Abstract
This work is focused on the landslide susceptibility assessment, applied to Mauritius Island. The study area is a volcanic island located in the western part of the Indian Ocean and it is characterized by a plateau-like morphology interrupted by three rugged mountain areas. The island is severely affected by geo-hydrological hazards, generally triggered by tropical storms and cyclones. The landslide susceptibility analysis was performed through an integrated approach based on morphometric analysis and preliminary Geographical Information System (GIS)-based techniques, supported by photogeological analysis and geomorphological field mapping. The analysis was completed following a mixed heuristic and statistical approach, integrated using GIS technology. This approach led to the identification of eight landslide controlling factors. Hence, each factor was evaluated by assigning appropriate expert-based weights and analyzed for the construction of thematic maps. Finally, all the collected data were mapped through a cartographic overlay process in order to realize a new zonation of landslide susceptibility. The resulting map was grouped into four landslide susceptibility classes: low, medium, high, and very high. This work provides a scientific basis that could be effectively applied in other tropical areas showing similar climatic and geomorphological features, in order to develop sustainable territorial planning, emergency management, and loss-reduction measures.
1. Introduction
Landslide susceptibility maps provide valuable information for disaster mitigation works and land planning strategies [1]. The evaluation and the identification of sensitive areas where the probability of landslides is high became a very important phase in the process of territorial planning by enabling a timely start of preventive and remedial actions [2]. Landslide susceptibility is defined as a quantitative or qualitative assessment of the classification, volume (or area), and spatial distribution of landslides that exist or potentially may occur in an area [3]. In more detail, it is the likelihood that a landslide phenomenon happens in a specific area based on local terrain conditions, but without any specification about when it could happen. This estimate of “where” landslides are likely to occur involves a degree of interpretation and is based on the correlation of several factors (i.e., topography, geology, geomorphology, geotechnical properties, climate, vegetation, and anthropogenic factors) with the distribution of past events [4,5,6].
Various methods for landslide susceptibility assessment can be encountered in the scientific literature. In general, they are divided into two groups: qualitative and quantitative methods, with the most important difference represented by their degree of objectivity. Landslide occurrence, in space or time, can be inferred from numerous approaches such as inventory-based mapping, deterministic techniques, probabilistic techniques, heuristic techniques, statistical analysis, and multi-criteria decision making analysis [3,7,8,9,10,11,12,13,14,15]. Remotely-sensed (RS) data combined with the Geographical Information System (GIS) were largely used for landslide susceptibility mapping. These innovative techniques offer the ability to manipulate significant volumes of data for large geographical areas and also encourage collecting basic landslide inventory data suitable for site-specific studies and for refining landslide hazard assessments in the future [16,17]. The GIS environment is widely used in models for the generation of thematic data layers, computation of different controlling factors, assignment of weights, data integration, and generation of landslide susceptibility maps. Such GIS-based models are represented by Weighted Overlay, Decision Tree model, Analytical Hierarchy Process, and physically-based landslide hazard models [18,19]. Nevertheless, it is recognized that in both qualitative and quantitative models, the results are prone to the inherent uncertainties related to various analysis parameters such as errors and variability in model choice, weighting factors, data availability, and human judgment [20].
In the current study, the achievement of landslide susceptibility maps is intended for use as a general guide to depicting areas of relative susceptibility to slope failure and as a predictor of landslide hazards at specific sites. The objective of the research was to better define the spatial distribution of landslide susceptibility, poorly known in the previous thematic studies, and to individuate the main critical areas all over the Mauritius Island. In detail, the type and degree of landslide susceptibility were derived from a mixed heuristic and statistical analysis, based on either direct (geomorphological field mapping in specific-site investigations) and indirect (photogeology and GIS data processing) analysis. The overall results led to the realization of a new zonation of landslide susceptibility for Mauritius Island, identifying four classes marking low, medium, high, and very-high landslide susceptibility.
Mauritius is a large volcanic island located in the western part of the Indian Ocean, approximately 900 km east of Madagascar (20°12′ S, 57°30′ E, Figure 1a). The island presents a plateau-like morphology, gently sloping towards the coastal plains, interrupted by three mountainous environments in the SW and SE sectors, and just S of the capital Port Louis. It is characterized by a humid tropical maritime climate and it is mostly affected by SE trade winds. The area is severely affected by geo-hydrological hazards, especially during the rainy season when heavy rainfall events cause the flooding of the river plain areas and trigger landslides with strong damages and fatalities [21]. The island is strongly influenced by a variety of morphostructural contexts (i.e., steep mountain areas, flat highlands, gentle sloping lowlands, and flat coastal areas) under different local climate features, which influence the type, intensity, spatial, and temporal distribution of geomorphological processes. Hence, the main geomorphological hazards affecting Mauritius Island are floods [22], landslides [23], and soil erosion [24,25]. The aim of this work was to prepare a reliable landslide susceptibility map through a multidisciplinary analysis concerning aerial-photos analysis and geomorphological field mapping, integrated with GIS processing, in order to provide a further advancement in the well-known methods for susceptibility assessment [26,27,28,29,30]. Furthermore, this work could represent an effective tool in geomorphological hazard studies for tropical areas, readily available to interested stakeholders, and it could provide a scientific basis for the implementation of sustainable territorial planning, emergency management, and loss-reduction measures.
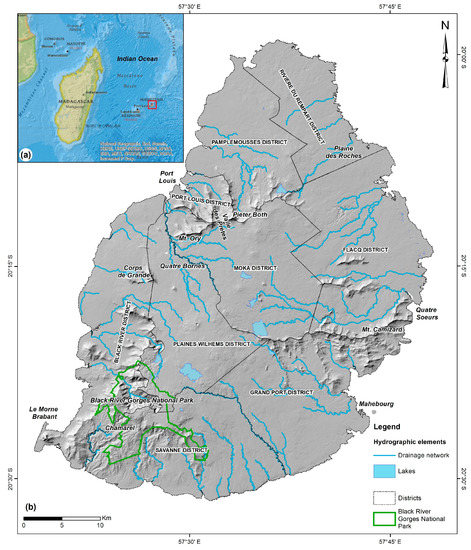
Figure 1.
(a) National Geographic World Map of the western part of Indian Ocean [31], the red box indicates the location of Mauritius Island; (b) shaded relief image of Mauritius Island from 40 m Digital Terrain Model (DTM).
2. Study Area
Mauritius, together with Réunion (capital Port Mathurin; 19°41′ S, 63°25′ E), Rodrigues (capital St. Denis; 20°52′ S, 55°27′ E) and some further smaller islands, is part of the Mascarene Archipelago, situated along the southern part of the Mascarene submarine ridge in the Indian Ocean (Figure 1a). The island has an overall surface area of about 1860 km2 with a maximum elevation of 828 m a.s.l. in the Black River Gorges National Park, near Chamarel (Figure 1b). It comprises the remnants of a massive shield volcano that has a covering of younger volcanic rocks. Some of the volcanic craters still contain lakes and, locally, the rivers give rise to impressive waterfalls. From a physiographic standpoint, it consists of a broken ring of mountain ranges, encircling a central plateau extended at an altitude of about 600 m a.s.l. and surrounded by gentle slopes down to the coastal plains. The whole island is rimmed by a coral shelf and the related lagoon.
Situated north of the Tropic of Capricorn, Mauritius has a humid tropical climate characterized by cyclones in the summer period (from November to March) and by moderate to low rainfall during the winter period (from April to October). The mean annual temperature ranges between 23 and 28 °C and the mean annual rainfall is ~2000 mm (ranging from ~600 to ~4000 mm) [32,33,34].
Based on the orography of the landscape, the island can be subdivided into different physiographic domains according to [35]: mountain areas (a), central uplands (b), southern highlands (c), lava plains (d), and coastal areas (e) (Figure 2).
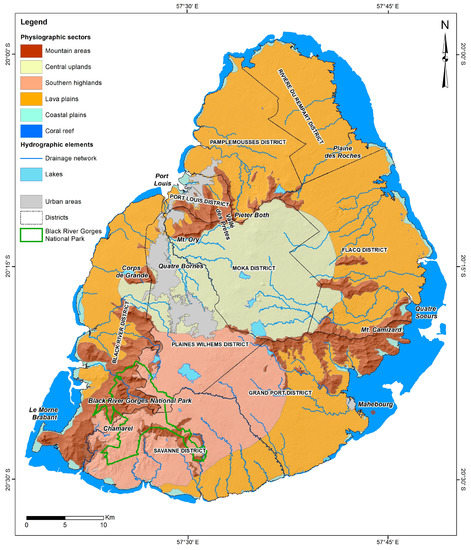
Figure 2.
Physiographic map of Mauritius Island.
(a) The mountain areas are characterized by sectors with moderate elevation (ranging from ~600 to ~800 m a.s.l.), dominated by peaks and ridges, with steep slopes and precipitous wall-like escarpments towards the inland areas and more gentle slopes with outer spurs projecting towards the sea. These domains are located in the north-western sector showing a NE–SW direction dominated by Pieter Both; in the central-eastern sector with an E–W trending ridge dominated by the relief of Mt. Camizard, and in the south-western sector showing a NNE–SSW direction interrupted by the Black River Gorges.
(b) The central uplands are in the Moka District, showing a morphology from planar to gently radial sloping towards the coast. This domain reaches an altitude of about 400 m a.s.l. and includes two of the main urban areas of the island (Quatre Bornes and Plaines Wilhems). It also includes most of the area within the caldera of the main island volcano.
(c) The southern highlands are in the Savanne and Grand Port districts and comprise the southern side of the main caldera showing a planar morphology mostly above 500 m a.s.l.
(d) The lava plains include the surrounding coastal plains and inland gentle slopes, with a wavy morphology, mostly below 300 m a.s.l. These plains are incised by the main rivers of the island, which locally generate deep gorges and valleys.
(e) The coastal areas show a morphology characterized by flat lowlands with bays and straight coasts. This domain is surrounded by a coral reef and the related lagoon, except for two stretches along the western and southern sectors of the island.
The geological history of Mauritius Island and its volcanism are historically well documented [36,37,38,39,40]. The island was built up during three distinct episodes of volcanic activity (from 10 to 0.02 My), which can be described, according to a geological chronology [35], as follows: Ancient Lava Series (10–5 My) including the breccia series (10–7.8 My), which caused the emergence of the island, and the Old Lava Series (7.6–5 My), which consisted of ancient basalts and phonolite building the primitive island shield volcano, whose central part collapsed to form the main Mauritius Caldera; the Intermediate Lava Series (or Early Volcanic Series) (3.5–1.7 My) consisting mostly of pyroclasts and basaltic flows; and the Recent Lava Series (also named Late Lavas, 0.7–0.02 My), the most important and extensive volcanic event in terms of aerial coverage (about 70% of the island), comprising basalts, scoria, tuff, and pyroclasts (Figure 3).
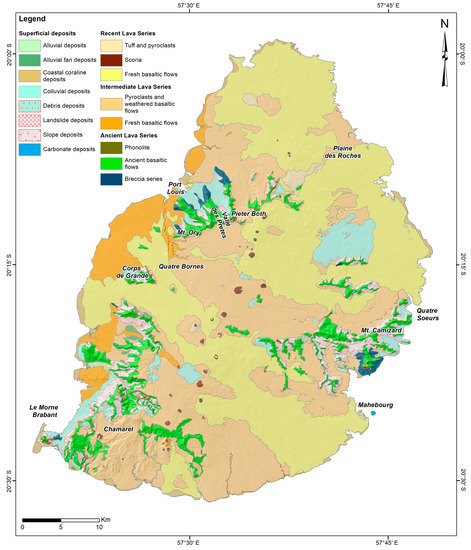
Figure 3.
Geo-lithological scheme of Mauritius Island (modified from Giorgi et al. [40]).
Carbonate deposits constitute the coral reef and the related lagoons built-up all around the coastline. Superficial deposits are widespread on the island, mainly consisting of alluvial, slope, and landslide deposits. The alluvial, alluvial fan, and colluvial deposits are present in the main fluvial plains, and debris, landslide, and slope deposits are developed in the mountain environments. The coastal domain is characterized by the presence of coraline sandy beaches and sand dunes bordering approximately 20% of the coastline.
3. Methods
The landslide susceptibility assessment was achieved through an integrated approach based on the combination of morphometric analysis and preliminary GIS-based techniques, supported by photogeological analysis and geomorphological field mapping.
Morphometric and slope analysis was carried out with the GIS software (ArcMap® 10.6.1, ESRI, Redlands, CA, USA). It was performed using topographic maps (1:25,000–1:10,000 scale) and supported by the use of a 40 m Digital Terrain Model (DTM) as a base map, and by the creation of a Digital Elevation Model (10 m DEM) derived from 1:10,000 scale technical maps. This analysis was based on the definition of the orographic features and the drainage network of the island. By means of the SHALSTAB model [41,42], a preliminary map was produced in order to outline the spatial distribution of the landslide susceptibility. This model is able to capture the physics involved in landslides triggered by rainfall in tropical and mountainous terrains and could be implemented successfully to identify slopes prone to failure with only a high-resolution Digital Elevation Model.
The geomorphological analysis was based on stereoscopic air-photo interpretation and field mapping. Aerial photo interpretation and photogeological analysis of high resolution (15 cm) orthophoto images allowed us to map homogeneous areas prone to landslides and slope instability. Field mapping was carried out at an appropriate scale (1:5,000–1:10,000), according to international guidelines [43], Italian geomorphological guidelines [44,45,46], and the thematic literature concerning geomorphological mapping and analysis in different geological and climatic contexts [47,48,49,50,51]. We focused on the definition of lithological features, superficial deposit cover, and the type and distribution of geomorphological landforms with reference to the main landslides affecting the island. Field survey and schematic geological–geomorphological field sketches allowed to analyze landslide geometry and their state of activity, as well as the anthropogenic influence. The analysis of the major lithological features was performed by integrating field data with the geological map of Mauritius Island at 1:50,000 scale [40,52]; while, the land-use analysis was based on a 1:100,000 scale map [53] and information about the soil types have been derived from a soil map at a 1:50,000 scale [54]. Special attention has been devoted to mapping superficial deposits (i.e., colluvial, alluvial, landslide, and slope deposits), which had been poorly mapped in previous geological maps [40,52].
The landslide susceptibility assessment was based on a mixed heuristic and statistical analysis, according to the most relevant literature [55,56,57,58,59,60]. This approach led to the identification and combination of relevant parameters for the mechanism of landslide occurrence. Regarding the study area, eight parameters (slope, aspect, topographic curvature, drainage pattern, vegetation cover, lithology, soil cover, and rainfall) were considered as landslide controlling factors. All the factors were portrayed in thematic maps and divided into different classes. Each class of every single factor was rated following a weighting system based on comparative judgments and synthesis of priorities [61,62,63,64]. This iterative procedure allowed us to rate individual classes in order to provide an immediate measure of the role played by each factor and its related classes on the landslide susceptibility. In detail, this stepwise approach led to compare the factor dataset with the preliminary GIS-based landslide susceptibility and with the distribution of the different types of landslide (i.e., rockfalls, landslides, and rapid earth flows). The analysis was performed through the calculation of the “Landslide index” (Li), expressed by the equation [65,66]:
where Al is the surface area of every class of the factors, and At is the whole surface area of the island. Moreover, a parameter reclassification was performed in order to better assign the appropriate weight to each class, using the following equation [65,66]:
where Li0 is the landslide index for a specific class of the considered factor, Limin is the minimum landslide index value of all classes for a given factor, and Limax is the maximum landslide index value of all classes for a given factor. Then, a categorization of the factors according to their role in the weighting system was realized. Each class was normalized to 100 percent so that calibration would have the same scale in all factors. The convenience of such a normalization consists in the possibility to weigh the contribution among classes belonging to factors with different ranges of Li-values. All the weighted factors were summed altogether, using the ArcGIS Raster Calculator tool, and reclassified to obtain the landslide susceptibility for each mass movement type, as follows:
where Wfi is the weight of each factor and crfi is the contribution ratio, evaluated through an expert-based approach. This summation resulted in the final susceptibility mapping, where the higher the S value, the higher the susceptibility to different types of mass movements (rockfalls, landslides, or rapid earth flows). Finally, all the collected data, portrayed in three thematic maps, were integrated into the GIS software through a cartographic overlay process [67,68] in order to portray the spatial distribution of the landslide susceptibility.
Li = (Al/At),
W = [(Li0 − Limin)]/[(Limax − Limin)],
S = ∑ (Wfi * crfi),
3.1. Landslide Controlling Factors
Landslide susceptibility analysis involves data collection and construction of a spatial database from which relevant factors are extracted. Selecting those independent variables with a major role is, however, a difficult task. There are neither universal criteria nor guidelines. Hence, the selection of factors needs to take into account the nature of the study area and data availability [69,70,71].
The eight factors considered for the susceptibility analysis were: slope, aspect, topographic curvature, drainage pattern, vegetation cover, lithology, soil cover, and rainfall. Each factor, described in the following paragraphs, was selected and subdivided into different classes in order to best commensurate the diversity of the data source and difference in the scales and to clearly delineate its role in the mechanism of landslide occurrence in the wider geological and geomorphological context of the island.
3.1.1. Slope
The slope angle is commonly used in landslide susceptibility studies since landsliding is directly related to this factor [58,65,72,73]. In this study, the slope has been divided into ten classes (Figure 4a). The predominant class is 0–5° and it is homogeneously present in correspondence of flat areas along coastal and lava plains. Some wide sectors of the lowlands and uplands show slope values ranging from 5–15° to 25–35°, with steep slopes affected by landslides and earth flows. The higher slope values are related to peaks and ridges of the mountain areas which present sub-vertical slopes (over 55°), affected by rockfalls.
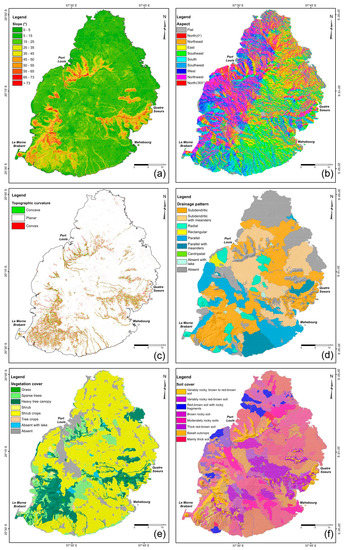
Figure 4.
(a) Slope map; (b) aspect map; (c) topographic curvature map; (d) drainage pattern map; (e) vegetation cover map; (f) soil cover map.
3.1.2. Aspect
Aspect is considered a less important factor in landslide susceptibility studies [55,72]. Nevertheless, aspect-associated parameters, such as exposure to sunlight, drying winds, and rainfall may influence the occurrence of landslides [73,74,75]. The aspect map has been classified into ten classes (Figure 4b). The overall shape of the island outlines a specific aspect distribution, in which slopes facing north to northwest and south to southwest are slightly predominant over east to southeast facing slopes.
3.1.3. Topographic Curvature
The term curvature is theoretically defined as the rate of change of slope gradient (profile curvature) and/or aspect (planform curvature), usually in a specific direction [76,77]. Positive values of profile curvatures define convexity; negative values of profile curvatures characterize slope concavity [73]. Positive values of topographic curvature characterize ridges, while negative ones define valleys. Values around zero indicate flat surfaces, whatever the slope is. The topographic curvature map (Figure 4c) combines both the profile and planform curvatures. The highest values characterize the three mountain areas with scarps, ridges, deep valleys, and gorges where rockfalls and landslides may occur. Moderate values locally affect the southern highlands and the lava plains along the main fluvial incisions.
3.1.4. Drainage Pattern
The drainage network, strictly influenced by the underlying lithology, can be used to extract information on the general direction of surface water flows towards individual basin outlets, the angle of intersection between the tributaries and the main channels, and the overall confluences distribution, which can control the drainage discharge and the related instability, particularly in critical hydrological conditions.
The drainage network was divided into nine homogeneous drainage patterns (Figure 4d). The predominant pattern is sub-dendritic, although in some sectors it is absent due to the high permeability of lavas and pyroclasts. Parallel patterns and parallel with meandering channels characterize the central and southern highlands especially in the southern sector of the island. Radial, centripetal, and rectangular patterns are locally present. The drainage network is totally absent in the northern sector of the island.
3.1.5. Vegetation Cover
The vegetation cover plays an important role in slope stability. In general, sparsely, or poorly vegetated areas are affected by faster soil erosion and greater instability than forested ones [26,58,72]. In the study area, a vegetation map (Figure 4e) was derived from the photogeological analysis and the land-use map [53]. Vegetation cover was classified into eight classes, in which areas with absent vegetation correspond to urban areas. The predominant vegetation type is shrub crops, including sugar canes, which cover most of the lava plains, and the central and southern highlands, whereas forests (heavy tree canopy and sparse trees) cover large parts of the mountain areas.
3.1.6. Lithology and Soil Cover Deposits
Lithology and soil cover are important factors in landslides susceptibility analysis, since different lithological units may be affected by different landslide types with variable susceptibility degrees. Moreover, soil cover deposits, mostly exposed to weathering, may influence land permeability, geotechnical parameters and, therefore, the landslide type, as known from thematic literature [26,73,78,79].
The predominant lithological units are: fresh basaltic flows (Recent Lava Series), mostly outcropping in the lava plains and the central and southern highlands and poorly affected by mass movements; pyroclasts and weathered basaltic flows (Intermediate Lava Series) outcropping in the central and southern highlands, and locally affected by landslides and earth flows; ancient basalts and phonolites (Ancient Lava Series), outcropping in the mountain areas and largely affected by rockfalls; colluvial deposits, widespread at the base of the mountainous slopes, largely affected by earth flows and translational-rotational landslides (Figure 3).
For the study area, the soil types were grouped into eight units depending on their typology and the related thickness (Figure 4f). The most widespread type is the brown to red–brown soil with rocky fragments and basalt outcrops, which usually increases in thickness (from few to >100 cm) in the middle and lower part of the mountain areas, and variably rocky soil of moderate thickness.
3.1.7. Rainfall
Rainfall and heavy rainfall events play a key role in the mechanism of landslide triggering. This mechanism depends on rainfall distribution and it is controlled by the interactions of different factors, such as orography and hydrography, lithology, land use and vegetation, etc. [80,81,82,83]. The analysis of the rainfall and temperature data, evaluated from a 29-year time record (1971–2000), proved certain features of the climate on the island (Figure 5). The island is characterized by a humid tropical maritime climate and by permanent SE trade winds. The mean annual temperature ranges between 23 and 28 °C. The mean summer (November–March) rainfall is 1300 mm; the mean winter (April–October) rainfall is 660 mm. The mean annual rainfall is greater in the central uplands (4000 mm) and windward slopes (~1400 mm on the eastern coast) and lower in the western slopes (600 mm on the coast). Occasionally, tropical cyclones and storms affect the island inducing geomorphological effects, such as the events occurred in March–April 2013 and in March 2015 [25,32,33,34]. The average summer rainfall was used in the weighting procedure to best represent the link between rainfall data and landslide susceptibility in this dynamic climatic context.
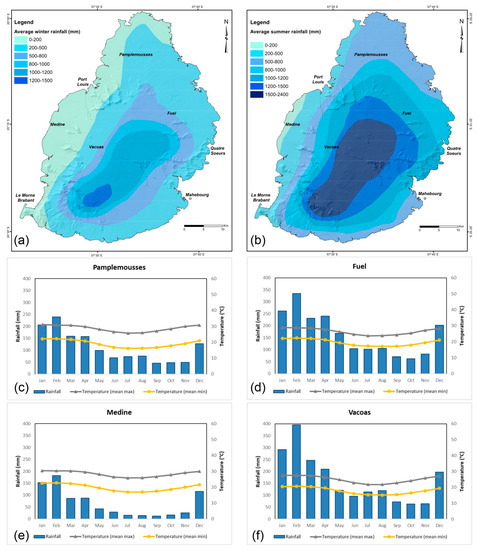
Figure 5.
(a) Average winter rainfall map; (b) average summer rainfall map; (c) termo-pluviometric diagram of the western region (Medine); (d) termo-pluviometric diagram of the central region (Vacoas); (e) termo-pluviometric diagram the eastern region (Fuel); (f) termo-pluviometric diagram of the northern region (Pamplemousses).
4. Results
4.1. Preliminary GIS-Based Landslide Susceptibility Map
A preliminary susceptibility map (Figure 6) was produced using GIS technology. This map allowed us to outline the critical areas in terms of potential spatial distribution of landslide susceptibility. For this kind of analysis, SHALSTAB model provides a DEM modeling calculation and applies a topographic index suggesting that surface topography is a primary indicator of where landslides are most likely to occur. In the current study, different areas marking low, medium, high, and very-high landslide susceptibility were identified. The analysis allowed us to identify areas with high and very high landslide susceptibility in correspondence to the three mountain areas, to some sectors of the southern highlands, and to the incision of the main rivers. Central uplands, southern highlands, and lava plains show the lowest values in accordance with the morphology of the island. A region that has no class values presents no landslide susceptibility and mostly corresponds to coastal areas.
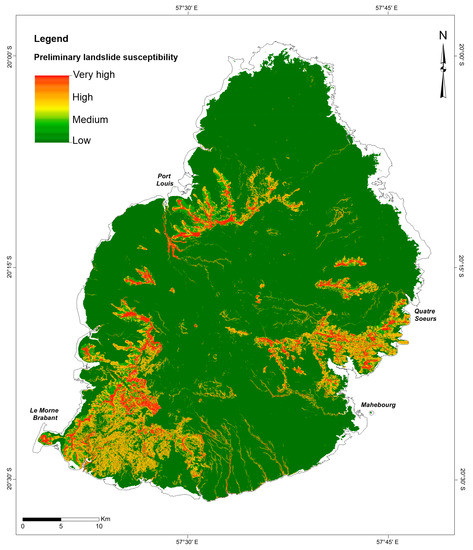
Figure 6.
Preliminary GIS-based landslide susceptibility map produced using the SHALSTAB model.
4.2. Photogeological Analysis
The photogeological analysis was carried out to support and verify the preliminary GIS mapping. The analysis allowed for outlining the main landslide-prone areas, considering previous studies and technical reports provided by the Mauritius Ministry of Environment and Sustainable Development. According to the orographic (elevation and slope), hydrographic (drainage pattern), vegetational, geological (lithology and soil cover) and geomorphological (slope gravity landforms and processes) features, a detailed analysis was performed in the three mountain areas of the island with reference to some specific and mostly representative sites (Chitrakoot, Quatre Sœurs, Chamarel, and Corps de Garde) (Figure 7). Each of the mapped sites is located in a different sector of the island and it is characterized by a specific geomorphological setting highlighting the development of different types of mass movements, such as rockfalls, landslides, and rapid earth flows.
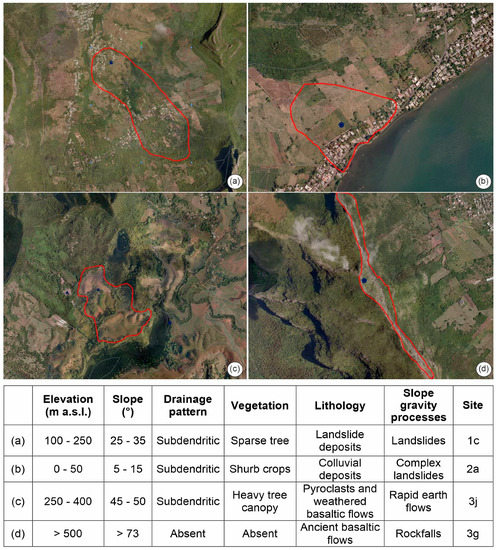
Figure 7.
Examples of photogeological analysis; for investigation sites’ locations see Figure 10. The red line indicates the area involved by landslide phenomena. (a) Landslide area of Chitrakoot (Port Louis District); (b) landslide area of Quatre Soeurs (Flacq District); (c) earth flow area of Chamarel (Black River District); (d) rockfalls along the scarps of Corps de Garde (Plaines Wilhems District).
Chitrakoot area (Figure 7a) is in the Port Louis District, located at moderate elevation (ranging from 100 to 250 m a.s.l.) with low to moderate slope (25–35°) in the lower part, passing to more gentle slopes in the upper part. The drainage pattern is subdendritic and this site shows sparse tree vegetation, with some patches of heavy three canopy. The bedrock lithology is ancient basalt, generally covered by landslide deposits. Slope gravity processes are referable to large landslides affecting the middle and lower sectors of the area.
Quatre Soeurs area (Figure 7b) is in the Flacq District, located at low elevation (ranging from 0 to 50 m a.s.l.) with low slope values (5–15°). The drainage pattern is almost subdendritic with small drainage lines perpendicular to the slope. This site shows heavy tree canopy in the very upper part, with dense shrub crops in most of the urban areas along the coast. The bedrock lithology is ancient basalt, covered by colluvial deposits. The area is affected by slope gravity processes referable to a complex landslide located in the lower part of the slope near the coastal area.
Chamarel area (Figure 7c) is in the Black River District, located at intermediate elevation (ranging from 250 to 400 m a.s.l.); slope values are around 45–50° with some vertical scarps in the lower sector. The drainage pattern is subdendritic and the vegetation is characterized by heavy tree canopy. The bedrock lithologies are pyroclastic rocks and interbedded weathered lavas, covered by thick to moderately thick brown soil. The area shows evidence of rapid earth flows along the main drainage lines.
Corps de Garde area (Figure 7d) is in the Plaines Wilhems District and it is represented by a vertical scarp at an altitude >500 m a.s.l. with high slope values (>73°). The hydrography is absent, and the vegetation is absent as well. The main geomorphological feature is represented by a wide scarp representing the detachment area of rockfalls.
4.3. Geomorphological Field Survey
The field survey was performed to verify the presence, geometry, typology, and state of activity of mass movements in specific and most representative sites (Chitrakoot, Quatre Sœurs, Chamarel, and Corps de Garde). The main landslides-prone areas were mapped in the field by collecting data on specific field sheets, including geological–geomorphological field sketches (Figure 8) and photo documentation (Figure 9), showing the relationship between landslides, bedrock lithology, and superficial deposits.
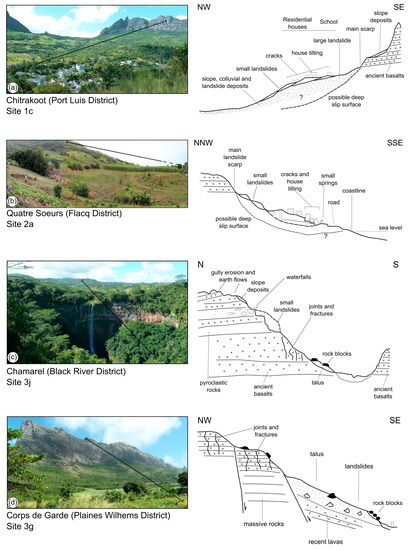
Figure 8.
Field geomorphological survey. Panoramic view and schematic geological–geomorphological field sketches; for investigation site locations see Figure 10. Black lines on the left represent the trace of the field sketches. (a) Large complex landslide area of Chitrakoot, (Port Louis District); (b) rotational and translational landslide area of Quatre Soeurs (Flacq District); (c) earth flow and rockfall area of Chamarel (Black River District); (d) rockfalls along the scarps of Corps de Garde (Plaines Wilhems District).
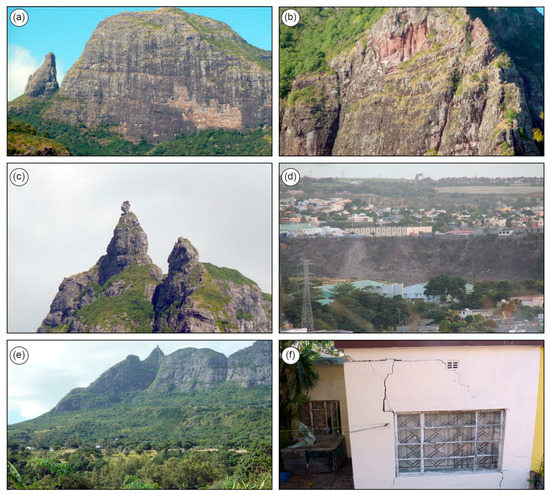
Figure 9.
Photo documentation of geomorphological features of Mauritius Island. (a) Corps de Garde, vertical basalt scarps affected by rockfalls; the light color outlines a recent rockfall detachment, at the base of the slope the vegetation covers the rockfall accumulation; (b) Le Morne, detail of a recent rockfall detachment scarp (reddish colored area); (c) Pieter Both, the second-highest peak in Mauritius, one of the symbols of the island, characterized by a poorly stable large block; (d) Grand River North West, landslides affecting the fluvial scarp of one of the main rivers of the island; (e) Chitrakoot, in the background large basalt scarps affected by rockfalls, in the foreground scarps and terraces related to a large complex landslide; (f) Chitrakoot, building damaged due to the landslide activity.
Chitrakoot area is characterized by the presence of the main landslide scarp on the ancient basalts lithologies. In the middle part of the slope, moving towards the urban area, the wide gently-undulating sector is referable to a landslide terrace, with small counterslopes, that could be connected to a large landslide involving the whole slope, with a possible deep slip surface (>20–30 m). This area is also affected by shallow to moderately-slow landslides involving the colluvial deposits and inducing secondary landslide scarps, tilting, severe cracks, and damages to residential houses. This geomorphological setting is supposed to be linked to the superimposition of small slides on a large complex landslide, probably triggered by heavy rainfall events (Figure 8a).
Quatre Soeurs area is also dominated by the main landslide scarp on the ancient basalts lithologies, partly covered by slope deposits. In the middle part of the slope a wide counterslope, with small swamps and small scarps, is present, affecting colluvial and slope deposits. In the lower part of the slope, the houses are affected by wide cracks and tilting both down-slope and counterslope. At the base of the slope, finally, small springs are present and strong damages affect the main road. This geomorphological setting is supposed to be linked to the superimposition of shallow small rotational or complex landslides on a wide deep translational–rotational landslide, sliding on the main slip surface (Figure 8b).
Chamarel area presents a geomorphological setting variable from the upper to the lower sector of the slope, according to the complex morphological setting. The upper sector of the slope, developed on pyroclast rocks and weathered basaltic flows, is characterized by small valleys with V- and U-shape, arranged in subdendritic drainage pattern. These valleys are affected by gully erosion and earth flows during heavy rainfall events. In the middle and lower part of the slope, the alternation of thick layers of basalts and pyroclastic rocks induced a step-like morphology affected by small landslides and rockfalls; the latter affects mainly the lower layer of ancient fractured basalts, with the formation of rock blocks up to >10 m in size (Figure 8c).
Corps de Garde’s ridge is characterized by several main rockfall scarps. The main ones are in the northeastern and southern side (up to 200 m high); while, the minor ones are present in the western side. These scarps are in a dormant state; they do not show evidence of very recent activity but could easily be reactivated. In the lower sectors of the area, slope and landslides deposits are covered by shrub vegetation unless some blocks that are still uncovered. This aspect confirms a dormant state of the landslide phenomena (Figure 8d).
4.4. Landslide Distribution
The spatial distribution of landslide susceptibility resulted from the combination of photogeological analysis and field survey. In detail, it was produced by merging data from aerial photo interpretation of high-resolution orthophoto images in the three mountain areas of the island and data from geomorphological field activity in specific-site investigations, defined considering technical reports provided by the Mauritius Ministry of Environment and Sustainable Development. This analysis allowed us to characterize different geomorphological homogeneous areas showing evidence of slope gravity processes such as rockfalls, landslides (complex landslides, translational and rotational slides), and rapid earth flows. This arrangement is summarized and graphically shown in Figure 10.
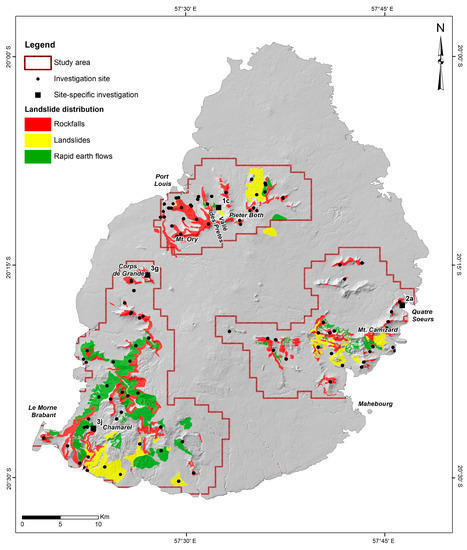
Figure 10.
Landslide spatial distribution in the three mountain areas of Mauritius Island, with investigation site locations. This graphical representation includes rockfalls, landslides (complex landslides, translational and rotational slides) and rapid earth flows.
Rockfalls occur on steep or vertical wall-like escarpments in the mountain areas, at elevations ranging from about 500 to 800 m a.s.l., showing the highest slopes values (from 50 to >73°). The escarpments are on the bare rock (mostly ancient basalts lithologies with no vegetation and no soil cover). Surface hydrography is generally absent, only related to surface water runoff and infiltration due to rock fracturation. The main landslide scarps represent the detachment areas of rockfalls and at the base large talus slopes deposits are present, made up of large blocks embedded in coarse debris resulting from repeated rock falls, and mostly covered by thick shrub and tree vegetation. Large complex landslides affect the middle and lower parts of the slopes and are located at a moderate elevation ranging from 150 to 500 m a.s.l. on concave or convex–concave slopes surrounding the mountain areas, with moderate slope values (25–35°); locally gentle landslides terraces occur. The bedrock lithology is represented by ancient basalts or pyroclasts, generally covered by superficial deposits (colluvial and slope deposits). The drainage pattern is mostly subdendritic or parallel (locally radial). The main sites show sparse tree vegetation, with some patches of heavy tree canopy in the middle and upper part.
Translational and rotational landslides mostly occur at low elevations ranging from 0 to 150 m a.s.l. showing low slopes values (5–15°), changing to steeper slopes in the upper sectors (15–25°); they affect the basal slopes surrounding the mountain areas and in some cases the slopes of the central and southern highlands. The bedrock lithology is represented by intermediate basalts or pyroclasts, covered by colluvial deposits. The drainage pattern is almost parallel with small drainage lines perpendicular to the slope. Most of the sites show a heavy tree canopy in the very upper part, and dense shrub crops and shrubs in most of the area. Locally, this type of slide occurs also along the fluvial scarps of the main rivers.
Rapid earth flows are located at intermediate elevations ranging from 150 to 500 m a.s.l. in the southern highlands and locally around the mountain areas. The slope values are usually around 15–25°, locally increasing in the correspondence of vertical scarps. The bedrock lithologies are mostly pyroclastic rocks and interbedded weathered lavas, covered by colluvial deposits. The drainage pattern is mostly subdendritic; the vegetation is characterized by sparse trees and in many cases by shrub crops (sugar cane).
5. Discussion
Landslide susceptibility assessment was performed through the analysis and the cartographic overlay of susceptibility to different types of mass movements: rockfalls, landslides (including rotational and translational slides, complex landslides, general slow landslides) and rapid earth flow. The analysis was based on the interaction between controlling factors, which provides certain clues for landslide susceptibility, such as orographic features (slope, aspect, profile, and planar curvature), hydrographic features (drainage pattern), geological features (lithology and soil cover), vegetation features, and rainfall data. Original data were converted to digital form and individual factors were processed through digitization in a GIS environment. All the factors were portrayed in thematic maps and divided into different classes. Each class of every single factor was analyzed through a weighting procedure to provide an immediate measure of the role played on the landslide susceptibility. In detail, this stepwise approach allowed us to compare the factor dataset with the preliminary GIS-based landslide susceptibility and with the distribution of the different types of landslide (i.e., rockfalls, landslides, and rapid earth flows). The correlation between controlling factors and landslides has been computed by evaluating the “Landslide index” (Li) for the individual classes into which each factor has been divided. Then, a categorization of the factors according to their role in the weighting system was realized. Each class was normalized to 100 percent to best weigh the contribution among classes belonging to factors with different ranges of Li-values and work with the same scale in all factors. This weighting procedure is summarized in Table 1. Moreover, with reference to the physiographic context of the island, the slope factor was considered as a primary indicator of slope instability and it was processed to define its significant role in the occurrence of different types of landslides (Table 2). The slope was classified into ten classes from 0 to >73°, and each class was weighted defining Li and W [65,66], separately for different landslide types. Class 1 of the slope layer (slope ranging 0–5°) has almost no observed rockfalls area, resulting in zero weight; while, for example, class 9 (slope ranging 65–73°) has the maximum Li, resulting in the maximum weight (defined as 100), since sub-vertical slopes are largely affected by rockfalls. As for landslide distribution, the highest Li values are for class 2 (slope ranging 5–15°) and class 3 (slope ranging 15–25°), resulting in a 100 and 23 weight, respectively. As for rapid earth flow distribution, the highest Li values are again for class 2 (5–15°), resulting in a 100 weight, and for classes 3 to 7 (15–55°).

Table 1.
Weighting procedure of controlling factors considered for landslide susceptibility analysis.

Table 2.
Slope factor weighting procedure.
To better calibrate and testify the role played by landslide controlling factors, an overall contribution ratio (crfi) was assigned to each factor (Table 3). This process of calibration was performed, through an expert-based approach, considering the influence of factors and related classes in the mechanism of occurrence of different types of mass movements. In detail, the contribution ratio was defined by combining data obtained from photogeological analysis and geomorphological field surveys in specific-site investigations. The analysis revealed that the contribution of each influencing factor varies across the island. The spatial variation showed that morphological factors are important driving parameters for slope failures and have multiple influences on landslide susceptibility. The slope factor directly affects shear stress and, generally, gentle slopes are expected to have lower susceptibility to landsliding than steep ones. Profile and planar curvature express the shape of the slope and were rated in order to reflect the topography of the island. Lithological features also influence the landslide susceptibility with strong effects on hydrological and mechanical characteristics of rock mass. Hence, lithology was considered as to the different role played in the mechanism of occurrence of different types of mass movements. Even though Ancient Lava Series are considered as hard and stiff rocks, due to the high fragmentation they are favorable to rock falls. Loose and high erodible formations, like superficial deposits, tuff, pyroclasts, and weathered basaltic flows, are prone to generate rotational and translational slides, and general slow landslides, since they are unconsolidated formations.

Table 3.
Landslide controlling factors and related contribution ratio for rockfalls, landslides, and rapid earth flows susceptibility.
Finally, all the weighted factors were summed altogether, using the ArcGIS Raster Calculator tool, and reclassified to portray the spatial distribution of landslide susceptibility in thematic maps (Figure 11). This analysis allowed us to produce three different susceptibility maps for rockfalls, landslides (including rotational and translational slides, complex landslides, general slow landslides), and rapid earth flows.
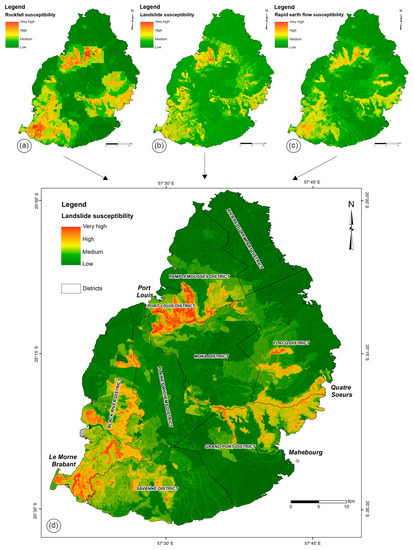
Figure 11.
(a) Rockfall susceptibility map; (b) landslide susceptibility map (including rotational and translational slides, complex landslides, general slow landslides); (c) rapid earth flow susceptibility map; (d) landslide susceptibility map of Mauritius Island.
Rockfall susceptibility map (Figure 11a) shows very high values all along the main escarpments and the upper part of the slopes on bare basalt rocks of the mountain areas (Port Louis, Pamplemousses district, and Le Morne); high values are in the eastern side, along the main scarps of the Flacq and Grand Port districts and in the south-western side, along the main escarpments of the Black River District; in the latter areas rockfalls are partly prevented by the high vegetation cover (heavy tree canopy). Some patches of medium to high values occur on rock scarps along the main rivers in the southern and north-western side of the island.
Landslide susceptibility map (Figure 11b) shows very-high levels in the lower part of the main slopes of the mountainous-hilly areas of the northern, eastern, and south-western parts of the island. These areas are mostly on ancient basalt rocks in the upper part and on basalt or pyroclastic rock in the lower part, covered by superficial deposits. They are characterized by sparse trees and shrubs vegetation cover and show the presence of several scarps and landslides terraces outlining an irregular convex-concave morphology.
Rapid earth flow susceptibility map (Figure 11c) shows very high values from the upper to the lower part of the main slopes of the mountainous and hilly areas of the northern, eastern, and south-western sides of the island, even though these are covered by sparse trees and tree canopy. High values are also present in some hilly or gently undulated landscapes that developed on pyroclastic rocks and recent lavas, covered by sugar cane crops, on the southern side of the island (Savanne District; i.e., Chamarel area).
These maps were summed altogether and reclassified to define, through a cartographic overlay approach into the GIS software [64,67,68], the spatial distribution of landslide susceptibility (Figure 11d). This analysis depicts four main classes (low, medium, high, and very high); thus, the maximum values, resulting from the combination of the three mass movements susceptibility maps, are classified as the maximum susceptibility value.
The spatial distribution of susceptibility related to the different types of mass movement outlines that high/very high landslide susceptibility is strictly consistent with the distribution of the overall “Landslide index” (Li) derived from the statistical approach and confirmed by photogeological analysis and field survey. This is mostly related to the steep slopes on basalt rocks (mostly affected by rockfalls) and to the steep to moderately steep slopes at the base of the basalt rock slopes (potentially affected by landslides and rapid earth flows). Concerning the medium class, the large areas are particularly significant, since they are mostly related to moderate to gentle slopes characterized by superficial deposits (i.e., colluvial and slope deposits), outlined by the photogeological and field survey, potentially affected by large complex landslides.
6. Conclusions
This paper presents a landslide susceptibility assessment realized following a multidisciplinary approach, which involves morphometric analysis, GIS-based analysis, photogeological analysis, and geomorphological field mapping. This detailed investigation shows clearly that the geomorphological response of the island is highly variable and dependent on a range of eight parameters including slope, aspect, topographic curvature, drainage pattern, vegetation cover, lithological features, soil cover, and rainfall, which can be considered as landslide controlling factors. The landslide susceptibility maps created are intended for use as a general guide to depicting areas of relative susceptibility to slope failure and as a predictor of landslide hazards at specific sites. Areas of high and very high landslide susceptibility depict the potential for slope failure to occur but do not depict the time frame of the failure, the type of failure nor the volume of the mass involved. The study was performed using input data from different scale (ranging from 1:5000–1:100,000) in order to best summarize all the bibliographic information and to describe landslides in the wider context of their geomorphological situation with their role in landscape development assessed so as to understand the likelihood and potential magnitude of any hazards [84]. In order to avoid inaccuracy in the results, it was verified by detailed geological–geomorphological field mapping and photogeological analysis in specific and most representative sites. The type and degree of landslide susceptibility were derived from mixed heuristic and statistical analysis, based on either direct (photogeological analysis and field mapping) or indirect (GIS data processing) analysis. The overall results of this work allowed us to realize a new zonation of landslide susceptibility for Mauritius Island, identifying four landslide susceptibility classes (low, medium, high, and very high). This work gave a better comprehension of the relations between morphological, lithological, and geomorphological conditions, and the rainfall events triggering mass movements, such as rockfalls, landslides, and rapid earth flows. Therefore, this methodological approach was useful to identify areas that are susceptible to mass movements. Moreover, the comparison between preliminary GIS-based susceptibility map (Figure 6) and final susceptibility maps (Figure 11d) clearly outlines the significant contribution of photogeology analysis and geomorphological field survey, together with mixed heuristic–statistical procedure, to develop a technique for landslide susceptibility assessment. This approach allowed us to reduce and refine the spatial distribution of high and very-high landslide susceptibility and made it possible to map a large distribution of medium susceptibility that mostly pertains to the occurrence of landslides on moderate to gentle slopes not outlined by the preliminary maps and poorly known in the previous thematic studies. In conclusion, this approach allowed for a better calibration of landslide susceptibility analysis, for the improvement of results in terms of consistency with mass movements distribution, and for the definition of the main critical areas all over the Mauritius Island. Hence, landslide susceptibility assessment provides a scientific basis for the implementation of land use, emergency management, climate change resilience actions, and loss-reduction measures. This approach could be effectively applied in other tropical areas showing similar climatic and geomorphological features in order to identify landslide-prone areas and give information for disaster mitigation works and land planning strategies.
Author Contributions
Conceptualization, V.M. and A.G; methodology, G.P. and E.M.; data curation, E.M. and G.P.; geomorphological investigation, GIS mapping, and photogeological analysis, E.M.; writing—original draft preparation, G.P.; writing—review and editing: V.M. and E.M.; supervision and project administration. V.M. and A.G.; funding acquisition, E.M.
Funding
This research was funded by Mauritius Ministry of Environment and Sustainable Development, and the APC was funded by Enrico Miccadei, grant provided by Università degli Studi “G. d’Annunzio” Chieti-Pescara.
Acknowledgments
This paper is the main output of an extensive research project sponsored by the Republic of Mauritius within the framework of the Development of an Inundation, Flooding, and Landslide National Risk Profile. The project has been carried out in collaboration with the Mauritius Ministry of Environment and Sustainable Development. The authors wish to thank the Mauritius Ministry of Environment and Sustainable Development and the Government for providing the topographic data, Digital Elevation Model (DEM), aerial photos, and orthophotos used for this work. The authors wish to thank the anonymous reviewers for their critical review of the paper and their precious suggestions, which significantly improved this manuscript.
Conflicts of Interest
The authors declare no conflict of interest.
References
- Kerekes, A.H.; Horváth, C.s. Landslide susceptibility evaluation using GIS. Case study: Silvanie Hills (Romania). Stud. UBB Geogr. LXI 2016, 2, 85–99. [Google Scholar]
- Dolean, B.E. Landslide susceptibility assessment using Spatial Analysis and GIS modeling in Cluj-Napoca Metropolitan Area, Romania. Cinq Cont. 2017, 7, 23–41. [Google Scholar]
- Fell, R.; Corominas, J.; Bonnard, C.; Cascini, L.; Leroi, E.; Savage, W.Z. Guidelines for landslide susceptibility, hazard and risk zoning for land-use planning. Eng. Geol. 2008, 102, 99–111. [Google Scholar] [CrossRef]
- Brabb, E.E. Innovative approaches to landslide hazard and risk mapping. In Proceedings of the IVth International Conference and Field Workshop in Landslides, Tokyo, Japan, 23–31 August 1985; pp. 17–22. [Google Scholar]
- Guzzetti, F.; Reichenbach, P.; Ardizzone, F.; Cardinali, M.; Galli, M. Estimating the quality of landslide susceptibility models. Geomorphology 2006, 81, 166–184. [Google Scholar] [CrossRef]
- Rossi, M.; Guzzetti, F.; Reichenbach, P.; Mondini, A.C.; Peruccacci, S. Optimal landslide susceptibility zonation based on multiple forecasts. Geomorphology 2010, 114, 129–142. [Google Scholar] [CrossRef]
- Soeters, R.; Van Westen, C.J. Slope instability recognition, analysis, and zonation. In Landslides, Investigation and Mitigation (Transportation Research Board, National Research Council, Special Report; 247); Turner, A.K., Schuster, R.L., Eds.; National Academy Press: Washington, DC, USA, 1996; pp. 129–177. ISBN 0-309-06151-2. [Google Scholar]
- Van Westen, C.J.; Rengers, N.; Terlien, M.T.J.; Soeters, R. Prediction of the occurrence of slope instability phenomenal through GIS-based hazard zonation. Geol. Rundschau 1997, 86, 404–414. [Google Scholar] [CrossRef]
- Aleotti, P.; Chowdhury, R. Landslide hazard assessment: Summary review and new perspectives. Bull. Eng. Geol. Environ. 1999, 58, 21–44. [Google Scholar] [CrossRef]
- Conoscenti, C.; Di Maggio, C.; Rotigliano, E. GIS analysis to assess landslide susceptibility in a fluvial basin of NW Sicily (Italy). Geomorphology 2008, 94, 325–339. [Google Scholar] [CrossRef]
- Melelli, L.; Taramelli, A.; Nucci, G. L’analisi statistica bivariata in ambiente GIS: Un esempio applicato alla valutazione della suscettibilità da frana. Mem. Descr. della Cart. Geol. d’Italia 2008, 78, 169–182. [Google Scholar]
- Van Den Eeckhaut, M.; Reichenbach, P.; Guzzetti, F.; Rossi, M.; Poesen, J. Combined landslide inventory and susceptibility assessment based on different mapping units: An example from the Flemish Ardennes, Belgium. Nat. Hazards Earth Syst. Sci. 2009, 9, 507–521. [Google Scholar] [CrossRef]
- Petschko, H.; Brenning, A.; Bell, R.; Goetz, J.; Glade, T. Assessing the quality of landslide susceptibility maps—Case study Lower Austria. Nat. Hazards Earth Syst. Sci. 2014, 14, 95–118. [Google Scholar] [CrossRef]
- Rahman, M.S.; Ahmed, B.; Di, L. Landslide initiation and runout susceptibility modeling in the context of hill cutting and rapid urbanization: a combined approach of weights of evidence and spatial multi-criteria. J. Mt. Sci. 2017, 14, 1919–1937. [Google Scholar] [CrossRef]
- Moradi, H.; Avand, M.; Janizadeh, S. Landslide Susceptibility Survey Using Modeling Methods. In Spatial Modeling in GIS and R for Earth and Environmental Sciences; Elsevier: Amsterdam, The Netherlands, 2019; pp. 259–275. [Google Scholar] [CrossRef]
- De Graff, J.V.; Romesburg, H.C.; Ahmad, R.; McCalpin, J.P. Producing landslide-susceptibility maps for regional planning in data-scarce regions. Nat. Hazards 2012, 64, 729–749. [Google Scholar] [CrossRef]
- Ali, S.; Biermanns, P.; Haider, R.; Reicherter, K. Landslide susceptibility mapping by using a geographic information system (GIS) along the China-Pakistan Economic Corridor (Karakoram Highway), Pakistan. Nat. Hazards Earth Syst. Sci. 2019, 19, 999–1022. [Google Scholar] [CrossRef]
- Pardeshi, S.D.; Autade, S.E.; Pardeshi, S.S. Landslide hazard assessment: Recent trends and techniques. Springerplus 2013, 2, 11. [Google Scholar] [CrossRef]
- Antoniou, V.; Lappas, S.; Leoussis, C.; Nomikou, P. Landslide Risk Assessment of the Santorini Volcanic Group. In Proceedings of the 3rd International Conference on Geographical Information Systems Theory, Applications and Management (GISTAM 2017), Porto, Portugal, 27–28 April 2017; pp. 131–141. [Google Scholar] [CrossRef]
- Chalkias, C.; Polykretis, C.; Ferentinou, M.; Karymbalis, E. Integrating Expert Knowledge with Statistical Analysis for Landslide Susceptibility Assessment at Regional Scale. Geosciences 2016, 6, 14. [Google Scholar] [CrossRef]
- Nel, W.; Hauptfleisch, A.; Sumner, P.D.; Boojhawon, R.; Rughooputh, S.D.D.V.; Dhurmea, K.R. Intra-event characteristics of extreme erosive rainfall on Mauritius. Phys. Geogr. 2016, 37, 264–275. [Google Scholar] [CrossRef]
- Nigel, R.; Rughooputh, S.D.D.V. A Water Accumulation Flooding Potentiality Index (WAFPI) for rating the risk of flooding- A case study of Mauritius Island. Univ. Mauritius Res. J. 2008, 14, 93–111. [Google Scholar]
- Nigel, R.; Rughooputh, S.D.D.V. A Landslide Potentiality Mapping on Mauritius Island. Available online: https://www.geospatialworld.net/article/a-landslide-potentiality-mapping-on-mauritius-island/ (accessed on 23 November 2019).
- Nigel, R.; Rughooputh, S.D.D.V. Soil erosion risk mapping with new datasets: An improved identification and prioritisation of high erosion risk areas. Catena 2010, 82, 191–205. [Google Scholar] [CrossRef]
- Nel, W.; Mongwa, T.; Sumner, P.; Anderson, R.; Dhurmea, K.; Boodhoo, Y.; Boojhawon, R.; Rughooputh, S.D.D.V. The Nature of Erosive Rainfall on a Tropical Volcanic Island with an Elevated Interior. Phys. Geogr. 2012, 33, 269–284. [Google Scholar] [CrossRef]
- Dai, F.C.; Lee, C.F.; Li, J.; Xu, Z.W. Assessment of landslide susceptibility on the natural terrain of Lantau Island, Hong Kong. Environ. Geol. 2001, 40, 381–391. [Google Scholar] [CrossRef]
- Miller, S.; Degg, M. Landslide susceptibility mapping in North-East Wales. Geomatics, Nat. Hazards Risk 2012, 3, 133–159. [Google Scholar] [CrossRef]
- Grozavu, A.; Pleşcan, S.; Patriche, C.V.; Mărgărint, M.C.; Roşca, B. Landslide susceptibility assessment: GIS application to a complex mountainous environment. In Environmental Science and Engineering (Subseries: Environmental Science); Springer: Berlin/Heidelberg, Germany, 2013; pp. 31–44. [Google Scholar] [CrossRef]
- Chalkias, C.; Kalogirou, S.; Ferentinou, M. Landslide susceptibility Peloponnese Peninsula in South Greece. J. Maps 2014, 10, 211–222. [Google Scholar] [CrossRef]
- Shirzadi, A.; Chapi, K.; Shahabi, H.; Solaimani, K.; Kavian, A.; Ahmad, B.B. Rock fall susceptibility assessment along a mountainous road: an evaluation of bivariate statistic, analytical hierarchy process and frequency ratio. Environ. Earth Sci. 2017, 76, 4. [Google Scholar] [CrossRef]
- National Geographic World Map, Digital Topographic Basemap of the World. Available online: https://services.arcgisonline.com/ArcGIS/rest/services/NatGeo_World_Map/MapServer (accessed on 30 July 2019).
- Ministry of Energy and Public Utilities. Hydrology Data Book 2006–2010. Available online: http://www.gov.mu/portal/site/mpusite (accessed on 29 March 2019).
- Boodhoo, S.Y. The Changing Climate of Mauritius; Mauritius Meteorological Services: Vacoas-Phoenix, Mauritius, 2008. [Google Scholar]
- Mauritius Meteorological Service Climate of Mauritius. Available online: http://metservice.intnet.mu/ (accessed on 23 January 2019).
- Saddul, P. Mauritius: A Geomorphological Analysis; The Mahatma Gandhi Institute Press: Moka, Mauritius, 1995; pp. 28–32. [Google Scholar]
- Sentenac, R. Recherches d’eau Souterraine a l’ile Maurice; MSIRI Occasional Paper; Mauritius Sugar Industry Research Institute: Moka, Mauritius, 1964; Volume 17, pp. 1–21. [Google Scholar]
- McDougall, I.; Chamalaun, F.H. Isotopic dating and geomagnetic polarity studies on volcanic rocks from Mauritius, Indian Ocean. Bull. Geol. Soc. Am. 1969, 80, 1419–1442. [Google Scholar] [CrossRef]
- Baxter, A.N. Magmatic Evolution of Mauritius–Western Indian Ocean. Ph.D. Thesis, University of Edinburgh, Edinburgh, UK, 1972. [Google Scholar]
- Hantke, R.; Seheidegger, A.E. Morphotectonics of the Mascarene Islands. Ann. di Geofis. 1998, 41, 165–181. [Google Scholar] [CrossRef]
- Giorgi, L.; Borchiellini, S.; Delucchi, L. Geologic Map—Hydrogeological Scheme, 1:50,000 and Explanatory Notes; Coorperation et Francophonie and Water Resources Unit: Rose Hill, Mauritius, 1999. (In French) [Google Scholar]
- Montgomery, D.R.; Dietrich, W.E. A physically based model for the topographic control on shallow landsliding. Water Resour. Res. 1994, 30, 1153–1171. [Google Scholar] [CrossRef]
- Aristizábal, E.; García, E.; Martínez, C. Susceptibility assessment of shallow landslides triggered by rainfall in tropical basins and mountainous terrains. Nat. Hazards 2015, 78, 621–634. [Google Scholar] [CrossRef]
- Griffiths, J.S.; Smith, M.J.; Paron, P. Introduction to Applied Geomorphological Mapping. In Developments in Earth Surface Processes; Elsevier: Amsterdam, The Netherlands, 2011; pp. 3–11. [Google Scholar] [CrossRef]
- Pellegrini, G.B.; Carton, A.; Castaldini, D.; Cavallin, A.; D’Alessandro, L.; Dramis, F.; Gentili, B.; Laureti, L.; Prestininzi, A.; Rodolfi, G.; et al. Proposta di legenda geomorfologica ad indirizzo applicativo. Geogr. Fis. E Din. Quat. 1993, 16, 129–152. [Google Scholar]
- SGN. Guida al Rilevamento della Carta Geomorfologica D’ITALIA, 1:50.000; Quad. Ser. III del Serv. Geol. Naz.; Servizio Geologico d’IItalia: Rome, Italy, 1994. [Google Scholar]
- ISPRA; AIGEO. Aggiornamento ed Integrazione delle Linee Guida della Carta Geomorfologica D’italia in Scala 1:50.000; Quad. Ser. III del Serv. Geol. Naz.; Servizio Geologico d’Italia: Rome, Italy, 2018. [Google Scholar]
- Miccadei, E.; Paron, P.; Piacentini, T. The SW escarpment of Montagna del Morrone (Abruzzi, Central Italy): Geomorphology of a fault-generated mountain front. Geogr. Fis. E Din. Quat. 2004, 27, 55–87. [Google Scholar]
- Miccadei, E.; Orrù, P.; Piacentini, T.; Mascioli, F.; Puliga, G. Geomorphological map of the Tremiti Islands (Puglia, Southern Adriatic Sea, Italy), scale 1:15,000. J. Maps 2012, 8, 74–87. [Google Scholar] [CrossRef]
- Miccadei, E.; Piacentini, T.; Pozzo, A.D.; La Corte, M.; Sciarra, M. Morphotectonic map of the Aventino-Lower Sangro valley (Abruzzo, Italy), scale 1:50,000. J. Maps 2013, 9, 390–409. [Google Scholar] [CrossRef]
- Miccadei, E.; Carabella, C.; Paglia, G.; Piacentini, T. Paleo-Drainage Network, Morphotectonics, and Fluvial Terraces: Clues from the Verde Stream in the Middle Sangro River (Central Italy). Geosciences 2018, 8, 337. [Google Scholar] [CrossRef]
- Parlagreco, L.; Mascioli, F.; Miccadei, E.; Antonioli, F.; Gianolla, D.; Devoti, S.; Leoni, G.; Silenzi, S. New data on Holocene relative sea level along the Abruzzo coast (Central Adriatic, Italy). Quat. Int. 2011, 232, 179–186. [Google Scholar] [CrossRef]
- Willaime, P.; Chauviat, C.; Danard, M.; Hosanee, A.; Jhoty, I.; Laidat, D.; Seguin, L. Pedology Map of Mauritius, 1:50,000; Mauritius Sugar Industry Research Institute (MSIRI) and Office de la Recherche Scientifique et Technique Outre-Mer (ORSTOM): Paris, France, 1983. (In French) [Google Scholar]
- Nigel, R.; Rughooputh, S.D.D.V.; Boojhawon, R. Land cover of Mauritius Island. J. Maps 2015, 11, 217–224. [Google Scholar] [CrossRef]
- DOS-MSIRI Soil Map of Mauritius (Provisional Classification) at 1:100,000; Directorate of Overseas Survey (DOS): London, UK, 1962.
- Carrara, A.; Cardinali, M.; Detti, R.; Guzzetti, F.; Pasqui, V.; Reichenbach, P. GIS techniques and statistical models in evaluating landslide hazard. Earth Surf. Process. Landforms 1991, 16, 427–445. [Google Scholar] [CrossRef]
- Guzzetti, F.; Carrara, A.; Cardinali, M.; Reichenbach, P. Landslide hazard evaluation: A review of current techniques and their application in a multi-scale study, Central Italy. Geomorphology 1991, 31, 181–216. [Google Scholar] [CrossRef]
- Baeza, C.; Corominas, J. Assessment of shallow landslide susceptibility by means of multivariate statistical techniques. Earth Surf. Process. Landforms 2001, 26, 1251–1263. [Google Scholar] [CrossRef]
- Ercanoglu, M.; Gokceoglu, C. Use of fuzzy relations to produce landslide susceptibility map of a landslide prone area (West Black Sea Region, Turkey). Eng. Geol. 2004, 75, 229–250. [Google Scholar] [CrossRef]
- Baum, R.L.; Coe, J.A.; Godt, J.W.; Harp, E.L.; Reid, M.E.; Savage, W.Z.; Schulz, W.H.; Brien, D.L.; Chleborad, A.F.; McKenna, J.P.; et al. Regional landslide-hazard assessment for Seattle, Washington, USA. Landslides 2005, 2, 266–279. [Google Scholar] [CrossRef]
- Flentje, P.; Stirling, D.; Chowdhury, R. Landslide Susceptibility and Hazard Derived from a Landslide Inventory Using Data Mining—An Australian Case Study. Available online: https://ro.uow.edu.au/engpapers/368/ (accessed on 23 November 2019).
- Ayalew, L.; Yamagishi, H.; Ugawa, N. Landslide susceptibility mapping using GIS-based weighted linear combination, the case in Tsugawa area of Agano River, Niigata Prefecture, Japan. Landslides 2004, 1, 73–81. [Google Scholar] [CrossRef]
- Foumelis, M.; Lekkas, E.; Parcharidis, I. Landslide susceptibility mapping by GIS-based qualitative weighting procedure in Corinth area. Bull. Geol. Soc. Greece 2004, 36, 904–912. [Google Scholar] [CrossRef]
- Moradi, M.; Bazyar, M.H.; Mohammadi, Z. GIS-based landslide susceptibility mapping by AHP method, a case study, Dena City, Iran. J. Basic Appl. Sci. Res. 2012, 2, 6715–6723. [Google Scholar]
- Roslee, R.; Mickey, A.C.; Simon, N.; Norhisham, M.N. Landslide susceptibility analysis (LSA) using weighted overlay method (WOM) along the Genting Sempah to Bentong highway, Pahang. Malaysian J. Geosci. 2018, 1, 13–19. [Google Scholar] [CrossRef]
- Lee, S.; Min, K. Statistical analysis of landslide susceptibility at Yongin, Korea. Environ. Geol. 2001, 40, 1095–1113. [Google Scholar] [CrossRef]
- Romeo, R.W.; Mari, M.; Floris, M.; Pappafico, G.; Gori, U. Un approccio per coniugare la suscettività spaziale e temporale da frana: Un’applicazione nella regione marche (Italia Centrale). Ital. J. Eng. Geol. Environ. 2011, 2, 63–78. [Google Scholar]
- Basharat, M.; Shah, H.R.; Hameed, N. Landslide susceptibility mapping using GIS and weighted overlay method: a case study from NW Himalayas, Pakistan. Arab. J. Geosci. 2016, 9, 292. [Google Scholar] [CrossRef]
- Carabella, C.; Miccadei, E.; Paglia, G.; Sciarra, N. Post-Wildfire Landslide Hazard Assessment: The Case of The 2017 Montagna Del Morrone Fire (Central Apennines, Italy). Geosciences 2019, 9, 175. [Google Scholar] [CrossRef]
- Ayalew, L.; Yamagishi, H. The application of GIS-based logistic regression for landslide susceptibility mapping in the Kakuda-Yahiko Mountains, Central Japan. Geomorphology 2005, 65, 15–31. [Google Scholar] [CrossRef]
- Dou, J.; Bui, D.T.; Yunus, A.P.; Jia, K.; Song, X.; Revhaug, I.; Xia, H.; Zhu, Z. Optimization of causative factors for landslide susceptibility evaluation using remote sensing and GIS data in parts of Niigata, Japan. PLoS ONE 2015, 10. [Google Scholar] [CrossRef]
- Costanzo, D.; Rotigliano, E.; Irigaray, C.; Jiménez-Perálvarez, J.D.; Chacón, J. Factors selection in landslide susceptibility modelling on large scale following the gis matrix method: Application to the river Beiro basin (Spain). Nat. Hazards Earth Syst. Sci. 2012, 12, 327–340. [Google Scholar] [CrossRef]
- Çevik, E.; Topal, T. GIS-based landslide susceptibility mapping for a problematic segment of the natural gas pipeline, Hendek (Turkey). Environ. Geol. 2003, 44, 949–962. [Google Scholar] [CrossRef]
- Yalcin, A.; Reis, S.; Aydinoglu, A.C.; Yomralioglu, T. A GIS-based comparative study of frequency ratio, analytical hierarchy process, bivariate statistics and logistics regression methods for landslide susceptibility mapping in Trabzon, NE Turkey. Catena 2011, 85, 274–287. [Google Scholar] [CrossRef]
- Süzen, M.L.; Doyuran, V. Data driven bivariate landslide susceptibility assessment using geographical information systems: A method and application to Asarsuyu catchment, Turkey. Eng. Geol. 2004, 71, 303–321. [Google Scholar] [CrossRef]
- Komac, M. A landslide susceptibility model using the Analytical Hierarchy Process method and multivariate statistics in perialpine Slovenia. Geomorphology 2006, 74, 17–28. [Google Scholar] [CrossRef]
- Wilson, J.P.; Gallant, J.C. Digital Terrain Analysis. In Terrain Analysis: Principles and Applications; Wiley & Sons: New York, NY, USA, 2000; pp. 1–27. [Google Scholar]
- Hungr, O.; Wilson, P. Stability of slopes curved in plain—An example. In Proceedings of the 59th Canadian Geotechnical Conference, Vancouver, BC, Canada, 1–4 October 2006. [Google Scholar]
- Conforti, M.; Aucelli, P.P.C.; Robustelli, G.; Scarciglia, F. Geomorphology and GIS analysis for mapping gully erosion susceptibility in the Turbolo stream catchment (Northern Calabria, Italy). Nat. Hazards 2011, 56, 881–898. [Google Scholar] [CrossRef]
- Yesilnacar, E.; Topal, T. Landslide susceptibility mapping: A comparison of logistic regression and neural networks methods in a medium scale study, Hendek region (Turkey). Eng. Geol. 2005, 79, 251–266. [Google Scholar] [CrossRef]
- Ding, J.; Yang, Z.; Shang, Y.; Zhou, S.; Yin, J. A new method for spatio-temporal prediction of rainfall-induced landslide. Sci. China, Ser. D Earth Sci. 2006, 49, 421–430. [Google Scholar] [CrossRef]
- Lepore, C.; Kamal, S.A.; Shanahan, P.; Bras, R.L. Rainfall-induced landslide susceptibility zonation of Puerto Rico. Environ. Earth Sci. 2012, 66, 1667–1681. [Google Scholar] [CrossRef]
- Segoni, S.; Tofani, V.; Rosi, A.; Catani, F.; Casagli, N. Combination of Rainfall Thresholds and Susceptibility Maps for Dynamic Landslide Hazard Assessment at Regional Scale. Front. Earth Sci. 2018, 6, 85. [Google Scholar] [CrossRef]
- Piacentini, T.; Galli, A.; Marsala, V.; Miccadei, E. Analysis of soil erosion induced by heavy rainfall: A case study from the NE Abruzzo Hills Area in Central Italy. Water 2018, 10, 1314. [Google Scholar] [CrossRef]
- Griffiths, J.S.; Mather, A.E.; Stokes, M. Mapping landslides at different scales. Q. J. Eng. Geol. Hydrogeol. 2015, 48, 29–40. [Google Scholar] [CrossRef]
© 2019 by the authors. Licensee MDPI, Basel, Switzerland. This article is an open access article distributed under the terms and conditions of the Creative Commons Attribution (CC BY) license (http://creativecommons.org/licenses/by/4.0/).