Article

A Novel Approach to Isolation and Screening of Calcifying Bacteria for Biotechnological Applications

Department of Life, Health & Environmental Sciences, Microbiology Laboratory, University of L’Aquila, Coppito, 67010 L’Aquila, Italy
*
Author to whom correspondence should be addressed.
Geosciences 2019, 9(11), 479; https://doi.org/10.3390/geosciences9110479
Submission received: 31 October 2019 / Revised: 12 November 2019 / Accepted: 12 November 2019 / Published: 14 November 2019
(This article belongs to the Special Issue Tracking the Deep Biosphere through Time)

Abstract

:
Bacterial calcium-carbonate precipitation (BCP) has been studied for multiple applications such as remediation, consolidation, and cementation. Isolation and screening of strong calcifying bacteria is the main task of BCP-technique. In this paper, we studied CaCO3 precipitation by different bacteria isolated from a rhizospheric soil in both solid and liquid media. It has been found, through culture-depending studies, that bacteria belonging to Actinobacteria, Gammaproteobacteria, and Alphaproteobacteria are the dominant bacteria involved in CaCO3 precipitation in this environment. Pure and mixed cultures of selected strains were applied for sand biocementation experiments. Scanning electron microscopy (SEM) and energy dispersive X-ray spectroscopy (EDS) analyses of the biotreated samples revealed the biological nature of the cementation and the effectiveness of the biodeposition treatment by mixed cultures. X-ray diffraction (XRD) analysis confirmed that all the calcifying strains selected for sand biocementation precipitated CaCO3, mostly in the form of calcite. In this study, Biolog® EcoPlate is evaluated as a useful method for a more targeted choice of the sampling site with the purpose of obtaining interesting candidates for BCP applications. Furthermore, ImageJ software was investigated, for the first time to our knowledge, as a potential method to screen high CaCO3 producer strains.

1. Introduction

In natural environments, chemical CaCO3 precipitation is accompanied by microbial processes involving bacteria, particularly cyanobacteria, archaea, small algae, and fungi [1]. Bacterial calcium-carbonate precipitation (BCP) is of major ecological and geological importance, and it has been widely studied in soils, caves, lakes, spring, and seawater, as well as in the laboratory [2,3,4,5,6,7,8,9,10,11,12,13,14,15]. Chemical CaCO3 precipitation is a rather straightforward process governed mainly by concentration of non-precipitated calcium, concentration of the total inorganic carbon, pH, and availability of nucleation sites for CaCO3 crystal formation [16,17,18]. Bacteria can alter these factors, either separately or in combinations with one another, in a number of ways linked to cell surface structures and metabolic activities [16,17,18,19,20,21,22,23,24,25,26,27,28,29,30,31,32,33,34,35,36]. For example, in super-saturated solution, bacteria can become the nucleus of mineral precipitation due to Ca2+ adsorption to the capsule, cellular surface membrane, cell wall, or EPS (exo-poly-saccharides) layer [21,23,24,25,26]. Alternatively, in under-saturated solution, bacteria can induce precipitation of CaCO3 through metabolic pathways associated with photosynthesis [17,19,28,29,32,33,34], nitrogen and sulfur cycles [17,31], and ion exchange (Ca2+/H+) [20]. These different metabolic processes increase pH and/or dissolved inorganic carbon concentration, favoring CaCO3 precipitation.
The various ecological implications of BCP in biotechnology have been described by Zhu and Dittrich [37]. BCP applications include: Bioremediation of metal contaminated soil and ground water; restoration and preservation of calcareous sculptural artefacts, historical monuments and civil buildings; bioconcrete; different geotechnical-engineering applications such as soil/sand strength, sand impermeability, mitigation of liquefaction, soil erosion control, impermeabilization of polluted soils and other soil improvement projects; microbial enhanced oil recovery (EOR); CO2 sequestration; filler for rubber, plastic, and ink [38,39,40,41].
There are two ways to apply BCP technology to sand/soil improvement. The first (biostimulation) involves increasing BCP naturally occurring in the soil, through specific nutrient injection until it reaches the desired level. To date, because of its simplicity, the most commonly studied system of applied BCP is urea hydrolysis via the enzyme urease. The second (bioaugmentation) involves the use of selected calcifying bacteria that, in primis, produce CaCO3 crystals at high amount and speed, in suitable environment. Until now, calcifying bacteria for the different biotechnological uses have been isolated mainly from soil, freshwater and seawater, different CaCO3 deposits such as stalactites and stalagmites in caves, and screened based mostly on traditional method (which requires a large amount of reagent and time) [41]. However, there are few studies on the rhizosphere bacteria ability to precipitate CaCO3 [27,42] despite the fact that root exudates include amino acids (whose metabolization produces the pH conditions necessary for BCP), as well as low-molecular weight organic acids whose mineralization by heterotrophic bacteria can lead to CaCO3 precipitation in a circumneutral environment rich in dissolved calcium [20,27].
In this study, we enriched a consortium of bacteria isolated from rhizosphere soil based on their ability to precipitate CaCO3. Then, we isolated several individual members of this community, and analyzed their metabolism and biomineralization to screen strong CaCO3 depositor strains. The best strains were further characterized based on their ability to cement sand.
The novelty of this study lies above all in the microbiological approach to biocementation. It is based on the study of the indigenous microbial community of a rhizospheric soil (such as in biostimulation) and then on the use of calcifying bacterial strains or their consortia (such as in bioaugmentation) isolated from it. This is because we attempted to optimize the choice of the sampling site by Biolog EcoPlate assay (assessing the carbonatogenic potential of the microbial community dwelling the soil) to obtain effective calcifying strains to be used also in other sites, as well as for biotechnological applications other than biocementation.
Biolog EcoPlates are 96-well plates, containing in triplicate 31 different substrates plus a control [43]. The substrates in the wells can be subdivided into five groups: Carbohydrates (n = 10), carboxylic acids (n = 9), amines and amides (n = 2), amino acids (n = 6), and polymers (n = 4). These compounds occur naturally in the soil and most of them are exudate by plant root in the rhizosphere [44]. In each well there is a redox indicator (a tetrazolium salt) that changes from colorless into purple in the presence of metabolic activity of the microbial community. The intensity of the coloring, which is optically measured at 590 nm, is proportional to the substrate utilization.
As to methodological novelty, we proposed the use of ImageJ [45,46] as a low cost and rapid method to assess the in vitro mineralization aptitude of calcifying strains. A calcifying strain is of interest from a biotechnological point of view, mainly, when it produces a large amount of crystals that can be evaluated, for example, by recovering the crystals from agar and weighing them [22]. This operation is time consuming and not always leads to the expected result because crystals can remain embedded in the microbial biofilm. The ImageJ, already used in many scientific applications, allows screening in a shorter time.

2. Materials and Methods

2.1. Soil Sampling, Biolog EcoPlate Assay, and Physico–Chemical Analyses

In this study, we used the Biolog EcoPlates to assess the carbonatogenic potential of the microbial communities dwelling the rhizosphere soil of Pinus strobus (Pinaceae), with the purpose of choosing a proper sampling site for an efficient screening of calcifying bacterial strains (since bacterial mineralization of organic acids and amino acids are important metabolic pathways involved in BCP). As the probability to select strong calcifying bacteria should likely increase starting the screening program from a soil dwelled by metabolically active, versatile, and highly diversified microbial community, we used the Biolog EcoPlate assay to obtain information also in this regard.
The rhizosphere soil was sampled from the garden of a residential area located near L’Aquila (Central-Italy) at a depth of 5 cm, using sterile tools. The composite sample, placed into a sterile container, was carried to the laboratory at room temperature and immediately subjected to Biolog EcoPlate assay (BIOLOG Inc., Hayward, CA, USA) and microbiological analyses, performed in triplicate. 3 g of soil were added to 27 mL of sterile physiological solution (0.9% NaCl) into a sterile flask, stirred for 30 min at room temperature and then centrifuged for 2 min at 2000 rpm. The supernatant was collected and placed into a sterile Petri dish, under sterile condition. A multichannel pipette was used to inoculate 150 µL of the bacterial suspension into each well of the Biolog EcoPlate. The microplates were placed in a sterile plastic envelope, hermetically sealed, in order to limit the dehydration of the wells and incubated at 28 °C. The metabolic fingerprints were analyzed by measuring the absorbance at the Biolog Microstation, immediately following the inoculation procedure, considered as time zero, then every 24 h until 216 h.
Microbial activity in each EcoPlate, was expressed as average well color development (AWCD), which gives the index of the total metabolic potential of the community [47]. AWCD was determined as follows Equation (1):
AWCD = i = 1 31 O D i 31
To calculate the AWCD at each reading time, the optical densities from each well (ODi) were corrected by subtracting the initial reading at time zero of the same well, as well as of the blank one (inoculated but without a carbon source). OD590 = 0.25 was assumed as a threshold value, below which a substrate was considered as unmetabolized [47].
The following metabolic-ecological indexes were calculated based on the ODs at 120 h, when the community reached the plateau: (i) Metabolic richness index (R) as the number of oxidized substrates, that indicates the metabolic versatility of the community [48]; (ii) the Shannon–Weaver index (H′), that measures the metabolic diversity of the species present. It was calculated as follows Equation (2):
H = i = 1 R p i   ( l n p i )
where pi (the proportional color development of the well over total color development of all wells in the plate) is calculated as the ratio of the corrected absorbance value of each well (ODi) to the sum of the absorbance value (∑ODi) of all wells in the plate [47] and (iii) the evenness index (E). This index, calculated as H′/lnR, measures the variation in color development among wells and indicates the uniformity in the microbial growth on the different substrates, which can be related to a similar abundance of the different species [47,48,49].
For a better knowledge of the material, physico–chemical properties of the sampled soil including pH, organic carbon content (%), total nitrogen (%), and assimilable phosphorous concentrations (mg/Kg), cation exchange capacity—CEC (meq) and exchangeable Ca2+, Mg2+, K+, Na+ (mg/Kg), total, and active calcium carbonate content (%), electric conductivity—EC (mS), texture, sand, silt, and clay fractions (%) were determined according with the official methods [9].
As shown in Table 1, the sampled soil was a sandy-loam soil containing an average amount of total carbonates and a very high amount of Ca2+. Total pH was weak alkaline. The content of total N and available P were low and very low, respectively.

2.2. Isolation of CaCO3 Producing Bacteria

An amount of sample corresponding to 10 g of dried soil was resuspended in 90 mL sterile physiological solution and stirred for 50 min to detach the bacteria, whose external surface is negatively charged, from soil cations. Triplicate B4 agar plates [4] (2.5 g calcium acetate, 4.0 g yeast extract, 10.0 g glucose, and 18.0 g Biolife agar per liter of distilled water, the final pH was adjusted to 8.0 with NaOH) were inoculated with soil dilutions ranging from 10−2–10−6 and incubated aerobically at 28 °C for 24 or 48 h (depending on the growth rate of the bacteria). B4 is an enrichment medium for calcifying bacteria; the acetate ion is an energy source, while the Ca2+ cation is used by the calcifying bacteria to precipitate calcium carbonate. The presence of glucose speeds the process. After its first description in 1973 [4], B4 medium was utilized by several authors [50,51,52,53,54] to stimulate the growth of calcifying bacterial species. The rationale is that calcifying heterotrophic bacteria belong to various groups with different nutritional and physiological properties so that the presence of nutrients widespread in the environment, such as glucose and factors present in yeast extract, is expected to enlarge the platform of enriched strains. Colonies were assessed every 24/48 h with optical microscopy (Leitz-Biomed) and selected as positive based on visual crystal formation within 25 days. Positive isolates were purified by repeated streaking on B4 agar plates and preliminarily characterized.
A serial dilution of the soil sample was also plated in triplicate on nutrient agar (Difco) for colony forming unit (CFU) counting.
Calcifying bacteria were preserved by various methods. For short-term preservation, strains were incubated at 28 °C for 2–5 days and then kept at 4 °C on slants of B4. For long-term maintenance pure cultures were kept in glycerol at −80 °C.

2.3. Preliminary Characterization and Biolog Identification

Morphological characterization of the bacterial colony was performed on the basis of pigmentation, form, elevation, margin, opacity, and surface [55]. Optical microscope (Leitz-Biomed, 40× and 100×) was used to establish the shape of the heat-fixed bacterial cells after Gram staining by the Color Gram 2 Kit (bioMérieux, Marcy-l’Etoile/France), following the kit instructions. Physiological characterization was performed on the basis of the relation to temperature (bacterial isolates were incubated on B4 agar at 4, 20, and 28 °C, significant temperatures for in situ biocementation experiments) and oxygen presence (since anaerobic conditions are abundant in the soil, particularly when the rain saturates the soil and gas exchange slows down almost completely) by incubating bacterial strains on B4 agar in an anaerobic chamber (Oxoid, Hampshire, UK). The occurrence of a catalase reaction was demonstrated by the formation of bubbles after mixing a suspension of one-day bacterial cultures with a drop of 3% (v/v) hydrogen peroxide water-solution on slide. Urease activity of calcifying strains was detected on Christensen agar medium containing 2% urea and phenol red as pH indicator [56,57]. We cooled the sterilized medium (115 °C for 20 min) to 40–50 °C, before adding the urea supplement. Inoculated agar slants were incubated at 28 °C for 24/48 h and observed for color change after 6, 24, and 48 h of incubation. Microorganisms with urease activity hydrolyze urea with the ammonium ions production causing a change of color of the agar medium to fuchsia (alkaline pH).
Biolog GN2 and GP2 plates (Biolog, Inc., Hayward, Calif., USA) were used for the identification of Gram-negative and Gram-positive bacteria, respectively. One or two days (depending on the growth rate of the bacterium) before the inoculation on Biolog GN2 and GP2 plates, bacterial strains were streaked on Biolog universal growth agar (BUG) and incubated at 28 °C. Inoculation and reading of micro-plates were carried out according to the instructions of manufacturer using a Biolog Microstation with OmniLog. The Biolog method is based on oxidation tests of 93 substrates in a 96-well microtiter plate. Each well contains a redox dye, tetrazolium violet, that allows colorimetric determination of the increased respiration that occurs when microbial cells are oxidizing a C-substrate. Reactions were compared to the GP or GN database based on the similarity index which must be at least 0.75 to be considered an acceptable species identification after 4 h of incubation and at least 0.50 after 16–24 h of incubation.

2.4. Calcification and CaCO3 Solubilization Activities

Pure bacterial cultures on B4 agar plates were observed every 24/48 h under a light microscope (Leitz-Biomed, 10×) for up to 25 days after inoculation, to follow crystal production by the bacterial strains at different temperatures, under aerobic condition. Three temperatures 4, 20, and 28 °C were selected to test the induction of carbonate precipitation by the bacterial isolates, as representative of natural conditions. The bacterial aptitude for calcification was evaluated on the basis of: (i) CaCO3 crystal amount on B4 agar, (ii) size of the CaCO3 bioliths, (iii) presence of CaCO3 aggregates, (iv) time to initiate the precipitation activity. Position of crystals on B4 agar (on the colony, in proximity, or far away in the medium) was also checked.
Calcifying bacterial strains were inoculated also into 100 mL of sterile B4 liquid medium, to assess their capability to precipitate in liquid conditions. Inoculated flasks were incubated under static conditions at 28 °C for two months. The presence of crystals was macroscopically assessed both at the bottom of the flasks and on the wall.
As microbial mediated reactions can generate considerable amounts of H+ ions that can dissolve CaCO3 deposits, we tested the ability of the selected calcifying strains to dissolve CaCO3 after 7, 15, and 30 days of incubation at 28 °C. Calcifying isolates were grown on the Deveze-Bruni medium (1.0 g peptone, 1.0 g yeast extract, 5.0 g glucose, 5.0 g NaCl, 0.4 g K2HPO4, 0.5 g (NH4)2SO4, 0.1 g MgCl2, 0.01g FeCl2, 0.1 g CaCl2, pH = 6.8) supplemented with 0.14 or 2.5% (w/v) CaCO3 [58]. Solubilization activity was shown as clear halo that surrounded each colony in response to decreased pH [59].

2.5. ImageJ Analysis

In the present research, the ImageJ software was evaluated as a rapid screening method to estimate the extent of CaCO3 production on B4 agar plates by each calcifying bacterial strain, after 30 days of growth at 28 °C. ImageJ analysis was performed from digital images of five different areas (total area = 125 × 5 mm2) of the inoculated B4 agar plates (plate area = 6359 mm2) observed upside down at optical microscope (Leitz-Biomed, 10×) (Figure 1). These areas were randomly chosen and acquired through an iPhone, used as the camera, directly from the eyepiece of the microscope. By ImageJ analysis we calculated the total area occupied by the crystals on each optical image and the mean (with its standard deviation) on each set of the five images, to obtain the percent average surface covered by CaCO3 crystals (referred as BCP extent) deposited in vitro by each calcifying strain. In this preliminary study, the scale bar was determined by a micrometric slide.

2.6. Sand Biocementation Test

Experiments of consolidation by BCP were carried out using sand samples from the Adriatic-sea coast (Central Italy) and bacterial calcifying cultures selected during this study. Table 2 shows some of the physical and chemical characteristics of the sand used in this study.
The sand was characterized by a weak alkaline pH, a medium content of total carbonates and a high level of exchangeable Ca2+. The content of organic matter as well as of total N and assimilable P were very low.
The following biocementation experiments were set up: (i) 7 g of sand, on Petri dish, for three weeks; (ii) 300 g of sand, in Magenta vessel, for two months; (iii) 300 g of sand, in Magenta vessel, for two months in the presence of equimolar (1 M) urea and calcium chloride, as calcification inducing-agents. Control specimens were sand samples treated with not inoculated B4 medium.
For sand biocementation on Petri dish, strain selection was based on: (i) Calcification extent (% area covered by CaCO3 crystals precipitated on B4 agar plates) established by ImageJ software. This parameter depends on amount and size of the precipitated CaCO3 crystals, presence of CaCO3 aggregates, days to initiate bio-precipitation, CaCO3 solubilization activity; (ii) calcification parameters not included in the calcification extent, such as biodeposition in liquid medium and capability to precipitate CaCO3 at different temperatures; (iii) cell morphology; (iv) relation with oxygen; (v) Gram-staining 7 g of washed sand, sterilized at 120 °C for 20 min and dried in an oven, were homogenously distributed on a 90 mm Petri dish and then inoculated with 25 mL of a calcifying cell suspension (107 CFU/mL), grown on B4 medium. Biopretreated samples were incubated at 28 °C statically, to allow the bacteria to cement the sand.
To test BCP in depth, 300 g of sand were placed in a Magenta vessel and inoculated with 150 mL of a calcifying cell suspension (106 CFU/mL), grown on B4 medium, in the presence or not of the inducing agents (equimolar urea and calcium chloride). For sand biocementation in Magenta vessel, strain selection was based on: (i) Calcification extent (established by ImageJ software), (ii) ability to precipitate CaCO3 crystals in B4 liquid medium, (iii) ability to hydrolyze urea, and (iv) growth in anaerobiosis.

2.7. SEM, XRD, and EDS Analyses

Scanning electron microscopy (SEM) was used to study crystal morphology and their relationship with microbial cells. Samples were prepared as follows: Samples on agarized media were dried at 37 °C for 40 days; agar medium was cut into flat blocks, gold-sputtered, and observed with a Philips SEM XL30CP. For crystallite-poor samples, the agar was dissolved and crystals were collected and purified according to the method of Rivadeneyra [22].
XRD was used to identify CaCO3 mineral phases of the bioprecipitated crystals. XRD analyses were done by a two-circle θ/2θ diffractometer with a Cu radiation source (Bruker D5000). The supply voltage of the X-ray tube was set at 40 kV, 40 mA. The 2θ scan range was between 20 and 60°; each scan was done in steps of 0.02. A counting time between 30 and 40 s per step was selected, depending on the sample density. The crystalline phases were identified using the ICDD database (JCPDS). XRD samples were prepared as follows: Cultured solid media were dried at 32 °C, agar medium was cut into 10 × 30 mm flat blocks, 0.5 mm high, and those richest in crystallites were fixed by adhesive tape on a glass slide for X-ray measurements.
SEM and EDS were used to detect, after 20 days-treatment, the nature of sand cementation by the calcifying cultures. For EDS, samples were dried, uniformly spread directly on adherent tabs, and analyzed without gold film. SEM-EDS analysis was performed by a SEM-Philips XL30CP and a EDX-INCA ENERGY 250.
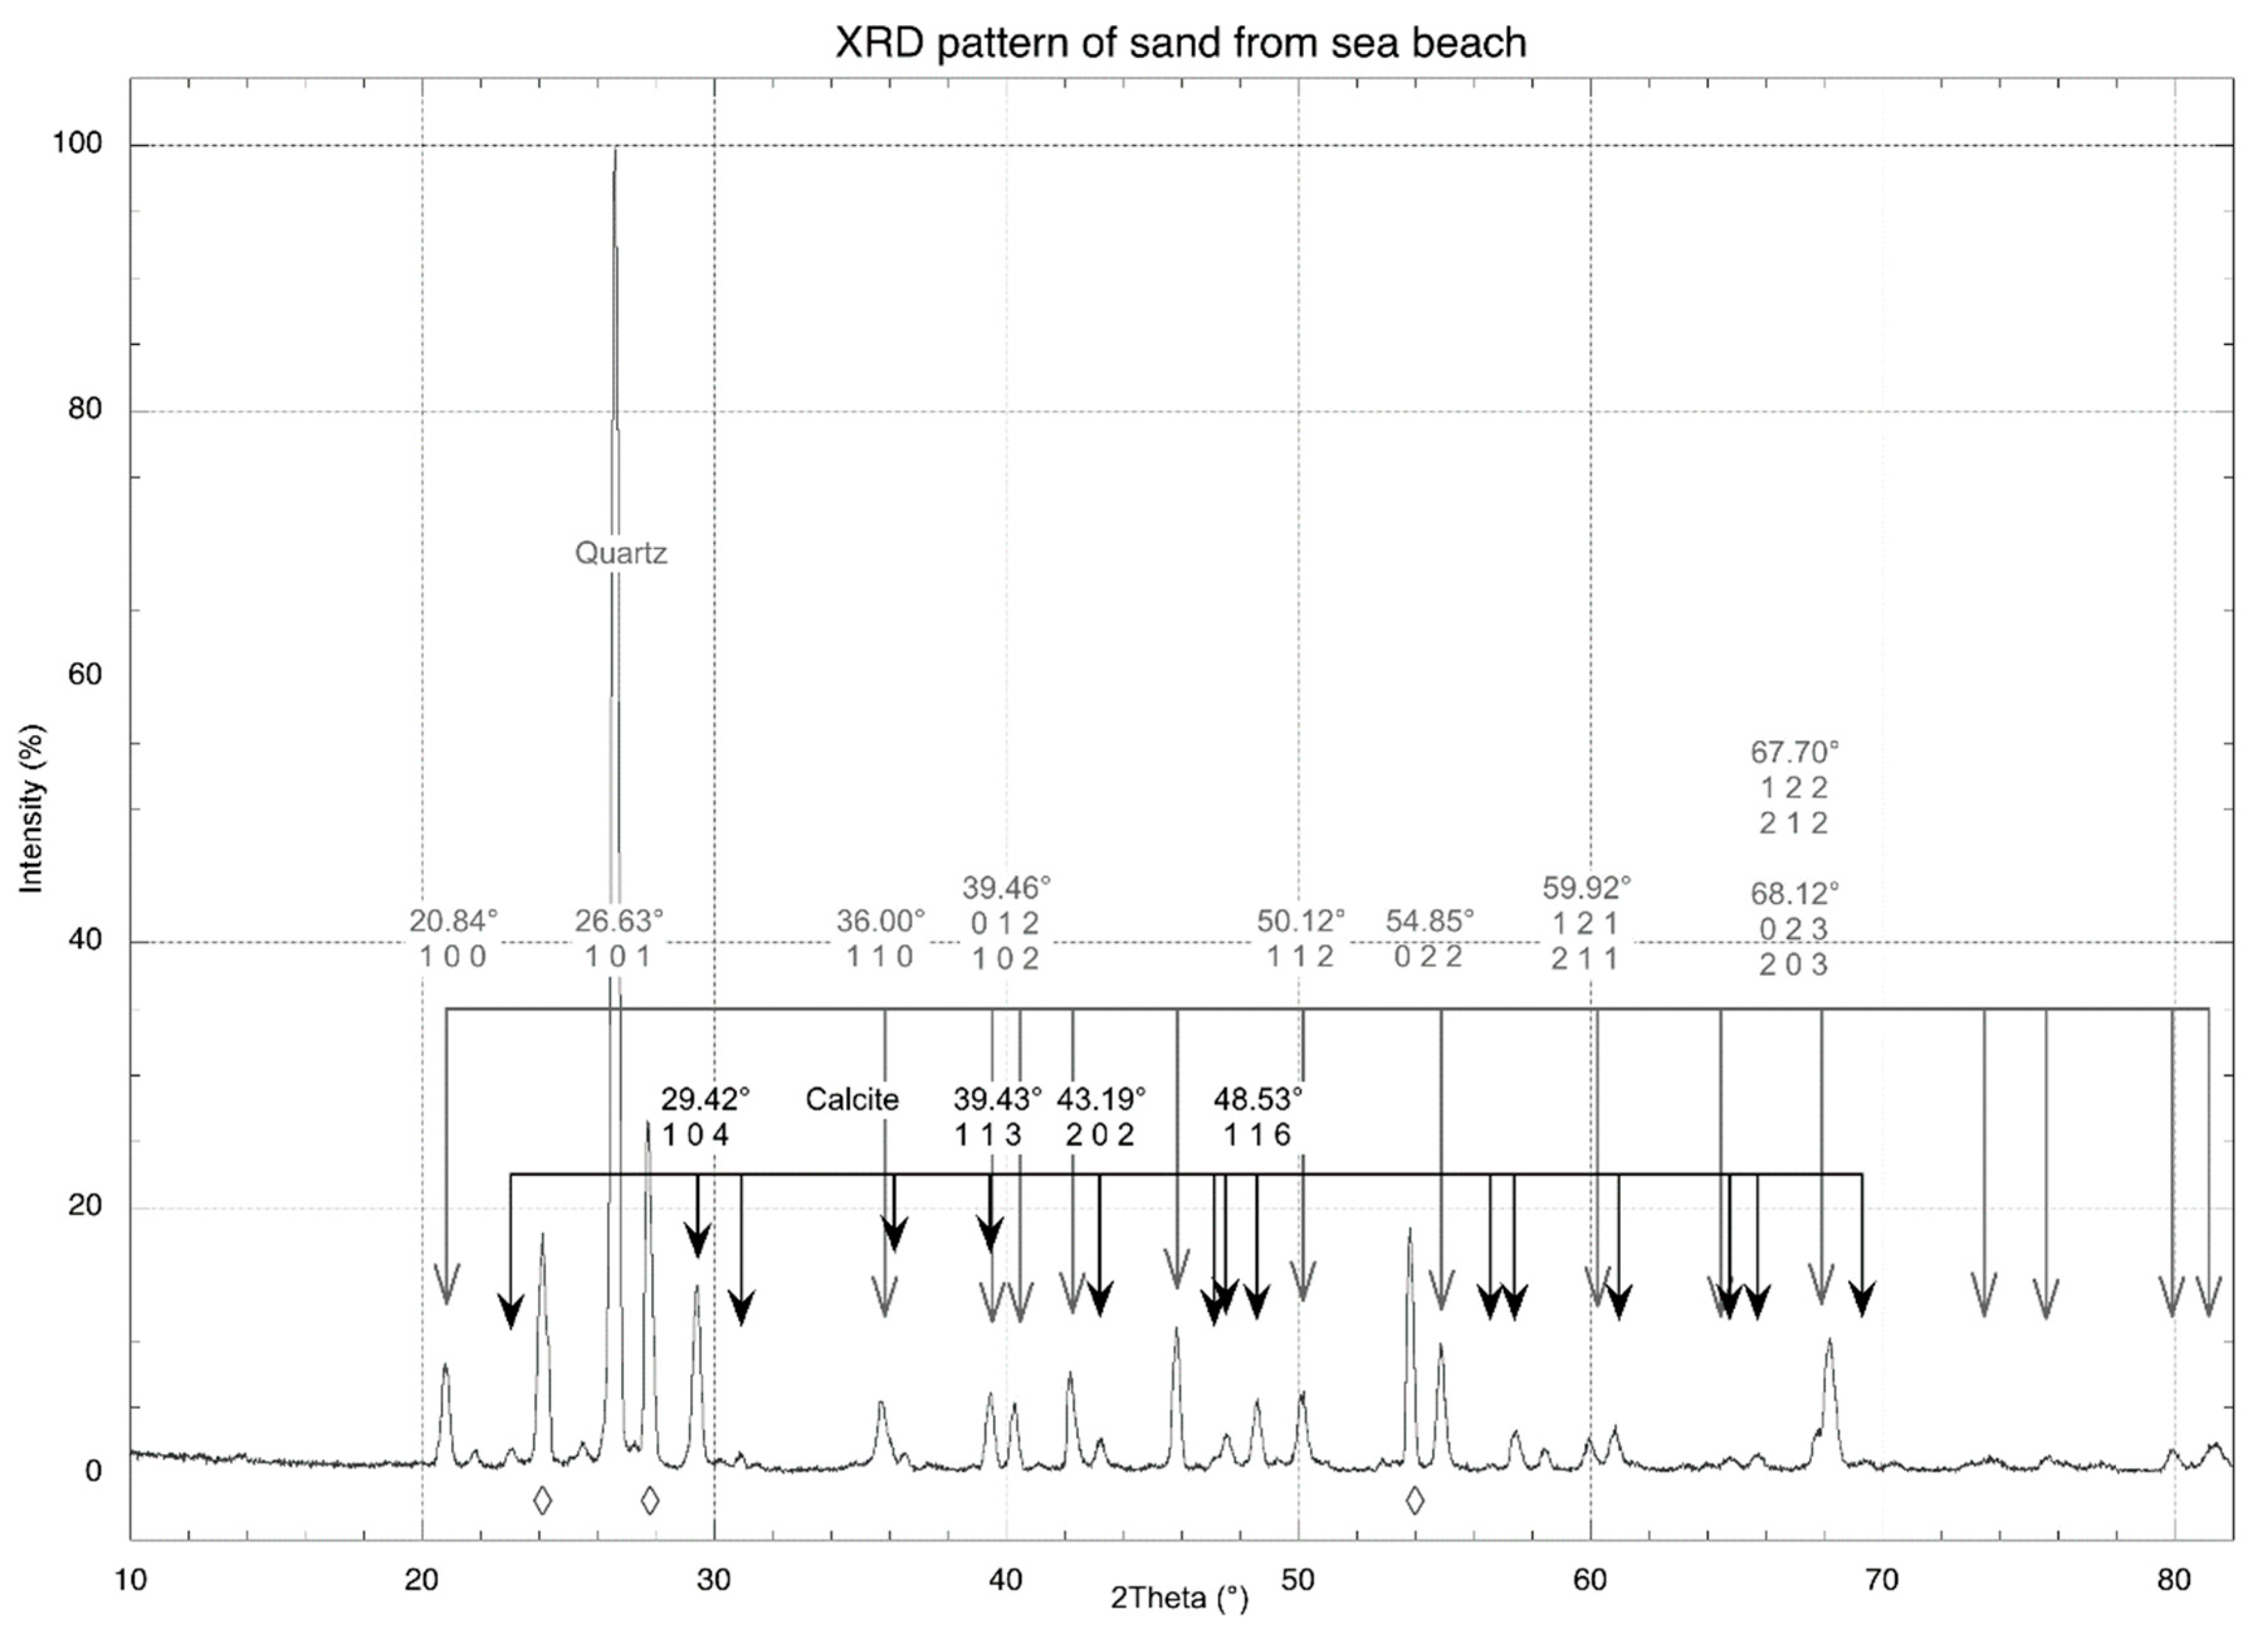
XRD and EDS were also used to study the untreated sea sand.

3. Results and Discussion

3.1. Biolog EcoPlates Assay

Since BCP is influenced by the metabolic activity of the bacteria, we investigated through the Biolog EcoPlates the metabolic activity of the bacterial communities dwelling a rhizospheric soil, with the purpose of choosing a good sampling site for an efficient calcifying bacteria screening. In the literature there is a lot of information about the possibilities of using the Biolog EcoPlates to analyze functional microbial diversity in the presence of different plant and cultivation type, and to study the metabolic activity of microorganisms in soils contaminated with pesticides and heavy metals.
To our knowledge, Andrei et al. [60] were the first to use Biolog EcoPlates to investigate the carbonatogenic potential of bacterial communities (dwelling a limestone statue in Romania), based on their ability to metabolize amino acids since this metabolization promotes the pH conditions necessary for the biomineralization process (by ammonia released in the process of oxidative deamination). Overall, Andrei et al. study highlights the need to evaluate the carbonatogenic potential of the bacterial communities present on a stone artwork prior to designing an efficient conservation treatment based on resident calcifying bacteria. On the same line, we used the Biolog EcoPlate assay to assess the carbonatogenic potential of the bacterial community dwelling a rhizospheric soil at the aim of starting an efficient screening program of calcifying bacteria.
Unlike Andrei et al., in this study we have correlated the carbonatogenic potential of the bacterial communities to the metabolic use not only of the amino acids but also of the organic acids present in the Biolog EcoPlate. This is because both these carbon compounds occur naturally in the rhizospheric soil environment, as plant root exudates, as well as because low-molecular weight organic acids mineralization by heterotrophic bacteria is another microbial process that (increasing both pH and concentration of dissolved inorganic carbon) can lead to calcium carbonate precipitation in a circumneutral environment rich in dissolved calcium. As CaCO3 precipitation always appears to be a response of the heterotrophic bacterial communities to an enrichment of the environment in organic matter in aerobiosis, anaerobiosis, and microaerophilia, this mineralization process has been commonly used in microbial carbonate precipitation experiments [17,20]. Moreover, since the probability of obtaining efficient CaCO3 producer strains increases likely in the presence of bacterial communities highly biodiversified with a high catabolic versatility, we used the Biolog EcoPlate assay also to obtain information about these metabolic and ecological aspects. Based on these considerations, all the information of the studied rhizospheric soil obtained through the Biolog EcoPlate system revealed its usefulness to start a successful screening of calcifying bacteria. In fact, we found that at the end of the incubation period, the soil microbial community used 29 out of 31 different substrates (metabolic Richness index R = 29) present in the Biolog EcoPlate, including all the amino acids and almost all the organic acids (apart from 2-hydroxybenzoic acid and α-ketobutyric acid). This means that the microbial community under study had a high functional diversity and catabolic versatility as well as a good mineralization potential of CaCO3 (the utilization of all the six amino acids, as well as of almost all the carboxylic acids indicates the presence in the soil of favorable conditions for the growth of microorganisms carrying the enzymes taking part in metabolic pathways of BCP). The general catabolic activity of the soil community to utilize the C-substrates, turned out to be not only wide (as shown by the metabolic Richness index, R) but also high as shown by the dynamic of the AWCD during the incubation time of the EcoPlates, at 28 °C (Figure 2).
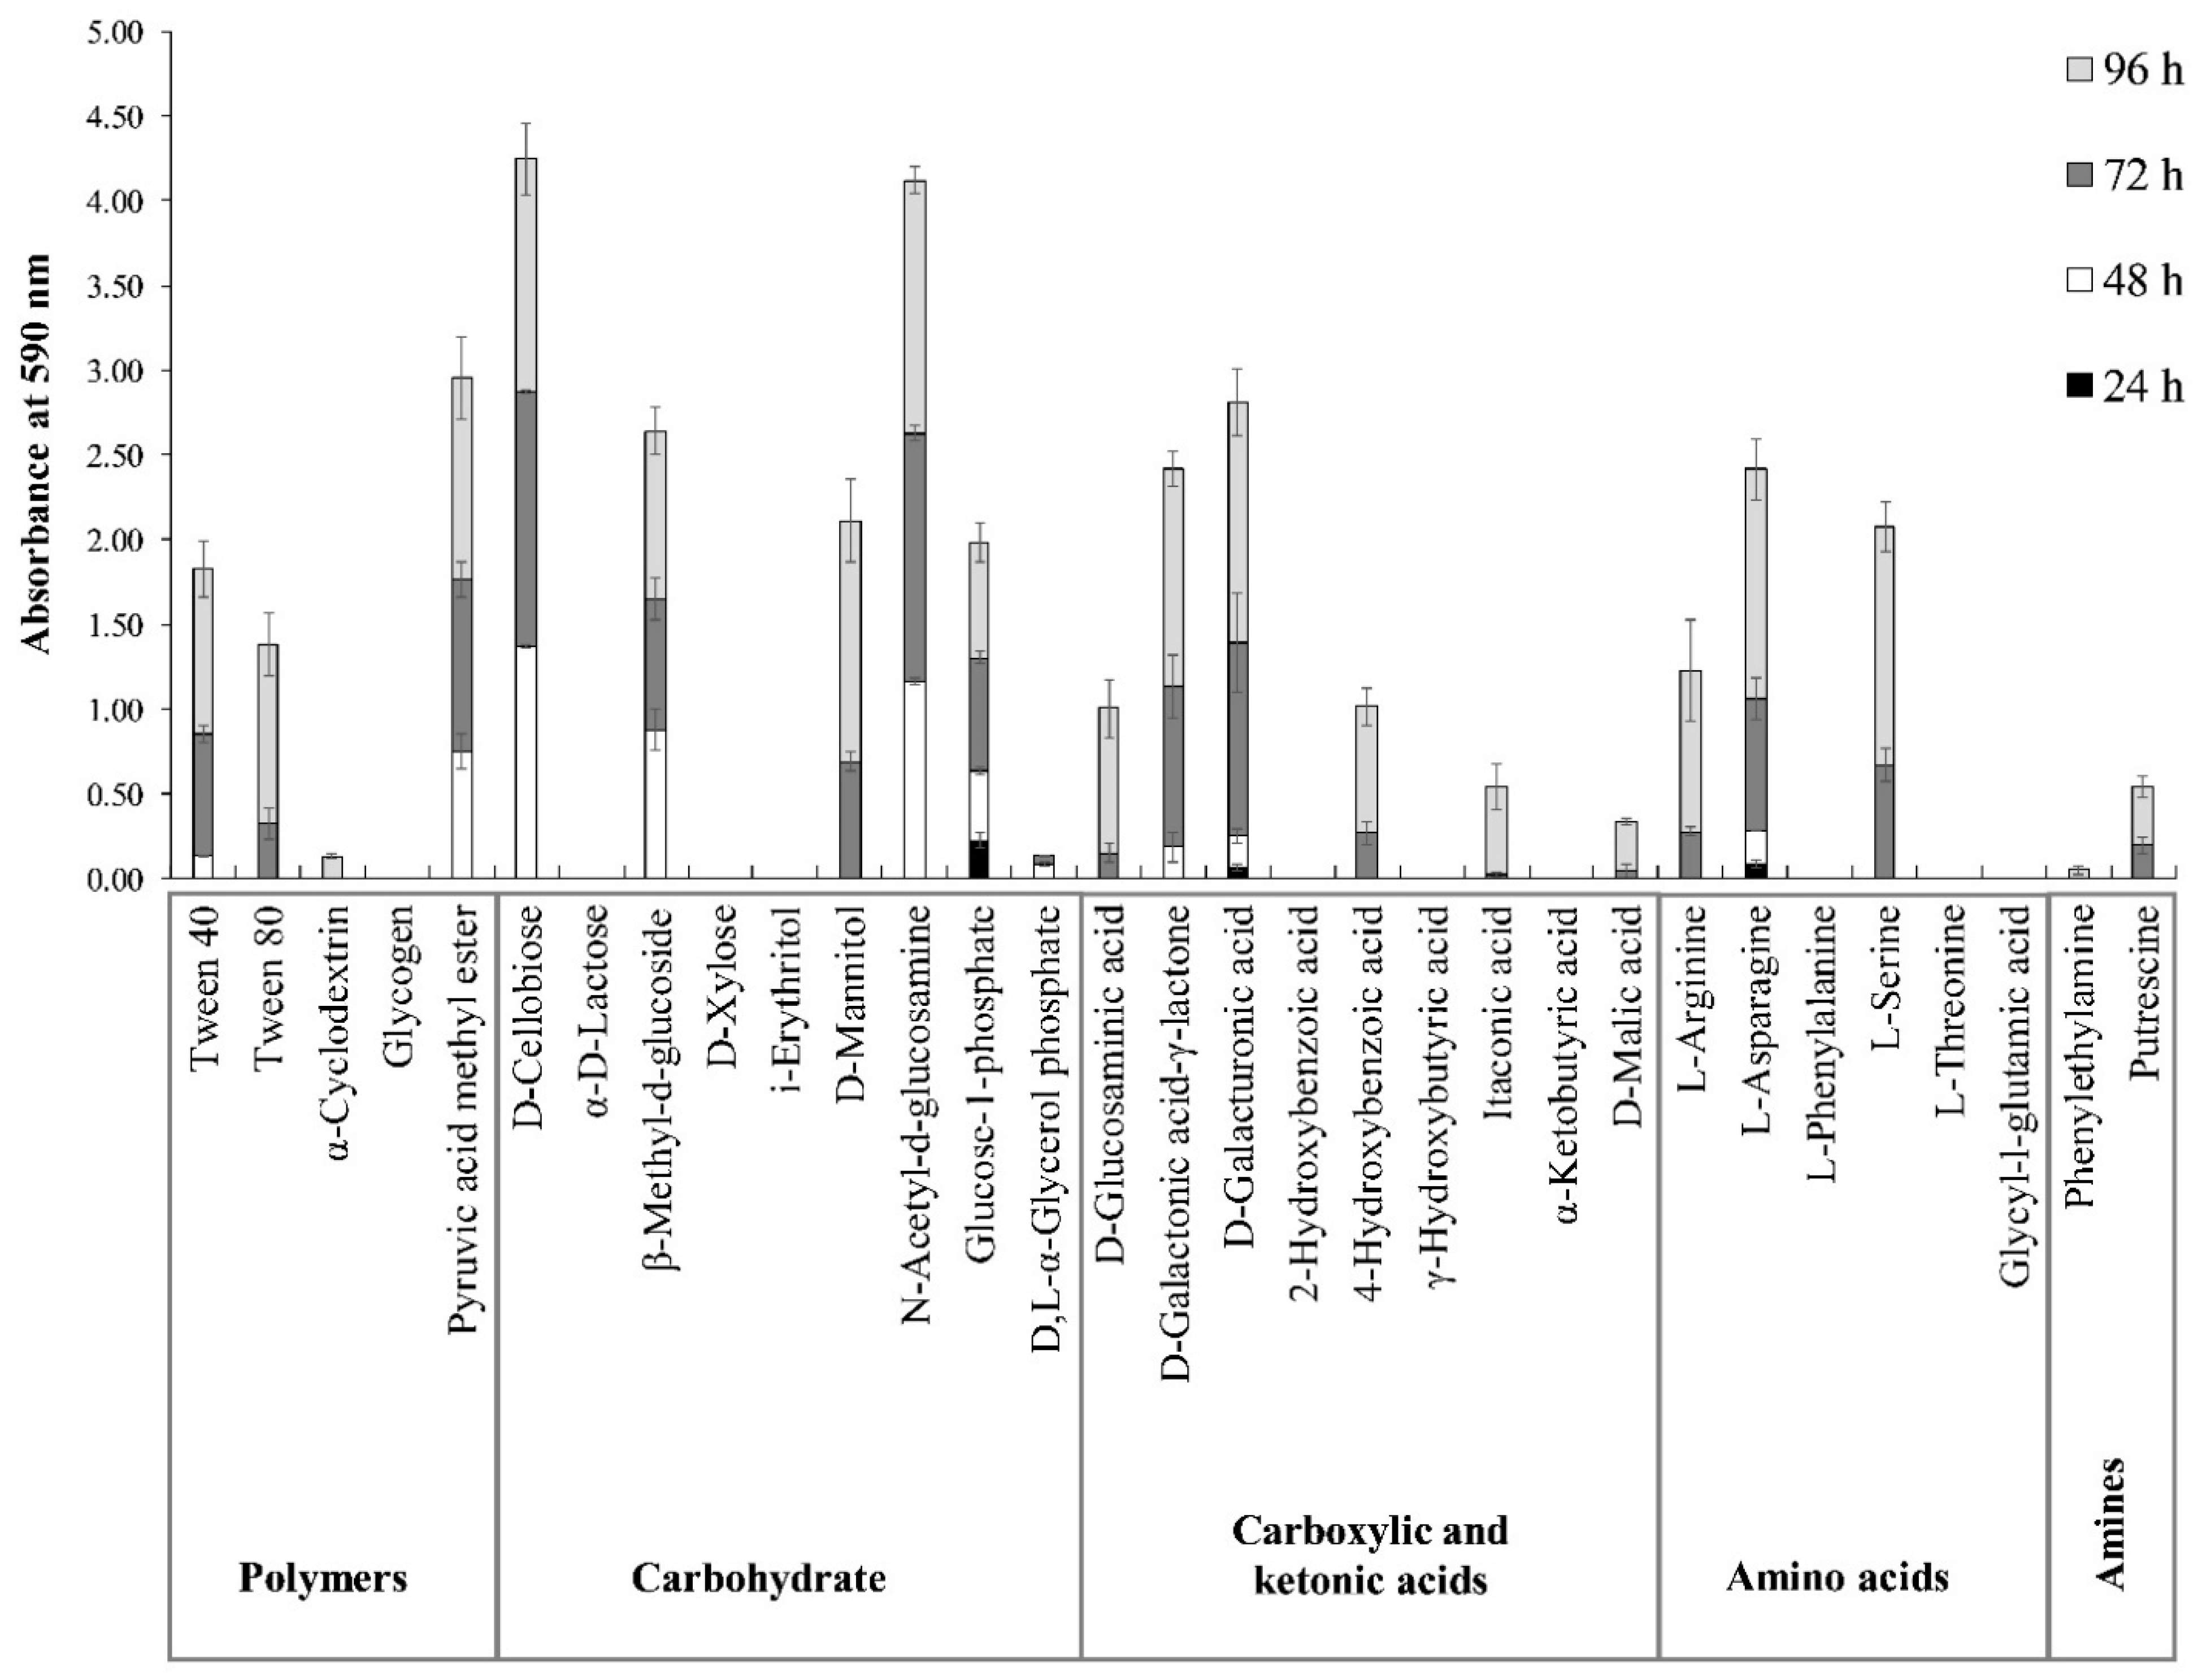
Figure 3 showed that microbial functional diversity changed over time, and that the microbial community initially prefer C-substrates from the carboxylic and amino acid groups (namely D-Galacturonic acid and L-Asparagine), in addition to Glucose-1-phosphate. During the exponential phase, an increasing number of substrates (belonging to all five groups) was utilized (Figure 3). However, the diversification over time of the microbial substrate use from the different groups (polymers, carbohydrates, carboxylic acids, amino acids, and amines) is beyond the aim of this research and will not be further discussed.
The substrate uniformity index (E) value was 0.95, highlighting a high uniformity in the activity of the different substrates (that can be related to a similar abundance of the different species), indicating from our specific point of view, a greater chance of isolating bacteria capable to perform ammonification (of amino acids) and low-molecular weight organic acid mineralization. Finally, the Shannon–Weaver index (H′) was equal to 3.20, highlighting a high diversity of the species present related to the high diversity of nutrients available for growth in the root zones, including amino acids and organic acids [61].

3.2. Isolation and Preliminary Characterization of Heterotrophic Calcifying Bacterial Strains

By using traditional cultivation techniques, a discrete cultivable heterotrophic bacterial community was isolated from the sampled rhizospheric soil (4.5 × 10⁵ CFU/g dw). The cultivable heterotrophic bacterial density was lower than expected (106–1010 CFU/g dw), possibly because sampling was done in winter. In a previous work [9], we also found that the cultivable microbial biomass is significantly related to the silt fraction, negatively related to the clay fraction, and negatively related to the Ca2+ content (Table 1). As expected, based on the weak alkaline pH value (Table 1), bacteria represented 78% of the cultivable microbial population. Fungi were the remaining component. Fourteen morphologically different heterotrophic bacteria (named from P1 to P14, where P stands for pure) were isolated from this microbial community and purified by streaking on B4 agar. Table 3 shows characterization results of the bacterial calcifying isolates.
All the bacterial isolates formed rod-shaped cells with different length, sometimes irregular or branched. The results of morphological characterization also showed the prevalence (64%) of Gram-positive bacteria; only strains P2, P7, P12, P13, and P14 were Gram-negative. This prevalence is in line with the results of previous works [6,8]. It is known from the literature that Gram-positive bacteria are the predominant bacteria in the soil: Only coryneform bacteria of the genus Arthrobacter alone account for approximately 20%–25% of the soil cultivable bacterial population [62]. However, Gram-negative bacteria tend to be more abundant in rhizospheric soil compared to the bulk soil. Gram-negative bacteria biomass increases when rapidly decomposable C compounds (such as sugars, organic, and amino acids) are available [63], whereas higher proportions of Gram-positive bacteria are usually found in resource-limited area [64,65].
Strain P8 showed growth capacity at all three tested temperatures, all other strains grew only at 20 and 28 °C. Strains P5, P6, P8, P9, P12, P13, and P14 showed growth also in anaerobiosis and are therefore considered facultative anaerobes. The use of facultative anaerobic bacteria is fundamental for soil biocementation in situ, as in the soil co-exist aerobic and anaerobic microzones [66].
All the strains were catalase positive. Apart from the strain P14 (urease negative) and P13 (not determined), all the calcifying bacteria hydrolyzed urea. This result is in accordance with the literature, since urea production, even in the presence of a significant amount of ammonium, is a common feature among soil bacteria. Urea hydrolysis producing ammonia, increases pH and leads to the production of carbonates. This means that the application of stimulated biocalcification, based on the urea hydrolysis by native or selected (in the laboratory) microbial strains, is potentially useful in a variety of soil bio-engineering applications [67].
During the characterization stage, strain P5 showed serious growth problems and was replaced by strains P12, P13, and P14, from its fourth purification step. These strains were used along this study as a mixed calcifying culture, named M5, containing in a similar proportion the strains P12, P13, and P14.

3.3. Identification of the Calcifying Bacterial Strains

By the Biolog identification system, all the Gram-positive short/pleomorphic rod isolates were identified as coryneform bacteria, and Clavibacter agropyri was the most common (Table 3 and Table 4).
Isolates P3, P4, P8, P9, and P10, identified as Clavibacter agropyri (Corynebacteria), were Gram-positive rod-shaped cells, often disposed to an angle to each other giving irregular forms (Table 3). The genus Clavibacter contains plant pathogenic coryneform bacteria, causing gummosis, characterized by the presence of 2,4-diaminobutyric acid as a cell wall component [68,69,70]. Strain P6, a facultative anaerobic Gram-positive bacterium with good urease activity, was identified as Corynebacterium urealyticum. The aerobic Gram-positive strain P11 was identified as Sanguibacter suarezii, a coryneform bacterium first isolated from blood animal samples [71]. Coryneform bacteria are widespread in nature, being common inhabitants of water and soil, where they form alone approximately 20%–25% of the soil fertile cultivable bacterial population [62]. They may be pathogens or commensals of humans, animals, and plants. This ecological diversity is matched by their wide range of biochemical properties making them an interesting group of bacteria for biotechnology purposes. Among the Gram-negative isolates, strain P2 was identified by the Biolog system as Vibrio tubiashii (% PROB = 94). The genus Vibrio, includes a great diversity of species that are common inhabitants of the aquatic environment where they are usually closely associated with many kinds of marine organisms [72]. V. tubiashii is a halophilic species, firstly isolated by Tubiash et al. [73], pathogenic for the larvae of bivalve mollusks. Its genome consists of two chromosomes, two megaplasmids and two plasmids. This might be a survival strategy acquired by the Vibrios that has facilitated their adaptation to various niches, including soil environments, in the evolution process [74,75]. Strains P12 and P14 were identified as Sphingomonas sanguinis and Pseudomonas syringae, respectively. Due to their biodegradative and biosynthetic capabilities, both of them have been used for a wide range of biotechnological applications. Strains P1, P13, and P7 were not identified (Table 4). The composition of the cultivable component of the microbial community living in the rhizospheric soil of Pinus strobus, showed the presence of a wide range of bacteria from diverse phylogenetic affiliation mainly Actinobacteria, Alphaproteobacteria, and Gammaproteobacteria. No other attempts were made to identify the isolated bacterial species as our attention was directed towards the optimization of the process stage for isolating and screening of effective calcifying bacteria.

3.4. Calcification and CaCO3 Solubilization Activities

Observation of pure solid bacterial cultures under light microscopy, showed that 100% of the bacterial isolates were capable of forming crystalline CaCO3 on B4 agar plates at 20 and 28 °C (Table 5). This result confirms that: (i) Biomineralization leading to CaCO3 deposits is a quite common phenomenon in natural habitats [1,2,3,4,5,6,7,8,9,10,11,12,13,14,15]; (ii) the rhizospheric soil is a good source for efficient isolation of calcifying bacteria as karst caves and secondary carbonate soils; iii) nutrient availability is a critical factor affecting microbial metabolism and precipitation activity [27]; (iv) the efficiency of the Biolog EcoPlate system as a tool for estimating calcification potentiality of environmental bacterial communities [60]; (v) the importance of bacterial calcification as a detoxification process (calcification by bacterial species may be an important phenotype for survival in high calcium environments as the studied soil—Table 1).
Table 5 shows the calcification parameters of the bacterial isolates: Number of days required to start precipitation of CaCO3 in B4 agar cultures at 4, 20, and 28 °C, position on B4 agarized medium of the deposited crystals, amount and size of the crystals visually established by the microscope, presence of bioliths aggregates and mineralization ability in liquid B4 medium.
At 28 °C, CaCO3 formation took place rapidly and all the calcifying bacteria began to precipitate within two weeks (Table 5): High temperatures resulted in faster bacterial growth and thus, higher acetate consumption. Vice versa, at lower temperatures bacterial metabolism slows down and resulted, for instance, in slow rates of pH change and acetate consumption. In fact, when bacteria were cultivated at 20 °C, the time required for crystal precipitation was longer and all the calcifying isolates began to precipitate within four weeks (Table 5). Apart from strain P8, which precipitated after three weeks, bacterial growth and crystal deposition was not observed at 4 °C.
The microscopic observation showed that at 28 °C, CaCO3 precipitation always takes place inside the bacterial colony and often in the immediate vicinity and/or in the culture medium, that is in a microenvironment conditioned by the direct presence of the cells. This means that for the deposition of CaCO3 the presence of crystallization nuclei is not sufficient, but the role of microbial metabolism is necessary. No crystal formation was observed in uninoculated control plates. This confirms that CaCO3 deposition was to be attributed to the bacterial cells.
Table 5 shows that, apart from strain P2 that deposited prismatic and oval crystals, all others strains deposited spherical crystals, as the only prevalent typology. About the size, 66.6% of the calcifying cultures deposited large-sized crystals (P1, P3, P4, P6, P7, P8, P9, and P10). Strains P2, P5, P11, and the mixed culture M5, precipitated crystals of smaller dimensions (Table 5). Regarding the amount of precipitated crystals, the most active cultures in calcification, were strains P1, P2, P3, P4, P6, P9, and P11 (Table 5). The remaining strains (P7, P8, and P10) showed quantitative characteristics of intermediate precipitation.
Strains with the larger amount of precipitates were also those that gave rise to more CaCO3 aggregates (Table 5). Based on microscopic observation of the calcifying solid cultures, the mixed culture M5 produced larger crystal aggregates than the pure cultures of its constituent strains P12, P13, and P14. Actually, bacteria always live in bio-diversified community, metabolically interacting, thus extending their survival through co-metabolism. This is one of the reasons why it is sometimes preferable to use mixed calcifying cultures.
Strain P6, identified as Corynebacterium urealyticum, precipitates the largest amount of crystals in B4 liquid medium (Table 5). Strains P3 and P8, identified as Clavibacter agropyri, showed a good precipitation ability in liquid B4 medium. P1, P2, P10, and P11 showed very poor ability to precipitate in B4 medium; while P4, P7, P9, and the mixed culture M5 showed no precipitation activity in liquid medium (Table 5).
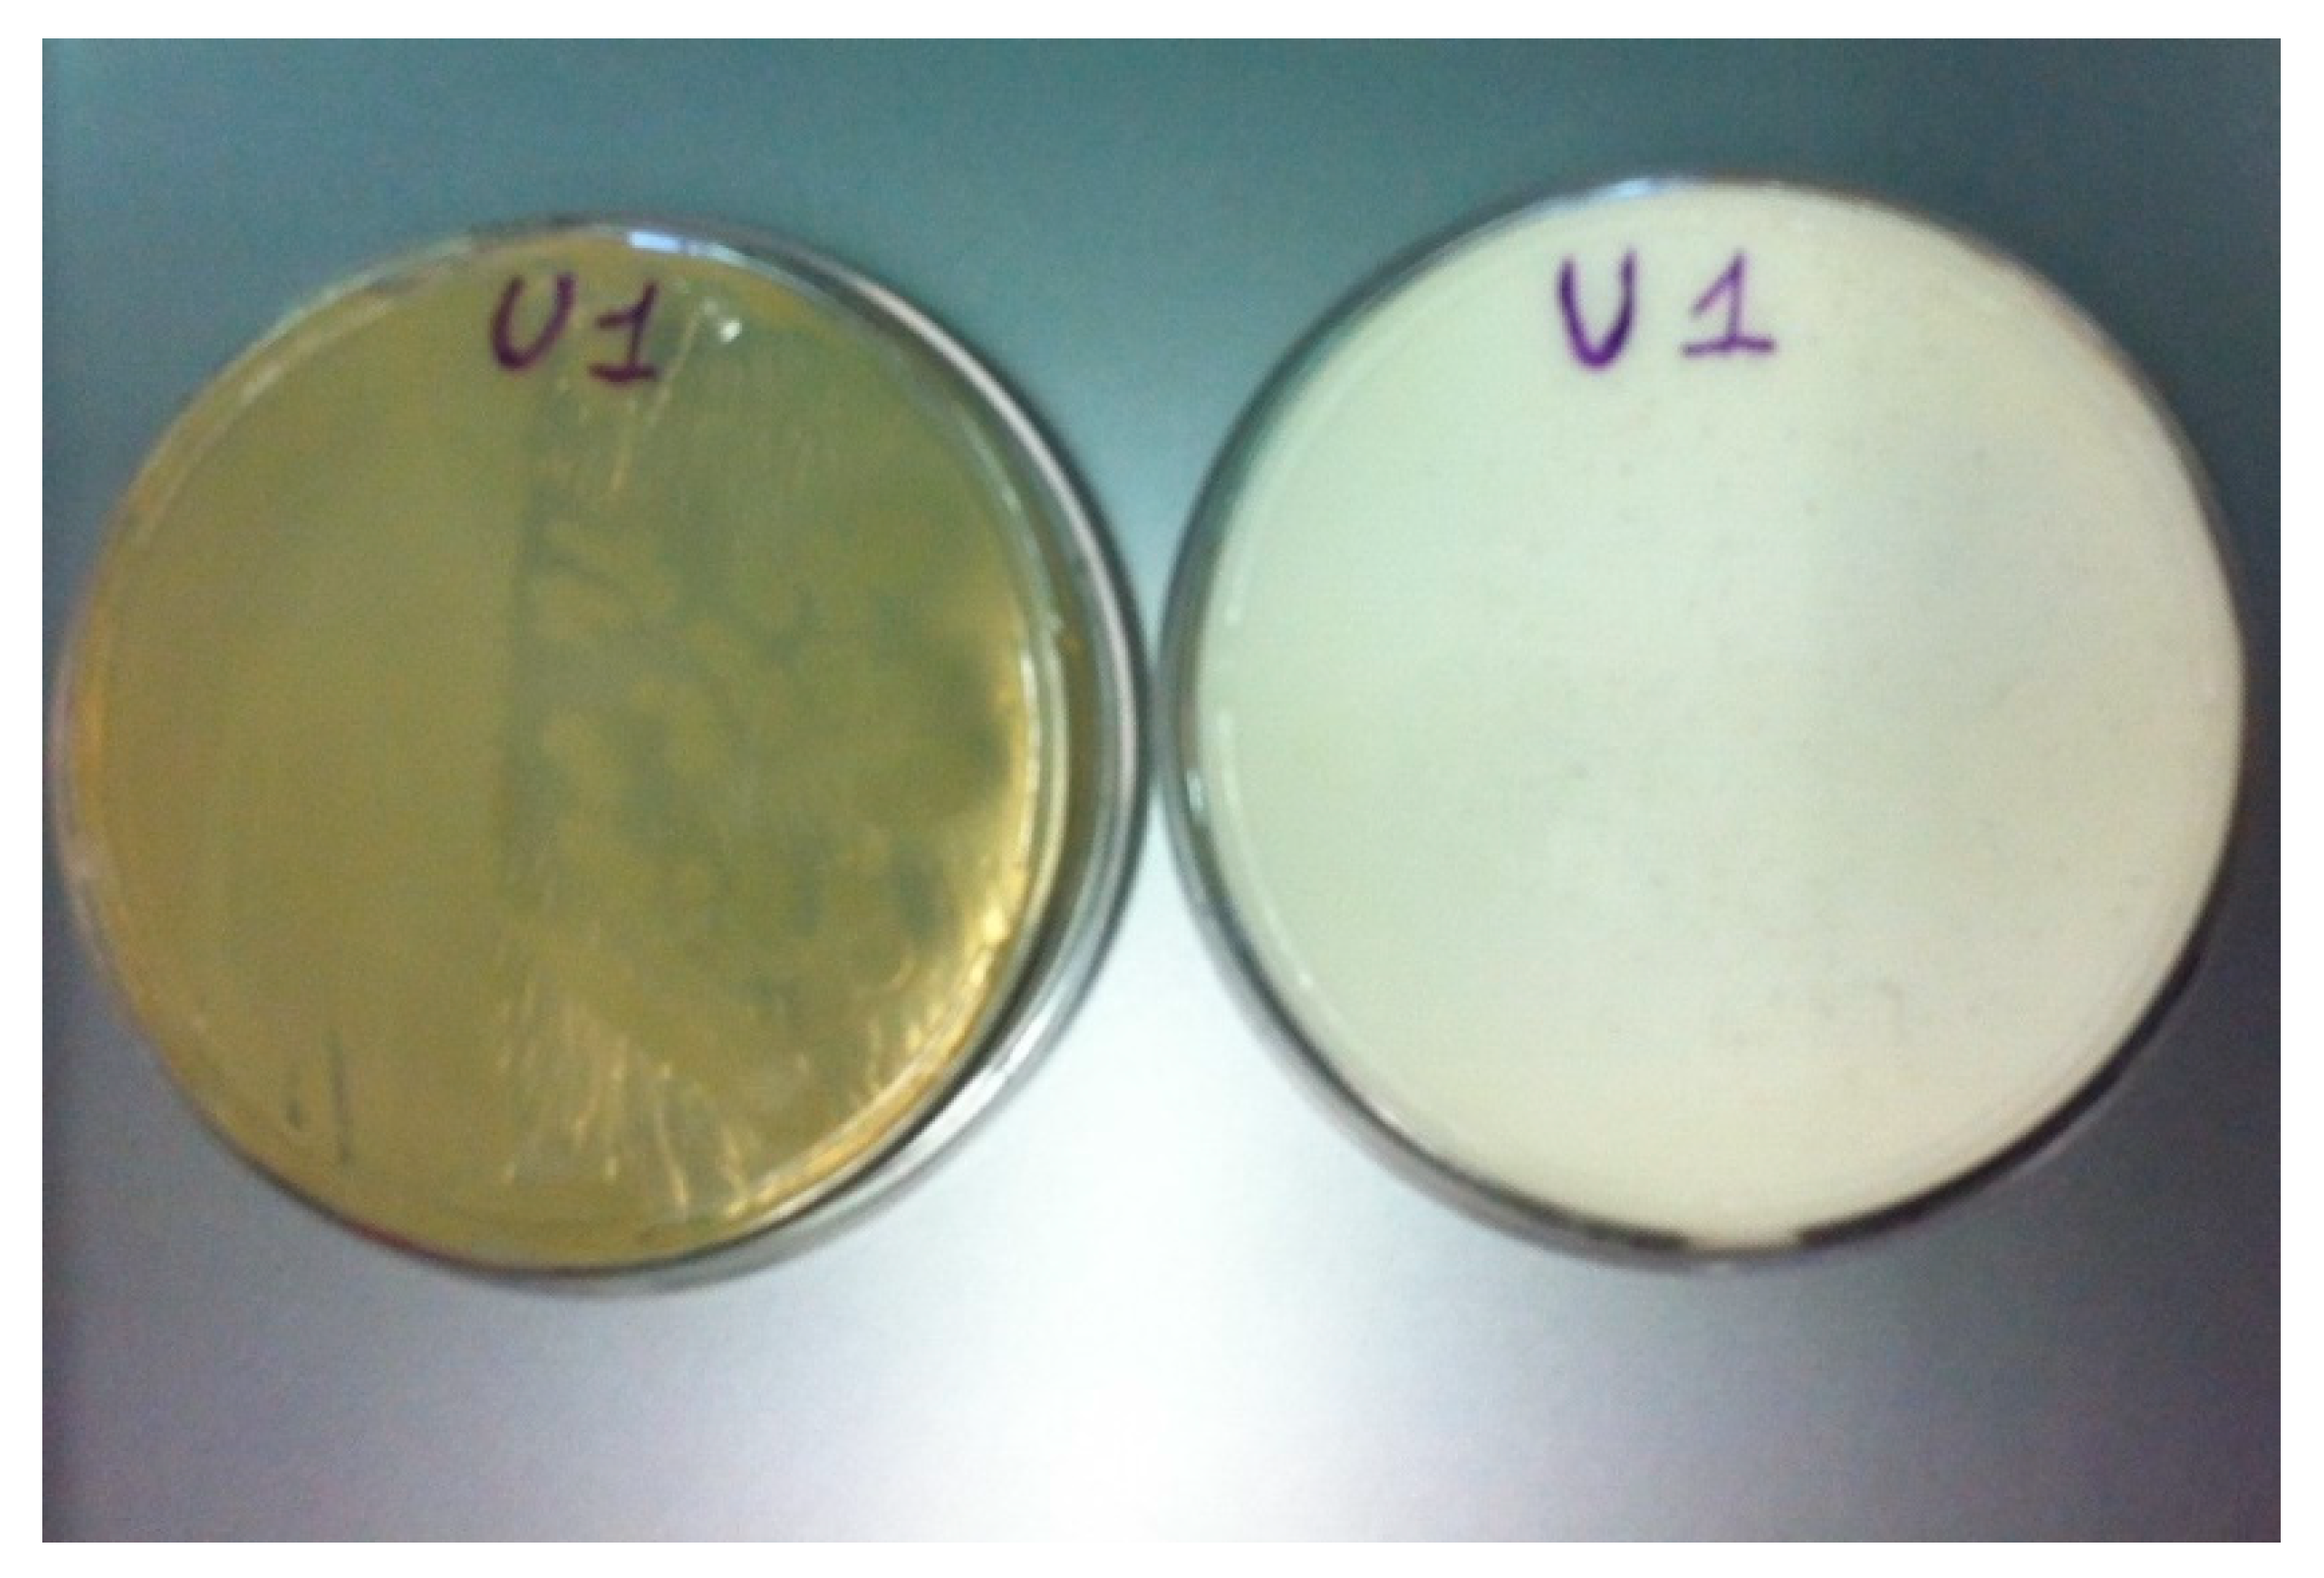
All the calcifying cultures showed carbonate-solubilization ability when grown on 0.14% CaCO3, after four weeks of incubation at 28 °C (Table 6). Vibrio tubiashii (P2), Clavibacter agropyri (P3, P10), the not identified strains P1 (Figure 3), and P7 being particularly effective.
Apart from strain P9, identified as Clavibacter agropyri, which do not dissolve detectable amounts of carbonate, all the calcifying strains showed poor CaCO3 solubilization ability, when grown on 2.5% CaCO3 (Table 6). Three calcifying cultures (P1, P2, and M5) showed spotted solubilization (Table 6 and Figure 4). The mixed calcifying culture M5 showed solubilization activity in a lesser extent than expected.

3.5. Bacterial Calcification Activity by the Imagej Software

It is possible to evaluate the CaCO3 precipitation efficiency of a calcifying strain taking into account different calcification parameters such as: (i) Time required to initiate precipitation, (ii) abundance of the precipitated crystals (which is related to the precipitation rate of the calcifying strain), (iii) crystal size, (iv) presence of crystal aggregates, and (v) CaCO3 solubilization activity. The use of the ImageJ software allowed us to obtain a very effective BCP index, referred in this paper as “extent” (i.e., calcification level as percent average surface occupied by CaCO3 crystals biodeposited on an agarized medium). The BCP extent, depending on all the calcification parameters mentioned above, allows to test in a single step the calcification aptitude of each bacterial strain, optimizing the screening program.
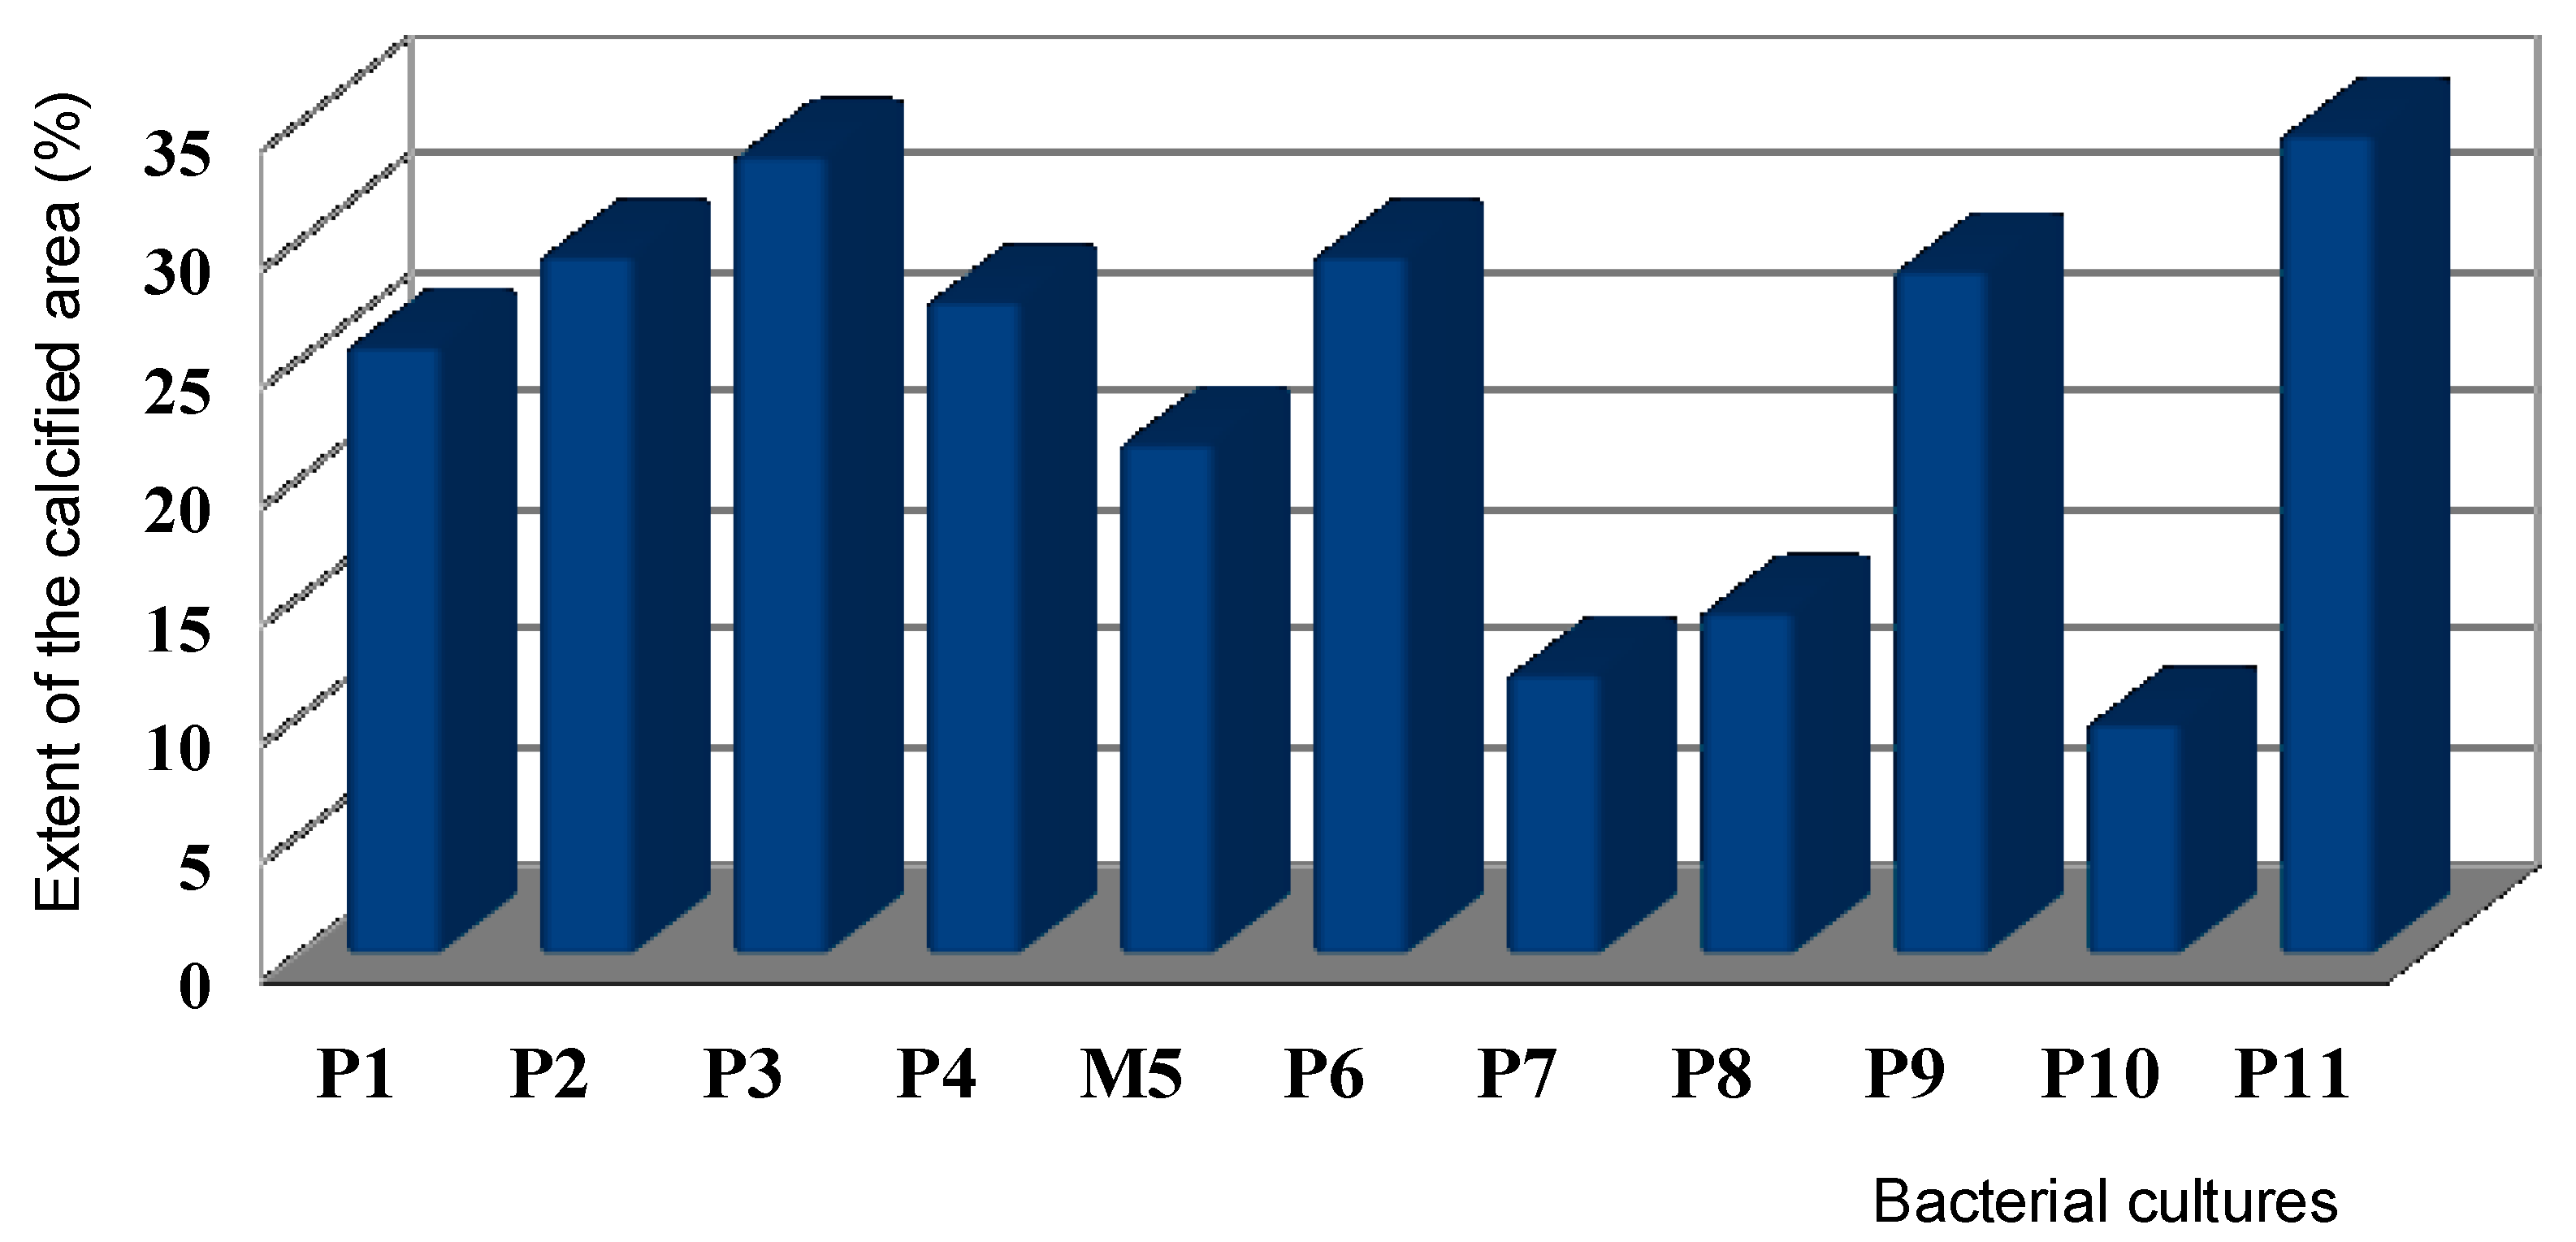
Figure 5 shows the percent average surface occupied by CaCO3 crystals precipitated by the calcifying bacterial cultures, after 30 days of growth on B4 agar, at 28 °C.
Two groups of calcifying strains were identified on the basis of their calcification ability in terms of extent (%) of the biocemented area: A group of very highly active BCP bacteria, with percent average surface occupied by CaCO3 crystals greater than 25% and group of less active bacteria with CaCO3 percent average surface less than 25%. The calcifying strains belonging to the first group were strains P2 (Vibrio tubiashii), P3, P4, and P9 (all three Clavibacter agropyri), P6 (Corynebacterium urealyticum), and P11 (Sanguibacter suarezii). All these bacterial strains produced in vitro CaCO3 crystals abundant and medium/large sized, apart from strain P6 that formed smaller crystals (Table 5). They also showed a good aptitude to form large aggregates and vice versa a poor or absent CaCO3 solubilization activity (Table 5 and Table 6).

3.6. Calcifying Strain Selection for Sand Biocementation

Calcifying cultures for sand biocalcification experiments on Petri dish, were selected base on their morpho-physiological traits (Table 3) and calcification parameters (Table 5 and Table 6, and Figure 5), as stated in Materials and Methods.
Among bacterial strains with BCP extent greater than 25% (Figure 5), we selected: (i) Strain P2, identified as Vibrio tubiashii, being the only one to have a not branched or irregular shape of the cell (Table 3). Short rods are certainly to be preferred compared to medium, long, or branched rods because of their greater possibility of penetration into the ground; (ii) strain P9, Clavibacter agropyri, for both the ability to growth in the absence of oxygen (Table 3) and its no solubilization activity of CaCO3 at 2.5% (Table 6). Facultative anaerobes are preferred because of their tolerance for the restricted availability of oxygen that can be encountered in subsurface environments; this ability is fundamental because aerobic and anaerobic microzones coexist in the soil, since anaerobic conditions are abundant, particularly when the rain saturates the soil and gas exchange slows down almost completely [66]; and (iii) strain P11, identified as Sanguibacter suarezii, Gram-positive. Gram-positive bacteria are preferable to Gram-negative ones for their thicker wall, which makes them more resistant to changes in osmotic pressure, which is a typical condition for soil under consolidation or in recovery phase [66]. The mixed calcifying culture M5, belonging to the second group (Figure 5), was also included in the biocementation experiments.
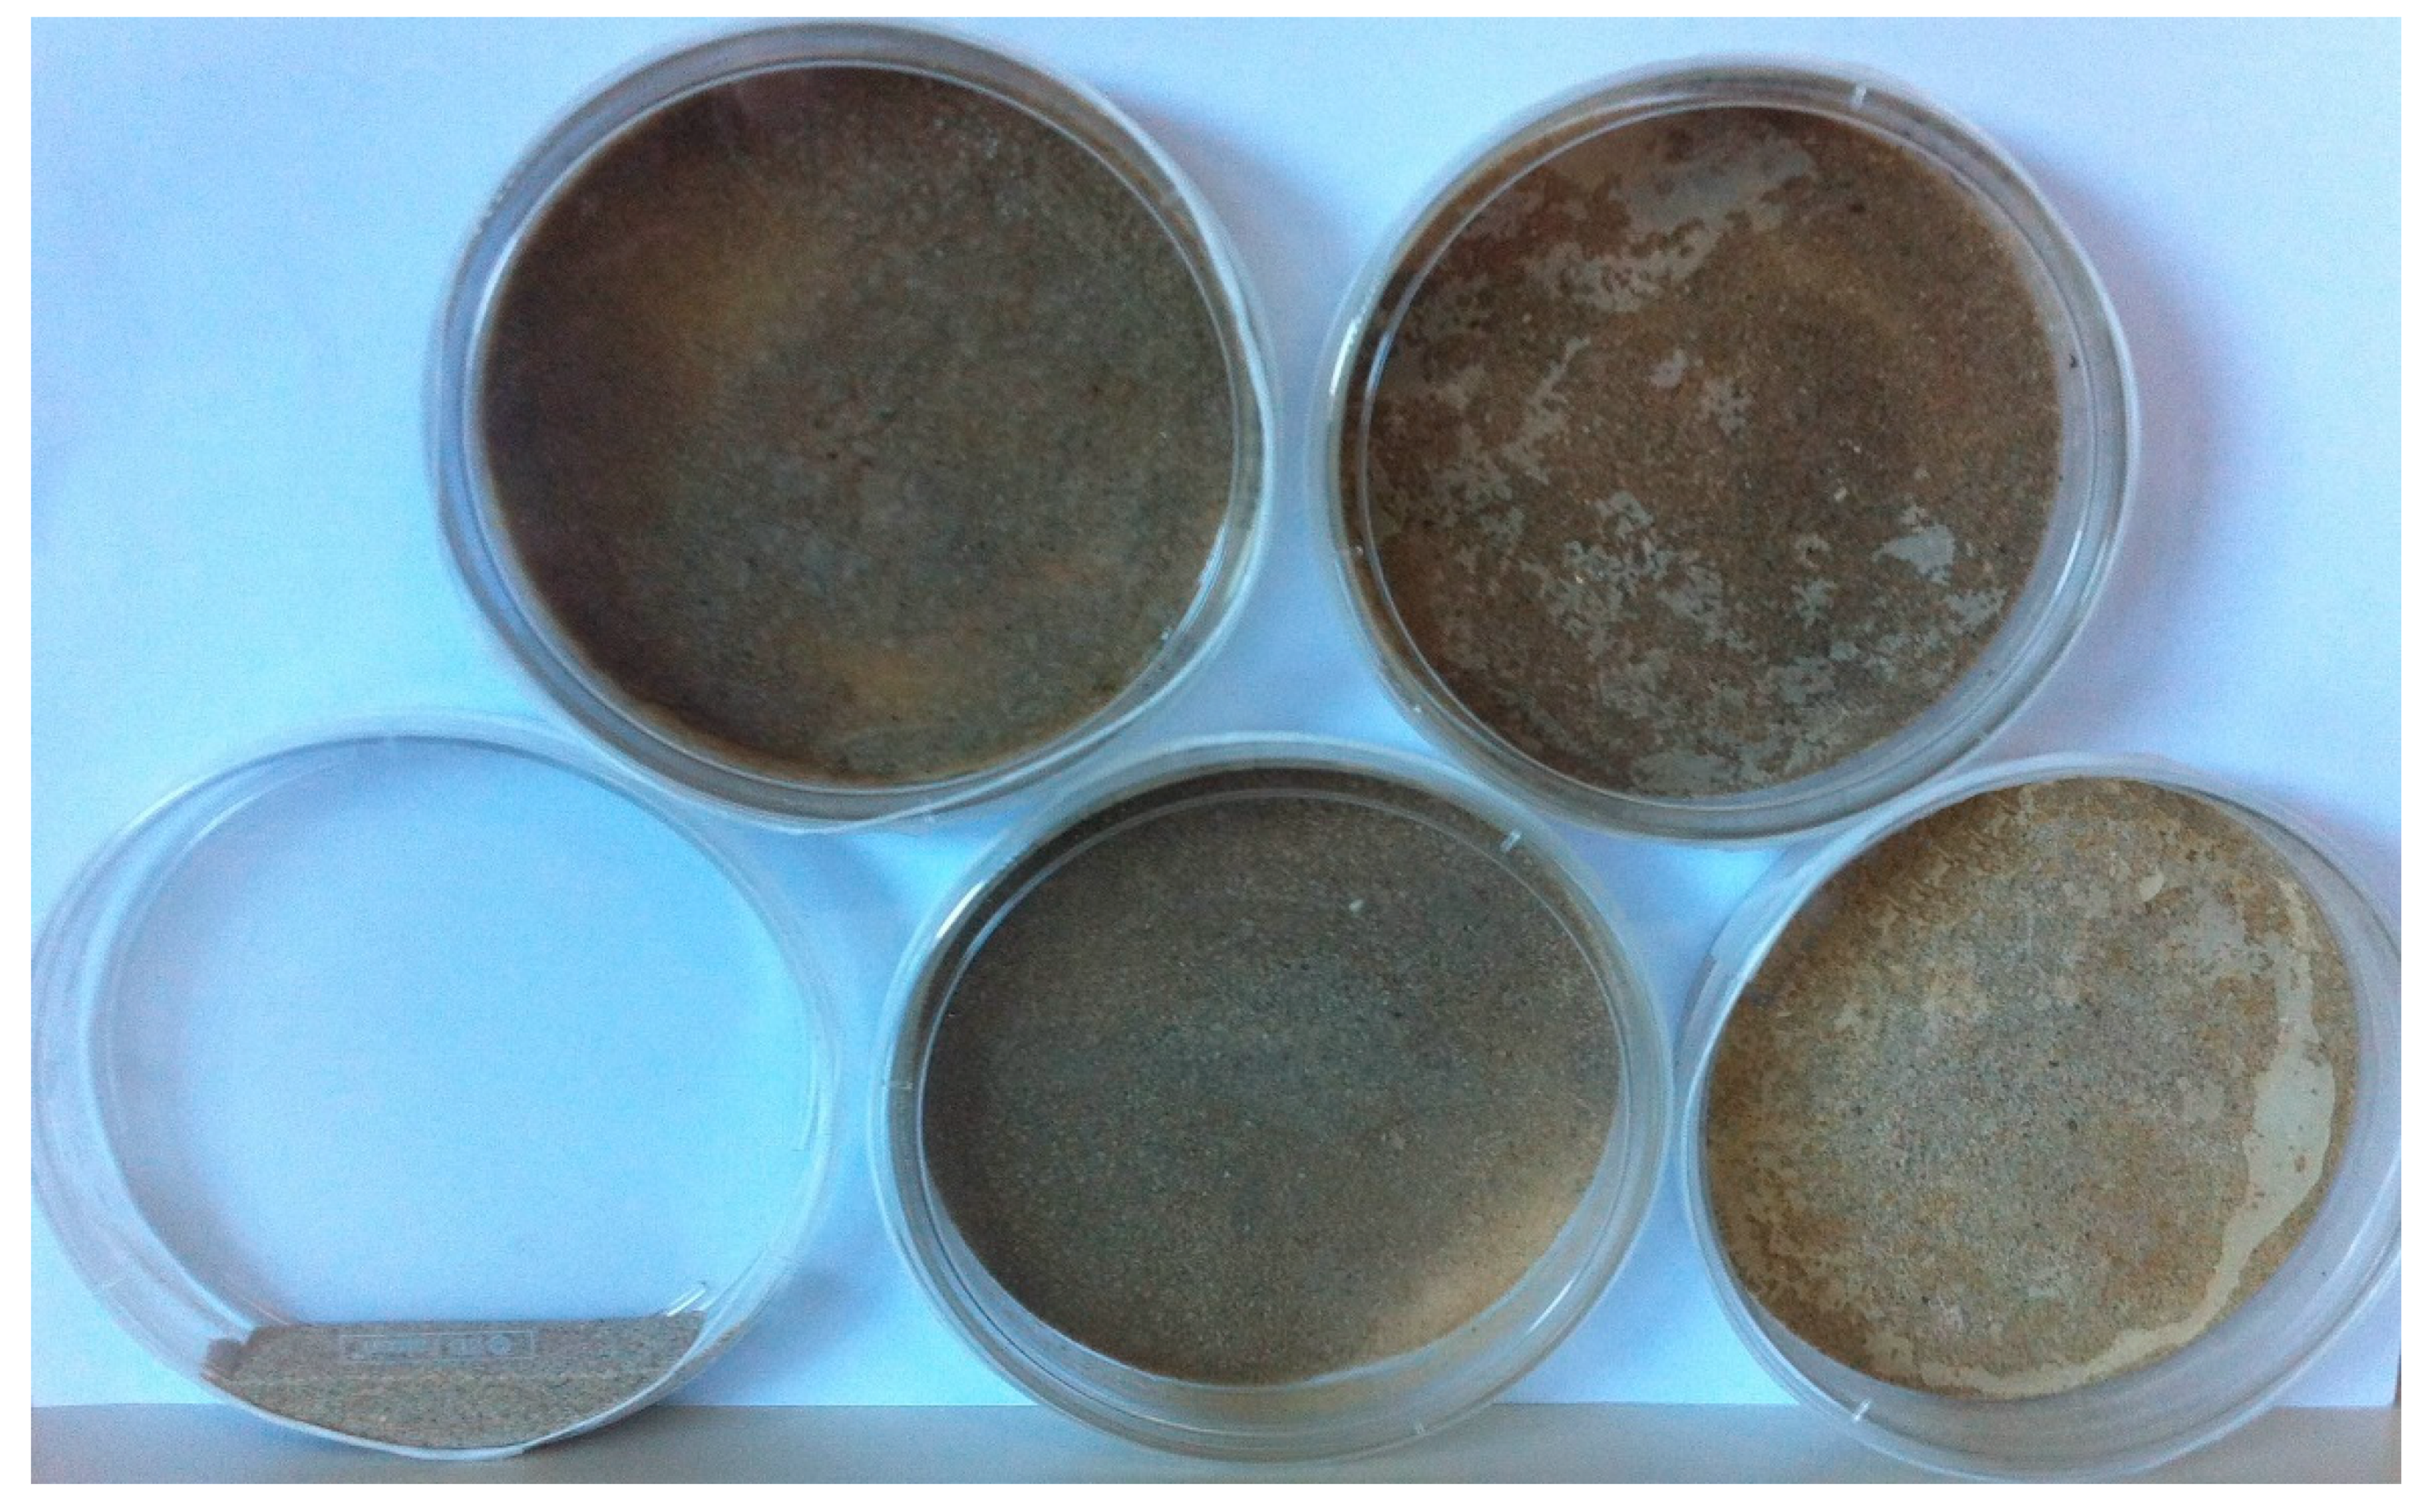
After 20 days of biotreatment (at 28 °C, under static conditions) there was complete cementation of all the pre-treated sand samples (Figure 6).
No signs of calcification were observed on the sand sample not biotreated (Figure 6). This showed that the cementing action of the sand particles was to be attributed to the bacterial cells.
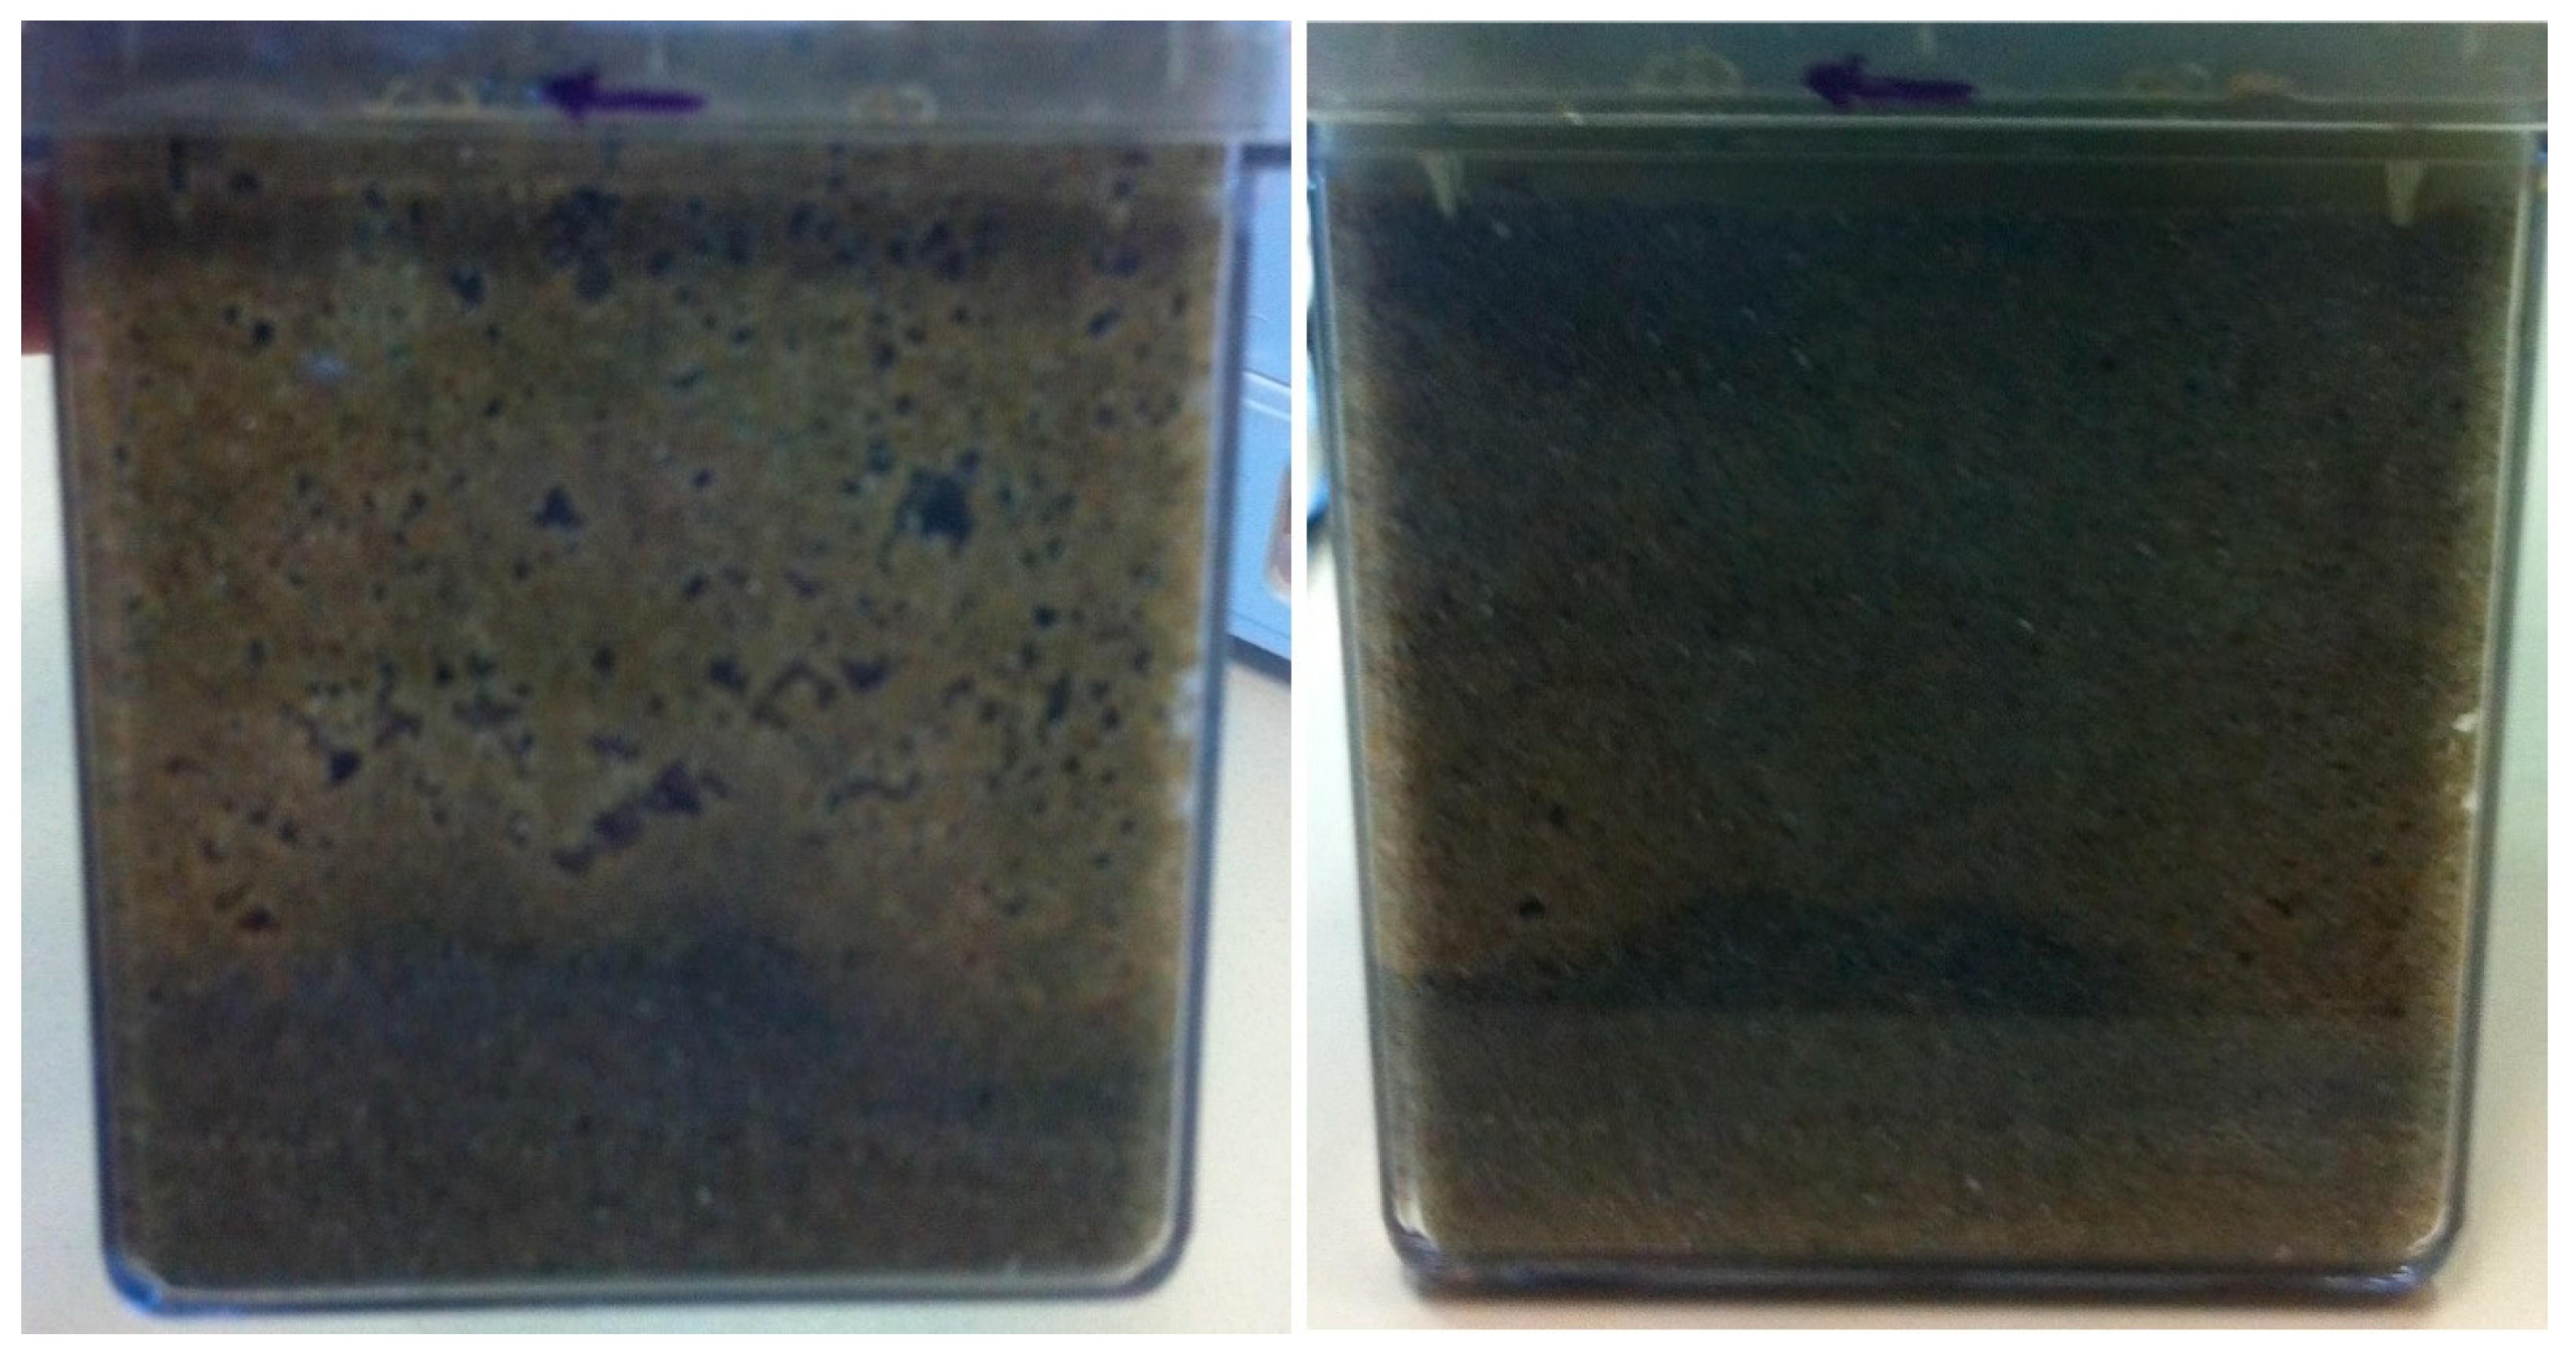
Strain P6 (Corynebacterium urealyticum), belonging to the first group of calcifying strains (Figure 5), was selected for deep sand biocementation base on its capability to precipitate CaCO3 crystals in liquid B4 medium, to hydrolyze urea, and to grow in anaerobiosis (Table 5). The results obtained after one week (on the left) and two months (on the right) of treatment are shown in Figure 7.
After the biotreatment, the sand samples did not reach a cementation level sufficient to be subjected to the shear strength test, even in the presence of urea, calcium chloride, and low clay fraction [38,39]. Optimization of the deep biocementation experiments, fallowing outside the objectives of this work, has not been carried out.

3.7. SEM, XRD, and EDS Analyses

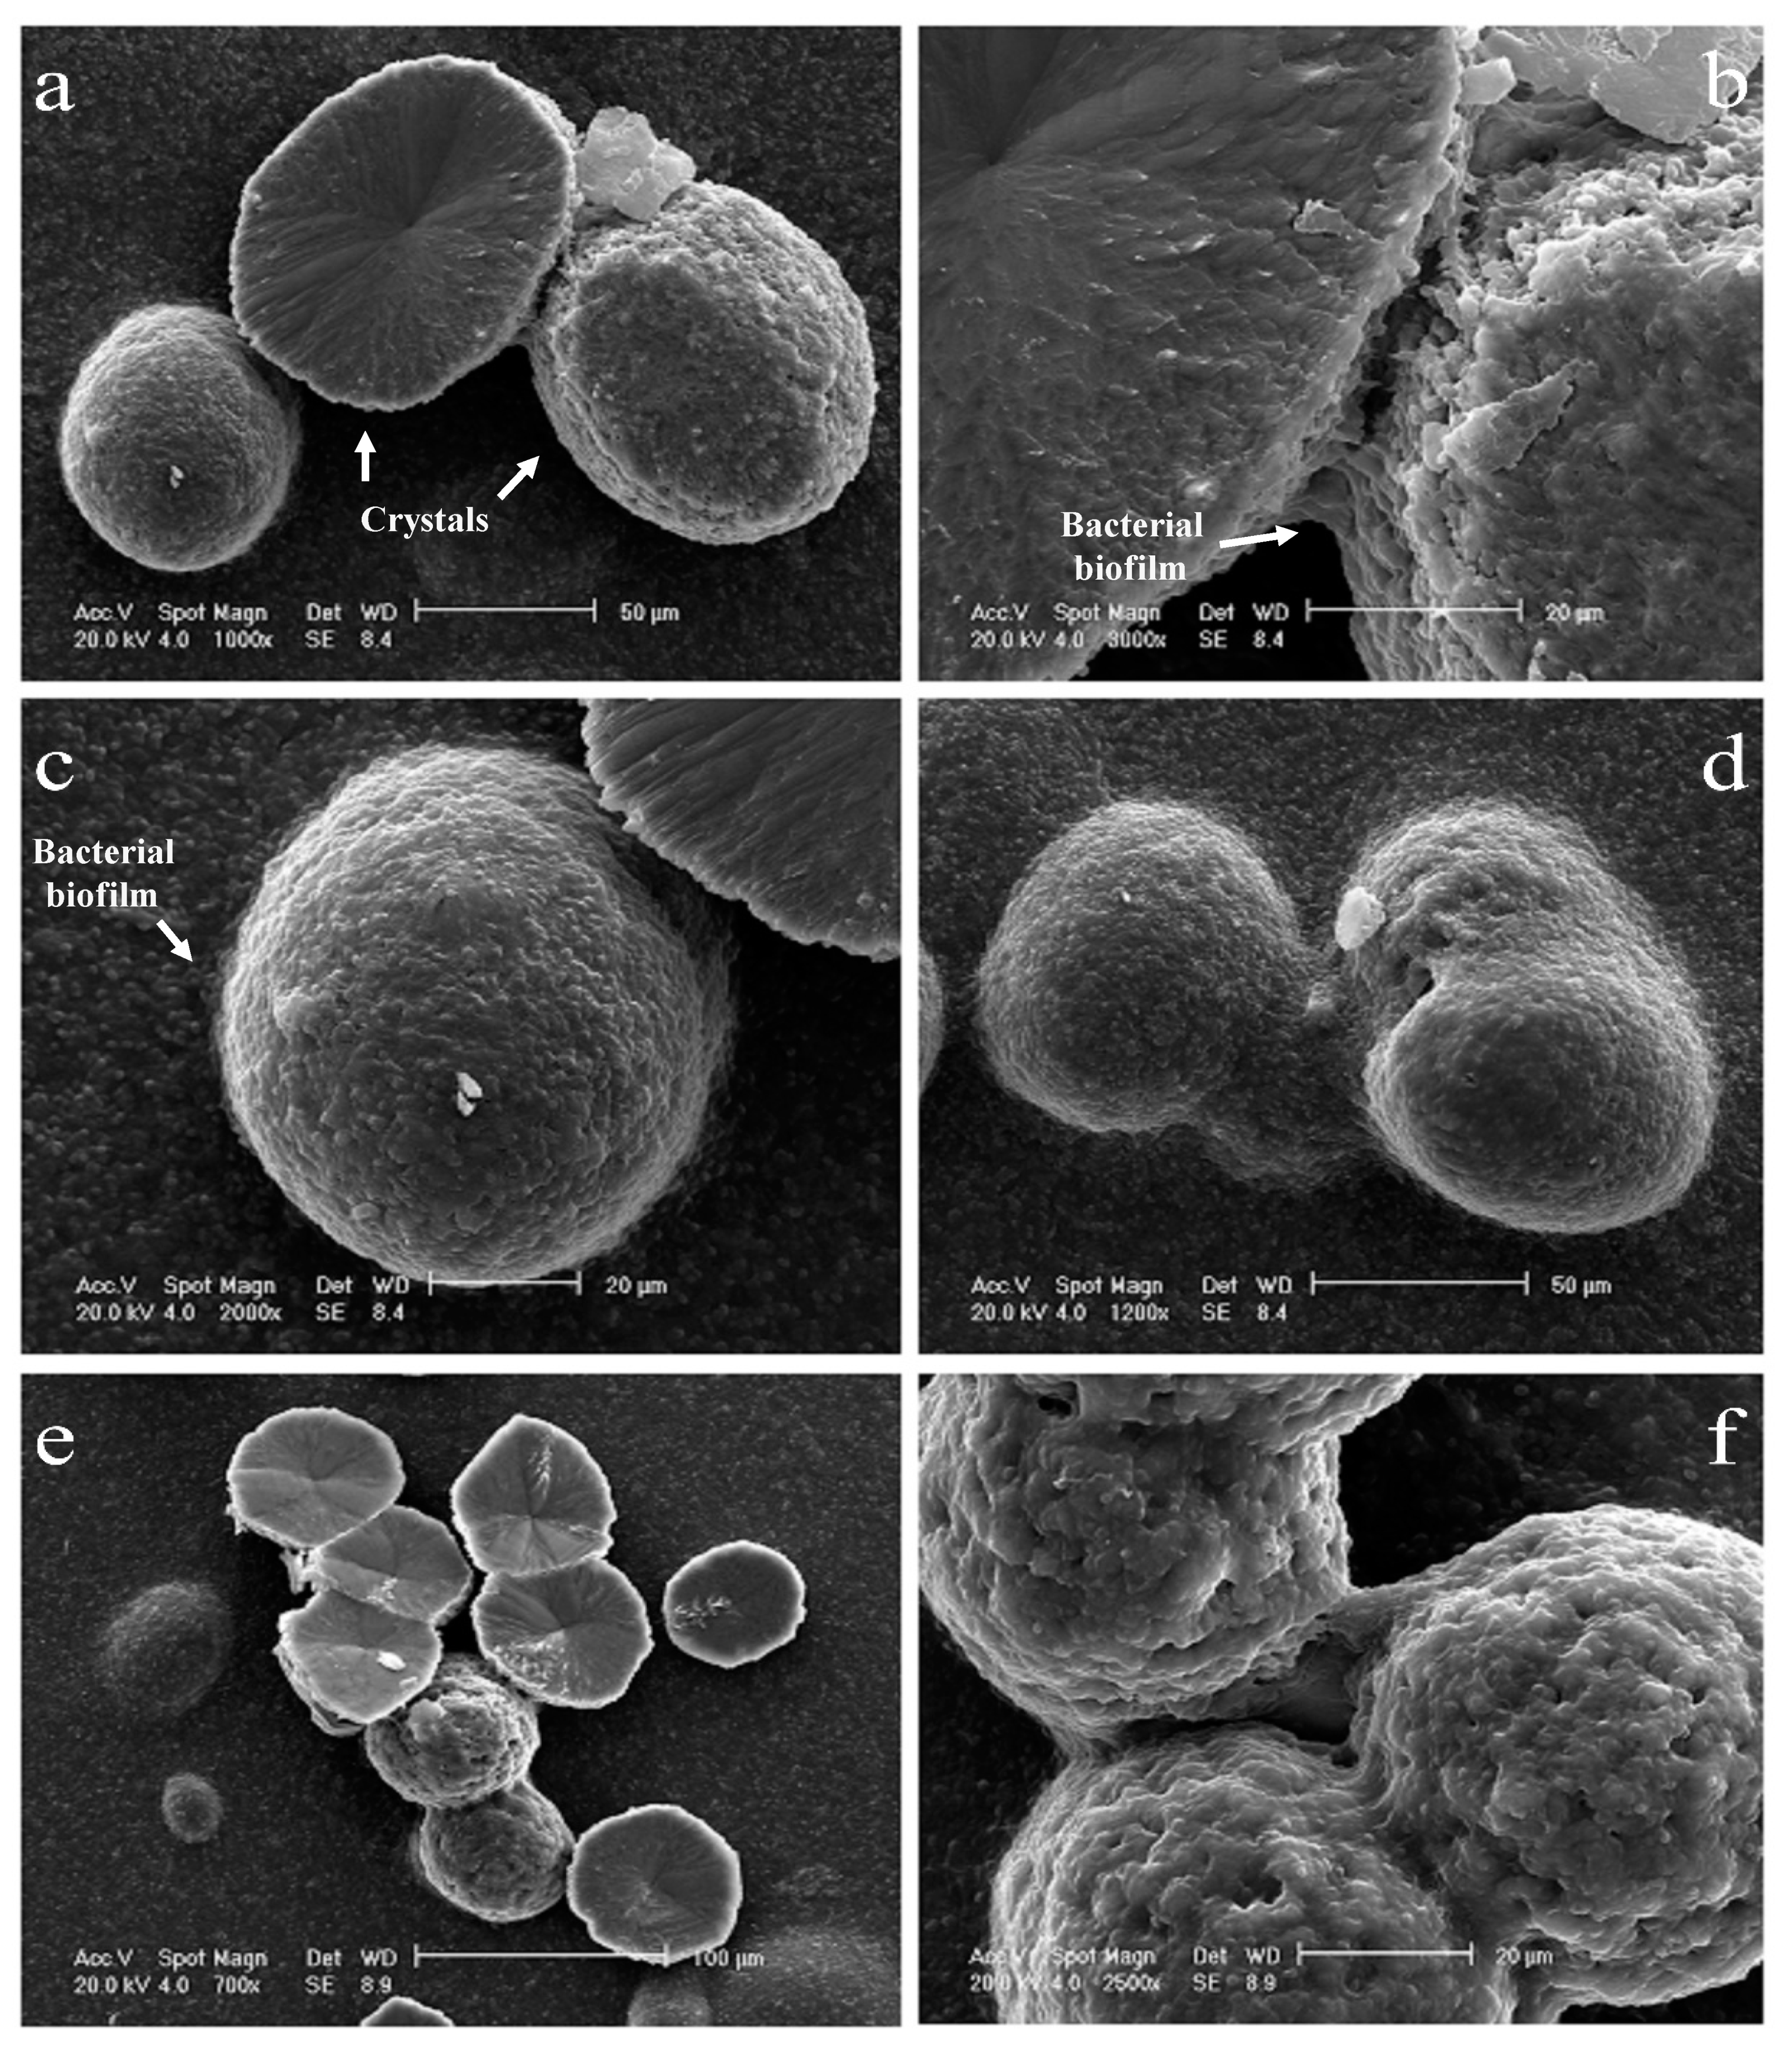
SEM observations were carried out to study the morphological characteristics of the biominerals precipitated and the involvement of bacteria in calcite biomineralization. A variety of crystal shapes were observed. The most frequent were single irregular spheres (Figure 8a,c–f), hemispheres (Figure 8a,e), and their irregular aggregates (Figure 8e, in particular). Most of the formed crystals had rough surfaces. SEM investigation also revealed the presence of bacterial cells in close contact with CaCO3 crystals (Figure 8a,c,d, and f, in particular). The presence of CaCO3 associated with bacteria proves that bacteria served as nucleation sites during the mineralization process.
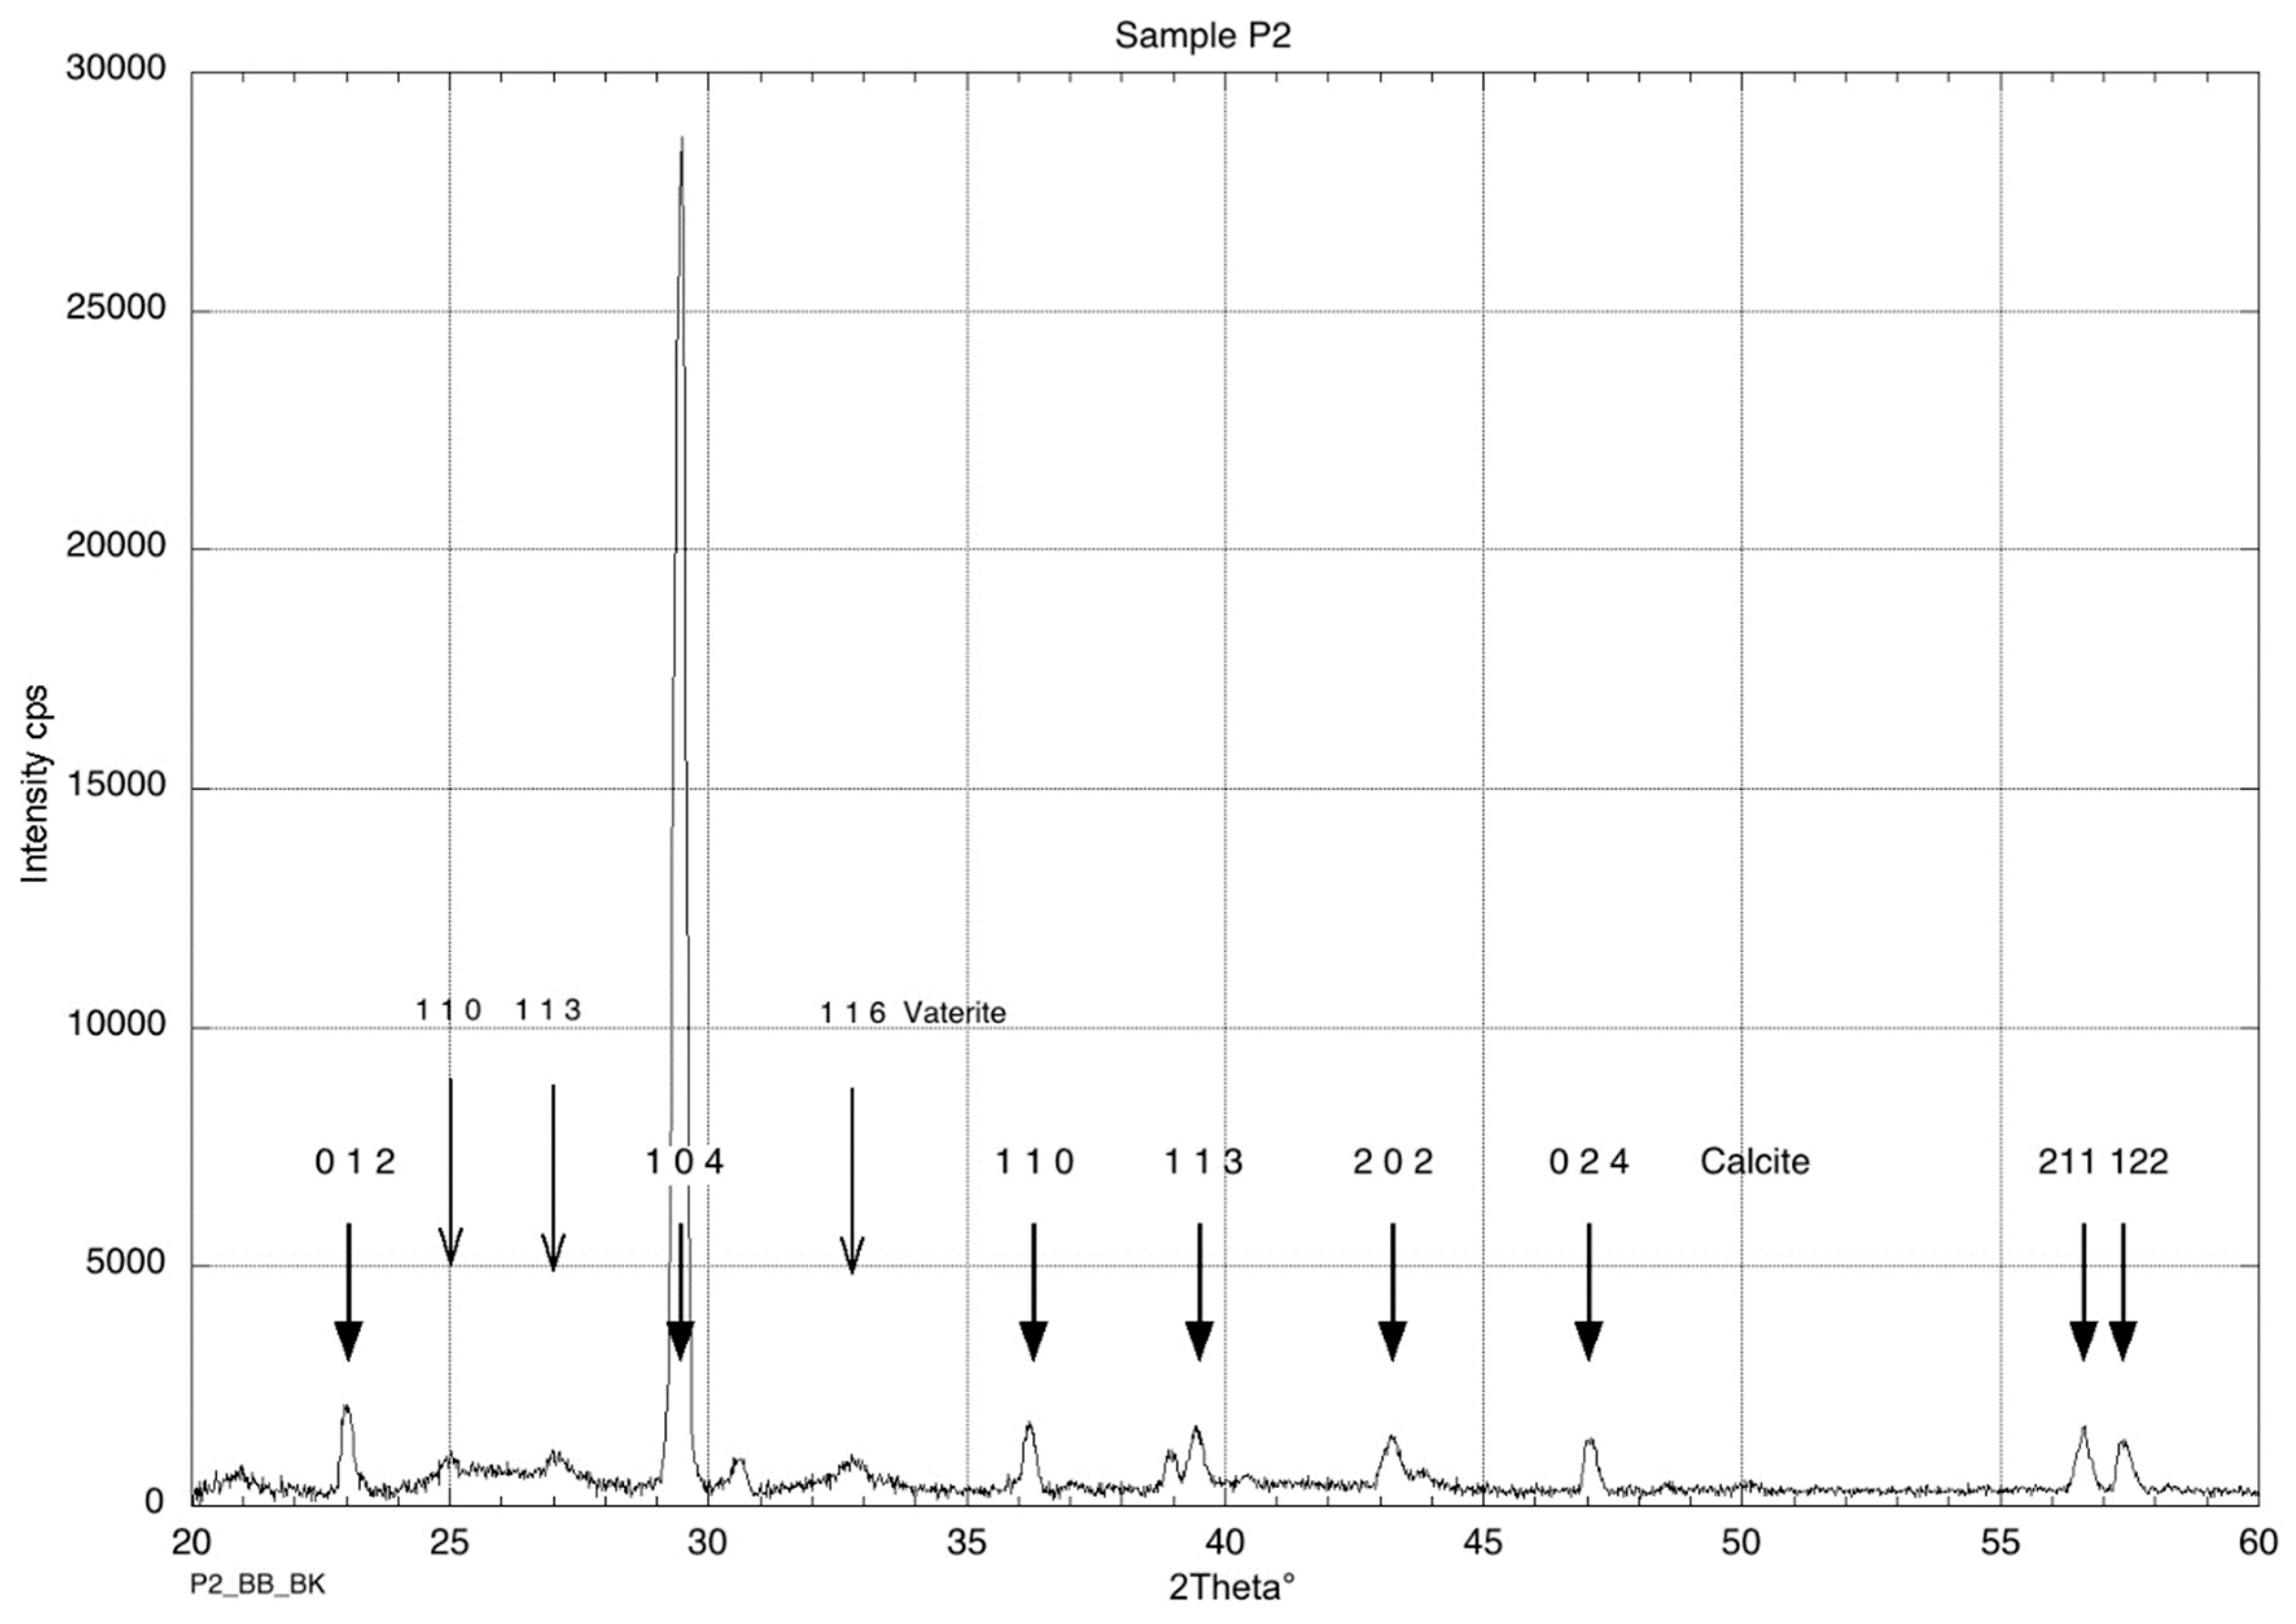
X-ray diffraction was carried out to identify the types of carbonate polymorph that were precipitated by the pure cultures selected for sand biocementation (P2 in Figure 9, P6, P9, and P11). In all the investigated cases, crystals precipitated by bacteria were both calcite, the rhombohedral form of CaCO3 [R-3c] (card number 5–586), and vaterite, a hexagonal form of CaCO3 [P63/mmc] (card number 24–30).
Vaterite is the CaCO3 polymorph with a high solubility that may be prone to dissolution by meteoric water and to a low degree of consolidation, by comparison to calcite. However, it was suggested that the microbially induced vaterite achieves similar degrees of stability as calcite by incorporating organic molecules [76].
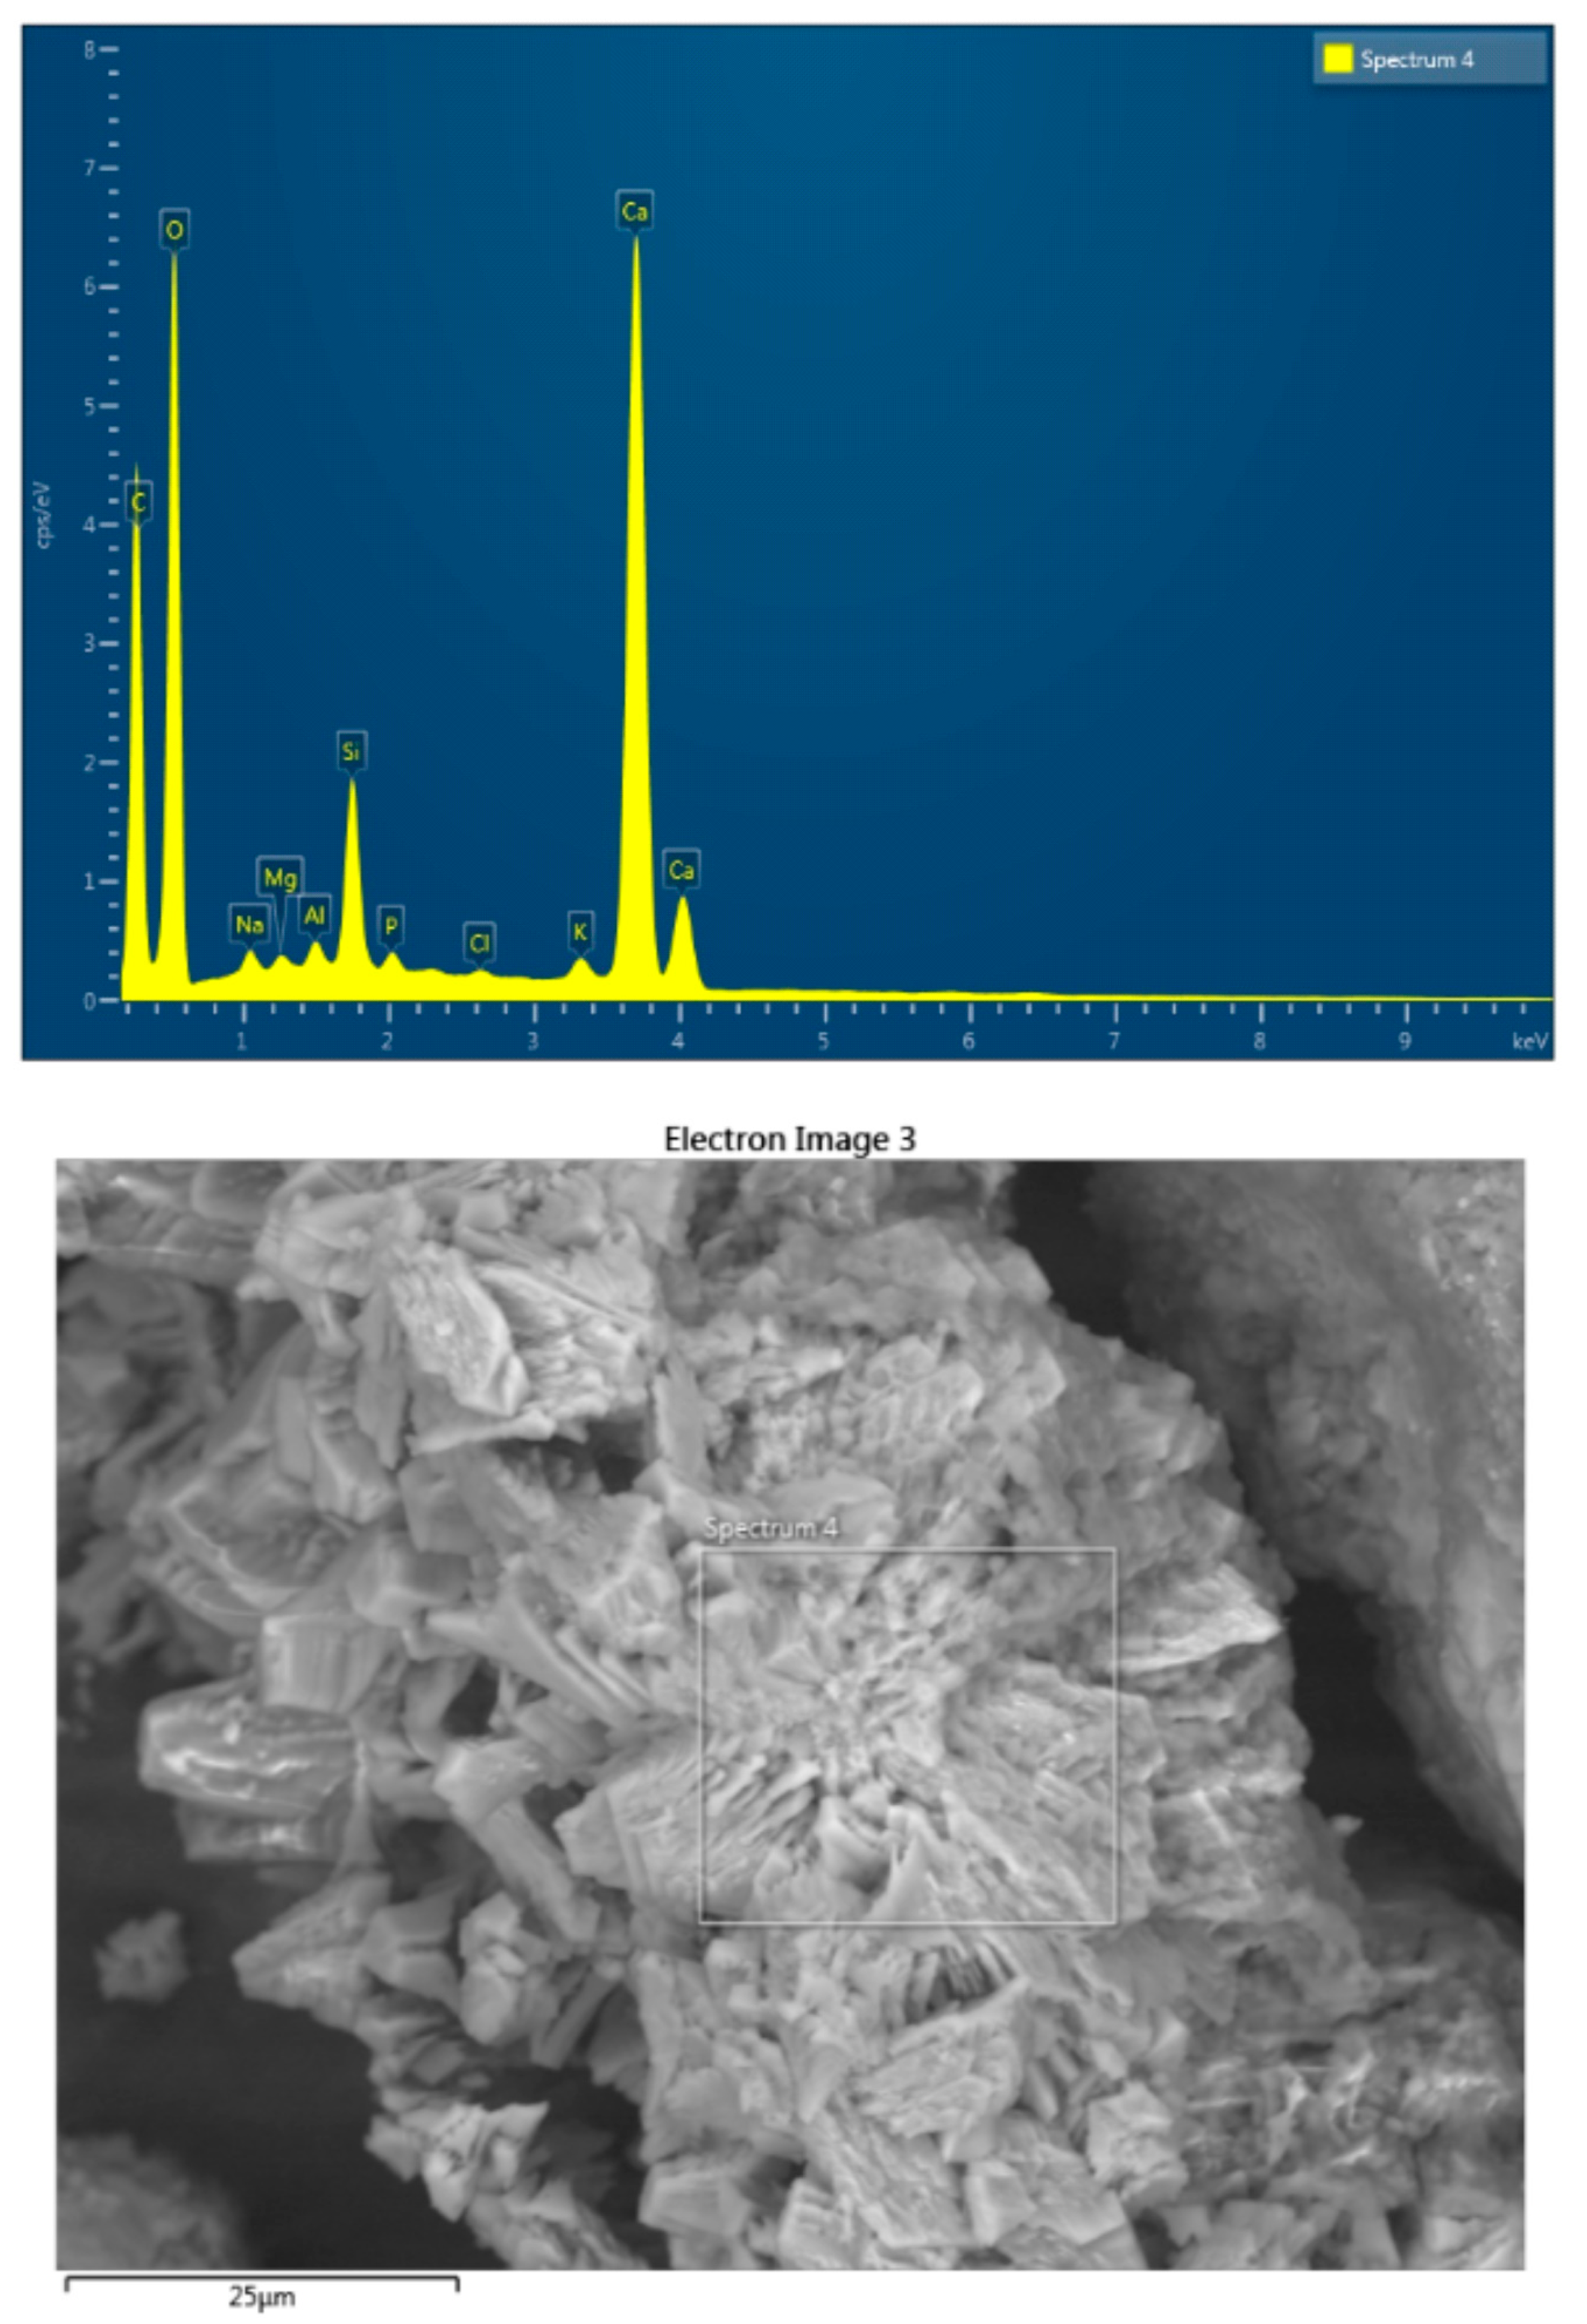
SEM and EDS analyses of the sand samples biotreated on Petri dishes (Figure 6) showed that sand compaction was due to the cementing action of CaCO3 bioliths that act as a bridge between the sand particles. The EDS spectra (Figure 10) showed Ca, C, O peaks that can be associated qualitatively with CaCO3. The presence of high carbon, calcium, and oxygen peaks in the analyzed area, showed a high amount of CaCO3. SEM image in Figure 10, shows that CaCO3 crystals produced by strain P9, Clavibacter agropyri, coat and bridge the sand particles, cementing the matrix.
According to EDS analysis, also the untreated sand presents, besides a high content of silica and oxygen, calcium and carbon but in low amount (Figure 11). As showed by the physico–chemical analyses (Table 2) and XRD (Figure 12), organic matter is the origin of C, while lithogenic carbonates could be the origin of Ca identified by EDS.

4. Summary and Conclusions

Successful application of BCP in the different fields of interest, depends on a variety of factors. Much effort has been devoted to understand the factors governing BCP as well as the criteria for the selection of bacterial strains to optimize the biodeposition of CaCO3 in a variety of biotechnological applications. To date, two strategies involving bacteria capable of inducing CaCO3 precipitation have been mostly used: One in which an axenic culture is used directly for biotechnological purposes and another that utilizes the carbonatogenic potential of the autochthonous microbial communities. In this study, we adopted a novel approach based on the study (through the Biolog EcoPlates) of the BCP potential of the sampling site (a rhizospheric soil) and the use of selected (pure or mixed) calcifying cultures from this community. Until now, rhizospheric soil has been scarcely explored, with most of the studies focused on different calcium carbonate deposits in caves, freshwater, and seawater. Growth and biodiversity of the rhizospheric bacteria are highly influenced by type of soil, moisture content, temperature, chemicals, and above all by the plant species. Thus, choosing a proper rhizospheric soil (by knowing that microbial community dwelling the rhizospheric soil have the possibilities to perform ammonification of amino acids as well as mineralization of organic acids) it is possible to increase the screening efficiency for strong CaCO3 depositor strains, likely due to increased number of bacteria useful to induce CaCO3 precipitation. In this study, we used the B4 medium to isolate the cultivable heterotrophic calcifying microflora from the rhizospheric soil of Pinus strobus, obtaining a microbial consortium consisting exclusively of calcifying bacteria, although B4 was not a selective medium. This confirms how the combined use of Biolog EcoPlates (for a more targeted selection of the sampling site) and rhizospheric soil (as sampling site) can represent a useful tool to start a successful screening of potent calcifying cultures. To our knowledge this is the first study that shows the CaCO3 biomineralization ability of Vibrio tubiashii, Clavibacter agropyri (Corynebacterium), Corynebacterium urealyticum, Sanguibacter suarezii, Sphingomonas sanguinis, and Pseudomonas syringae. As the metabolic response in the Biolog EcoPlates is at community level and involves in each well cooperative as well as competitive microbial behaviors, the real utility of the Biolog EcoPlates for a more targeted choice of the sampling site is conditioned by the use of mixed cultures whenever calcifying ability of the bacterial culture decreases or disappears following bacterial strain purification. Thus, it is important to preserve the BCP potential of the rhizospheric microbial community.
To select (pure or mixed) bacterial cultures suitable for sand biocementation, we performed an array of tests based on carbonate precipitation (i.e., CaCO3 precipitation on solid media at different temperatures or in liquid condition at 28 °C), carbonate solubilization as well as physio-morphological analyses. To assess the extent of calcification by each bacterial strain, we applied ImageJ software as a new method for estimating BCP in solid media. Nevertheless, the positive results we obtained both in the enrichment and in the selection of bacteria useful for sand biocementation, the approach we proposed as well as the use of the ImageJ as a screening tool, need to be further investigated and optimized.
As a future goal, we are studying the role of cell interactions, namely the occurrence of a cell-to-cell communication system (quorum sensing), in the BCP process mediated by Gram-negative bacteria. Moreover, an optimization of the ImageJ method is in progress using a motorized microscope (Zeiss AXIO Imager.M2) with an Axiocam 503 camera, for the automatic choice of the visual fields and an accurate scale-bar determination and calibration.

Author Contributions

P.C. conceived the research question, contributed to methodology and data curation, wrote the draft paper, contributed to revision and editing; M.D.G. contributed to the analysis of the results, critical revision, and editing of the final manuscript.

Funding

This research received no external funding.

Acknowledgments

We thank L. Giansante for his assistance during the laboratory work, M. Giammatteo and L. Arrizza for assistance with SEM, M. Pellegrini and F. Matteucci for Biolog assistance and data elaboration. We also thank M. Passacantando and G. Cappuccio for collaboration in crystal XRD-analyses and graphic assistance.

Conflicts of Interest

The authors declare no conflict of interest.

References

  1. Stocks-Fischer, S.; Galinat, J.K.; Bang, S.S. Microbiological precipitation of CaCO3. Soil Biol. Biochem. 1999, 31, 1563–1571. [Google Scholar] [CrossRef]
  2. Banks, E.D.; Taylor, N.M.; Gulley, J.; Lubbers, B.R.; Giarrizo, J.G.; Bullen, H.A.; Hoehler, T.M.; Barton, H.A. Bacterial calcium carbonate precipitation in cave environments: A function of calcium homeostasis. Geomicrobiol. J. 2010, 27, 444–454. [Google Scholar] [CrossRef]
  3. Baskar, S.; Baskar, R.; Mauclaire, L.; Mckenzie, J.A. Role of microbial community in stalactite formation, Sahastradhara caves, Dehradun, India. Curr. Sci. 2005, 88, 1305–1308. [Google Scholar]
  4. Boquet, E.; Boronat, A.; Ramos-Cormenzana, A. Production of calcite (calcium carbonate) crystals by soil bacteria is a general phenomenon. Nature 1973, 246, 527–529. [Google Scholar] [CrossRef]
  5. Braissant, O.; Cailleau, G.; Dupraz, C.; Verrecchia, E.P. Bacterially induced mineralization of calcium carbonate in terrestrial environments: The role of exopolysaccharides and amino acids. J. Sediment. Res. 2003, 73, 485–490. [Google Scholar] [CrossRef]
  6. Cacchio, P.; Ercole, C.; Lepidi, A. Calcium carbonate deposition in limestone caves: Microbiological aspects. Subterr. Biol. 2003, 1, 57–63. [Google Scholar]
  7. Cacchio, P.; Ercole, C.; Cappuccio, G.; Lepidi, A. Calcium carbonate precipitation by bacterial strains isolated from a limestone cave and from a loamy soil. Geomicrobiol. J. 2003, 20, 85–98. [Google Scholar] [CrossRef]
  8. Cacchio, P.; Contento, R.; Ercole, C.; Cappuccio, G.; Preite Martinez, M.; Lepidi, A. Involvement of microorganisms in the formation of carbonate speleothems in the Cervo Cave (L’Aquila-Italy). Geomicrobiol. J. 2004, 21, 497–509. [Google Scholar] [CrossRef]
  9. Cacchio, P.; Ercole, C.; Lepidi, A. Evidences for bioprecipitation of pedogenic calcite by calcifying bacteria from three different soils of L’Aquila Basin (Abruzzi, Central Italy). Geomicrobiol. J. 2015, 32, 701–711. [Google Scholar] [CrossRef]
  10. Danielli, H.M.C.; Edington, M.A. Bacterial calcification in limestone caves. Geomicrobiology 1983, 3, 1–16. [Google Scholar] [CrossRef]
  11. Lipman, C.B. Further studies on marine bacteria with special reference to the drew hypothesis on CaCO3 precipitation on sea. Carnegie Inst. 1929, 39, 231–248. [Google Scholar]
  12. Morita, R.Y. Calcite precipitation by marine bacteria. Geomicrobiology 1980, 2, 63–82. [Google Scholar] [CrossRef]
  13. Northup, D.E.; Reysenbach, A.L.; Pace, N.R. Microorganisms and speleonthems. In Cave Minerals of the World, 2nd ed.; Hill, C., Forti, P., Eds.; National Speleological Society: Huntsville, AL, USA, 1997; pp. 261–266. ISBN 1-879961-07-5. [Google Scholar]
  14. Novitsky, J.A. Calcium carbonate precipitation by marine bacteria. Geomicrobiology 1981, 2, 375–388. [Google Scholar] [CrossRef]
  15. Riding, R. Microbial carbonates: The geological record of calcified bacterial-algal mats and biofilms. Sedimentology 2000, 47, 179–214. [Google Scholar] [CrossRef]
  16. Zhuang, D.; Yan, H.; Tuckerd, M.E.; Zhao, H.; Han, Z.; Zhao, Y.; Sun, B.; Li, D.; Pan, J.; Zhao, Y.; et al. Calcite precipitation induced by Bacillus cereus MRR2 cultured at different Ca2+ concentrations: Further insights into biotic and abiotic calcite. Chem. Geol. 2018, 500, 64–87. [Google Scholar] [CrossRef]
  17. Castanier, S.; Le Metayer-Levrel, G.; Perthuisot, J.-P. Ca-carbonates precipitation and limestone genesis—The microbiogeologist point of view. Sediment. Geol. 1999, 126, 9–23. [Google Scholar] [CrossRef]
  18. Hammes, F.; Verstraete, W. Key roles of pH and calcium metabolism in microbial carbonate precipitation. Rev. Environ. Sci. Biotechnol. 2002, 1, 3–7. [Google Scholar] [CrossRef]
  19. Douglas, S.; Beveridge, T.J. Mineral formation by bacteria in natural microbial communities. FEMS Microbiol. Ecol. 1998, 26, 79–88. [Google Scholar] [CrossRef]
  20. Castanier, S.; Métayer-Levrel, G.L.; Perthuisot, J.-P. Bacterial Roles in the Precipitation of Carbonate Minerals. In Microbial Sediments; Riding, R.E., Awramik, S.M., Eds.; Springer: Heidelberg/Berlin, Germany, 2000; pp. 32–39. [Google Scholar] [CrossRef]
  21. Schultze-Lam, S.; Fortin, D.; Davis, B.S.; Beveridge, T.J. Mineralisation of bacterial surfaces. Chem. Geol. 1996, 132, 171–181. [Google Scholar] [CrossRef]
  22. Rivadeneyra, M.A.; Delgado, G.; Ramos-Cormenzana, A.; Delgado, R. Biomineralization of carbonates by Halomonas eurihalina in solid and liquid media with different salinities: Crystal formation sequence. Res. Microbiol. 1998, 149, 277–287. [Google Scholar] [CrossRef]
  23. Southam, G. Bacterial Surface-Mediated Mineral Formation. In Environmental Microbe-Metal Interactions; Lovley, D., Ed.; ASM Press: Washington, DC, USA, 2000; pp. 257–276. [Google Scholar]
  24. Braissant, O.; Decho, A.W.; Dupraz, C.; Glunk, C.; Przekop, K.M.; Visscher, P.T. Exopolymeric substances of sulfate-reducing bacteria: Interactions with calcium at alkaline pH and implication for formation of carbonate minerals. Geobiology 2007, 5, 401–411. [Google Scholar] [CrossRef]
  25. Decho, A.W. Overview of biopolymer-induced mineralization: What goes on in biofilms? Ecol. Eng. 2009, 30, 1–8. [Google Scholar] [CrossRef]
  26. Ercole, C.; Cacchio, P.; Botta, A.L.; Centi, V.; Lepidi, A. Bacterially induced mineralization of calcium carbonate: The role of exopolysaccharides and capsular polysaccharides. Microsc. Microanal. 2007, 13, 42–50. [Google Scholar] [CrossRef] [PubMed]
  27. Braissant, O.; Verrecchia, E.P.; Aragno, M. Is the contribution of bacteria to terrestrial carbon budget greatly underestimated? Naturwissenschaften 2002, 89, 366–370. [Google Scholar] [CrossRef] [PubMed]
  28. Arp, G.; Volker, T.; Reimer, A.; Michaelis, W.; Reitner, J. Biofilm exopolymers control microbialite formation at thermal springs discharging into the alkaline Pyramid Lake, Nevada, USA. Sediment. Geol. 1999, 126, 159–176. [Google Scholar] [CrossRef]
  29. McConnaughey, T.A.; Whelan, J.F. Calcification generates protons for nutrient and bicarbonate uptake. Earth Sci. Rev. 1997, 42, 95–117. [Google Scholar] [CrossRef]
  30. Seifan, M.; Samani, A.K.; Berenjian, A. Induced calcium carbonate precipitation using Bacillus species. Appl. Microbiol. Biotechnol. 2016, 100, 9895–9906. [Google Scholar] [CrossRef]
  31. Wright, D.T. The role of sulphate-reducing bacteria and cyanobacteria in dolomite formation in distal ephemeral lakes of Coorong region, South Australia. Sed. Geol. 1999, 126, 147–157. [Google Scholar] [CrossRef]
  32. Arp, G.; Reimer, A.; Reitner, J. Photosynthesis-induced biofilm calcification and calcium concentrations in Phanerozoic oceans. Science 2001, 292, 1701–1704. [Google Scholar] [CrossRef]
  33. Dittrich, M.; Obst, M. Are picoplankton responsible for calcite precipitation in lakes? Ambio 2004, 33, 559–564. [Google Scholar] [CrossRef]
  34. Plée, K.; Pacton, M.; Ariztegui, D. Discriminating the role of photosynthetic and heterotrophic microbes triggering low-Mg calcite precipitation in freshwater biofilms (Lake Geneva, Switzerland). Geomicrobiol. J. 2010, 27, 391–399. [Google Scholar] [CrossRef]
  35. Power, I.M.; Wilson, S.A.; Small, D.P.; Dipple, G.M.; Wan, W.K.; Southam, G. Microbially mediated mineral carbonation: Roles of phototrophy and heterotrophy. Environ. Sci. Technol. 2011, 45, 9061–9068. [Google Scholar] [CrossRef] [PubMed]
  36. Ehrlich, H.L. Geomicrobiology: Its significance for geology. Earth-Sci. Rev. 1998, 45, 45–60. [Google Scholar] [CrossRef]
  37. Zhu, T.; Dittrich, M. Carbonate precipitation through microbial activities in natural environment, and their potential in biotechnology: A review. Front. Bioeng. Biotechnol. 2016, 4, 4. [Google Scholar] [CrossRef] [PubMed] [Green Version]
  38. Cardoso, R.; Pires, I.; Duarte, S.O.D.; Monteiro, G.A. Effects of clay’s chemical interactions on biocementation. Appl. Clay Sci. 2018, 156, 96–103. [Google Scholar] [CrossRef]
  39. Morales, L.; Garzón, E.; Sánchez-Soto, S.P.J.; Romero, E. Microbiological induced carbonate (CaCO3) precipitation using clay phyllites to replace chemical stabilizers (cement or lime). Appl. Clay Sci. 2019, 174, 15–28. [Google Scholar] [CrossRef]
  40. Anbu, P.; Kang, C.H.; Shin, Y.J.; So, J.S. Formation of calcium carbonate minerals by bacteria and its multiple applications. SpringerPlus 2016, 5, 250. [Google Scholar] [CrossRef] [Green Version]
  41. Vekariya, M.S.; Pitroda, J. Concrete: New Era for Construction Industry. Intern. J. Eng. Tre. Tech. 2013, 4, 4128–4137. [Google Scholar]
  42. Chahal, N.; Rajor, A.; Siddique, R. Calcium carbonate precipitation by different bacterial strains. Afr. J. Biotechnol. 2011, 10, 8359–8372. [Google Scholar]
  43. Garland, J.L.; Mills, A.L. Classification and characterization of heterotrophic microbial communities on the basis of patterns of community-level sole-carbon-source utilization. Appl. Environ. Microbiol. 1991, 57, 2351–2359. [Google Scholar]
  44. Dakora, F.D.; Phillips, D.A. Root exudates as mediators of mineral acquisition in low-nutrient environments. Plant and Soil 2002, 245, 35–47. [Google Scholar] [CrossRef]
  45. Abràmoff, M.D.; Magelhaes, P.J.; Ram, S.J. Image processing with ImageJ. Biophotonics Inter. 2004, 11, 36–42. [Google Scholar]
  46. Schneider, C.A.; Rasband, W.S.; Eliceiri, K.W. NIH Image to ImageJ: 25 years of image analysis. Nat. Methods 2012, 9, 671–675. [Google Scholar] [CrossRef] [PubMed]
  47. Garland, J.L. Analytical approaches to the characterization of samples of microbial communities using patterns of potential C source utilization. Soil Biol. Biochem. 1996, 28, 213–222. [Google Scholar] [CrossRef]
  48. Frąc, M.; Oszust, K.; Lipiec, J. Community level physiological profiles (CLPP), characterization and microbial activity of soil amended with dairy sewage sludge. Sensors 2012, 12, 3253–3268. [Google Scholar] [CrossRef] [Green Version]
  49. Zak, J.C.; Willig, M.R.; Moorhead, D.L.; Wildman, H.G. Functional diversity of microbial communities: A quantitative approach. Soil Biol. Biochem. 1994, 26, 1101–1108. [Google Scholar] [CrossRef]
  50. Supraja, N.; Prasad, T.N.V.K.V. Extracellular synthesis of Calcium Precipitating Bacteria Isolated from Rock Environment Region and its Characterization Studies. Adv. Bioequiv. Bioavailab. 2018, 1. [Google Scholar] [CrossRef]
  51. Otlewska, A.; Gutarowska, B. Environmental parameters conditioning microbially induced mineralization under the experimental model conditions. Acta Biochim. Pol. 2016, 63, 343–351. [Google Scholar] [CrossRef]
  52. Marvasi, M.; Visscher, P.T.; Perito, B.; Mastromei, G.; Martinez, L. Physiological requirements for carbonate precipitation during biofilm development of Bacillus subtilis etfA mutant. FEMS Microbiol. Ecol. 2010, 71, 341–350. [Google Scholar] [CrossRef] [Green Version]
  53. Urzì, C.; Garcia-Valles, M.; Vendrell, M.; Pernice, A. Biomineralization process on rock and monument surfaces observed in field and in laboratory conditions. Geomicrobiol. J. 1999, 16, 39–54. [Google Scholar]
  54. Baskar, S.; Baskar, R.; Mauclaire, L.; McKenzie, J.A. Microbially induced calcite precipitation in culture experiments: Possible origin for stalactites in Sahastradhara caves, Dehradun, India. Curr. Sci. 2006, 90, 58–64. [Google Scholar]
  55. Smibert, R.M.; Krieg, N.R. General characterization. In Manual Methods for General Bacteriology; Gerhardt, P., Ed.; American Society for Microbiology: Washington, DC, USA, 1981; pp. 409–443. [Google Scholar]
  56. Christensen, W.B. Urea Decomposition as a Means of Differentiating Proteus and Paracolon Cultures from Each Other and from Salmonella and Shigella Types. J. Bacteriol. 1946, 52, 461–466. [Google Scholar] [PubMed]
  57. MacFaddin, J.F. Biochemical Tests for Identification of Medical Bacteria, 3rd ed.; Williams & Wilkins: Philadelphia, PA, USA, 2000; p. 298. ISBN 0683053183. [Google Scholar]
  58. NORMAL Commission. NORMAL 9/88 recommendations. In Autotrophic and Heterotrophic Microflora: Culture Methods for Isolation; Consiglio Nazionale delle Ricerche/Istituto Centrale per il Restauro: Rome, Italy, 1990. [Google Scholar]
  59. Martino, T.; Salamone, P.; Zagari, M.; Urzì, C. Adesione a substrati solidi e solubilizzazione del CaCO3 quale misura della capacità deteriorante di batteri isolati dal marmo Pentelico. In Proceedings of the XI Meeting of the Italian Society of General Microbiology and Microbial Biotechnology (SIMGBM), Gubbio, Italy, 25–28 September 1992; pp. 249–250. [Google Scholar]
  60. Andrei, A.-S.; Păuşan, M.R.; Tămaş, T.; Har, N.; Barbu-Tudoran, L.; Leopold, N.; Banciu, H.L. Diversity and biomineralization potential of the epilithic bacterial communities inhabiting the oldest public stone monument of Cluj-Napoca (Transylvania, Romania). Front. Microbiol. 2017, 8, 372. [Google Scholar] [CrossRef] [PubMed] [Green Version]
  61. Jones, D.L. Organic acids in the rhizosphere—A critical review. Plant Soil 1998, 205, 25–44. [Google Scholar] [CrossRef]
  62. Florenzano, G. Fondamenti di Microbiologia del Terreno; REDA: Rome, Italy, 1983; p. 123. [Google Scholar]
  63. Marilley, J.; Aragno, M. Phylogenetic diversity of bacterial communities differing in degree of proximity of Lolium perenne and Trifolium repens roots. Appl. Soil Ecol. 1999, 13, 127–136. [Google Scholar] [CrossRef]
  64. Atlas, R.M.; Bartha, R. Microbial Ecology: Fundamentals and Applications, 4th ed.; The Benjamin/Cummings Publishing Company: San Francisco, CA, USA, 1998; ISBN 0805306552. [Google Scholar]
  65. Kourtev, P.S.; Ehrenfeld, J.G.; Haggblom, M. Exotic plant species alter the microbial community structure and function in the soil. Ecology 2002, 83, 3152–3166. [Google Scholar] [CrossRef]
  66. Ivanov, V.; Chu, J. Applications of microorganisms to geotechnical engineering for bioclogging and biocementation of soil in situ. Rev. Environ. Sci. Biotechnol. 2008, 7, 139–153. [Google Scholar] [CrossRef]
  67. Burbank, M.B.; Weaver, T.J.; Williams, B.C.; Crawford, R.L. Urease activity of ureolytic bacteria isolated from six soils in which calcite was precipitated by indigenous bacteria. Geomicrobiol. J. 2012, 29, 389–395. [Google Scholar] [CrossRef]
  68. Davis, M.J.; Gillaspie, A.G.; Vidaver, A.K.; Harris, R.W. Clavibacter: A new genus containing some phytopathogenic coryneform bacteria, including, Clavibacter xyli subsp. xyli sp. nov., subsp. nov. and Clavibacter xyli subsp. cynodontis subsp. nov., pathogens that cause ratoon stunting disease of sugarcane and bermudagrass stunting disease. Int. J. Bacteriol. 1984, 34, 107–117. [Google Scholar]
  69. Riley, I.T. Serological relationships between strains of coryneform bacteria responsible for annual ryegrass toxicity and other plant pathogenic corynebacteria. Int. J. Syst. Bacteriol. 1987, 37, 153–159. [Google Scholar] [CrossRef] [Green Version]
  70. Riley, I.T.; Reardon, T.B.; McKay, A.C. Genetic Analysis of plant pathogenic bacteria in the genus clavibacter using allozyme electrophoresis. J. Gen. Microbiol. 1988, 134, 3025–3030. [Google Scholar] [CrossRef] [Green Version]
  71. Fernandez-Garayzabal, J.F.; Dominguez, L.; Pascual, C.; Jones, D.; Collins, M. Phenotypic and phylogenetic characterization of some unknown coryneform bacteria isolated from bovine blood and milk: Description of Sanguibacter gen. nov. Lett. Appl. Microbiol. 1995, 20, 69–75. [Google Scholar] [CrossRef] [PubMed]
  72. Thompson, F.L.; Iida, T.; Swings, J. Biodiversity of Vibrios. J. Microbiol. Mol. Biol. Rev. 2004, 68, 403–431. [Google Scholar] [CrossRef] [PubMed] [Green Version]
  73. Tubiash, H.S.; Chanley, P.E.; Leifson, E. Bacillary necrosis, a disease of larval and juvenile bivalve mollusks. I. Etiology and epizootiology. J. Bacteriol. 1965, 90, 1036–1044. [Google Scholar] [PubMed]
  74. Okada, K.; Iida, T.; Kita-Tsukamoto, K.; Takeshi, H. Vibrios commonly possess two chromosomes. J. Bacteriol. 2005, 187, 752–757. [Google Scholar] [CrossRef] [PubMed] [Green Version]
  75. Rivadeneyra, M.A.; Delgado, R.; del Moral, A.; Ferrer, M.R.; Ramos-Cormenzana, A. Precipitation of calcium carbonate by Vibrio spp. from an inland saltern. FEMS Microbiol. Ecol. 1994, 13, 197–204. [Google Scholar] [CrossRef]
  76. Rodriguez-Navarro, C.; Jimenez-Lopez, C.; Rodriguez-Navarro, A.; Gonzalez-Muñoz, M.T.; Rodriguez-Gallego, M. Complex biomineralized vaterite structures encapsulating bacterial cells. Geochim. Cosmochim. Acta 2007, 71, 1197–1213. [Google Scholar] [CrossRef]
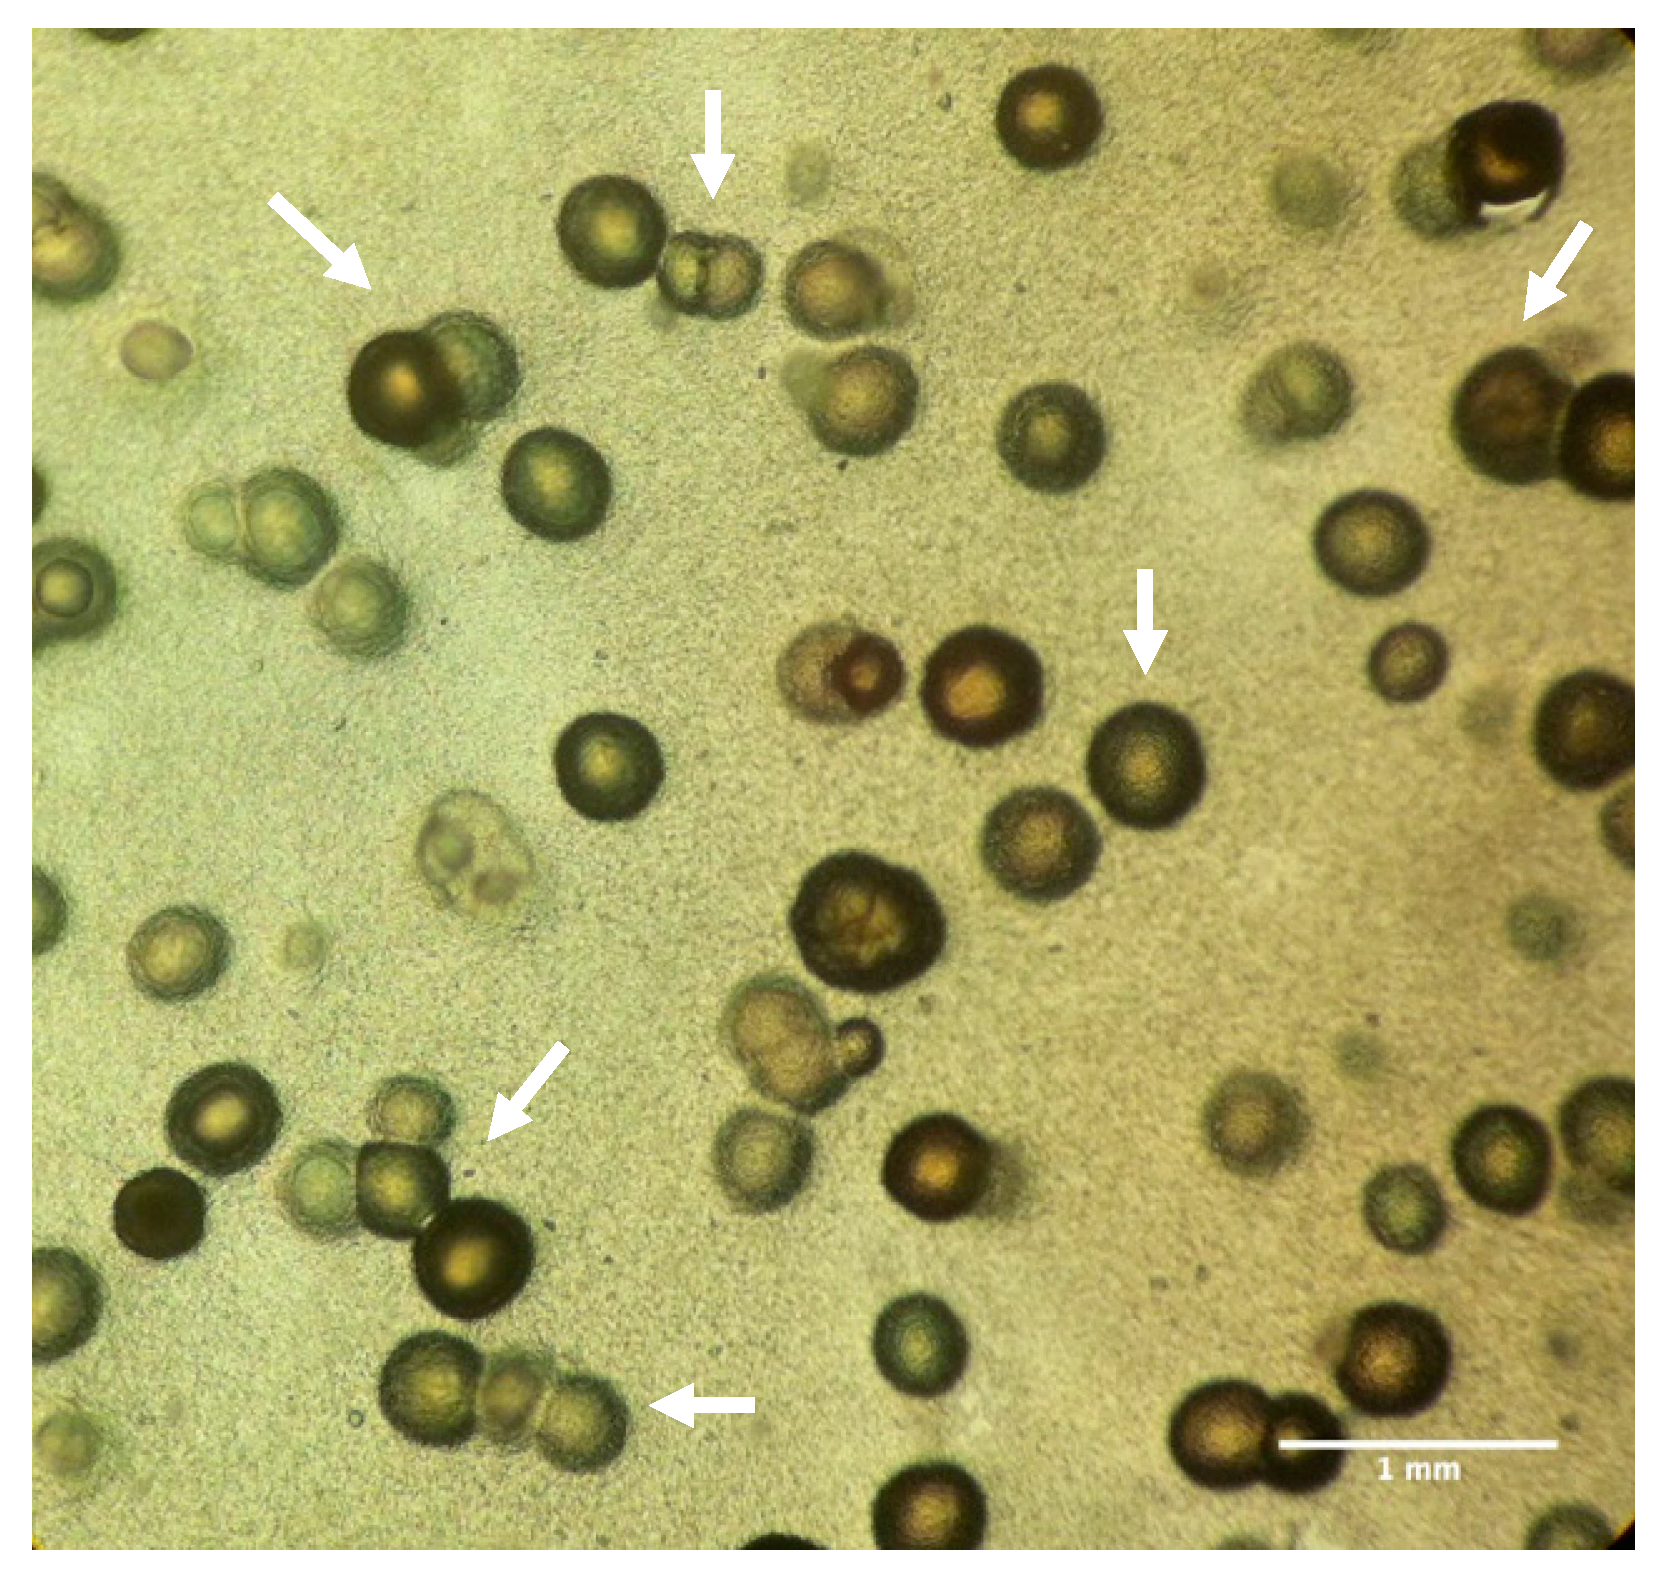
Figure 1. A digital image acquired through an iPhone (used as the camera) of an inoculated B4 agar plate, observed upside down at optical microscope (Leitz-Biomed, 10×). Note globular CaCO3 crystals of different dimensions and their aggregates precipitated by the strain P1 (arrows), after 30 days of growth at 28 °C.
Geosciences 09 00479 g001
Figure 2. Dynamic of the average well color development (AWCD) of the rhizospheric-soil sample during the incubation time (9 days), at 28 °C (AWCD points are means of three replicates). Data were corrected subtracting the initial readings (at 590 nm) at time zero, as well as the reading of the control well (inoculated but without a C-substrate). The curve shows how the microbial community had a long lag-time in the development of formazan products within the Biolog-plate wells. Development was consistent and linear over the entire incubation period (9 days). The number of positive wells increased slowly for the first 24 h and then increased up to 192 h of incubation, when stationary phase began.
Geosciences 09 00479 g002
Figure 3. Stacked columns showed the diversification over time of the substrate use from the different groups (polymers, carbohydrates, carboxylic and ketonic acids, amino acids and amines) by the soil microbial community. In the figure, absorbances are reported (recorded at 590 nm) for each substrate from 0 to 48 h (from 72 to 96 h, and from 96 to 216 h. The chart shows how the substrate use in the first 24 h (during the lag-phase, Figure 2), is limited to Glucose-1-phosphate, L-Asparagine, and D-Galacturonic acid. During the exponential phase, an increasing number of substrates (belonging to all five groups) was used by the microbial community.
Geosciences 09 00479 g003
Figure 4. CaCO3 solubilization, after 30 days incubation at 28 °C, by the not identified strain P1, firstly named U1. Note that the solubilization is almost complete at 0.14% (left), and as spots at 2.5% CaCO3 (right).
Geosciences 09 00479 g004
Figure 5. Percent average surface (BCP extent) occupied by the CaCO3 crystals precipitated in vitro by the pure and mixed calcifying cultures, after 30 days of growth on B4 agar at 28 °C (the BCP-extent values were obtained through ImageJ software).
Geosciences 09 00479 g005
Figure 6. Samples of biocemented sand through CaCO3 precipitation by strains P2, P11, M5, and P9 (starting from the upper left to the lower right) after 20 days of incubation, at 28 °C. Untreated control at the left bottom. The plates were positioned vertically to highlight the biocementation of the sand, not present in the control.
Geosciences 09 00479 g006
Figure 7. Test for deep biocementation of 300 g of sea sand in Magenta vessel (60 × 60 and 50 mm height), by strain P6 (Corynebacterium urealyticum) grown on B4 liquid medium. On the left the sample after a week of treatment, on the right the sand-sample after two months of treatment (note the complete occlusion of visible pores by the biodeposition of CaCO3 crystals).
Geosciences 09 00479 g007
Figure 8. Scanning electron micrograph of CaCO3 crystals and calcite aggregates deposited in vitro on agarized B4, at 28 °C by rhizospheric strains P1 (unidentified) (ad) and P2 (Vibrio tubiashii) (e,f). (a) Bioliths, spherical and hemispherical; magnification 50 μm. (b) Enlargement of a, contact zone between two bioliths, during the aggregation phase, showing a bridge formed by biofilm and CaCO3 crystals of neo-deposition; 20 μm magnification. (c) Enlargement of a, observe the significant amounts of bacterial cells in the background, 20 μm magnification. (d) Spherical bioliths completely immersed in the microbial biofilm, 50 μm magnification. (e) Aggregate formed by bioliths and hemi-bioliths, surrounded by bacterial cells; 100 μm magnification. (f) CaCO3 aggregate of three bioliths, note the cementing action of the microbial biofilm; 20 μm magnification.
Geosciences 09 00479 g008
Figure 9. X-ray diffraction pattern from an agar dried culture of strain P2, Vibrio tubiashii. The spectrum shows the presence of a mixture of calcite and vaterite. The background level is due to the presence of the agar and of the adhesive tape.
Geosciences 09 00479 g009
Figure 10. EDS spectrum and SEM image of the sand after 20 days of treatment at 28 °C with the strain P9 (Clavibacter agropyri).
Geosciences 09 00479 g010
Figure 11. EDS spectrum and SEM image of the untreated sand.
Geosciences 09 00479 g011
Figure 12. XRD pattern of the sea sand. The spectrum shows the prevalence of quartz and calcite.
Geosciences 09 00479 g012
Table 1. Physico–chemical properties of the soil sampled for the isolation of calcifying bacteria.
Skel.Sand
(%)
Silt
(%)
Clays
(%)
Text.O.M.
(%)
pHE.C.
(mS)
Tot. CaCO3
(%)
Act. CaCO3
(%)
N
(%)
Ca
(ppm)
Mg
(ppm)
K
(ppm)
Na
(ppm)
P
(ppm)
Fe
(ppm)
Mn
(ppm)
Cu
(ppm)
Zn
(ppm)
C.E.C.
(meq)
Ca
(meq)
Mg
(meq)
K
(meq)
Na
(meq)
B. S.
(%)
Mg/K
Con.4815 37C.S.1.067.60.40316.43.00.0741002442036669.613.01.91.223.3520.502.040.520.291003.9
Skel. = Skeleton; Con. = considerable (150–350 g/kg); Text. = texture; C.S. = clay, sand; O.M. = organic matter; E.C. = electric conductivity; Tot. CaCO3 = total calcium carbonate content; Act. CaCO3 = active calcium carbonate content; C.E.C. = cation exchange capacity; B.S. = basic saturation. Sand, silt, clay, total, and active calcium carbonate values are wt%.
Table 2. Physico–chemical properties of the sea sand utilized for biocementation experiments.
Skel.Sand
(%)
Silt
(%)
Clay
(%)
Text.O.M.
(%)
pHE.C.
(mS)
Tot. CaCO3
(%)
Act. CaCO3
(%)
N
(%)
Ca
(ppm)
Mg
(ppm)
K
(ppm)
Na
(ppm)
P
(ppm)
Fe
(ppm)
Mn
(ppm)
Cu
(ppm)
Zn
(ppm)
C.E.C.
(meq)
Ca
(meq)
Mg
(meq)
K
(meq)
Na
(meq)
B. S.
(%)
Mg/K
TRA.9424S.0.047.90.5733.90.90.0092940775411963.64.60.40.816.0114.70.650.140.521004.6
Skel. = Skeleton; TRA. = trace; Text. = texture; S. = sandy; O.M. = organic matter; E.C. = electric conductivity; Tot. CaCO3 = total calcium carbonate content; Act. CaCO3 = active calcium carbonate content; C.E.C. = cation exchange capacity; B.S. = basic saturation. Sand, silt, clay, total, and active calcium carbonate values are wt %.
Table 3. Morphological, physiological, and biochemical traits of the heterotrophic calcifying bacteria isolated from a rhizospheric soil near L’Aquila (Central Italy).
StrainCellGram4 °C20 °C28 °CAnaerobic Growth Urease
P1Short rod+-++-+ +
P2 Short rod--++-+ +
P3Short/irregular rod+-++-+ + +
P4Short/irregular rod+-++-+ + +
P5Rod+-+++ +
P6Short rod+-++++ +
P7Rod--++-+ + +
P8Short/irregular rod+++++ + + +
P9Short/irregular rod+-+++ + +
P10Short/irregular rod+-++-+ +
P11Short/branched rod+-++-+
P12 *Rod -n.d.++++
P13 *Rod-n.d.+++n.d.
P14 *Rod -n.d.+++-
Gram + = Gram positive; Gram – = Gram negative; Bacterial growth at 4, 20, and 28 °C in aerobiosis and in anaerobiosis at 28 °C: (-) = absent, (+) = present; urease activity (+) = trace, (+ +) = good, (+ + +) = very good; n.d.= not determined. * Strains P12, P13, and P14, from the fourth purification step of strain P5, were recovered and characterized after the loss of P5.
Table 4. Identification of the calcifying bacterial isolates.
Strain Identified Species% ID
P1Not identified
P2Vibrio tubiashii94
P3Clavibacter agropyri93
P4Clavibacter agropyri73
P6Corynebacterium urealyticum78
P7Not identified
P8Clavibacter agropyri87
P9Clavibacter agropyri73
P10Clavibacter agropyri87
P11Sanguibacter suarezii98
P12Sphingomonas sanguinis98
P13Not identified
P14Pseudomonas syringae
pv persicae
92
% ID = Identification index.
Table 5. Calcification parameters of the bacterial isolates.
Timing aPosition bShapeSizeAmount cAggregatesLiquid Media
Strain4 °C20 °C28 °C28 °C28 °C28 °C28 °C28 °C28 °C
P1-3014In/OutG/OM/L+ + +++
P2-138 In/OutP/OS/M+ + + ++ + ++
P3-208In/OutGM/L+ + ++ ++ +
P4-2310In/OutGL+ + ++-
P5n.d.n.d.n.d.In/OutG/OS+-n.d.
M5 d-1614In/OutG/OS+ + + +++-
P6-118InG/PM/L+ + + ++ ++++
P7-84In/OutGL+++ +-
P82088In/OutG/PS/L+++++
P9-2210In/OutGM/L+ + + +++/+ + +-
P10-138InG/PS/M/L++-+
P11-128In/OutG/PS+ + ++/+ ++
a Timing: Number of days required to start precipitation of CaCO3 in B4 agar cultures at 4, 20, and 28 °C; b Position on B4 agarized medium of the deposited crystals (inside and/or outside the bacterial colony); c visually established by the microscope; d M5 is a mixed calcifying culture composed by the strains P12 (Sphingomonas sanguinis), P13 (not identified), and P14 (Pseudomonas syringae); n.d. = not determined; In = inside the colony; Out = outside the colony; In/Out = inside and outside the colonies; G = globular, spheric; O = oval; P = prismatic; S = small-sized; M = medium-sized (80–100 μm); L = large-sized (100–200 μm); CaCO3 deposition: (-) = absent, (+) = trace, (+ +) = good, (+ + +) = very good, (+ + + +) = excellent.
Table 6. Solubilization activity of the calcifying bacterial cultures obtained from a rhizospheric soil (L’Aquila-Central Italy).
StrainsIdentified SpeciesSolubilization
CaCO3 (0.14%)CaCO3 (0.5%)
P1Not identified+ + ++/- a
P2Vibrio tubiashii+ + ++/-
P3Clavibacter agropyri+ + ++/+ +
P4Clavibacter agropyri+ ++ +
M5Sphingomonas sanguinis (P12), Not identified (P13), Pseudomonas syringae (P14)+ ++
P6Corynebacterium urealyticum+ ++ +
P7Not identified+ + ++/+ +
P8Clavibacter agropyri+ ++/-
P9Clavibacter agropyri+ +-
P10Clavibacter agropyri+ + ++
P11Sanguibacter suarezii+ ++
a +/- = spotted solubilization.