Abstract
The 24 September 2001 College Park, Maryland, tornado was a long-track and strong tornado that passed within a close range of two Doppler radars. It was the third in a series of three tornadoes associated with a supercell storm that developed in Stafford County, Virginia, and initiated 3–4 km southwest of College Park and dissipated near Columbia, Howard County. The supercell tracked approximately 120 km and lasted for about 126 min. This study presents a synoptic and mesoscale overview of favorable conditions and forcing mechanisms that resulted in the severe convective outbreak associated with the College Park tornado. The results show many critical elements of the tornadic event, including a negative-tilted upper-level trough over the Ohio Valley, a jet stream with moderate vertical shear, a low-level warm, moist tongue of the air associated with strong southerly flow over south-central Maryland and Virginia, and significantly increased convective available potential energy (CAPE) during the late afternoon hours. A possible role of the urban heat island effects from Washington, DC, in increasing CAPE for the development of the supercell is discussed. Satellite imagery reveals the banded convective morphology with high cloud tops associated with the supercell that produced the College Park tornado. Operational WSR-88D data exhibit a high reflectivity “debris ball” or tornadic debris signature (TDS) within the hook echo, the evolution of the parent storm from a supercell structure to a bow echo, and a tornado cyclone signature (TCS). Many of the mesoscale features could be captured by contemporary numerical model analyses. This study concludes with a discussion of the effectiveness of the coordinated use of satellite and radar observations in the operational environment of nowcasting severe convection.
1. Introduction
An F3 tornado struck College Park, Maryland, hereafter referred to as the College Park tornado, on 24 September 2001 (see Figure 1b) with its track passing within a close range of two Doppler radars. It was the third in a series of three tornadoes produced by a supercell storm that developed from the splitting of a pre-existing supercell at its right flank around 1944 UTC (or 1544 LST) over Stafford County, Virginia. This tornado, the most intense one (F3 intensity), developed 3–4 km southwest of College Park from this supercell at approximately 2116 UTC (or 1716 LST) and dissipated over eastern Howard County, Maryland, by 2150 UTC (see its path in Figure 1a). With a track of 28 km, the College Park tornado remains the only long-track event with an intensity of F3 or greater to directly impact the greater Washington, DC and adjacent suburban Maryland region since 2000. The long-lived supercell that spawned the College Park tornado could be tracked approximately 120 km from Stafford County, Virginia, across Washington, DC, to Howard County, Maryland, in 126 min.
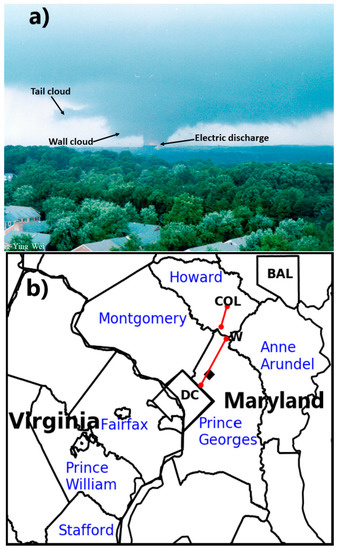
Figure 1.
(a) The College Park tornado at 2121 UTC viewed approximately 2 miles from the northeast (courtesy of Ming-Ying Wei of NASA). Note an electric discharge with the University of Maryland football stadium in the foreground. (b) The track of the College Park tornado (two red line segments) from Washington, DC, to Columbia, Maryland, during the period of 2119–2154 UTC 24 September 2001. The black diamond marks the location of College Park; “W” marks the location of the severe thunderstorm straight-line wind damage that was observed near Laurel at 2140 UTC; and “COL” marks the location of tornado dissipation near Columbia.
The College Park tornado produced heavy damage from just west of the campus of University of Maryland to downtown Laurel (Figure 1a,b). On and near the campus, the tornado caused approximately $15 million in damage, including 10 destroyed trailers (used as temporary facility for the Maryland Fire and Rescue Institute), several heavily damaged buildings, many tossed and destroyed vehicles, and two fatalities. It then struck the US Department of Agriculture Research Center, causing an estimated $41 million in damage to buildings and research documents. It continued north through Beltsville (5 km northeast of College Park), damaging homes, businesses, and schools. In downtown Laurel, the tornado tore the roof off a wing of the Laurel High School and then destroyed a single-level house in the neighborhood behind the school. Moving from Prince Georges County into Howard County, the tornado caused damage to 43 homes before finally dissipating in Columbia. Overall, $16 million in damage resulted in Prince Georges County that included 861 residential homes, 560 vehicles, and at least 23 commercial businesses. Approximately an additional $1 million in damage was caused in Howard County. The total damage in Maryland was estimated to be over $73 million (National Weather Service 2001, available online at https://www.weather.gov/lwx/stormdata) [1].
Tornado climatology as compiled by the National Climatic Data Center (NCDC) indicates that, on average, there is one significant tornado with an intensity damage rating of an F2 to F5 that occurs over the state of Maryland approximately every two years. This climatology is based on data obtained by the Storm Prediction Center’s National Severe Weather Database between the years 1950 and 2017 from the National Weather Service/Storm Prediction Center’s Online SeverePlot 3.0 (available online at https://www.spc.noaa.gov/climo/online/sp3/plot.php). The occurrence of the College Park tornado and the 28 April 2002 La Plata, Maryland, tornado of F4 intensity within a one-year period possibly indicates a significant increasing trend in tornado occurrence in this region. Based on this apparent increasing trend, the US Congress considered tasking the National Weather Service to initiate a study on the occurrence of the two tornadoes. The tornado climatology also reveals that after a 13 year lull in significant tornado activity over Maryland since 2004, a strong EF2 tornado, generated by a high-precipitation (HP) supercell storm, impacted Stevensville, Kent Island, during the early morning of 24 July 2017. Although it was a short-lived tornado that tracked from the Chesapeake Bay onto the Eastern Shore, its nighttime occurrence was especially dangerous and caused major structural damage and injury. The occurrence of the 2017 Kent Island tornado event, in consideration of new techniques available for numerical weather prediction model, Doppler radar, and geostationary satellite data visualization and analysis, has provided the motivation to revisit the College Park tornado as a forensic study. In particular, it still remains unclear what peculiar environmental conditions accounted for the development of the series of tornadoes, since F3/4 tornado events are rare in this mid-Atlantic region. Accordingly, this study will focus on the regional environment in which the College Park tornado developed with the use of Python modules such as Sounding/Hodograph Analysis and Research Program in Python (SHARPpy, https://github.com/sharppy/SHARPpy) and Python ARM Radar Toolkit (Py-ART, https://arm-doe.github.io/pyart/).
Previous studies of other tornado outbreaks have also shown specific tornadic supercell storm structures that were similar to the College Park tornado, in which the circulation of the low-level mesocyclone was strengthened mainly by the baroclinicity associated with the forward flank gust front (FFGF), and the rear-flank downdraft (RFD) was associated with the descending reflectivity core (DRC, Rasmussen et al. (2006) [2], Figure 2 of Kennedy et al. (2007) [3]) that modulated the low-level rotation and buoyancy field. Accordingly, the role of the DRC and subsequent RFD in the generation of the College Park tornado is addressed in detail in Section 3.
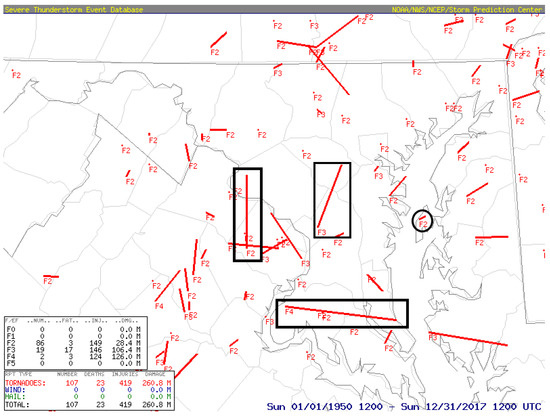
Figure 2.
Plot of significant tornado tracks over Maryland and the greater Washington, DC, metropolitan area between 1950 and 2017. The track of the College Park tornado, as well as other recent long-track tornadoes in Fairfax County, Virginia, and Charles County, Maryland, are outlined by black rectangles, while the track of the 2017 Kent Island tornado is outlined by a black circle. Courtesy of the National Weather Service/Storm Prediction Center.
In addition, two encouraging aspects of this event were (i) the successful tornado warning and prediction of its track and timing by the NWS’ Sterling Office (see Appendix A) and (ii) the real-time, experimental forecast of a long-lived mesocyclone associated with the tornado. Specifically, the NWS’ Sterling Office issued a tornado warning at 2110 UTC, based on Doppler radar observations at 2106 UTC, which included the timing of its passage at College Park (see Appendix A).
The objectives of the present study were to (i) document favorable conditions and forcing mechanisms at both the synoptic- and mesoscale that resulted in the severe convection outbreak and tornadogenesis using GOES imagery, National Centers for Environmental Prediction (NCEP) Final (FNL) analysis pressure fields, and derived thermodynamic profiles and parameters; and (ii) to examine the morphology of the supercell/mesocyclone associated with the College Park tornado and their sequences using Doppler radar data obtained from the Sterling, Virginia NEXRAD, and re-calibrated Geostationary Operational Environmental Satellite (GOES)-8 imager datasets. This study emphasizes environmental factors and storm structural attributes that favored the generation of intense convective downdrafts and resulting strong outflow winds in a region of moderate vertical wind shear. The outflow–shear interaction was identified as an important forcing mechanism for tornado genesis.
The next section provides a larger-scale overview of the upper-level and surface features as well as upper-air observations that are favorable for severe convection and tornadic activity utilizing satellite imagery and NCEP FNL analysis output data. Section 3 documents the evolution of the supercell that spawned the College Park tornado and shows the structures and evolution of the tornado and its parent supercell, as well as convective morphology using high-resolution Doppler radar and satellite imagery. A summary and concluding remarks are given in the final section.
2. Larger-Scale Overview
The 1800 UTC 24 September 2001 NCEP Final (FNL) analysis was selected as the numerical model dataset to most effectively visualize the pre-storm environment over the mid-Atlantic coastal region. The NCEP FNL Operational Global Analysis, with 1 degree by 1 degree resolution and a six hourly update cycle, is generated from the Global Data Assimilation System (GDAS). The FNL analyses are generated by the same model used in the Global Forecast System (GFS) about an hour after the GFS is initialized, resulting in the ingestion of more observational data. The GFS uses the FNL from the previous 6 h cycle as part of its initialization. The FNL analysis-generated fields, especially superimposed over satellite imagery, were used to provide a large-scale thermodynamic environmental overview three hours prior to the genesis of the College Park tornado event, which was critical in demonstrating the diagnosis and short-term prediction capability of the contemporary GFS Aviation (AVN) model.
Equivalent potential temperature (θe) fields as shown in Figure 3 and Figure 4, generated at isobaric levels as well as in vertical cross-sections, provided a strong signal for severe thunderstorm development. Figure 3b shows the presence of a cold front about 200 km to the west of College Park at 1745 UTC, corresponding roughly to the leading edge of a large θe gradient, shown in Figure 3a, that extended westward into the Ohio Valley. Clearly, this cold front would play an important role in lifting the low-level northward-flowing warm and moist air, as represented by a 1000 hPa θe ridge. In addition, College Park was located ahead (eastward) of a deep shortwave trough axis within a favorable region of quasi-geostrophic upward motion, as implied by positive differential vorticity advection (PDVA). The shortwave trough extended from the Great Lakes to the lower Mississippi Valley and, in combination with the cold front, served as a mechanism for enhanced lifting over the mid-Atlantic coastal region.
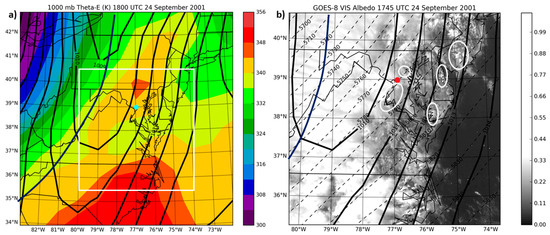
Figure 3.
(a) The National Centers for Environmental Prediction Final (NCEP FNL) analysis-generated 1000 hPa equivalent potential temperature (θe, contoured at 4 K intervals) with overlying sea-level pressure (hPa, solid) at 1800 UTC; and (b) sea-level pressure (hPa, solid) and 500 hPa geopotential height (m, dashed) overlying GOES-8 visible albedo imagery over the mid-Atlantic coastal region at 1745 UTC 24 September 2001. A white rectangle marks the boundaries of the visible image in (b). The white closed curves in (b) mark the location of enhanced cumulus. Cyan (left) and red (right) dots indicate the location of College Park.
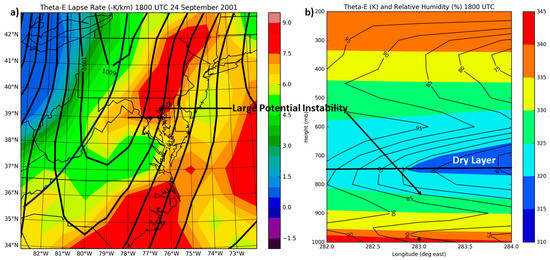
Figure 4.
(a) NCEP FNL analysis-generated 1000–700 hPa θe lapse rate (K km−1) with overlying sea level pressure (hPa, solid); and (b) vertical cross-section of θe and relative humidity (percent) along the horizontal line at latitude 39° N given in (a) at 1800 UTC 24 September 2001. A black dot indicates the location of College Park.
Regional, high-resolution (1 km) visible imagery was available, in general, every five to ten minutes from 1745 to 2145 UTC, while the GOES-8 imager was in rapid scan mode, which allowed for tracking the evolution of tornado-producing supercell storms following the methodology of Line et al. (2016) [4]. Figure 3b, visible imagery at 1745 UTC, displays a band of bright, thick convective clouds with overlying cirrus extending from western Pennsylvania to western Virginia, that corresponded with the location of the lower tropospheric θe ridge. The imagery also shows breaks in the cirrus deck revealing widespread cumulus congestus and enhanced cumulus clusters ahead of the cold front over east-central Maryland and the Eastern Shore with a distinct one at about 50 km to the southwest of College Park (Figure 3b). This revealed the presence of potential instability ahead of the shortwave trough prior to the tornadic event. The GOES imagery during the time of development and impact of the College Park tornado is explored further in Section 3.
The surface analysis shown in Figure 3 at 1800 UTC indicates that low-level positive θe advection was occurring over southern Maryland and the Eastern Shore ahead of the surface front. According to Chaston (1995) [5], such a θe tongue, acting upon by a lifting mechanism (i.e., PDVA and/or frontal lifting), can serve as an axis of available potential energy that is convertible into the kinetic energy of the subsequent convection. In this case, the θe tongue provided a source of warm, moist, and positively buoyant air to feed the supercell as it tracked northeastward into central Maryland, producing strong convective updrafts. Moreover, the mid-tropospheric PVA resulted in large-scale ascent over central Maryland during the development of the College Park tornado.
Figure 4b, a vertical cross-sectional image over the greater Washington, DC, metropolitan area, indicates the presence of high-θe air (i.e., θe > 335 K) in the lowest 100 hPa layer in the warm sector, anticipating the generation of intense convection when this high-θe air is lifted at the frontal boundary or convectively generated cold outflows. Thus, the supercell storm that would eventually produce the College Park tornado was predominantly “fed” by the positively buoyant high θe air [6]. Note that the low-level southerly flow overlain by strong southwesterly flow aloft indicated the presence of strong directional wind shear that was to be a major contributor to the development of storm rotation and the favorability for splitting supercell storms, as mentioned in Section 1.
Of interest was the presence of a large vertical θe gradient from the surface to 750 hPa and a well-defined dry layer aloft that was favorable for severe convection and tornadic supercell development. McGinley (1986) [7] and Weisman and Klemp (1986) [8] argued that a dry air layer in the mid-levels (650–500 hPa) would enhance storm severity by maximizing the vertical θe lapse rate thereby increasing convective instability and parcel energy. The 1000–700 hPa θe lapse rate (K km−1) image in Figure 4a highlights the presence of a surface-based deep layer of potential instability extending from the Washington, DC, area northeastward to southeastern New York. This condition would have strongly suggested rapid storm intensification with passage from Virginia into Maryland. Another means by which a midlevel dry layer can enhance storm severity is through the process of entrainment of dry air into moist downdrafts. This process could result in evaporational cooling that increases the strength of downdraft and storm outflows thereby enhancing convergence along gust fronts and subsequent updraft redevelopment [8], and is further explored in Section 3 with the discussion of the role of the rear-flank downdraft in tornadogenesis.
Figure 5 shows the FNL analysis-generated sounding at 1800 UTC over College Park, three hours prior to the arrival of the supercell storm. The FNL generates a marginal elevated mixed layer (“EML”; Banacos and Ekster 2010) [9] between 600 and 750 hPa, in which the temperature lapse rate was greater than moist adiabatic, while the dew point curve was nearly parallel to a saturation mixing-ratio line. The EML above 750 hPa served as a cap to the southerly flow of high-θe air and potential instability (“PI”) and a source of higher-momentum, unsaturated air that could be ingested into the mid-levels of deep convective storms, as can be seen in Figure 5. This confirms the significance of a continued southerly supply of high θe air for a potentially unstable environment, given the presence of a deep shortwave trough to the west.
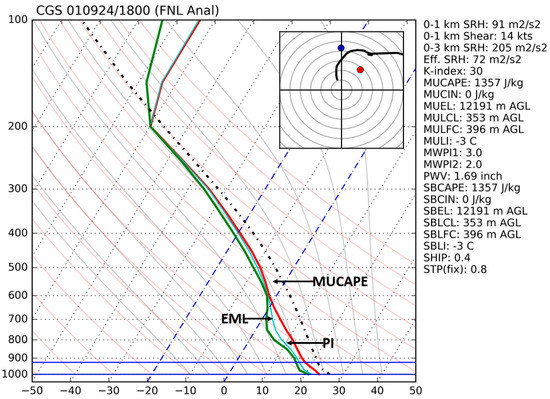
Figure 5.
NCEP FNL analysis-generated thermodynamic profile and computed parameters at 1800 UTC 24 September 2001 over College Park, with a hodograph in the upper right corner. “EML” and “PI” denote the presence of an elevated mixed layer and potential instability, respectively. Thin green and thick black dotted curves represent wet bulb temperature and parcel temperature, respectively. In the hodograph, Bunker’s Storm motion right mover is plotted as a red dot and left mover as a blue dot.
In addition to the presence of an EML and PI layer, the lower-to-middle tropospheric lapse rate and lifted condensation level (LCL) were considered as major factors for tornadogenesis. Craven and Brooks (2004) [10] noted in their study of sounding-derived parameters associated with deep moist convection that significant tornado environments featured 0–3 km above ground level (AGL) temperature lapse rates greater than 6 °C km−1 and mean layer LCL (MLLCL) heights below 1000 m. For the College Park tornado, a 0–3 km AGL lapse rate was calculated to be 7 °C km−1 while most unstable parcel LCL (MULCL) and MLLCL were calculated to be 353 m and 791 m, respectively. Large temperature lapse rates are often an indicator of an EML and promote strong conditional instability. Very low LCLs enhance tornado potential by limiting sub-cloud evaporation and decreasing the potential for cold outflow that could interfere with the developing mesocyclone [10].
Given the presence of the prevailing southwesterly flows in the lower troposphere (Figure 3 and Figure 4) and the near 2100 UTC observed surface temperature of 23.9 °C at the Washington Reagan National Airport (KDCA) and 22.2 °C at the Baltimore-Washington International Airport (KBWI) (not shown), we may hypothesize that the urban heat island (UHI) effects of Washington, DC, could play an important role in increasing convective available potential energy (CAPE) between 2000 and 2100 UTC over the Washington–College Park area, as the high θe airstream moved across the urban region. This hypothesis is based on the work of Zhang et al. (2011) [11], who showed that the “hot air” generated over Washington, DC, can be advected downstream to enhance the boundary-layer warmth (or CAPE in the present case) in College Park, Columbia, and even in Baltimore. Of course, a rigorous test of this hypothesis remains to be an interesting project for a future study.
In summary, the dynamic lifting mechanism resulting from the combination of PDVA and the eastward-advancing cold front, was amplified by potential instability associated with the lower-tropospheric θe ridge over the mid-Atlantic coastal region and served to stretch vertical air columns to generate low-level vorticity. An elevated, unsaturated layer of conditional instability between the 650 and 850 hPa levels, as detected by large temperature lapse rates, fostered RFD generation as this higher momentum air was ingested into the southern and western peripheries of the supercell. The presence of a very low altitude LCL acted as a limiting factor for downdraft and resulting storm outflow intensity and allowed for the unimpeded development of a low-level mesocyclone.
3. Radar and Satellite Morphology
Before showing the radar and satellite morphology, for completeness, it is desirable to describe the evolution of the supercell storm that produced the College Park tornado. The supercell was first seen at 1915 UTC (not shown). By 2045 UTC (Figure 6a), there were widespread intensifying deep convective storms over northern Virginia and central Maryland, apparent as a region of relatively high albedo in GOES-8 visible imagery (Setvak et al. 2003) [12]. The supercell storm had split over northern Virginia and was well within the right entrance region of an upper-level jet core. Its left-moving storm was weaker than the right-moving supercell and eventually dissipated by 2029 UTC. However, the right-moving supercell was maintained as a quasi-steady storm, in which three tornadoes were spawned. The first tornado (F0 intensity) had an 18 km path through Stafford and Prince William Counties between 2010 and 2032 UTC and touched down on Quantico Marine Base. The second tornado (F1 intensity) had a 25 km path from Fort Belvoir, Virginia, to the US Capitol in the District of Columbia, between 2044 and 2112 UTC. The right-flank supercell continued to track northeastward, steered by strong southwesterly flow aloft, as being evident by the large 500 hPa geopotential height gradient with southwest-to-northeast oriented height contours, and eventually produced the F3 College Park tornado. By 2115 UTC, as shown in the visible satellite imagery in Figure 6, the distinctive supercell storm emerged as the elongated shape in the southwest to northeast direction (Figure 6b), and as evidenced by the hodograph shown in Figure 5, was indicative of the strong shearing aloft associated with the jet stream. Overshooting thunderstorm tops were much more apparent as there was shadowing over the surrounding cloud mass to the east and northeast of the supercell near College Park, as well as to the east of a cluster of convective storms over northern Maryland. The development of the overshooting top near College Park was signifying the further intensification of convection associated with the supercell and the possibility that the storm was becoming severe, producing damaging winds and heavy rainfall.
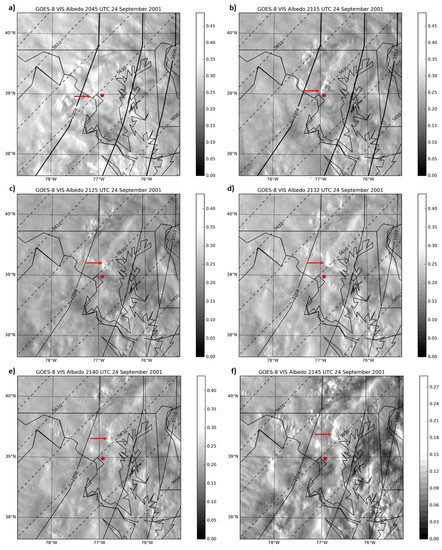
Figure 6.
GOES-8 visible albedo imagery over the mid-Atlantic coastal region with overlying sea-level pressure (hPa, solid) and 500 hPa geopotential height (m, dashed) at (a) 2045 UTC; (b) 2115 UTC; (c) 2125 UTC; (d) 2132 UTC; (e) 2140 UTC; and (f) 2145 UTC 24 September 2001. The red arrows mark the location of the College Park supercell.
A prominent overshooting top was still apparent in GOES-8 visible imagery in Figure 6c–f, as the supercell storm tracked rapidly northeastward ahead of the cold front, toward the Baltimore metropolitan area. During the time period 2125 to 2145 UTC, deep convection still continued to develop over the Atlantic coastal plain from northeastern North Carolina to southeastern Pennsylvania and tracked northeastward into a region of large vertical directional (veering) wind shear.
The GOES-8 infrared window channel imagery shown in Figure 7 also tracked important features of the College Park supercell during the time of development and evolution of the tornado. Specifically, the GOES-8 split window (channel 4–5) brightness temperature difference (BTD) imagery (Inoue 1987) [11] at a 4 km resolution, with a convective storm cloud mask applied that removed cirrus and warm, low-topped cumulus clouds, displayed a high level of detail in storm structure. This derived product was effective in identifying storm-scale features, including rough edge texture apparent as indentation on the southern and southwestern flanks of the storm during the tornadogenesis period, 2045 to 2125 UTC (marked by black arrows in Figure 8a–c). The BTD imagery was compared to NEXRAD reflectivity imagery, shown in Figure 8 and Figure 9, to demonstrate that near zero or slightly negative BTD values were associated with high radar reflectivity (>50 dBZ), and a series of notches on the southwestern (rear) periphery of the supercell storm was possibly associated with the mid-tropospheric intrusion of high momentum, unsaturated air into the precipitation core of the thunderstorm. This correspondence was especially apparent during the early part of the tornado’s track from College Park to Laurel. Facilitated by strong southwesterly winds of 20 to 25 m s−1 (40 to 49 kt) in the EML, as displayed by the hodograph in the sounding profile, the interaction of unsaturated environmental air with the heavy precipitation core likely provided downdraft energy for intense storm outflow winds that initiated and sustained the tornado. Markowski (2002) [13] reviewed the physical processes of RFD generation, the role of the RFD in the acceleration of the RF gust front, and the generation and enhancement of vertical vorticity at the interface between the RFD and rotating updraft. The combined effect of these processes results in the intensification of a low-level mesocyclone and subsequent tornadogenesis.
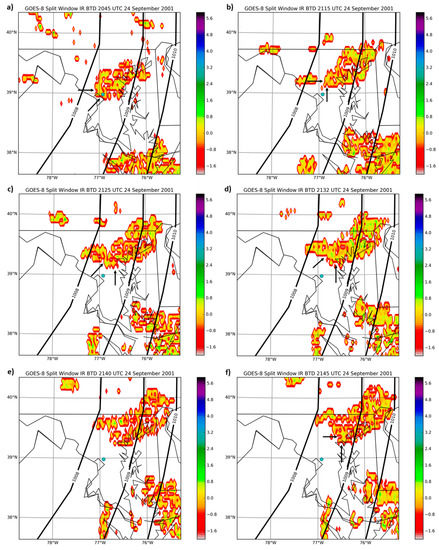
Figure 7.
GOES-8 split window infrared imagery over the mid-Atlantic coastal region with overlying sea-level pressure (hPa, solid) at (a) 2045 UTC; (b) 2115 UTC; (c) 2125 UTC; (d) 2132 UTC; (e) 2140 UTC; and (f) 2145 UTC 24 September 2001.
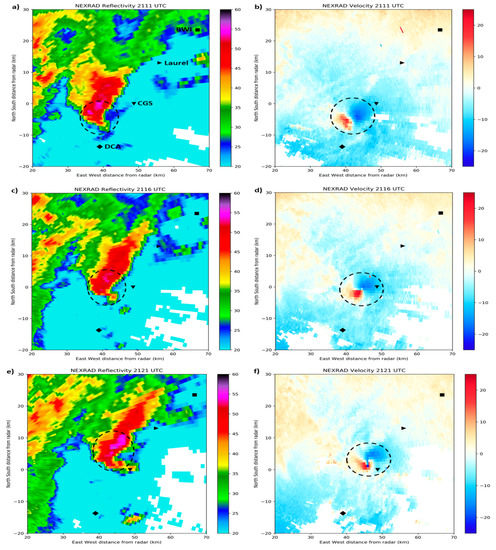
Figure 8.
Sterling, Virginia, 0.5° WSR-88D (NEXRAD) radar reflectivity factor (dBZ) and radial velocity (m s−1), respectively, on 24 September 2001 at (a–b) 2111 UTC; (c–d) 2116 UTC; and (e–f) 2121 UTC. Black diamonds, inverted triangles, right-pointing triangles, and squares mark the locations of Reagan (Washington) National Airport (“DCA”), College Park Airport (“CGS”), Laurel severe wind report, and Baltimore-Washington International Airport (“BWI”), respectively. Black dashed, closed curves mark the location of the parent supercell in the reflectivity factor imagery and the tornado signature (velocity couplet) in the radial velocity imagery.
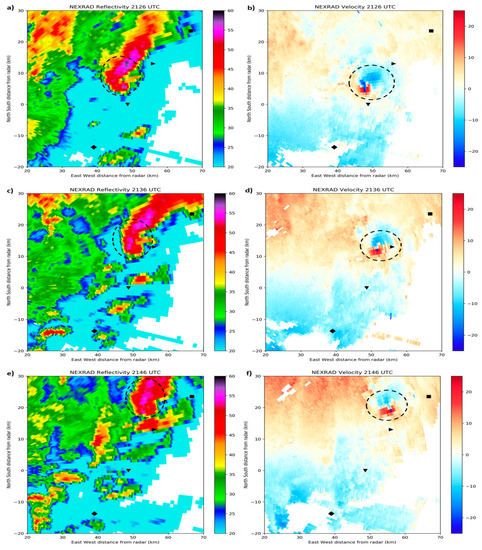
Figure 9.
Sterling, Virginia, 0.5° WSR-88D (NEXRAD) radar reflectivity (dBz) and velocity (m s−1), respectively, on 24 September 2001 at (a–b) 2126 UTC; (c–d) 2136 UTC; and (e–f) 2147 UTC. Black diamonds, inverted triangles, right-pointing triangles, and squares mark the locations of Reagan (Washington) National Airport (“DCA”), College Park Airport (“CGS”), Laurel severe wind report, and Baltimore-Washington International Airport (“BWI”), respectively. Black dashed, closed curves mark the location of the parent supercell in the reflectivity factor imagery and the tornado signature (velocity couplet) in the radial velocity imagery.
Scans of the College Park tornado were available from the Sterling, Virginia, WSR-88D (KLWX) radar. During its lifetime, the tornado was 39–59 km from KLWX. The centerline heights of the lowest elevation angle beam were approximately 400–700 m AGL for the KLWX radar which, operating in volume coverage pattern (VCP) 11 (scans at elevation angles up to 19.5° with updates every 5 min), collected reflectivity and velocity data continuously during the tornado.
Figure 8 and Figure 9 display a well-defined hook echo near the southern end of the supercell as it tracked across Washington, DC. The hook echo has been frequently identified as an indicator of the existence of an RFD that, through the processes of gust front acceleration and convergence, results in an increase in low-level vorticity concentration and subsequent tornadogenesis [13]. In addition, the increase in reflectivities in the hook echo, especially apparent between 2111 and 2126 UTC, was consistent with the development and evolution of a DRC, as identified in Figure 4 of Rasmussen et al. (2006) [2] and in Figure 2 of Kennedy et al. (2007) [3], respectively. As the supercell tracked northeastward, the hook echo developed a prominent “debris ball” at its eastern tip defining the location of the tornado (see Figure 8e,f). Higher radar reflectivities (i.e., >45 dBZ) in the debris ball, that would eventually constitute a tornadic debris signature (TDS) in a later generation of polarimetric Doppler radar [14], began at approximately 2121 UTC near College Park and continued beyond 2146 UTC, when the tornado was located near Columbia, Maryland. During the period of reflectivity maximum, the tornado traveled almost exclusively through populated areas in Maryland, including College Park, Beltsville, and Laurel, with a significant amount of debris being generated. Maximum reflectivities in the debris ball were approaching 60 dBZ at 2126 UTC, rivaling reflectivities observed in the parent supercell. Additionally, current use of dual-polarization radars has shown through tornadic debris signatures that, in many cases, the large reflectivity in the “ball” of the hook is consistent with damage from debris [14].
Brown et al. (1978) [15] identified and defined a tornado vortex signature (TVS) as a couplet of “mean Doppler velocity extrema that occur about one beamwidth apart, regardless of vortex size or strength”. In a similar manner, the associated TVS in the present case was readily apparent in radial velocity imagery between 2121 and 2146 UTC, in Figure 8f and Figure 9, as a couplet of azimuthally adjacent maximum outbound (red shading) and inbound (blue shading) velocities located near College Park. The TVS, just prior to tornado touchdown in College Park near 2120 UTC, was preceded by an increase in outbound velocity, observed to be near 24 m s−1 (48 kt) and 6 m s−1 larger than the inbound velocity at 2116 UTC (Figure 8d), as well as an increase in sharpness of the indentation on the southern flank of the storm as indicated by the BTD imagery in Figure 7b,c. The asymmetry of the TVS was likely due to the increasing translational motion of the parent supercell toward the northeast at 15 m s−1 (30 kt). Between 2136 and 2146 UTC (Figure 9c–f), non-tornadic (i.e., downburst) wind damage was observed in the Laurel area, where there was a break and subsequent westward shift in the tornado track. The TVS signature in radar could be associated with the presence of overshooting tops, thunderstorm cloud elongation, and rear-flank dry-air notches, as is apparent in GOES split window BTD imagery in Figure 7. At the end of the lifetime of the tornado, after tracking through the Columbia area, NEXRAD reflectivity imagery observed the evolution of the parent supercell to a bow echo (not shown). Note that the bow echo described herein was shorter lived with a smaller scale than that studied by Davis et al. (2004) [16] and did not result in any observations of severe winds or wind damage. In this case, the bow echo transition was most likely just a signification of weakening of the supercell storm.
Burgess et al. (2002) [17] defined the quantity of Delta-V as the TVS velocity difference (or storm-relative velocity). This strong correspondence could be well demonstrated in the present case. As displayed in Figure 8d, by 2116 UTC, the Delta-V had rapidly exceeded 40 m s−1 (80 kt) as the tornado was developing southwest of College Park and then continued to increase to near 50 m s−1 (100 kt) by 2121 UTC as the tornado reached F3 intensity (Figure 8f). A Peak Delta-V of greater than 50 m s−1 was observed at 2126 UTC (Figure 9b) as the tornado was tracking rapidly northeastward toward Beltsville. After 2130 UTC, Delta-V decreased to 40 m s−1 as the intensity of the tornado weakened to F2 (Figure 9d). By 2146 UTC (Figure 9f), the tornado, moving northeast toward Columbia, was near the end of its lifetime and its intensity had decreased to F1. Consequently, Delta-V decreased significantly to 40 m s−1. It was also observed that as the tornado intensified from F1 to F3, the TVS moved from a location on the left-front quadrant of the hook to the center of the TDS.
The reflectivity cross-section also displayed signatures that were highly indicative of tornadic activity (Figure 10). A distinctive bounded weak echo region (BWER) was present during the lifetime of the supercell. A complete description of the three stages in the evolution of a tornadic supercell are featured in Rotunno (1986) [6]. At 2116 UTC (Figure 10a), the mature supercell displayed the following characteristics: the echo top was at its maximum height (~10 km) with a well-defined BWER, suggesting the existence of a strong updraft and intensification of the mesocyclone as it was building down to the lower levels (and to the ground, based on the surface observations mentioned in Section 1). At this time, a hook echo was developing on the right rear flank, as indicated in the 2111 UTC reflectivity image (see Figure 8a). By 2121 UTC (Figure 10c), the BWER ceiling had lowered as it began to fill, indicating that the supercell was in a collapsing phase [6]. The 2121 UTC reflectivity (Figure 8e) reveals that the hook echo was “wrapping up” south and east of the parent cell, signifying the high probability of tornadic development. The development of the hook echo and BWER collapse demonstrated the intensification of the supercell downdraft and a surge of the gust front as it became highly contorted in the vicinity of the main updraft. This is consistent with the subsequent development of a bow echo structure (not shown). It was also apparent that the location of the tornado cyclone had moved toward the center of the mesocyclone.
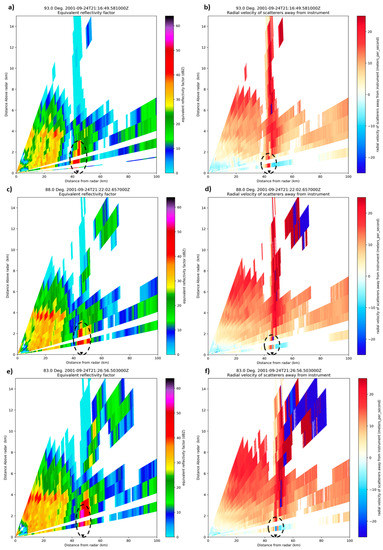
Figure 10.
Sterling, Virginia, WSR-88D (NEXRAD) cross-sections of reflectivity and radial velocity, respectively, on 24 September 2001 at (a–b) 2116 UTC; (c–d) 2122 UTC; and (e–f) 2126 UTC. Black dashed, closed curves mark the location of the parent supercell and inverted triangles mark the location of the tornado signature.
4. Summary and Conclusions
The 24 September 2001 College Park, Maryland, tornado is noteworthy because of its nearly 30 km length track, and it remains the only long-track event with an intensity of F3 or greater to directly impact on the greater Washington, DC, and adjacent suburban Maryland region since 2000. Employment of recently developed visualization techniques in Python revealed associated features that were identifiable on a number of spatial and temporal scales in satellite, radar, and NCEP’s FNL analysis datasets. The tornado featured many similarities to previous and more recent significant tornado events that resulted in widespread damage in urban areas.
The NCEP FNL data and GOES imagery on 24 September revealed many favorable mesoscale environment and critical elements of the College Park tornadic event: (a) an upper-level westward-tilted trough over the Ohio Valley region; (b) the development of deep convection ahead of a surface front over the mid-Atlantic states with widespread cirrus clouds associated with a jet stream; (c) breaks in the cirrus clouds over south-central and eastern Maryland revealing the presence of widespread cumulus congestus; (d) storm elongation and overshooting cloud tops associated with the supercell, indicative of intense, deep convection in a strongly shared environment; and (e) dry-air notches (intrusions) on the southern and western flanks of the supercell that indicated possible interaction of mid-tropospheric unsaturated air with the precipitation (especially ice phase) core. The entrainment of high-momentum, unsaturated air into the precipitation core is a typical forcing mechanism for an intense RFD and resulting strong surface outflow. The NCEP FNL analysis-derived upper-air soundings and vertical θe profiles exhibited strong potential instability with moderate CAPE over central Maryland to “feed” deep convection. A striking observation in the imagery was the intensification of the supercell as it moved into a progressively unstable environment and then the appearance of dry-air notches on the periphery of the storm at the approximate times that the supercell produced a tornado. We also hypothesized the possible role of the UHI effects from Washington, DC, in increasing CAPE for the development of the supercell storm associated with the College Park tornado, based on the work of Zhang et al. (2011) [11]. It should be mentioned that while the GOES imagery cannot reveal the development of a tornado, it does help track the evolution of tornado-producing supercell storms, as demonstrated in the present study. Of course, real-time Doppler radar data has to be used to monitor the development and evolution of a tornado, as summarized below.
Operational WSR-88D signatures in reflectivity and velocity were shown to have utility in detecting and monitoring the College Park tornado. The radar data revealed (a) a well-defined hook echo; (b) a high reflectivity “debris ball” (TDS) within the hook echo; (c) a tornado vortex signature (TVS) in the velocity data; (e) a large TVS velocity difference (>40 m s−1) at the approximate time of tornado touch-down; and (f) collapse of the bounded weak echo region (BWER) at the time of tornado development. In this case, the high-reflectivity debris ball of the hook echo was used to infer the presence of a damaging tornado [16]. The 24 September velocity signatures demonstrated a relationship to the strength of the flow surrounding the tornado. Finally, the evolution of the parent supercell to a bow echo signature was inferred as an indicator of the possible development of a downburst at the end of the tornado’s lifetime.
In conclusion, the coordinated use of satellite imagery, radar data, and operational modeling guidance at multiple spatial scales have helped the operational forecaster to reasonably predict the outbreak of severe convection as well as the development of the supercell/tornado that tracked through College Park during the afternoon of 24 September 2001. Numerical model guidance could provide a long-term outlook for conditions favorable for the development of severe convection several hours prior to the tornado event, while regional satellite imagery proved to be effective in indicating the existence of these conditions one to three hours prior to tornado touch-down in College Park. In the present case, NWP model data, specifically the FNL Operational Global Analysis, and satellite imagery identified a combination of forcing mechanisms that resulted in the development of the supercell that produced the College Park tornado. Finally, radar imagery proved to be an effective tool in monitoring the structural evolution of the supercell as well as the tornado that tracked through College Park. Of course, the above results are mostly a hindsight view, and they do not imply that any future tornado occurring over the Washington–Baltimore corridor or elsewhere could also be successfully predicted like the present case. Clearly, more research should be conducted in the future to improve the monitoring of tornadic storms through satellite and radar observations, and to improve the model initial conditions with more real-time high-resolution observations assimilated and the model physics parameterizations. Artificial intelligence (AI) methods, such as artificial neural networks (ANNs), have recently been proven effective in convective storm analysis and prediction. Early studies by McCann (1992) [18] and more contemporary studies by Collins and Tissot (2016) [19] have demonstrated the utility of ANNs in NWP model parameter evaluation to predict thunderstorm development. Considering recent advances in severe convective storm pattern recognition with the higher-resolution imagery of the GOES-R series (i.e., GOES-16), the neural network method could be feasible in the identification of supercell storm and tornado signatures and in short term prediction of storm development and tornadogenesis.
Author Contributions
Conceptualization, K.L.P. and D.-L.Z.; methodology, K.L.P. and D.-L.Z.; software, K.L.P. and T.W.; validation, D.-L.Z.; formal analysis, K.L.P.; investigation, K.L.P. and D.-L.Z.; resources, T.W.; data curation, K.L.P. and T.W.; writing—original draft preparation, K.L.P.; writing—review and editing, D.-L.Z.; visualization, T.W. and K.L.P.; supervision, D.-L.Z.; project administration, D.-L.Z.; funding acquisition, D.-L.Z.
Funding
This research and the APC were funded by US Office of Navy Research Grants N000141410143 and N000141712210.
Acknowledgments
The authors wish to thank Steven Zubrick of the National Weather Service Forecast Office, Sterling, Virginia, for providing a comprehensive radar dataset for analysis in this research effort.
Conflicts of Interest
The authors declare no conflict of interest.
Appendix A. Tornado Warning Issued by the NWS/Sterling Office at 0510 PM LST 24 September 2001
THE NATIONAL WEATHER SERVICE IN STERLING VIRGINIA HAS ISSUED A TORNADO WARNING FOR...
NORTHERN SOUTHEAST MONTGOMERY COUNTY IN CENTRAL MARYLAND
NORTHERN PRINCE GEORGES COUNTY IN CENTRAL MARYLAND
UNTIL 545 PM EDT
AT 506 PM EDT...NATIONAL WEATHER SERVICE DOPPLER RADAR INDICATED A TORNADO 6 MILES SOUTHWEST OF HYATTSVILLE...
MOVING NORTHEAST AT 35 MPH.
THE TORNADO IS EXPECTED TO BE... OVER HYATTSVILLE...
2 MILES NORTHWEST OF BLADENSBURG AT 516 PM
2 MILES SOUTHEAST OF ADELPHI...
2 MILES SOUTHEAST OF LANGLEY PARK AT 518 PM OVER COLLEGE PARK...
3 MILES SOUTHEAST OF HILLANDALE AT 520 PM
OVER GREENBELT AT 522 PM
OVER BELTSVILLE AT 524 PM
References
- National Weather Service. 2001: Storm Data and Unusual Weather Phenomena, September 2001. Available online: https://www.weather.gov/lwx/stormdata (accessed on 4 March 2019).
- Rasmussen, E.N.; Straka, J.M.; Gilmore, M.S.; Davies-Jones, R. A Preliminary Survey of Rear-Flank Descending Reflectivity Cores in Supercell Storms. Weather Forecast. 2006, 21, 923–938. [Google Scholar] [CrossRef]
- Kennedy, A.; Straka, J.M.; Rasmussen, E.N. A Statistical Study of the Association of DRCs with Supercells and Tornadoes. Weather Forecast. 2007, 22, 1191–1199. [Google Scholar] [CrossRef]
- Line, W.E.; Schmit, T.J.; Lindsey, D.T.; Goodman, S.J. Use of geostationary super rapid scan satellite imagery by the Storm Prediction Center. Weather Forecast. 2016, 31, 483–494. [Google Scholar] [CrossRef]
- Chaston, P.R. Weather Maps; Chaston Scientific, Inc.: Kearney, MO, USA, 1995; p. 167. [Google Scholar]
- Rotunno, R. Tornadoes and tornadogenesis. In Mesoscale Meteorology and Forecasting; Ray, P.S., Ed.; American Meteorological Society: Boston, MA, USA, 1986; pp. 414–436. [Google Scholar]
- McGinley, J. Nowcasting mesoscale phenomena. In Mesoscale Meteorology and Forecasting; Ray, P.S., Ed.; American Meteorological Society: Boston, MA, USA, 1986; pp. 657–688. [Google Scholar]
- Weisman, M.L.; Klemp, J.B. Characteristics of Isolated Convective Storms. In Mesoscale Meteorology and Forecasting; Ray, P.S., Ed.; American Meteorological Society: Boston, MA, USA, 1986; pp. 331–358. [Google Scholar]
- Banacos, P.C.; Ekster, M.L. The association of the elevated mixed layer with significant severe weather events in the Northeastern United States. Weather Forecast. 2010, 25, 1082–1102. [Google Scholar] [CrossRef]
- Craven, J.P.; Brooks, H.E.; Hart, J.A. Baseline climatology of sounding derived parameters associated with deep, moist convection. Natl. Weather Dig 2004, 28, 13–24. [Google Scholar]
- Zhang, D.-L.; Shou, Y.; Dickerson, R.; Chen, F. Impact of upstream urbanization on the urban heat island effects over the Washington-Baltimore metropolitan region. J. Appl. Meteorol. Climatol. 2011, 50, 2012–2029. [Google Scholar] [CrossRef]
- Setvák, M.; Rabin, R.M.; Doswell, C.A.; Levizzani, V. Satellite observations of convective storm tops in the 1.6, 3.7 and 3.9 μm spectral bands. Atmos. Res. 2003, 67, 607–627. [Google Scholar] [CrossRef]
- Inoue, T. A cloud type classification with NOAA 7 split-window measurements. J. Geophys. Res. Atmos. 1987, 92, 3991–4000. [Google Scholar] [CrossRef]
- Markowski, P.M. Hook echoes and rear-flank downdrafts: A review. Mon. Weather Rev. 2002, 130, 852–876. [Google Scholar] [CrossRef]
- Brown, R.A.; Lemon, L.R.; Burgess, D.W. Tornado detection by pulsed Doppler radar. Mon. Weather Rev. 1978, 106, 29–38. [Google Scholar] [CrossRef]
- Davis, C.; Atkins, N.; Bartels, D.; Bosart, L.; Coniglio, M.; Bryan, G.; Cotton, W.; Dowell, D.; Jewett, B.; Johns, R.; et al. The bow echo and MCV experiment: Observations and opportunities. Bull. Am. Meteorol. Soc. 2004, 85, 1075–1093. [Google Scholar] [CrossRef]
- Burgess, D.W.; Magsig, M.A.; Wurman, J.; Dowell, D.C.; Richardson, Y. Radar observations of the 3 May 1999 Oklahoma City tornado. Weather Forecast. 2002, 17, 456–471. [Google Scholar] [CrossRef]
- McCann, D.W. A neural network short-term forecast of significant thunderstorms. Weather Forecast. 1992, 32, 1209–1226. [Google Scholar] [CrossRef]
- Collins, W.G.; Tissot, P. Thunderstorm Predictions Using Artificial Neural Networks. In Artificial Neural Networks–Models and Applications; Rosa, J.L.G., Ed.; IntechOpen: London, UK, 2016. [Google Scholar] [CrossRef]
© 2019 by the authors. Licensee MDPI, Basel, Switzerland. This article is an open access article distributed under the terms and conditions of the Creative Commons Attribution (CC BY) license (http://creativecommons.org/licenses/by/4.0/).