Abstract
The first contact between precipitation and the land surface is often a plant canopy. The resulting precipitation partitioning by vegetation returns water back to the atmosphere (evaporation of intercepted precipitation) and redistributes water to the subcanopy surface as a “drip” flux (throughfall) and water that drains down plant stems (stemflow). Prior to the first benchmark publication of the field by Horton in 1919, European observatories and experimental stations had been observing precipitation partitioning since the mid-19th century. In this paper, we describe these early monitoring networks and studies of precipitation partitioning and show the impressive level of detail. Next to a description of the early studies, results included in this synthesis have been digitized and analyzed to compare them to recent studies. Although many early studies lack modern statistical analyses and monitoring tools that have become standard today, they had many strengths (not necessarily shared by every study, of course), including: A rigorous level of detail regarding stand characteristics (which is often lacking in modern ecohydrological studies); high-resolution spatiotemporal throughfall experiments; and chronosequential data collection and analysis. Moreover, these early studies reveal the roots of interest in precipitation partitioning processes and represent a generally forgotten piece of history shared by the hydrology, meteorology, forestry, and agricultural scientific communities. These studies are therefore relevant today and we hope modern scientists interested in plant-precipitation interactions will find new inspiration in our synthesis and evaluation of this literature.
1. Introduction
Much of Earth’s land surface is covered by vegetation: An estimated 30% is covered by forests [1], another 27% by grasslands [2], and croplands cover an additional 11% [3]. Thus, the first contact between precipitation and the land surface is often a plant canopy. Thereafter, precipitation may travel through various storage elements in the vegetated landscape—epiphytic plants [4], stems [5], understories [6], and litter layers [7]—before reaching the soil surface. The result of these “precipitation partitioning” processes is that a hydrologically-relevant portion of precipitation is returned to the atmosphere (interception) [8], a portion is redistributed as a subcanopy “drip” flux (throughfall), and a portion drains down plant stems (stemflow). By budgeting these different precipitation partitioning components, a better understanding of available soil water and river discharge [9], as well as a deeper subsurface recharge [10] is made possible. In view of the large parts of the globe covered by vegetation, its effect on the water cycle is of great importance [11].
Precipitation partitioning processes first achieved global attention through Robert Horton’s 1919 benchmark publication [12], which inspired a century of research on this topic to date. However, most of the 19th century scientific literature that inspired Horton is rarely cited today. In fact, nearly all pre-20th century studies on precipitation partitioning have not been cited for several decades—not even by comprehensive reviews on throughfall, stemflow or interception since the 1920s [13]. This literature, however, merits the attention of modern researchers, as it contains a substantial, well-documented set of results collected under diverse storm and site conditions that was analyzed thoughtfully and placed in broader hydrological, ecological and even political context. Moreover, these studies report observations of states and fluxes rarely investigated to date, like litter interception [14,15,16,17,18] and the partitioning of precipitation by crops and nonvascular vegetation (lichens and bryophytes) [16,18].
The diversity of plants and settings from which data were collected by these early precipitation partitioning researchers was necessarily rooted in their early motivation, land use change [19,20]. Compared to today land use changed substantially in Europe since the mid-19th century. Based on historical land change studies [21,22], efforts have been made to reconstruct past land cover. Fuchs et al. [21] for example reported that forest cover has increased by 25% since the 1950s within Europe. Fuchs et al. [22] reported forest and natural vegetation to have increased by up to about 22% in the period 1900 to 1990 based on different models. It can therefore be said that land use change in the mid 19th century was even more relevant than today with respect to forest cover and therefore clearly motivated researchers to investigate the effect of forests on climate and water.
By the end of the 19th century, enough observations had been collected, analyzed, and reported to enable multiple reviews on precipitation partitioning by vegetation [16,17,23,24]. In this paper, we perform another, modern review of this literature (German language sources) by (i) describing the methods and study sites, (ii) compiling and analyzing to contextualize results, (iii) sharing translated study motivations and interpretations of results, and then (iv) comparing 19th century findings to recent research. We hope that readers of this special issue will find new inspiration in these first observations of plant effects on net precipitation.
2. Forest Hydrometeorological Monitoring during the 19th Century
“The question of ‘How much precipitation reaches the forest soil compared to the open?’ has multiple scientific and practical implications, not just for silviculture but for hydrology in general. There is scarcely a more difficult obstacle to meteorological research than this, as forests are highly variable in species composition, age, height, and crown density, development, shape and closure.”E. Ebermayer, Munich, Germany [14]
In 1855, Dove [19] described the motivation to study the effect of forests on climate strikingly: “Nowhere on Earth does the physiognomy of the land change so rapidly as in the new world. Richly cultivated fields surround populated cities, where a few decades ago hardly a human sound interrupted the silence of the jungle. In this way, cultured landscapes interrupt the uniform forest cover so that, in the end, the forest disintegrates into isolated patches. How will this influence rainfall conditions? We do not know.” That same year, Krutzsch [20] suggested research be done on how “the rain falling on a forest is held up by the leaves and twigs and spread over a larger area, so that it arrives at the surface after a much longer time, at a much more gradual rates, and with much less force to the ground” because “This circumstance is not unimportant regarding the ability of soils to catch the rain.” Krutzsch [20], thus motivated by increasing rates of deforestation and forest-to-cropland conversion, aimed to investigate forests’ effects on the water cycle by establishing the first known national (at that time funded by the Kingdom of Saxony, now a federal state in Germany) observatory network for forest-meteorological observation. By 1862, the first experimental designs were complete for investigating how much precipitation (rain, snow, and rime) reached soils in vegetated landscapes (forests and crops) and field instruments had been deployed in Saxony, Germany [15]. Motivation for the Kingdom of Saxony to establish the first institutionalized forest-meteorological observatory network may principally stem from Hans Carl von Carlowitz’s 1713 treatise, which effectively argued that forest management was a key component of national environmental sustainability [25]. Soon after the installation of the Saxon forest-meteorological observatories, a similar national observatory network was deployed in seven sites throughout the (then, Kingdom of) Bavaria, Germany [14]. By the end of the 1860s, observatories for estimating precipitation partitions beneath forests and crops had been established throughout Europe [26,27,28,29] (Figure 1). Before 1870, measurements on throughfall (and its spatiotemporal variability), stemflow, litter leachate, and interception storage and evaporation components had begun (Supplementary Table S1 includes station coordinates).
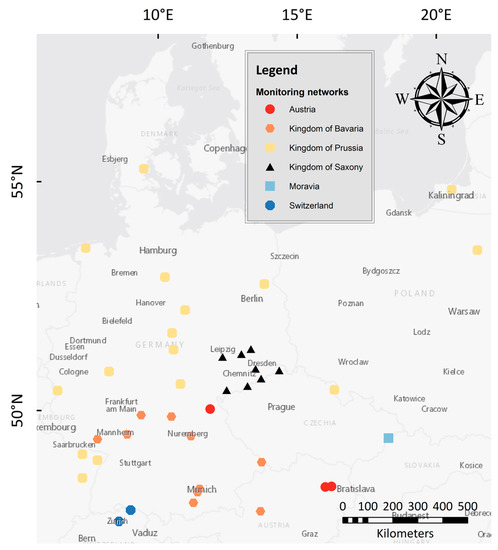
Figure 1.
Distribution of forest-meteorological stations in the 19th century. Many stations are associated with the national observatories of the Kingdoms of Saxony, Bavaria, and Prussia. These national observatories most probably had further stations not shown on the map. Further stations associated with Austria, Moravia, and Switzerland were not necessarily national observatories but individual experimental sites.
Standard methods to measure (and even terminology to describe) the states and fluxes in precipitation partitioning processes had not yet been established; however, a lack of standard methods for this subfield persists to date. The early methods designed and employed for the first national-scale forest-meteorological observatories by Krutzsch [30] and Ebermayer [14], were explicitly described, including sensor details, monitoring protocols, and payment schemes for field workers [14,30]. Field data collection was typically accomplished by the foresters and forest workers, rather than research assistants, students or the scientists themselves. In addition to many recent studies, this most probably also is the reason for the rather detailed tree age information listed in the studies (Table 1). Although the chronosequential dynamics of stemflow, throughfall, and interception have rarely been observed [31] and are, arguably, not yet well-conceptualized, nearly all early studies state stand age and many estimate all precipitation partitions across multiple stand ages (Table 1). Being part of national observatories, protocols for data management, analysis, and dissemination were also well described [15,32]. Specifically, forest hydrometeorological field data were sent to centralized depositories for analysis (to the “Royal Statistical Office” of the respective kingdom) at the end of each month. In Saxony, foresters responsible for field observations would also send data to the Royal Academy in Tharandt (which is still the location of the forestry department of Dresden University). After quality analysis and control procedures and compilation of datasets across sites by the centralized depositories, results were routinely published in the scientific section of the major newspaper (e.g., the Leipzig Newspaper in Saxony) to provide data dissemination. Protocols were so detailed that they included a decree from the Royal Ministry of Finance exempting all “meteorological letters and tables” from postage fees.

Table 1.
Summary of the early European studies included in this review, including the locations, species, age, flux studied (I: interception, T: throughfall, S: stemflow), and precipitation types (Ra: rain, Sn: snow, Mx: mixed rain-snow, Fo: fog, Ri: rime) studied. Figures and tables throughout this review are developed based on these studies. Studies are arranged chronologically.
Next to the national scale observatories of the Kingdoms of Saxony, Bavaria, and Prussia, several experimental stations existed that are summarized in Table 1 and shown in Figure 1. Locations were taken from the different literature references (e.g., [33]) and where coordinates were missing, the locations were researched using auxiliary information stated in the literature, e.g., vicinity to major landmarks such as hilltops or forest names. Table 1 provides a summary of publications cited by these reviews (scanned documents available on request from the corresponding author). Initially, stations were located in forest clearings next to the foresters’ lodges to test whether areas beside forests received greater precipitation (per [19]). Starting with the Grillenburg station in 1862 [15], these stations were later upgraded to include sub-canopy observations (at first only throughfall or litter leachate). Once stations were updated, sub-canopy (and even sub-litter layer) observations focused on the effect of precipitation partitioning on the water cycle [15,23]. Forests were studied as to their effect on available water resources, such as river flow [16]. Within this review the focus lies on precipitation partitioning data (an overview of the digitized data sources can be found in Supplementary Material Table S2); however, it is important to note that these early forest-meteorological networks included other complementary datasets (i.e., temperature and humidity below the canopy, or dynamics in litter and moss water content) and complementary studies (on evaporation and transpiration) [34]. As part of the motivation was to assess the effect of forest-to-cropland conversion on water availability, precipitation partitioning work was also done for crops [17] in order to compare with the forests’ effects on water resources.
Despite the exhaustive and detailed monitoring plans of these 19th century observatories, issues with the experimental design hampered the anticipated comparison of net precipitation datasets across sites and land uses, as well as the application of these datasets to water and forest management. Two major issues were that the national observatories began by (1) deploying only one or two gauges below the canopy for throughfall, and (2) stemflow was not measured (perhaps not even known to occur). It was not long until Carl Eduard Ney—a scientist, master-forester, and prolific naturalist writer and poet—emerged as the first advocate for stemflow research after recording the first stemflow observations (beginning March, 1870) in Ebermayer’s Bavarian network; unfortunately, his early data were lost after submission to the central depository [37]. The under-sampling of throughfall was continued for decades; however, resulting in many early studies reporting a wide range of confusing observations (well-known to modern scientists working on precipitation partitioning processes), including: Greater localized throughfall than open rainfall (i.e., spurious negative interception estimates), extremely low localized throughfall (i.e., spurious overestimates of interception), and the effect of snow redistribution below canopies [23,24,28]. The high fine-scale spatial variability of throughfall became obvious as experiments with a large number of gauges per tree (up to 12), including stemflow observations, were conducted in 1881 by Riegler [35] and later by Hoppe [38] (up to 30 gauges). Interestingly, the low number of gauges used in many studies (an issue that still has relevance today) was an explicit motivation for Hoppe’s high-resolution studies [38]. For historical context, we would like to note that nearly all studies explicitly mentioned that cost and physical access to study sites were major obstacles to expanding throughfall networks and including stemflow (see example discussions by Bühler [23] and Ney [37], respectively). This difficulty is made even more apparent by many studies containing statements praising the efforts of foresters to accomplish sampling campaigns—in some cases, where only 20 throughfall observations were recorded per storm per site: “The great effort and care required in these investigations is evident from the simple fact that, during the winter, no less than twenty gauges were in use, and the snow in half of them had to be transported for quite a distance and melted in rooms! Let us not deny that the observer, Forester Herzog, carried out this work with conscientiousness and reliability” [23].
In addition, it should be mentioned that we could find no laboratory observations, although a lab experiment about stemflow is briefly discussed by Riegler [35]. Thus, all experiments discussed here were conducted in situ. Many of these field studies, however, offer a wealth of ancillary data in terms of tree species, stand age, canopy architecture and density, storm type (e.g., convective or advective systems) and rainfall intensities. No details are known as to the selection of sites as well as the selection of trees (apart from their being major forest resource species), but it is fair to assume that no statistically advanced study design was used to select trees or position gauges. Data were also not analyzed statistically (besides averaged values), yet the data seems to be of very high quality especially with regards to their ancillary information. In fact, many studies leveraged their extensive metadata to provide detailed discussions on the potential effects of climate and phenology [16,24,37,38].
3. Canopy and Litter Interception
“How much rain reaches forest soils, how much is stored and how much evaporates, seems to me worthy of investigation in many respects. but, experiments must also question the value of forest litter water-absorbing and water-holding capability, as it clarifies why comparatively small amounts of rain can pass through the forest floor.”H. Krutzsch, Tharandt, Germany [15]
Although most research after 1900 focuses on the canopy interception component alone [39], leaving litter interception little researched [7], Krutzsch’s 1855 call for research on precipitation interception specifically noted the possible importance of litter [20]: “The fact that the humus-covered forest floor requires so much water before it is saturated makes it a main regulator of the flow of water to springs, streams and rivers.” Thus, Krutzsch began, with Blohmer (his forester colleague in Grillenburg, Germany), the first quantitative measurements of interception below the litter layer of a ~35 year-old Picea stand for 16 months in 1862–1863 [15,40]. Although the measurements consisted of one rain gauge buried beneath the litter “150 paces” from another single rain gauge in the open (both gauge openings were level with the soil surface), the first mean annual estimate of effective rainfall, 47% [15] was comparable to current estimates of litter interception [7]. Krutzsch [15] also provides individual data points to demonstrate the relationship between effective rainfall and storm magnitude (Table 2).
Table 2.
Storm rainfall amounts and the relative portion of rain that drained through Picea litter [15].
The first detailed litter interception study appears to have been done by Wollny [34], starting in 1886. Wollny’s litter interception estimates (Table 3) were made in the open, which he acknowledged resulted in a higher estimation than would be expected beneath forest cover, because “rain was much more frequent than in the forest, and drier litter took a greater part of the precipitation.” Pre-storm water content was even meticulously measured for the 5-cm thick litter layers and found to be lower than typical for forests, having decreased to 14.2% for pine needle litter, 13.1% for beech leaf litter, and 7.5% in mosses [34]. Still, many results in Table 3 agree with modern research [7,41]. For thicker litter layers during an average year, greater interception was reported for broadleaf litter than needleleaf litter (Table 3), which agrees with the most recent literature review of modern datasets [41]. Moss cover was also shown to greatly increase rainfall interception (Table 3), which agrees with recent observations that more broadly focus on all nonvascular plants, lichens and bryophytes [8].
Table 3.
Litter interception (as a percentage of annual rainfall) for three years which represented a dry, moderate, and wet year for rainfall (from [16,34]).
These first observations of rainfall interception by the litter were considered quantitatively significant and inspired new monitoring campaigns throughout Europe [24]. Since Krutzsch’s litter interception measurements (Table 2) were conducted in the open, scientists began reporting canopy rainfall interceptions estimates (almost always without consideration of stemflow) for a wide range of common forest and crop species (Figure 2a). At the stand scale, estimates of total annual rainfall interception by plant canopies varied markedly across the studied species, from 10% to nearly 50% (Figure 2a). At finer, sub-plot scales, spatial variability in rainfall interception were revealed to range from 0% beneath gaps to >90% beneath dense canopy [16,24,37,38]. For crops, 19th century scientists expected planting density to directly influence rainfall interception, but this did not always occur (Figure 2b,c). Wollny [17] was surprised to find that rainfall interception by oat canopies was consistent across a wide range of planting densities (Figure 2b); yet canopy rainfall interception did directly vary in response to increased planting density for maize (Figure 2c).
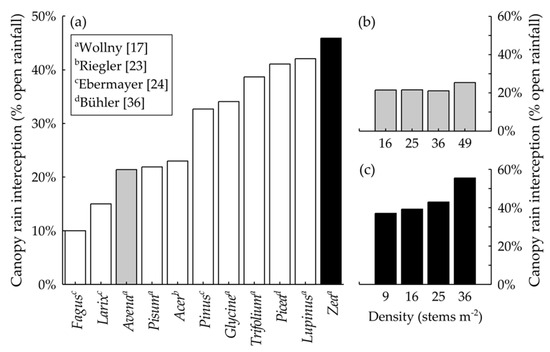
Figure 2.
(a) Annual (trees) or seasonal (crops) total rainfall interception by various types of plant canopies estimated across multiple study sites [17,23,24,35]. Wollny [17] also estimated canopy rainfall interception across typical planting densities of two common crops: (b) Oats and (c) maize.
Wollny’s [17] crop interception estimates, however, as Ney [16] points out, are likely to be overestimated because Wollny did not measure stemflow. The lack of stemflow observations across planting densities may have also masked important density-related dynamics in canopy rainfall interception by these crops. Although, to the authors’ knowledge, no crop stemflow observations existed at that time, Ney [16] states that “it is probable that more rainwater contacting crop canopies, with the exception of red clover, drain down the stalks to the ground than on beech trees” [Note: beech, Fagus sylvatica, was Ney’s archetype for a voluminous stemflow-generating plant, as will be discussed in a later section]. Even now, there are few observations of crop stemflow, but they confirm Ney’s [16] hypothesis, showing that maize, wheat, and other crops generally divert greater portions of rainfall to their stems than trees [42].
Early snow interception estimates, based on a limited number of observation points below the canopy (likely only one observation point, as the design was based on Ebermayer’s), were provided in the first annual report of the Prussian forest-meteorological station observations (for the study year 1875) by Müttrich [33] in 1877. Although the snow interception measurements were not adequately replicated (producing frequent large negative snow interception values in Table XII of the referenced report), Müttrich [33] provides detailed investigations of precipitation interception with regard to species-specific phenological observations (what he called “Phenomena of plant life” in Table XXXI of the referenced report). These phenological observations indicate the timing of “budswelling, first leaf, first flower, ripening of the first fruits, browning of the leaves, and complete defoliation.” Rigorous snow interception estimates were reported first for a single event (16 February 1884 [38]) for various tree species, which motivated the following full winter snow interception estimates the following year [43] (ranges indicate chronosequences, youngest to oldest per information provided in): Abies alba (47–74%), Picea abies (42–75%), Pinus sylvestris (25–44%), Larix decidua (17–30%), Fagus grandifolia (10–37%), Fraxinus excelsior and Alnus glutinosa (26%), Quercus robur (5–15%), coppiced hardwood stand (10–25%), and a fruit orchard (27%) [38]. Thus, Bühler [43] concluded that “Snow is almost always intercepted in larger quantities than by rain.”
In 1893, Ney [16] synthesized and evaluated hydrologic observations beneath the canopy, litter and moss cover from Wollny, Krutzsch, and Blohmer (among others) to develop a first full accounting of the canopy rainwater balance in monospecific broadleaf plantation forests. His account suggested that “the proportion of rainfall becoming litter leachate for a typical year may be 47% in summer, 17.4% in winter [when litter is thickest after senescence], and 32.2% at the annual scale; however, for exceptionally dry years (like 1887) assuming just a 5-cm-thick moss layer, this value will be <20%. With better accounting for variability, it may not even reach 10% of open rainfall.” A year later, Ney [37] presented the first estimate of total canopy water storage capacity (including the stem) based on in situ observation: 2-mm for a mature hardwood stand. This canopy water storage capacity estimate is within the range of other indirect estimates of similar forest canopies made from methods developed decades later, like the indirect regression-or submersion-based and direct stem compression- or sway-based methods [40,44].
4. Throughfall and its Spatiotemporal Variability
“There are silvicultural, water management and, therefore, forestry-political reasons why precipitation beneath forest canopies [i.e., throughfall] must be quantified.”A. Bühler, Zurich, Switzerland [23]
As described earlier, throughfall measurements in 19th century European observatories were generally under-replicated. Despite this, enough throughfall observations were collected across sites to enable basic comparisons between several species that may be of interest to modern researchers. For example, a compilation of the late 19th century reviews yields insight into the understanding, at the time, of how relative throughfall may vary: (i) Across forests of different canopy structures (Figure 3a); seasonally in regard to leaf habit (Figure 3b), and with tree age (Figure 3c). The annual estimates, which rely on larger sample size, show that leaf type alone (needleleaved versus broadleaved) is not a strong predictor of relative throughfall (Figure 3a). In fact, the range of annual relative throughfall estimates for three example needleleaved and broadleaved forest species, each, overlap a great deal, 55–85% and 65–90%, respectively (Figure 3a). Nineteenth century scientists were cautious to compare leaf types as they were aware of the methodological limitations; for instance, Hoppe [38] states that “The calculation of sound throughfall averages requires much more rain gauges than a single gauge installed anywhere within the forest stand.” This indicates that other canopy structural factors likely drive throughfall generation—a common conclusion of recent modern research focusing on the effects of intrinsic factors (like cuticular wax condition [45]) and extrinsic factors (like disease and air pollution [46]) on water retention in/release from forest canopies. Despite these early and modern observations, vegetation variables to predict precipitation partitioning into throughfall versus evaporation are still generally grouped into broad plant functional types [47], and efforts to transition from functional types to hydrologic traits have only recently begun [48].
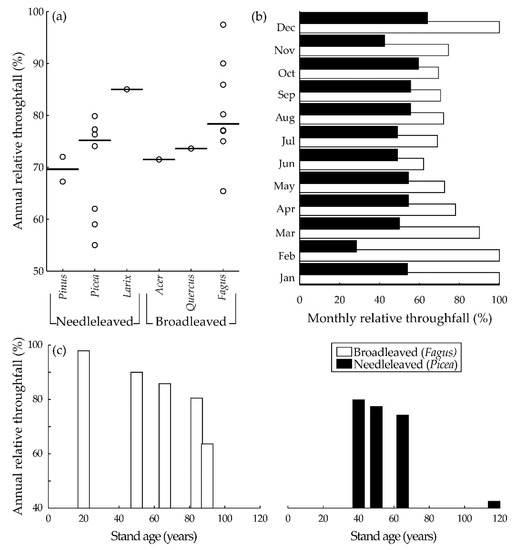
Figure 3.
The first summary of throughfall observations in Europe (Bavaria, Prussia, France, and Switzerland [24]) reported (a) a wide range of annual relative throughfall for needle- and broadleaved tree species. (b) Seasonal variability (monthly data collected over two years by Bühler [23]) in relative throughfall for an example needleleaved evergreen and broadleaved seasonal forest. (c) Relative throughfall across a chronosequence was also reported for P. abies and F. sylvatica [23,24,34].
The influence of seasonal leaf habit on relative throughfall was first observed and discussed by Bühler [23] at Haidenhaus (Switzerland) for 20-year old monospecific stands of an evergreen species, Picea abies, and deciduous species, Fagus sylvatica (Figure 3b). Each site had 10 gauges deployed throughout the year (for rain, snow, and mixed precipitation events)—a number that exceeded most deployments to that time and that was limited by “high costs and the difficulty of measurements in winter” [23]. Bühler explicitly discussed “where should the rain [i.e., throughfall] gages be set-up?” then justified his final sampling design (“gages were placed under the densest canopy cover”) and described its limitations (on pages 129–130 of [23]). Under these conditions, monthly relative throughfall observations throughout the year were generally consistent beneath the evergreen P. abies, but diminished 15–20% between the winter and summer seasons for the deciduous F. sylvatica (Figure 3b). For F. sylvatica, even the response of relative throughfall to transitions between seasons, now the so-called “phenoseasons,” can be observed, something rarely reported in modern studies [49,50,51].
Ebermayer’s review [24] synthesized Bühler’s [23] results with results from other P. abies and F. sylvatica stands, enabling a chronosequential evaluation of annual relative throughfall for two common forestry species (Figure 3c). As these forest stands matured annual relative throughfall decreased (Figure 3c). For both species, Ebermayer [24] found a sharp reduction in annual relative throughfall for the oldest stand (Figure 3b). The relatively larger proportion of throughfall beneath F. sylvatica compared to P. abies led Ebermayer to conclude that young F. sylvatica forests (and probably all deciduous trees) contribute more to the humidification of the soil by the precipitation than coniferous trees [24]. He states that “the leafless crowns of deciduous trees have little effect in winter and contribute much more to the increase in winter [soil] humidity, than the evergreen coniferous trees.” [24].
Inter-storm and seasonal variability in relative throughfall was not solely investigated in regards to leaf phenology, but also to storm magnitude and precipitation type (Table 4). From the start of 19th century Prussian forest-meteorological observatories, sampling protocols included snowstorms [15] and lengthy winter storms of mixed snow-rain occurrence were sampled [16,23]. Data for comparison among multiple precipitation types (rain, snow, and mixed rain-snow) were available for relative throughfall beneath canopy areas of different species, canopy density and, for P. abies, at two different stand ages (Table 4). Since the studied broadleaved species, F. sylvatica, was leafless during winter snowfall and subcanopy snow redistribution was not accounted for, all snow was believed to reach the surface (Table 4). For the evergreen P. abies, however, relative throughfall from snowstorms was significantly reduced compared to the open (Table 4). In many cases, mixed rain-snow storms produced the least relative throughfall beneath P. abies (Table 4). Indeed, the results listed in Table 4 were discussed by Bühler [23] to explain the reductions in relative throughfall beneath P. abies canopies during some months (e.g., November and February in Figure 3b). Throughfall under F. sylvatica were lowest during rainfall rather than under mixed rain-snow storms (Table 4)—possibly due to the mixed precipitation events occurring during times where the deciduous canopy was only partially leafed (late senescence and early budding). The influence of mixed precipitation events on throughfall generation has received little research attention to date [42], making these 19th century results a valuable contribution. For example, Table 4 indicates that throughfall generation from broadleaved deciduous canopies may differentially respond to mixed precipitation events than needleleaved evergreen canopies—a possibility that, to our knowledge, has not been investigated to date and raises interesting questions about the canopy water balance: e.g., is relative throughfall diminished during mixed precipitation events due to greater stemflow [52], or greater interception?, and, does the trade-off between throughfall, stemflow and interception during mixed storms vary with leaf and/or branch traits? Bühler’s [23] results also begin the examination into density-related fine-scale variability in relative throughfall patterns during mixed precipitation events.
Table 4.
Comparison of relative throughfall (% of gross precipitation) beneath canopy cover classified as “dense,” “light,” or “gap” from example broadleaf and needleleaf tree species across different precipitation types. Results from Bühler [23]. * Relative throughfall during the snow events was estimated beneath canopy areas when Fagus sylvatica was leafless.
In addition to data analyses at the annual and seasonal scales, relative throughfall was estimated at the inter-event scale [24]. Although it was difficult to delineate discrete storm events without being on-site at all times or without automated monitoring, these field observations were of high enough quality to reveal a common trend reported since the mid-20th century [53]: Increasing relative throughfall with storm magnitude until some constant value (Figure 4). Storms were generally grouped into storm size classes for analysis, hence the grouped storm sizes on the x-axis of Figure 4. The Aston [53] formula, which is commonly used to estimate canopy water storage capacity in hydrologic models [39], fits these data well (Figure 4). Relationships between three tree species’ relative throughfall and rainstorm magnitude also varied significantly (Figure 4).
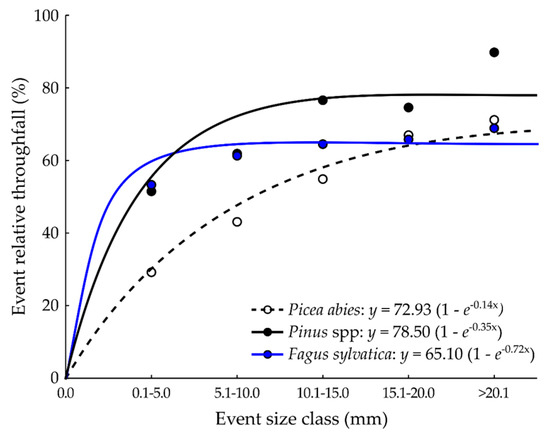
Figure 4.
Relative throughfall across event size classes as summarized for three different tree species in Ebermayer [24] (p. 300). Regressions per Aston [53] were fit to the data and plotted.
Attention was paid to spatial variability of throughfall as well. One of the earliest studies, by Riegler [35], deployed only three throughfall gages beneath isolated urban tree canopies (in Vienna, Austria) and noted throughfall’s high spatial variability: “It often happens that gauges beneath crowns receive greater precipitation than in the open due to the unequal distribution of water caused by the crowns.” By the 1890s, a discussion was recorded between Ney and Hoppe about the importance of estimating throughfall spatial variability and its relationship to overhead canopy structures [37], prompting Hoppe’s 1896 high resolution sampling campaign (30–45 gauges) [38]—the first known high-resolution throughfall and stemflow study. The throughfall gauges were not randomly distributed beneath the canopy, but deployed across 10 × 10 m plots in a cross-shape at different distances from tree stems. Hoppe [38] reported that fine-scale relative throughfall ranged widely, from 14–112% of open rainfall, and that the median relative throughfall amount at any location depended on the distance from the nearest stem (Figure 5). Since Hoppe [38], many modern studies have sought deterministic relationships between relative throughfall and forest structural variables, with contradictory results [54,55,56,57,58,59,60]. Current research efforts on drivers of fine-scale spatial variability have recently turned to the development of statistical tools to reduce sampling errors [57,61] and estimate spatial heteorogeneity [55,58]. A metric commonly applied to compare fine-scale spatial variability of throughfall (since Kimmins [56]) is the coefficient of variation (CV); yet, this metric may not be generally appropriate, as throughfall data are typically skewed and include extreme values where drip points persist [62]. Thus, the quartile coefficient of dispersion (CQV) may be more appropriate for estimating fine-scale variability of throughfall patterns.
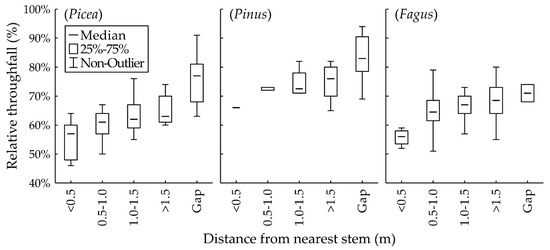
Figure 5.
Descriptive statistics of relative throughfall with varying distanced from the nearest tree stem for three tree species (Picea abies, Pinus Sylvestris, Fagus syvlativa) as reported by Hoppe [38]. For Pinus, Hoppe had only one observation <0.5 m and a narrow range of observations at the 0.5–1.0 m range, where the median falls on the lower box border.
The throughfall data reported by Hoppe [38] was used to estimate CV and CQV (i) at different distances from the nearest stem, (ii) for different rainstorm size classes and (iii) overall for three different species of contrasting leaf traits (Table 5). Overall, CV ranged from 51–38.3% and CQV from 0.7–23.4%, which agrees with throughfall variability reported by recent studies: From 14 to 134% from a German F. sylvatica forest [63] and 11–39% from a French Pinus forest [64]. For the most part, CV and CQV were inversely related to storm size across all species (Table 5), again agreeing with modern observations [63,64,65,66]. Across study species, throughfall variability was often higher beneath Picea abies than the other two species, and Pinus sylvestris canopies generated throughfall with the lowest spatial variability (Table 5). No apparent trends appear to exist in Hoppe’s [38] throughfall data with regard to spatial variability and proximity to the nearest stem (Table 5). Despite these detailed throughfall observations, internationally, Hoppe [38] is most commonly cited for its stemflow data, and it took >50 years before detailed spatial interpolation maps would be developed for throughfall in search of spatial structures, by Linskens [67,68] (an English version of this can be found in [62]).
Table 5.
The throughfall coefficient of variation and quartile coefficient of dispersion for three tree species, at different distances from the nearest stem and across different storm size classes per Hoppe [38].
5. The Rise of Stemflow
“…it can be assumed that different tree species, with great differences in branch structure and position, will very differently discharge precipitation down their stems.”W. Riegler, Vienna, Austria [35]
Once stemflow was recognized, equivalent research attention was given to this flux in comparison to throughfall and interception [16,24,34,35,37], which is surprising considering that stemflow was little-researched, compared to other precipitation partitioning fluxes, by modern scientists until the recent decade [69,70] and still is not integrated into any large-scale hydrologic or dynamic vegetation model [71,72]. The relative proportions of stemflow per unit canopy area were reported for common forestry and ornamental tree species of central Europe [11,23,29,30] (Figure 6a), and the range of relative stemflow reported in the literature reviews [11,22,23] was within, or near to, the range reported in more recent studies of these species: Pinus, 0.7% v 0.4–1.6% [73,74], Picea, 1.4% v 0.1–3.0% [75,76], Quercus, 5.7% v 0.9–3.5% [77], Acer, 6% v 0.6–4.8% [78,79,80], and Fagus, 12% v 4.9–11.5% [74,76,81] species. Ney [16,37] and Riegler [35] not only reported that stemflow yields increased after leaf senescence, but Ney [16] presented results showing that the stemflow response to storm size also changed with the canopy’s leaf state (Figure 6b). Hoppe [38] later reported substantial intraspecific stemflow variability (something rarely investigated to date [82,83,84,85]) and, after being unable to discover an obvious overarching driver of this stemflow variability, he discussed possible relationships between stemflow volume and tree architecture, including the relationship between the area receiving precipitation water (projected canopy area) and the area draining this water (stem base area) (Figure 6c). Ney [16], who worked with the national forestry service, also mentions that rime and dew were often found in forest gauges, where stemflow contributed to a 1.14 mm rime-melt event (Dec 9, 1869 in Johanneskreuz) and 0.08 mm of dew from a tree canopy. Most of these findings, particularly regarding stemflow generation under non-rainfall conditions, remain under-researched to date [38].
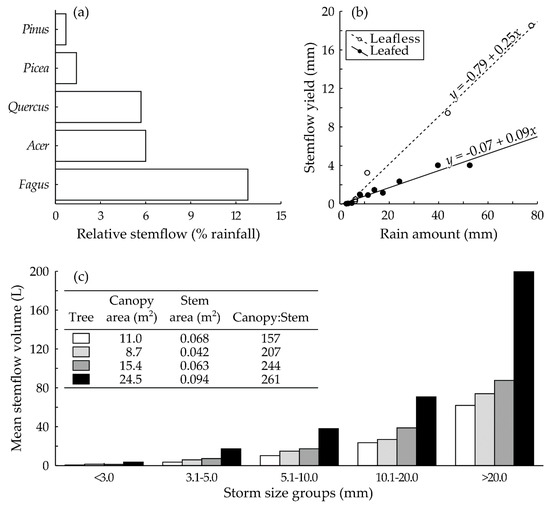
Figure 6.
Nineteenth century stemflow measurements and analysis from Riegler [35], Ney [16], Ebermayer [24], and Hoppe [38]. (a) Relative stemflow generated from example tree species [24,35] ranging from 0.7% to 12.8%. All species besides Pinus are from Riegler [35], Pinus is from Ebermayer p.300 [24]. (b) Positive linear relationships between rain amount and stemflow yield differ between leafed and leafless periods (p < 0.05 for both) from an example Fagus sylvatica tree from Ney [16]. (c) Mean stemflow volume across groups of storm size for four example F. sylvatica trees with differing canopy area to stem area relationships from Hoppe [38].
Arguably one of the most interesting aspects of stemflow research in the 19th century was that most researchers who measured stemflow or reviewed stemflow measurements mentioned its potential to be a concentrated water supply to soil moisture or to initiate runoff, despite its generally small percentage of precipitation across the canopy area [16,23,24,35,37]. Indeed, 19th century stemflow observers were quite keen. Very early (in 1881) the stemflow process was already conceptually described as a “funnel” [29] (similar to Herwitz [86] over a century later, in 1986). Researchers sought to describe the structure of the canopy “funnel” [35] and link these structures to variability in stemflow yield [16,37,38]. Although Ney was the first to measure stemflow, Riegler [35] was the first to discuss voluminous stemflow generation using the “funnel” analogy, writing that “The beech tree drained the most water down its trunk. Its full, branch-dense crown with branches oriented at acute angles were perfect for this purpose and concentrated rainwater like a funnel onto the trunk.” Later in the same publication, Riegler [35] expands his stemflow funneling analogy to describe the “double funneling” of stemflow down root pathways (similar to Johnson and Lehmann [87], in 2006) and the break-down of stemflow funneling (similar to Van Stan and Gordon [70], in 2018). Specifically, Riegler [35] wrote: “There are two opposing main types of tree structures: in the first, the branches of the trunk go askew upwards, converging against the trunk so that as many of them as possible feed precipitation water to the trunk; in the second, the branches emerge obliquely downwards from the trunk and therefore do not lead the water running down to them to the trunk Since, as a rule-of-thumb, the root system is an underground image of the crown—where trees of the first type are deep tap roots and of the second type, widespread secondary root systems—the result is important from a biological point of view. The tree’s branches appear principally directed to transport precipitation water where it can be best utilized by the root system. In other words: in the case of trees with taproots, a great deal of water flows down the trunk and penetrates near the trunk, into the ground to the taproot. Alternatively, trees with outstretched secondary roots divert water more abundantly to the branch ends and onto the ends of the radially-divergent root system. “
Continuing this interest in canopy architectural controls over stemflow generation, Hoppe [38] discussed, in detail over several pages, the canopy structures of the seven trees he outfitted for stemflow monitoring. As mentioned in the previous quote from Rieger, the shape of the funnel, particularly the ratio of canopy area to stem area explained some of the variability in Hoppe’s [38] stemflow data (Figure 6c). In Hoppe’s words, “Water volumes accumulated from the stem do not completely lack lawfulness; however different they may appear at the first moment, they seem, after all, to be dependent on the interaction of the stem size and crown development.” By the end of the 20th century, stemflow was considered a scientific priority by the early forest hydrologic research community. Indeed, a discussion recorded in Ney’s 1894 presentation to the then-prestigious Austrian Forestry Association on “the measurement of rainwater flowing down tree stems” concluded with the following statement: “I did not consider influences which may be the most powerful and therefore cannot be eliminated easily influences by species, age, density and quality, also by the climate, and last but not least, by the timing of leaf budding and senescence which vary with species and climate. These influences, whose significance require wide-ranging and continuous observation, can only be studied through international collaboration.” [37]. Hoppe is then recorded as continuing the discussion with the following call-to-action: This “task cannot be completed ‘in the storm’ [i.e., in haste], but rather by experimentation. Even an experiment designed and calculated with care can fail due to a small miscalculation, seemingly insignificant premise, or minimal obstacle. Therefore, I propose to the research institutes whose representatives have come together today to leave this question on the agenda and come back to it later. Until then some preliminary studies, for example the establishment of a research station, should be carried out. Only after that, when the method and instruments have been tested, should we move with full force towards a larger, extensive investigation and final solution of this very pressing issue” [37]. Again, many of the influences that Hoppe and Ney suggested the scientific community investigate and discuss in 1894, remain under-researched to this day. This may be, in part, due to his call for standardized stemflow methods and instrumentation also remaining un-answered to this day.
6. Conclusions
“I am already quite satisfied if we are able to prove numerically that the differences between the rain gauges have to be corrected by about 40 or 60% to calculate the loss that the forest soil and springs suffer due to rainfall intercepted by tree canopies. Whether it is now exactly 51 or 59, I don’t care. Today we do not really know whether it is 20 or 80%.”C.E. Ney, Brunswick, Germany [37]
Much of our current conceptual understanding of how precipitation is intercepted and routed to the surface below vegetation canopies was known before the turn of the 20th century. Beginning at the top of the canopy, rainwater storage capacity (including the stem component) and total interception, including interception by some herbaceous, short vegetation and various broadleaf, needleleaf, and mossy litter layers had been estimated. Throughfall spatiotemporal variability and its relation to storm size and select forest structural variables had been reported for multiple major forestry species of various leaf traits and seasonal habits. Before 1900, two decades of weekly-to-discrete storm-scale stemflow observations had been collected across European observatories and paired with detailed (albeit qualitative) canopy architectural analyses. Moreover, stemflow’s funneling capability, the canopy conditions under which stemflow’s funneling can fail, and its potential relevance at/below the surface had been discussed and suggested as a future research priority. All precipitation partitions had been recorded and analyzed across seasons (including transitional leaf states) and across chronosequences for various tree species. These observations also included multiple precipitation and condensation types: Rain, snow, mixed rain-snow, fog, rime, and dew. Despite methodological limitations, the magnitude of observations and estimates agree well with results from modern field research and yield similar relationships to those found (and applied) by modern studies. The presented studies are arguably relevant today, as they confirm the results of modern studies and, perhaps more importantly, furnish a unique lens into the roots of interest in precipitation partitioning processes. Of course, some of what was done in the 19th century is antiquated nowadays; but, many of the data and objectives that these early researchers had would be a welcome addition to future work.
Supplementary Materials
The following are available online at https://www.mdpi.com/2076-3263/9/10/423/s1, Table S1: Station names and coordinates of the observatories and experimental stations plotted in Figure 1, Table S2: Overview of the data sources of digitized data including auxiliary information.
Author Contributions
Conceptualization, J.F. and J.T.V.S.II; acquisition and scanning of literature, J.F.; digitization of select datasets, J.F. and J.T.V.S.II; writing—original draft preparation, J.T.V.S.II and J.F.; writing—review and editing, J.F. and J.T.V.S.II.
Funding
No funding supported the development of this manuscript.
Acknowledgments
We gratefully acknowledge the enthusiastic assistance of Johanna C. Metzger and Iris K. Busch.
Conflicts of Interest
The authors declare no conflict of interest.
References
- FAO. Global Forest Resources Assessment. Main Report, FAO Forest Paper 163. 2010. Available online: http://www.fao.org/3/i1757e/i1757e00.htm (accessed on 28 September 2019).
- Suttie, J.M.; Reynolds, S.G.; Batello, C. Grasslands of the World. Food & Agriculture Org., 2005. Available online: http://www.fao.org/3/y8344e00.htm (accessed on 28 September 2019).
- Alexandratos, N.; Bruinsma, J. World Agriculture towards 2030/2050: The 2012 Revision. ESA Working paper FAO, Rome. 2012. Available online: https://ideas.repec.org/p/ags/faoaes/288998.html (accessed on 28 September 2019).
- Van Stan, J.T.; Pypker, T.G. A review and evaluation of forest canopy epiphyte roles in the partitioning and chemical alteration of precipitation. Sci Total Environ 2015, 536, 813–824. [Google Scholar] [CrossRef]
- Hutchings, N.; Milne, R.; Crowther, J. Canopy storage capacity and its vertical distribution in a sitka spruce canopy. J. Hydrol. 1988, 104, 161–171. [Google Scholar] [CrossRef]
- Black, T.; Kelliher, F.M. Processes controlling understorey evapotranspiration. Philos. Trans. R. Soc. Lond. B Biol. Sci. 1989, 324, 207–231. [Google Scholar] [CrossRef]
- Gerrits, A.; Savenije, H. Forest floor interception. In Hydrology and Biogeochemistry of Forest Ecosystems; Levia, D.F., Carlyle-Moses, D.E., Tanaka, T., Eds.; Springer: Berlin, Germany, 2011; pp. 445–454. [Google Scholar]
- Porada, P.; Van Stan, J.T.; Kleidon, A. Significant contribution of non-vascular vegetation to global rainfall interception. Nat. Geosci. 2018, 11, 563. [Google Scholar] [CrossRef]
- Spencer, S.A.; van Meerveld, H.J. Double funnelling in a mature coastal British Columbia forest: Spatial patterns of stemflow after infiltration. Hydrol. Process. 2016, 30, 4185–4201. [Google Scholar] [CrossRef]
- Tanaka, T. Effects of the Canopy Hydrologic Flux on Groundwater. In Hydrology and Biogeochemistry of Forest Ecosystems; Levia, D.F., Carlyle-Moses, D.E., Tanaka, T., Eds.; Springer: Berlin, Germany, 2011; pp. 499–518. [Google Scholar]
- Savenije, H.H.G. The importance of interception and why we should delete the term evapotranspiration from our vocabulary. Hydrol. Process. 2004, 18, 1507–1511. [Google Scholar] [CrossRef]
- Horton, R.E. Rainfall interception. Mon. Weather. Rev. 1919, 47, 603–623. [Google Scholar] [CrossRef]
- Zon, R. Forest and Water in the Light of Scientific Investigation; Forest Service, United States Department of Agriculture. United States Government Printing Office: Washington, DC, USA, 1927; 106p.
- Ebermayer, E. Die Physikalischen Einwirkungen des Waldes auf Luft und Boden und seine klimatologische und Hygienische Bedeutung: Begründet Durch die Beobachtungen der Forst.-Meteorolog. Stationen im Königreich Bayern; C. Krebs: Aschaffenburg, Germany, 1873; Volume 1, 1253p. [Google Scholar]
- Krutzsch, H. Die zu forstlichen Zwecken eingerichteten meteorologischen Stationen und die Resultate der Beobachtungen im Jahre 1863. Tharandter forstliches Jahrbuch 1863, 16, 216–226. [Google Scholar]
- Ney, C.E. Der Wald und die Quellen; F. Pietzcker: Tübingen, Germany, 1893; 101p. [Google Scholar]
- Wollny, E. Untersuchungen über das Verhalten der atmosphärischen Niederschläge zur Pflanze und zum Boden. Forschungen auf dem Gebiete der Agricultur-Physik 1890, 13, 316–356. [Google Scholar]
- Wollny, E. Forschungen auf dem Gebiete der Agricultur-Physik. Available online: https://archive.org/details/bub_gb_WJZPAAAAIAAJ/page/n7 (accessed on 28 September 2019).
- Dove, H. Ueber die Vertheilung der Regen in der gemässigten Zone. Annalen der Physik 1855, 170, 42–59. [Google Scholar] [CrossRef]
- Krutzsch, H. Ueber den Einfluß der Waldungen auf die Regenverhältnisse der gemäßigten Zone. Tharander forstliches Jahrbuch 1855, 11, 123–141. [Google Scholar]
- Fuchs, R.; Herold, M.; Verburg, P.H.; Clevers, J.G.P.W. A high-resolution and harmonized model approach for reconstructing and analysing historic land changes in Europe. Biogeosciences 2013, 10, 1543–1559. [Google Scholar] [CrossRef]
- Fuchs, R.; Herold, M.; Verburg, P.H.; Clevers, J.G.; Eberle, J. Gross changes in reconstructions of historic land cover/use for Europe between 1900 and 2010. Glob. Chang. Biol. 2015, 21, 299–313. [Google Scholar] [CrossRef] [PubMed]
- Bühler, A. Die Niederschläge im Walde. Mitt. d. Schweiz. Centr. Anst. f. forstl. Versuchswesen. 1892, 127–160. [Google Scholar]
- Ebermayer, E. Untersuchungs-Ergebnisse über die Menge und Vertheilung der Niederschläge in den Wäldern. Forstl. Naturw. Ztschr. 1897, 6, 283–291. [Google Scholar]
- Von Carlowitz, H.-C. Sylvicultura oeconomica oder Haußwirthliche Nachricht und Naturmäßige Anweisung zur Wilden Baum-Zucht. Johann Friedrich Braun, Leipzig. 1713. Available online: https://reader.digitale-sammlungen.de/de/fs1/object/display/bsb10214444_00002.html (accessed on 28 September 2019).
- Clavé, J. Étude de météorologie forestière. Revue des Deux Mondes (1829-1971) 1875, 9, 632–649. [Google Scholar]
- Fernow, B.E. A Brief History of Forestry in Europe, The United States and other Countries; University Press: Toronto, ON, Canda, 1913. [Google Scholar]
- Johnen, A.; Breitenlohner, J. Comparative Beobachtungen der Niederschläge nach Fautrat’s Methode. Akademische Verlagsgesellschaft 1879, 8, 16–19. [Google Scholar]
- Maurice, A.; Frécaut, R. Hydrologie fluviale de l’europe continentale. Revue Géographique de l’Est 1962, 2, 411–428. [Google Scholar] [CrossRef]
- Krutzsch, H. Über die zu forstlichen Zwecken in Sachsen eingerichteten meteorologischen Stationen. Tharandter Forstl. Jahrb. 1863, 15, 72–104. [Google Scholar]
- Sadeghi, S.M.M.; Van Stan, J.T.; Pypker, T.G.; Friesen, J. Canopy hydrometeorological dynamics across a chronosequence of a globally invasive species, ailanthus altissima (mill., tree of heaven). Agric. For. Meteorol. 2017, 240–241, 10–17. [Google Scholar] [CrossRef]
- Bruhns, C. Resultate aus den meteorologischen Beobachtungen angestellt an mehreren Orten im Königreich Sachsen in den Jahren 1826 bis 1861 und an den königl. sächsischen Stationen im Jahre 1866; Ernst Julius Günther: Leipzig, Germany, 1868. [Google Scholar]
- Müttrich, A. Jahresbericht Über die Beobachtungs-Ergebnisse der im Königreich Preussen und in den Reichslanden Eingerichteten Forstlich-Meteorologischen Stationen; Julius Springer: Berlin, Germany, 1877. [Google Scholar]
- Wollny, E. Forstlich-meteorologische Beobachtungen. Zweite Mittheilung. Forschungen auf dem Gebiete der Agricultur-Physik 1890, 13, 134–184. [Google Scholar]
- Riegler, W. Beobachtungen über die Abfuhr meteorischen Wassers entlang den Hochstämmen. Mitteilungen der forstlichen Bundes-Versuchsanstalt Wien 1881, 2, 234–246. [Google Scholar]
- Bühler, A. Studien nach dem Schneefall vom 16. Februar 1884. Forstwissenschaftliches Centralblatt 1885, 7, 236–239. [Google Scholar]
- Ney, C.E. Über die Messung des an den Schäften der Bäume herabfliessenden Regenwassers. Mitt. ad forstl. Versuchswesen Österr 1894, 17, 115. [Google Scholar]
- Hoppe, E. Regenmessung unter Baumkronen; 75 p. W. Frick: Wien, Austria, 1896. [Google Scholar]
- Muzylo, A.; Llorens, P.; Valente, F.; Keizer, J.J.; Domingo, F.; Gash, J.H.C. A review of rainfall interception modelling. J. Hydrol. 2009, 370, 191–206. [Google Scholar] [CrossRef]
- Krutzsch, H. Untersuchungen über die Waldstreu. Forstwirtschaftliches Jahrbuch. Königl.-Sächs. Akademie für Forst- und Landwirthe zu Tharand. 1850, 6, 88–110. [Google Scholar]
- Klamerus-Iwan, A.; Link, T.; Keim, R.; Van Stan, J., II. Storage and routing of precipitation through canopies. In Precipitation Partitioning by Vegetation: A Global Synthesis; Van Stan, J., II, Gutmann, E., Friesen, J., Eds.; Springer Nature: Berlin, Germany, 2019. [Google Scholar]
- Sadeghi, S.; Gordon, A.; Van Stan, J., II. A global synthesis of throughfall and stemflow hydrometeorology. In Precipitation Partitioning by Vegetation: A Global Synthesis; Van Stan, J., II, Gutmann, E., Friesen, J., Eds.; Springer Nature: Berlin, Germany, 2019. [Google Scholar]
- Bühler, A. Der Waldbau nach wissenschaftlicher Forschung und praktischer Erfahrung: Ein Hand-und Lehrbuch; University of Michigan Library: Ann Arbor, MI, USA, 1918; Volume 1. [Google Scholar]
- Friesen, J.; Lundquist, J.; Van Stan, J.T. Evolution of forest precipitation water storage measurement methods. Hydrol. Process. 2015, 29, 2504–2520. [Google Scholar] [CrossRef]
- Klamerus-Iwan, A.; Błońska, E. Seasonal variability of interception and water wettability of common oak leaves. Ann. For. Res. 2016, 60, 63–73. [Google Scholar] [CrossRef]
- Klamerus-Iwan, A.; Witek, W. Variability in the wettability and water storage capacity of common oak leaves (quercus robur l.). Water 2018, 10, 695. [Google Scholar] [CrossRef]
- Matthes, J.H.; Goring, S.; Williams, J.W.; Dietze, M.C. Benchmarking historical cmip5 plant functional types across the upper midwest and northeastern united states. J. Geophys. Res.: Biogeosci. 2016, 121, 523–535. [Google Scholar] [CrossRef]
- Matheny, A.M.; Mirfenderesgi, G.; Bohrer, G. Trait-based representation of hydrological functional properties of plants in weather and ecosystem models. Plant Divers. 2017, 39, 1–12. [Google Scholar] [CrossRef] [PubMed]
- Sadeghi, S.M.M.; Van Stan, J.T.; Pypker, T.G.; Tamjidi, J.; Friesen, J.; Farahnaklangroudi, M. Importance of transitional leaf states in canopy rainfall partitioning dynamics. Eur. J. For. Res. 2018, 137, 121–130. [Google Scholar] [CrossRef]
- Staelens, J.; De Schrijver, A.; Verheyen, K. Seasonal variation in throughfall and stemflow chemistry beneath a european beech (fagus sylvatica) tree in relation to canopy phenology. Can. J. For. Res. 2007, 37, 1359–1372. [Google Scholar] [CrossRef]
- Van Stan, J.T.; Levia, D.F., Jr.; Inamdar, S.P.; Lepori-Bui, M.; Mitchell, M.J. The effects of phenoseason and storm characteristics on throughfall solute washoff and leaching dynamics from a temperate deciduous forest canopy. Sci. Total Environ. 2012, 430, 48–58. [Google Scholar] [CrossRef] [PubMed]
- Levia, D.F. Differential winter stemflow generation under contrasting storm conditions in a southern new england broad-leaved deciduous forest. Hydrol. Process. 2004, 18, 1105–1112. [Google Scholar] [CrossRef]
- Aston, A. Rainfall interception by eight small trees. J. hydrol. 1979, 42, 383–396. [Google Scholar] [CrossRef]
- Helvey, J.; Patric, J. Canopy and litter interception of rainfall by hardwoods of eastern united states. Water Resour. Res. 1965, 1, 193–206. [Google Scholar] [CrossRef]
- Keim, R.F.; Skaugset, A.E.; Weiler, M. Temporal persistence of spatial patterns in throughfall. J. Hydrol. 2005, 314, 263–274. [Google Scholar] [CrossRef]
- Kimmins, J. Some statistical aspects of sampling throughfall precipitation in nutrient cycling studies in british columbian coastal forests. Ecology 1973, 54, 1008–1019. [Google Scholar] [CrossRef]
- Lloyd, C.; Marques, A.D.O. Spatial variability of throughfall and stemflow measurements in amazonian rainforest. Agricul. For. Meteorol. 1988, 42, 63–73. [Google Scholar] [CrossRef]
- Voss, S.; Zimmermann, B.; Zimmermann, A. Detecting spatial structures in throughfall data: The effect of extent, sample size, sampling design, and variogram estimation method. J. Hydrol. 2016, 540, 527–537. [Google Scholar] [CrossRef]
- Wilm, H.G. Determining net rainfall under a conifer forest. J. Agricul. Res. 1943, 67, 501–513. [Google Scholar]
- Zimmermann, A.; Zimmermann, B.; Elsenbeer, H. Rainfall redistribution in a tropical forest: Spatial and temporal patterns. Water Resour. Res. 2009, 45. [Google Scholar] [CrossRef]
- Zimmermann, A.; Zimmermann, B. Requirements for throughfall monitoring: The roles of temporal scale and canopy complexity. Agricul. For. Meteorol. 2014, 189, 125–139. [Google Scholar] [CrossRef]
- Van Stan, J.T., II; Hildebrandt, A.; Friesen, J.; Metzger, J.C.; Yankine, S.A. Spatial variablity and temporal stability of local net precipitation patterns. In Precipitation Partitioning by Vegetation: A Global Synthesis; Van Stan, J., II, Gutmann, E., Friesen, J., Eds.; Springer Nature: Berlin, Germany, 2019. [Google Scholar]
- Metzger, J.C.; Wutzler, T.; Dalla Valle, N.; Filipzik, J.; Grauer, C.; Lehmann, R.; Roggenbuck, M.; Schelhorn, D.; Weckmüller, J.; Küsel, K. Vegetation impacts soil water content patterns by shaping canopy water fluxes and soil properties. Hydrol. Process. 2017, 31, 3783–3795. [Google Scholar] [CrossRef]
- Loustau, D.; Berbigier, P.; Granier, A.; Moussa, F.E.H. Interception loss, throughfall and stemflow in a maritime pine stand. I. Variability of throughfall and stemflow beneath the pine canopy. J. Hydrol. 1992, 138, 449–467. [Google Scholar] [CrossRef]
- Holwerda, F.; Scatena, F.; Bruijnzeel, L. Throughfall in a puerto rican lower montane rain forest: A comparison of sampling strategies. J. Hydrol. 2006, 327, 592–602. [Google Scholar] [CrossRef]
- Zimmermann, B.; Zimmermann, A.; Lark, R.M.; Elsenbeer, H. Sampling procedures for throughfall monitoring: A simulation study. Water Resour. Res. 2010, 46. [Google Scholar] [CrossRef]
- Linskens, H. Niederschlagsmessungen unter verschiedenen baumkronentypen im belaubten und unbelaubten zustand. Plant Biol. 1951, 64, 214–220. [Google Scholar]
- Linskens, H. Niederschlagsverteilung unter einem Apfelbaum im Laufe einer Vegetationsperiode. Ann. Meteorol. 1952, 1/2, 30–34. [Google Scholar]
- Levia, D.F.; Germer, S. A review of stemflow generation dynamics and stemflow-environment interactions in forests and shrublands. Rev. Geophys. 2015, 53, 673–714. [Google Scholar] [CrossRef]
- Van Stan, J.T.; Gordon, D.A. Mini-review: Stemflow as a resource limitation to near-stem soils. Front. Plant Sci. 2018, 9. [Google Scholar] [CrossRef] [PubMed]
- Murray, S.; Watson, I.; Prentice, I. The use of dynamic global vegetation models for simulating hydrology and the potential integration of satellite observations. Prog. Phys. Geogr. 2013, 37, 63–97. [Google Scholar] [CrossRef]
- Gutmann, E.D. Global modeling of precipitation partitioning by vegetation and their applications. In Precipitation Partitioning by Vegetation: A Global Synthesis; Van Stan, J., II, Gutmann, E., Friesen, J., Eds.; Springer Nature: Berlin, Germany, 2019. [Google Scholar]
- Vanguelova, E.I.; Benham, S.; Pitman, R.; Moffat, A.J.; Broadmeadow, M.; Nisbet, T.; Durrant, T.; Barsoum, N.; Wilkinson, M.; Bochereau, F.; et al. Chemical fluxes in time through forest ecosystems in the UK – Soil response to pollution recovery. Environ. Pollut. 2010, 158, 1857–1869. [Google Scholar] [CrossRef] [PubMed]
- Aussenac, G. Interception des précipitations par le couvert forestier. Ann. Sci. forest. 1968, 25, 135–156. [Google Scholar] [CrossRef]
- Ovington, J.D. A comparison of rainfall in different woodlands. For.: Int. J. For. Res. 1954, 27, 41–53. [Google Scholar] [CrossRef]
- Nihlgard, B. Precipitation, Its Chemical Composition and Effect on Soil Water in a Beech and a Spruce Forest in South Sweden. Oikos 1970, 21, 208–217. [Google Scholar] [CrossRef]
- Herbst, M.; Rosier, P.T.W.; McNeil, D.D.; Harding, R.J.; Gowing, D.J. Seasonal variability of interception evaporation from the canopy of a mixed deciduous forest. Agric. For. Meteorol. 2008, 148, 1655–1667. [Google Scholar] [CrossRef]
- Matthew, S.M. Hydrological and Biogeochemical Fluxes of Throughfall and Stemflow in Temperate Swamps. Master’s Thesis, Department of Geography and Planning, University of Toronto, Toronto, ON, Canada, 2015. [Google Scholar]
- Buttle, J.M.; Farnsworth, A.G. Measurement and modeling of canopy water partitioning in a reforested landscape: The Ganaraska Forest, southern Ontario. Can. J. Hydrol. 2012, 466–467, 103–114. [Google Scholar] [CrossRef]
- Freedman, B.; Prager, U. Ambient bulk deposition, throughfall, and stemflow in a variety of forest stands in Nova Scotia. Can. J. For. Res. 1986, 16, 854–860. [Google Scholar] [CrossRef]
- Bittner, S.; Talkner, U.; Krämer, I.; Beese, F.; Hölscher, D.; Priesack, E. Modeling stand water budgets of mixed temperate broad-leaved forest stands by considering variations in species specific drought response. Agric. For. Meteorol. 2010, 150, 1347–1357. [Google Scholar] [CrossRef]
- Levia, D.F.; Michalzik, B.; Näthe, K.; Bischoff, S.; Richter, S.; Legates, D.R. Differential stemflow yield from european beech saplings: The role of individual canopy structure metrics. Hydrol. Process. 2015, 29, 43–51. [Google Scholar] [CrossRef]
- Su, L.; Xu, W.; Zhao, C.; Xie, Z.; Ju, H. Inter-and intra-specific variation in stemflow for evergreen species and deciduous tree species in a subtropical forest. J. Hydrol. 2016, 537, 1–9. [Google Scholar] [CrossRef]
- Van Stan, J.T.; Levia, D.F. Inter- and intraspecific variation of stemflow production from fagus grandifoliaehrh. (american beech) and liriodendron tulipiferal. (yellow poplar) in relation to bark microrelief in the eastern united states. Ecohydrology 2010, 3, 11–19. [Google Scholar]
- Van Stan, J.T.; Lewis, E.S.; Hildebrandt, A.; Rebmann, C.; Friesen, J. Impact of interacting bark structure and rainfall conditions on stemflow variability in a temperate beech-oak forest, central Germany. Hydrol. Sci. J. 2016, 61, 2071–2083. [Google Scholar] [CrossRef]
- Herwitz, S.R. Infiltration-excess caused by stemflow in a cyclone-prone tropical rainforest. Earth Surf. Process. Landf. 1986, 11, 401–412. [Google Scholar] [CrossRef]
- Johnson, M.S.; Lehmann, J. Double-funneling of trees: Stemflow and root-induced preferential flow. Ecoscience 2006, 13, 324–333. [Google Scholar] [CrossRef]
© 2019 by the authors. Licensee MDPI, Basel, Switzerland. This article is an open access article distributed under the terms and conditions of the Creative Commons Attribution (CC BY) license (http://creativecommons.org/licenses/by/4.0/).