Abstract
Canopy throughfall comprises the largest portion of net precipitation that is delivered to the forest floor. This water flux is highly variable across space and time and is influenced by species composition, canopy foliage, stand structure, and storm meteorological characteristics. In upland forests throughout the central hardwoods region of the Eastern United States, a compositional shift is occurring from oak-hickory to more mesic, shade-tolerant species such as red maple, sweetgum, and winged elm. To better understand the impacts of this shift on throughfall flux and the hydrologic budget, we monitored throughfall for one year in Northern Mississippi under the crowns of midstory and overstory oak (post oak and southern red oak) and non-oak species (hickory, red maple, and winged elm). In general, oak had more throughfall than co-occurring non-oak species in both canopy levels. In the overstory during the leaf-off canopy phase, white oak had relatively higher throughfall partitioning (standardized z-score = 0.54) compared to all other species (z-score = −0.02) (p = 0.004), while in the leaf-on canopy phase, red maple had relatively lower throughfall (z-score = −0.36) partitioning compared to all other species (z-score = 0.11). In the midstory, red maple was the only species to exhibit a difference in throughfall between canopy phases, with much lower throughfall in the leaf-off compared to the leaf-on canopy phase (z-score = −0.30 vs. 0.202, p = 0.039). Additionally, throughfall under oak crowns was less variable than under non-oak crowns. These results provide evidence that the spatial and temporal distribution of throughfall inputs under oak crowns are different than non-oak species, likely due to differences in crown architecture (i.e., depth and density). As oak dominance diminishes in these forests, it is possible that the portion of rainfall diverted to throughfall may decrease as well. The net impacts to watershed hydrology are still unknown, but these results provide one mechanism by which the distribution of water resources may be affected.
1. Introduction
In upland hardwood forests throughout the Eastern United States, there has been a shift in dominance from oak (Quercus spp.) to shade-tolerant species such as maples (both Acer rubrum and A. saccharum), ashes (Fraxinus spp.), and elms (Ulmus spp.) [1,2,3]. This shift may be caused by “mesophication” a hypothesized feedback loop by which systematic exclusion of the natural fire regime has allowed fire-sensitive, and often shade-tolerant, species (aka “mesophytes”) to establish and create cooler, moister, and darker understory conditions that are unfavorable for oak regeneration and survival [4]. These compositional shifts may impact the hydrologic budget at the watershed scale. For example, mesophytes have higher rates of transpiration compared to co-occurring oaks, such that an increase in mesophyte dominance increased watershed evapotranspiration losses by 29%, leading to a reduction in watershed yield by 22% [5]. While differences in physiology between oaks and non-oaks have been shown to modify the hydrologic regime, species-specific differences in canopy structure may also contribute to changes in water inputs, thus affecting the overall water budget.
The majority of precipitation that passes through the forest canopy and contributes to net inputs of water at the forest floor is termed throughfall. Throughfall generally constitutes about 70% of bulk precipitation, with a much smaller portion, less than 5%, delivered to the forest floor along tree trunks (i.e., stemflow), and the remainder (~25%) intercepted by the forest canopy and evaporated back to the atmosphere [6,7,8]. However, these percentages are highly variable across space and time due to storm meteorological conditions, stand conditions, and species-specific structural characteristics. For example, in deciduous forests, throughfall is lower when foliage is present because leaves provide additional surfaces for water interception, compared to when foliage is absent [9]. Likewise, denser forest stands with more canopy layers have less throughfall than sparser stands or those with fewer canopy layers. At the individual tree level, species with glabrous leaf coatings shed water more easily than those with rough surfaces, reducing leaf interception and increasing throughfall [10,11]. Other leaf characteristics, such as orientation and shape, can influence the ability of individuals to shed or intercept rainwater [12,13].
The importance of species-level traits on the net inputs of precipitation to the forest floor has been investigated, but largely in the context of the sampling accuracy when species biodiversity is high [14,15,16]. Other studies have focused on throughfall variability under a single tree crown [17,18]. At the stand- to landscape-scale, the distribution of species has been shown to exert an influence on throughfall variability based on topographic position [19]. Ultimately though, topographic position determined species composition, and differences in canopy structure among species were the driving cause of the differences in throughfall observed [19].
Canopy and bark characteristics of mesophytes may be sufficiently different than that of co-occurring oaks to create a redistribution of water resources to the forest floor. For example, Alexander and Arthur [20] showed that red maples have 4–12% less throughfall and +250% more stemflow than oaks in an upland oak-hickory forest in Kentucky. Siegert et al. [21] also observed significant increases in stemflow from red maple and hickory across sites in Mississippi. Along with previous stemflow studies comparing bark morphology to stemflow production [22,23], these results provide initial evidence that mesophytic species not only create understories with lower light levels, but also redirect water to soils in the immediate vicinity of their tree boles, which may further reduce the flammability of the landscape. What is less clear is whether crown architecture or leaf water storage characteristics of mesophytes differ from those of oak, and whether changes in stand-level species composition will alter the spatial and temporal input of throughfall as well. As such, this study sought to quantify the spatial and temporal variability of throughfall beneath the crowns of oak and co-occurring non-oak species in relation to canopy structural characteristics. An improved understanding of controls on the forest hydrologic cycle among species can provide hydrologists and other land managers with better tools to manage forests for water resources.
2. Materials and Methods
2.1. Site Description
The study was conducted in an upland forest at Spirit Hill Farm in Northwestern Mississippi (34.6661 N, 89.7004 W) located in the North Central Hills physiographic district. The mean 30-year temperatures for this southern temperate climate are 15.3 °C, with average winter (DJF) temperatures of 4.9 °C and average summer (JJA) temperatures of 25.1 °C [24]. Annual 30-year precipitation is 1490 mm, with nearly all precipitation occurring as rainfall [24]. The soils on the site are Ruston fine sandy loams, which are very deep, well drained, moderately permeable that formed in loamy marine or stream deposits [25].
2.2. Field Methods
The species composition of the site is typical of upland oak-hickory stands throughout the Southeastern United States and is dominated by multiple species of both genera. Southern red oak (Q. falcata) from the Section Lobotae (i.e., red oaks) was selected as the dominant red oak species. White oak (Q. alba) from the Section Quercus (i.e., white oaks) was selected as the dominant white oak species. Non-oak species selected for study were mockernut hickory (Carya tomentosa), red maple, and winged elm (Ulmus alata). Six individuals of each species were located in each of three replicate 350 m2 plots at the study site, with three individuals in the midstory and three individuals in the overstory (Table 1). Midstory trees were defined as trees with a measurable diameter at breast height (DBH) (i.e., the tree was taller than breast height, 1.3 m) but a DBH < 10 cm. Overstory trees were defined as trees with DBH > 10 cm. Red maple was infrequently found in the overstory at this site, but due to its reputation in the literature as a mesophyte reaching co-dominant canopy positions in forests throughout the Eastern United States [20,26,27,28,29], was included in this study. Winged elm was not found in the overstory at all.

Table 1.
Overstory and midstory species (abbreviations given in parentheses) selected for study with mean ± standard error of diameter at breast height (DBH), basal area (BA), crown area (CA), and density.
Throughfall gauges were constructed from 3.8 L polyethylene collectors fitted with a 12.5 cm diameter funnel. Underneath each overstory tree, one throughfall gauge was deployed adjacent to the tree bole and a second throughfall gauge was deployed at distance midway between the tree bole and crown edge, termed “mid-crown”. In the midstory, due to the small size of tree crowns, a single gauge was deployed at the mid-crown point. Throughfall volume was measured at 4-week intervals, after which the gauges were emptied and placed back in the same position.
Monthly throughfall volume was converted into a depth equivalent through the equation:
where D is the depth equivalent in cm, V is the volume of throughfall in cm3, and A is the orifice area of the throughfall gauge in cm2. In order to compare across sampling periods and rainfall amounts, throughfall depth was standardized to a z-score through the equation:
where is the throughfall z-score for each gauge during the sampling interval, is the mean depth of all throughfall gauges for a sampling interval, and is the standard deviation of all throughfall gauges for a sampling interval.
Linear mixed models were used to explore the impact of species, canopy leaf phase, and collector position on TFz. In the overstory, species, canopy leaf phase, and collector positions and their interactions were fixed effects, while individual trees within a species were a random effect. We chose to use a mixed model in order to incorporate individual trees and their repeated measurement as random effects. In this way, we are able to explain variation across species while the model accounts for variation within a species. Models were run using the lmer function in R and fit using the restricted maximum-likelihood criterion [30]. Least-Squares Means post-hoc pairwise comparisons were performed when statistical differences in sample means were detected (α = 0.05) using the emmeans package in R [31]. In the midstory, only species and canopy leaf phase were set as fixed effects because there was only one gauge per tree. Prior to model development, TFz was tested to meet the assumptions of normality and homogeneity of variance. In the overstory, TFz was not normally distributed, so it was cube root transformed. Transformed TFz values were used for statistical analysis but un-transformed TFz values are presented in figures for ease of interpretation.
To assess throughfall variability, the coefficient of variation (CV) was calculated with the equation:
where σ is the standard deviation of throughfall depth and µ is the mean throughfall depth for each species during each sampling interval, and by collector location for overstory species. Linear models were used to explore the impact of throughfall depth, species, leaf canopy phase, and collector position on CV.
3. Results
3.1. General Throughfall Trends
From winter 2017/18 through winter 2018/19, throughfall was monitored approximately monthly for a total of 12 sampling periods. Total rainfall over the period was 203.3 cm and total throughfall, averaged across species and gauge location, was 181.3 cm (89.2%) (Table 2). During the sampling period November 2017 through February 2019, more throughfall than rainfall was recorded at the study site, which could be due to a highly localized storm cell that impacted the study site but not the meteorological station.
Table 2.
Summary of rainfall depth and midstory and overstory throughfall depth and percent of total rainfall collected in approximately 4-week intervals over the study period.
Linear mixed models were developed separately for overstory and midstory species to test the effects of canopy leaf phase and gauge position on throughfall distribution. In the overstory, TFz differed between species (p = 0.025) and as an interaction between species and canopy leaf phase (p = 0.006) (Table 3). Overall, white oaks had higher TFz than other species (Figure 1), which means that partitioning of throughfall by white oaks was greater than the average across both the leaf-off and leaf-on canopy phases. Specifically, in the leaf-off canopy phase, white oak had relatively higher throughfall partitioning compared to all other species. In the leaf-on canopy phase, white oak had more similar throughfall partitioning while, red maple had relatively lower throughfall partitioning compared to all other species (Figure 1). All species except southern red oak exhibited a decrease in TFz from the leaf-on canopy phase to the leaf-off canopy phase, with the largest decrease in white oak. The primary interaction of species and leaf phase was between southern red oak and white oak, whereby TFz was different between the two species in the leaf-off canopy phase (p = 0.004) but not during the leaf-on canopy phase (p = 0.923). Among species, mid-canopy throughfall gauges had marginally greater standardized throughfall than gauges located next to tree boles (mid-canopy = 0.152 vs. Bole = 0.035, p = 0.104).
Table 3.
Summary of generalized linear mixed model results using standardized z-scores for throughfall.
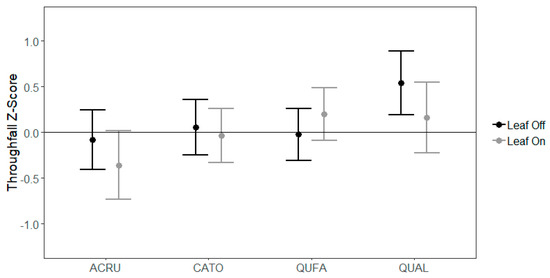
Figure 1.
Mean throughfall z-scores (TFz) with standard error bars for overstory species. Species codes: ACRU = red maple, CATO = mockernut hickory, QUFA = southern red oak, QUAL = white oak.
In the midstory, TFz was not different among species (p = 0.233) and was only marginally different due to canopy leaf phase (p = 0.077), with clear differences exhibited as an interaction between species and leaf phase (p = 0.052). In the leaf-off canopy phase, TFz was lower (−0.225) compared to the leaf-on canopy phase (−0.078). Red maple was the only species to exhibit a difference in throughfall partitioning between canopy phases, with much lower throughfall in the leaf-off canopy phase compared to the leaf-on (−0.303 vs. 0.202, p = 0.039) (Figure 2).
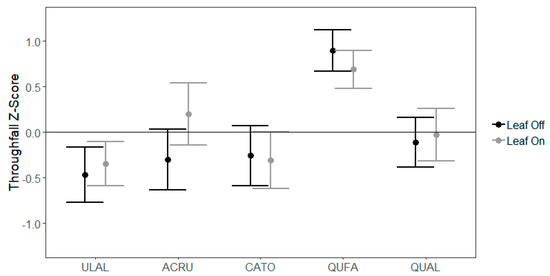
Figure 2.
Mean throughfall z-scores (TFz) with standard error bars for midstory species. Species codes: ACRU = red maple, ULAL = winged elm, CATO = mockernut hickory, QUFA = southern red oak, QUAL = white oak.
3.2. Species-Level Variability
For overstory species, the coefficient of variation in throughfall was lower in the leaf-off canopy phase than in the leaf-on canopy phase (11.0 vs. 16.5) (p = 0.002) (Figure 3). Red maple and white oak had the highest overall CVs (15.5 and 15.1, respectively), followed by hickory (12.5) and southern red oak (11.9), although there was no difference in the regression equations among species (p = 0.120) (Figure 3). In the leaf-on canopy phase, throughfall depth was a moderate predictor of CV (r2 = 0.11, p = 0.068, y = −0.35x + 20.88) such that as throughfall increased, the variability among gauges decreased. However, throughfall depth was not a strong predictor of CV in the leaf-off canopy phase (r2 = 0.00, p = 0.466).
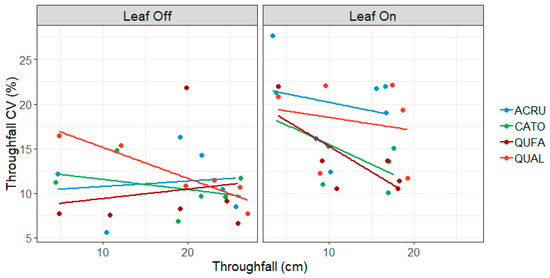
Figure 3.
Coefficient of variation (CV) in overstory throughfall by leaf phase and species. Species codes: ACRU = red maple, CATO = mockernut hickory, QUFA = southern red oak, QUAL = white oak.
In the midstory, red maple and hickory had the greatest CV (15.8 and 14.6, respectively), followed by white oak (13.0), winged elm (12.4), and southern red oak (7.8). Similar to the overstory, CV was greater in the leaf-on canopy phase (14.3) compared to the leaf-off canopy phase (11.3). In the leaf-off canopy phase, there was essentially no relationship between throughfall quantity and throughfall CV (r2 = 0.00, p = 0.717) (Figure 4). In the leaf-on canopy phase, all species exhibited a decrease in CV with increasing throughfall quantity (r2 = 0.28, p = 0.060, y = −0.04x + 4.67). Interestingly, the CV of southern red oak increased with increasing throughfall, leading to a predictive model significantly different than the other species (p = 0.012).
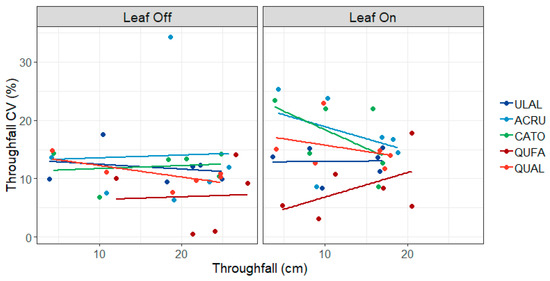
Figure 4.
Coefficient of variation (CV) in midstory throughfall by leaf phase and species. Species codes: ACRU = red maple, ULAL = winged elm, CATO = mockernut hickory, QUFA = southern red oak, QUAL = white oak.
3.3. Gauge-Level Variability
During the leaf-off canopy phase, throughfall gauges underneath crowns of white oaks consistently had higher standardized throughfall quantities (Figure 5A,B). For gauges located next to tree boles, six out of eight of the highest median z-scores were white oaks, while red oaks and hickories often had z-scores near zero (Figure 5A). For gauges underneath the mid-crown point, five of the top eight gauges were underneath white oak crowns (Figure 5B). Gauges underneath hickory crowns ranked lower at the mid-crown point compared to next to tree boles. During the leaf-on canopy phase, non-oak species had the lowest z-scores in four out of five gauges located next to tree boles (Figure 5C) and at mid-crown points (Figure 5D).
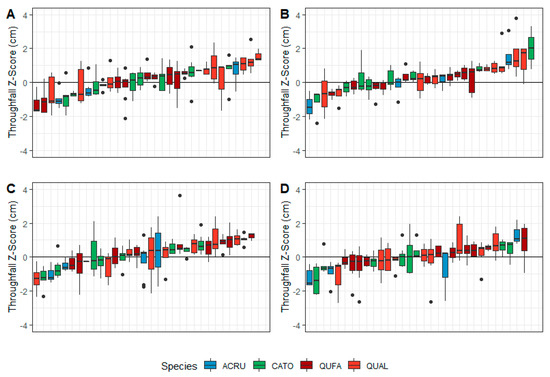
Figure 5.
Rank of overstory throughfall gauges by species and median z-score in the (A) leaf-off canopy phase next to the tree bole, (B) leaf-off canopy phase at the mid-canopy point, (C) leaf-on canopy phase next to the tree bole, and (D) leaf-on canopy phase at the mid-canopy point. Species codes: ACRU = red maple, CATO = mockernut hickory, QUFA = southern red oak, QUAL = white oak.
In the midstory, southern red oak throughfall gauges had the highest z-scores in the leaf-off canopy phase but not in the leaf-on canopy phase (Figure 6). In the leaf-off canopy phase, winged elm and hickory dominated the number of gauges with low z-scores (Figure 6A). In the leaf-on canopy phase, seven out of 10 red maple gauges had higher than average z-scores (Figure 6B).
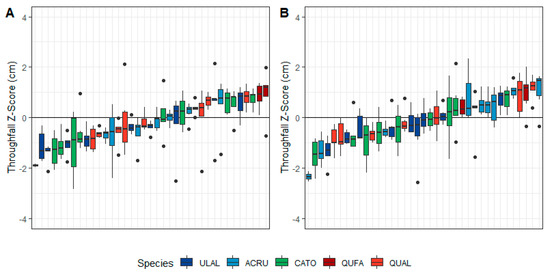
Figure 6.
Rank of midstory throughfall gauges by species and median z-score in the (A) leaf-off and (B) leaf-on canopy phases. Species codes: ACRU = red maple, ULAL = winged elm, CATO = mockernut hickory, QUFA = southern red oak, QUAL = white oak.
4. Discussion
At our study site, southern red oak had the largest diameter at breast height and occupied the most basal area, but had the smallest crown area. In contrast, red maple trees had the smallest basal area but the second highest crown area, illustrating how stem size is not necessarily an indicator of crown size. As a result, the larger crowns of red maple lead to greater rainfall interception and less throughfall compared to a co-occurring oak species of the same size but with a smaller crown. Forest canopies are spatially and temporally heterogeneous for many reasons, but some inherent structure can be attributed to differences in function and ecological niches. For example, pioneer species, which are shade-intolerant, allocate resources to grow tall and fast, resulting in shallower crowns with fewer branches. In contrast, climax species, which are moderate to very shade-tolerant, grow slower and are able to photosynthesize at lower light levels, maintaining multiple layers of branches and foliage, resulting in denser and deeper crowns. In evergreen species, this tradeoff between growth strategies in relation to shade tolerance was observed with vertical branching most common among pioneer species (i.e., shade-intolerant species) and horizontal branching most common among climax species (i.e., shade-tolerant species) [32]. As such, the structural traits of species reflect differences in functional traits associated with light acquisition and photosynthesis [33,34]. Consequently, these structural traits may also impact the redistribution of rainwater by the forest canopy.
With regards to canopy water partitioning, the architecture of tree crowns has direct impacts on the number of layers to intercept rainwater. In tropical forest ecosystems where species diversity is highest, differences in DBH and crown size were observed and were most pronounced among midstory trees [35]. At our study site in a temperate forest, the crown to basal area ratio was 2.5- to 25-times greater for red maple overstory trees compared to those of white oak and southern red oak, respectively. In the midstory, red maple and winged elm had crown to basal area ratios up to 11 times greater than either oak species. Thus, both canopy layers displayed differences in structure among species, but these traits were stronger in the overstory.
In this study, the rank of standardized throughfall was different between gauges located at the bole of the tree trunk compared to the mid-crown point underneath overstory trees (Figure 5). Although there were no consistent trends between gauge location or the interaction with species (p > 0.050). However, overall, the variability of throughfall at this study was within the range (<50%) of CV observed in other systems [15,36,37]. Compared to these studies, we also observed greater variability (i.e., the range of boxplots in Figure 5 and CVs in Figure 3 and Figure 4) during the leaf-on canopy phase compared to the leaf-off canopy phase, especially for the mid-crown gauges. More variability when foliage is present would be expected, as the number of intercepting surfaces increases with new foliage, whereby the spatial complexity of branching architecture combined with that of foliage distribution leads to even higher throughfall variability.
Keim et al. [38] considered the spatial scale over which throughfall collectors were correlated, and found that during the leaf-on canopy phase, the structure of individual tree crowns resulted in correlation between gauges, but in the leafless canopy, that correlation weakened significantly [38]. When foliage is present, the architecture of the tree crown may be more pronounced, leading to stronger spatial patterns. Differences between species in leaf surface characteristics may also influence retention of water by the tree crown. Not only do oaks have smaller crowns, but they have waxier leaf surfaces that help shed intercepted rainfall [10,39], both characteristics leading to greater throughfall than non-oaks. Species that are more shade-tolerant also tend to have larger leaves to capitalize on light interception and photosynthesis [40], which would also increase rainfall interception and decrease throughfall.
Compounding these interactions is also the myriad of storm conditions (i.e., rainfall intensity, wind speed and intensity, synoptic seasonality [41,42,43]), adding to the complexity of an already spatially complex process. In this study, throughfall was collected over 4-week sampling intervals, so any fine-scale temporal influence that species have on throughfall partitioning was not evaluated. However, it is likely that more frequent sampling intervals would help elucidate differences between species. For example, the timing of leaf life cycles in a deciduous forest from leaf emergence to full canopy occupancy to senescence, termed phenoseasons [44], determine the quantity of radiation making it to the forest floor. At the same time, the quantity of rainfall will also be impacted by phenoseasons. Growth strategies and physiology determine leaf life span [45,46], so it is reasonable to hypothesize that these attributes differ between species and will impact throughfall. Additionally, coatings on leaf surfaces change throughout the growing season, such that leaf hydrophobicity decreases as leaves age, increasing interception storage capacity, thus reducing throughfall [47]. Had this study been able to sample at shorter-time intervals, differences in phenoseasons beyond leaf-on vs. leaf-off canopy phase may have been expressed more strongly and led to periods during the year when throughfall was even more different among species.
The forest hydrologic budget is a balance of inputs via throughfall and stemflow (i.e., net precipitation) and outputs via interception, evaporation, transpiration (i.e., evapotranspiration) and streamflow. This study considered how structural traits vary among species to influence throughfall specifically. Here, we have presented preliminary evidence that suggests throughfall may be reduced during mesophication. However, net precipitation also includes stemflow and the smoother and thinner bark of mesophytes has been shown to substantially increase stemflow production compared to co-occurring oaks [20,21]. Evidence also suggests that mesophytes transpire more water than co-occurring oaks [5]. The impacts of mesophication on forest hydrologic cycles is still unresolved but these few studies provide evidence that watershed yield is decreasing as a result of changing species composition.
Mesophication and changing species composition and structure may have implications beyond forest hydrology. Throughfall is enriched with nutrients that accumulate in forest canopies during antecedent dry periods which are subsequently washed off, and also leached from plant surfaces during rainfall [48,49,50]. Species-level differences in throughfall have been observed across a range of forest functional types [51,52,53], and recent work has linked canopy-derived nutrient inputs with soil microbiological communities [54,55,56,57]. For example, presence of canopy epiphytes increased nutrient fluxes in throughfall and led to differences in abundance of ammonia-oxidizing soil bacteria, compared to soils underneath trees where epiphytes were not present [54].
5. Conclusions
A shift away from oak dominance throughout upland hardwood forests in the Eastern United States is widespread, and the magnitude and direction of ecosystem functions are uncertain. This paper provides preliminary evidence that changing tree species composition will impact the redistribution of throughfall water, the largest canopy-derived water flux, to the forest floor. As red maple and other mesophytes increase in dominance, throughfall volume will likely decline and throughfall variability will likely increase, both as a result of denser tree crowns associated with these shade-tolerant species. Whether the net impact of denser tree crowns increases soil moisture (by providing more shade and less evaporation) or decreases soil moisture (by reducing throughfall inputs) is yet to be determined. However, these differences in throughfall redistribution could have effects on the net result of mesophication by impacting both growing conditions and forest floor flammability. Furthermore, these differences in water fluxes will be compounded with differences in nutrient fluxes among species, which may alter other biogeophysical components, including soil biogeochemistry.
Author Contributions
Conceptualization, C.M.S. and H.D.A.; Methodology and Formal Analysis, C.M.S. and N.A.D.; Writing—original draft preparation, C.M.S.; Writing—review and editing, C.M.S., N.A.D., and H.D.A.
Funding
This work was supported by the National Institution of Food and Agriculture, U.S. Department of Agriculture, Mclntire Stennis capacity grants # MISZ-069390 (C.M.S.) and MISZ-069450 (H.D.A.).
Acknowledgments
This work was conducted at Spirit Hill Farm through the generous donation by Bob and Sheryl Bowen of the property to the Mississippi State University Bulldog Forest. This work is a contribution of the Forest and Wildlife Research Center and the Mississippi Agricultural and Forestry Experiment Station, Mississippi State University. This work was supported by the National Institution of Food and Agriculture, U.S. Department of Agriculture, Mclntire Stennis capacity grants # MISZ-069390 and MISZ-069450. Any opinions, findings, conclusions, or recommendations expressed in this publication are those of the author(s) and do not necessarily reflect the view of the U.S. Department of Agriculture. This project was made possible by the College of Forest Resources/Forest and Wildlife Research Center Undergraduate Research Scholars Program.
Conflicts of Interest
The authors declare no conflict of interest.
References
- Knott, J.A.; Desprez, J.M.; Oswalt, C.M.; Fei, S. Shifts in forest composition in the eastern United States. For. Ecol. Manag. 2019, 433, 176–183. [Google Scholar] [CrossRef]
- Abrams, M.D. Where has all the white oak gone? Bioscience 2003, 53, 927–939. [Google Scholar] [CrossRef]
- Fei, S.; Steiner, K.C. Evidence for increasing red maple abundance in the eastern United States. For. Sci. 2007, 53, 473–477. [Google Scholar]
- Nowacki, G.J.; Abrams, M.D. The demise of fire and “mesophication” of forests in the eastern United States. Bioscience 2008, 58, 123–138. [Google Scholar] [CrossRef]
- Caldwell, P.V.; Miniat, C.F.; Elliott, K.J.; Swank, W.T.; Brantley, S.T.; Laseter, S.H. Declining water yield from forested mountain watersheds in response to climate change and forest mesophication. Glob. Chang. Biol. 2016, 22, 2997–3012. [Google Scholar] [CrossRef] [PubMed]
- Brown, J.H.; Barker, A.C. An analysis of throughfall and stemflow in mixed oak stands. Water Resour. Res. 1970, 6, 316–323. [Google Scholar] [CrossRef]
- Roberts, J. The influence of physical and physiological characteristics of vegetation on their hydrological response. Hydrol. Process. 2000, 14, 2885–2901. [Google Scholar] [CrossRef]
- Levia, D.F.; Germer, S. A review of stemflow generation dynamics and stemflow-environment interactions in forests and shrublands. Rev. Geophys. 2015, 53, 673–714. [Google Scholar] [CrossRef]
- Nanko, K.; Hudson, S.A.; Levia, D.F. Differences in throughfall drop size distributions in the presence and absence of foliage. Hydrol. Sci. J. 2016, 61, 620–627. [Google Scholar] [CrossRef]
- Holder, C.D. Leaf water repellency of species in Guatemala and Colorado (USA) and its significance to forest hydrology studies. J. Hydrol. 2007, 336, 147–154. [Google Scholar] [CrossRef]
- Papierowska, E.; Szporak-Wasilewska, S.; Szewińska, J.; Szatyłowicz, J.; Debaene, G.; Utratna, M. Contact angle measurements and water drop behavior on leaf surface for several deciduous shrub and tree species from a temperate zone. Trees 2018, 32, 1253–1266. [Google Scholar] [CrossRef]
- Crockford, R.H.; Richardson, D.P. Partitioning of rainfall into throughfall, stemflow and interception: Effect of forest type, ground cover and climate. Hydrol. Process. 2000, 14, 2903–2920. [Google Scholar] [CrossRef]
- Park, A.; Cameron, J.L. The influence of canopy traits on throughfall and stemflow in five tropical trees growing in a Panamanian plantation. For. Ecol. Manag. 2008, 255, 1915–1925. [Google Scholar] [CrossRef]
- Zimmermann, A.; Zimmermann, B. Requirements for throughfall monitoring: The roles of temporal scale and canopy complexity. Agric. For. Meteorol. 2014, 189, 125–139. [Google Scholar] [CrossRef]
- Zimmermann, A.; Wilcke, W.; Elsenbeer, H. Spatial and temporal patterns of throughfall quantity and quality in a tropical montane forest in Ecuador. J. Hydrol. 2007, 343, 80–96. [Google Scholar] [CrossRef]
- Holwerda, F.; Scatena, F.N.; Bruijnzeel, L.A. Throughfall in a Puerto Rican lower montane rain forest: A comparison of sampling strategies. J. Hydrol. 2006, 327, 592–602. [Google Scholar] [CrossRef]
- Staelens, J.; De Schrijver, A.; Verheyen, K.; Verhoest, N.E.C. Spatial variability and temporal stability of throughfall water under a dominant beech (Fagus sylvatica L.) tree in relationship to canopy cover. J. Hydrol. 2006, 330, 651–662. [Google Scholar] [CrossRef]
- Nanko, K.; Onda, Y.; Ito, A.; Moriwaki, H. Spatial variability of throughfall under a single tree: Experimental study of rainfall amount, raindrops, and kinetic energy. Agric. For. Meteorol. 2011, 151, 1173–1182. [Google Scholar] [CrossRef]
- Siegert, C.M.; Levia, D.F.; Hudson, S.A.; Dowtin, A.L.; Zhang, F.; Mitchell, M.J. Small-scale topographic variability influences tree species distribution and canopy throughfall partitioning in a temperate deciduous forest. For. Ecol. Manag. 2016, 359, 109–117. [Google Scholar] [CrossRef]
- Alexander, H.D.; Arthur, M.A. Implications of a predicted shift from upland oaks to red maple on forest hydrology and nutrient availability. Can. J. For. Res. 2010, 726, 716–726. [Google Scholar] [CrossRef]
- Siegert, C.M.; Limpert, K.E.; Drotar, N.; Siegle-Gaither, M.; Burton, M.; Lowery, J.; Alexander, H.D. Effects of canopy structure on water cycling: Implications for changing forest composition. In Proceedings of the 20th Biennial Southern Silvicultural Research Conference, Shreveport, LA, USA, 12–14 March 2019. [Google Scholar]
- Van Stan, J.T.; Lewis, E.S.; Hildebrandt, A.; Rebmann, C.; Friesen, J. Impact of interacting bark structure and rainfall conditions on stemflow variability in a temperate beech-oak forest, central Germany. Hydrol. Sci. J. 2016, 61, 2071–2083. [Google Scholar] [CrossRef]
- McGee, G.G.; Cardon, M.E.; Kiernan, D.H. Variation in Acer saccharum Marshall (Sugar Maple) Bark and Stemflow Characteristics: Implications for Epiphytic Bryophyte Communities. Northeast. Nat. 2019, 26, 214–235. [Google Scholar]
- Arguez, A.; Durre, I.; Applequist, S.; Squires, M.; Vose, R.; Yin, X.; Bilotta, R. NOAA’s U.S. Climate Normals (1981–2020). NOAA National Centers for Environmental Information, doi:10.7289/V5PN93JP. Available online: https://data.nodc.noaa.gov/cgi-bin/iso?id=gov.noaa.ncdc:C00824# (accessed on 30 July 2019).
- Soil Survey Staff, Natural Resources Conservation Service, United States Department of Agriculture. Web Soil Survey. Available online: https://websoilsurvey.sc.egov.usda.gov/ (accessed on 30 July 2019).
- Granger, J.J.; Buckley, D.S.; Sharik, T.L.; Zobel, J.M.; DeBord, W.W.; Hartman, J.P.; Henning, J.G.; Keyser, T.L.; Marshall, J.M. Northern red oak regeneration: 25-year results of cutting and prescribed fire in Michigan oak and pine stands. For. Ecol. Manag. 2018, 429, 467–479. [Google Scholar] [CrossRef]
- Keyser, T.L.; Arthur, M.; Loftis, D.L. Repeated burning alters the structure and composition of hardwood regeneration in oak-dominated forests of eastern Kentucky, USA. For. Ecol. Manag. 2017, 393, 1–11. [Google Scholar] [CrossRef]
- Allen, D.; Dick, C.W.; Strayer, E.; Perfecto, I.; Vandermeer, J. Scale and strength of oak-mesophyte interactions in a transitional oak-hickory forest. Can. J. For. Res. 2018, 48, 1366–1372. [Google Scholar] [CrossRef] [PubMed]
- Alexander, H.D.; Arthur, M.A. Increasing red maple leaf litter alters decomposition rates and nitrogen cycling in historically oak-dominated forests of the eastern U.S. Ecosystems 2014, 17, 1371–1383. [Google Scholar] [CrossRef]
- Bates, D.; Maechler, M.; Bolker, B.; Walker, S. Package Lme4: Linear Mixed-Effects Models Using Eigen and S4. R Package version 1.1-21. Available online: https://cran.r-project.org/web/packages/lme4/index.html (accessed on 30 July 2019).
- Lenth, R.; Singmann, H.; Love, J.; Buerkner, P.; Herve, M. Package emmeans: Estimated Marginal Means, aka Least-Squares Means. R package version 1.4.1. Available online: https://cran.r-project.org/web/packages/emmeans/index.htm.l (accessed on 30 July 2019).
- Yang, X.D.; Yan, E.R.; Chang, S.X.; Da, L.J.; Wang, X.H. Tree architecture varies with forest succession in evergreen broad-leaved forests in Eastern China. Trees 2015, 29, 43–57. [Google Scholar] [CrossRef]
- Kobe, R.K.; Pacala, S.W.; Silander, J.A.; Canham, C.D. Juvenile tree survivorship as a component of shade tolerance. Ecol. Appl. 1995, 5, 517–532. [Google Scholar] [CrossRef]
- Niinemets, Ü. Growth of young trees of Acer platanoides and Quercus robur along a gap-understory continuum: interrelationships between allometry, biomass partitioning, nitrogen, and shade tolerance. Int. J. Plant Sci. 1998, 159, 318–330. [Google Scholar] [CrossRef]
- Aiba, S.I.; Kohyama, T. Crown architecture and life-history traits of 14 tree species in a warm-temperate rain forest: Significance of spatial heterogeneity. J. Ecol. 1997, 85, 611. [Google Scholar] [CrossRef]
- Staelens, J.; De Schrijver, A.; Verheyen, K.; Verhoest, N.E.C. Spatial variability and temporal stability of throughfall deposition under beech (Fagus sylvatica L.) in relationship to canopy structure. Environ. Pollut. 2006, 142, 254–263. [Google Scholar] [CrossRef] [PubMed]
- Ritter, A.; Regalado, C.M. Investigating the random relocation of gauges below the canopy by means of numerical experiments. Agric. For. Meteorol. 2010, 150, 1102–1114. [Google Scholar] [CrossRef]
- Keim, R.F.; Skaugset, A.E.; Weiler, M. Temporal persistence of spatial patterns in throughfall. J. Hydrol. 2005, 314, 263–274. [Google Scholar] [CrossRef]
- Holder, C.D.; Gibbes, C. Influence of leaf and canopy characteristics on rainfall interception and urban hydrology. Hydrol. Sci. J. 2017, 62, 182–190. [Google Scholar] [CrossRef]
- Lusk, C.H. Leaf area and growth of juvenile temperate evergreens in low light: Species of contrasting shade tolerance change rank during ontogeny. Funct. Ecol. 2004, 18, 820–828. [Google Scholar] [CrossRef]
- Siegert, C.M.; Levia, D.F.; Leathers, D.J.; Van Stan, J.T.; Mitchell, M.J. Do storm synoptic patterns affect biogeochemical fluxes from temperate deciduous forest canopies? Biogeochemistry 2017, 132, 273–292. [Google Scholar] [CrossRef]
- Keim, R.F.; Link, T.E. Linked spatial variability of throughfall amount and intensity during rainfall in a coniferous forest. Agric. For. Meteorol. 2018, 248, 15–21. [Google Scholar] [CrossRef]
- Staelens, J.; De Schrijver, A.; Verheyen, K.; Verhoest, N.E.C. Rainfall partitioning into throughfall, stemflow, and interception within a single beech (Fagus sylvatica L.) canopy: Influence of foliation, rain event characteristics, and meteorology. Hydrol. Process. 2008, 22, 33–45. [Google Scholar] [CrossRef]
- Hutchison, B.A.; Matt, D.R. The distribution of solar radiation within a deciduous forest. Ecol. Monogr. 1977, 47, 185–207. [Google Scholar] [CrossRef]
- Wright, I.J.; Reich, P.B.; Westoby, M.; Ackerly, D.D.; Baruch, Z.; Bongers, F.; Cavender-Bares, J.; Chapin, T.; Cornelissen, J.H.C.; Diemer, M.; et al. The worldwide leaf economics spectrum. Nature 2004, 428, 821–827. [Google Scholar] [CrossRef]
- Augspurger, C.K.; Bartlett, E.A. Differences in leaf phenology between juvenile and adult trees in a temperate deciduous forest. Tree Physiol. 2003, 23, 517–525. [Google Scholar] [CrossRef] [PubMed]
- Klamerus-Iwan, A.; Witek, W. Variability in the wettability and water storage capacity of common oak leaves (Quercus robur L.). Water 2018, 10, 695. [Google Scholar] [CrossRef]
- Berger, T.W.; Untersteiner, H.; Toplitzer, M.; Neubauer, C. Nutrient fluxes in pure and mixed stands of spruce (Picea abies) and beech (Fagus sylvatica). Plant Soil 2009, 322, 317–342. [Google Scholar] [CrossRef]
- Staelens, J.; De Schrijver, A.; Verheyen, K. Seasonal variation in throughfall and stemflow chemistry beneath a European beech (Fagus sylvatica) tree in relation to canopy phenology. Can. J. For. Res. 2007, 37, 1359–1372. [Google Scholar] [CrossRef]
- Legout, A.; van der Heijden, G.; Jaffrain, J.; Boudot, J.P.; Ranger, J. Tree species effects on solution chemistry and major element fluxes: A case study in the Morvan (Breuil, France). For. Ecol. Manag. 2016, 378, 244–258. [Google Scholar] [CrossRef]
- Arisci, S.; Rogora, M.; Marchetto, A.; Dichiaro, F. The role of forest type in the variability of DOC in atmospheric deposition at forest plots in Italy. Environ. Monit. Assess. 2012, 184, 3415–3425. [Google Scholar] [CrossRef]
- Shiklomanov, A.N.; Levia, D.F. Stemflow acid neutralization capacity in a broadleaved deciduous forest: The role of edge effects. Environ. Pollut. 2014, 193C, 45–53. [Google Scholar] [CrossRef] [PubMed]
- Silva, I.C.; Rodriguez, H.G. Interception loss, throughfall and stemflow chemistry in pine and oak forests in northeastern Mexico. Tree Physiol. 2001, 21, 1009–1013. [Google Scholar] [CrossRef] [PubMed]
- Moore, L.D.; Van Stan, J.T.; Gay, T.E.; Rosier, C.; Wu, T. Alteration of soil chitinolytic bacterial and ammonia oxidizing archaeal community diversity by rainwater redistribution in an epiphyte-laden Quercus virginiana canopy. Soil Biol. Biochem. 2016, 100, 33–41. [Google Scholar] [CrossRef]
- Rosier, C.L.; Levia, D.F.; Van Stan, J.T.; Aufdenkampe, A.; Kan, J. Seasonal dynamics of the soil microbial community structure within the proximal area of tree boles: Possible influence of stemflow. Eur. J. Soil Biol. 2016, 73, 108–118. [Google Scholar] [CrossRef]
- Teachey, M.E.; Pound, P.; Ottesen, E.A.; Van Stan, J.T. Bacterial Community Composition of Throughfall and Stemflow. Front. For. Glob. Chang. 2018, 1, 7. [Google Scholar] [CrossRef]
- Ribbons, R.R.; Kepfer-Rojas, S.; Kosawang, C.; Hansen, O.K.; Ambus, P.; McDonald, M.; Grayston, S.J.; Prescott, C.E.; Vesterdal, L. Context-dependent tree species effects on soil nitrogen transformations and related microbial functional genes. Biogeochemistry 2018, 140, 145–160. [Google Scholar] [CrossRef]


© 2019 by the authors. Licensee MDPI, Basel, Switzerland. This article is an open access article distributed under the terms and conditions of the Creative Commons Attribution (CC BY) license (http://creativecommons.org/licenses/by/4.0/).