Article

The Internal Structural Evolution of Calderas: Results from 3D Discrete Element Simulations

ICREA (Institució Catalana de Recerca i Estudis Avançats) and Facultat de Geologia, Universitat de Barcelona, Catalonia, Barcelona 08028, Spain
Geosciences 2019, 9(10), 419; https://doi.org/10.3390/geosciences9100419
Submission received: 8 August 2019 / Revised: 18 September 2019 / Accepted: 24 September 2019 / Published: 26 September 2019

Abstract

:
The structural evolution of calderas is a key issue in volcanology and has profound implications for hazard analysis and the exploitation of geothermal energy and hydrothermal ores. However, their internal geometry at depth and the detailed fault and fracture distribution are unclear and debated. In order to better constrain the internal structural evolution of calderas, I have developed a 3D discrete element model of a frictional cover undergoing piston-like subsidence at its base, simulating magma chamber deflation and cover collapse. I examine two piston geometries, simulating magma chambers with roofs that are circular and rectangular in plan view, to investigate patterns of faulting and subsidence in three dimensions. In both models a complex arrangement of normal and reverse faults accommodates deeper subsidence at higher structural levels. Bell- to cone-shaped, outward-dipping ring faults are consistently the first structures to develop; these faults propagate upwards from the piston edges towards the surface. Later caldera growth is mainly the result of movement on vertical, or steeply inward-dipping, normal ring faults which enclose the earlier reverse faults. As a result, all calderas widen, in terms of their surface expression, with time. The final stage of caldera development includes significant collapse of the caldera walls and transport of this material towards the caldera center. The results confirm that the evolutionary patterns/stages proposed from 2D numerical and analogue models can be generalized to three dimensions, although significant differences between long- and short-axis geometries do occur when the piston is elongate. Compared to 2D simulations, however, 3D results show the geometric complexity of ring faulting, with variations in strain and fault activity at various stages of development demonstrating that often a simple, continuous ring fault structure is not developed.

Graphical Abstract

1. Introduction

Calderas have been the focus of many field-based, physical (laboratory), and numerical investigations (e.g., [1,2,3,4,5,6,7,8,9,10,11,12,13,14,15]; Figure 1). This is a result of their importance both as a serious human hazard and from a fundamental scientific viewpoint [16]. Calderas are generally thought to be the result of magma chamber evacuation, producing under-pressure relative to the surrounding medium and collapse of the magma chamber roof. The resulting subsidence of the overlying materials may take the form of a trapdoor, piston, funnel, broad sag, or combinations thereof (e.g., [2,17]). While caldera morphology, surface structure, and deformation patterns are reasonably well understood [3,16,18], their deeper structures are not as they are often obscured by later volcanic deposits and landslides. In particular, the geometry of “ring” faults at depth and the detailed internal fault and fracture distribution as a result of caldera collapse are unclear and debated; we know little of how they initiate and link. Analogue sandbox (physical) experiments have been successful in elucidating controls on caldera and volcano morphology and internal structure (e.g., [1,2,8]; Figure 1A–C). In particular, analysis of final geometries in serial sections of models has demonstrated the complexity of internal faulting and folding. The incremental, internal structural development of analogue models is, however, particularly difficult to analyze. Most analytical and numerical models to date have focused more on stress fields around idealized magma chambers and on conditions suitable for caldera initiation, rather than on the evolution of faulting during subsequent caldera development as a result of geologically realistic amounts of subsidence (cf. [4,19,20,21,22,23]). Hardy [7] and later Holohan et al. [24] presented 2D discrete element models of caldera development which reproduced both normal and reverse faulting and their complex spatio-temporal relationships seen in equivalent natural examples and analogue models. However, these studies, like most other numerical models, were 2D, while natural caldera structures may be affected by a variety of parameters which influence their development in three dimensions. We know very little about the manner in which ring faults form and link in three dimensions above a collapsing magma chamber roof. To build on these earlier studies and to better understand the internal structural development of calderas in three dimensions, I present here the results of large-displacement, high-strain 3D numerical simulations of caldera development for piston/magma chamber roofs that are circular and rectangular in plan view (c.f. Figure 2c,d). These numerical models, using the discrete element technique, encapsulate the initial formation of calderas and the subsequent evolution of both normal and reverse faulting during their development. In addition, this technique allows the monitoring of internal structures and strain patterns in three dimensions. Model geometries and incremental strains in a variety of oriented sections, and their implications for the structural evolution of calderas, are examined and discussed.

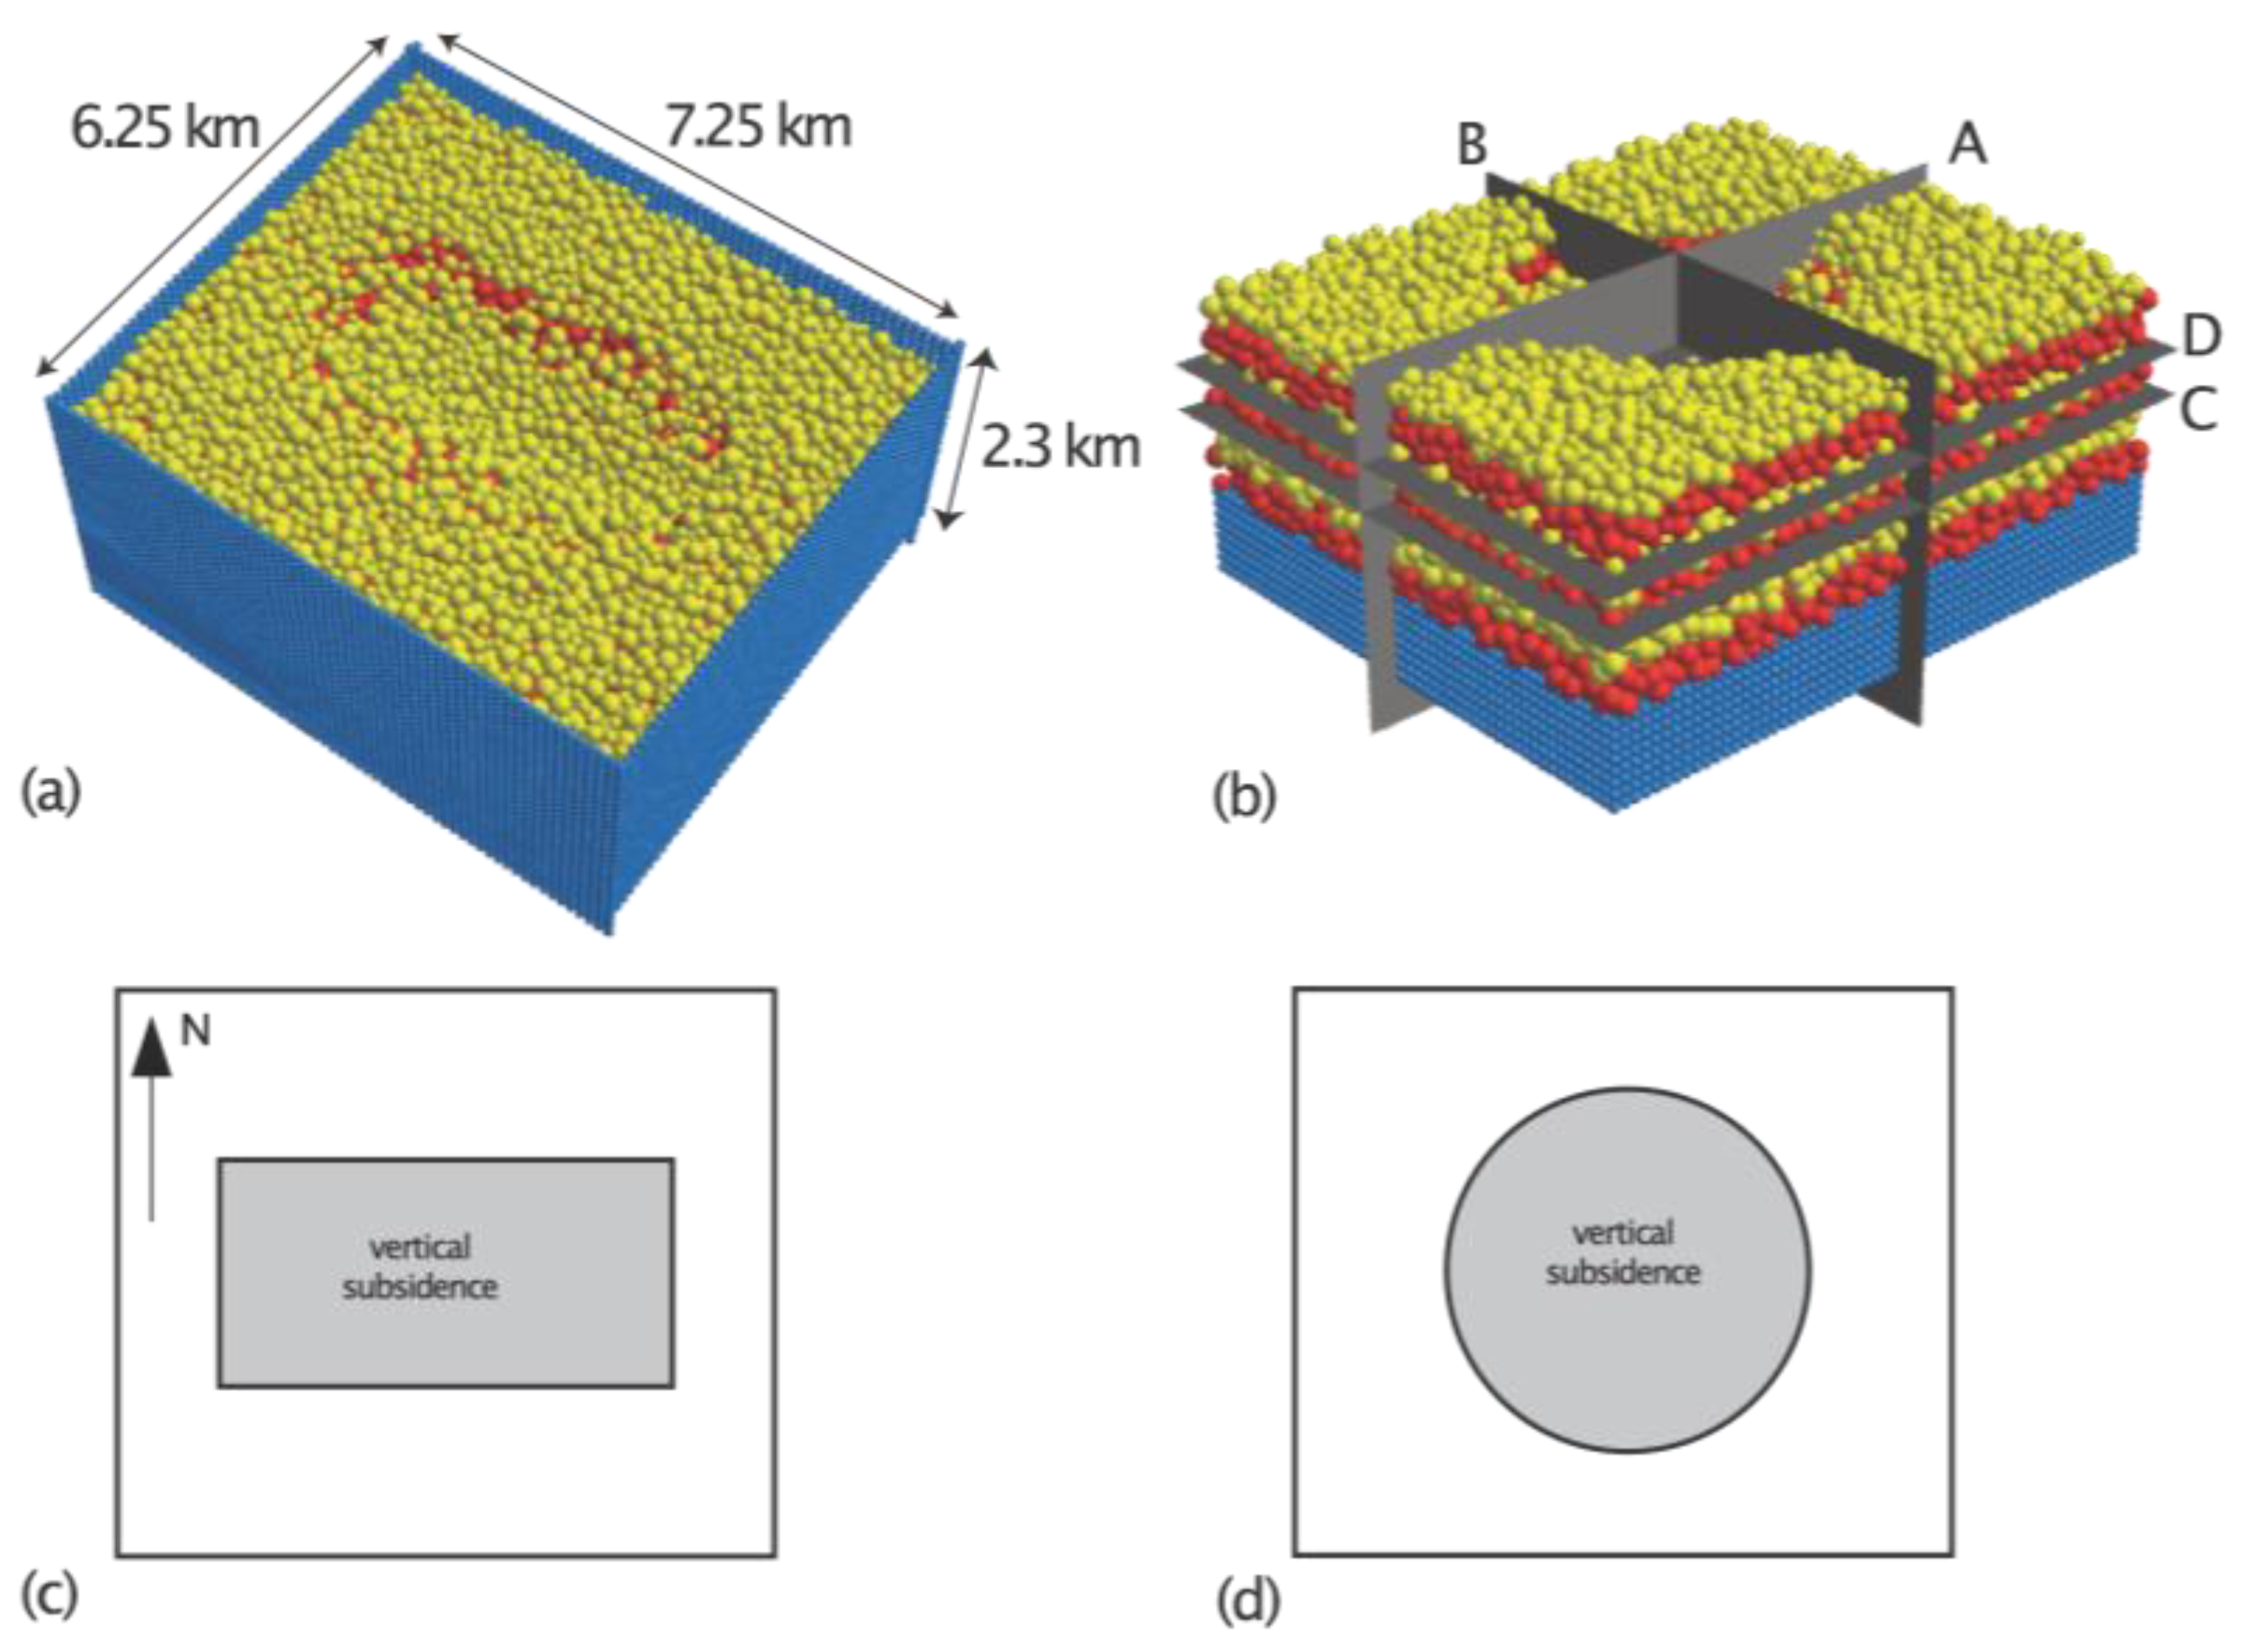
2. Modeling Methodology and Initial and Boundary Conditions

I performed a series of 3D discrete element numerical experiments to better constrain fault initiation and propagation in a frictional, cohesionless material (a common analogue for brittle materials in the upper crust, e.g., [7,26,27,28] subject to boundary conditions which are akin to those thought to produce calderas in nature (cf. [2,5,24]). The modelling of calderas subject to high strain is a classic problem for the discrete element technique as it deals well with situations in which localization and faulting are important and allows large relative motion of individual elements. In addition, it does not require remeshing and easily handles complex, abrupt boundary conditions ([29]). This was initially demonstrated by Hardy [7], who presented a 2D discrete element model of caldera development which appeared to reproduce many of the features seen in natural examples and in analogue models and confirmed previous conceptual models of caldera development. A similar, later study was presented by Holohan et al. [24]. Here, I present the results of the same modeling approach generalized to simulate calderas in three dimensions. The transition from a 2D to a 3D numerical model is straightforward from both mathematical and algorithmic perspectives, but it is computationally quite demanding. Typical experiments like those discussed here take ~12 h to run on a desktop machine with two 6-core Intel Xeon (× 5650–2.66 GHz) processors allowing 24 computational threads.
The 3D numerical experiments presented here consider a 6.25 × 7.25 × 2.3 km section of the brittle upper crust, subject to vertical, piston-like subsidence at its base (Figure 2). The model represents the brittle crust using ca. 20,000 variably sized, spherical elements that are subject to Newton’s equations of motion and whose contacts interact with elastic (normal) and Coulomb frictional (shear) forces under the influence of gravity (see Hardy et al., [28] for a full description of the modeling approach). The piston top is flat and can take a variety of shapes; here it is either circular or rectangular (Figure 2c,d), and its walls are vertical. Element radii range from 75 to 125.0 m. These radii were chosen for pragmatic reasons as they result in tractable runtimes for the simulations; smaller elements would clearly produce more detail and higher resolution in the results. Elements had a density of 2500 kg/m3, and the bulk coefficient of friction (µ) of the modeled brittle material was ca. 0.60, giving an internal angle of friction (ø) of ca. 30 degrees. As in many previous modeling studies (e.g., [7,26,27,28]), I assumed that the upper crustal material under consideration has no cohesion. This is a justifiable assumption for faulted and fractured volcanic rocks, particularly at the crustal scale where cohesion is negligible compared to normal stresses at depth. Vertical subsidence of the piston was incremented at 0.005 m per time step for 200,000 time steps to achieve a total subsidence of 1.0 km; subsidence increments were chosen to ensure numerical stability. Both the roof thickness (2.3 km) and total subsidence chosen herein are thought to be representative of natural calderas (see Acocella [6]). Two piston-top geometries were considered: the circular piston has a radius of 2000 m, while the rectangular piston is 5000 by 2500 m, giving them identical subsiding areas. The discrete elements were advanced to their new positions within the model by integrating their equations of motion using Newtonian physics and a velocity Verlet numerical scheme (cf. [7,28,30]). Displacements/velocities for each element were recorded during a model run for analysis of the 3D shear strain using the program SSPX (Cardozo and Allmendinger [31]; cf. [7,32]).

3. Simulation Results

Results from the two different model configurations (circular and rectangular pistons) are presented here: in each case, the top of the piston was located at the center of the base of the model (Figure 2c,d). Several other piston shapes have been investigated; the examples presented here are end-member caldera roof geometries that have been tested. In this section I firstly present the final surface geometry and incremental surface subsidence for each experiment. I then explore the progressive development of the caldera structures on different 2D sections, together with a detailed analysis of incremental shear strain accrued during the previous 200 m of basal piston subsidence at five stages of development (200, 400, 600, 800, and 1000 m of basal subsidence); the orientation of these sections in shown in Figure 2b.

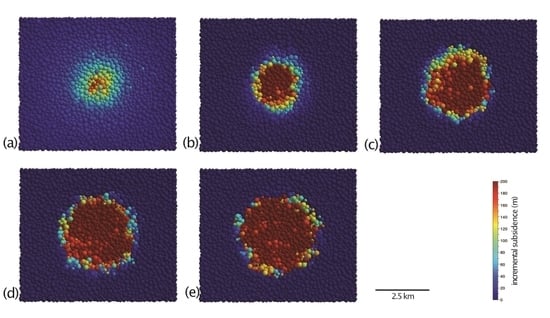
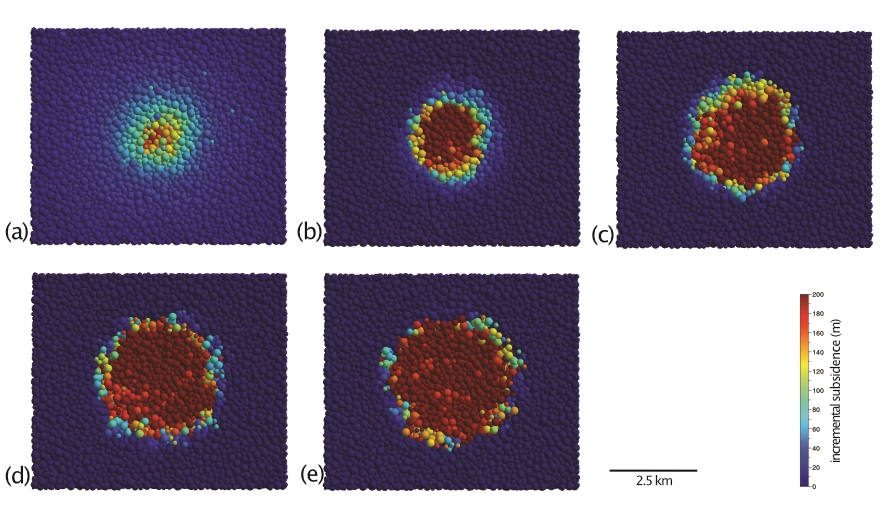
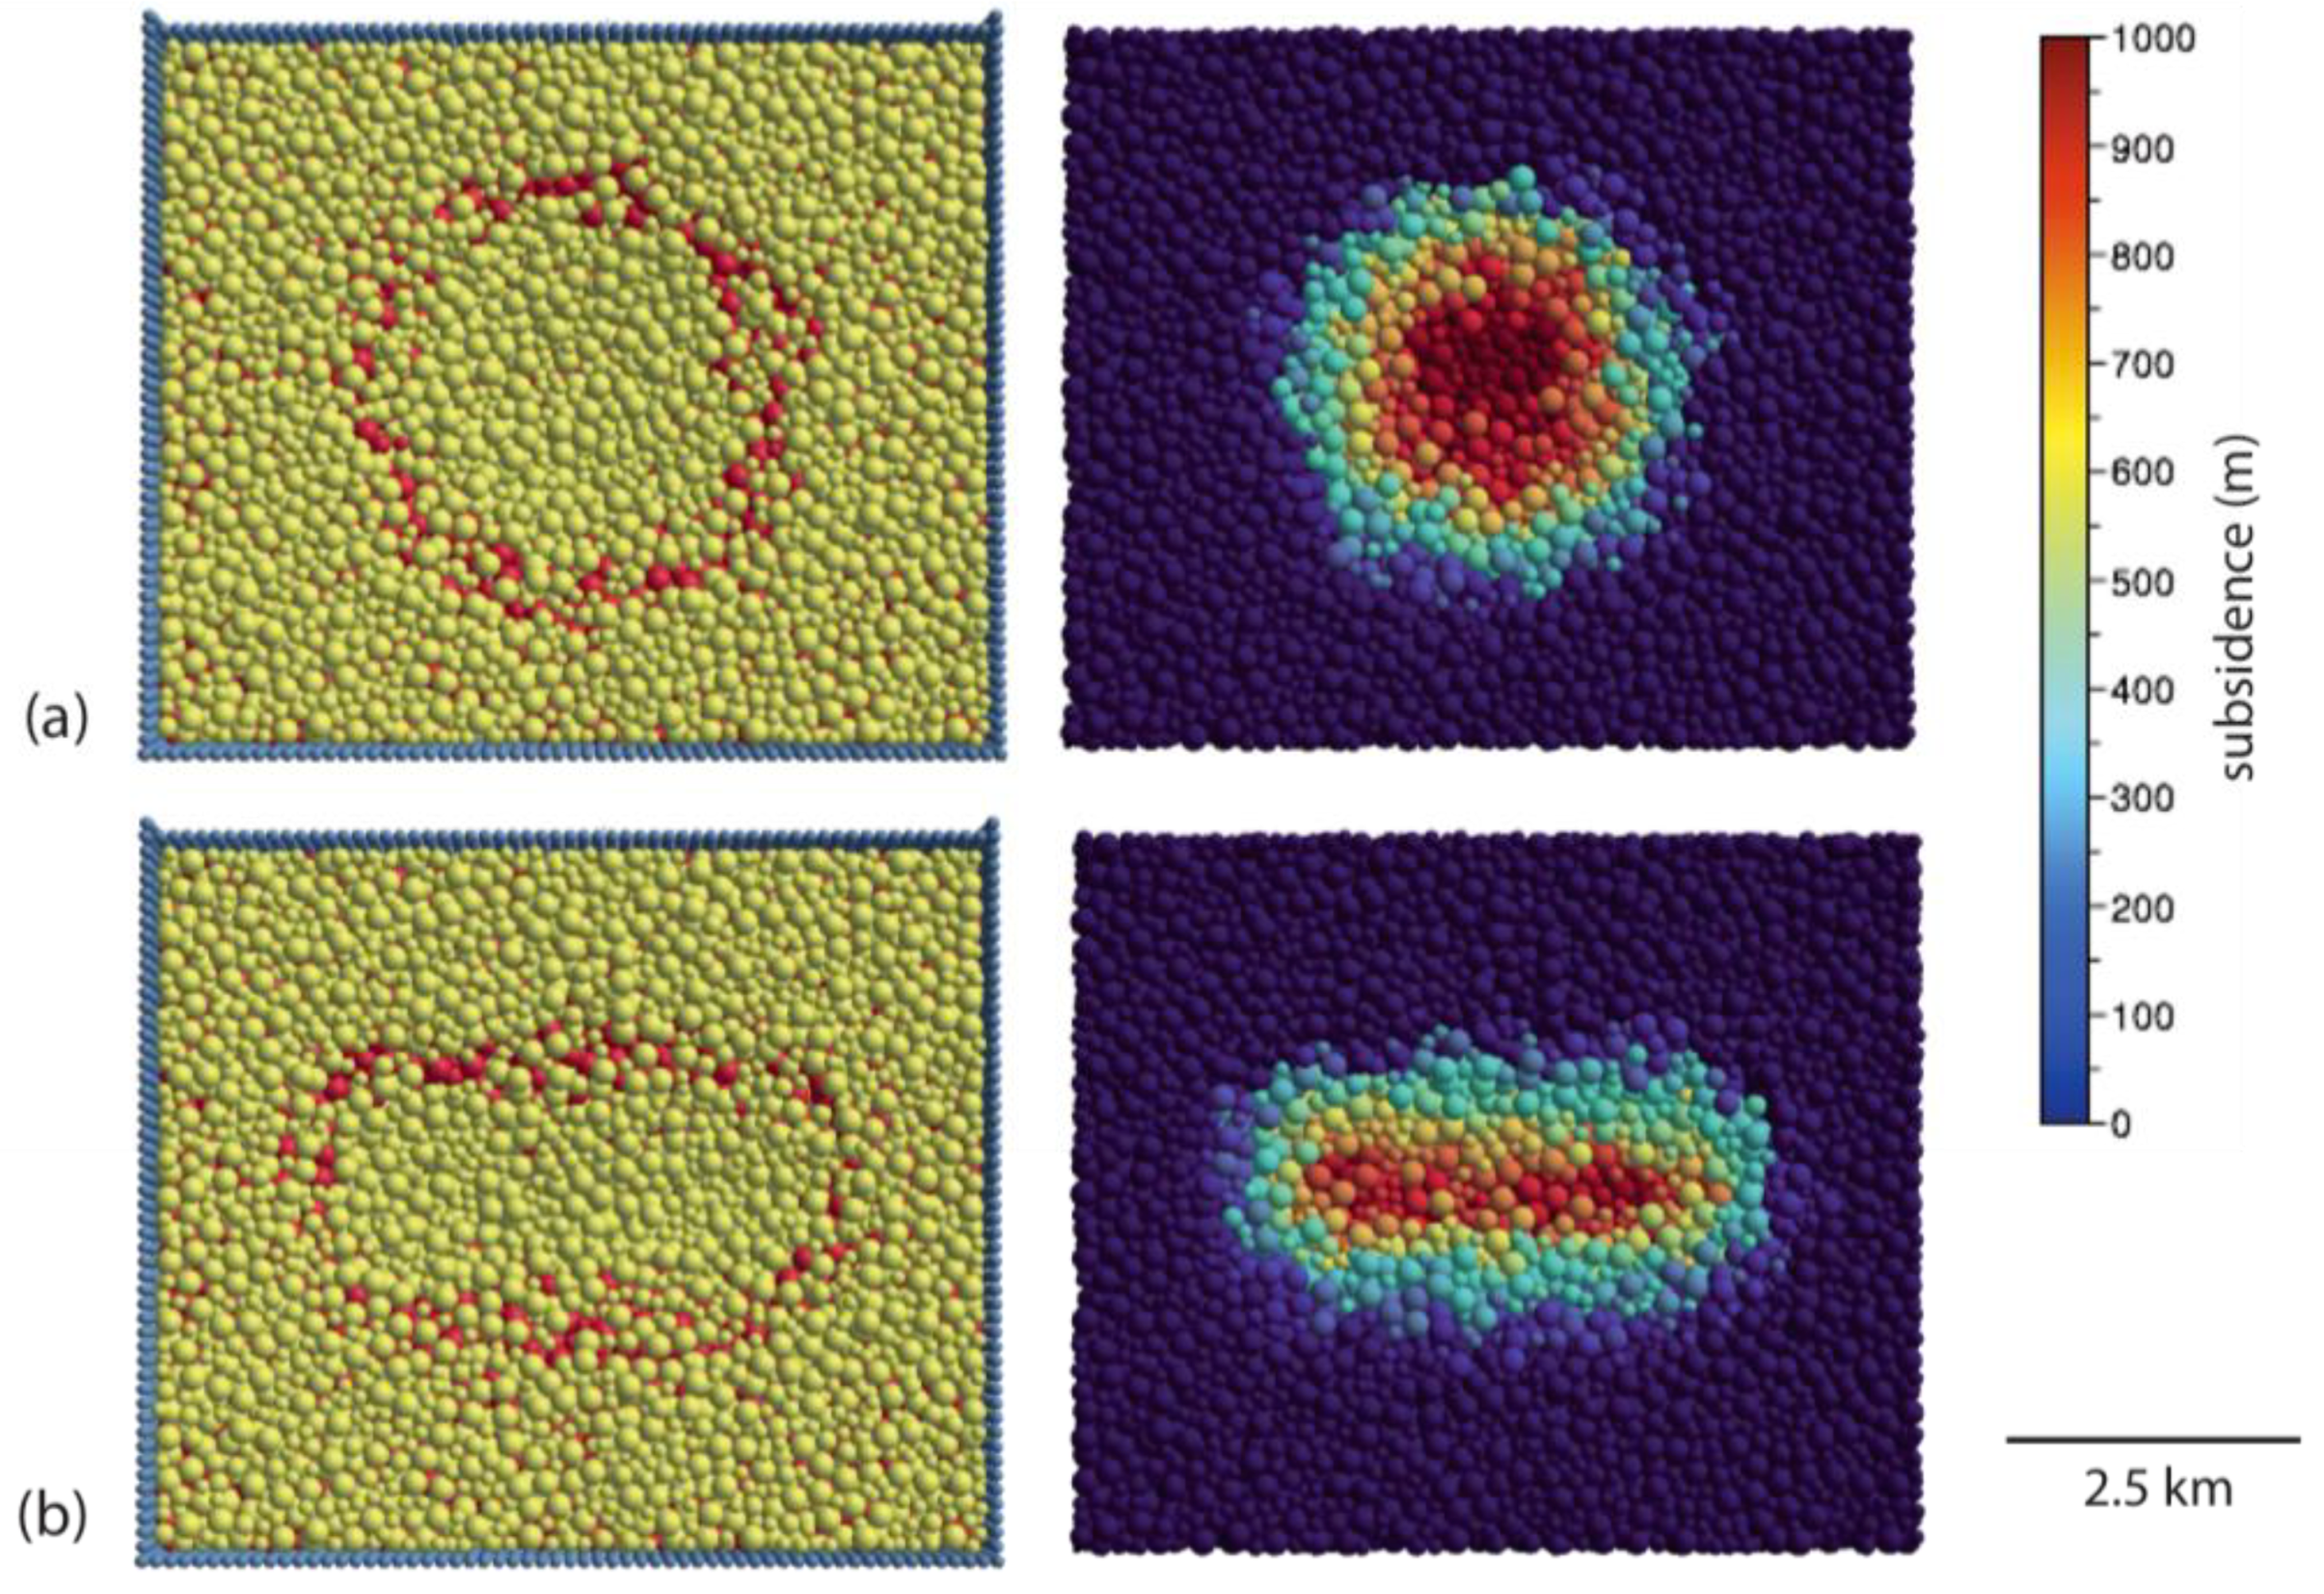
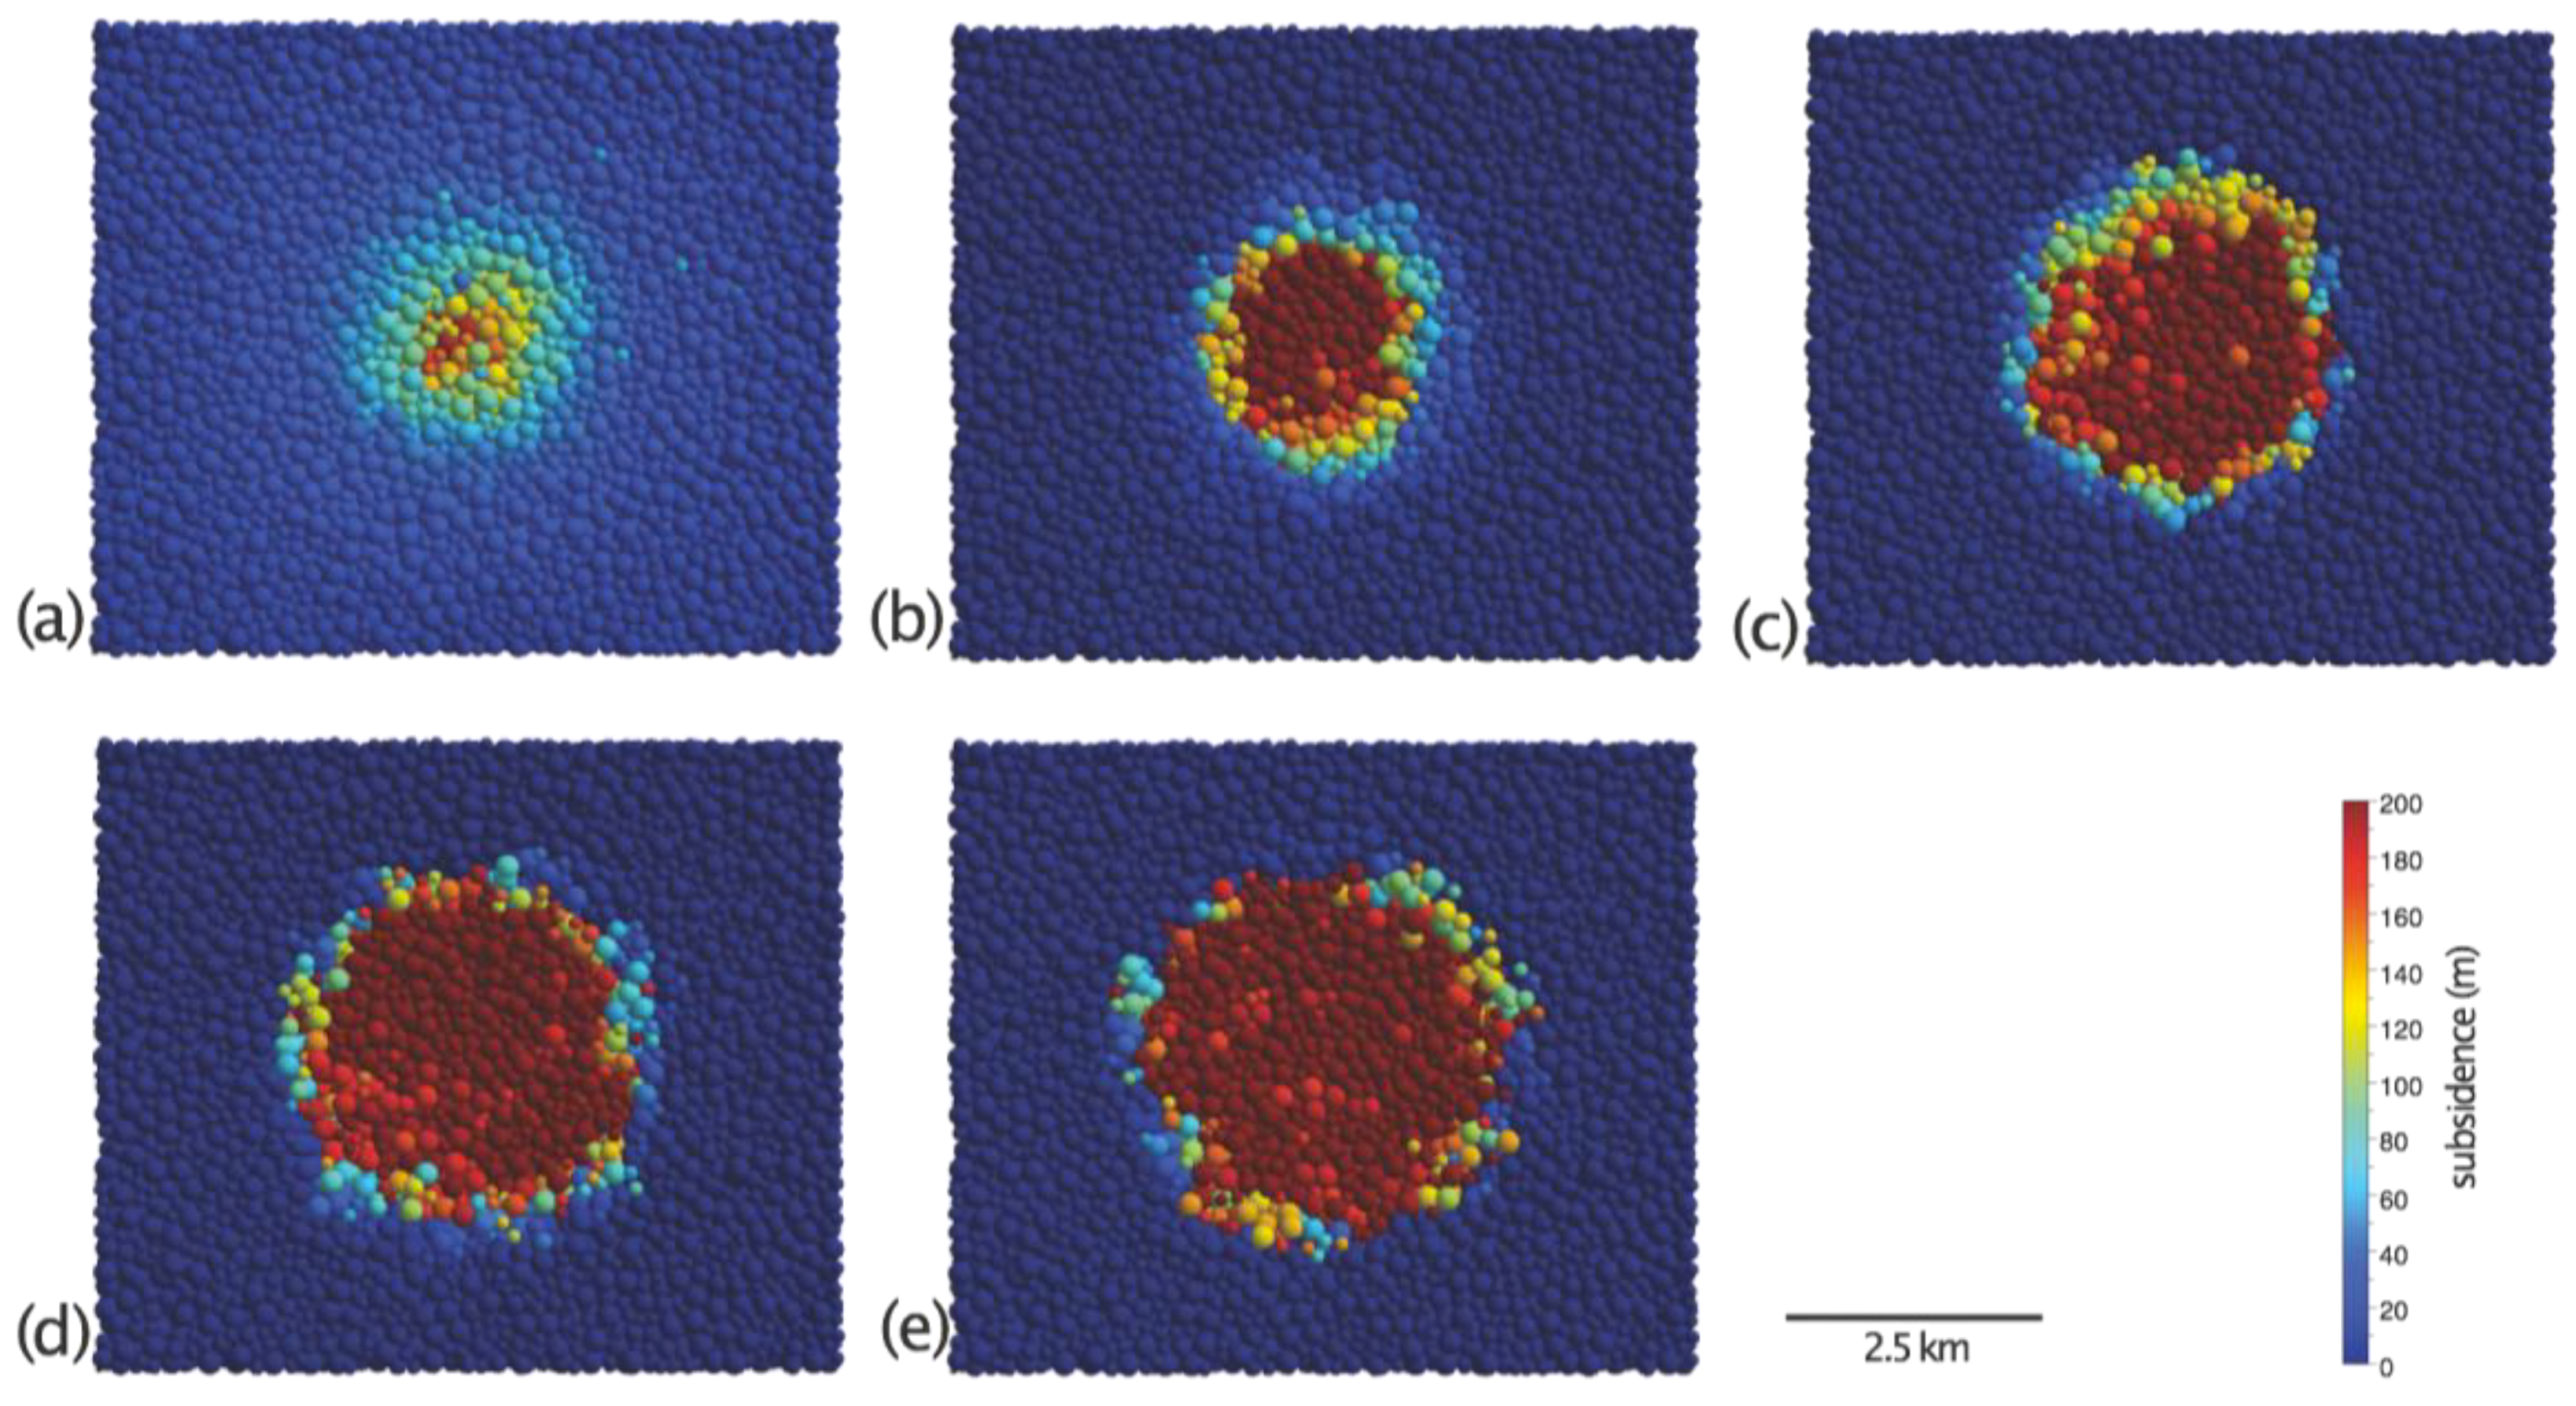
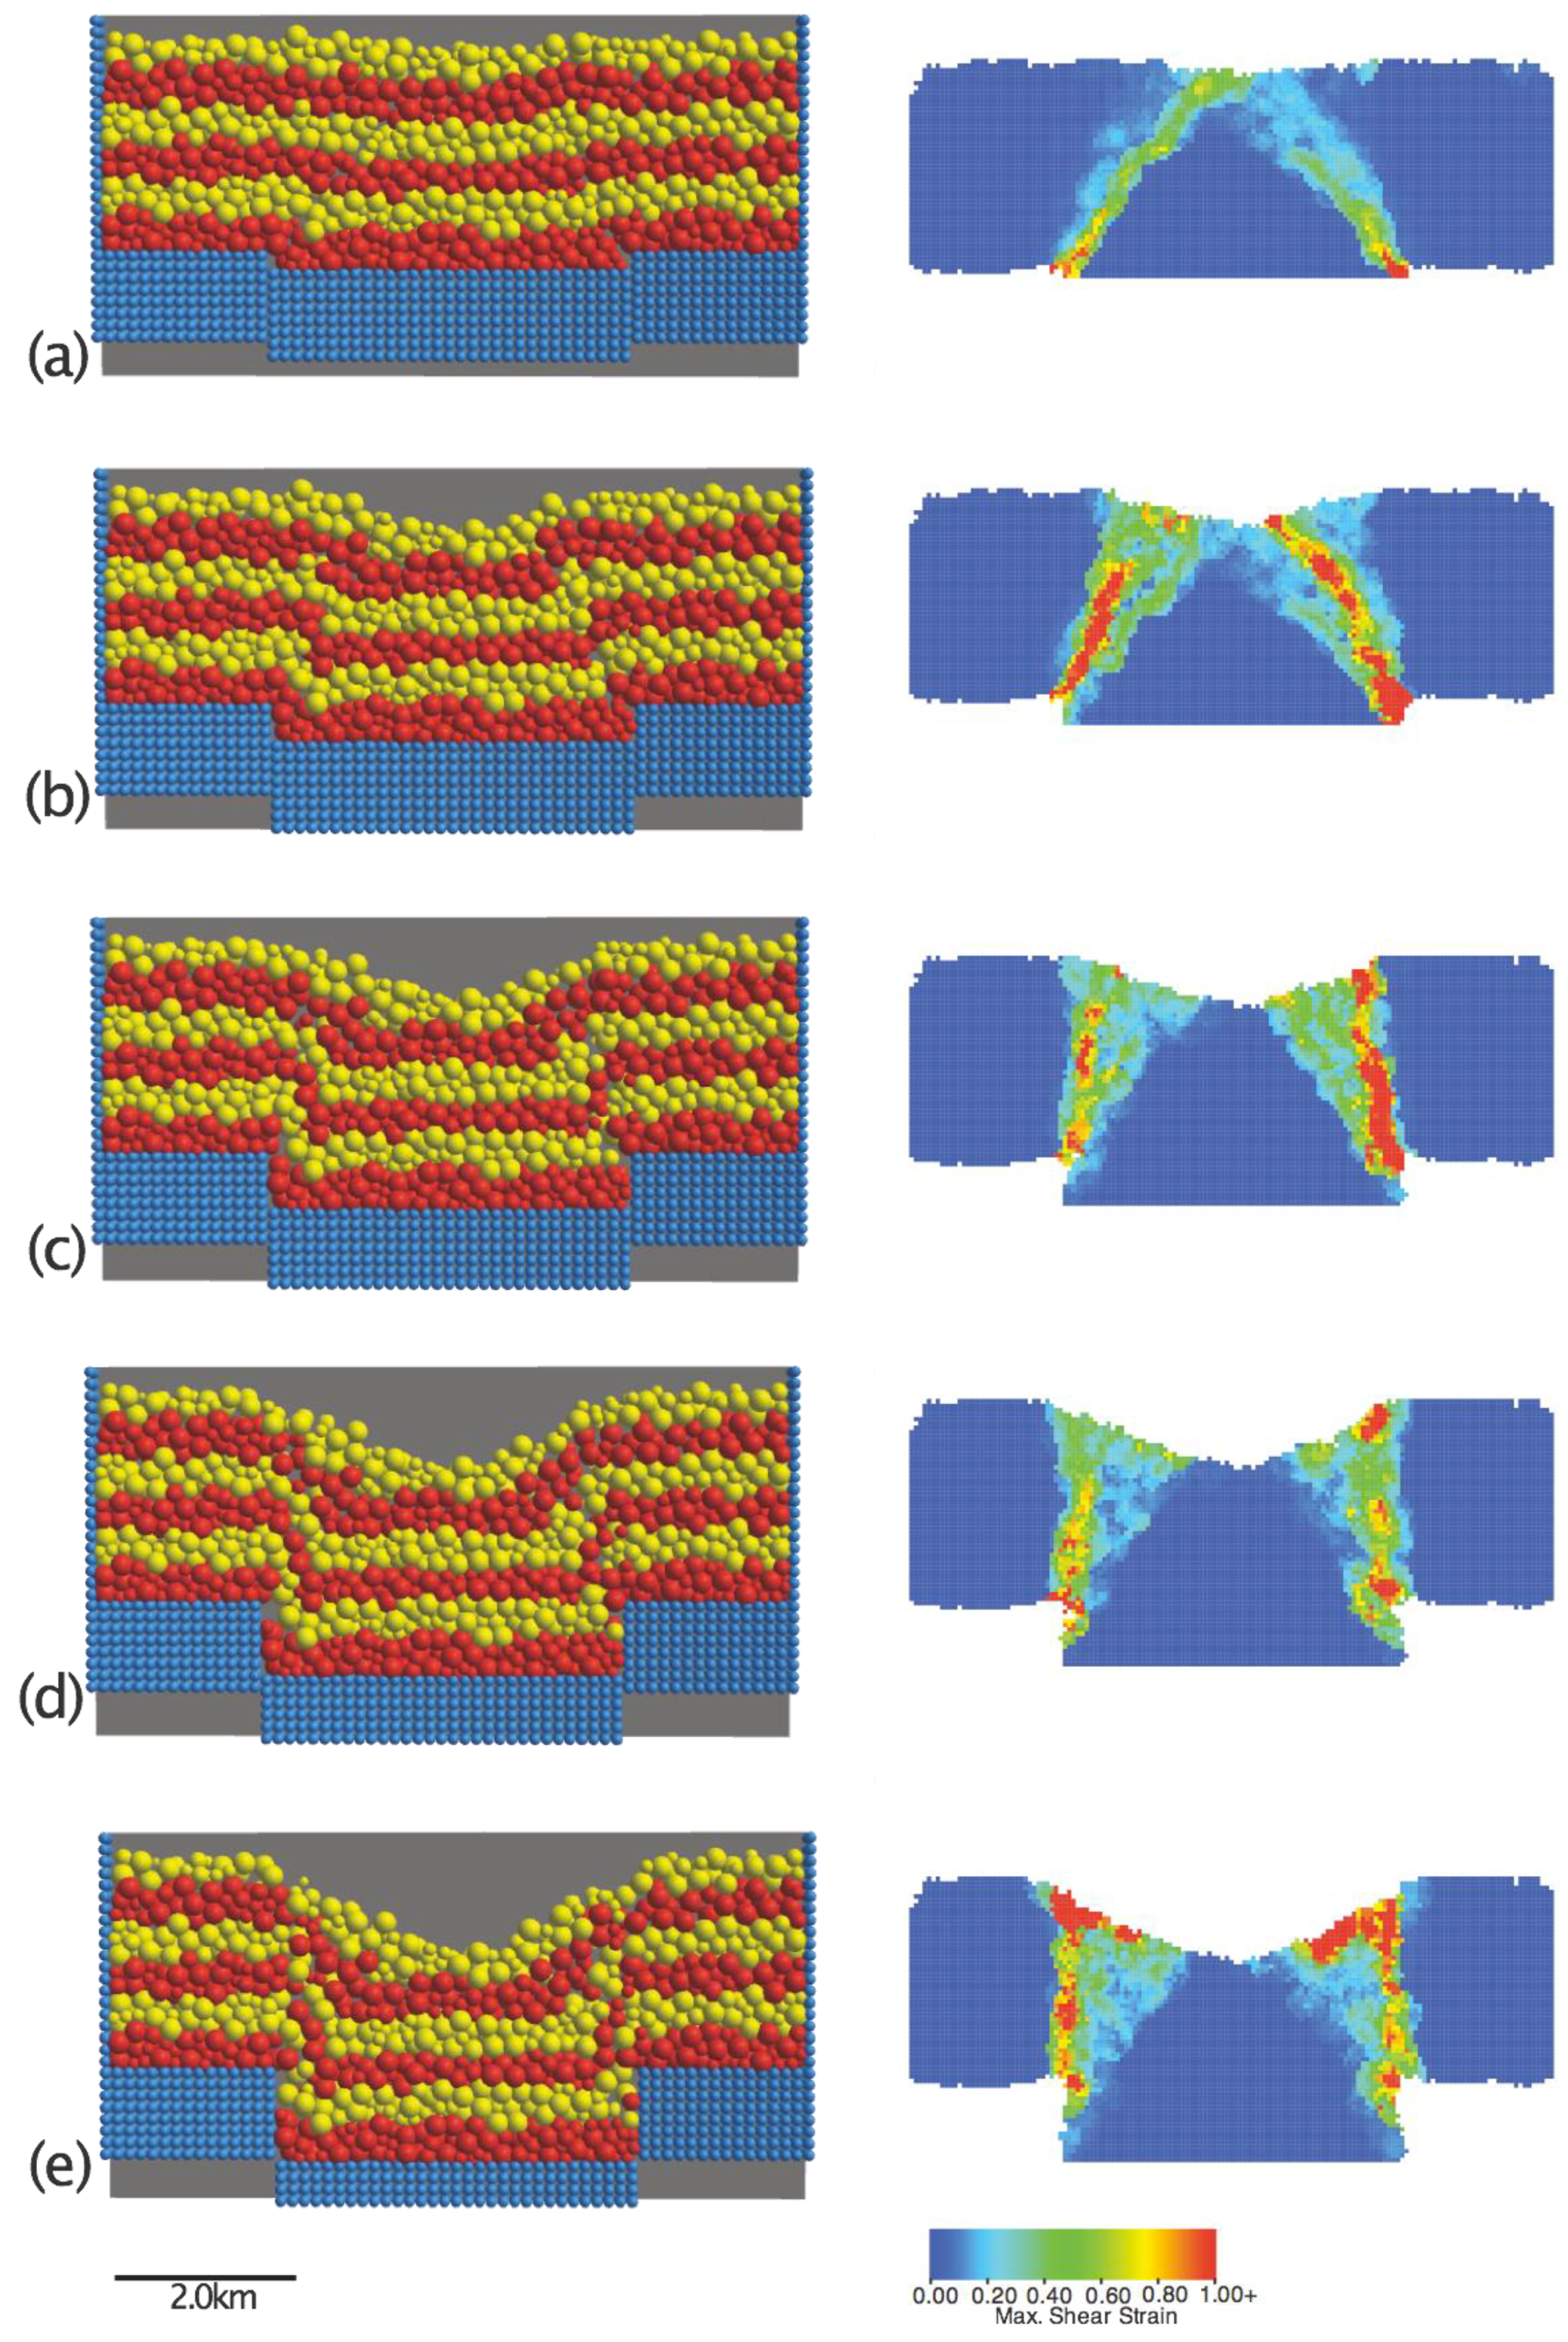
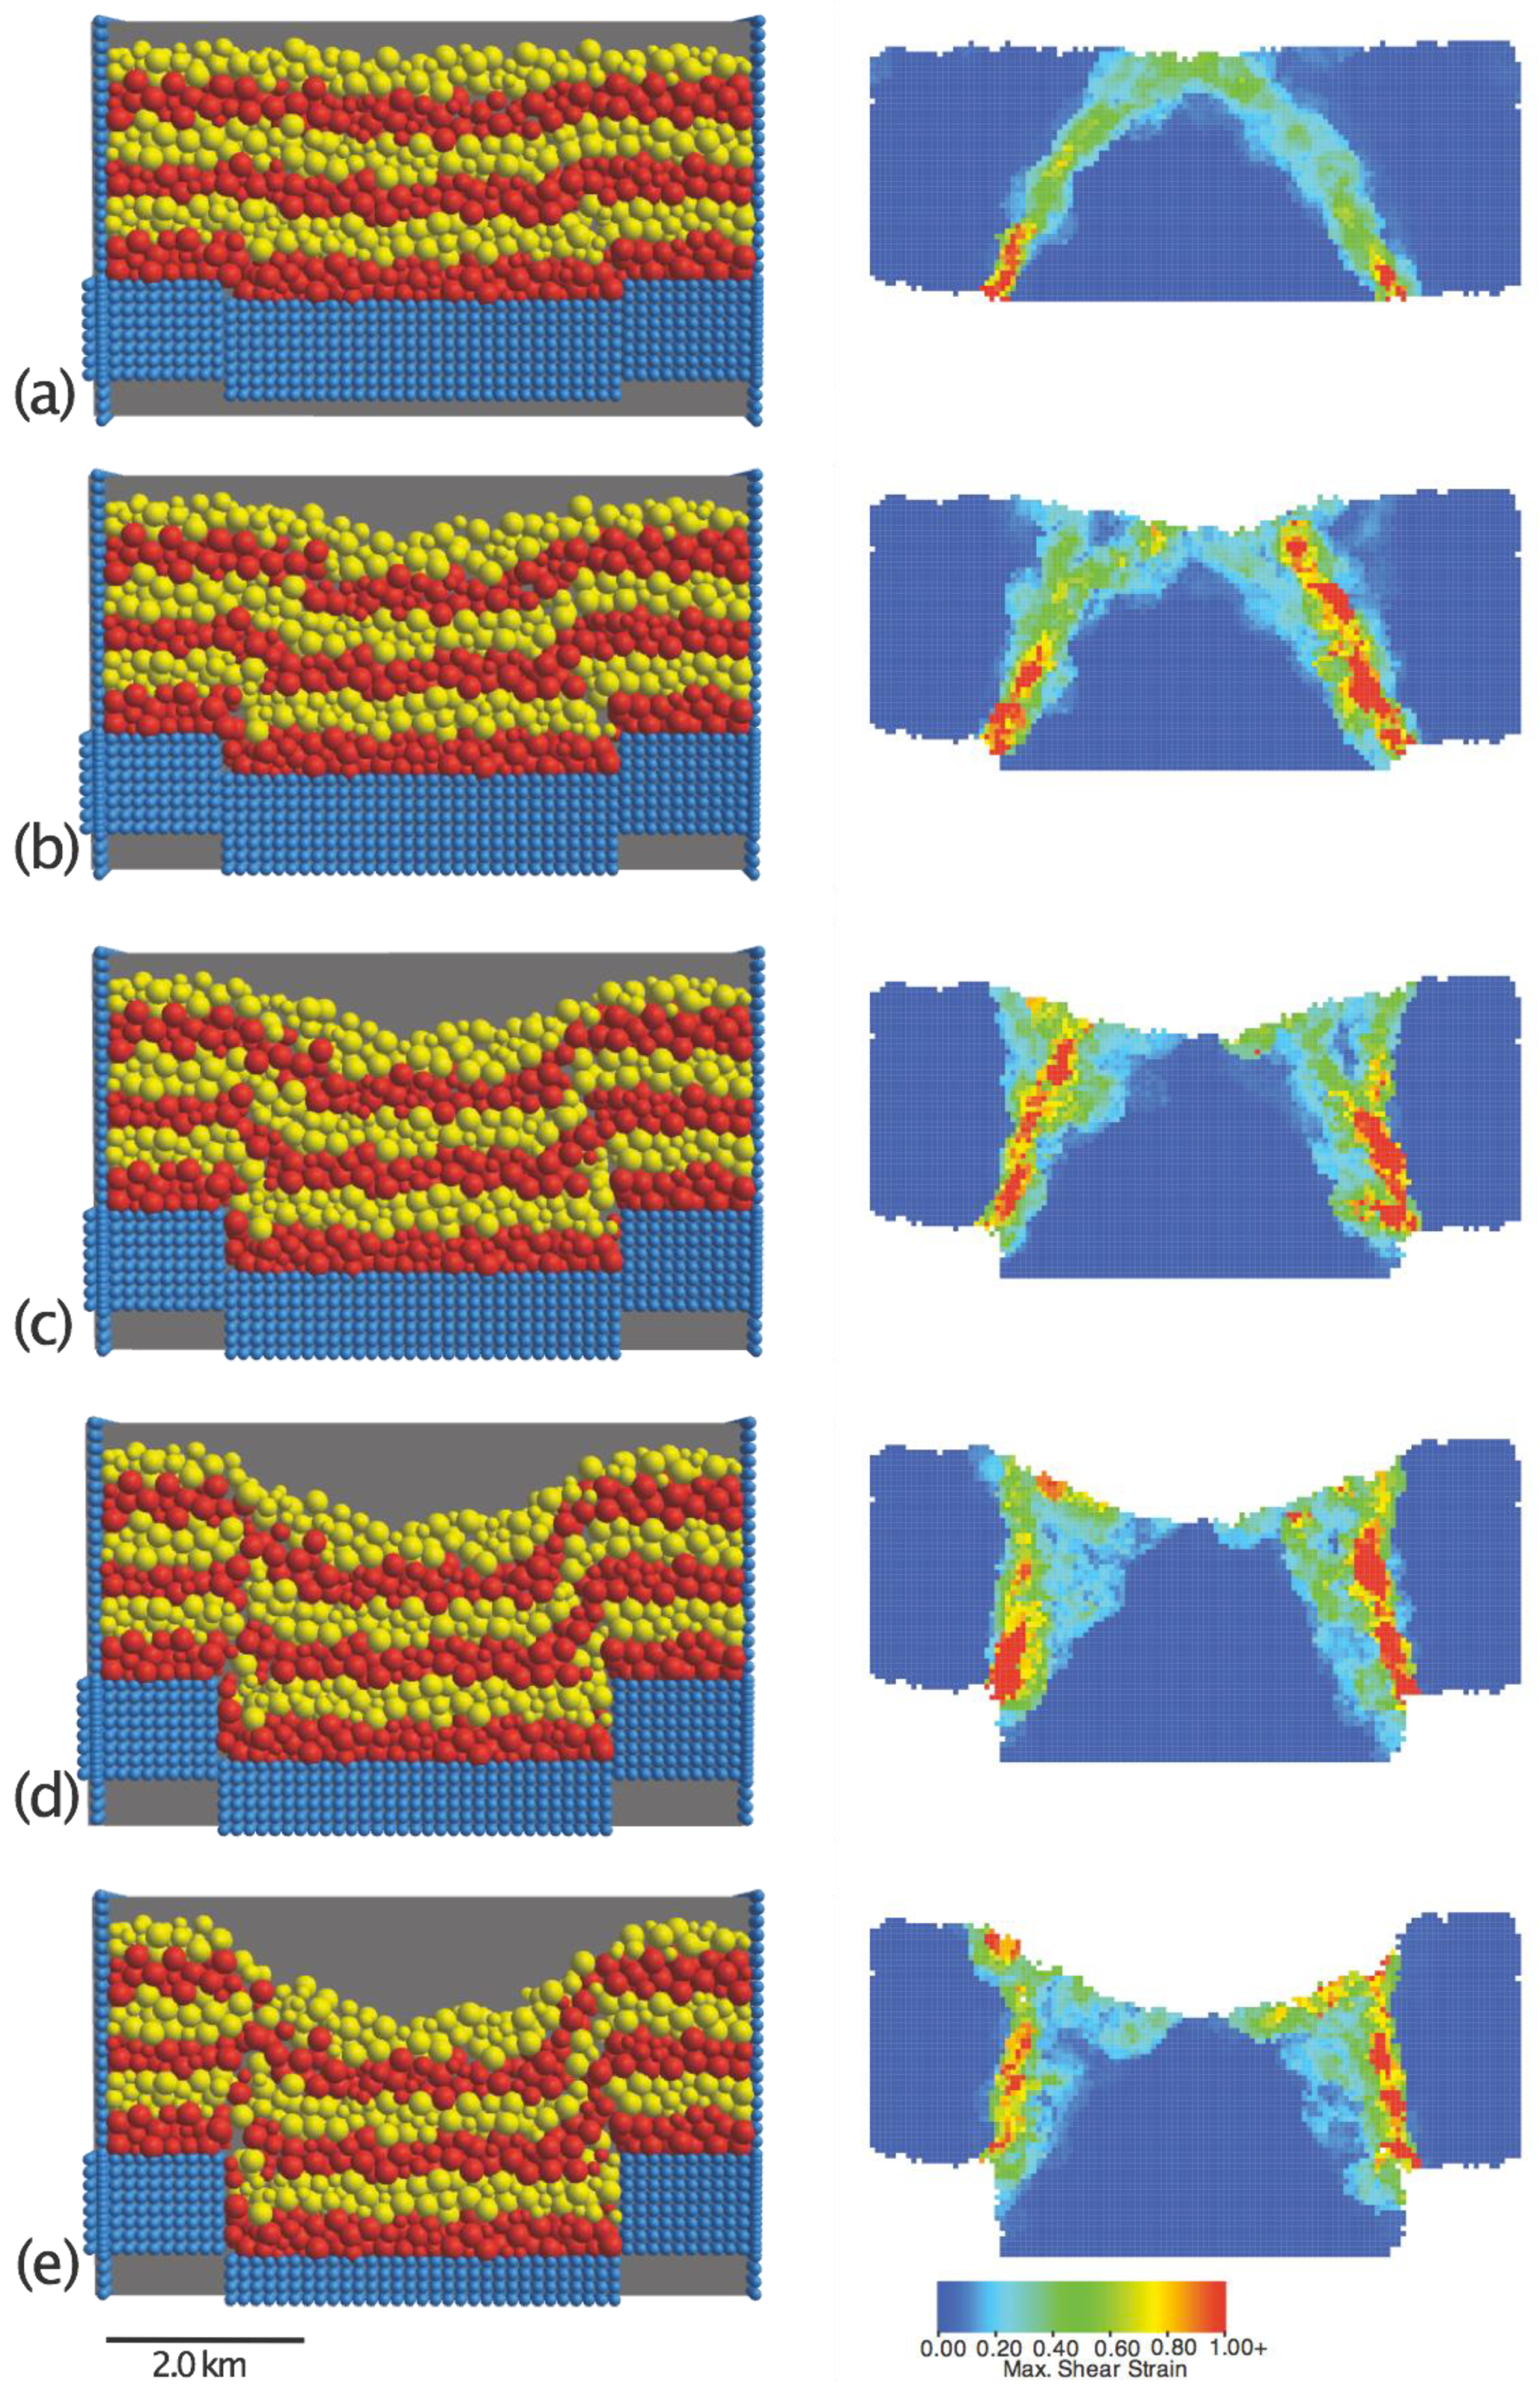
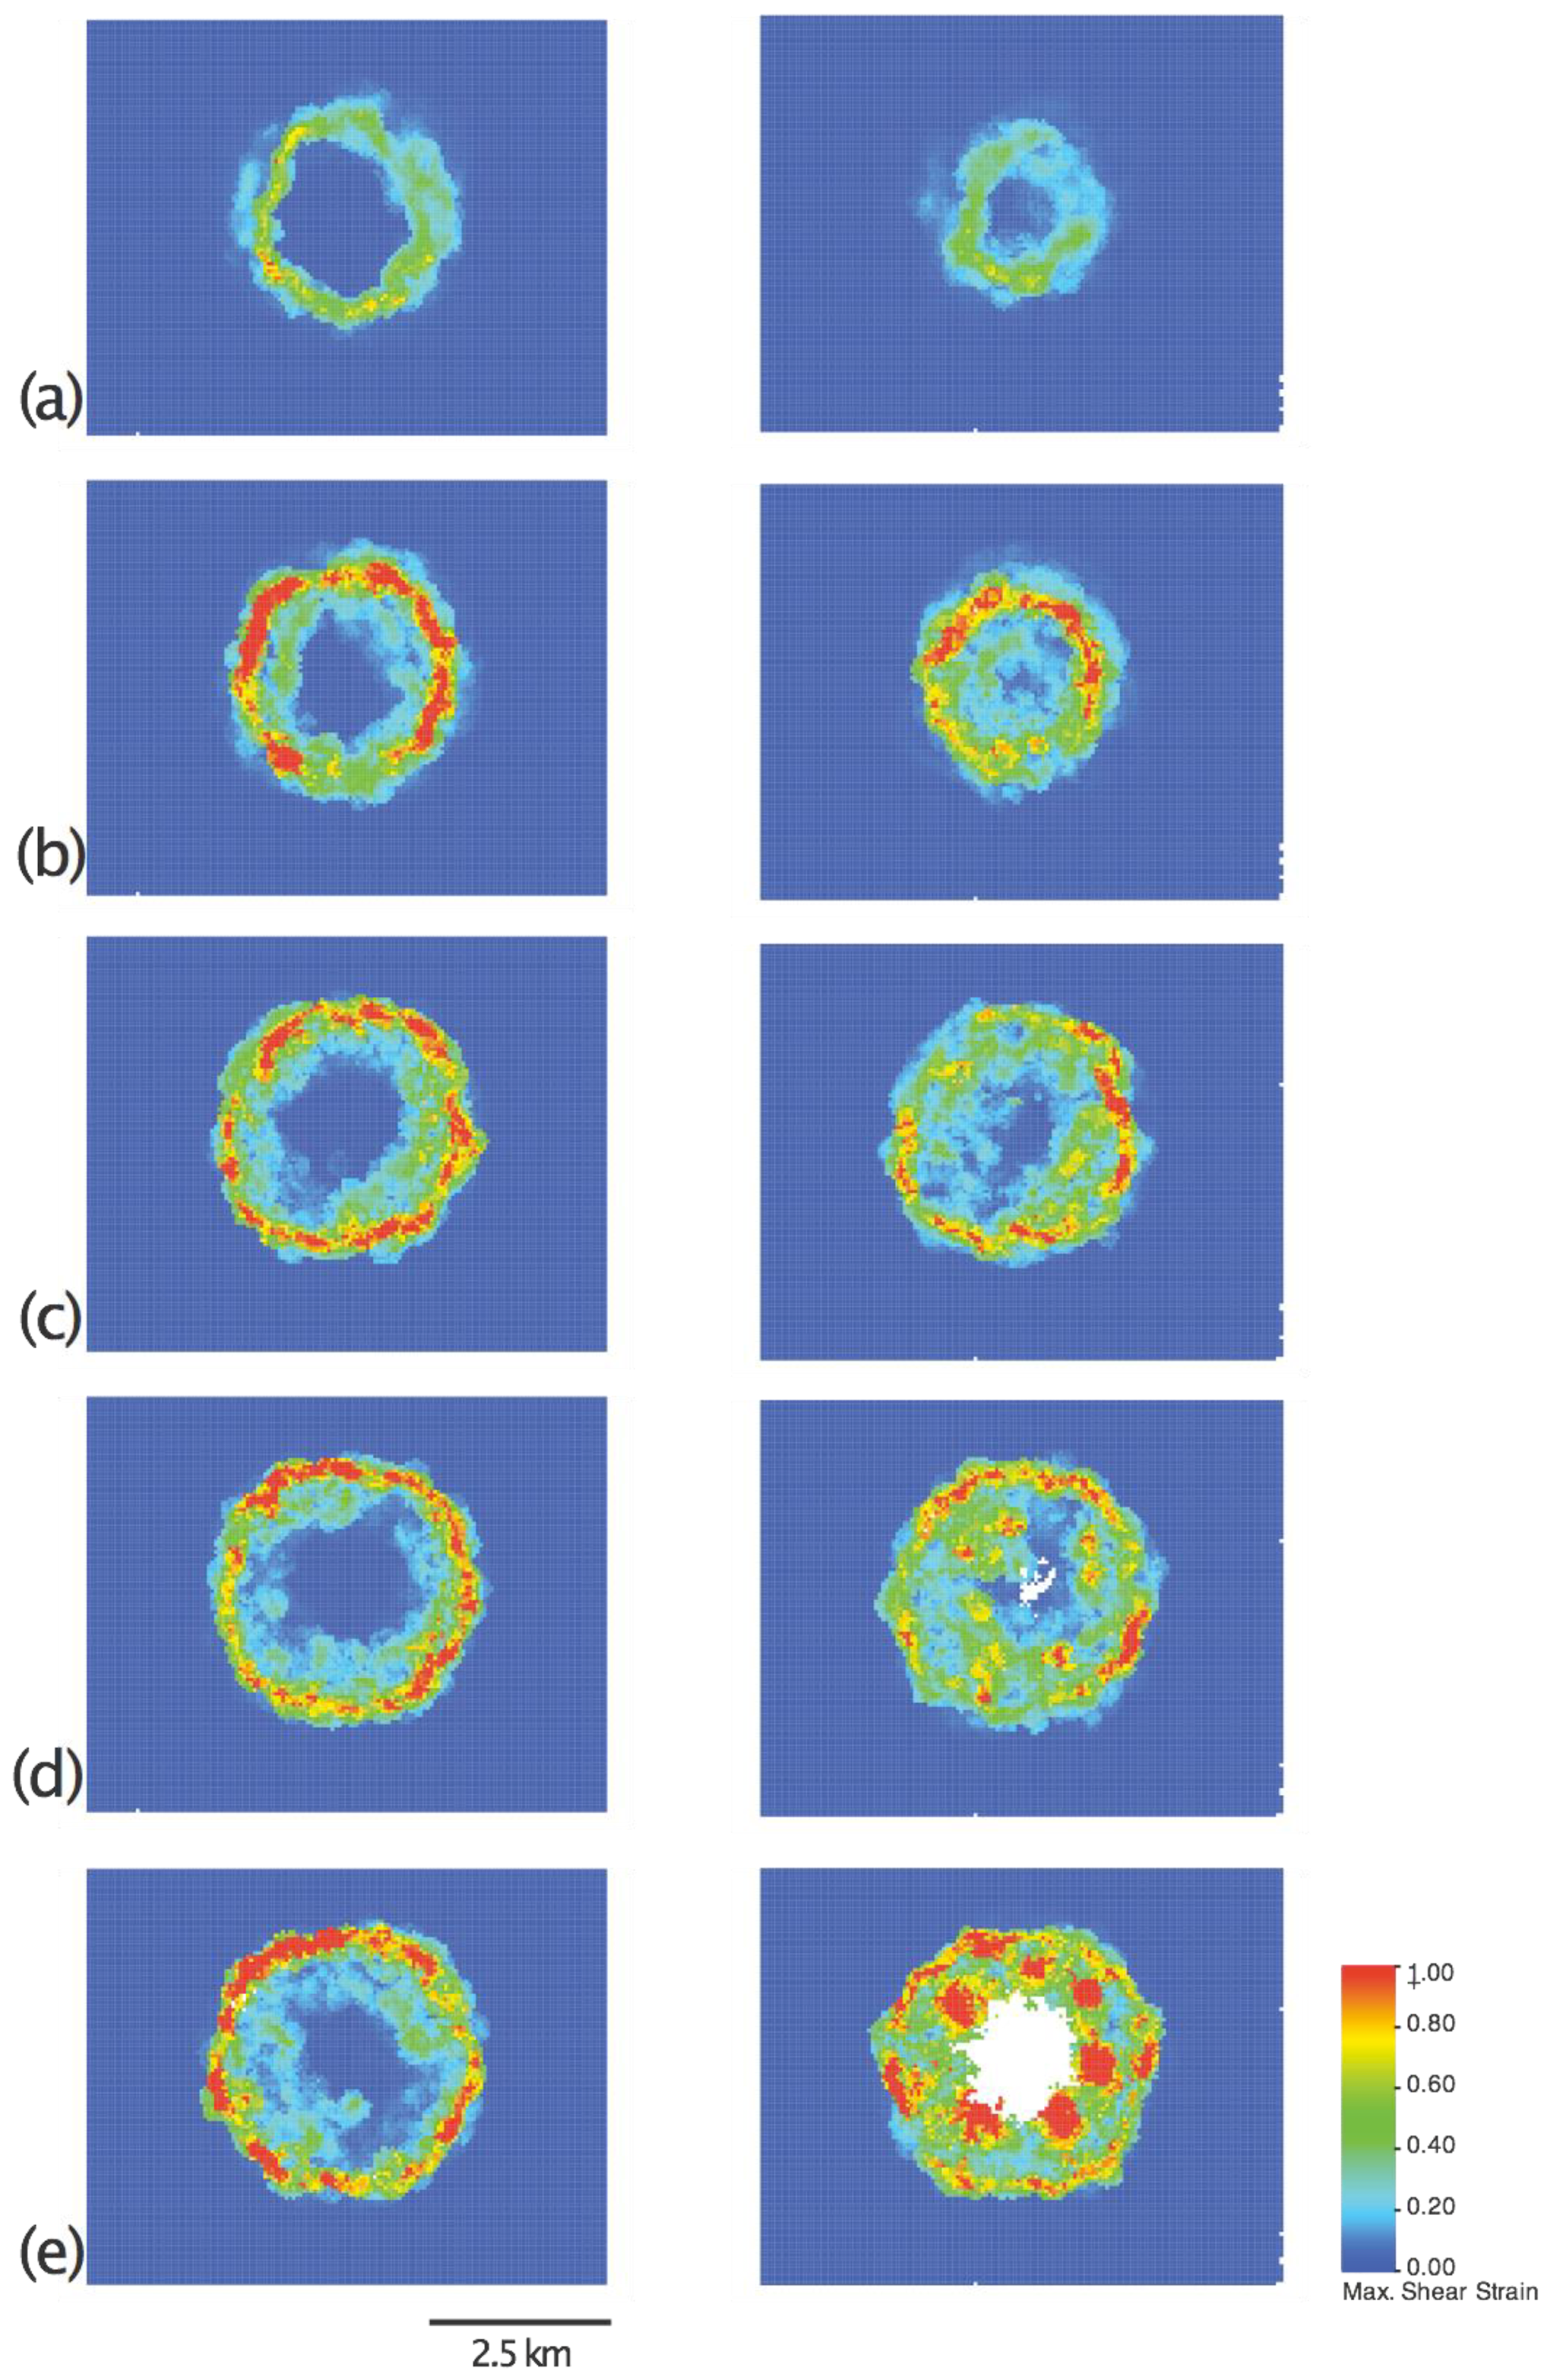
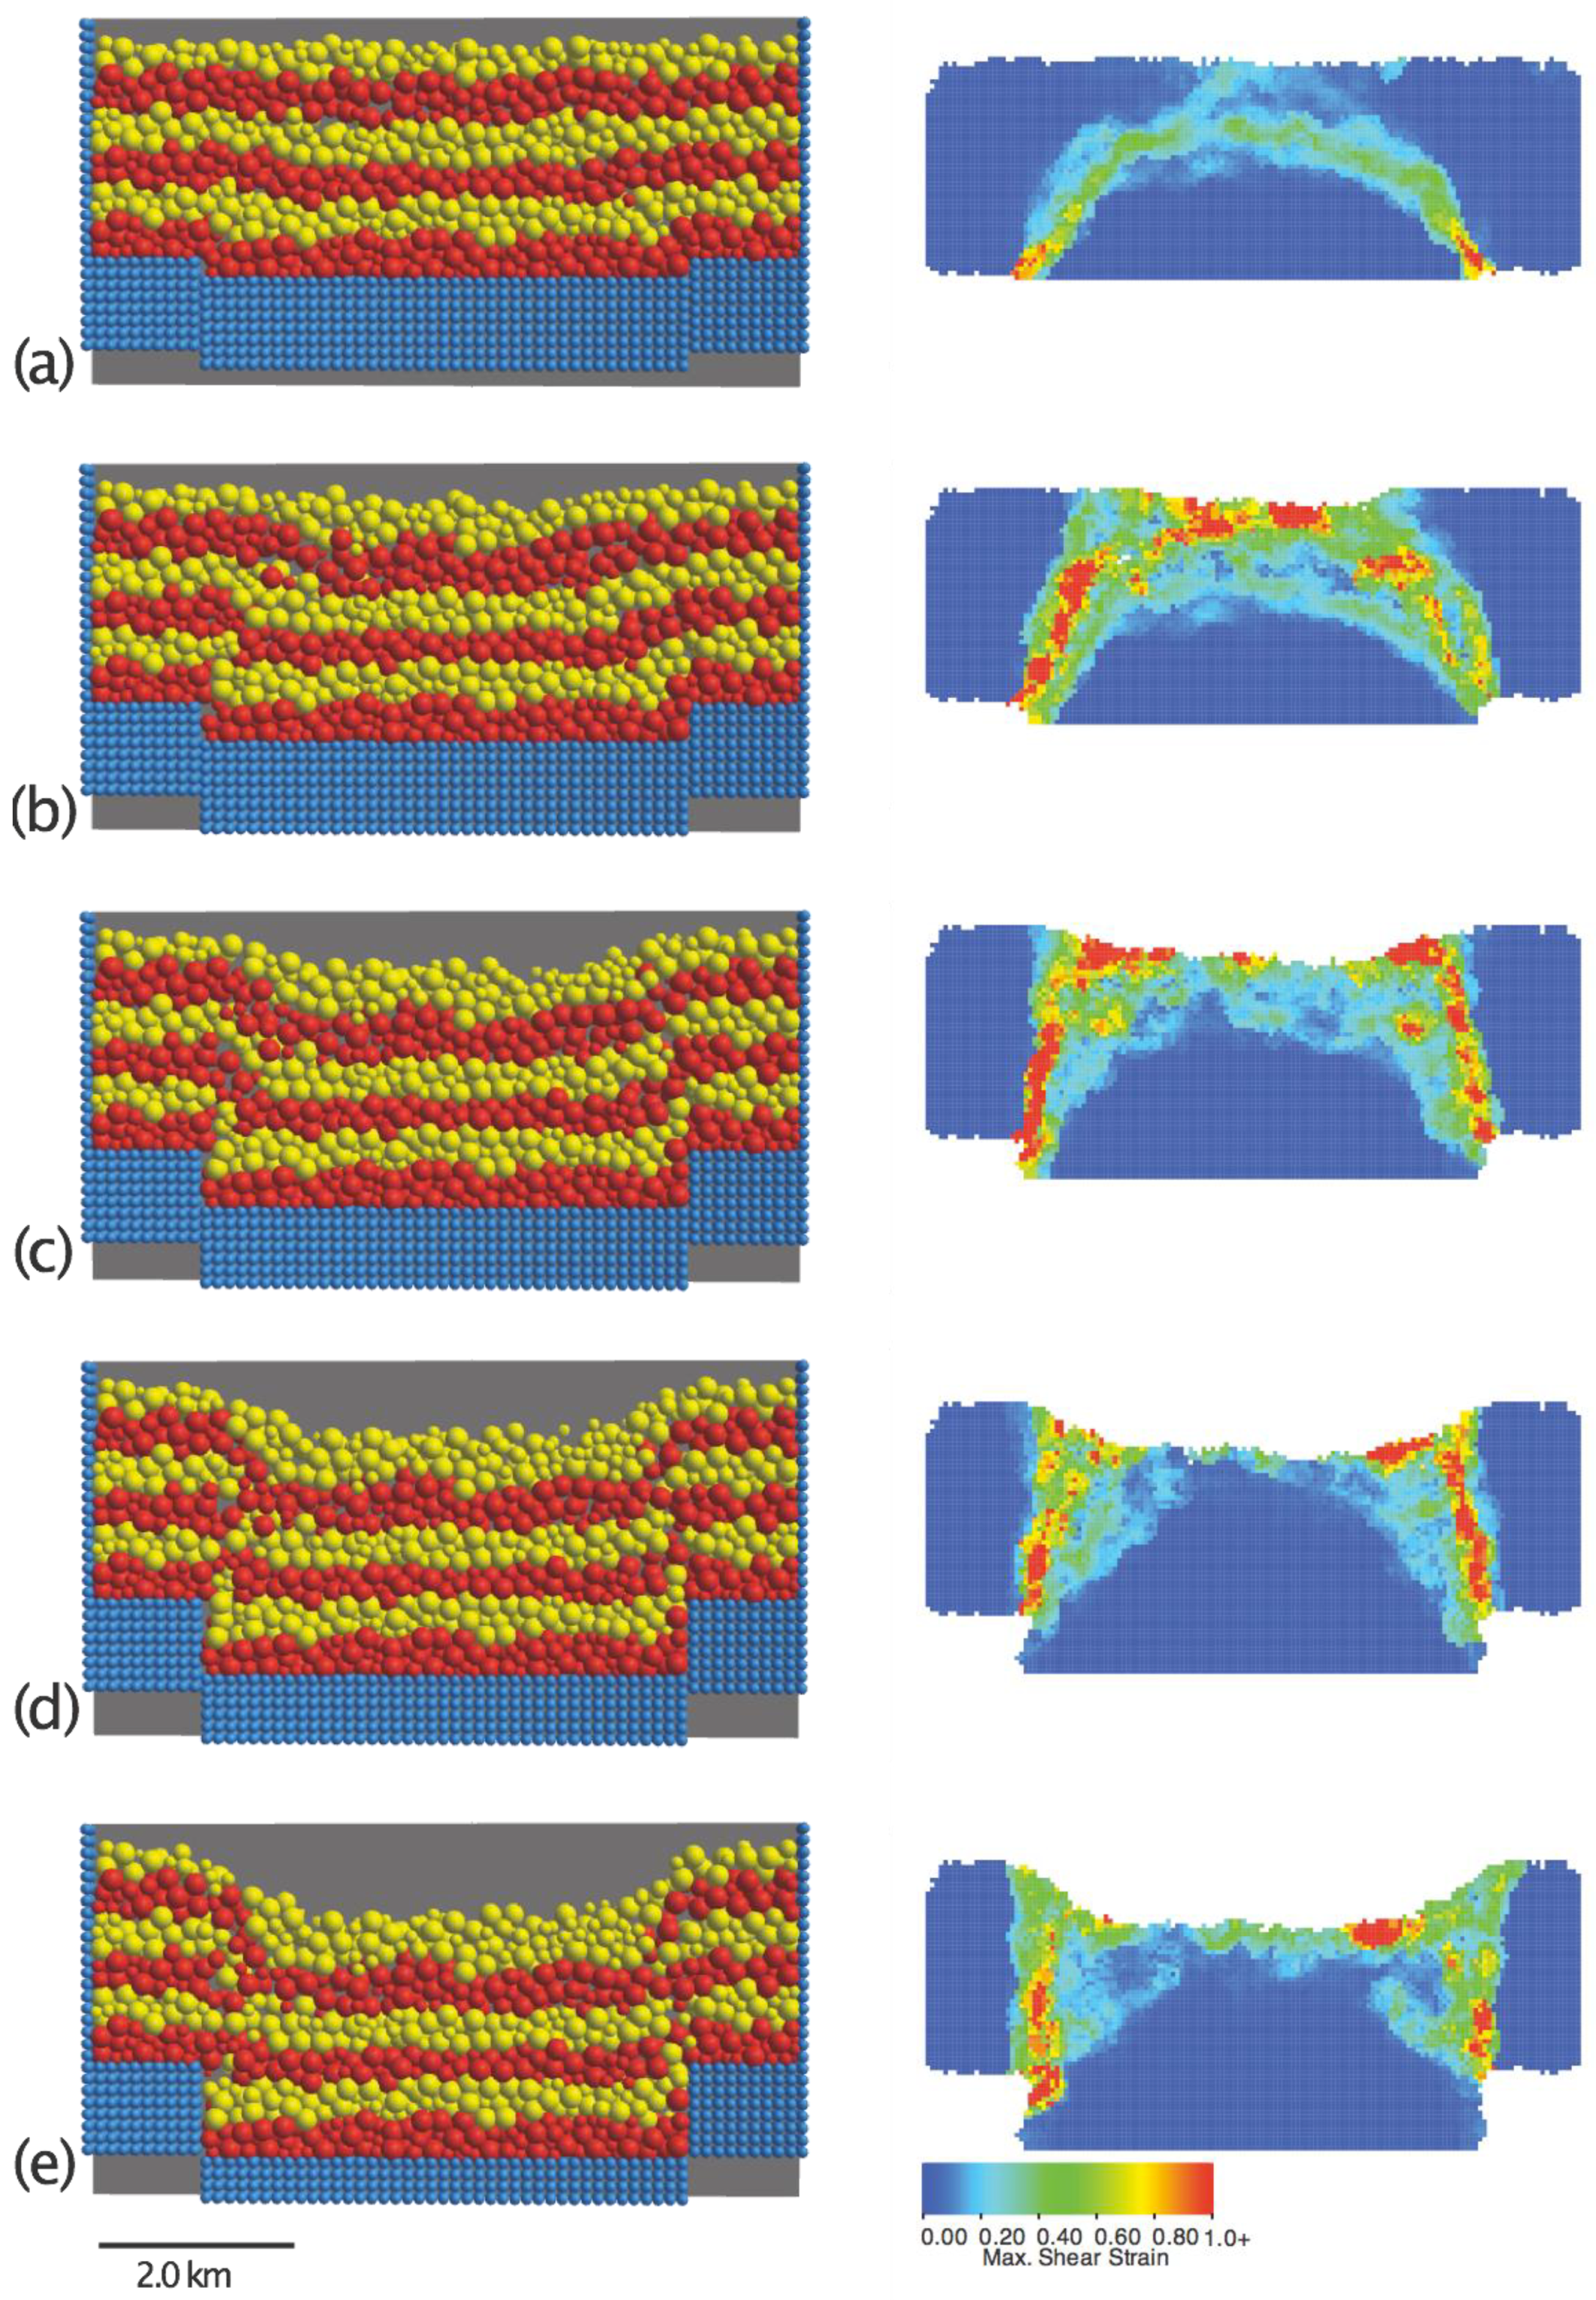
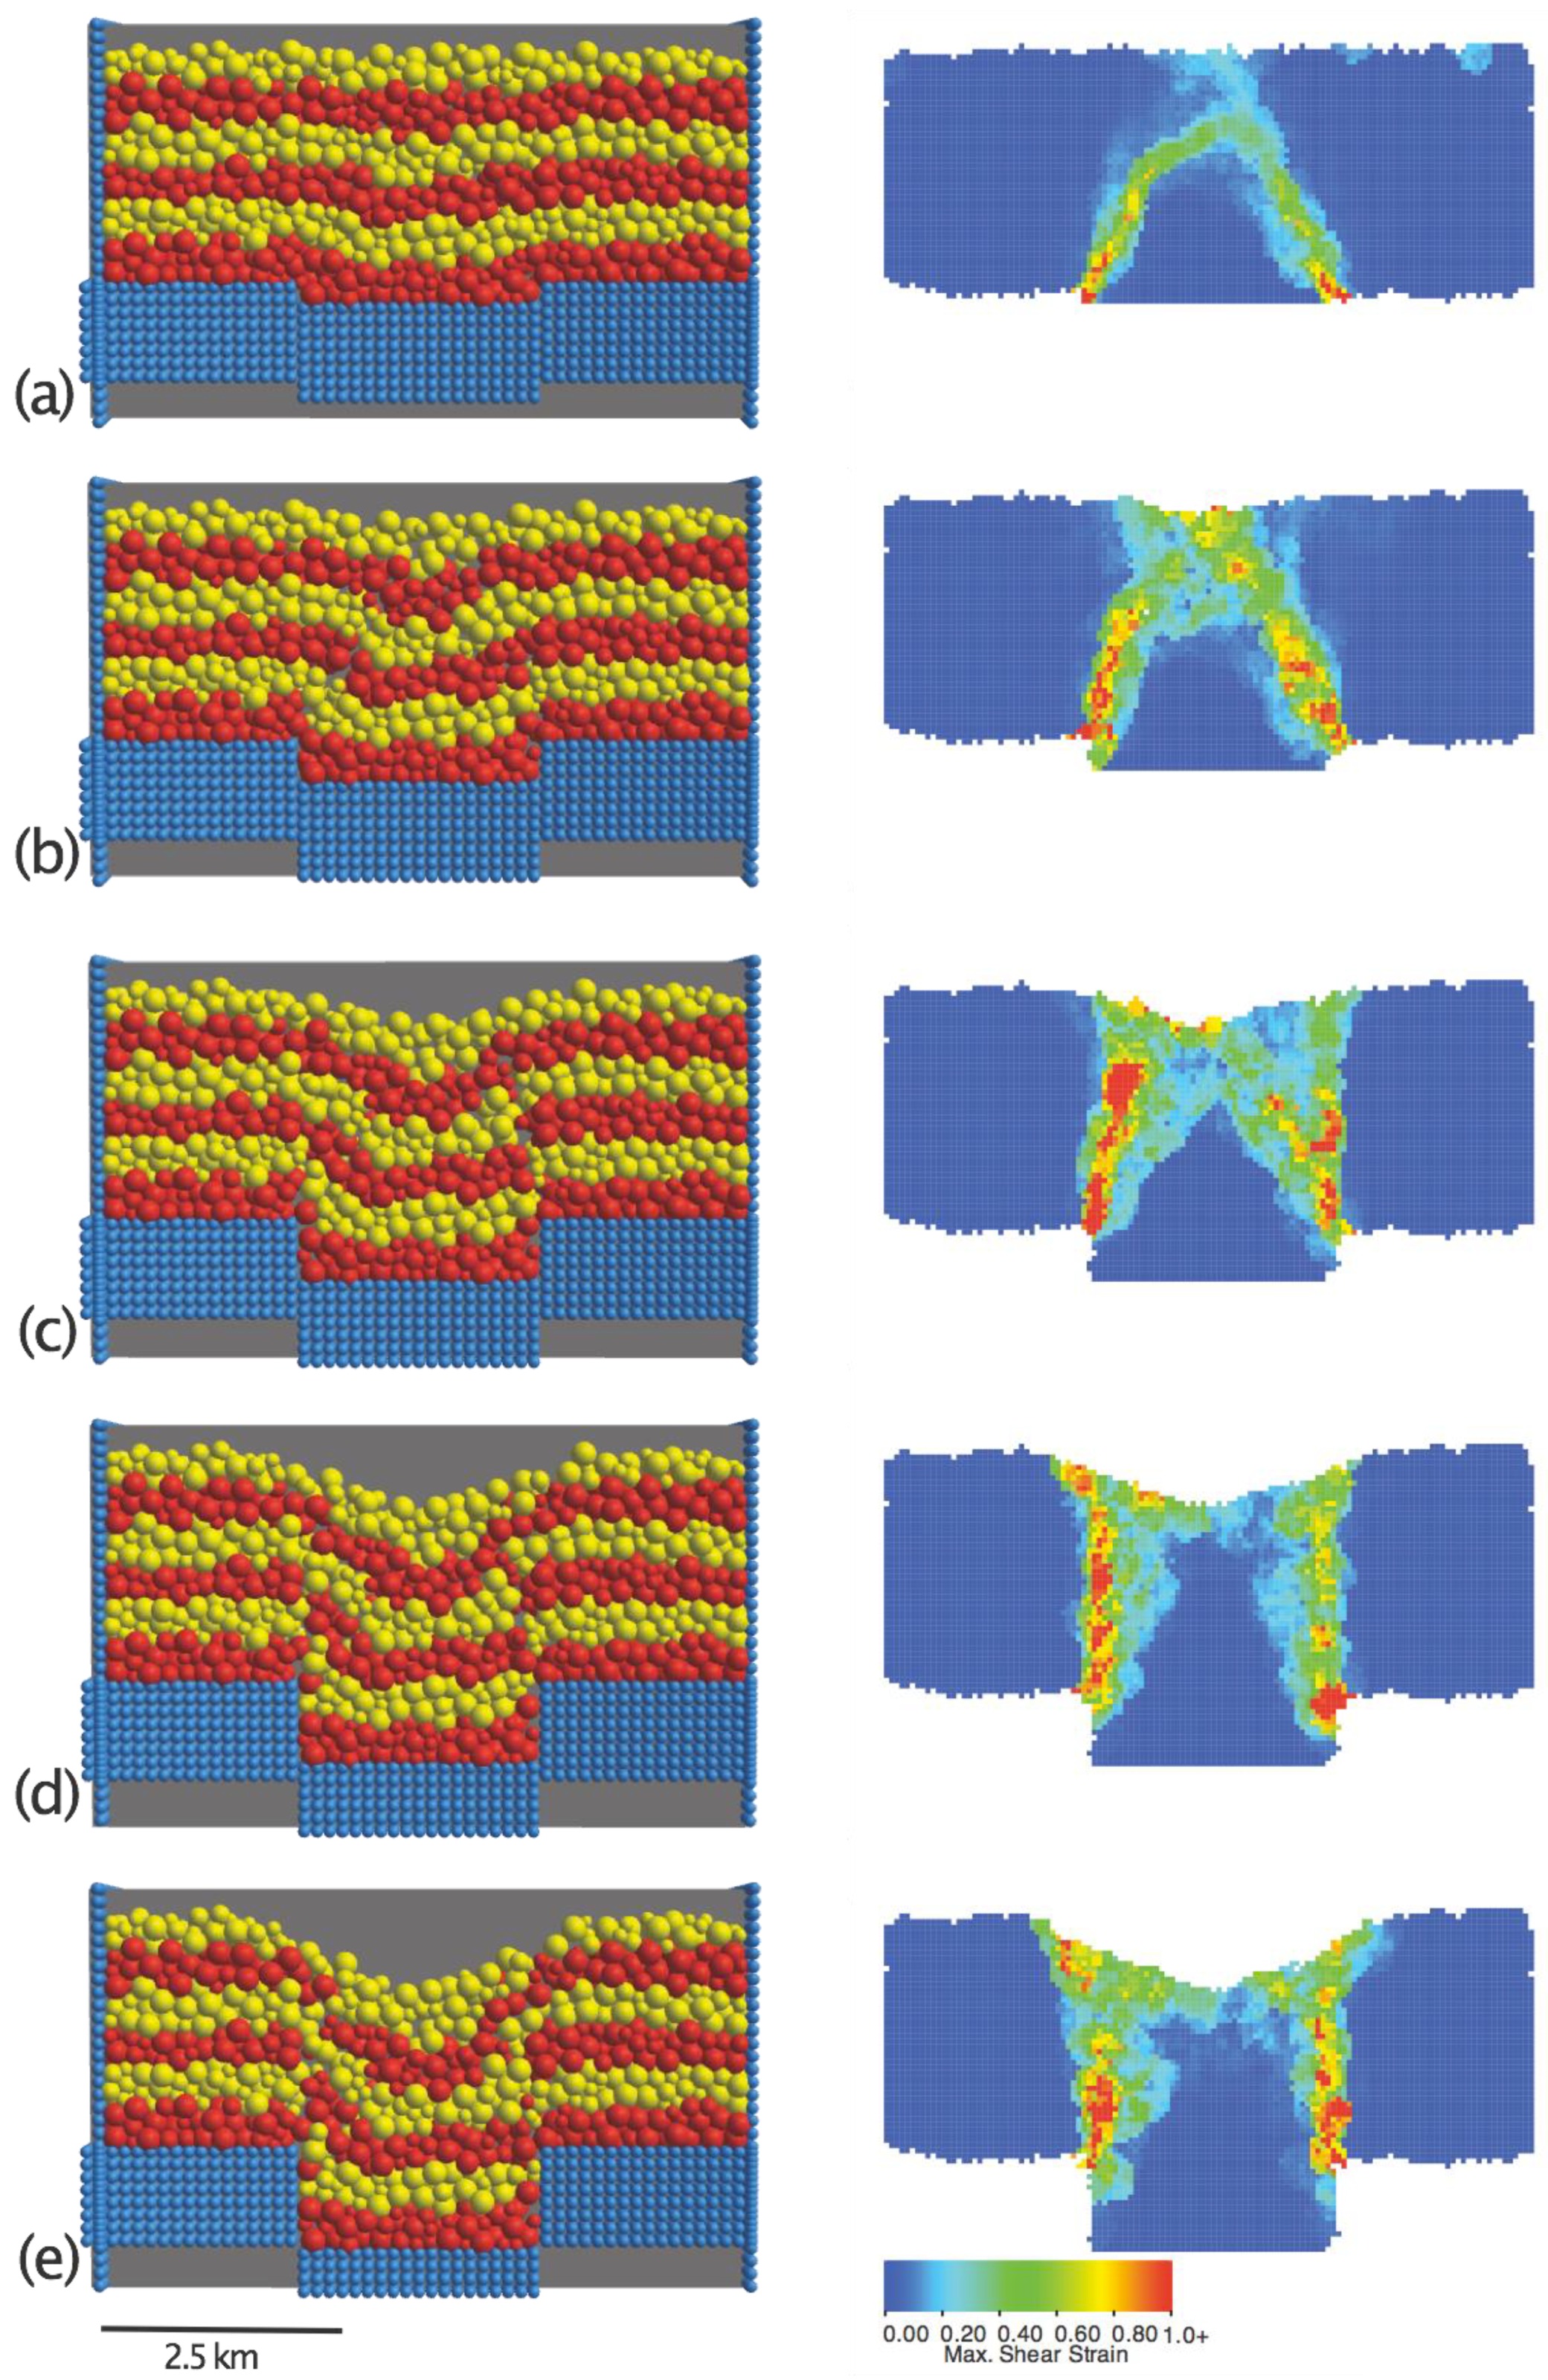
3.1. Experiment 1: Basal Piston with a Circular Top

In the first experiment (Figure 3a and Figure 4) the basal piston was cylindrical with a radius of 2000 m. The final surface geometry observed in this experiment (Figure 3a) shows a circular/annular zone of ring faulting enclosing an area approximately 4.3 km in diameter, which is located directly above the subsiding piston at depth. This central area enclosed by the ring faulting is not visibly faulted at the surface. There is no marked asymmetry in the surface structure. The final surface subsidence is concentric and reaches a maximum of ca. 1000 m in the central part of the caldera, equivalent to the chamber roof displacement at depth (Figure 3a). However, the final subsidence pattern is achieved through progressive widening of the caldera through time (shown in Figure 4). Initially, the subsidence is minor and sag-like at the surface, with only a small central area subsiding to any great extent (Figure 4a). However, this phase quickly gives way to surface subsidence that is more piston-like and homogenous, with a central area subsiding almost coherently as a block (Figure 4b). This pattern of subsidence continues with subsequent piston displacement, and it is notable that this broadly circular zone widens radially with time (Figure 4c–e).
We can examine the geometric and incremental shear strain evolution of this model in two vertical cross sections (A and B) which intersect at the center of the caldera (Figure 2b); overall the evolution of the two sections is very similar. In both cross sections (Figure 5 and Figure 6), it can be seen that the first structures to form are two outward-dipping, curved, reverse faults (dipping ca. 65 degrees at depth, 35–40 degrees nearer the surface) which nucleate at the edges of the subsiding block and propagate upwards (Figure 5a,b and Figure 6a,b), similar to the structure seen in 2D studies. These ring faults accommodate much of the initial displacement of the base and they intersect the ground surface (but not each other) to define a central, bell-shaped, subsiding block (Figure 5a,b and Figure 6a,b). Vertical to steeply dipping (70–90 degrees) reverse faults subsequently develop after this initial phase of reverse faulting; these faults also root at the edges of the subsiding piston and enclose the earlier ring faults (Figure 5c,d and Figure 6c,d). With continued piston subsidence these faults become dominant, accommodating much of the displacement (Figure 5d and Figure 6d). In the upper part of the cover, these faults become shallower and link into normal faults (dipping at ca. 60–70 degrees) that define the caldera (Figure 5d,e and Figure 6c–e). A final feature of note is the near-surface zones of high shear strain developed at the caldera margins in the final stages of the model; these are collapse features (landslides) developed when the caldera walls become over-steepened (Figure 5d,e and Figure 6d,e), not before seen in numerical simulations of caldera collapse. The final caldera in these sections is slightly wider than the subsiding block and contains a central “plug” of cover material that is almost intact, bounded by two marginal zones of inwardly dipping and faulted strata (Figure 5e and Figure 6e; cf. Figure 1).
In order to gain a better understanding of the internal development of this model, the evolution of incremental shear strain on two horizontal sections through the model (C and D, located at 1000 and 1500 m from the base of the model, respectively—Figure 2b). These novel results are shown in Figure 7. After 200 m of basal piston subsidence, both sections show continuous circular/ring fault zones, although there is a marked decrease of the diameter of this ring fault between sections C and D, reflecting the bell-shaped nature of the reverse faults in 3D at this stage (Figure 7a). The overall incremental shear strain is low, reflecting the distributed, diffuse nature of deformation at this stage. With continued piston subsidence (400 m), both sections show a more distinct ring fault zone. This ring fault zone has widened, expressing the structural change seen in the 2D sections from moderately dipping to steep reverse faults and their propagation to the surface (cf. Figure 5, Figure 6b, and Figure 7b). Note that the intensity of deformation in this fault zone is not constant but varies quite markedly along the structure. After 600 m of piston subsidence the ring fault zone has widened further, expressing the structural change seen in the 2D sections from reverse faults to enclosing steep normal faults (cf. Figure 5, Figure 6c, and Figure 7c). During the final stages of piston subsidence (800 and 1000 m) the fault zones only widen to a minor degree, but section D shows the spectacular development of collapse structures within the caldera (expressed as six small circular zones of high shear strain; Figure 7d,e). Note that this caldera is characterized by a relatively flat base and by narrow flanking structures.

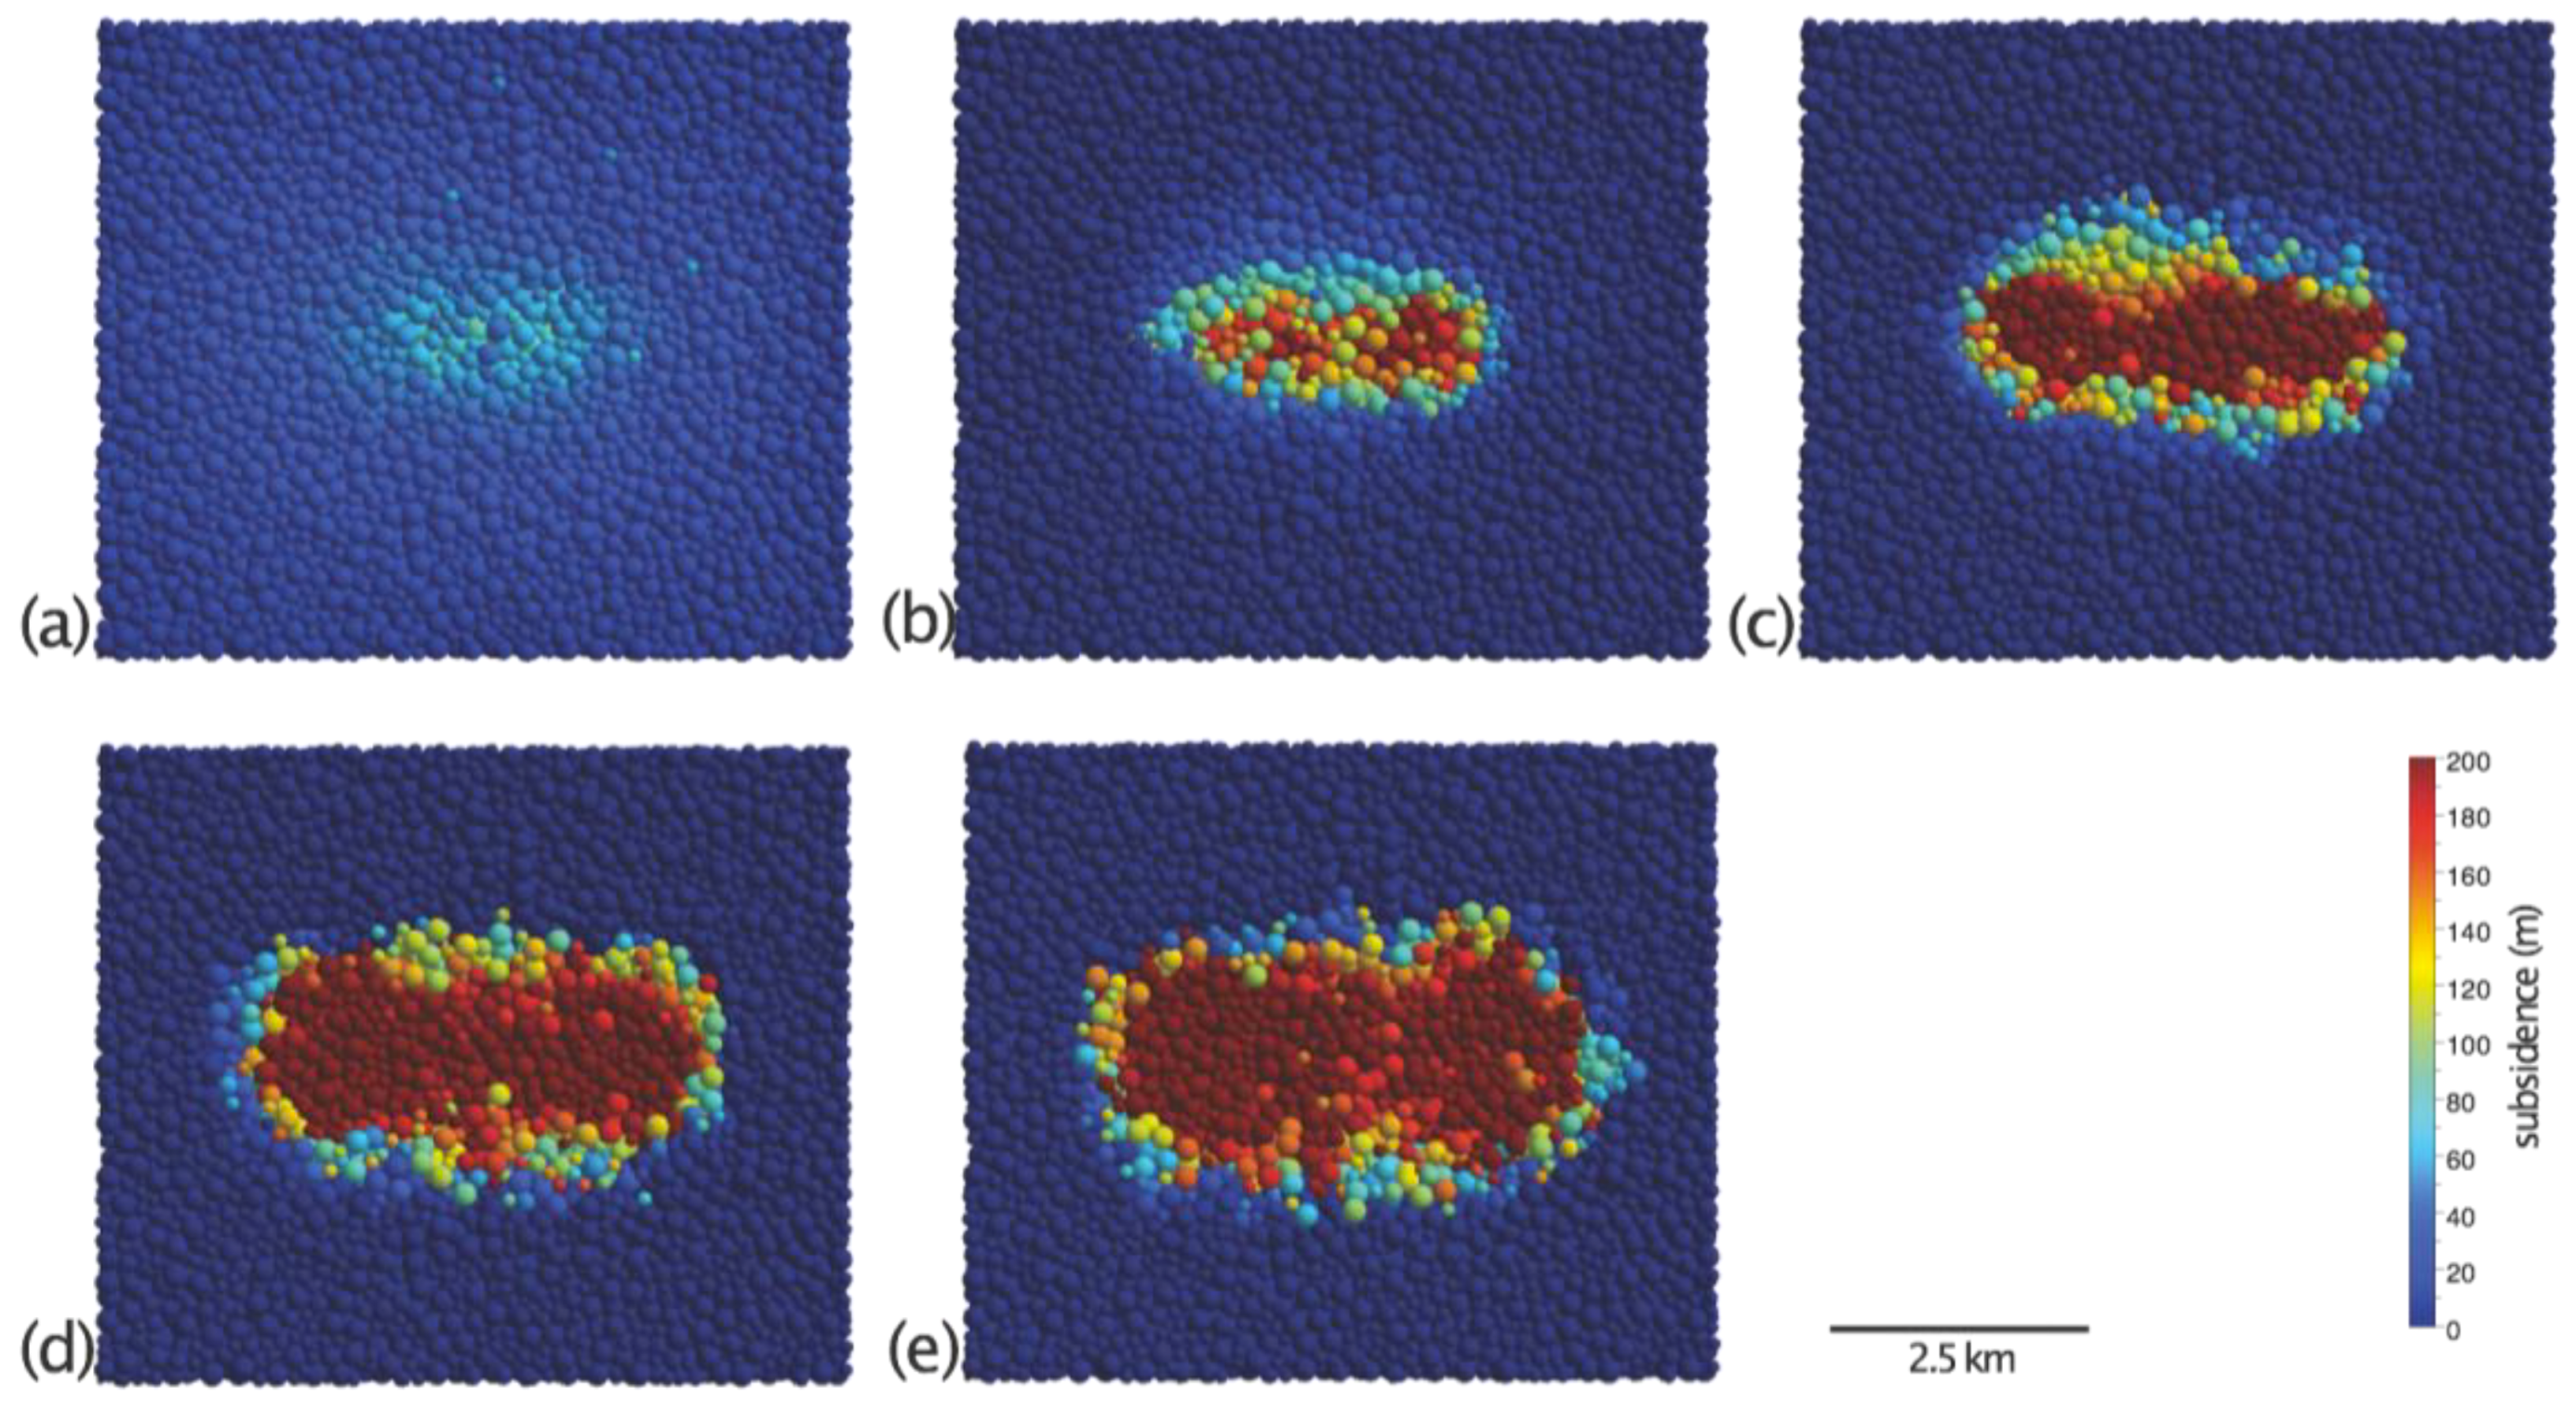
3.2. Experiment 2: Basal Piston with a Rectangular Top

In the second experiment (Figure 3b and Figure 8) the subsiding piston was rectangular in plan view with dimensions of 5000 m by 2500 m. The final surface geometry observed in this experiment (Figure 3b) shows an approximately elliptical zone of faulting with axes 5.3 km and 2.8 km, which is located directly above the subsiding piston. This zone of faulting encloses an elongate, elliptical, central area which is not visibly faulted. The final subsidence reaches a maximum of ca. 1000 m in the narrow, central part of the caldera (Figure 3b), with the final subsidence pattern achieved through incremental widening of the caldera through time (Figure 8). Initially, after 200 m of downward piston displacement, subsidence is rather minor, diffuse, and sag-like at the surface and is confined to a small central zone (Figure 8a). However, after 400 m of piston displacement, this gives way to a zone of increased subsidence initially broadly elliptical in shape (Figure 8b). With continued piston displacement, this zone widens and lengthens with time (Figure 8c). In the final stages of piston displacement (800 and 1000 m), subsidence is quite uniform across the caldera, which now has a distinct boundary/edge (Figure 8d,e).
The geometric and shear strain evolution of this model in a series of 2D cross sections show the manner in which the caldera develops internally through time. Shown in Figure 9 and Figure 10 are the geometric and incremental shear strain evolution in two vertical cross sections (A and B) which intersect at the center of the caldera (Figure 2b); the evolution of the two cross sections is very distinct. In the section taken along the length of the subsiding piston (A, Figure 9), the first structures to form (after 200 m of downward piston displacement) are two outward-dipping, curved reverse faults (dipping ca. 65 degrees at depth, shallowing to sub-horizontal) which nucleate at the edges of the subsiding block and propagate upwards (Figure 9a). These faults do not intersect the ground surface but rather link at depth to define a wide, bell-shaped, subsiding block with only minor subsidence at the surface (Figure 9a). With continued piston displacement (400 m), vertical to steeply dipping (70–90 degrees) reverse faults develop; these faults also root at the edges of the subsiding piston (Figure 9b). Marked subsidence is now visible at the surface. With continued piston subsidence (600 m) these faults become dominant, accommodating much of the displacement (Figure 9c). As displacement continues, in the upper part of the cover, the steep–vertical faults link with shallower, normal faults (dipping at ca. 60 degrees) that define the caldera flanks (Figure 9d,e). Final features of note are the near-surface zones of high shear strain developed at the caldera margins in the final stages of the model; these are collapse features (landslides) developed when the caldera walls become over-steepened (Figure 9d,e). In the section across the subsiding piston (B, Figure 10), the first structures to form (after 200 m piston displacement) are also two outward-dipping, curved reverse faults (dipping ca. 65 degrees at depth, shallowing before intersecting near the surface) which nucleate at the edges of the subsiding block and propagate upwards (Figure 10a). These faults define a narrow central, bell-shaped, subsiding block with only minor subsidence at the ground surface (Figure 10a). After 400 m piston displacement, faulting propagates to the free surface but in a complex manner (Figure 10b). With continued piston displacement the faulting at depth takes the form of steep–vertical normal and reverse faults (Figure 10c). After 800 and 1000 m piston displacement, these steep to vertical faults link with shallower normal faults (dipping at ca. 60 degrees) that define the caldera flanks (Figure 10d,e). Note that in this cross section, the caldera is dominated by flanking structures and only has a very narrow, flat base.
In order to gain a better understanding of the internal development of this model, the evolution of incremental shear strain on two horizontal sections (C and D, located at 1000 and 1500 m from the base of the model, respectively—Figure 2b) is shown in Figure 11. After 200 m of piston subsidence, both sections show elongate, elliptical ring fault zones, although there is a marked difference in the form of these faults between sections C and D, reflecting the bell-shaped nature of the fault in 3D and the level at which the section is cut (Figure 11a). With continued subsidence (after 400 and 600 m) both sections show a widening zone of faulting, expressing the change seen the 2D sections from moderately dipping to steep–vertical reverse faults (Figure 11b,c). However, at this stage the faults in the upper section (D) are still not continuous and do not define a simple ring structure; they are quite complex and seem to be almost offset in places (see Figure 11b,c). During the final stages of subsidence, the ring fault zones only widen to a minor degree, but section D shows the notable development of collapse structures within the caldera (expressed as small circular zones of high shear strain; Figure 11e).

4. Discussion

The experiments presented here—the first 3D numerical models of the internal, faulted structure of calderas—have demonstrated the manner in which calderas initiate and grow in frictional materials above a subsiding magma chamber. They have shown the influence that chamber roof geometry has on the style of caldera growth and confirmed the results of previous analogue and numerical modeling studies (e.g., [2,5,6,8]).
While the surface expression and structure of active calderas is often observable, their deeper structure is often concealed and/or difficult to assess; therefore, the experimental results documented here provide insights into the possible geometry of structures at depth in calderas and emphasize some characteristic features. Firstly, as in 2D, reverse (outward-dipping) faults are a characteristic feature of cover deformation and act along with normal faults to accommodate the magma chamber roof subsidence; they are a consistent feature of all experiments. This is supported by their occurrence in sandbox models with similar boundary conditions (e.g., [1,5,8,17,25,33,34] Figure 1a–c) and by recent micro-seismic data from the Axial Seamount (offshore Oregon, USA) ([14]; Figure 1f). These reverse faults are consistently the first structures to develop, and we see that they take the form of bell- or dome-shaped surfaces (ring faults) in the initial stages of magma chamber roof subsidence (Figure 7a and Figure 11a). In summary, the initial ring faults dip outwards toward the caldera edges and may or may not intersect the surface. This study also showed that they are not simple structures in 3D, with variable strain and offset along the fault structure (Figure 7b,d and Figure 11b,d). Secondly, with continued chamber roof collapse, vertical to steeply dipping normal ring faults subsequently form and enclose the earlier ring faults. At shallower levels, faulting processes are dominated by inward-dipping normal faults which define the caldera margins. Thirdly, as a result, all calderas widen with time due to the transition from initial, outward-dipping reverse faults to enclosing, inward-dipping normal faults and, finally, to lateral collapse of the caldera walls. This is a general feature, seen in both analogue models and natural examples (Figure 1). The results also confirm that the evolutionary stages proposed from 2D numerical and analogue models can be generalized to three dimensions, although significant differences between long- and short-axis geometries do occur when the piston is elongated. Long-axis cross sections show a long, almost flat caldera base, whereas short-axis cross sections have a very narrow base and are dominated by flanking and collapse structures.
The results shown here are strikingly similar to those presented in data from both surface and recent submarine and seismic studies (e.g., [3,11,12,13,14,15,18]). All these studies demonstrated the importance of outward-dipping reverse faults. At the Axial Seamount, Levy et al. [14]. documented micro-earthquakes that occurred during 2015–2016 that were located on portions of an outward-dipping ring fault system that was reactivated in response to the inflation and deflation of the underlying magma chamber (Figure 1f). These micro-earthquake data compare very favorably to the zones of high shear strain developed during early roof chamber subsidence reported here (cf. Figure 1f, Figure 5a,b and Figure 10a,b). In addition, widening of the caldera with time has now been confirmed by observations both in the Miyakejima caldera, Japan [3] and in the 2018 eruption of Kilauea in Hawaii [15]. The impact of these findings on seismology and deformation models for caldera collapses is clear: one cannot solely think of a simple ring fault structure above a collapsing magma chamber roof, or solely of the occurrence of either normal or reverse faults. It appears that reality is much more complicated during both inflation and deflation of magma chambers. The role of outward-dipping, reverse ring faults, in particular, seems to be overlooked.
The modelling approach presented here offers an alternative, complementary approach to analogue modelling. One distinct advantage is the non-destructive monitoring of internal structures and their evolution in 3D. This allows us to see the manner in which ring faults initiate, propagate, and evolve, which cannot be observed in 2D. The consistency between the analogue and numerical experiments presented here gives us confidence in our ability to model upper-crustal materials under these and perhaps other, more complex boundary conditions. In this study any cohesion of the rock mass was ignored as we assumed that in a faulted and fractured rock, mass cohesion is negligible compared to normal stresses at depth. However, this could be improved by introducing a complex (cohesional) stratigraphy in the shallower crust. The models presented here have only considered the effect of chamber roof geometry; they do not consider the effects of regional stress, depth to the magma chamber, temperature, or magma chamber inflation prior to the caldera collapse. These issues and other refinements are the subject of ongoing work.

5. Conclusions

In the 3D experiments of caldera development presented here, both normal and reverse ring faults accommodate deeper subsidence at shallower levels. The incremental shear strain analysis shows that curved, outward-dipping, reverse ring faults are consistently the first structures to develop; subsequent caldera growth is mainly the result of movement on vertical–steep reverse or steeply inward-dipping normal ring faults that enclose the earlier reverse faults. Compared to 2D simulations, the 3D results show the geometric complexity of ring faulting and variations in strain and fault activity at various stages of development; they often do not display a simple, continuous ring fault structure. Finally, a stage of collapse may be noticed in the uppermost parts of the caldera. All calderas widen with time, and this widening leads to lateral propagation of faults when the subsiding piston is elongate.

Funding

This research received no external funding.

Acknowledgments

Calculation and visualization of the model strains was possible with the generous collaboration of Néstor Cardozo and Rick Allmendinger in providing their program SSPX. High-quality, insightful comments from three reviewers improved the manuscript immensely.

Conflicts of Interest

The authors declare no conflict of interest.

References

  1. Martí, J.; Ablay, G.J.; Redshaw, L.T.; Sparks, R.S.J. Experimental studies of collapse calderas. J. Geol. Soc. 1994, 151, 919–929. [Google Scholar] [CrossRef]
  2. Merle, O.; Roche, O.; Druitt, T.H. Experimental study of caldera formation. J. Geophys. Res. Space Phys. 2000, 105, 395–416. [Google Scholar] [CrossRef]
  3. Geshi, N.; Shimano, T.; Chiba, T.; Nakada, S. Caldera collapse during the 2000 eruption of Miyakejima Volcano, Japan. Bull. Volcanol. 2002, 64, 55–68. [Google Scholar] [CrossRef]
  4. Kusumoto, S.; Takemura, K. Numerical simulation of caldera formation due to collapse of a magma chamber. Geophys. Res. Lett. 2003, 30, 2278. [Google Scholar] [CrossRef]
  5. Geyer, A.; Folch, A.; Martí, J. Relationship between caldera collapse and magma chamber withdrawal: An experimental approach. J. Volcanol. Geotherm. Res. 2006, 157, 375–386. [Google Scholar] [CrossRef]
  6. Acocella, V. Understanding caldera structure and development: An overview of analogue models compared to natural calderas. Earth-Sci. Rev. 2007, 85, 125–160. [Google Scholar] [CrossRef]
  7. Hardy, S. Structural evolution of calderas: Insights from two-dimensional discrete element simulations. Geology 2008, 36, 927–930. [Google Scholar] [CrossRef]
  8. Holohan, E.P.; Troll, V.R.; Vries, B.V.W.D.; Walsh, J.J.; Walter, T.R. Unzipping Long Valley: An explanation for vent migration patterns during an elliptical ring fracture eruption. Geol. 2008, 36, 323–326. [Google Scholar] [CrossRef]
  9. Holohan, E.; Schöpfer, M.; Walsh, J.; Holohan, E. Stress evolution during caldera collapse. Earth Planet. Sci. Lett. 2015, 421, 139–151. [Google Scholar] [CrossRef] [Green Version]
  10. Bathke, H.; Sudhaus, H.; Holohan, E.; Walter, T.R.; Shirzaei, M. An active ring fault detected at Tendürek volcano by using InSAR. J. Geophys. Res. 2013, 118, 4488–4502. [Google Scholar] [CrossRef]
  11. Wilcock, W.S.D.; Tolstoy, M.; Waldhauser, F.; Garcia, C.; Tan, Y.J.; Bohnenstiehl, D.R.; Caplan-Auerbach, J.; Dziak, R.P.; Arnulf, A.F.; Mann, M.E. Seismic constraints on caldera dynamics from the 2015 Axial Seamount eruption. Science 2016, 354, 1395–1399. [Google Scholar] [CrossRef] [PubMed] [Green Version]
  12. Wilcock, W.; Dziak, R.; Tolstoy, M.; Chadwick, W.; Nooner, S.; Bohnenstiel, D.; Caplan-Auerbach, J.; Waldhauser, F.; Arnulf, A.; Ballard, C.; et al. The Recent Volcanic History of Axial Seamount: Geophysical Insights into Past Eruption Dynamics with an Eye Toward Enhanced Observations of Future Eruptions. Oceanography 2018, 31, 114–123. [Google Scholar] [CrossRef] [Green Version]
  13. Nobile, A.; Acocella, V.; Ruch, J.; Aoki, Y.; Borgstrom, S.; Siniscalchi, V.; Geshi, N. Steady subsidence of a repeatedly erupting caldera through InSAR observations: Aso, Japan. Bull. Volcanol. 2017, 79. [Google Scholar] [CrossRef]
  14. Levy, S.; Bohnenstiehl, D.R.; Sprinkle, P.; Boettcher, M.S.; Wilcock, W.S.D.; Tolstoy, M.; Waldhauser, F. Mechanics of fault reactivation before, during, and after the 2015 eruption of Axial Seamount. Geology 2018, 46, 447–450. [Google Scholar] [CrossRef]
  15. Neal, C.A.; Brantley, S.R.; Antolik, L.; Babb, J.L.; Burgess, M.; Calles, K.; Cappos, M.; Chang, J.C.; Conway, S.; Desmither, L.; et al. The 2018 rift eruption and summit collapse of Kīlauea Volcano. Science 2019, 363, 367–374. [Google Scholar] [CrossRef]
  16. Cole, J.W.; Milner, D.M.; Spinks, K.D. Calderas and caldera structures: A review. Earth-Sci. Rev. 2005, 69, 1–26. [Google Scholar] [CrossRef]
  17. Walter, T.R.; Troll, V.R. Formation of caldera periphery faults: An experimental study. Bull. Volcanol. 2001, 63, 191–203. [Google Scholar] [CrossRef]
  18. Parks, M.M.; Heimisson, E.R.; Sigmundsson, F.; Hooper, A.; Vogfjörd, K.S.; Árnadóttir, T.; Ófeigsson, B.; Hreinsdóttir, S.; Hjartardóttir, Á.R.; Einarsson, P.; et al. Evolution of deformation and stress changes during the caldera collapse and dyking at Bárdarbunga, 2014–2015: Implication for triggering of seismicity at nearby Tungnafellsjökull volcano. Earth Planet. Sci. Lett. 2017, 462, 212–223. [Google Scholar] [CrossRef]
  19. Gudmundsson, A. Formation and development of normal-fault calderas and the initiation of large explosive eruptions. Bull. Volcanol. 1998, 60, 160–170. [Google Scholar] [CrossRef]
  20. Kusumoto, S.; Takemura, K. Caldera geometry determined by the depth of the magma chamber. Earth Planet. Space 2005, 57, 17–20. [Google Scholar] [CrossRef]
  21. Gray, J.; Monaghan, J. Numerical modelling of stress fields and fracture around magma chambers. J. Volcanol. Geotherm. Res. 2004, 135, 259–283. [Google Scholar] [CrossRef]
  22. Pinel, V.; Jaupart, C. Caldera formation by magma withdrawal from a reservoir beneath a volcanic edifice. Earth Planet. Sci. Lett. 2005, 230, 273–287. [Google Scholar] [CrossRef]
  23. Gudmundsson, A. Conceptual and numerical models of ring-fault formation. J. Volcanol. Geotherm. Res. 2007, 164, 142–160. [Google Scholar] [CrossRef]
  24. Holohan, E.P.; Schöpfer, M.P.J.; Walsh, J.J. Mechanical and geometric controls on the structural evolution of pit crater and caldera subsidence. J. Geophys. Res. Solid Earth 2011, 116. [Google Scholar] [CrossRef]
  25. Horsfield, W.T. An experimental approach to basement-controlled faulting. Geol. Mijnb. 1977, 56, 363–370. [Google Scholar]
  26. Saltzer, S.D.; Pollard, D.D. Distinct element modeling of structures formed in sedimentary overburden by extensional reactivation of basement normal faults. Tectonics 1992, 11, 165–174. [Google Scholar] [CrossRef]
  27. Morgan, J.K. Volcanotectonic interactions between Mauna Loa and Kilauea: Insights from 2-D discrete element simulations. J. Volcanol. Geotherm. Res. 2006, 151, 109–131. [Google Scholar] [CrossRef]
  28. Hardy, S.; McClay, K.; Muñoz, J.A. Deformation and fault activity in space and time in high-resolution numerical models of doubly vergent thrust wedges. Mar. Pet. Geol. 2009, 26, 232–248. [Google Scholar] [CrossRef]
  29. Cundall, P.A.; Strack, O.D.L. A discrete numerical model for granular assemblies. Géotechnique 1979, 29, 47–65. [Google Scholar] [CrossRef]
  30. Mora, P.; Place, D. A lattice solid model for the non-linear dynamics of earthquakes. Int. J. Mod. Phys. C 1993, 4, 1059–1074. [Google Scholar] [CrossRef]
  31. Cardozo, N.; Allmendinger, R.W. SSPX: A program to compute strain from displacement/velocity data. Comput. Geosci. 2008, 35, 1343–1357. [Google Scholar] [CrossRef]
  32. Hardy, S. Does shallow dike intrusion and widening remain a possible mechanism for graben formation on Mars? Geology 2016, 44, 107–110. [Google Scholar] [CrossRef]
  33. Sanford, A.R. Analytical and experimental study of simple geological structures. Geol. Soc. Am. Bull. 1959, 70, 19–52. [Google Scholar] [CrossRef]
  34. Vendeville, B.C. Scale-models of basement induced-extension. C. R. Acad. Sci. 1988, 307, 1013–1019. [Google Scholar]
Figure 1. (A–C) Examples of experimental, 2D sandbox analogue models: (A) Line drawing of simple piston-like subsidence beneath a sand cover, redrawn from Horsfield [25]; (B,C) Piston-like withdrawal of a silicone reservoir underlying a sand cover, redrawn from Merle et al. [2]; (D) Schematic illustration of the structure of the Miyakejima caldera, Japan in the early stages of subsidence (9 July 2000), where an (early) inner reverse fault borders the central zone and a later, outer, normal fault limits the marginal zone (redrawn from Geshi et al. [3]); (E) Surface expression (caldera rim) of the Miyakejima caldera, Japan from the early stages of subsidence (9 July 2000) to post eruption (16 January 2001) (redrawn from Geshi et al. [3]); (F) Seismicity during the 2015 eruption of Axial Seamount (offshore Oregon, USA) showing earthquake density on a cross section, where the red line delineates the top of the magma chamber (redrawn from Levy et al. [14]).
Geosciences 09 00419 g001
Figure 2. (a) Model setup showing dimensions; (b) The four model sections discussed in the text: section A runs W–E parallel to the long (7.25 km) model boundary, while section B runs N–S; (c,d) Bases of the models in the two experiments with a rectangular and a cylindrical piston, respectively. The model colors are for illustration only and have no mechanical significance.
Geosciences 09 00419 g002
Figure 3. Final surface geometries (left) and total surface subsidence (right) after 1000 m basal piston displacement: experiments with (row a) circular and (row b) rectangular piston roofs, respectively.
Geosciences 09 00419 g003
Figure 4. Evolution of (incremental) caldera surface subsidence accrued during the preceding 200 m of basal subsidence at (a) 200, (b) 400, (c) 600, (d) 800, and (e) 1000 m basal subsidence for an experiment with a piston with a flat, circular roof.
Geosciences 09 00419 g004
Figure 5. Evolution of vertical section A: caldera geometry (left) and incremental shear strain accrued during the preceding 200 m of basal subsidence (right) at (a) 200, (b) 400, (c) 600, (d) 800, and (e) 1000 m basal subsidence for an experiment with a flat, circular roof.
Geosciences 09 00419 g005
Figure 6. Evolution of vertical section B: caldera geometry (left) and incremental shear strain accrued during the preceding 200 m of basal subsidence (right) at (a) 200, (b) 400, (c) 600, (d) 800, and (e) 1000 m basal subsidence for an experiment with a flat, circular roof.
Geosciences 09 00419 g006
Figure 7. Evolution of horizontal sections C (left) and D (right): incremental shear strain accrued during the preceding 200 m of basal subsidence at (a) 200, (b) 400, (c) 600, (d) 800, and (e) 1000 m basal subsidence for an experiment with a flat, circular roof.
Geosciences 09 00419 g007
Figure 8. Evolution of (incremental) caldera surface subsidence accrued during the preceding 200 m of basal subsidence at (a) 200, (b) 400, (c) 600, (d) 800, and (e) 1000 m basal subsidence for an experiment with a piston with a flat, rectangular roof.
Geosciences 09 00419 g008
Figure 9. Evolution of vertical section A: caldera geometry (left) and incremental shear strain accrued during the preceding 200 m of basal subsidence (right) at (a) 200, (b) 400, (c) 600, (d) 800, and (e) 1000 m basal subsidence for an experiment with a flat, rectangular roof.
Geosciences 09 00419 g009
Figure 10. Evolution of vertical section B: caldera geometry (left) and incremental shear strain accrued during the preceding 200 m of basal subsidence (right) at (a) 200, (b) 400, (c) 600, (d) 800, and (e) 1000 m basal subsidence for an experiment with a flat, rectangular roof.
Geosciences 09 00419 g010
Figure 11. Evolution of horizontal sections C (left) and D (right): incremental shear strain accrued during the preceding 200 m of basal subsidence at (a) 200, (b) 400, (c) 600, (d) 800, and (e) 1000 m basal subsidence for an experiment with a flat, rectangular roof.
Geosciences 09 00419 g011

