Abstract
In February 2017, a failure occurring in Oroville Dam’s main spillway risked causing severe damages downstream. A unique aspect of this incident was the fact that it happened during a flood scenario well within its design and operational procedures, prompting research into its causes and determining methods to prevent similar events from reoccurring. In this study, a hydroclimatic analysis of Oroville Dam’s catchment is conducted, along with a review of related design and operational manuals. The data available allows for the comparison of older flood-frequency analyses to new alternative methods proposed in this paper and relevant literature. Based on summary characteristics of the 2017 floods, possible causes of the incident are outlined, in order to understand which factors contributed more significantly. It turns out that the event was most likely the result of a structural problem in the dam’s main spillway and detrimental geological conditions, but analysis of surface level data also reveals operational issues that were not present during previous larger floods, promoting a discussion about flood control design methods, specifications, and dam inspection procedures, and how these can be improved to prevent a similar event from occurring in the future.
1. Introduction
Dam construction and operation across the centuries has resulted from major and multipurpose human needs and is linked to the development of human wealth, health and the growth of civilization [1,2,3,4]. Spillways are a crucial aspect of dams, as their most important function is to discharge excess flows during severe floods to prevent dams from failing due to overtopping [5,6]. The International Committee on Large Dams (ICOLD) has suggested that nearly a third of dam related incidents is linked to this cause of failure. These cases are usually brought about by extreme weather conditions that exacerbate faulty or incomplete spillway designs, leading to significant damage [6,7]. As such, reducing the risk of spillway failures is a topic that promotes continuing research and improvement. Ongoing studies have attempted to investigate these structures both from a hydrologic approach [8,9] and by looking into the various available design methods and materials [10,11,12]. The former studies found several cases of spillways built using outdated data and formulas which are now obsolete, and proposed alternative methods to calculate design flows taking into account the effects of long-term persistence on floods [2,7,8,13]. On the other hand, works that focused on the more practical aspects of building spillways analyzed the core elements of these structures [5,14], and determined scenarios where they can be undermined even when not under extreme conditions, much like the case of Oroville Dam itself. Studies of previous similar dam failures [9,14,15] reveal multiple aspects of a typical dam failure due to a problem developing in its spillway, and prove that usually when such an incident occurs, several different factors likely contributed to it.
In their publication “Lessons from dam incidents”, ICOLD summarizes some 500 incidents from 1800 to 1965. Several of these have been the subject of major investigations and have a substantial literature [16]. Another useful reference in USCOLD’s “Lessons from Dam Incidents USA”, which lists over 500 incidents in the USA [17]. A report published by the UK’s Environment Agency offers insights and information on lessons learnt from over 100 national and international dam incidents and failures [18]. Many of these include incidents caused by overtopping, internal erosion and foundation failures such as those related to the Oroville incident.
Analyzing scenarios like these leads to preventing future disasters, and the Oroville Dam incident is yet another case study that promotes varying topics of dam risk assessment, flood control analysis, as well as offering insights into design and operational procedures regarding these crucial structures.
2. Materials and Methods
2.1. Feather River Basin Characteristics
Oroville Dam’s catchment, the Feather River Basin, lies between the north end of the Sierra Nevada range and the east side of the Sacramento River Valley. It is bounded by Mt. Lassen to the northwest, and by the Diamond Mountains to the northeast. Documented results of geological studies in the vicinity [19,20] suggest that the area immediately in and around Lake Oroville composed mostly of what is called the “Bedrock Series”. This consists mostly of metavolcanic and pyroclastic rock, such as amphibolite. Above this bedrock lie various younger sedimentary rocks such as shales, dolomites, Quaternary alluvium, playas, terraces, glacial till and moraines, and finally various marine and non-marine sediments [21]. In general, the Feather River Basin is considered an area of low seismicity [20]. The Feather River Basin as well as the city of Oroville are characterized by a Mediterranean climate. Precipitation in the Feather River basin occurs most usually during the cooler months, in rare yet intense events. On average, there are only 57 days of precipitation per year, and 36 of those are liquid. Large floods in the Feather River basin occur due to severe winter rain storms, in some cases augmented by snowmelt. A typical event may last several days, not being a single storm, but a sequence of smaller individual storms in quick succession. In these cases, runoff can produce high-peak intense flows downstream with a variety of flood characteristics [22].
A report [23] contains unregulated, annual maximum flow data for the Feather River at Oroville station resulting from rainfall for 1-day, 3-day, 7-day, 15-day, and 30-day durations as provided by the US Army Corps of Engineers. Each n-day period is useful for different aspects of reservoir management [22,23,24,25]. The most intense floods from this analysis can be found in Table 1.

Table 1.
Historical maximum 1-day and 3-days floods, Feather River at Oroville [23].
2.2. Oroville Dam Characteristics
Oroville Dam is a zoned earth-fill embankment structure with a maximum height of 235 m above river excavation as shown in Figure 1. The dam embankment has a volume of approximately 61 million m3 and comprises an inclined impervious core on a concrete foundation, supplemented by zoned earth-fill sections on both sides.
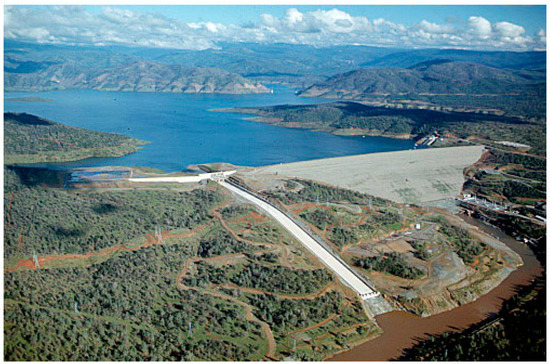
Figure 1.
Aerial view of Oroville Dam [26].
This dam has a large catchment, with an area of approximately 9342 km2 and reservoir surface area of approximately 64 km2. The reservoir capacity (up to the main spillway sill level) is 3427 hm3, whereas the maximum operating volume is stated to be 4364 hm3 (up to the emergency spillway sill level). Further pertinent data on the dam, including a stage-storage capacity curve can be found in related design reports released shortly after the dam’s construction [19,22]. An important additional note is that this dam is not the only one that operates in the Feather Basin; it is part of a network that includes several upstream reservoirs and diversion pools [27,28].
Oroville Dam’s spillway is located on a natural ridge adjacent to right abutment of the main embankments. It consists of two independent structures, a combined flood control outlet and an emergency weir. The former consists of an unlined approach channel with walls in such a way as to make flows smoothly transit into an outlet passage, a headworks structure, and a concrete lined chute, approximately 929 m in length. The headworks structure is comprised of eight top-seal radial gates, 17.78 cm thick and 5.18 m wide by 10.06 m high. At the end of the lined chute, chute blocks help absorb some of the energy from the outgoing flow before it pours into the Feather River.
The main concept behind designing the flood control outlet was to limit Feather River flow to 5094 m3/s in the occurrence of a flood event known as the Standard Project Flood (SPF). For Oroville Dam, the peak inflow of the SPF was estimated at 12,700 m3/s, and is claimed to have a return period of 450 years in related design documents [19]. In order to meet this criterion, the flood control was designed for a 4245 m3/s controlled release, and a flood control reservation volume of 925.11 hm3 was deemed necessary. This volume is also mentioned in the official manual for flood control operation of Oroville Dam [19,22].
According to references [19,29], the combined capacity of the main and emergency spillways is 17,472 m3/s, which corresponds to a peak inflow of 20,160 m3/s. The event that would cause this inflow corresponds to what has been known as the Probable Maximum Flood (PMF). Given the known design capacity of the main spillway, this would set the design capacity of the emergency spillway to approximately 9900 m3/s in order to meet the combined outflow required by the PMF.
Blasting was used for almost 90% of the main spillway chute foundation, in order to reach grade. The remaining amount consisted of the removal of several seams of clay located in the foundation, and a few areas where the slope failed [19]. The slopes in the flood control outlet section were of a lower quality rock than initially presumed and several large seams ran parallel with the main spillway chute. The countermeasure that was applied was the replacement of planned anchor bars with grouted rock blots, pigtail anchors and a chain-link covering the area’s surface [19].
2.3. Annual Maxima Rainfall Analysis
Until now, known flood control studies for Oroville Dam and the Feather Basin have attempted to determine the Probable Maximum Flood (PMF) for Lake Oroville, based on the Probable Maximum Precipitation (PMP). The most recent existing study available detailing PMP calculations in California is Hydrometeorological Report No. 59 or HMR 59 [30]. In brief, the computational procedure includes tracing an outline of the drainage basin, placing this outline on top of a given PMP 10-m2, 24-h index map, then determining depth-duration relationships and areal reduction factors, and finally conducting temporal distribution of incremental depths extracted from a given curve.
While this method is simple to use, and the analysis involved in creating these PMP index maps undoubtedly contains valuable information, it would be better to adopt a probabilistic approach to precipitation analysis, where instead of assuming a deterministic, theoretical upper limit, a return period would be assigned to any precipitation and flood value. This would be achieved by studying existing precipitation data and extracting a return period for the already calculated 24-h index depths, for every sub-area of the Feather River Basin, as determined by the California Department of Water Resources [27]. One of the possible methods to achieve this is exposed below.
The 24-h index PMP depth essentially describes a daily maximum precipitation value. If the distribution of daily rainfall for a given area is known, one can assume that the annual maxima of daily rainfall would resemble one of two limiting types: type I, known as Gumbel distribution or type II, known as Fréchet distribution. The Generalized Extreme Value (GEV) distribution, which comprises these types by way of its shape parameter (as well as type III, known as reversed Weibull, which however is not recommended for rainfall maxima [31]) can be fitted to a series of annual maxima of daily rainfall.
In accordance with References [13,32,33], the GEV distribution using the method of L-moments is fitted to various precipitation data gathered from the Feather Basin [34,35]. A map of the basin with the measurement stations used in this analysis can be found in Appendix A [34,35,36].
To improve accuracy, a filter is applied to the data, i.e., only years with 300 or more daily measurements are taken into account, roughly equivalent to at least 25 days with measurements per month. After discarding stations with data suspected of containing erroneous measurements that could not be cross-referenced with floods around the same time period, four significant precipitation measurement stations were selected for this analysis. Then, annual daily maxima time series are created. The process is simple: First, select the maximum daily precipitation value of every year, then rank them in descending order. Obviously, the highest value is the most important one, so it is imperative that it is cross-referenced with multiple sources to confirm its validity. Finally, the GEV-max distribution with the method of L-moments is fitted using the “Pythia” statistical tool of the HYDROGNOMON open software, which follows the exact principles stated in the related literature [13,32,33].
2.4. The 2017 Event
During the first few days of January 2017, two small rain storms occurred just over Oroville Dam’s reservoir [34,37]. The first rain storm was short, lasting only 4 days, peaking at 90 mm on January 3, and the second was a stronger 6-day event, peaking at 136 mm on January 10. These rain storms quickly led into a large increase of inflows into Lake Oroville. Two inflow peaks occurred: The primary one was 4839 m3/s on January 8 at 21:00 p.m., and a secondary peak of 3079 m3/s, occurring on January 10 at 22:00 p.m. These inflows are definitely significant, yet expected during a typical wet season. However, outflows from Lake Oroville at the same time were very low, almost zero, as there was a sharp water storage increase in Lake Oroville, as well as a significant rise in its surface elevation. Lake Oroville’s surface elevation initially exceeded the flood control minimum on January 12, 2017 at 17:00 p.m. Around that time, outflows from Oroville Dam’s main spillway were increased to compensate for this fact and return the surface elevation to below the minimum. Overall, the Oroville Dam operator was able to return the surface level to below the flood control limit on February 3, 2017 at 17:00 p.m, just in time for an upcoming February rain storm.
Thereafter, according to CDEC, a rain storm over the Feather Basin began on February 2, 2017, and ended around February 11. The largest flood value occurred on February 9 at 19:00 p.m., and was 5392 m3/s. This value is significantly lower than the highest recorded floods to ever occur in the Feather Basin. Under normal circumstances, Oroville Dam should have been able to deal with this event without trouble. On February 6 at approximately 13:00 p.m., outflows from Lake Oroville were raised in order to prepare for incoming inflows to 1500 m3/s. However, the next day, February 7, at approximately 10:00 a.m., workers at the Oroville Dam site noticed a discoloration in the water flowing through the main spillway. Outflow from the main spillway was immediately halted, in order to detect the source of this discoloration, revealing a large hole in the main spillway chute, seen in Figure 2.
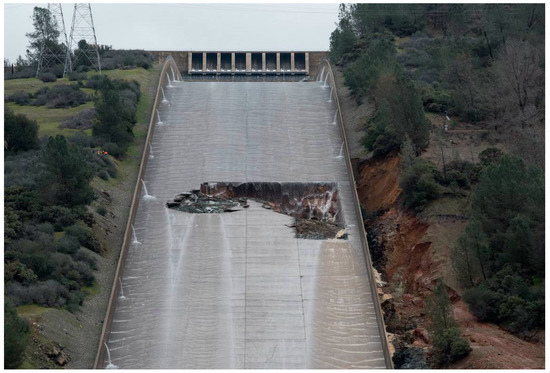
Figure 2.
7 February 2017. Front view of the initial main spillway chute damage [38].
At this point, the main spillway is already severely damaged, and any discharges at that point would rapidly amplify this erosion and move entire parts of the concrete chute and walls downstream. However, Lake Oroville’s surface elevation is already past the flood control minimum, and inflows from the February rain storm are imminent. After brief consultation with various dam safety agencies, the operators decided to release test flows into the main spillway and monitor the damage. These small flows ranged hourly from around 300 m3/s to 900 m3/s over the course of February 8. On the very next day, February 9, the hole in the main spillway had increased in size.
A worrying aspect of the spillway damage is that it was moving uphill. This is a typical sign of a failure known as headcutting (or undercutting), which is what happens when water flowing across a hard surface falls onto a softer surface below.
With the ever-increasing inflows dangerously raising the reservoir surface level, which is already above the minimum flood control elevation, there was no time to quickly repair the main spillway. At this point, the Oroville Dam operators were facing a tough dilemma; either continue to release flows through the already damaged chute and cause further erosion, or risk using the untested auxiliary spillway. However, as the latter structure is ungated, if unchecked the dam itself would make that choice for them, as water would flow over the emergency spillway as soon as the surface elevation surpassed its crest, at 274.62 m. As such, a plan was formulated to continue letting small flows pass through the main spillway, while also preparing the area around the auxiliary spillway in case it would have to be put to use. To that end, workers began clearing the area downstream of this secondary structure, as well as placing large rocks at its foot to mitigate possible erosion. At this point, the inflows into Lake Oroville increased tremendously, reaching the aforementioned peak of 5392 m3/s. On February 11, at 8:00 a.m., surface elevation at Lake Oroville surpassed that of the emergency spillway crest, meaning that for the first time in the dam’s history, water would pour over it. According to data from CDEC, water poured over this ogee weir for just over 37 h in total, as the surface level dropped below its crest elevation again on February 12 at 21:00 p.m.
A noticeable fact is that there is a parking lot just next to the emergency spillway, which is at a lower elevation, and thus is flooded by design whenever water pours over the weir. Furthermore, an access road located just below the structure was also subsequently flooded and quickly destroyed, as seen in Figure 3.
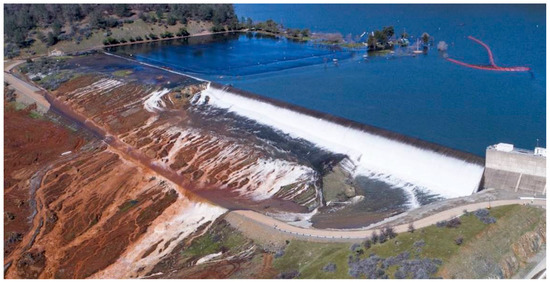
Figure 3.
11 February 2017. Image of the flooded parking lot and access road located next to the emergency spillway [39].
Unfortunately, erosion downstream developed much more rapidly than anticipated. While the emergency spillway was only active for a very brief duration, and peak discharge did not exceed 400 m3/s; large boils occurred downstream, destroying the access road below and threatening to damage the spillway crest itself by failure due to headcutting. The exact extent of the damage was not clearly visible when water was still pouring over the downstream hill on February 12, however, and thus local authorities, fearing the worst outcome, were forced to spring into action and order the evacuation of Oroville and other areas downstream of the dam, including Yuba City and Marysville. The California Department of Water Resources responded to the evacuation order by immediately increasing outflow releases from the main spillway to 2830 m3/s. This would drastically lower the surface elevation and stop flows over the emergency spillway and any resulting erosions there, at the cost of causing irreparable damages to the main spillway. Luckily, despite the conditions, the upper portion of the main spillway was able to release these discharges without causing further upstream erosion. However, the hill downstream of the initial hole would be quickly eroded away from high velocity flows.
3. Results
Based on the evidence gathered, it is possible to make several hypotheses for the possible causes of failure for both spillways.
3.1. Emergency Spillway
It is much easier to determine the cause of the near failure of the emergency spillway due to the fact that it was actuated for a very brief duration under constant supervision, as authorities were already alerted of the situation. While water was pouring over the concrete weir without a problem, it was the surrounding conditions that posed a threat. Already from the documents describing Oroville Dam’s construction, the following facts are known:
- The emergency spillway was untested, even in the model studies conducted by the US Bureau of Reclamation [29].
- The area downstream of the emergency spillway was not cleared [19].
- The emergency spillway foundation excavation continued 3 m—deeper than expected—in order to reach the foundation rock that met the design criteria [19].
While it is known that this concrete overpour weir was built on a solid foundation, no effort was made to secure that the downstream ridge would be able to accommodate flows passing over it without significant erosion occurring as a result. This could have been acceptable if this structure was truly used as an emergency measure (i.e., any outflows from it not being factored into hydrologic design calculations, using only the main structure’s design capacity instead), but this is not the case. According to Reference [40], a high risk structure such as Oroville Dam should be able to withstand the PMF. All PMF analyses so far [22,27] have included the emergency spillway in their calculations, and in fact, in the event of the PMF, the emergency spillway is expected to reach outflow discharges of around 10,000 m3/s. Seeing as erosion threatened to cause structural failure at less than 420 m3/s, the spillway’s ability to withstand PMF-level discharges is questionable. In any case, this warrants the need for the structure to be properly armored with concrete and considered to be an “auxiliary” spillway, not an “emergency” one. This has been repeatedly requested by the community [41,42,43], and has yet to be fully implemented.
3.2. Revisiting the Minium Flood Control Elevation
When posing the question of why Oroville Dam was capable of withstanding the previous devastating floods of 1986 and 1997, and not the 2017 event, one is prompted to also examine the surface elevation levels prior to each flood. Thus, an attempt is made to compare Oroville Dam reservoir surface levels shortly before and after each of the three recent flood events, occurring in 1986, 1997 and 2017 [34]. In Figure 4, the vertical axis represents surface elevation in meters, whereas the horizontal axis represents time, up to 240 h (10 days) before and after peak inflow. Hour 0 is the hour during which peak inflow occurred for each event.
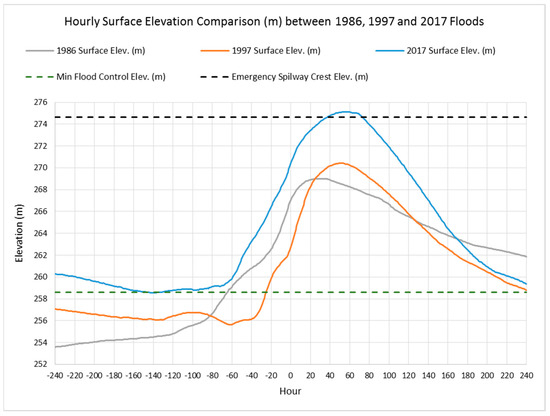
Figure 4.
Comparison of Oroville reservoir hourly surface elevations 10 days before and after the peak inflow of the 1986, 1997 and 2017 flood events.
Naturally, no two flood events are the same and they all impact Oroville Dam in subtly different ways, but this comparison contains clues on what went wrong during the 2017 spillway incident. Notably, while the 2017 peak inflow is the lowest of the three major flood events, its surface elevations are the highest. This is due to two factors. First, as is clear from the graph, shortly prior to peak inflow, the surface elevation during the 2017 event was higher than in previous floods. Already, this has a negative impact on flood management. While this elevation is below the minimum limit specified by the flood control manual [22], the 2017 flood is actually harder to manage than previous events. This is partly why, despite not being a record flood, this event came close to causing severe damages to Oroville Dam’s key structures once the main spillway failed.
According the flood control manual [22], the additional following restrictions are applied to flows from the main spillway:
- Any water stored in the designated flood control space should be released as quickly as possible, according to a given flood control diagram. Flows from Feather River should not exceed 4245 m3/s.
- During extreme flood events, releases greater than 4245 m3/s may be required in order to minimize uncontrolled spillway discharges.
- Releases from Oroville Dam are not to be increased more than 280 m3/s or decreased more than 140 m3/s in any given 2-h period.
While levels were within the flood control manual standards [22], the fact that they were close to the limit made dealing with the February 2017 inflows a much more daunting task once the main spillway failed. Thus, it would seem reasonable to request a lowering of the minimum flood control elevation level for Lake Oroville. Lowering the minimum flood control elevation level has its downsides, mainly due to losing reservoir capacity and its valuable resource, but it could be adjusted 5 m lower or even further down at the spillway’s sill elevation at 248 m without significant losses in efficiency. Alternatively, it can be maintained even lower by utilizing draw-offs and other outlets to a greater capacity. However, this method of managing the flood risk would need to be considered together with other economic and ecological factors to ensure the benefits are balanced with any other detrimental impacts.
Therefore, taking all of the above into account, it would seem logical to request a small reduction in the minimum flood control level. In their 2006 statement [41], FOR et al., had requested an additional 185 hm3 of surcharge storage be added to the 925 hm3 control pool in order to compensate for the never constructed Marysville Dam. This was a project that was included in the flood control pool calculations, yet was never completed. If this measure were to be implemented, according to the flood control manual, the new minimum flood control elevation would be 255 m. Under these conditions, according to Reference [29], the flood control outlet’s release capacity is approximately 1274 m3/s. By chance, this was the Oroville Dam reservoir’s surface elevation just before the 1997 flood [44], and the spillway performed adequately even when outflows briefly exceeded the designed discharges. Following additional analyses of other flood events, it may be considered that this small lowering of the flood control level could reduce risks to an acceptable level [5,8,45].
3.3. Main Spillway
Attempting to detect what caused the initial failure of the main spillway is a much more complicated task, as due to the nature of the incident, very few pictures are available showing the initial chute hole that was spotted on February 7. Any physical evidence that could have been gathered from the scene at the time has been likely washed away from the subsequent discharges that eroded away the bottom half of the chute and much of the downstream ridge. Simply looking at pictures of the February 7 chute damage is not enough, and can lead to forming biased conclusions. Thus, prior to studying these pictures, further background research is required.
A dam inspection guide [40] lists potential incidents that can occur on spillway concrete chutes and possible causes based on studies of previous similar events. More specifically, the following defects mentioned in the guide are directly related to the Oroville Dam main spillway chute.
- Cracking of concrete in floor slabs. Visible on casual inspection when concrete is dry, possibly caused by temperature changes or inadequate reinforcement.
- Damaged concrete. Possibly caused by cavitation or erosion due to irregularities or rough surface.
- Lifted slab panels. Indicated by vertical offsets in joints, possibly caused by poor drainage under slabs, and/or inadequate anchoring of slab to foundation.
Furthermore, the geological conditions below the spillway chute are also considered.
3.4. Structural Flaws
Based on previous inspection reports and other sources [19,27,46,47], it is known that cracks had previously occurred in the main spillway chute’s floor slabs, just above the herringbone drains. Aside from cracking, removal of joint filler and spalling have been also been documented as mechanisms that cause damages. Attempts to repair the structure took place in 1977, 1985, 2009, and 2013. These efforts usually included a simple removal of spalled concrete and patchwork with the intent of simply restoring flow surface. By 2017, cracks remained present above the drains, which likely allowed water to flow through the chute’s concrete slabs whenever the spillway was actuated.
Unfortunately, due to the nature of the incident and the measures that had to be taken to ensure Oroville Dam’s safety, if the initial cause of the main spillway chute’s failure was slab uplift due to a fault in the drain system, the only available evidence can be found in pictures taken shortly before and after the February 6 chute hole was spotted, as any physical evidence was subsequently eroded away by the February 12 outflows. However, by conducting background research, the following factors are discovered about the main spillway’s drain system and the concrete chute slabs [19,46,48,49]:
- The invert slabs have a minimum thickness of 380 mm, are anchored to rock with grouted anchor bars, and are provided with a system of underdrains [19].
- The initial drain system plan ended up being significantly altered during construction. After a recommendation by the Oroville Dam Consulting Board, the original horizontal pipe drains under the chute were enlarged and placed in a herring-bone pattern. The collector system operating in line with the chute was also enlarged and modified so as to enhance its capacity and self-cleaning ability [19].
- The last official inspection of the main spillway chute’s full length took place in 2015 [49]. At the time, no structural deficiencies were detected. An additional inspection took place in 2016 [50], but the spillway chute was only examined from the top of the FCO outlet structure, not up close like in 2015. A reason for this is not specified.
In addition, a comparison of pictures of the spillway shortly before the February 6 hole was discovered yield additional clues. Figure 5 is a comparison of two pictures of the main spillway chute, taken shortly before the February incident. The first was taken on 11 January 2017 and the second on 27 January of the same year.
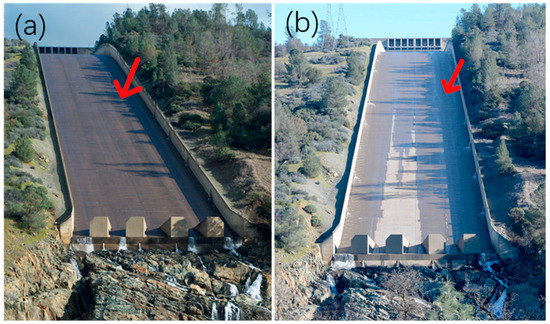
Figure 5.
Views of the Oroville Dam main spillway chute. (a) taken on 11 January 2017, and (b) taken on 27 January 2017. A red arrow points to the location of the initial chute failure [38,51].
While these pictures were only taken within 16 days of each other, there are significant differences in the spillway chute. A center section of the chute’s concrete floor appears dry on the right-hand picture, despite flows passing over the rest of the structure. This indicates possible irregularities among the floor slabs. Furthermore, the fact that this dry patch is not visible in the photo taken earlier, could possibly mean that a possible slab uplift occurred near the red arrow’s location, diverting small water flows around it instead of over it.
Furthermore, by looking at the drain system more closely, two clues are revealed: First, water is coming out of the drains under pressure, which is not according to design specifications, and secondly, discharge from these drains significantly increased in a short time, once flows from the January flood filled up the Oroville Dam reservoir. This is a telltale sign of a buildup of excess water occurring beneath the spillway, which could apply significant forces to the concrete slabs from below and cause them to uplift [40]. Additionally, the January 27 photograph shows the drains on the opposite wall operating under pressure as well.
3.5. Possible Cavitation—1-D Water Surface Profile Analysis
One of the possible causes of the initial damage to the concrete chute floor is cavitation. In order to better understand this cause, extensive examination of the USBR hydraulic model study of the main spillway [29] is required. Furthermore, comparing this data to a simple mathematical model of the main spillway chute could help find possible clues. A simple mathematical model is constructed in a spreadsheet software which uses an iterative procedure to simulate 1-D steady open-channel flow, known as the standard step method [52]. In order to construct this model, some additional assumptions must be made, which are analyzed below.
Based on the USBR main spillway chute profile, its main rectangular concrete section is 54.46 m wide, begins at Station +13 00 (past the beginning of the approach channel) and ends at Station +43 00, just before the terminal structure with the concrete chute blocks. As such, this main section is exactly 914.4 m in length, and only this part of the main spillway is modeled. To avoid confusions between the USBR calculations and those of the model, the entire model is constructed using American unit measurements (distance in feet, discharge in cfs, etc.).
To calculate flows, Manning’s n coefficient is additionally required. Unfortunately, there is no mention of the specific coefficient used for the hydraulic calculations of the final chute in Reference [29]. However, a profile drawing of an earlier model describes a lined concrete channel with an n value of 0.013. Based on this and the HEC-RAS manual specifications, an n value of 0.014 was selected for the model. Furthermore, in the interest of time and with the intent of keeping the mathematical model as simple as possible, critical flow depth was assumed at the chute’s beginning for every discharge profile, instead of the true depth which is partially controlled by the flood control outlet gates. However, as is evident later, this did not have a significant impact on the results.
Four discharge profiles were created, in accordance with those of the USBR model study: 20,000 cfs (566 m3/s); 50,000 cfs (1416 m3/s); 100,000 cfs (2832 m3/s); and finally 277,000 cfs (7484 m3/s), which is the main spillway’s design capacity. A water surface profile view of the chute for the latter discharge is plotted in Figure 6, with an additional data label at the exact point where the 2017 hole occurred (Station +33 00). Figures for the other surface profiles can be found in Appendix B.
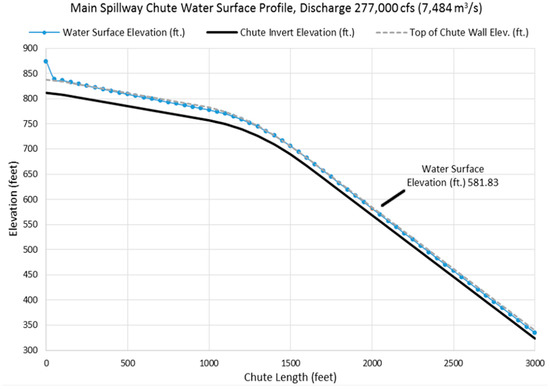
Figure 6.
Oroville Dam main spillway chute water surface profile, discharge 7484 m3/s.
From the chute flow analysis, it is clear that the initial assumption of critical flow depth at the chute’s beginning does not negatively impact the results significantly, as due to the chute’s design, flow depth quickly approaches normal depth with a standard S2 curve for supercritical flow [52]. For low discharge profiles, normal depth is reached fairly quickly, and only when the spillway is running at maximum capacity, 7484 m3/s (277,000 cfs), does the flow reach normal depth close to the chute’s end. No surface flow irregularities are immediately apparent from this analysis, indicating that cavitation is probably not the initial cause of the of main spillway’s failure. However, as this model assumes hydrostatic pressure, to confirm this assumption one could use the method recommended in Reference [53], that allows for the detection of cavitation despite one-dimensional flow assumptions.
A more thorough analysis was carried out as part of the Forensic study and noted that the cavitation was not a contributor to the failure of the service spillway chute. In fact, following our calculations (Appendix C) at the area of failure, one can make an estimate of cavitation number for the 100,000 cfs release of February 12. The channel velocity was around 95.5 fps and the flow depth around 5.9 ft providing a cavitation number around 0.275. This is much higher than 0.15–0.20 which according to Figures 3–8 of Reference [53] could have caused damage after 100 h of operation.
3.6. Geological Conditions Beneath the Main Spillway Chute
The fact that the main spillway chute was built on rock that required blasting to excavate would mean that the rock is suitably hard to serve as a foundation for the concrete chute sections. However, pictures of the initial spillway failure reveal more information about this foundation rock.
Based on Figure 7, it appears that the foundation rock is indeed composed of the metavolcanic materials mentioned previously. However, this particular section of bedrock appears highly fractured and heterogeneous. There is a significant variance of color in the formations, indicating different degrees of weathering. Furthermore, due to the orientation of the seams, the rock is expected to erode away in large chunks, not in sheets. It is also possible that water was able to seep through cracks in the weaker, more weathered sections of rock and undermine the chute from below.
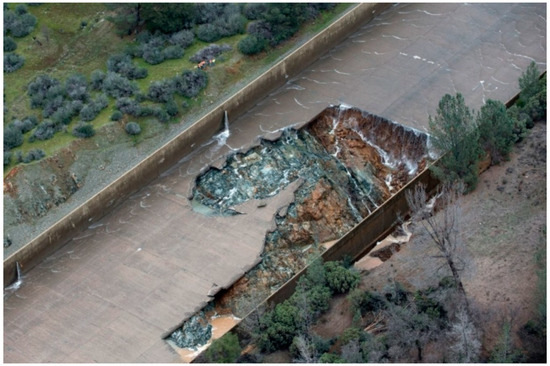
Figure 7.
7 February 2017. Side view of the initial spillway chute failure [38].
3.7. Annual Maximum Rainfall Analysis—Results
After consulting the 24-h PMP index depth maps in Reference [30] and comparing them to those specified in Reference [27] for the subareas of the Feather River Basin, it is possible to use these distribution fits to estimate the annual daily maximum precipitation value with a 10,000 year return period and find the return period of the stated probable maximum precipitation index depths. The results of this analysis are summarized in Table 2.

Table 2.
10,000-year annual daily maximum precipitation forecasts, compared to the 24-h PMP index depths and their return periods, based on the GEV-Max distribution fit.
The PMP usually has a return period that is extraordinally high, which increases safety. However, it would be an error to assume that designing with the PMP method removes risk entirely simply because it generates large values. This is why assigning a return period to a design precipitation value is better for representing the associated risks, which are inevitable in engineering.
Furthermore, the PMP method evidently does not always generate overly high values. In the case of the Quincy station (QCY), the distribution of the annual maximum rainfall results in a daily maximum precipitation value with a 10,000 year return period that is above the PMP 24-h index depth for the same region. That same probable maximum value has a corresponding return period of only 4348 years, which, while still being very high, leads to the conclusion that the PMP method is not risk-free as some would expect.
3.8. Flood Frequency Analysis
Instead of assuming a fixed “worst case scenario” flood that supposedly cannot be exceeded, which is what the PMF suggests, it is possible to assign a return period to existing design floods by using customary flood frequency analysis methods. The record of unregulated, annual maximum flow data for the Feather River at Oroville station resulting from rainfall for a 1-day duration provided by USGS [23] is an ideal input time series for this purpose, and further cross-examination with known extreme floods such as the 1964, 1986 and 1997 events as mentioned above confirms its accuracy. Using HYDROGNOMON, two distributions are fitted to the data, namely the Log-Pearson III with the method of maximum likelihood estimators and the GEV distribution using the L-Moments method, according to References [13,54,55]. The results of the distribution fitting can be found in Appendix C.
From this analysis, it is possible to extract the 10,000 year floods for each of the distribution fits. For the Log-Pearson III fit, the 10,000 year flood is estimated to be 32,000 m3/s and for the GEV fit, the same value is 24,464 m3/s. Furthermore, it is possible to assign return periods to existing calculated inflows such as the Standard Project Flood and various PMFs that can be found in References [19,22,27]. The results are documented in Table 3.

Table 3.
Return periods in years for various floods, as generated by the distribution fitting process.
The Standard Project Flood is mentioned to have a return period of 450 years [19], which is close to the average of the two distribution fitting results. However, the return period of the probable maximum flood is supposed to exceed 10,000 years, yet only the 1983 PMF achieved this for both distribution fits. Notably, the most current PMF was calculated in 2003 based on HMR 59 [27,54], and its return period does not exceed 5000 years for both distributions. Furthermore, according to this analysis, the return period of the 2017 flood is only 20 years for the LP3 fit and 33 years for the GEV fit. It should be noted that these flood figures are overall peaks, whereas the input for the fit is the slightly lower daily averages given by Reference [23], so these estimates are on the conservative side. In any case, these return periods should be viewed more as guidelines than as exact results. Nevertheless, lowering of the flood control elevation could allow Oroville Dam to still withstand these floods.
4. Discussion
Based on the above analysis, and after consulting dam inspection manuals [40] and reviewing the on-site investigation report [56], the following points stand out:
- From a structural standpoint, the main spillway chute appears to have initially failed due to uplift of its concrete floor slabs, caused somewhere between Stations +33 00 and +33 50 (2000 and 2050 feet of its rectangular section length, respectively). This uplift appears to have been caused by water accumulating below the chute floor, which was unable to be routed through the underdrains. This is evidenced by photographs showing them operating under pressure, which should never occur under design specifications. The authors findings agree with those of the Independent Forensic Team memos released recently [47,56].
- The rest of the damage to the main spillway was caused by high velocity flows due to the large amount of water that had to be routed through it to avoid erosion downstream of the emergency spillway.
- The fact that the Lake Oroville’s surface elevation was at the nominal minimum flood control level, which was above that during previous major flood events, resulted in more severe conditions, even though the February 2017 inflows were not at a record high. Thus, a lowering of the minimum flood control level to 255 m is recommended. FOR et al. [41] revealed that this actually would not be a new requirement, but an adaptation to outdated assumptions made in the 1970 flood control manual [22]. Based on the main spillway rating curve [29], it would be feasible to maintain the dam reservoir at this level during wet seasons. Further research into the Feather River’s Environmental Flow Components could also reveal crucial details of how floods impact the local ecosystem and how lowering the minimum flood control elevation might affect the existing balance [4]. Future research may use the available inflow and outflow data for this incident, as well as the most intense previous events to create spillway operation scenarios of their own and develop a more robust strategy for flood control.
- The current PMF value for Lake Oroville has a return period of less than 10,000 years based on the above analysis. It is recommended to either calculate a new 10,000 year flood for Lake Oroville using a probabilistic method, or use the 1983 PMF value which is suitably large. However, it is important to assign a return period to any resulting flood, as the whole concept of “probable maximum flood” is problematic [32] and its scientific content is disputed [31].
- The California Department of Water Resources’ quick response to the incident and initiation of a full scale repair and reconstruction of the Oroville Dam spillways are admirable. However, under current design, the dam is only capable of withstanding the Standard Project Flood with a return period of 500 years without sustaining significant damage. In order to withstand a flood with a return period of 10,000 years without causing significant erosions to the downstream areas, the emergency spillway needs to be redesigned and fully armored with concrete. This has been repeatedly requested by local interest groups [41,43].
- In the United States, many are using this incident as an example of severe issues the country has with maintaining the gigantic number of high-risk structures it has built over the past century [42,57]. Indeed, the Oroville Dam itself has been around for half a century. Until a major problem occurs at a critical facility like this one, it is easy to get complacent and avoid or postpone critical maintenance procedures like routine inspections and small repairs. Rven when larger problems or design flaws are pointed out [41], it is difficult to convince the authorities to fund large-scale repair projects. However, one would argue that such repair projects actually conserve money in the long run. The new Oroville Dam spillway is estimated to cost around $1.1 billion [58], which is significantly more than what would have been required for a full concrete armoring of the emergency spillway back in 2006.
In addition, the PMP–PMF analysis has several flaws. From a theoretical standpoint, the PMP suggests that there exists a theoretical upper limit of precipitation, which is simply not true. Nature is not bounded by numerical constraints, and the study of a brief history of available data cannot generate a true possible maximum value of precipitation. According to Reference [45], the only merit of the PMP value is that it is a large one. However, in some instances, this precipitation has been either exceeded shortly after it was published, and in others it has been considered absurdly high upon reexamination. On the other hand, constructing input timeseries of annual daily maxima from the available daily precipitation data is not a foolproof method either. As the daily maximum precipitation is a single value for each year, the resulting time series of annual maxima can be sensitive. For this reason, Appendix D contains the annual daily maxima series used as input for the distribution fit to promote further research and allow for cross-examination.
The concept of the Probable Maximum Flood is also highly controversial, for much of the same reasons as the PMP. Indeed, the fact that over the years various PMF studies for Lake Oroville have found largely varying values of probable maximum inflow and outflow does indicate that a true mathematical upper flood limit does not exist. Therefore, even the PMF is again associated with a certain degree of risk, however small. Especially due to the extent of the Feather River Basin and the large number of smaller reservoirs within it above Oroville Dam, it is difficult to generate a reliable design flood without taking multiple factors into account. At the very least, it is possible to assign a return period to existing design floods by using customary flood frequency analysis method.
5. Conclusions
The Oroville Dam 2017 spillway incident presents an interesting case study, as it is a failure of a dam’s key structure that occurred under standard operating conditions, yet at an unfortunate time. It raises very interesting questions from a dam operator’s perspective: What does one do when a spillway, a structure built to deal for emergency situations, fails just when it is needed? And in the specific case of Oroville Dam, is the auxiliary spillway a feature, or a mark of a critical flaw in its design? While it would indeed save the main dam from overtopping in the extraordinarily high flood event, in doing so it would likely not be able to hold for long, while its failure would flood an enormous area with more than 180,000 permanent residents. Furthermore, what has been thought of as “probable maximum flood” seems more probable then presumed, and it is definitely not a maximum.
An independent forensic team tasked with determining the causes of the spillway incident recently published summaries of their findings [47,56]. With the ability to conduct an on-site investigation, they were able to confirm some of the causes mentioned in this study as well as outline new ones. Namely, the redesign of chute’s underdrain system apparently led to an inconsistent thickness in the concrete floor slabs, which resulted in cracks above the herringbone drains, allowing water to pass through the slabs and also potentially led to concrete spalling. Furthermore, the anchorage of the concrete to the foundation was in some places developed in weathered sections of rock, leading to pullout strength lower than the intended design.
After the incident, the California Department of Water Resources seems to have taken a different stand on the issue, being more open to suggestions about the construction of the new spillways [59]. Still, this response came at a rather late time and is being met with some criticism [42,43]. However, their stance on providing free access data to the public and attempting to communicate and cooperate with local residents and interest groups is definitely a step in the right direction. It must be stated that this study would not be possible without the large amount of digital information available directly from the Department of Water Resources and related websites.
If there is a lesson that must be learned from this incident, it is that even when a critical structure like Oroville Dam seems to operate up to standard, one small flaw can emerge at any time and result in a severe failure due to the sheer scale of the facilities and the conditions they are expected to consistently work under. While routine official inspections by the dam operators and independent authorities are a necessity, they are simply not enough as time goes by. Informal inspections of all related facilities must be conducted by dam operators on a weekly or bi-weekly basis, in accordance with existing guidelines [40], not with the intent of writing official reports, but simply to detect the telltale signs of imminent failure before the potentially worst outcome becomes a reality. If the dam operators had noticed the differences in the main spillway chute’s floor slabs between mid and late January they might have been able to repair it in time and avoid the incident from occurring entirely, or at least mitigate its results.
Furthermore, this incident shows a possible lack of regulatory requirements based around the prevention of failures that could occur during normal operating conditions such as what happened at Oroville Dam. Even though no lives were lost as a result of the incident, some consequences on the local environment, economy, and communities might be felt in the years to come. In the end, while it takes a great amount of knowledge, research and responsibility to build a large dam, it takes much more to consistently operate one and protect it from damage.
Author Contributions
Conceptualization, A.K., A.T. and D.K.; methodology, A.K.; software, P.D.; validation, P.T., A.T., P.P., T.W. and D.K.; formal analysis, P.D. and T.I.; investigation, A.K.; resources, P.D., P.P., T.W. and D.K.; data curation, P.D. and T.I.; writing—original draft preparation, A.K.; visualization, A.K.; supervision, T.W. and D.K.; project administration, A.T. and P.T. All authors read and edited the paper before submission.
Funding
There was no funding for this work.
Acknowledgments
We are grateful to the three anonymous reviewers for their constructive comments which helped us to improve an earlier version of this manuscript.
Conflicts of Interest
The authors declare no conflict of interest.
Appendix A
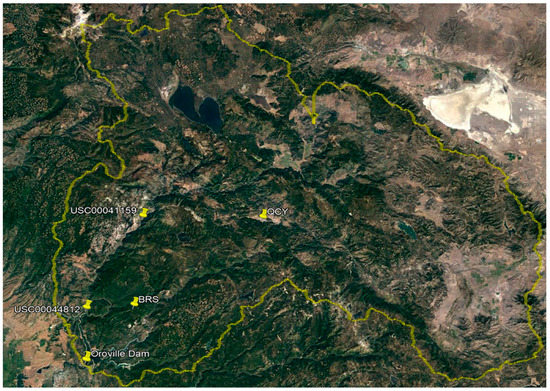
Figure A1.
Map of Oroville Dam catchment and selected precipitation measurement stations [34,35,36].
Appendix B
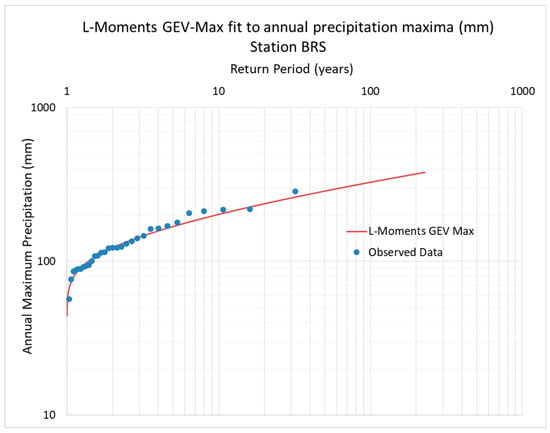
Figure A2.
L-Moments GEV-Max distribution fit to annual daily maxima of precipitation measurements, Brush Creek station (BRS).
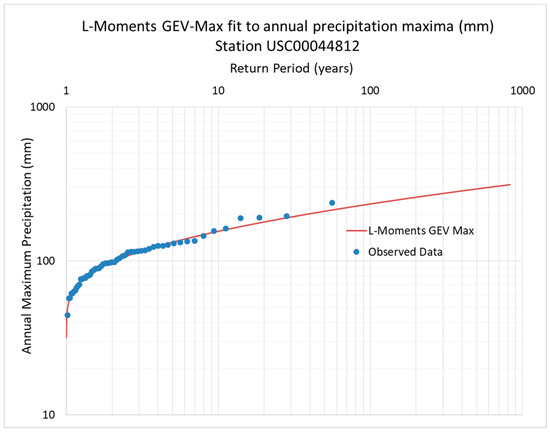
Figure A3.
L-Moments GEV-Max distribution fit to annual daily maxima of precipitation measurements, station USC00044812.
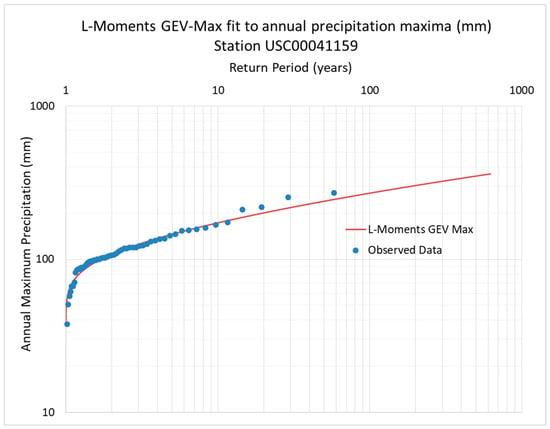
Figure A4.
L-Moments GEV-Max distribution fit to annual daily maxima of precipitation measurements, station USC00041159.
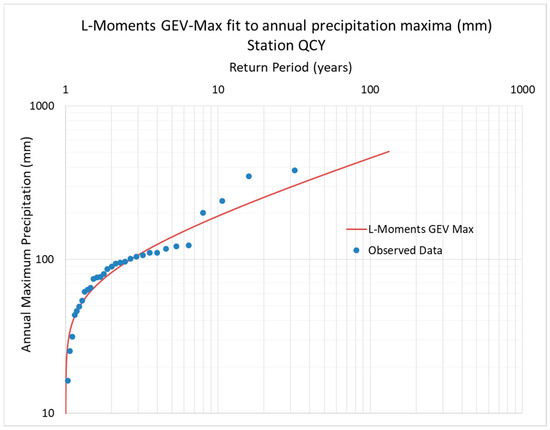
Figure A5.
L-Moments GEV-Max distribution fit to annual daily maxima of precipitation measurements, Quincy station (QCY).
Appendix C
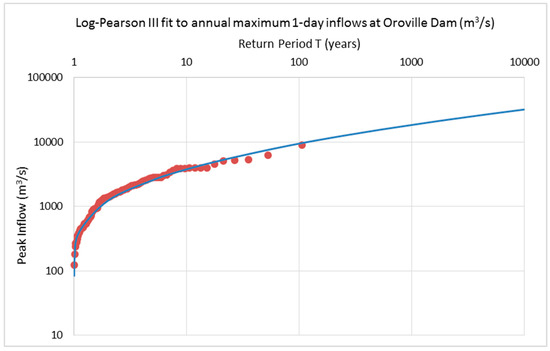
Figure A6.
Log-Pearson III distribution fit to annual unregulated maximum 1-day inflows at Oroville Dam (m3/s).
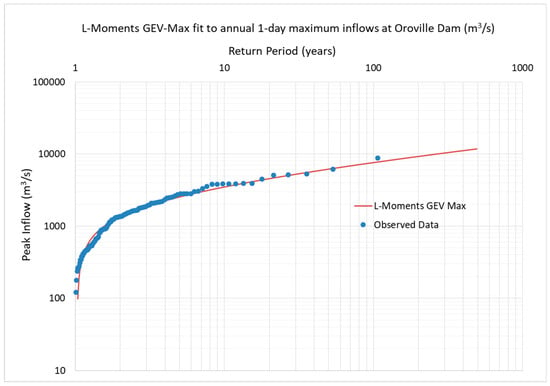
Figure A7.
L-Moments GEV-Max distribution fit to annual unregulated maximum 1-day inflows at Oroville Dam (m3/s).
Appendix D

Table A1.
Annual daily maximum precipitation (mm), Brush Creek (BRS) station.
Table A1.
Annual daily maximum precipitation (mm), Brush Creek (BRS) station.
| Year | Annual Daily Maximum (mm) | Year | Annual Daily Maximum (mm) |
|---|---|---|---|
| 1986 | 217.4 | 2002 | 211.8 |
| 1987 | 121.9 | 2003 | 122.4 |
| 1988 | 2004 | 113.8 | |
| 1989 | 89.4 | 2005 | 162.8 |
| 1990 | 93.2 | 2006 | 124.5 |
| 1991 | 122.4 | 2007 | 109.5 |
| 1992 | 89.4 | 2008 | 100.8 |
| 1993 | 170.2 | 2009 | 86.4 |
| 1994 | 76.5 | 2010 | 206.5 |
| 1995 | 141.5 | 2011 | 87.9 |
| 1996 | 179.1 | 2012 | 163.8 |
| 1997 | 285.2 | 2013 | 56.9 |
| 1998 | 115.1 | 2014 | 147.1 |
| 1999 | 94.5 | 2015 | 92.2 |
| 2000 | 130.3 | 2016 | 218.4 |
| 2001 | 108.0 | 2017 | 135.6 |

Table A2.
Annual daily maximum precipitation (mm), station USC00044812.
Table A2.
Annual daily maximum precipitation (mm), station USC00044812.
| Year | Annual Daily Maximum (mm) | Year | Annual Daily Maximum (mm) |
|---|---|---|---|
| 1913 | 127 | 1941 | 116.8 |
| 1914 | 44.5 | 1942 | 114.3 |
| 1915 | 129.5 | 1943 | 162.1 |
| 1916 | 125.5 | 1944 | 88.9 |
| 1917 | 96.5 | 1945 | 92.7 |
| 1918 | 68.6 | 1946 | 61.5 |
| 1919 | 96.5 | 1947 | 113.8 |
| 1920 | 107.2 | 1948 | 64.3 |
| 1921 | 76.2 | 1949 | 70.4 |
| 1922 | 116.1 | 1950 | 144.8 |
| 1923 | 61.5 | 1951 | 95.3 |
| 1924 | 101.6 | 1952 | 104.1 |
| 1925 | 97.3 | 1953 | 115.8 |
| 1926 | 132.3 | 1954 | 109.2 |
| 1927 | 80.3 | 1955 | 189.2 |
| 1928 | 76.2 | 1956 | 125.5 |
| 1929 | 123.2 | 1957 | 119.9 |
| 1930 | 57.7 | 1958 | 89.7 |
| 1931 | 97.8 | 1959 | 77.5 |
| 1932 | 57.2 | 1960 | 66.8 |
| 1933 | 77.7 | 1961 | 79.5 |
| 1934 | 63.5 | 1962 | 239 |
| 1935 | 114.3 | 1963 | 133.9 |
| 1936 | 98 | 1964 | 156.2 |
| 1937 | 191.5 | 1965 | 88.9 |
| 1938 | 85.1 | 1966 | 87.4 |
| 1939 | 81.8 | 1967 | 134.9 |
| 1940 | 194.6 |

Table A3.
Annual daily maximum precipitation (mm), station USC00041159.
Table A3.
Annual daily maximum precipitation (mm), station USC00041159.
| Year | Annual Daily Maximum (mm) | Year | Annual Daily Maximum (mm) |
|---|---|---|---|
| 1959 | 98.8 | 1988 | 132.8 |
| 1960 | 168.4 | 1989 | 130.6 |
| 1961 | 96.8 | 1990 | 91.7 |
| 1962 | 271.8 | 1991 | 106.2 |
| 1963 | 125.5 | 1992 | 98.3 |
| 1964 | 254.5 | 1993 | 103.6 |
| 1965 | 117.9 | 1994 | 119.9 |
| 1966 | 109.2 | 1995 | 210.8 |
| 1967 | 142.5 | 1996 | 145.5 |
| 1968 | 97.3 | 1997 | 61.5 |
| 1969 | 121.9 | 1998 | 174 |
| 1970 | 115.1 | 1999 | 100.3 |
| 1971 | 100.3 | 2001 | 105.4 |
| 1972 | 50.8 | 2002 | 119.4 |
| 1973 | 160.5 | 2003 | 101.6 |
| 1974 | 102.4 | 2004 | 102.4 |
| 1975 | 82 | 2005 | 153.4 |
| 1976 | 66.8 | 2006 | 94.5 |
| 1977 | 70.4 | 2007 | 57.4 |
| 1978 | 136.1 | 2008 | 106.9 |
| 1979 | 135.9 | 2009 | 86.6 |
| 1980 | 157.5 | 2010 | 85.3 |
| 1981 | 154.9 | 2011 | 95.5 |
| 1982 | 218.4 | 2012 | 119.9 |
| 1983 | 117.9 | 2013 | 37.8 |
| 1984 | 88.9 | 2014 | 112.5 |
| 1985 | 86.6 | 2015 | 88.1 |
| 1986 | 123.2 | 2016 | 66.8 |
| 1987 | 88.4 |

Table A4.
Annual daily maxima of precipitation (mm), Quincy (QCY) station.
Table A4.
Annual daily maxima of precipitation (mm), Quincy (QCY) station.
| Year | Annual Daily Maximum (mm) | Year | Annual Daily Maximum (mm) |
|---|---|---|---|
| 1989 | 121.9 | 2004 | 93.7 |
| 1990 | 80.3 | 2005 | 77.0 |
| 1991 | 95.5 | 2006 | 101.3 |
| 1992 | 38.6 | 2007 | 49.3 |
| 1993 | 201.7 | 2008 | 104.1 |
| 1994 | 43.7 | 2009 | 90.2 |
| 1995 | 2010 | 54.1 | |
| 1996 | 239.8 | 2011 | 61.5 |
| 1997 | 86.4 | 2012 | 106.7 |
| 1998 | 96.5 | 2013 | 31.5 |
| 1999 | 46.2 | 2014 | 117.1 |
| 2000 | 65.5 | 2015 | 76.5 |
| 2001 | 63.5 | 2016 | 110.7 |
| 2002 | 110.5 | 2017 | 123.7 |
| 2003 | 74.7 |
References
- Koutsoyiannis, D. Scale of water resources development and sustainability: Small is beautiful, large is great. Hydrol. Sci. J. 2011, 56, 553–575. [Google Scholar] [CrossRef]
- Efstratiadis, A.; Tegos, A.; Varveris, A.; Koutsoyiannis, D. Assessment of environmental flows under limited data availability: Case study of the Acheloos River, Greece. Hydrol. Sci. J. 2014, 59, 731–750. [Google Scholar] [CrossRef]
- Tyralis, H.; Tegos, A.; Delichatsiou, A.; Mamassis, N.; Koutsoyiannis, D. A Perpetually Interrupted Interbasin Water Transfer as a Modern Greek Drama: Assessing the Acheloos to Pinios Interbasin Water Transfer in the Context of Integrated Water Resources Management. Open Water J. 2017, 4, 18. [Google Scholar]
- Tegos, A.; Schlüter, W.; Gibbons, N.; Katselis, Y.; Efstratiadis, A. Assessment of Environmental Flows from Complexity to Parsimony—Lessons from Lesotho. Water 2018, 10, 1293. [Google Scholar] [CrossRef]
- Lewin, J.; Ballard, G.; Bowles, D.S. Spillway gate reliability in the context of overall dam failure risk. Available online: https://pdfs.semanticscholar.org/4e93/2f4989c4670f1a256280aae93b5583f685b2.pdf (accessed on 11 January 2019).
- Lempérière, F. Dams and Floods. Engineering 2017, 3, 144–149. [Google Scholar] [CrossRef]
- Bhattarai, S.; Zhou, Y.; Zhao, C.; Yadav, R. An Overview on Types, Construction Method, Failure and Key Technical Issues during Construction of High Dams. Electron. J. Geotech. Eng. 2016, 21, 18. [Google Scholar]
- Thompson, K.D.; Stedinger, J.R.; Heath, D.C. Evaluation and presentation of dam failure and flood risks. J. Water Resour. Plan. Manag. 1997, 123, 216–227. [Google Scholar] [CrossRef]
- Xu, Y.; Zhang, L.; Jia, J. Lessons from catastrophic dam failures in August 1975 in Zhumadian, China. In Proceedings of the Geosustainability and Geohazard Mitigation, New Orleans, LA, USA, 9–12 March 2008; pp. 162–169. [Google Scholar]
- Si, Y. The World’s most catastrophic dam failures. Qing 1998, 1998a, 25–38. [Google Scholar]
- Foster, M.; Fell, R.; Spannagle, M. The statistics of embankment dam failures and accidents. Can. Geotech. J. 2000, 37, 1000–1024. [Google Scholar] [CrossRef]
- Vaníček, I.; Vaníček, M.; Jirásko, D.; Pecival, T. Experiences from the small historical dams failures during heavy floods. IOP Conf. Ser. Earth Environ. Sci. 2015, 26, 12–42. [Google Scholar] [CrossRef]
- Papalexiou, S.; Koutsoyiannis, D.; Makropoulos, C. How extreme is extreme? An assessment of daily rainfall distribution tails. Hydrol. Earth Syst. Sci. 2013, 17, 851–862. [Google Scholar] [CrossRef]
- Rahman, M.A. Damage to Karnafuli Dam Spillway. J. Hydraul. Div. 1972, 98, 2155–2170. [Google Scholar]
- Moramarco, T.; Barbetta, S.; Pandolfo, C.; Tarpanelli, A.; Berni, A.; Morbidelli, R. Spillway Collapse of the Montedoglio Dam on the Tiber River, Central Italy: Data Collection and Event Analysis. J. Hydrol. Eng. 2013, 19, 1264–1270. [Google Scholar] [CrossRef]
- International Commission on Large Dams (ICOLD). Lessons from Dam Incidents; ICOLD: Paris, France, 1974. [Google Scholar]
- Committee on Dam Safety of the United States Committee on Large Dams (USCOLD). Lessons from Dam Incidents, USA II; American Society of Civil Engineers: New York, NY, USA, 1988. [Google Scholar]
- Charles, J.A.; Tedd, P.; Warren, A. Evidence Report—Lessons from Historical Dam Incidents; Environment Agency: Exeter, UK, 2011.
- California Department of Water Resources. California State Water Project, Volume III: Storage Facilities; The Resources Agency: Sacramento, CA, USA, 1974.
- California Department of Water Resources. Performance of the Oroville Dam and Related Facilities During the August 1, 1975 Earthquake; California Department of Water Resources: Sacramento, CA, USA, 1977.
- Jennings, C.; Strand, R.; Rogers, T. Geological Map of California. Available online: https://mrdata.usgs.gov/geology/state/state.php?state=CA (accessed on 11 January 2019).
- US Army Corps of Engineers. Oroville Dam and Reservoir, Report on Reservoir Regulation for Flood Control; US Army Corps of Engineers: Sacramento, CA, USA, 1970.
- Lamontagne, J.; Stedinger, J.R.; Berenbock, C.; Veilleux, A.; Ferris, J.; Knifong, D. Development of Regional Skews for Selected Flood Durations for the Central Valley Region, California, Based on Data through Water Year 2008; U.S. Geological Survey Scientific Investigations Report 2012–5130; U.S. Geological Survey: Reston, VA, USA, 2012.
- Hickey, J.; Collins, R.; High, J.; Richardsen, K.; White, L.; Pugner, P. Synthetic Rain Flood Hydrology for the Sacramento and San Joaquin River Basins. J. Hydrol. Eng. 2002, 7, 195–208. [Google Scholar] [CrossRef]
- Cudworth, A.J. Flood Hydrology Manual; U.S. Department of the Interior: Washington, DC, USA, 1989.
- Oroville-Dam-lge.jpg (1200×786). Available online: https://dl0.creation.com/articles/p119/c11909/Oroville-Dam-lge.jpg (accessed on 9 November 2018).
- California Department of Water Resources. Oroville Facilities Relicensing, FERC Project No. 2100; California Department of Water Resources: Sacramento, CA, USA, 2004.
- Koczot, K.M.; Jeton, A.E.; McGurk, B.J.; Dettinger, M.D. Precipitation-Runoff Processes in the Feather River Basin, Northeastern California, with Prospects for Streamflow Predictability, Water Years 1971–97; U.S. Geological Survey: Sacramento, CA, USA, 2005.
- US Bureau of Reclamation. Hydraulic Model Studies of the Flood Control Outlet and Spillway for Oroville Dam; US Bureau of Reclamation: Denver, CO, USA, 1965.
- US Army Corps of Engineers. Hydrometeorological Report No. 59; US Army Corps of Engineers: Silver Spring, MD, USA, 1999.
- Koutsoyiannis, D.; Papalexiou, S. Extreme Rainfall: Global Perspective. In Handbook of Applied Hydrology; McGraw-Hill: New York, NY, USA, 2017; pp. 74.1–74.16. [Google Scholar]
- Koutsoyiannis, D. A probabilistic view of Hershfield’s method for estimating probable maximum precipitation. Water Resour. Res. 1999, 35, 1313–1322. [Google Scholar] [CrossRef]
- Papalexiou, S.; Koutsoyiannis, D. A probabilistic approach to the concept of Probable Maximum Precipitation. Adv. Geosci. 2006, 7, 51–54. [Google Scholar] [CrossRef]
- California Department of Water Resources Oroville Dam Hydrologic Data; California Department of Water Resources: Sacramento, CA, USA, 2017.
- Menne, M.J.; Durre, I.; Korzeniewski, B.; McNeill, S.; Thomas, K.; Yin, X.; Anthony, S.; Ray, R.; Vose, R.S.; Gleason, B.E.; et al. Global Historical Climatology Network—Daily (GHCN-Daily), Version 3. Available online: https://data.world/us-noaa-gov/e59ba4b2-a901-43d5-b759-3f7d7168d044 (accessed on 11 January 2019).
- Google Earth. UC Davis Center for Watershed Sciences Map of Oroville Dam Catchment. Available online: https://en.wikipedia.org/wiki/Oroville_Dam (accessed on 11 January 2019).
- White, A.B.; Moore, B.J.; Gottas, D.J.; Neiman, P.J. Winter Storm Conditions Leading to Excessive Runoff above California’s Oroville Dam during January and February 2017. Bull. Am. Meteorol. Soc. 2018. [Google Scholar] [CrossRef]
- Pixel—California Department of Water Resources. Available online: https://pixel-ca-dwr.photoshelter.com/galleries/C0000OxvlgXg3yfg/G00003YCcmDTx48Y/I0000b5wb2ydgHxE/FL-Oroville-4842-jpg (accessed on 9 November 2018).
- Oroville Dam Spillway Failure. Available online: https://www.metabunk.org/oroville-dam-spillway-failure.t8381/ (accessed on 24 December 2018).
- Morrison-Knudsen Engineers, Inc. Inspection and Performance Evaluation of Dams: A Guide for Managers, Engineers, and Operators; Electric Power Research Institute: San Fransisco, CA, USA, 1986. [Google Scholar]
- Friends of the River, Sierra Club, South Yuba River Citizens League. Comments on Draft Environmental Impact Statement, Project 2100-134; Friends of the River: Sacramento, CA, USA, 2006. [Google Scholar]
- Stork, R.; Shutes, C.; Reedy, G.; Schneider, K.; Steindorf, D.; Wesselman, E. The Oroville Dam 2017 Spillway Incident: Lessons from the Feather River Basin; Friends of the River: Sacramento, CA, USA, 2017. [Google Scholar]
- Schnoover, S. Oroville Dam: Group that Issued 2005 Warning still Wants Full Emergency Spillway. Available online: https://www.mercurynews.com/2017/09/20/oroville-dam-group-that-issued-2005-warning-still-wants-full-emergency-spillway/ (accessed on 9 November 2018).
- Koskinas, A.E. The Oroville Dam 2017 Spillway Incident—Possible Causes and Solutions. Master Thesis, National Technical University of Athens, Athens, Greece, 2017. [Google Scholar]
- Benson, M.A. Thoughts on the Design of Design Floods; Water Resour. Publ.: Fort Collins, CO, USA, 1973; pp. 27–33. [Google Scholar]
- Federal Energy Regulatory Commission. 2014 Potential Failure Mode Analysis; Federal Energy Regulatory Commission: Washington, DC, USA, 2014.
- France, J.W.; Alvi, I.A.; Dickson, P.A.; Falvey, H.T.; Rigbey, S.J.; Trojanowski, J. Independent Forensic Team Report, Oroville Dam Spillway Incident; Independent Forensic Team: Leiden, The Netherlands, 2018. [Google Scholar]
- Federal Energy Regulatory Commission. 2009 Potential Failure Mode Analysis; Federal Energy Regulatory Commission: Washington, DC, USA, 2009.
- Division of Safety of Dams, California Department of Water Resources. August 3, 2015 Inspection Report; California Department of Water Resources: Sacramento, CA, USA, 2015.
- Division of Safety of Dams, California Department of Water Resources. August 22, 2016 Inspection Report; California Department of Water Resources: Sacramento, CA, USA, 2016.
- Oroville Week of 1-30-2017—MNG-Chico. Available online: https://mng-chico.smugmug.com/Oroville-Week-of-1-30-2017/i-sZJBSXt (accessed on 9 November 2018).
- Chaudhry, M.H. Open-Channel Flow, 2nd ed.; Springer: New York, NY, USA, 2008; ISBN 978-0-387-30174-7. [Google Scholar]
- Falvey, H.T. Cavitation in Chutes and Spillways. Available online: https://www.researchgate.net/publication/259095887_Cavitation_in_Chutes_and_Spillways (accessed on 25 December 2018).
- Interagency Advisory Committee on Water Data. Bulletin 17B: Guidelines for Determining Flood Flow Frequency; Interagency Advisory Committee on Water Data: Reston, VA, USA, 1982.
- Seckin, N.; Haktanir, T.; Yurtal, R. Flood frequency analysis of Turkey using L-moments method. Hydrol. Process. 2011, 25, 3499–3505. [Google Scholar] [CrossRef]
- Oroville Dam Spillway Incident Independent Forensic Team. IFT Interim Final Memo. Available online: https://damsafety.org/sites/default/files/files/IFT%20interim%20memo%20final%2009-05-17.pdf (accessed on 10 January 2014).
- BBC US Dam Risk Prompts California Evacuation. Available online: https://www.bbc.com/news/world-us-canada-38952847 (accessed on 9 November 2018).
- Sabalow, R.; Kasler, D. Oroville Dam repairs now exceed $1 billion and ‘may be adjusted further’ as work continues. The Sacramento Bee, 9 June 2018. [Google Scholar]
- Sabalow, R.; Kasler, D. Is Oroville Dam ready for the rainy season? Main spillway fixed, but work remains. The Sacramento Bee, 11 February 2018. [Google Scholar]
© 2019 by the authors. Licensee MDPI, Basel, Switzerland. This article is an open access article distributed under the terms and conditions of the Creative Commons Attribution (CC BY) license (http://creativecommons.org/licenses/by/4.0/).