1. Introduction
Climate change will not only change our way of life, it will also influence the preservation conditions of our cultural heritage. Increasing temperatures will cause a rise in sea level and changing precipitation patterns. Other expected effects of global warming are larger temperature fluctuations, an elevated risk of mold growth, more frequent salt deliquescence cycles, an accumulation of extreme weather events, such as heavy rain, flooding, droughts and strong wind, elevated UV-levels, etc. Moreover, the impact of growing (mass) tourism should be considered as well. On the other hand, a decrease in economic resources for heritage conservation is expected [
1,
2,
3,
4]. The expected impact of climate change on built heritage is already well-documented [
4], but one should also consider the changing indoor conditions. This is certainly the case for historic buildings where the outdoor climate often highly influences the indoor conditions. To protect our heritage from these new conditions, adequate mitigation actions will be needed in the near future. Climate change occurs at a slow pace over several generations. Therefore, the adaptation of preservation conditions will occur as a consecutive series of (low-cost) mitigation actions that are sufficiently good for the time being, interspersed with some high-cost but drastic mitigation actions. For heritage guardians, it might be difficult to decide when and which mitigation actions should be implemented. An evaluation tool to assess the evolution of indoor air quality in a quantitative way could support the optimization of the series of consecutive mitigation actions and prepare heritage guardians for the change that is to come.
We introduce a standardized method that converts data streams collected with data loggers (i.e., the input) into a time series of indoor air quality (IAQ) indexes (i.e., the output). The index describes the overall air quality in relation to the preservation conditions of a specific material or object type. The use of air quality indexes, both for indoor and outdoor situations, is already widely used in environmental studies from other fields, especially those related to health impact and human comfort [
5,
6,
7,
8,
9]. The IAQ index that we propose for cultural heritage applications is material specific and focuses on the indoor environment. It can be calculated for each measured data point in time, in contrast to time-averaged evaluations. Plotting the IAQ index over time by means of a line chart is a simple way to identify changes and trends in indoor air quality. It allows visualization of periods of elevated risk and the level of that risk and helps heritage guardians to identify hazards in a more focused way. Therefore, it offers a practical tool that supports decision-making towards the adaptation of the indoor environment to maintain certain preservation conditions despite climate change. Moreover, it can be used to objectively evaluate the effectiveness of a performed mitigation action.
The current paper describes the development of the algorithm that calculates the IAQ index from environmental measurements. The benefits of this approach are illustrated with a case study in which the effects of a mitigation action are shown.
2. Background
A well accepted method to follow up the preservation conditions of a heritage collection is to monitor an objects preservation state by regular visual inspections. The disadvantage of this method is that the hazards cannot be identified until there is visible damage. An alternative approach that enables early warning is based on the calculation of degradation rates of heritage objects from environmental measurements. The prediction of expected damage requires thorough knowledge of the relationships between environmental parameters and degradation rates. However, for many materials, the exact degradation mechanisms that describe that relationship are not yet fully understood. Alternatively, degradation rates can be predicted by (accelerated) degradation experiments under well-controlled conditions. The relationships between environmental parameters and the degradation rate are then described by a best-fitting mathematical function. Dose–response functions illustrate this approach. They enable the prioritization of the agents of deterioration and the definition of damage thresholds [
2,
10,
11]. An example of an algorithm based on such mathematical functions is the preservation metrics developed by the Image Permanence Institute [
12]. Unfortunately, dose–response functions are not available for all materials. Secondly, the degradation of a material is often influenced by the way it is integrated in the heritage object. Finally, the experimental conditions under which the functions are determined are not necessarily representative of natural conditions. Thus, the above approaches appear to be impractical for a generalized evaluation of the preservation conditions. Over the last two decades, risk assessments for collections have made their appearance in the heritage sector [
13,
14,
15]. Such assessments estimate the risk towards a collection by considering the ten agents of deterioration. They tackle the following questions [
16]: What might happen? How likely is that? What will the consequences be? Such risk assessments are often time-consuming and require relevant expertise. In this contribution, we propose an alternative risk-based approach that focuses on the indoor air quality for heritage preservation. This approach requires less expertise and is based on several easily applied principles that are validated through practical experience and theory. The following paragraphs describe the approach.
2.1. The Concept of Key Risk Indicators
From the huge amount of literature concerning the degradation of historic materials, it is possible to identify a large number of parameters that affect degradation rates. However, that reality is too complex to estimate the risk that damage might occur. Instead, we simplified it by using a first simple principle: the degradation rate of any material is, to a large extent, driven by a limited number of environmental parameters. This set of parameters can be grouped in four categories that correspond to the following agents of deterioration: incorrect temperature, incorrect relative humidity, radiation and pollution (
Figure 1).
The small set of environmental parameters that dominate the degradation rate of all (historic) materials can be considered to be markers, i.e., distinguishing and easily measurable features that give an objective indication of the preservation state in which a collection resides. Well-known examples are temperature, relative humidity, illuminance and UV-radiation. If the risks caused by these markers are known, the overall picture of the preservation conditions is known. For that reason, the markers can be used to introduce the concept of key risk indicators (KRIs) [
17,
18,
19]. KRIs are independent parameters that estimate the threat that certain preservation conditions will harm the collection. They rely on the measurement of a marker and on a corresponding description of the alarming situation where enhanced risk for accelerated degradation might occur. The following list gives an overview of the 12 most critical KRIs (i.e., type of threats) identified from the literature: too high relative humidity (RH), too low RH, too large RH fluctuations, too high temperature (T), too low T, too large T fluctuations, too high illumination, too high UV-radiation, too high concentration of oxidizing gases (O
3, NO
x, SO
2), too high concentrations of organic gases (acetic acid, formic acid, formaldehyde), too high concentrations of reduced sulfur compounds (H
2S, carbonyl sulfide (OCS)) and too high concentrations of dust (PM
2.5, PM
10, deposited dust) (
Figure 1).
2.2. Quantifying the KRIs
To simplify the estimation of the KRIs for specific environmental conditions, the question, “How fast do materials degrade?”, is replaced by the question, “How large is the risk for enhanced degradation?”. Although the answers of both questions contain similarities, they are not identical. For example, it is a complex matter to calculate the rate at which climate-induced damage accumulates in wooden objects from measurements of relative humidity and temperature [
20,
21,
22]. However, we know that these parameters cannot be too low, too high or with excessive fluctuations without enhancing the risk of damage. This means that the level of risk as described by a KRI can be estimated by comparing the measurement of a marker with its corresponding target value. Such target values or ranges of acceptable values can be found in the literature, guidelines and standards.
The KRIs are quantified by converting their corresponding markers into a level of risk that is described by a value between 0 and 1—the higher that value, the higher the risk. Based on previous literature, four types of conversion functions have been identified. They are described in the list below and visualized in
Figure 2. Since the shapes of the conversion functions are predefined, the exact definitions of the conversion functions are dependent on just a few nodes (i.e., the red dots in
Figure 2, upper part). The position of the nodes coincides with published target values and is material-dependent. There is sufficient literature on thresholds, but their exact values are sometimes under discussion. In this contribution, one expert set these values and tested the results for consistency. The concept of calculating the level of risk with simplified conversion functions can be considered to be the second principle of the approach.
Conversion Function 1: This function describes the impact of the KRIs having a too high/too low RH or a too high/too low T. For example, for most hygroscopic materials, a mid-range RH has a limited risk of damage, while RH-values outside this recommended range are associated with higher risks. Materials for which a too low RH does not matter, such as metals, the first node is set at position (0,0).
Conversion Function 2: The fluctuation of a marker (e.g., RH or T) is defined as the maximum value minus the minimum value within a period of 24 h. Objects can usually withstand small fluctuations without damage. Therefore, until a certain magnitude of fluctuation, the level of risk for enhanced degradation is zero. The larger the peak-to-peak value becomes, the higher the risk is. From a certain peak-to-peak value, the risk for enhanced damage is so high that the level of risk is considered to be 1.
Conversion Function 3: This function describes the risk for enhanced degradation that is caused by the intensity of visible light and UVA radiation. At lower radiation levels, there is only a small risk of enhanced degradation, but that risk increases at higher intensities. At a certain intensity, degradation is almost certain to occur, and the risk becomes 1.
Conversion Function 4: This function describes the risk of all pollutant-related KRIs, i.e., oxidizing gases, organic gases, reduced sulfur compounds and dust. Although the exact influence of the pollutant concentration on the degradation of many materials is not known in detail, it is known that the lower the concentration is, the smaller the impact is (i.e., the ALARA principle: as low as reasonably achievable). A total of four nodes is used to define the conversion function, since well-accepted standards often mention a lower and a higher ‘range’ of threshold levels (e.g., reference [
23]).
2.3. Risk Profile of a Material
The first principle states that the degradation rate of historic materials is driven by a limited number of markers. However, one single marker does not have the same effect on the degradation rates of different materials. For example, the same amount of radiation endangers very sensitive materials, such as paper and textiles and affects oil paintings to some extent, while metals are almost insensitive to it. On the other hand, when considering all KRIs on a single material, pollutants have, for example, a larger impact on metals than temperature. Therefore, the third principle states that weighting factors can be used (1) to rank the importance of the different KRIs per material or object type, and (2) to rank the sensitivity of material/object types per KRI.
A matrix was set up to elaborate the third principle. The matrix rows list 35 commonly occurring heritage materials and object types.
Table 1 gives an overview of these materials and object types. They are considered to be representative for most heritage collections and cover materials and object types for which sufficient information on degradation can be found in literature. The matrix columns list the KRIs. First, the importance levels of the KRIs are ranked per material/object type (horizontal matrix direction). Five categories are allowed, and the same category could be attributed to several KRIs. The rankings are based on an extensive literature study, information from previous projects [
24] and personal experience. Subsequently, the material/object sensitivity for each KRI was implemented using a five-category ranking as well (vertical matrix direction). To do so, the KRI importance within one material/object can change its ranking category, but the order of KRI importance within a material/object cannot change. Finally, the ranking categories are quantified by attributing a numerical score that reflects the impact of the KRI on the degradation: 0.05 (negligible), 0.25 (low), 0.5 (moderate), 0.75 (high) and 1 (extremely high). By using only five categories, disagreements between experts have a small effect on the final ranking because most disagreements are subtler that the rather broad categories that are imposed by our approach. The numerical scores are considered to be weighting factors.
In principle, the weighting factors describe the importance of each KRI. For this reason, the weight is independent of the marker value. Therefore, one weighting factor is assigned to each type of conversion function (
Figure 2, lower part). The only exception is Conversion Function 1, because it combines two KRIs and they need to be weighted independently. Moreover, for the KRI ‘too high RH’, an additional weighting factor is attributed when crossing an RH of 75%. Above this value, an elevated risk towards mold growth can be expected. This additional weighting factor is only valid for mold-sensitive materials. In the range where the risk is zero, the weight is not defined because w
i x R
i remains zero.
For each material/object type, a spider graph can be plotted to visualize the relative KRI-importance. Each graph can be considered to be a risk profile for a given material/object type—the total area of the spider graph indicates the average sensitivity of the material/object to the overall preservation conditions. The differences in total area demonstrate that not all materials degrade at the same rate.
Figure 3 gives an example for paintings, making the distinction between paintings on wood, canvas and copper.
2.4. Combining all KRI into an Overall Indoor Air Quality (IAQ) Index
The preservation conditions are not determined by a series of marker-specific risks but by one overall risk. The IAQ index is related to that global risk. To calculate the index, the heritage guardian must first select which material/object type he wants to determine the indoor air quality for from a list of options. Then, the IAQ index is calculated with an algorithm that follows six subsequent steps (
Figure 4), as follows: (1) The heritage guardian preprocesses the monitored environmental data to create a consistent data matrix to be uploaded. The matrix should be based on data of simultaneous measurements of markers at fixed time intervals. (2) Based on the material/object selection, the algorithm identifies which conversion functions are needed to calculate the level of risk for each KRI, R
i. (3) The algorithm now identifies the relative importance of the KRI based on the weighting factors, w
i. The levels of risk for the KRIs, R
i, are subsequently multiplied by the respective weighting factor, w
i. (4) The overall risk for a specific data point, R
max, is controlled by the highest weight-corrected marker-specific risk (i.e., max {w
1 × R
1, w
2 × R
2, …}). (5) Since risk is associated with the probability of occurrence of damage due to the preservation conditions, the probability that no damage will occur (i.e., the safety of the environment) is given by 1 − R
max. This magnitude is defined as the overall IAQ index. The numerical value of this index varies from 0 to 1—the higher the index, the better the preservation conditions. The maximum value of the IAQ index is determined by the w
i of the marker that sets R
max. The algorithm is repeated for each data point, resulting in a time series of IAQ indexes. If needed, a marker-specific IAQ index can be evaluated as well, defined as 1 − R
i. This marker-specific index does not consider the weighting factors. (6) The behavior of the IAQ-index over time can be visualized in line charts. Another visualization can be done by assigning a specific color to each IAQ value using a color map. This results in color bars that depict the IAQ index over time, allowing intuitive and user-friendly interpretation.
3. Materials and Methods
3.1. Data Acquisition
An in-house developed multi-sensor tool measured a large number of markers. The monitoring tool consisted of a multi-purpose data logger (DataTaker DT85, Thermo Fischer Scientific, Scoresby Vic, Australia) to which a wide range of off-the-shelf sensors were coupled. The temperature and relative humidity were collected with a GMW90 (Vaisala, Helsinki, Finland). The intensity levels of visible and UV light were monitored with the upward positioned sensors SKL310 and SKU421, respectively (Skye Instruments, Llandrindod Wells, UK). Particulate matter was collected with a DC1100 Pro Air Quality Monitor (Dylos Corporation, Riverside, CA, USA). The measured concentration in number of particles m−3 was converted into µg m−3 using an empirical formula provided by the supplier. Concentrations of NO2 and O3 were collected with NO2-A43F and OX-A431 sensors (Alphasense, Essex, UK). The concentration of total volatile organic compounds (TVOC) was measured with a photo ionization detector with a 10.6 eV lamp (Vaisala, Helsinki, Finland), but the concentrations were too close to the detection limit to get a meaningful signal. For other markers, such as H2S, no appropriate mid-price sensor could be found that was able to measure the (low) concentrations.
All sensors were read out in phase with a frequency of 15 min and saved by the data logger. Data was downloaded wirelessly using a 4G router.
3.2. Data Processing
The collected environmental data were stored in a data matrix. The rows consisted of the timestamp and the series of sensor readouts. The rows were denoted as the measuring points. The measured markers were organized as columns. The IAQ index was calculated by following the procedure described above and using an in-house developed software written in MatLab R2017a (The MathWorks, Natick, MA, USA).
3.3. Data Visualization
Data visualization makes large data sets understandable and helps to absorb the information in a constructive way. Therefore, even though the IAQ index already summarizes the appropriateness of an environment based on several markers, an intuitive data visualization remains essential. The data should be visualized in a way such that it becomes useful and easy to understand by the end user, i.e., heritage guardians. It was decided to visualize the IAQ index over time using color bars. For this, the IAQ values were associated with the reverse jet color map from the software package MatLab R2017a (The MathWorks, Natick, MA, USA). By associating the IAQ index of each data point to a vertical colored line, the time series was converted to a color bar. A dark blue color was assigned to an appropriate environment, while a red color indicated an environment with elevated risk.
3.4. Sampling Location
The application of the IAQ index calculations was illustrated on a dataset collected in a late Gothic church in the centre of a small Belgian city. The church houses several canvas paintings, including a masterpiece of Rubens. Its other remarkable interior elements are a valuable organ, an early 17th century sacrament tower, several wooden statues, a wooden pulpit and metal candle holders. Environmental monitoring was performed at the organ loft at a height of around 7 m. Data collection started on 3 July 2017 and will continue until spring 2019. The current article focuses on a four-month period from 1 January 2018 to 30 April 2018. Within this period, a new heating system was started up in the church. The target temperature of the heating was set at 11 °C. When outdoor temperatures increase during the warmer seasons, the heating system is automatically switched off. For the IAQ index calculations, we selected canvas paintings, restrained wood and copper as the material/object types of interest.
4. Results
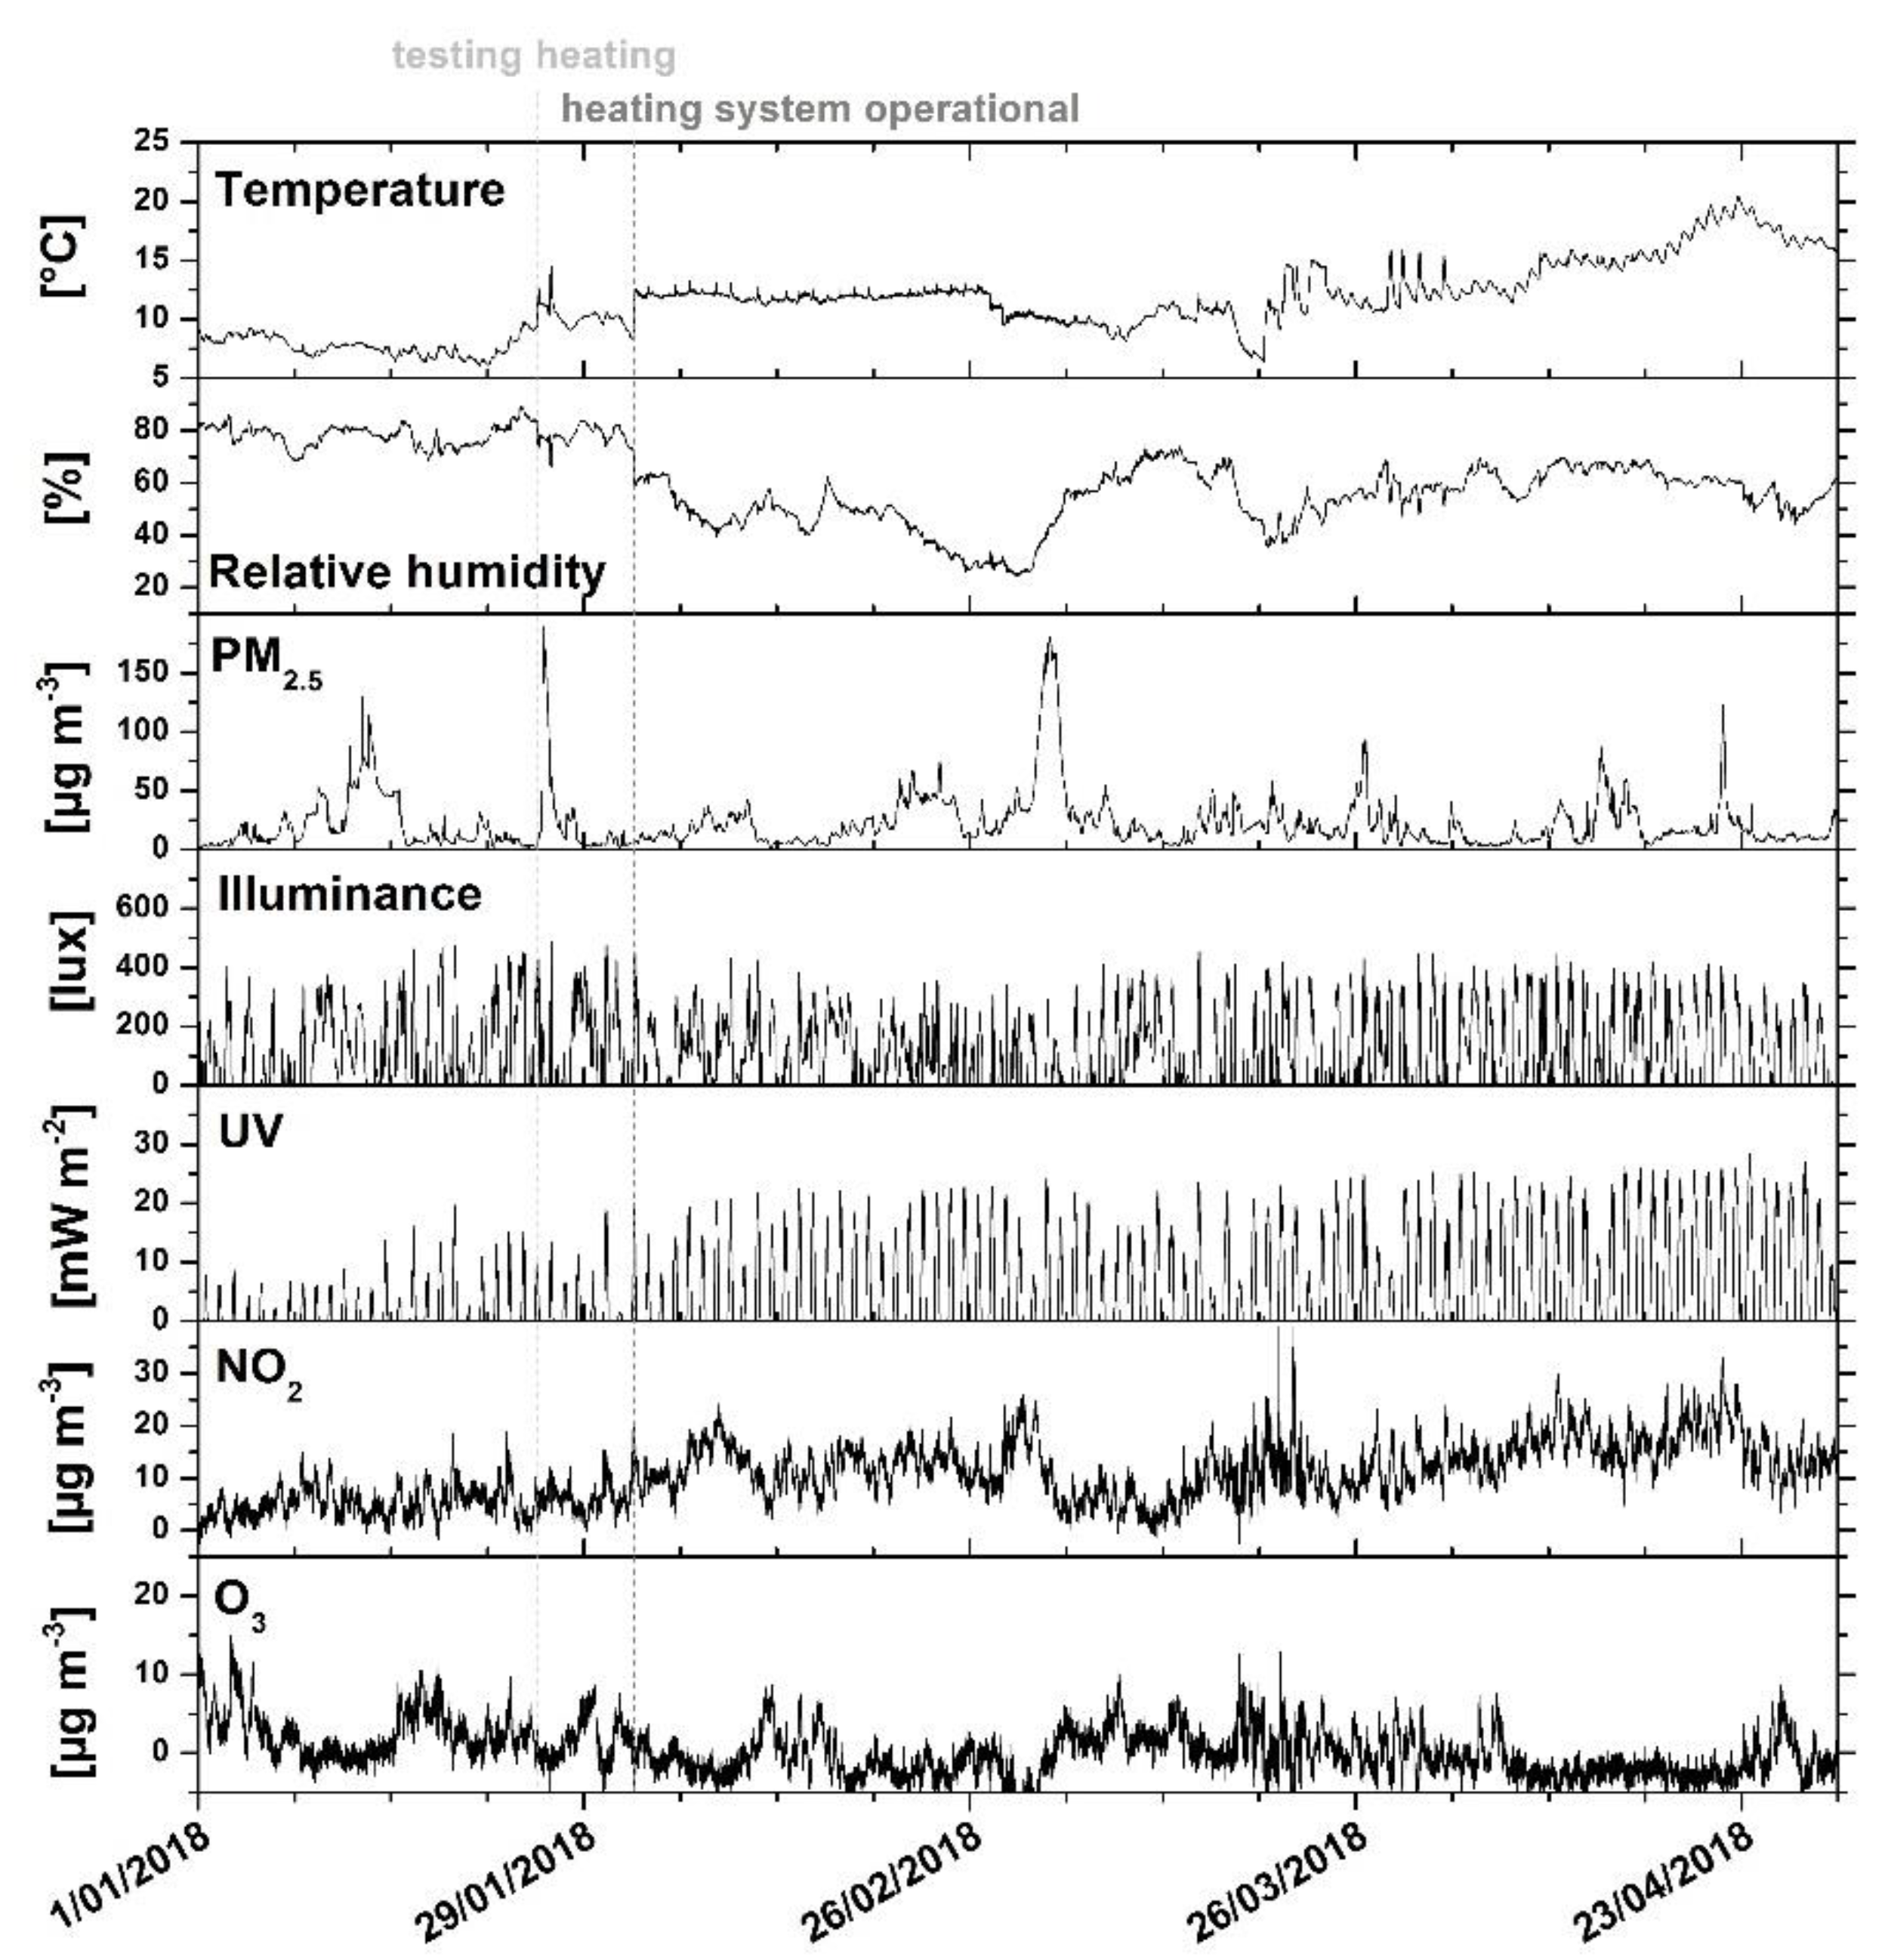
Figure 5 shows a traditional line chart for all measured markers in the church for the period, January to April 2018. At the beginning of January, temperatures in the church were below 10 °C, and correspondingly, high indoor humidity levels of around 80% were observed. On 25 January and 26 January, the newly installed heating system was tested. The first test resulted in a remarkable peak in particulate matter. This was linked to the resuspension of deposited dust in the heating grids. After the tests, the temperature increased from about 9 °C to 11 °C while the RH dropped from somewhat higher than 80% to 75–78%. The heating system was effectively put into operation on 1 February, with a target temperature of 11 °C. This resulted in a sudden drop in RH to 60%. Until the end of February, the temperature remained constant, but the RH continued to drop. It should be noted that there was a cold snap during this period, marked with outdoor temperatures below the freezing point and an outdoor decreasing RH as well. The combination of the outdoor cold snap and the indoor heating resulted in a continued decrease in RH down to almost 25%. Therefore, it was decided to lower the temperature set point of the heating system on 27 February. In mid-March, a failure in the installation occurred, resulting in a temperature drop. Subsequently, after a short period of heating, the outdoor temperature rose, and the heating system did not switch on anymore.
The other markers—illuminance, UV-radiation, NO2, O3 and PM2.5—showed the presence of numerous peaks. The peaks in the pollution-related markers could not be related to the heating system, except for one PM peak on 25 January. Illuminance and UV radiation mainly showed day–night cycles. Approaching spring, the UV levels tended to increase relative to the winter period.
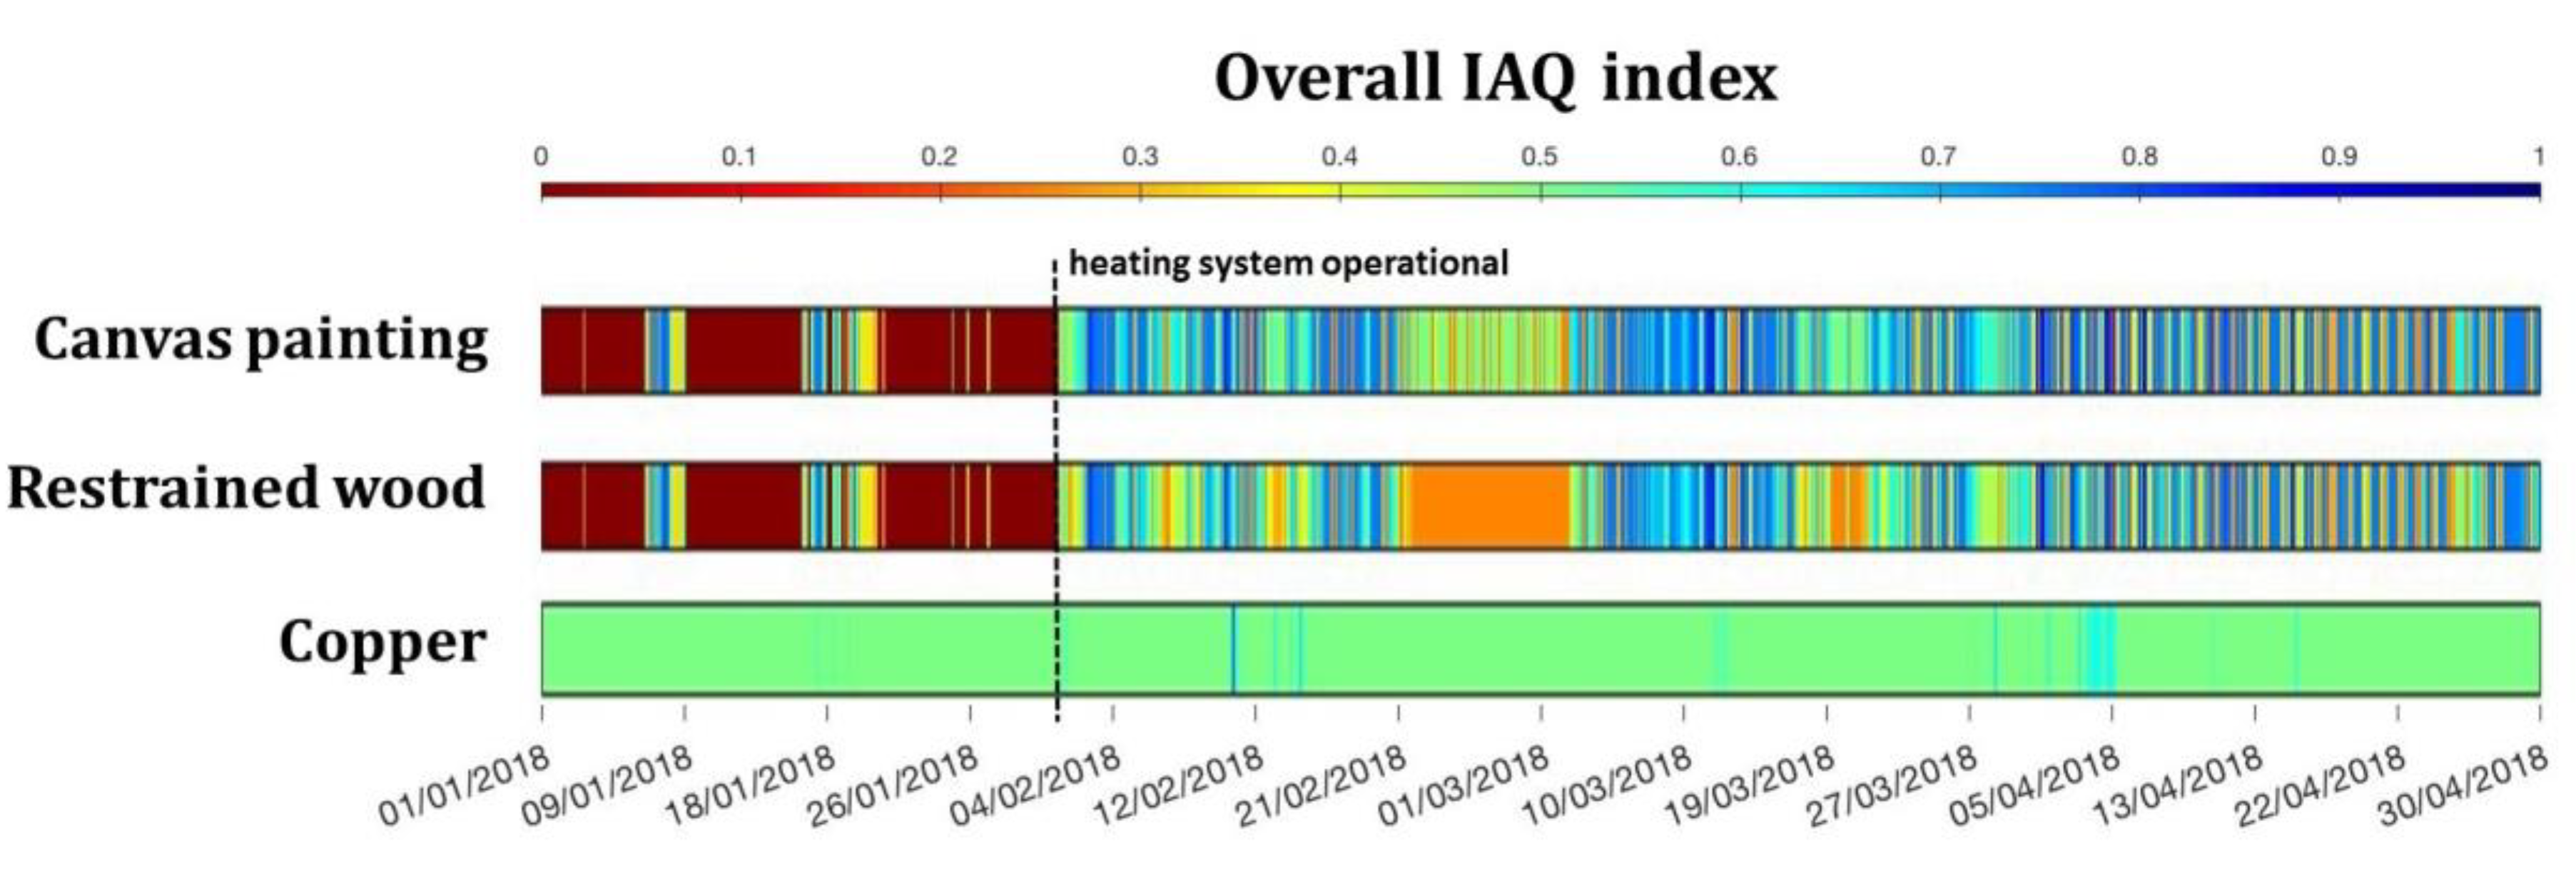
The graphs of all measured markers possess a wealth of information. However, when not familiar with data processing, the information can become overwhelming. The information output could be enhanced by adding yardsticks that denote the acceptable ranges as defined by guidelines. However, even with this information, heritage guardians could be lost in the data. To demonstrate the user-friendliness of the IAQ index calculations, the algorithm was run for this dataset for canvas painting, restrained wood and copper (
Figure 6). When hygroscopic materials, such as canvas paintings and wood, are exposed for a long time in certain humidity conditions, it is expected that they will acclimatize to these conditions [
25]. Therefore, for these materials, general RH threshold values for Belgian churches were considered [
26]. Other threshold values were mainly based on ASHRAE [
23], CIE [
27] and Finney [
28].
When comparing the overall IAQ index for these three material/object types, one quickly notices the correspondence between canvas painting and restrained wood, and the totally different outcome for copper. Indeed, canvas paintings and wood are both hygroscopic, while copper, as a metal, behaves in a different way. This results in a different sensitivity towards certain environments. For canvas paintings and restrained wood, a clear transition from a period with a high level of risk (dark red) towards more appropriate conditions (blue) can be observed around 1 February when the heating system was operational. After the heating system became operational, the IAQ index became worse again for a certain period. This period was more pronounced for restrained wood (orange color) compared to canvas painting (green to orange color). For copper, there is a rather equal IAQ evaluation throughout the whole period, with an intermediate IAQ index. To quantify the direct improvement of the start-up of the heating system, we considered the average IAQ index of one week before and one week after the heating system became operational. By considering such a short period in time, we focused on the short-term impact of this mitigation action, and eliminated other influences (e.g., seasonal change) and undesired situations as much as possible. The ΔIAQ between the weeks before and after the commissioning of the heating system equaled 0.6, 0.5 and 0.0 for canvas painting, restrained wood and copper, respectively.
The overall IAQ index gives a visual summary of the environmental appropriateness based on all (measured) KRIs. It compresses all information from the multiple environmental parameters of a data point into one single index. Based on the marker-specific IAQ indexes (1-
Ri), the marker(s) that cause the undesired situation can be identified.
Figure 7 shows an overview of all marker-specific IAQ indexes for restrained wood and copper, which are also visualized in color bars. For restrained wood, it is easily visible that the characteristic pattern in the overall IAQ index was mainly caused by a too high/too low RH. Temperature values and PM concentrations also exceeded the threshold levels, but these are estimated to have a lower impact on the general degradation rate of the collection.
For copper, the situation is more complex. The most striking undesired periods appeared for both a too high/too low RH and for too high concentrations of PM2.5 (dark red). However, the overall IAQ index depicts colors in the greenish range, corresponding to IAQ indexes of around 0.5. The translation of the marker-specific IAQ indexes to the overall IAQ index seems counter-intuitive. This is due to following reason. Copper is not considered to be a highly sensitive material when compared to other material types such as, for example, paper. Therefore, the highest weighting factor attributed to any marker for copper is 0.5. This means that only half of the color scale for the overall IAQ-index is used. In this specific case, both RH and PM exceeded the thresholds. The weighting factor for both markers equaled 0.5. Since the IAQ index is calculated as the maximum of (w1 x R1, w2 x R2, …, wn x Rn), almost the whole period had an overall IAQ-index of 0.5. In addition, our approach evaluated the preservation conditions with several independent KRIs. Synergetic effects, if any, were not considered, for example, the increased degradation rate of dust particles in humid conditions. Therefore, the start-up of the heating system is not visible in the color bar of the overall IAQ-index but is reflected in the marker-specific indexes and, especially, in the color bar related to a too high/too low RH. This effect is a limitation of the algorithm: the choice of incorporating the sensitivity of materials relative to each other results in a loss of information. However, by evaluating the combination of the overall and the marker-specific IAQ indexes, the information can still be made available.
5. Discussion
Although several personal/human decisions (e.g., selection and interpretation of standards and guidelines, definition of weighting factors, etc.) are introduced in the algorithm, the algorithm itself is a standardized procedure that leads to reproducible and quantitative judgement of the IAQ. This standardized evaluator enables the conversion of measurements into judgements. These judgements help the heritage guardian analyse the preservation conditions and identify the hazards that are endangering his collection. Before using the algorithm, the heritage guardian is obliged to select the materials or object types for which he wants to know the IAQ index from a list of materials/objects. It is important to have measurements of all relevant KRIs for that material/object type. Current technology does not yet allow continuous measurement of all relevant markers with low-cost devices. However, with fast-evolving technology, it is expected that more sensors with better detection limits will become available. In the meantime, the algorithm can be applied, but one should be aware of the possible overestimation of the IAQ due to missing information of a relevant marker.
Since hazards can reoccur in the future with a possible increased level of risk, it is advised that mitigation actions are performed to avoid or reduce the identified hazards reoccurring in the future. This means that identified undesirable situations contain valuable information and should not be neglected, even when they have not caused any noticeable harm so far. With this approach, the slow change in hazard occurrence as a result of climate change will automatically be compensated for. The overall IAQ index can be used to detect periods of elevated risk. By looking at the marker specific IAQ indexes or the original line graphs, the causes of risk can be identified. By mitigating these risks, even small ones, the general preservation conditions improve, and material degradation slows. The algorithm can already be applied on short datasets and does not require a minimum of at least one year of data as an input. Therefore, it allows the environment to be followed up in real-time. When the preservation conditions start to become worse, one can quickly undertake action before (irreversible) damage occurs. In this way, the IAQ index serves as an early warning.
Despite the advantages and the user-friendliness of our approach, there are also some points of concern that should be considered. One limitation has already been described by the visualization of the overall IAQ index of copper where the ranking of the different KRIs based on their impact on one material and the ranking the KRI based on the impact of a series of materials resulted in a limitation in the visualization of all required information. Also, the following remarks should be considered when using the algorithm:
The intuition of the developer affects the definition of the standardized evaluator. The proposed principles do not perfectly reflect the complex reality and require some expert intuition. However, they work well enough to make several evaluations. The principles can be refined at a later stage, and the IAQ indexes of data from the past can be recalculated. Thus, the standardized evaluator generates reproducible and quantitative evaluations, but the scale is not absolute.
The exact degradation rate remains unknown. Although the IAQ indexes give good insight into the periods with elevated risk, the initial question, “How fast do materials degrade?”, is not answered. However, the IAQ algorithm supports the formulation of that answer by estimating the enhanced risk for degradation. This already helps heritage guardians to make decisions.
Restricted options for material choice. The algorithm offers a list of 35 materials and object types to select. The list covers a wide range of heritage materials and objects that is representative of heritage collections. When using the IAQ index calculator, one should be aware that within each material/object type, variations in sensitivity exist depending on the applied techniques, material combinations, material purity, etc. These variations are one of the reasons why objects of art should be considered to be unique objects. Also the conservation state is important, since deterioration rates may vary during ageing [
25], and conservation–restoration treatments can suddenly change the fragility of an object. Such refinements are not implemented in the algorithm which considers materials and objects at a statistical level (i.e., average materials and objects with an average behavior).
Synergistic effects. The IAQ index does not consider synergistic effects because it uses independent KRIs to estimate the risk of elevated degradation and not degradation mechanisms. Several synergistic effects are well known, e.g., lead corrosion is highly promoted in the presence of organic acids and high humidity [
29,
30]. Since synergistic effects are not considered, periods of elevated risk could be somewhat underestimated. This could happen when the ranking of the KRIs as described by the weights is affected. However, changes in ranking are only expected with strong synergistic effects. Even though the overall IAQ index could be underestimated in cases of such strong synergistic effects, the marker-specific indexes will still show the periods of elevated risk.
Evolving standards and guidelines. Due to improved knowledge and expertise, green-thinking, and less energy-intensive preventive measures, standards and guidelines for temperature and humidity tend to become more relaxed [
31]. It is also expected that more accurate thresholds will become available for pollution levels. Therefore, to keep the algorithm up-to-date, the values that determine the conversion functions should be revised on a regular basis. Once revised, data from the past can be recalculated and re-evaluated considering the updated threshold values. This allows an evaluation of the progress in the IAQ despite changes in the ‘standardized evaluator’, i.e., the algorithm.
6. Conclusions
The IAQ-index estimates the indoor air quality in a standardized way. The proposed algorithm is a versatile tool that enables the introduction of a set of environmental parameters that goes beyond temperature and relative humidity. The introduction of an overall IAQ index and its visualization in color bars simplifies the analysis and interpretation of large data streams and a wide range of parameters that can be measured simultaneously. This offers heritage guardians a practical tool that helps them understand their indoor air quality. If more in-depth information is required, the user can consult the marker-specific IAQ indexes, or the original line graphs. The evaluation of such graphs becomes easier with the help of the IAQ indexes. This saves time and facilitates decision-making to improve the indoor air quality and to adapt the heritage institute to a changing climate.
All periods in time are evaluated in exactly the same way, resulting in a comparative risk of damage to heritage collections over time. Even if the following generations decide to adapt the algorithm, the data from the past can easily be re-evaluated and new comparative risks can be obtained. The comparative risk output also allows heritage guardians to quantify the effectiveness of mitigation actions and demonstrates that the effectiveness is not necessarily the same for all material/object types.
This substantiated and user-friendly tool will increase the awareness of a changing environment and will encourage heritage institutions to perform well-considered mitigation actions. In this way, the end-user will react to climate change-induced problems without necessarily realizing that these are related to climate change.


