Article

Modelling the Present and Future Water Level and Discharge of the Tidal Betna River

by
M. M. Majedul Islam
1,*,
Nynke Hofstra
1 and
Ekaterina Sokolova
2
1
Environmental Systems Analysis Group, Wageningen University and Research, 6708 PB Wageningen, The Netherlands
2
Department of Architecture and Civil Engineering, Chalmers University of Technology, 412 58 Gothenburg, Sweden
*
Author to whom correspondence should be addressed.
Geosciences 2018, 8(8), 271; https://doi.org/10.3390/geosciences8080271
Submission received: 14 June 2018 / Revised: 3 July 2018 / Accepted: 23 July 2018 / Published: 24 July 2018
(This article belongs to the Special Issue Hydrological Hazard: Analysis and Prevention)

Abstract

:
Climate change, comprising of changes in precipitation patterns, higher temperatures and sea level rises, increases the likelihood of future flooding in the Betna River basin, Bangladesh. Hydrodynamic modelling was performed to simulate the present and future water level and discharge for different scenarios using bias-corrected, downscaled data from two general circulation models. The modelling results indicated that, compared to the baseline year (2014–2015), the water level is expected to increase by 11–16% by the 2040s and 14–23% by the 2090s, and the monsoon daily maximum discharge is expected to increase by up to 13% by the 2040s and 21% by the 2090s. Sea level rise is mostly responsible for the increase in water level. The duration of water level exceedance of the established danger threshold and extreme discharge events can increase by up to half a month by the 2040s and above one month by the 2090s. The combined influence of the increased water level and discharge has the potential to cause major floods in the Betna River basin. The results of our study increase the knowledge base on climate change influence on water level and discharge at a local scale. This is valuable for water managers in flood-risk mitigation and water management.

1. Introduction

Floods often cause devastating effects on human life and properties worldwide. Climate change increases floods because of change in precipitation patterns and sea level rise (SLR) [1]. Bangladesh is extremely vulnerable to the impacts of climate change because of its low and flat terrain, high population density, high poverty levels, and the reliance of many livelihoods on climate-sensitive sectors [2]. The Betna River basin in the southwest of Bangladesh has been experiencing both fluvial flooding due to extreme precipitation during the monsoon and storm surge flooding due to cyclones originating from the Bay of Bengal. Floods hit this area almost every year of the last decade, causing loss of life and economic damage [3].
Increased precipitation and flooding cause increased runoff that brings pollution from the land into the river. Outbreaks of waterborne diseases, such as diarrhoea, are very common after flooding events [3] and cause serious public health risks in this area [4]. More frequent and intense flooding is likely to occur in this area in the future due to climate change and SLR [5]. Therefore, the impact of flooding could well become more severe, particularly due to the low lying areas, high population density, inadequate flood protection infrastructure, low level of social development, and high dependence on agriculture [4].
The fifth assessment report (AR5) of the Intergovernmental Panel on Climate Change [6] concluded that the projected adverse impacts of climate change on deltas would be mainly due to floods associated with extreme precipitation, increases in temperature and SLR. The future precipitation in Bangladesh is expected to increase between 5 and 20%, and average temperature is expected to increase between 2 and 4 °C by 2100 [7]. Trend analysis of SLR along the southwest coast of Bangladesh shows an annual increase of 5.5 mm based on tidal gauge record during 1977–1998 [8]. Although the impact of extreme precipitation and SLR on flood risks is substantial, current water management practices are not robust enough to cope with climate change consequences. The information about present climate variability and future climate scenarios needs to be better incorporated into planning and management of water bodies [8].
Process-based modelling is often performed to understand hydrodynamics of a basin and to assess the effectiveness of future flood protection infrastructure [9,10]. Several modelling and climate change studies were performed for South-Asian river basins [11,12,13,14]. These studies were mainly based on two climate change variables (temperature and precipitation) and reported that increases in future floods are very likely in this region, since increased temperatures and monsoon precipitation will likely impact river flows. However, in-depth studies on assessing combined impact of climate change and SLR on river hydrodynamics are lacking. Moreover, most of the climate change studies have been conducted in large or regional river basins like the Ganges, Brahmaputra and Meghna (GBM) River systems of India and Bangladesh [9,11,12,13]. No such studies have been performed for a relatively small basin; thus, the influence of climate change on water levels and discharge at the local scale remains unclear. Our study on the Betna River basin reduces this knowledge gap. The Betna River basin was selected for this study since it floods almost every year due to combined effects of extreme precipitation, storm surges and SLR. Moreover, the diversified water uses in the area (e.g., domestic, irrigation, shellfish growing, and bathing) require adequate water management.
The aim of the study was to assess the present and future water level and discharge in the Betna River. This was achieved by applying a process-based hydrodynamic model (MIKE 21 FM) to simulate water level and discharge under different future climate conditions. The MIKE 21 FM model for the Betna River was set up, calibrated and validated using the observed water level and discharge data. The model was then used to project the future (2040s and 2090s) water level and discharge. The output of this study is likely helpful in addressing frequent and intense flooding induced by climate change in the study area. The findings and model can be transformed to other basins of the world with similar characteristics.

2. Materials and Methods
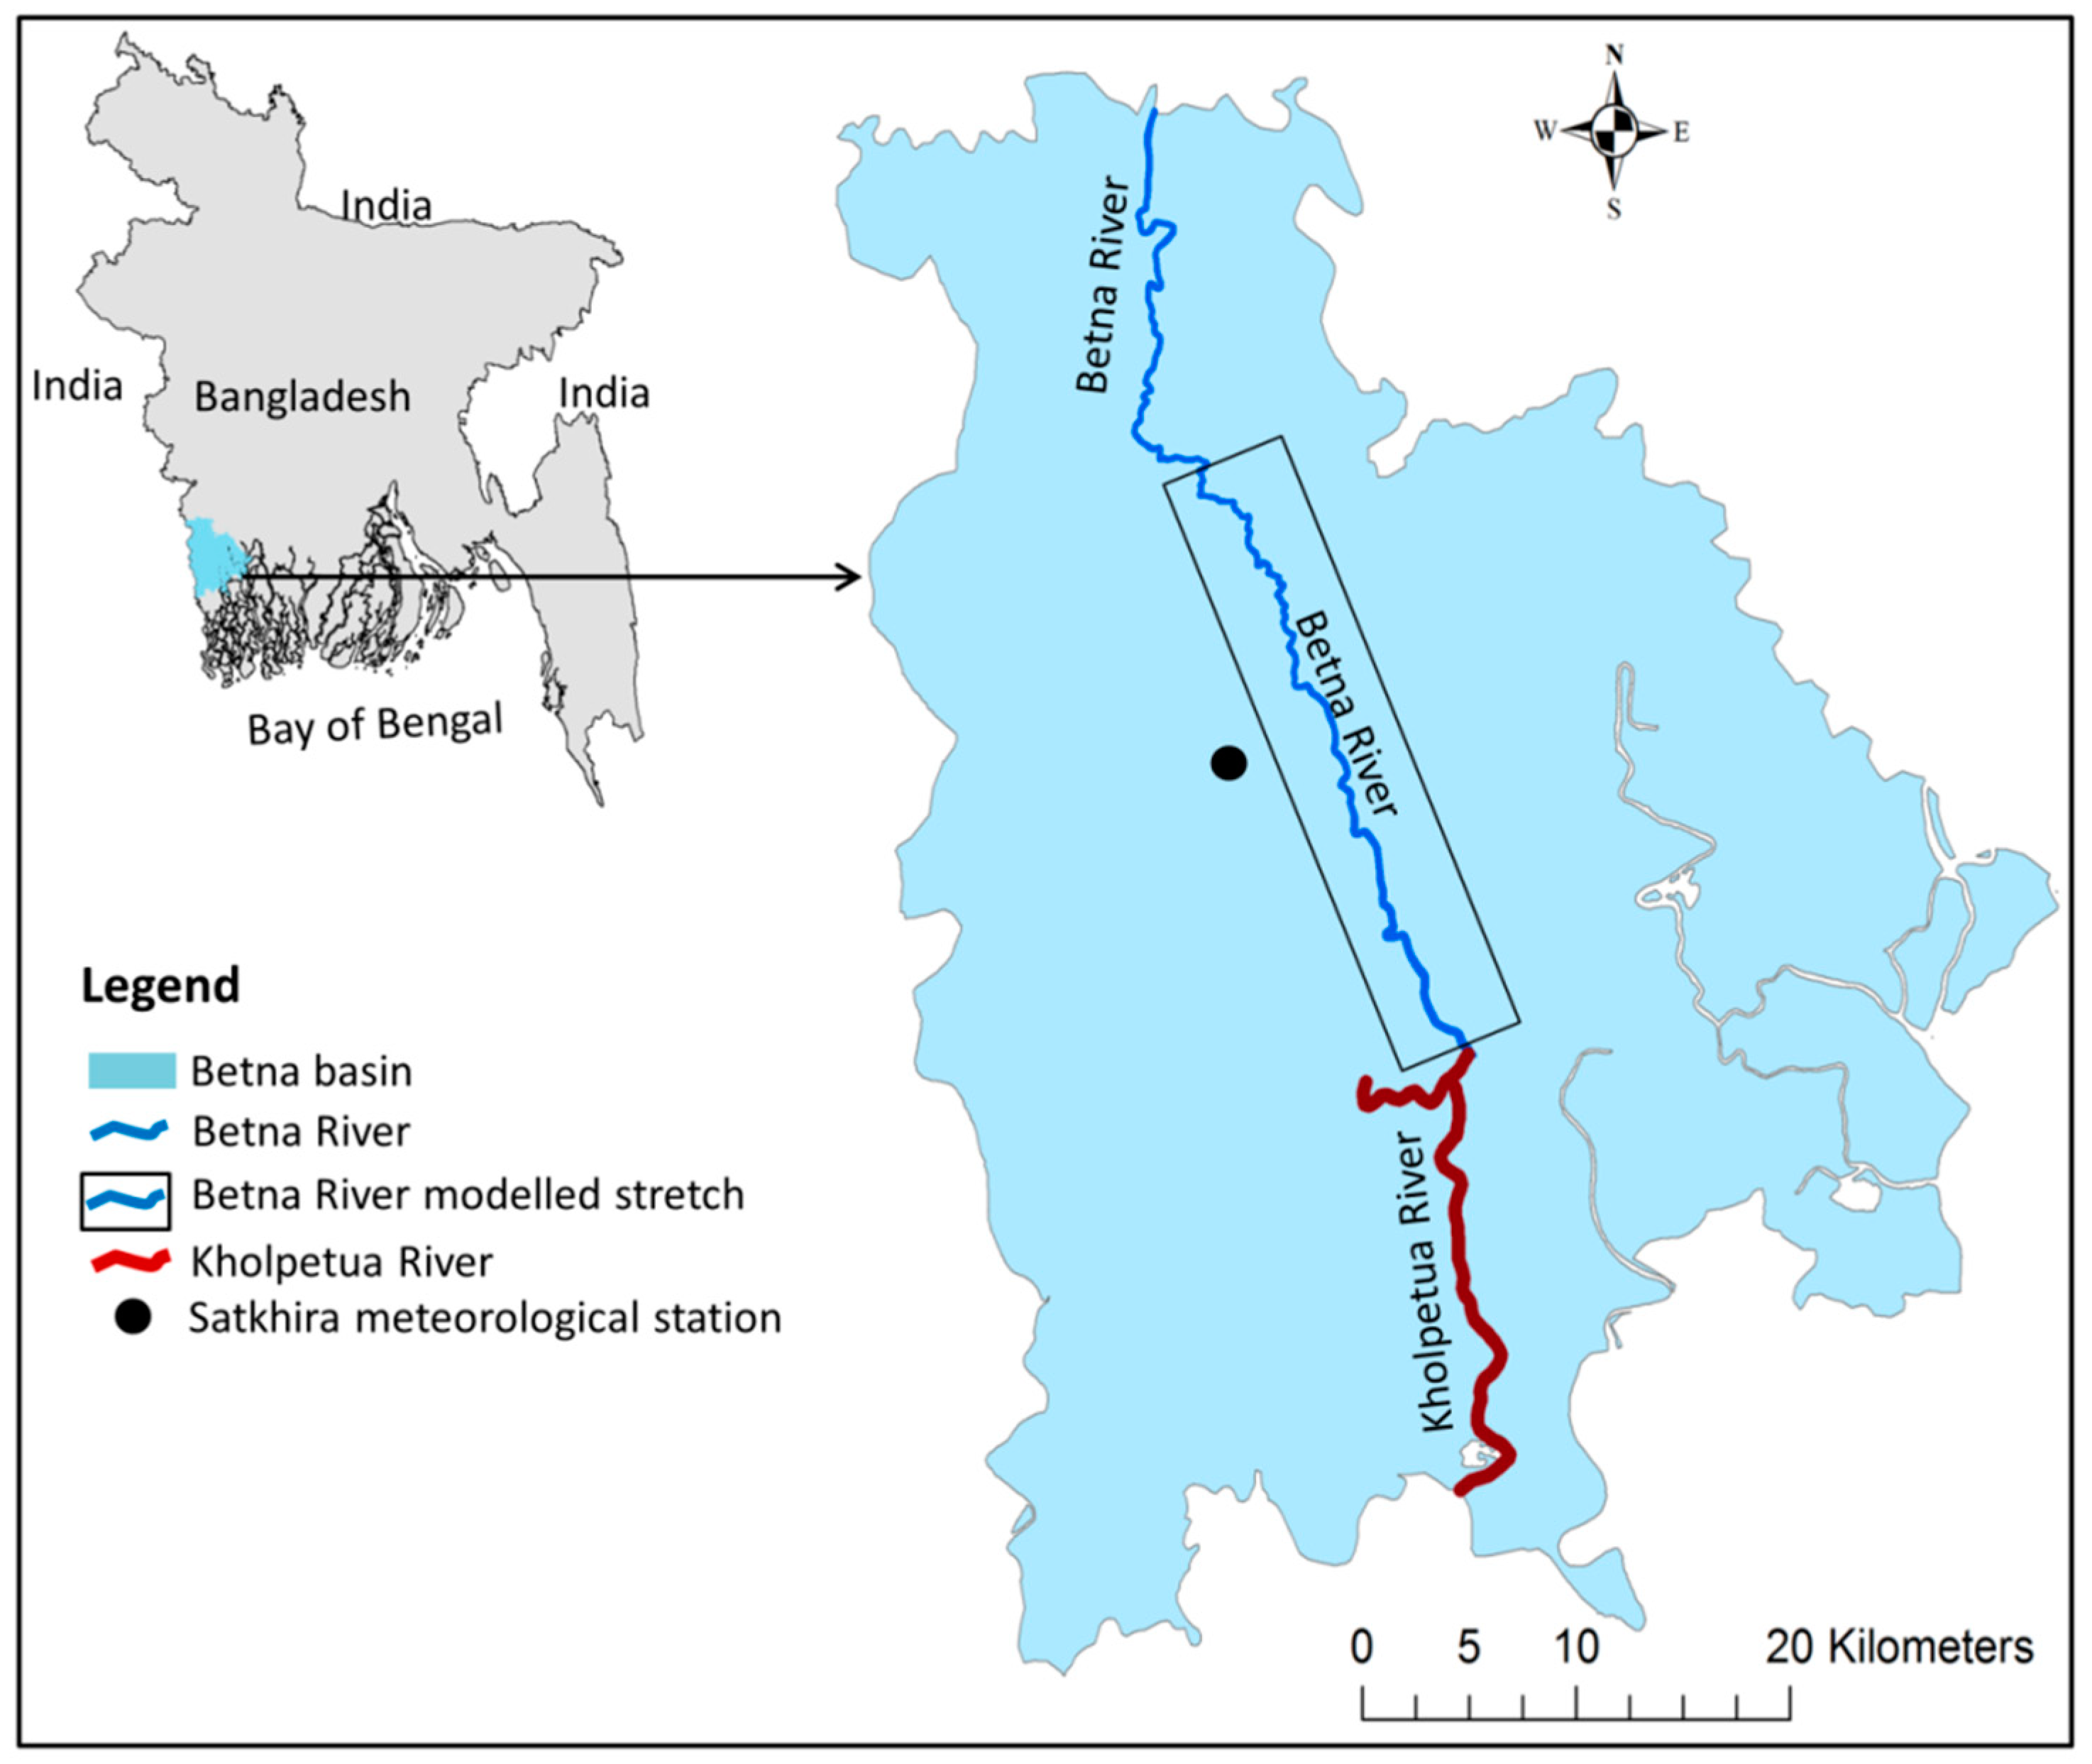
2.1. Study Area

The study area covers an area of 10,706 hectares in the Betna River basin, located in the Satkhira district of southwest Bangladesh. The river has a total length of about 192 km with an average width of 125 m. The study focused on approximately 30 km of the downstream part of the river (Figure 1); the upper part of the river was not included in the model, since it becomes almost dry during dry months. The river is hydrologically connected with the Bhairab River near the Jessore district in the north and the Kholpetua River near Assasuni of the Satkhira district in the south. The Betna River has tidal influence, which is the predominant factor for its sustainability, because during the dry season the fresh water inflow from upstream areas becomes very limited. The tide generates from the Bay of Bengal and propagates to the north until the upstream boundary of the study area. Like most coastal areas in Bangladesh, this study area is governed by the semidiurnal tide. The usual range of fluctuation of the water level is 0.7 m during neap tide and 3.0 m during spring tide [15].
The study area has a rainy season (monsoon) during June–September, followed by a cool and dry period during October–February and a hot season with frequent cyclones (pre-monsoon) during March–May. Mean annual rainfall in the area is about 1800 mm, of which approximately 70% occurs during the monsoon season [15]. This area is affected by inland flooding due to heavy incessant rainfall during the monsoon in August–September and by storm surge flooding during cyclone season in April–May [3,16]. Relative humidity of the area varies from about 70% in March to 90% in July. Mean annual air temperature is 26 °C with peaks of around 35 °C in May–June. Temperature in winter may fall to 10 °C in January [15]. Wind in the region shows two dominant patterns, i.e., south-westerly monsoon wind during June–September and north-easterly wind during November–February. Other months show no distinct wind direction pattern.
The study area is mainly a flat terrain with some low-lying depressions and many tidal channels and creeks that crisscross the area. The soils are mostly clay and loam. Land use is dominated by paddy cultivation and shrimp culture. About 8% of the total area is homesteads and settlements, about 10% is water bodies, 61% is agriculture and the remainder is wetlands used for aquaculture or integrated paddy shrimp culture [3,17].

2.2. Hydrodynamic Model Set Up

The two dimensional (2D) hydrodynamic model MIKE 21 FM [18] was applied to simulate future water level and discharge in the Betna River. This model was selected because it can simulate the hydrodynamic situation in a tidal river and generate outputs of high temporal and spatial resolution. The 2D model was used because the river is not very deep (maximum depth 9 m), and vertical mixing happens fast. The model simulates unsteady 2D flows in one vertically homogenous (depth averaged) layer and assumes that large flow gradients are absent in the vertical direction of the water column [1].
The hydrodynamic (HD) module of MIKE 21 FM simulates variations of water level and flows in response to several forcing functions on a rectangular or triangular grid of the study area when provided with the bathymetry, bed resistance coefficients, forcings and boundary conditions [19]. The model is based on a 2D numerical solution of Reynolds averaged Navier–Stokes equations. In the model, the Boussinesq simplifying approximation is used, and hydrostatic pressure is assumed [18]. The 2D model consists of vertically integrated momentum equations, continuity equation, advection-diffusion equations for temperature and salinity, and equation of state. The water density depends on temperature and salinity only [18]. The input and validation data required for the modelling process are river bathymetry, hydrodynamic and meteorological data. The detailed description of the model and the governing equations are presented in Danish Hydraulic Institute (DHI) [18] and Uddin et al. [19].

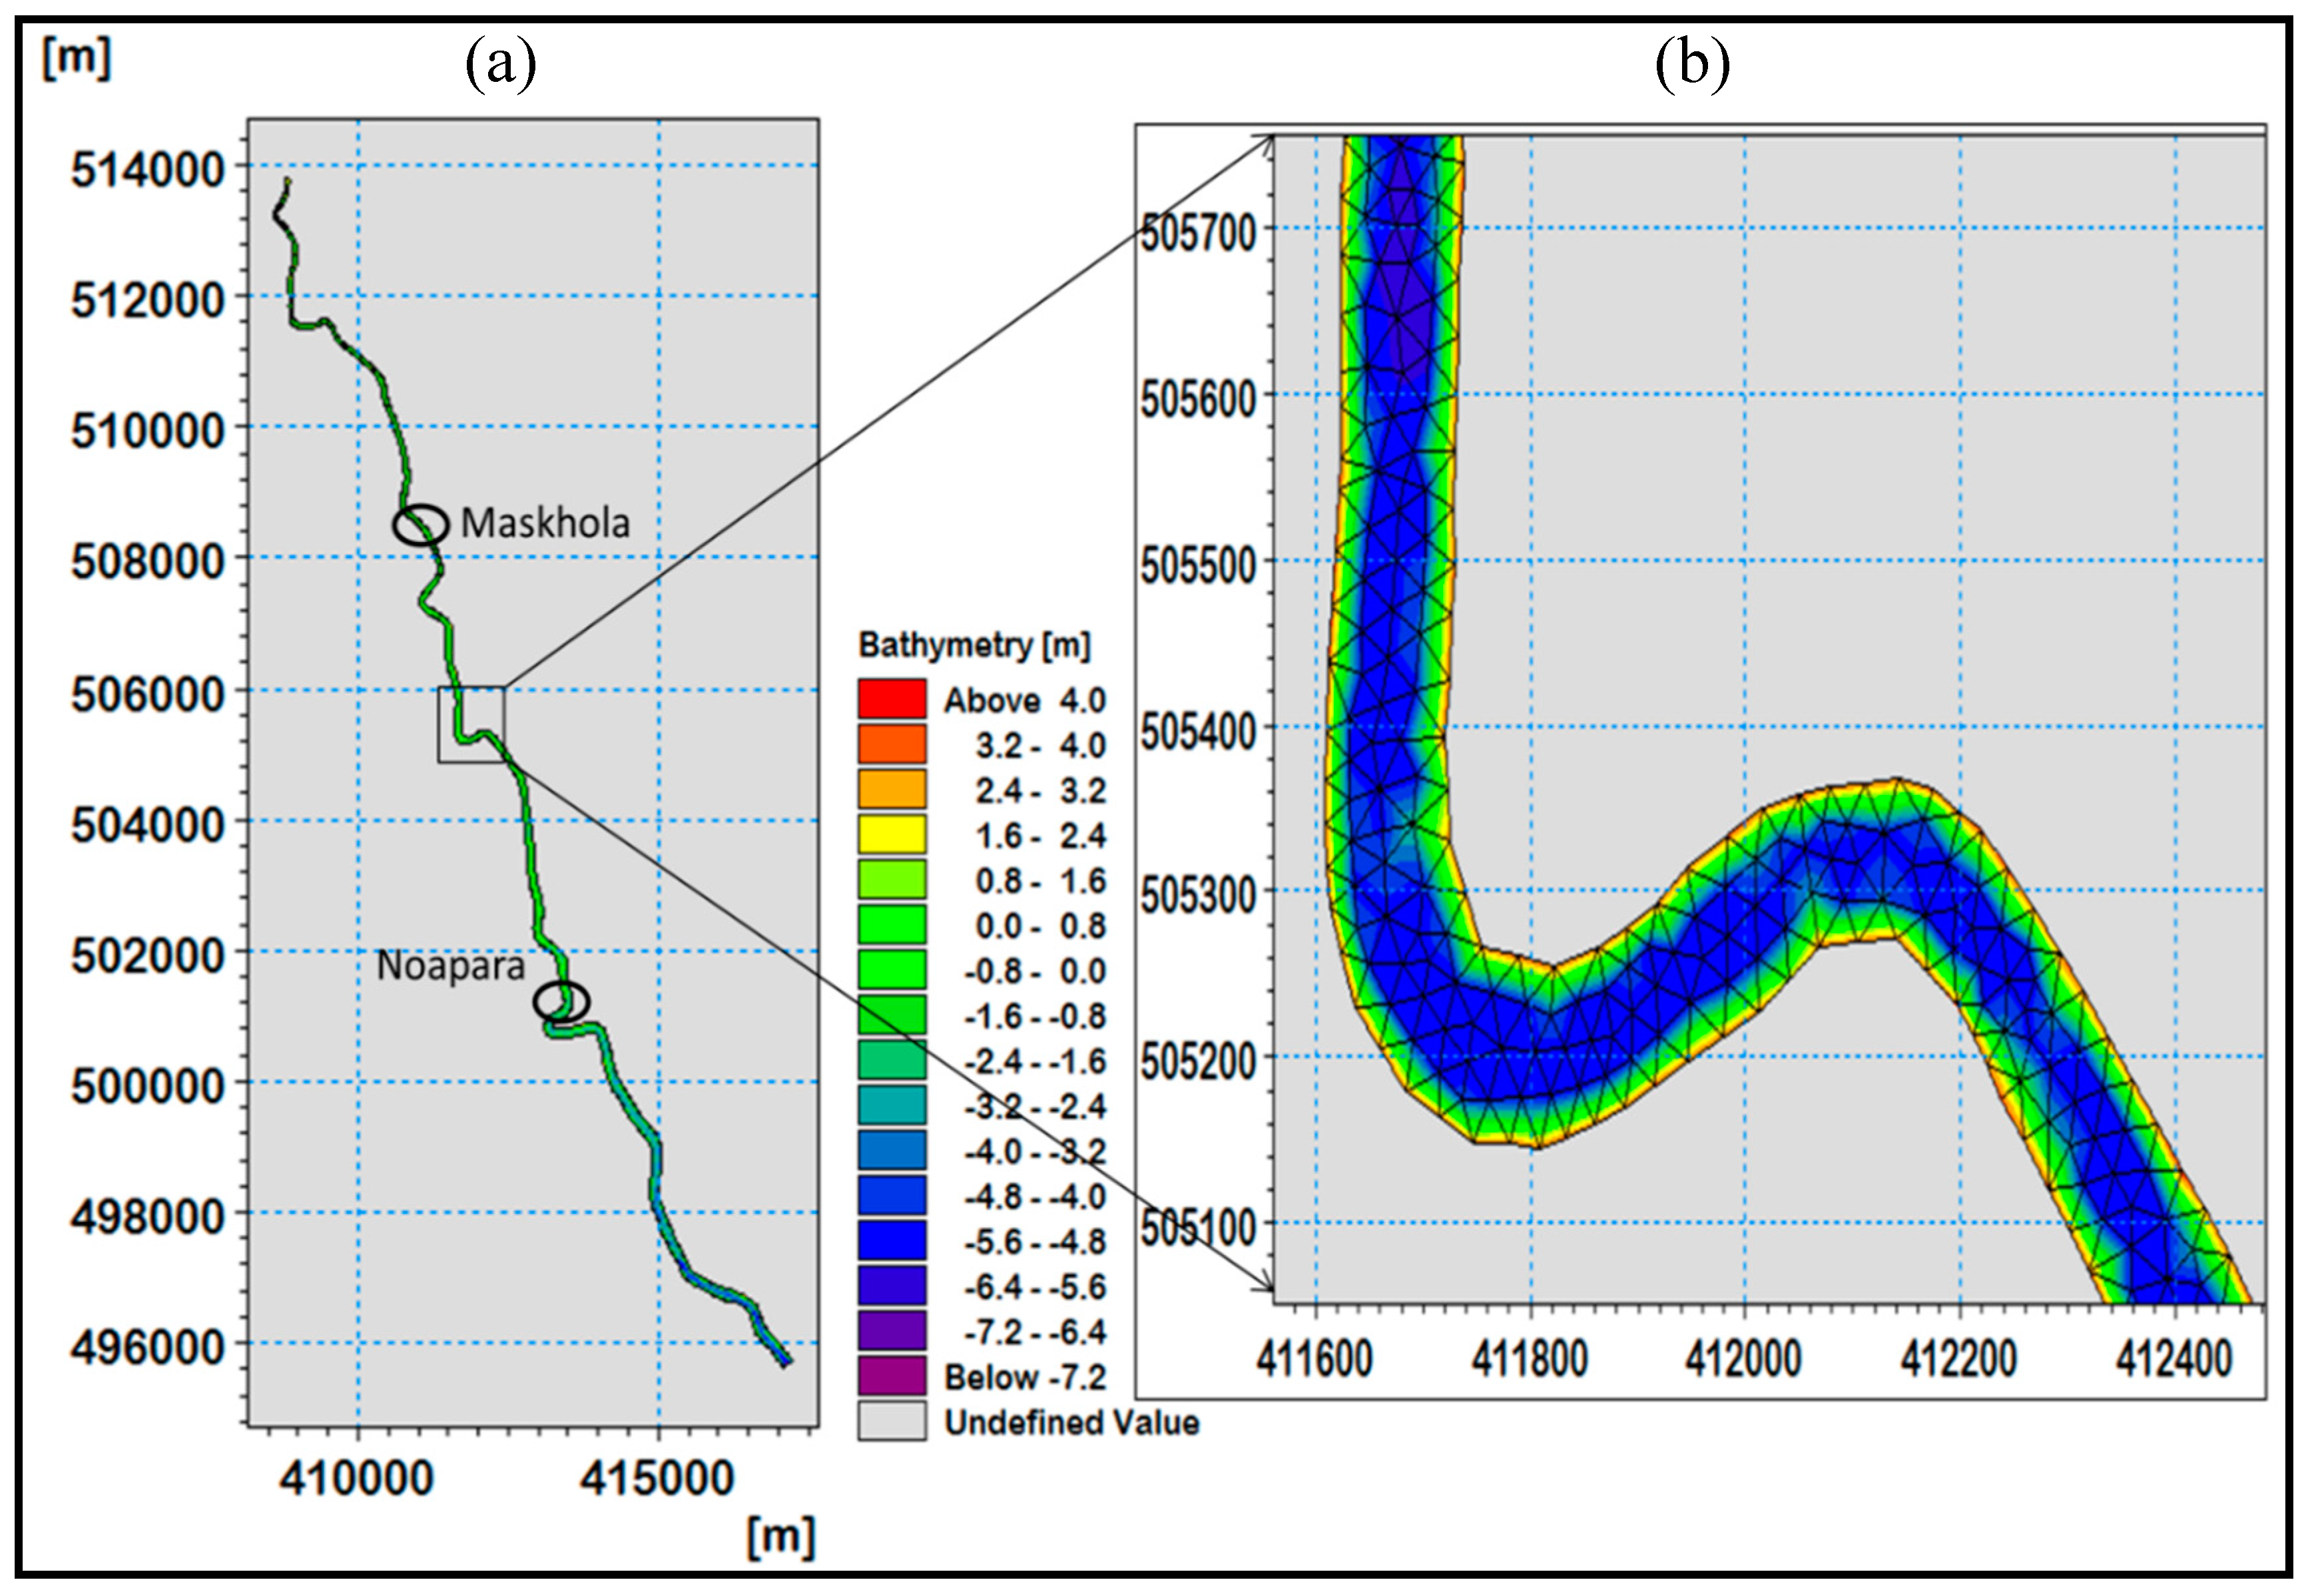
2.3. Bathymetric Survey and Mesh Generation

Modelling Bangladeshi river basins, including the Betna River, is difficult due to the scarcity of data. However, a comprehensive data collection survey was carried out in the Betna River system by the Institute of Water Modelling (IWM), Bangladesh, in 2012 to collect primary data, such as river bathymetry, water level and discharge. The distance between the surveyed river cross-sections varied from 400 to 500 m. The depth data were referred to meter Public Works Datum (mPWD) of Bangladesh (which is 0.46 m below mean sea level) using water level observed at the gauges within the survey area [15].
Mesh generation was done using the MIKE Zero mesh generator (Figure 2). A flexible mesh size with triangular elements was used, and the triangulation was performed with delaunay triangulation [18]. The mesh size was decreased and resolution increased where the river is narrow. The mesh consists of 4089 nodes and 6628 elements. The smallest element area is 42.5 m2 and the largest area is approximately 498 m2. In the modelling domain, intertidal zones were flooded and dried during every tidal phase to mimic natural conditions. The river is connected with some small drains, which have no water flow during dry weather and were thus considered as the land boundary in the model. However, during wet weather, stormwater runoff through the drains were included as a source in the model: four main drains were considered in the model. The runoff volume was estimated applying the runoff curve number method developed by the US Department of Agriculture [20].

2.4. Meteorological and Hydrodynamic Data

Precipitation, wind speed and direction, air temperature (maximum and minimum) and relative humidity data were collected from the Satkhira meterological station (Figure 1, Table 1). To calibrate the hydrodynamic model, water level and river discharge data were collected from IWM (Table 1). Water level data were collected with 0.5 h interval at three locations (Maskhola, Noapara and the downstream boundary, (Figure 2) along the Betna River from 1 August to 10 October 2012. The observed minimum and maximum water levels at Maskhola and Noapara in the Betna River were 1.55 and 3.48 mPWD, and −2.10 and 3.50 mPWD, respectively. Discharge measurements were carried out near Noapara (Figure 2) and the upper boundary by IWM in September 2012 for 13 h with 0.5 h interval both in spring and neap tide. The observed maximum discharge at Noapara during spring tide was 277 and 392 m3/s at the time of ebbing and flooding, respectively. For the baseline simulation, water level and discharge data were gathered from the Bangladesh Water Development Board (BWDB) for the period 2014–2015 (Table 1).
The boundary conditions were described using time-series for discharge and water level at the upstream and downstream boundaries, respectively. The initial conditions were specified using the measured data for water level, and initial water velocity was set to zero. The flooding depth 0.05 m, drying depth 0.005 m and wetting depth 0.1 m were set in the model. In the model, a constant horizontal eddy viscosity (0.28 m2/s), a constant clearness coefficient (70%), and default parameterisation (Table 2) for heat exchange were used. The model by default calculates evapotranspiration using air and water temperature data.

2.5. Calibration, Validation and Sensitivity Analysis

The model was calibrated by adjusting the parameter values (Table 2) to obtain output results that match measured data. After calibration the modeled and measured values of water level and discharge were compared at Maskhola and Noapara. The calibration period from 26 August to 15 September 2012 was selected because the bathimetric survey and measurements of hydrodynamics were conducted in that period. The calibration period covers the important monsoon period, when floods occur, and hydrodynamic variability is higher. A sensitivity analysis was also performed to estimate the rate of change in model output with respect to change in model inputs. The sensitivity analysis was performed by changing the following model inputs and parameters: water level and discharge at the model boundaries, water velocity, river bed roughness, wind speed, eddy viscosity, clearness coefficient, and heat exchange rate. The calibrated model was then applied to simulate water level and discharge for a typical year October 2014 to September 2015 to represent the baseline conditions.
The model output for the baseline year was validated using the measured water level. The model performance was assessed using two statistical parameters: coefficient of determination (R2) and the Nash-Sutcliffe efficiency (NSE). Generally, model performances are called satisfactory if R2 > 0.60 and NSE > 0.50; the closer the model efficiency is to 1, the more accurate the model is [21]. After validation, the model was applied to predict future water level and discharge under climate change situation.

2.6. Future Scenario Development

There are many General Circulation Models (GCMs) that describe past, present and future changes in climate on a global scale. With the help of GCMs, variations in surface air temperature, precipitation and sea level were computed; and the output from individual GCMs and averages of future climate conditions can be applied in climate change impact analysis [22]. In the current study, outputs from GCMs used in the fifth phase of the Climate Model Intercomparison Project (CMIP5) were used. CMIP5 was utilised by the IPCC in AR5 [23]. In IPCC AR5, four Representative Concentration Pathways (RCPs) were used for climate change projections [6]. In the current study, a relatively low emission pathway (RCP 4.5) and a high emission pathway (RCP 8.5) were used. Two GCMs, MPI-ESM-LR (Max Planck Institute for Meteorology) and IPSL-CM5A-LR (Institute Pierre-Simon Laplace), were used. These models were selected, since they have been used widely in this region and best represent precipitation and surface air temperature for this study area [8].
At first, the CMIP5 daily climatic data for both GCMs and RCPswere downloaded from the Earth System Grid Federation Portal (http://cmip-pcmdi.llnl.gov/cmip5/; https://esgf-data.dkrz.de/search/cmip5/). Then, the daily GCM data were downscaled and bias corrected using the “Delta method” with “quantile-quantile” correction, as described by Liu, Hofstra [24]. This is a relative change method, which is widely used in bias correction and downscaling GCM data with different grid size. The GCM’s gridded data have less variability and less local characteristics than the point input required for the model. Taking into account local variability is important for climate change impact studies, specifically in the case of a small river basin. This requires a downscaling method that generates point data from gridded data. The delta change method can efficiently produce point data [24]. The method includes quantile-quantile correction to ensure that extreme events become more extreme in the future climate data. In this study, daily observed air temperature and precipitation data from 1986 to 2005 were used as a basis for this downscaling. Two future time periods, 2031–2050 (2040s) and 2081–2100 (2090s), were considered for the two RCPs.
To project future precipitation, a 20-year average total monthly precipitation was computed for the observed and future downscaled data. Then, the percentage change between future and observed data was calculated for each month. The daily observed precipitation data for the baseline year 2014–2015 were modified by this percentage change and subsequently used as model input for the simulation of future hydrodynamic conditions. Fresh water inflow from upstream Gorai River basin areas were on average projected to increase during the monsoon period (driven primarily by increased basin precipitation) by 9% [25] and decrease during dry periods by 6% [4] by the 2050s. Similar change was assumed for the 2090s. These changes in discharge values along with the precipitation percentage changes were used to modify the observed current discharge data. The resulting discharge data were used to define the upstream boundary conditions in simulations for future prediction. The future stormwater runoff was estimated by the curve number method [20] using future precipitation data. For air temperature, daily average values were used.
SLR combined with the RCP scenarios was used to investigate the impact of climate change on the hydrodynamic characteristics of the Betna River. For RCP 4.5, the estimated global mean SLR is 0.24 and 0.4 m for the time horizons 2040s and 2090s respectively, relative to the average sea level for 1986–2005. For RCP 8.5, the estimated global mean SLR is 0.3 and 0.63 m for the time horizons 2040s and 2090s respectively [26]. Recent projections from the IPCC AR5 suggest that sea level in the northern Bay of Bengal (close to the study area) may rise between 0.1 and 0.3 m by 2050 and between 0.3 and 0.6 m by 2100, relative to the baseline period 1991–2010, without including local effects, such as land subsidence [27]. Based on these studies, the annual SLR for the study area was estimated. This estimated SLR and the annual land subsidence of 2.5 mm [27,28] together lead to the estimated relative mean SLR of 0.26 and 0.42 m for RCP 4.5, and of 0.44 and 0.76 m for RCP 8.5 for the 2040s and 2090s, respectively. These SLR values were added to the observed water level data to define the downstream boundary conditions in simulations for future prediction. Finally, the model was applied to simulate future (for the 2040s and 2090s) water level and discharge, and the results were compared with the modelling results for the baseline year (2014–2015) (Table 3).

3. Results

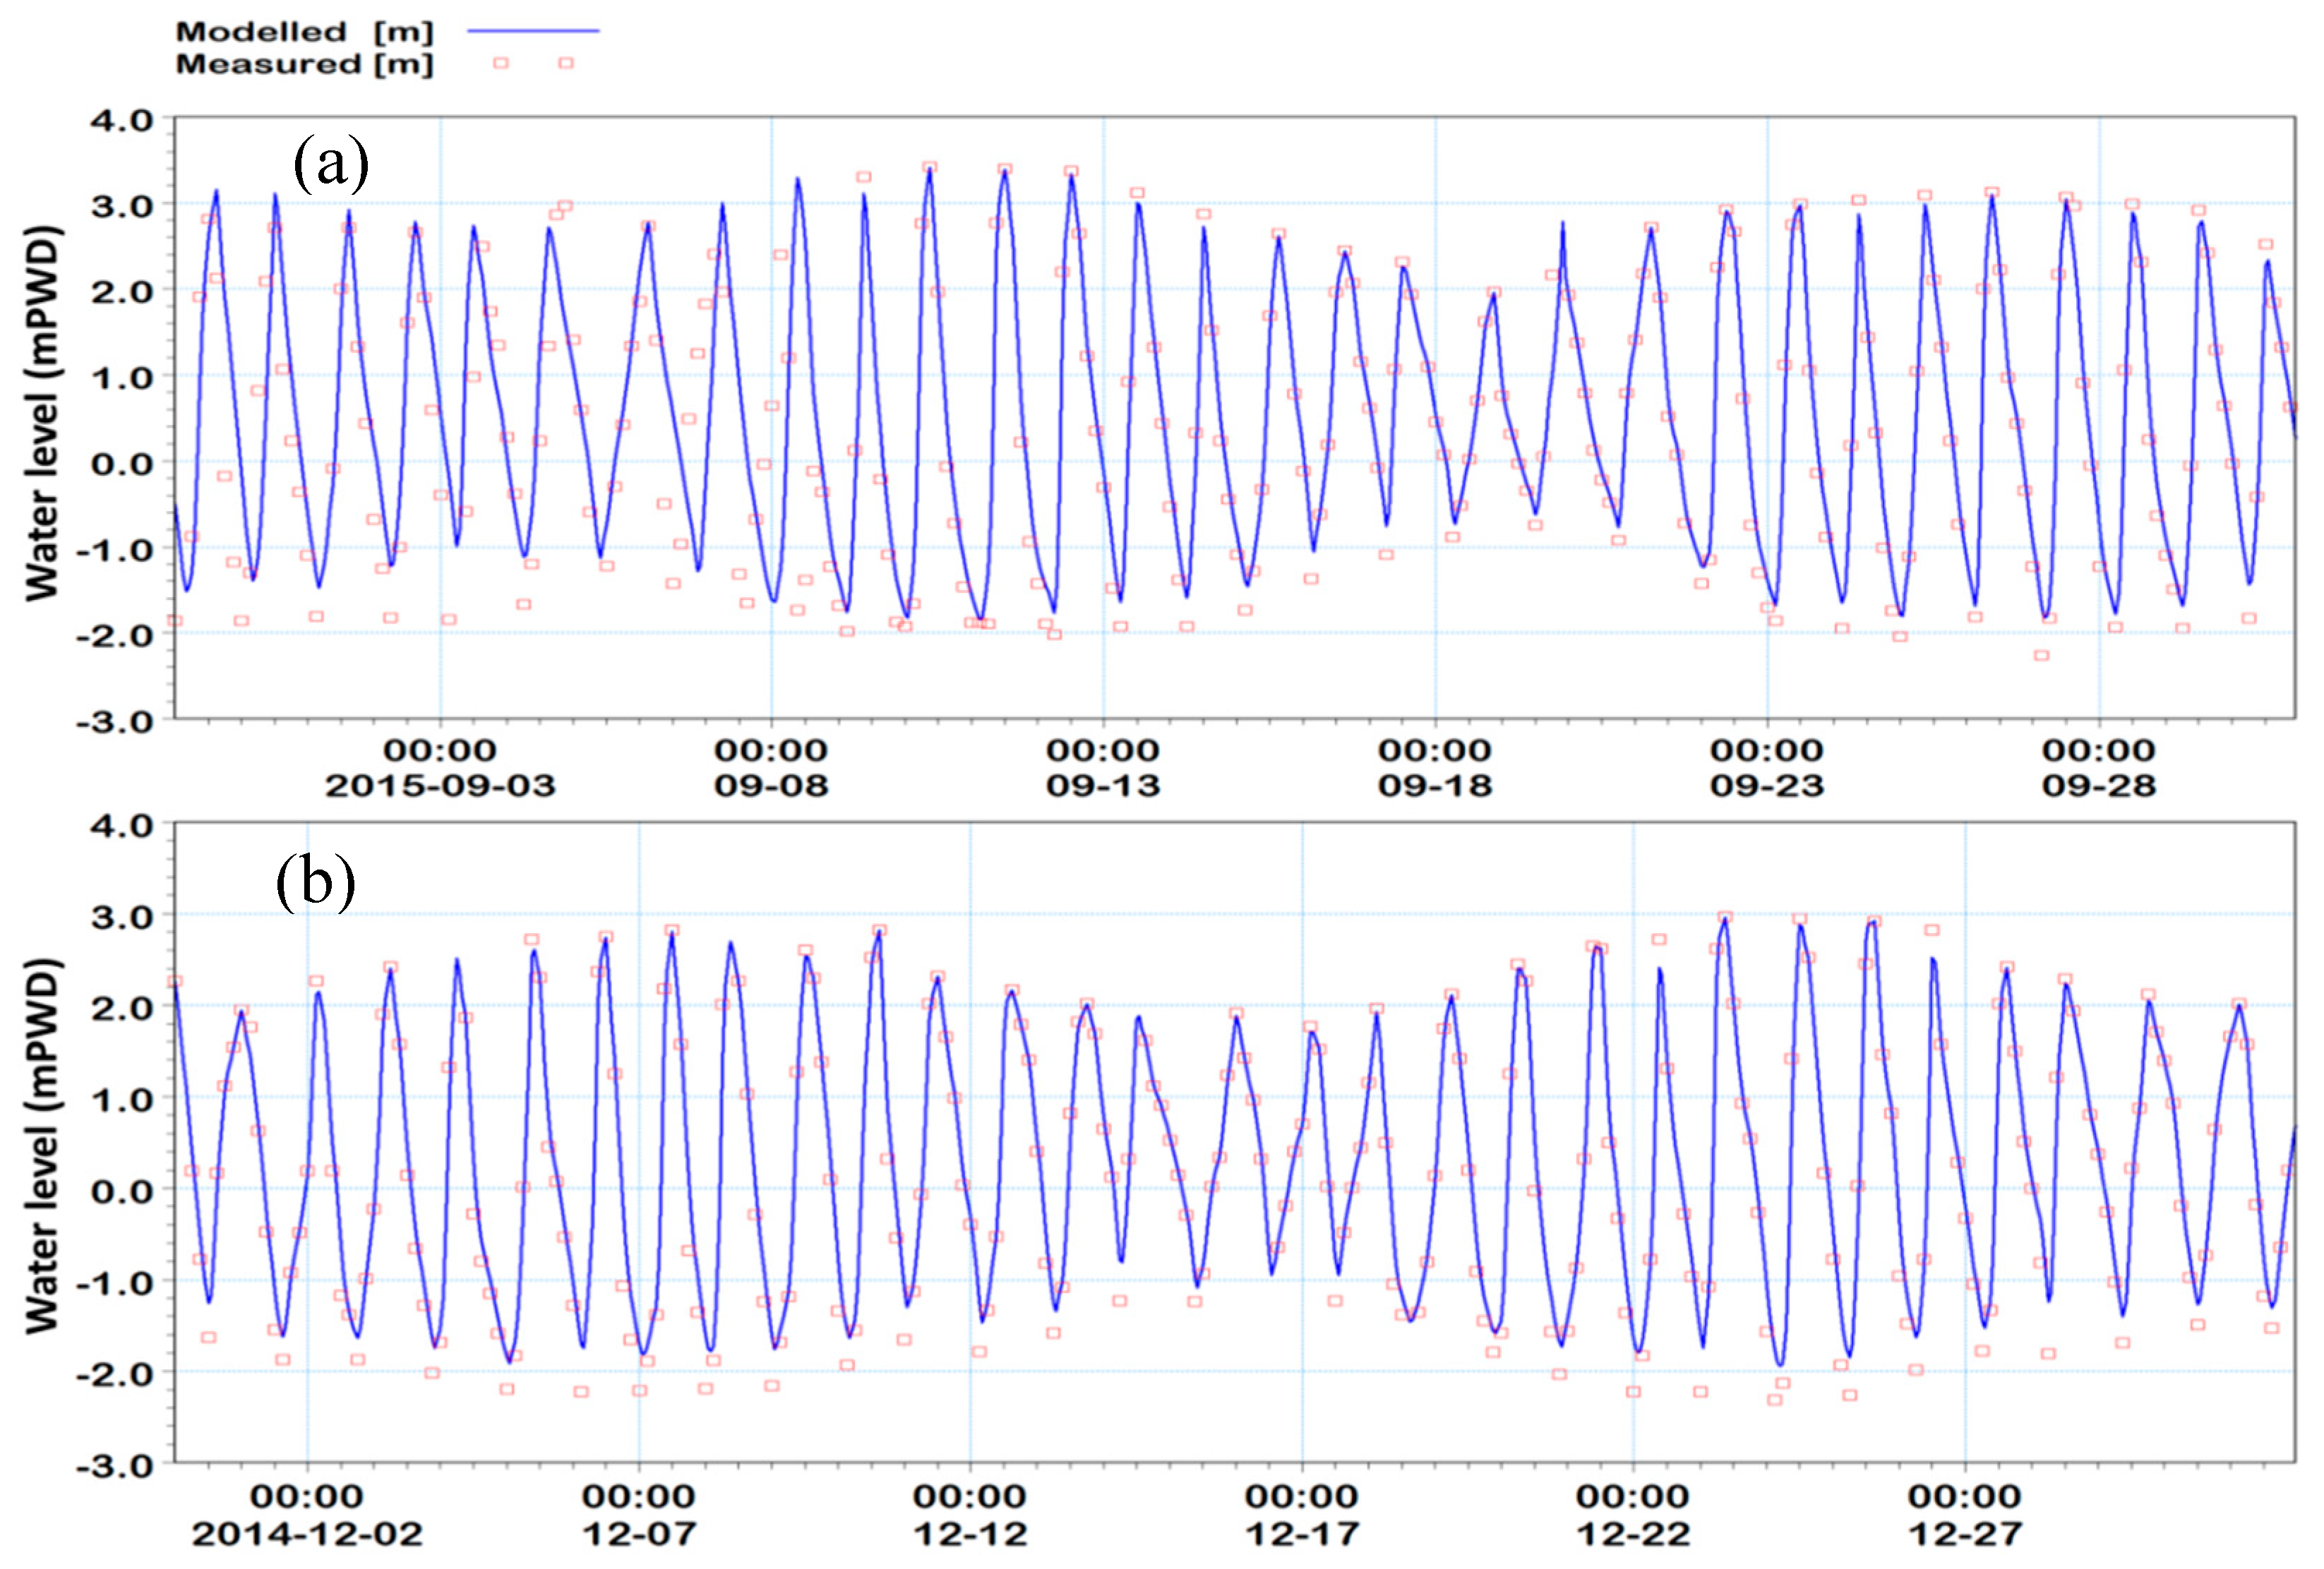
3.1. Model Calibration, Validation and Sensitivity Analysis

Through calibration, a very good agreement with the measured data for both water level and discharge was achieved (Figure 3), with R2 0.92 and 0.83, and NSE 0.81 and 0.66, respectively. Bed roughness (i.e., Manning’s number) is a calibration parameter which has the largest impact on water level; after calibration, a constant Manning’s number of 60 m1/3/s was used. The agreement between the modelled and measured water level for the baseline year (validation) was very good (R2 = 0.89, NSE = 0.76); the comparison for the discharge was not possible due to the lack of measured data. The model calibration and validation showed that the timing of the peaks was captured well, but the model slightly overestimated water level at low tides and underestimated discharge at high tides (Figure 3 and Figure 4).
The sensitivity analysis showed that the model output was mostly influenced by the water level and discharge at the model boundaries. The increase in water level at the downstream boundary due to SLR greatly influenced the model output. The model output was also sensitive to wind, which influenced the water level. The average wind speed of 3 m/s had no strong influence on the water level, while the wind speed of 15 m/s (the strongest observed) caused decreased water level in the upstream parts of the river.

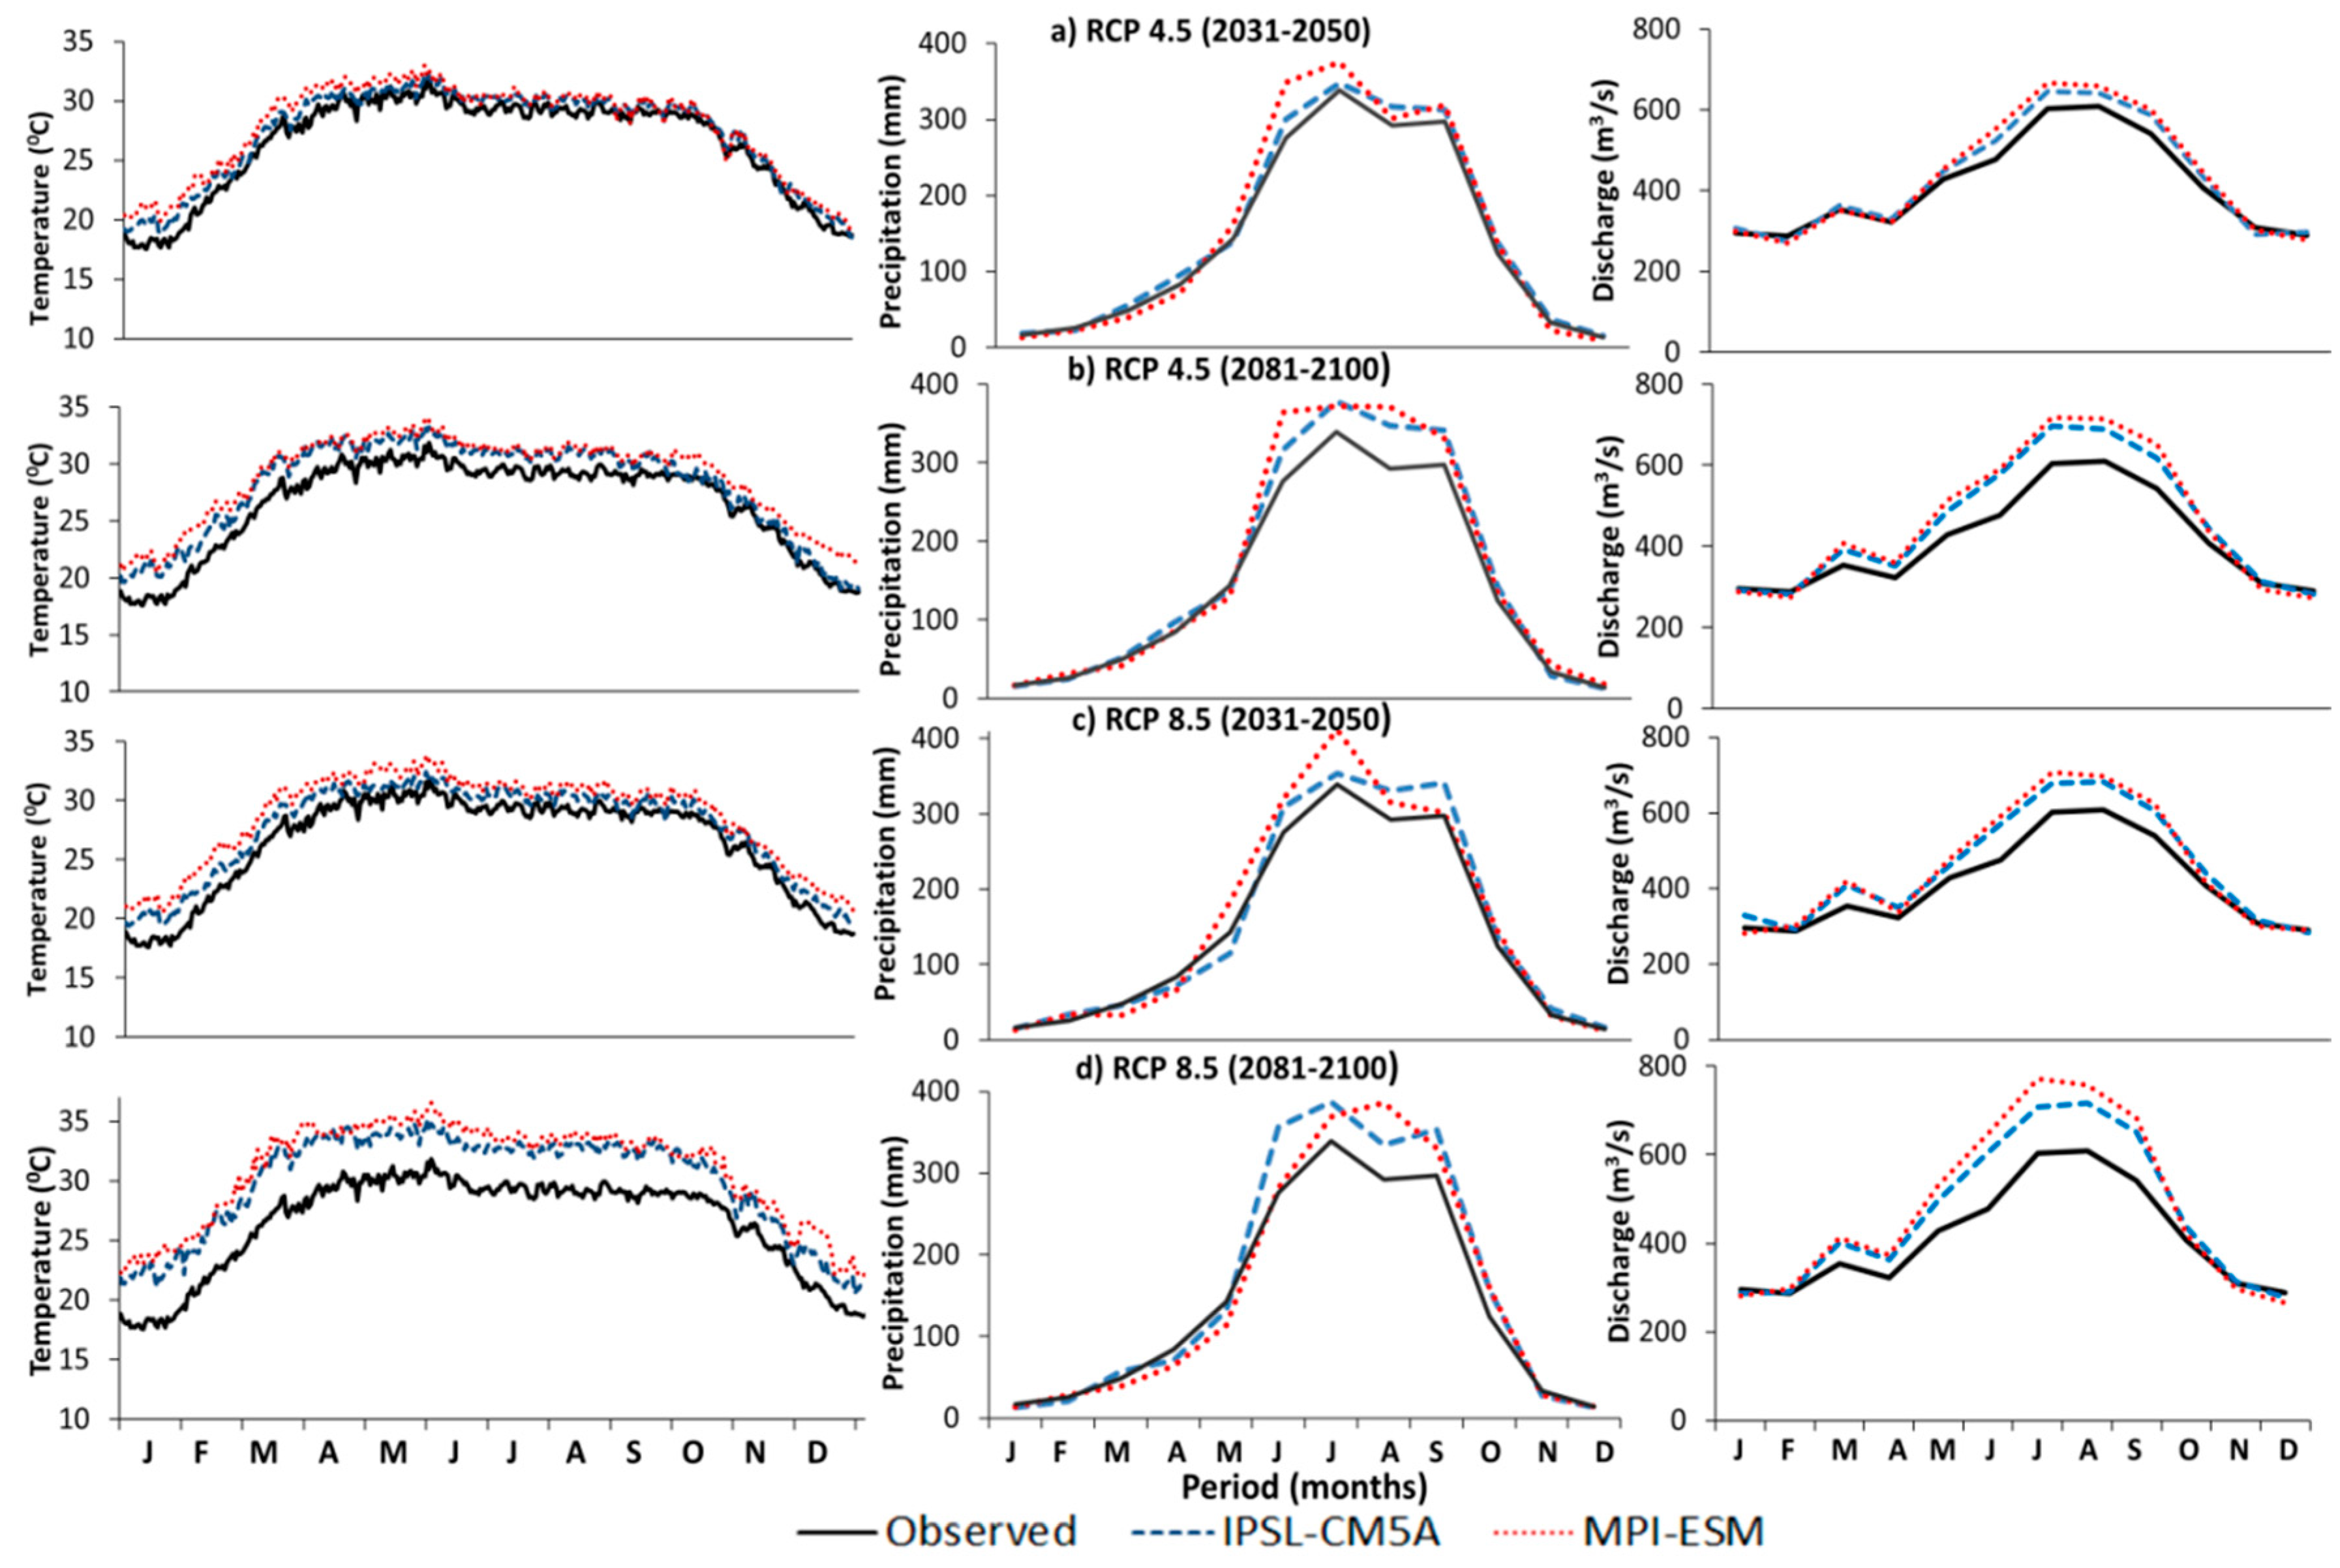
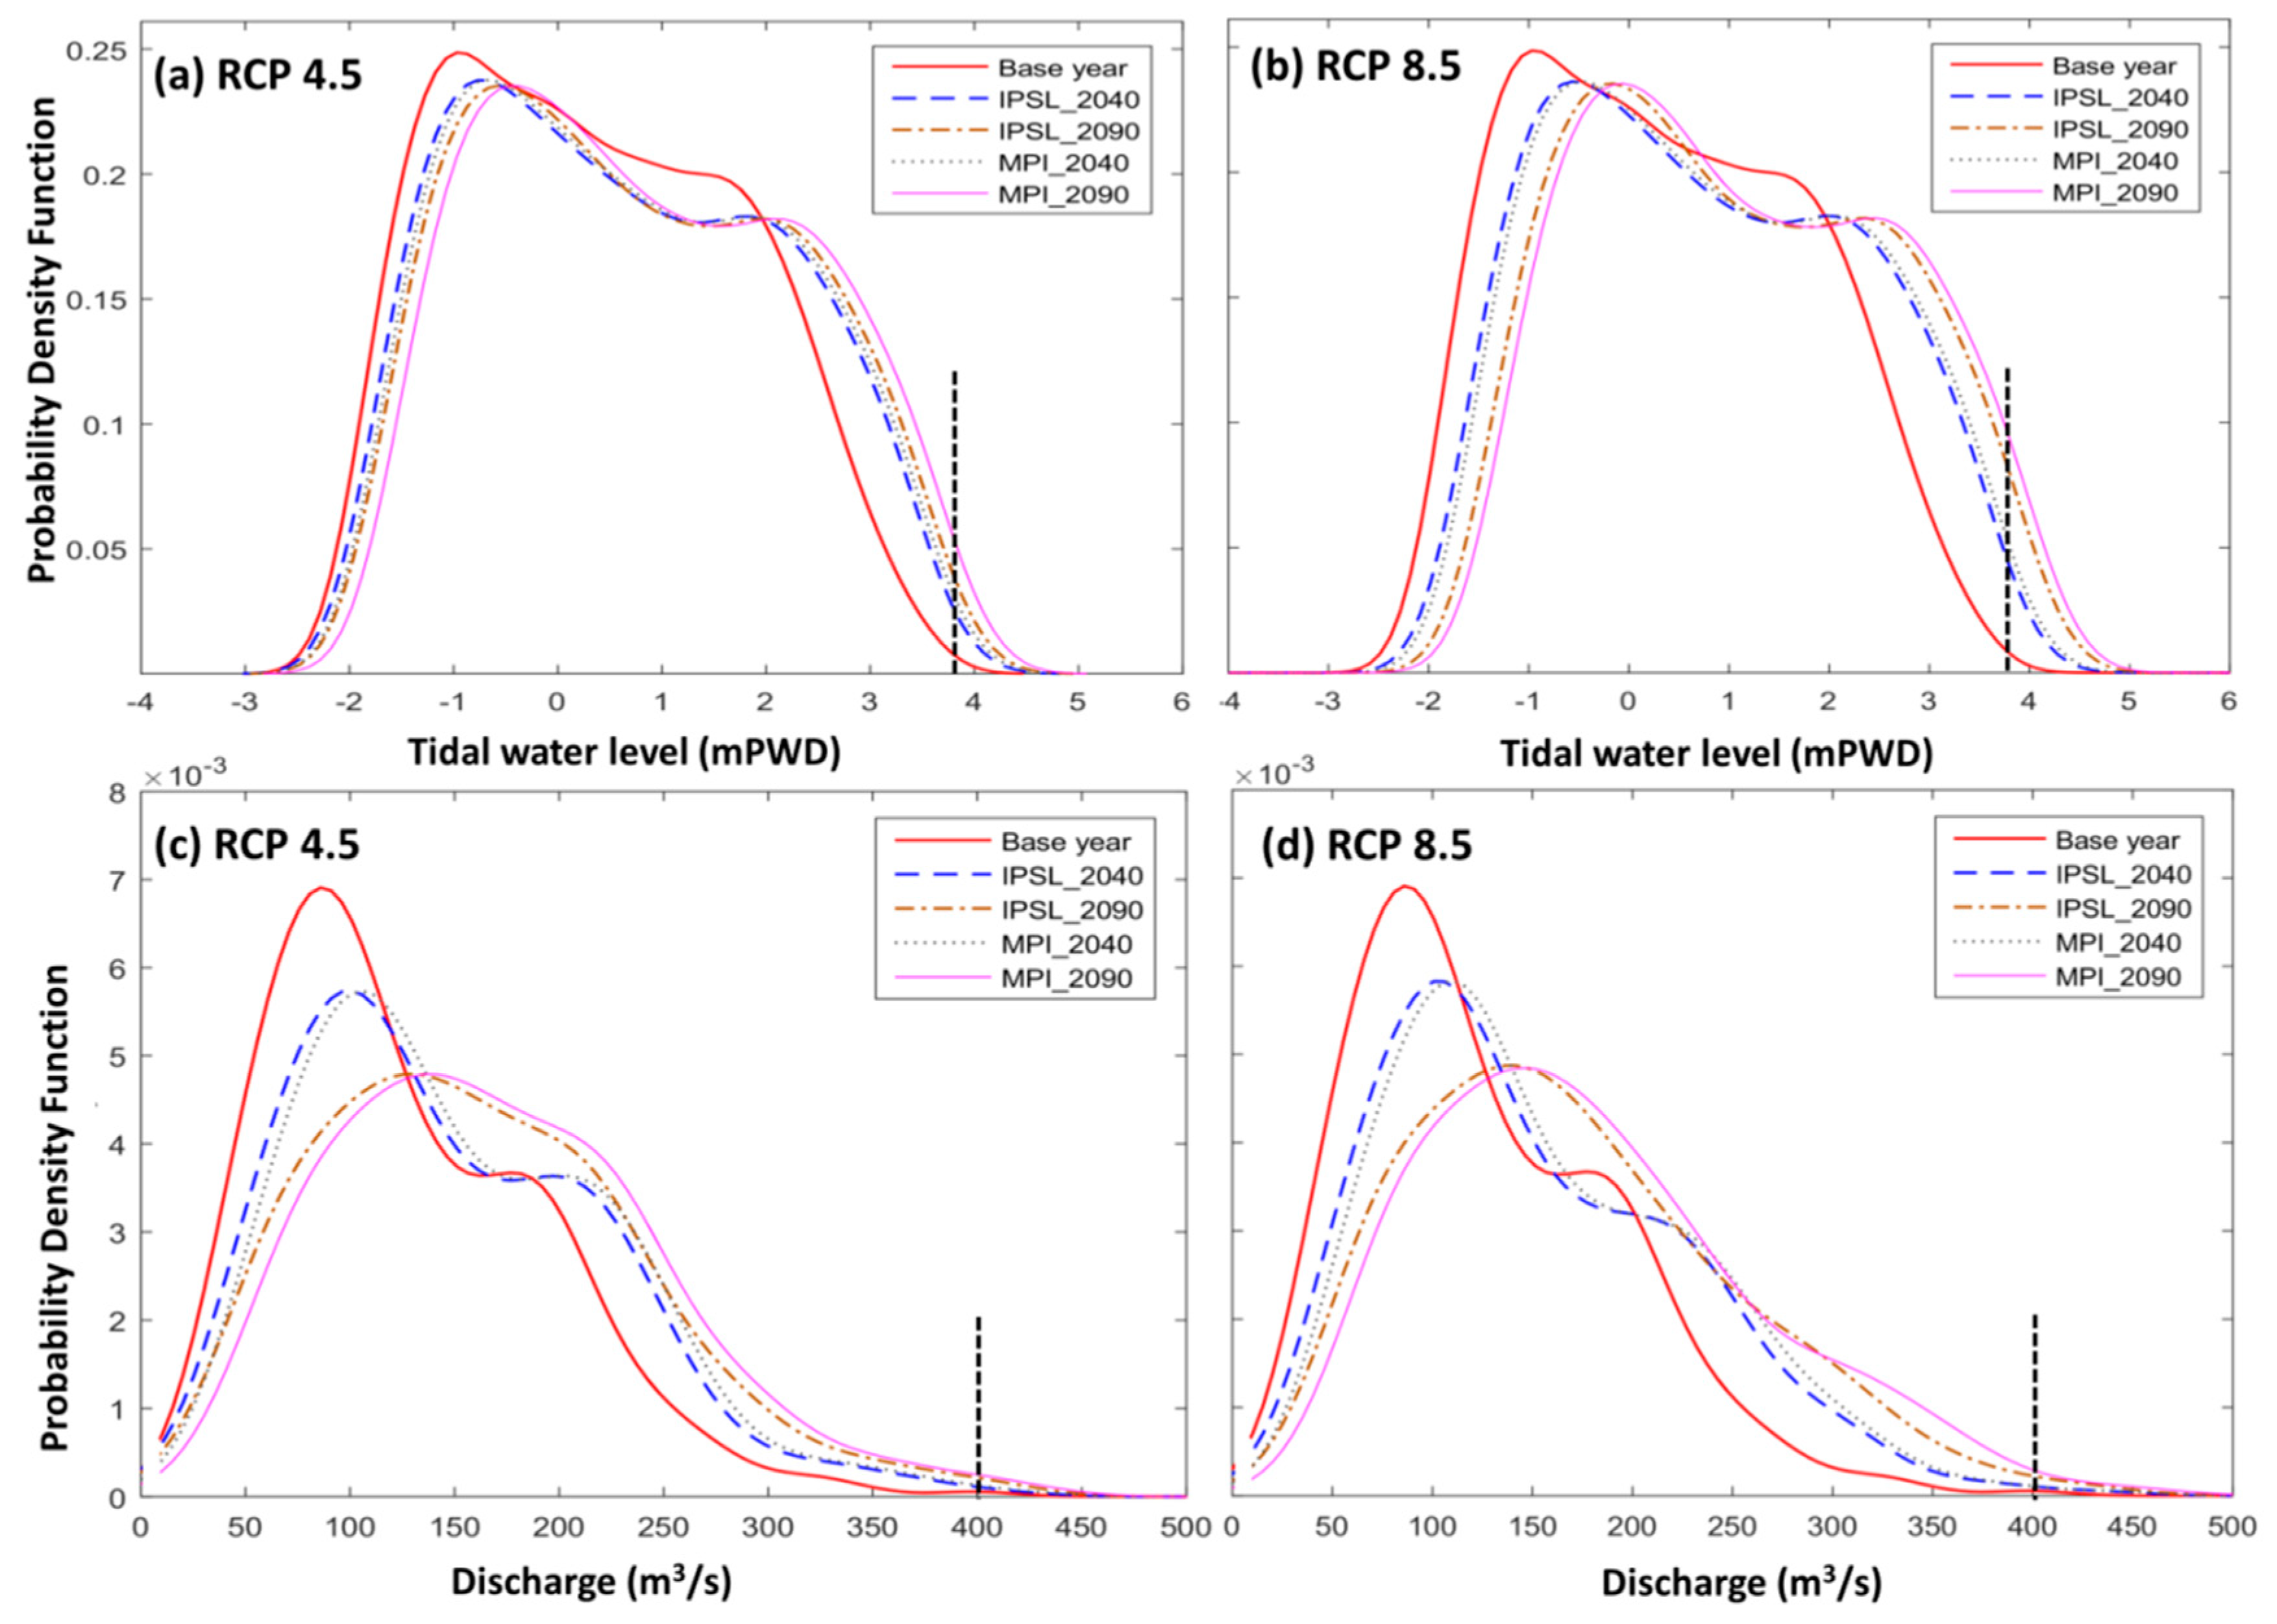
3.2. Future Projections

Future air temperature, precipitation and discharge projections show substantial variation between the two scenarios (RCP 4.5 and RCP 8.5) and two GCMs (Figure 5). Average air temperatures are expected to increase by 2 °C to 4 °C by the 2040s and 2090s respectively, compared to the observed baseline condition; the temperatures were consistently increased throughout the year, with greater increases by the 2090s compared to the 2040s. Precipitation is projected to increase during the monsoon season (June–September) by 3–28% and 5–32% by the 2040s and 2090s, respectively. Monthly average discharge shows increases in the near and far future compared to the observed discharge for both GCMs and both scenarios (Figure 5); the discharge is expected to increase in the monsoon periods and slightly decrease in dry periods (November–February).
The seasonal changes (percentage) in the mean water level and daily maximum discharge for the two GCMs and different scenarios are presented in Table 3. The mean change in water level at Noapara relative to the baseline year would be about 11% for the RCP 4.5 scenario and near future (2040s) and 23% for the RCP 8.5 scenario and far future (2090s), with increases being slightly larger in the monsoon than in the dry season. For the future discharge, the largest increase is expected in the monsoon period (June–September), with the data for the dry season showing no noticeable changes. The increase in the daily maximum discharge during the monsoon compared to the baseline year would be up to 8 and 16% in the near and far future respectively for RCP 4.5, and up to 21% by the end of century for RCP 8.5 (Table 3). The mean seasonal water level and discharge values for the two GCMs were not very different during the flood and ebb tide periods. The MPI-ESM GCM showed slightly higher water level and more extreme discharge in the Betna River compared to the IPSL-CM5A GCM.
The impact of climate change and SLR was also assessed by comparing probability density functions (PDFs) developed for the baseline year and for the future conditions. Fitting the data to PDFs allowed identification of the trends and tendencies in changes of the river water level and discharge caused by climate change. Modelling results regarding hourly water level and daily maximum discharge for all studied scenarios were fitted to a non-parametric probability distribution (Figure 6). Compared to the baseline year, the frequencies of high water level and daily maximum discharge are expected to increase in the future. The comparison of the RCP 4.5 scenarios with the baseline year showed a little increase in water level and daily maximum discharge in the near future (2040s), while in the far future (2090s), comparatively higher water level and daily maximum discharge can be expected. The comparison of the RCP 8.5 scenarios with the baseline year showed that a comparatively higher (than the RCP 4.5) water level and discharge would be expected for both the near and far future. Larger change was projected for the results from the MPI-ESM model compared to the IPSL-CM5A model.
To understand the individual impacts of SLR and the increase in upstream discharge on the water level in the Betna River, the model was run with and without SLR and the increase in upstream discharge during the monsoon. With the increase in upstream discharge, but without SLR, the future water level was found to be almost the same as in the baseline period (water level increased overall by around 1%). On the other hand, with SLR but without the increase in upstream discharge, the future water level was found to increase by 10–15% in the 2040s and 14–21% in the 2090s. Thus, for this tidal river, SLR had a stronger impact on the water level compared to the impact of the increase in upstream discharge, because the direction of the flow in the river is dominated by the tide. However, when the increased upstream discharge during the monsoon season coincides with high tide, the impact on the water level is greater.
The highest water level of the last 25 years in the Betna River at Benarpota (near Noapara) was 4.05 mPWD, and the flood danger level for 2014 was 3.84 mPWD [15]. The modelling results revealed that duration above the current flood danger level will increase up to 15 days by the 2040s and 34 days by the 2090s (Table 4). The duration of extreme discharge, >400 m3/s (defined as an extreme based on modelled and measured data) will increase up to 14 days by the 2040s and 33 days by the 2090s.

4. Discussion

The results revealed an increase in air temperature, and increased monsoon precipitation and discharge, which are in good agreement with other studies of this region [9,12,13,29]. The increased monsoon precipitation and discharge indicate a wetter monsoon season in the future. However, during the dry season, precipitation and discharge are mostly expected to decrease in the future. This means that less water will be available during the dry season. The decreased precipitation and discharge during the dry season are unlikely to lead to droughts in the study area, because of the continuous tidal water inflow from the bay. This could exacerbate the existing salinity intrusion problem [28]. However, the decreased dry weather precipitation and associated salinization were not the focus of this study.
The future scenario analysis reveals that the mean change in water level and discharge relative to the baseline year would be up to 23% and 21% respectively, by the end of century. This increased discharge combined with the high water level would likely worsen the flooding situation in southwest Bangladesh and cause major flooding problems in the Betna River basin. Whitehead and Barbour [11] also indicated in their study that a 15% increase of discharge in the GBM River systems by the 2050s would have the potential to increase flood risk within Bangladesh. The increased river discharge in the monsoon season in the future is consistent with the future projected increased precipitation. The increase in monsoon discharge can also be attributed to the increased monsoon discharge in the upstream rivers of the Betna River. The increasing trend of monsoon precipitation and river discharge in South Asia is also evident from other studies [9,12,13,25,30,31].
The dry season data shows no noticeable change in the future discharge (Table 3) due to lack of connectivity with upstream rivers during the dry months. This is in agreement with Zaman, Molla [29] in their study in the GBM River systems of Bangladesh. Zaman and Molla [29] also found increased monsoon discharge and little change in the dry season discharge due to siltation at the upstream river mouth. The dry season discharge is expected to reduce by maximum 2% in the far future and this is unlikely to substantially change the present situation of the Betna River because of the tidal influence.
The results also revealed that SLR had a stronger impact on the water level compared to the impact of upstream discharge change. The upstream discharge is dependent on precipitation; during the monsoon, fresh water inflow from upstream areas increases. In a tidal river like the Betna River, the impact of discharge on the water level is limited, because the direction of the flow in the river is dominated by the tide. However, when the increased upstream discharge coincides with high tide, the impact on the water level is greater. The increased duration of the water danger level combined with increased frequency of extreme discharge (Table 4 and Figure 6) can severely affect the surrounding agricultural land by prolonged inundation during the monsoon and cause losses in terms of lives and livelihoods. When the water danger level coincides with the extreme discharge event, it would cause disastrous floods in the Betna River basin.
The MIKE 21 FM model was chosen to study the Betna River, because this model is suitable for tidal rivers and produces results at high temporal and spatial resolution. However, this choice comes at a cost of high computational requirements, which limited the opportunities to run the model for many years and many different GCM outputs. However, using several GCMs is recommended for further studies, since using a full ensemble of climate models would provide a better understanding of uncertainty.
The model was successfully calibrated for a monsoon season and validated for a full year, as has been done in other studies [4,25,26,28]. A possible reason for the slight overestimation of the water level at low tides can be the simplification of the river cross-section during mesh generation; thus better bathymetric data would be beneficial for further improvement of the model. This overestimation may also be the case for the results of future scenarios. However, as the impact is likely to be the same for the baseline period and future scenarios, and the future scenarios are compared with the baseline period, this slight overestimation should not affect the outcomes of this study. The slight underestimation of the discharge at high tides, which occurs in many hydrological models [32] and can possibly be explained by the lack of an extreme flood during the calibration period, could result in a stronger underestimation for a more extreme year. This may also mean that for the future, the peaks could be more underestimated than for the present.
To simulate the future scenarios, the discharge projections for the upstream Gorai River [25] were considered representative for the Betna River, due to the lack of local future discharge projections. Even though the modelling results were sensitive to the discharge at the upstream boundary, for the future conditions, the SLR proved much more important than the increase in the upstream boundary discharge. Therefore, the choice for the future discharge projections is relatively unimportant.
Identifying the trends and future scenarios for hydrodynamic characteristics triggered by climate change is required for the effective management of water bodies. This information on present and future hydrodynamic conditions can assist policy makers and water managers in planning flood risk mitigation and designing adequate flood protection structures. This information can be used to formulate a project for strengthening climate resilience. Although some other factors such as, changes in water use upstream, land-use change, population growth, socio-economic development and river dredging activities could significantly influence future impacts, focus should not be on climate change only; other changes that could have major impacts on the sustainability of water management infrastructure should not be overlooked [4]. Flood forecasting, i.e., early warning system should be developed to inform local farmers about their roles in an adverse weather condition. Construction of reservoirs near the river bank to store excess flood water for uses in the dry season can be another effective adaptation measure. The developed model, climate change scenario analysis approach and results of this study can potentially be useful for other river basins with similar geographic settings.

5. Conclusions

This study assessed the present situation and the future climate change impacts on the water level and discharge in the Betna River by applying a hydrodynamic model MIKE 21 FM. Based on the obtained modelling results, we conclude that:
  • increased precipitation and SLR are expected in the Betna River basin in the near and far future under both RCP 4.5 and RCP 8.5;
  • in RCP 8.5, water level and discharge in the Betna River are expected to increase up to 16 and 13% for the 2040s, and up to 23 and 21% for the 2090s, respectively;
  • in RCP 4.5, although the expected increase in river discharge is relatively low (i.e., between 7 and 16%), the increased discharge combined with an increased water level is likely to cause major floods in the Betna River basin;
  • the modelling results suggest that during the dry season, a small decrease in discharge (up to 2%) is expected for the 2090s;
  • SLR explains a larger part of the future increase in water level than increasing upstream discharge; and
  • in the future, the duration above the current flood danger level and of the extreme discharge events is expected to increase by half a month (per year) in the 2040s and by more than one month in the 2090s, causing prolonged inundation in the river basin, particularly during the monsoon.

Author Contributions

M.M.M.I.; Data curation, M.M.M.I. and E.S.; Formal analysis, M.M.M.I., N.H. and E.S.; Investigation, M.M.M.I.; Methodology, M.M.M.I., N.H. and E.S.; Project administration, M.M.M.I.; Resources, N.H.; Software, E.S.; Supervision, N.H.; Writing-original draft, M.M.M.I.

Funding

This research was funded by Ministry of Science and Technology, Government of Bangladesh, grant number 39.000.014.03.539 and the APC was funded by ESA group, Wageningen University and Research.

Acknowledgments

We thank the Ministry of Science and Technology of the Government of Bangladesh for providing a fellowship to pursue this study. We thank the Bangladesh Water Development Board, Meteorological Department and the Institute of Water Modelling for kindly providing river bathymetric and hydro-meteorological data and giving permission to use the data in the modelling work. We especially thank the DHI for providing the licence for the MIKE Powered by DHI software. Furthermore, we thank Rik Leemans (Wageningen University) for his help in critical review of the manuscript.

Conflicts of Interest

The authors declare no conflict of interest. The founding sponsors had no role in the design of the study; in the collection, analyses, or interpretation of data; in the writing of the manuscript, and in the decision to publish the results.

References

  1. Webster, T.; McGuigan, K.; Collins, K.; MacDonald, C. Integrated river and coastal hydrodynamic flood risk mapping of the lahave river estuary and town of Bridgewater, Nova Scotia, Canada. Water 2014, 6, 517–546. [Google Scholar] [CrossRef]
  2. Ahmed, A.U. Bangladesh Climate Change Impacts and Vulnerability: A Synthesis, Climate Change Cell Department of Environment, Govt. of Bangladesh. 2006. Available online: https://www.Preventionweb.Net/files/574_10370.Pdf (accessed on 25 March 2017).
  3. CEGIS. Environmental Impact Assessment of Re-Excavation of Betna River in Satkhira District for Removal of Drainage Congestion; Bangladesh Water Development Board: Dhaka, Bangladesh, 2013; pp. 1–182. [Google Scholar]
  4. Asian Development Bank (ADB). Adapting to Climate Change: Strengthening the Climate Resilience of the Water Sector Infrastructure in Khulna, Bangladesh; Asian Development Bank: Mandaluyong City, Philippines, 2011; pp. 1–40. [Google Scholar]
  5. Karim, M.F.; Mimura, N. Impacts of climate change and sea-level rise on cyclonic storm surge floods in bangladesh. Glob. Environ. Chang. 2008, 18, 490–500. [Google Scholar] [CrossRef]
  6. IPCC. Summery for policymakers. In Climate Change 2014: Impacts, Adaptation, and Vulnerability. Part A: Global and Sectoral Aspects; Field, C.B., Barros, V.R., Dokken, D.J., Mach, K.J., Mastrandrea, M.D., Bilir, T.E., Chatterjee, M., Ebi, K.L., Estrada, Y.O., Genova, R.C., et al., Eds.; Contribution of Working Group II to the Fifth Assessment Report of the Intergovernmental Panel on Climate Change; Cambridge University Press: Cambridge, UK; New York, NY, USA, 2014; pp. 1–32. [Google Scholar]
  7. Mohammed, K.; Islam, A.S.; Islam, G.T.; Alfieri, L.; Bala, S.K.; Khan, M.J.U. Extreme flows and water availability of the brahmaputra river under 1.5 and 2 °C global warming scenarios. Clim. Chang. 2017, 145, 159–175. [Google Scholar] [CrossRef]
  8. Bandudeltas. Baseline Study on Climate Change in Bangladesh Delta Plan 2100 Project: Coast and Polder Issues, Planning Commision, Government of Bangladesh; Bandudeltas: Dhaka, Bangladesh, 2015. [Google Scholar]
  9. Jin, L.; Whitehead, P.; Sarkar, S.; Sinha, R.; Futter, M.; Butterfield, D.; Caesar, J.; Crossman, J. Assessing the impacts of climate change and socio-economic changes on flow and phosphorus flux in the ganga river system. Environ. Sci. Process. Impacts 2015, 17, 1098–1110. [Google Scholar] [CrossRef] [PubMed]
  10. Kuchar, L.; Iwański, S. A modeling framework to assess the impact of climate change on river runoff. Meteorol. Hydrol. Water Manag. 2014, 2, 49–63. [Google Scholar] [CrossRef]
  11. Whitehead, P.; Barbour, E.; Futter, M.; Sarkar, S.; Rodda, H.; Caesar, J.; Butterfield, D.; Jin, L.; Sinha, R.; Nicholls, R. Impacts of climate change and socio-economic scenarios on flow and water quality of the ganges, brahmaputra and meghna (GBM) river systems: Low flow and flood statistics. Environ. Sci. Process. Impacts 2015, 17, 1057–1069. [Google Scholar] [CrossRef] [PubMed]
  12. Ghosh, S.; Dutta, S. Impact of climate change on flood characteristics in brahmaputra basin using a macro-scale distributed hydrological model. J. Earth Syst. Sci. 2012, 121, 637–657. [Google Scholar] [CrossRef]
  13. Apurv, T.; Mehrotra, R.; Sharma, A.; Goyal, M.K.; Dutta, S. Impact of climate change on floods in the brahmaputra basin using CMIP5 decadal predictions. J. Hydrol. 2015, 527, 281–291. [Google Scholar] [CrossRef]
  14. Alam, R.; Islam, M.S.; Hasib, M.R.; Khan, M.Z.H. Characteristics of hydrodynamic processes in the meghna estuary due to dynamic whirl action. IOSRJEN 2014. [Google Scholar] [CrossRef]
  15. IWM. Feasibility Study for Drainage Improvement of Polder 1, 2, 6–8 by Mathematical Modelling under the Satkhira District; Institute of Water Modelling: Dhaka, Bangladesh, 2014; pp. 1–184. [Google Scholar]
  16. Hossain, A.N.H.A. Integrated Flood Management: Case Study Bangladesh; Bangladesh Water Development Board (BWDB): Dhaka, Bangladesh, 2003; pp. 1–14. [Google Scholar]
  17. Islam, M.M.M.; Hofstra, N.; Islam, M.A. The impact of environmental variables on faecal indicator bacteria in the betna river basin, Bangladesh. Environ. Process. 2017, 4, 319–332. [Google Scholar] [CrossRef]
  18. DHI. Mike 21 and Mike 3 Flow Model FM; MIKE by DHI: Horsholm, Denmark, 2011. [Google Scholar]
  19. Uddin, M.; Alam, J.B.; Khan, Z.H.; Hasan, G.J.; Rahman, T. Two dimensional hydrodynamic modelling of northern bay of bengal coastal waters. Comput. Water Energy Environ. Eng. 2014, 3, 140–151. [Google Scholar] [CrossRef]
  20. Cronshey, R.G.; Roberts, R.T.; Miller, M. Urban Hydrology for Small Watersheds. In Procedding of the Specialty Conference, Hydrauolics and Hydrology in the Small Computer Age. Hydrology Division/ASCE, Lake Buena Vista, FL, USA, 12–17 August 1985; Waldrop, W.R., Ed.; American Society of Civil Engineers: New York, NY, USA, 1985. [Google Scholar]
  21. Moriasi, D.N.; Arnold, J.G.; Van Liew, M.W.; Bingner, R.L.; Harmel, R.D.; Veith, T.L. Model evaluation guidelines for systematic quantification of accuracy in watershed simulations. Trans. ASABE 2007, 50, 885–900. [Google Scholar] [CrossRef]
  22. Christensen, N.S.; Lettenmaier, D.P. A multimodel ensemble approach to assessment of climate change impacts on the hydrology and water resources of the colorado river basin. Hydrol. Earth Syst. Sci. Discuss. 2007, 11, 1417–1434. [Google Scholar] [CrossRef]
  23. Taylor, K.E.; Stouffer, R.J.; Meehl, G.A. An overview of CMIP5 and the experiment design. Bull. Am. Meteorol. Soc. 2012, 93, 485–498. [Google Scholar] [CrossRef]
  24. Liu, C.; Hofstra, N.; Leemans, R. Preparing suitable climate scenario data to assess impacts on local food safety. Food Res. Int. 2015, 68, 31–40. [Google Scholar] [CrossRef]
  25. Billah, M.; Rahman, M.M.; Islam, A.K.M.S.; Islam, G.M.T.; Bala, S.K.; Paul, S.; Hasan, M.A. Impact of climate change on river flows in the Southwest region of Bangladesh. In Proceedings of the 5th International Conference on Water & Flood Management (ICWFM-2015), Dhaka, Bangladesh, 6–8 March 2015. [Google Scholar]
  26. Elshemy, M.; Khadr, M. Hydrodynamic impacts of egyptian coastal lakes due to climate change-example Manzala Lake. Int. Water Technol. J. 2015, 5, 235–246. [Google Scholar]
  27. Kay, S.; Caesar, J.; Wolf, J.; Bricheno, L.; Nicholls, R.; Islam, A.S.; Haque, A.; Pardaens, A.; Lowe, J. Modelling the increased frequency of extreme sea levels in the ganges–brahmaputra–meghna delta due to sea level rise and other effects of climate change. Environ. Sci. Process. Impacts 2015, 17, 1311–1322. [Google Scholar] [CrossRef] [PubMed]
  28. Dasgupta, S.; Kamal, F.A.; Khan, Z.H.; Choudhury, S.; Nishat, A. River Salinity and Climate Change: Evidence from Coastal Bangladesh; World Bank Policy Research Working Paper; World Bank Group: Washington, DC, USA, 2014. [Google Scholar]
  29. Zaman, A.; Molla, M.; Pervin, I.; Rahman, S.M.; Haider, A.; Ludwig, F.; Franssen, W. Impacts on river systems under 2 °C warming: Bangladesh case study. Clim. Serv. 2017, 7, 96–114. [Google Scholar] [CrossRef]
  30. Kirby, J.; Mainuddin, M.; Mpelasoka, F.; Ahmad, M.; Palash, W.; Quadir, M.; Shah-Newaz, S.; Hossain, M. The impact of climate change on regional water balances in Bangladesh. Clim. Chang. 2016, 135, 481–491. [Google Scholar] [CrossRef]
  31. Mirza, M.M.Q.; Warrick, R.; Ericksen, N. The implications of climate change on floods of the ganges, brahmaputra and meghna rivers in Bangladesh. Clim. Chang. 2003, 57, 287–318. [Google Scholar] [CrossRef]
  32. Kan, G.; He, X.; Ding, L.; Li, J.; Liang, K.; Hong, Y. Study on applicability of conceptual hydrological models for flood forecasting in humid, semi-humid semi-arid and arid basins in China. Water 2017, 9, 719. [Google Scholar] [CrossRef]
Figure 1. Study area, the Betna River basin in the southwest of Bangladesh.
Geosciences 08 00271 g001
Figure 2. Bathymetry (a) and mesh (b) for the hydrodynamic model of the Betna River.
Geosciences 08 00271 g002
Figure 3. Model calibration: simulated and measured tidal water level (a) and discharge (b) at Noapara in the Betna River. The lines and dots represent the modelled values and measured values, respectively. The negative discharge values mean that during flood tide the flow is from the opposite direction.
Geosciences 08 00271 g003
Figure 4. An example of comparison of modelled and measured tidal water level at Noapara in the Betna River. (a) represents a wet month (September 2015), and (b) represents a dry month (December 2014).
Geosciences 08 00271 g004
Figure 5. Daily average air temperature (left), monthly average precipitation (middle), and monthly average discharge (right) projections for the Betna River basin for two RCPs, RCP 4.5 (a,b) and RCP 8.5 (c,d) and two future periods, near future (2031–2050; a,c) and far future (2081–2100; b,d).
Geosciences 08 00271 g005
Figure 6. Probability density functions (PDFs) of hourly water levels (a,b) and daily maximum discharges (c,d) in the Betna River at Noapara for the baseline year (2014–2015) and in the near (2040s) and far (2090s) future under RCP 4.5 (a,c) and RCP 8.5 (b,d) for the two General Circulation Models (GCMs). The vertical dotted lines represent flood danger water levels (a,b) and extreme discharge levels (c,d).
Geosciences 08 00271 g006
Table 1. Input data used for the hydrodynamic model.
Data TypeResolutionPeriodLocationSource
River bathymetryCross-section 400–500 m2012Modelled stretchIWM a
Water level for calibration period0.5 h2012 Maskhola, Noapara and lower boundaryIWM a
Water level for validation period3 h2014–2015Near Noapara and lower boundaryBWDB b
Discharge for calibration period0.5 h2012Near Noapara and upper boundaryIWM a
Discharge for validation period1 week2014–2015Near upper boundaryBWDB b
Precipitation1 day2012–2015BMD SatkhiraBMD c
Air temperature1 day2012–2015BMD SatkhiraBMD c
Wind speed and direction3 h2012–2015BMD SatkhiraBMD c
Relative humidity1 day2012–2015BMD SatkhiraBMD c
a Institute of Water Modelling, Bangladesh; b Bangladesh Water Development Board; c Bangladesh Meteorological Department.
Table 2. Parameter values used in the hydrodynamic modeling.
Parameter TypeFormulationCalibrated ValueNote
Horizontal eddy viscositySmagorinsky formulation Selected after multiple simulations where different values were tested.
Constant value0.28 m2/s
Range1.8 × 10−06–1.0 × 10⁸ m2/s
Vertical eddy viscosityk-epsilon formulation
Range1.0 × 10−07–2.0 × 10−04 m2/s
Bed roughness Roughness height
Constant value60 m1/3/s
Wind frictionConstant value0.001255
Heat exchangeConstant in Dalton’s law0.5
Wind coefficient in Dalton’s law0.9
Sun constant, ‘‘a’’ in Ångström’s law0.176
Sun constant, ‘‘b’’ in Ångström’s law0.37
Light intensityLight extinction coefficient0.5
Table 3. Projected change (%) in seasonal mean water level and discharge at Noapara in the Betna River: Comparison of the two Representative Concentration Pathway (RCP) scenarios for the near (2040s) and far (2090s) future with the baseline year. The monsoon season occurs during June–September and the dry season during November–February.
GCMsNear Future (2040s)Far Future (2090s)
RCP 4.5RCP 8.5RCP 4.5RCP 8.5
MonsoonDryMonsoonDryMonsoonDryMonsoonDry
Flood TideEbb TideFlood TideEbb TideFlood TideEbb TideFlood TideEbb TideFlood TideEbb TideFlood TideEbb TideFlood TideEbb TideFlood TideEbb Tide
Water level (% change)
IPSL-CM5A11.111.310.610.715.515.114.213.915.615.414.514.421.421.719.719.9
MPI-ESM11.411.711.111.315.815.414.514.116.115.914.814.922.122.720.320.5
Discharge (% change)
IPSL-CM5A7.67.21.21.311.611.40.80.614.714.90.40.520.220.5−1.8−1.6
MPI-ESM8.28.10.80.912.412.70.70.716.116.2−1.3−1.221.321.1−2.2−2.3
Table 4. Change in duration above the current (2014–2015) flood danger level and extreme discharge at Noapara in the Betna River for two RCPs, two GCMs and two future periods.
GCMsScenariosDuration above Flood Danger LevelDuration above Discharge of 400 m3/s
Baseline (2014–2015)13 days11 days
IPSL-CM5ARCP 4.5 (2040s)25 days21 days
RCP 8.5 (2040s)27 days24 days
RCP 4.5 (2090s)41 days35 days
RCP 8.5 (2090s)45 days46 days
MPI-ESMRCP 4.5 (2040s)25 days22 days
RCP 8.5 (2040s)28 days25 days
RCP 4.5 (2090s)43 days36 days
RCP 8.5 (2090s)47 days46 days

