Abstract
This study provides a unique procedure for validating and reconstructing temperature and precipitation data. Although developed from data in Middle Italy, the validation method is intended to be universal, subject to appropriate calibration according to the climate zones analysed. This research is an attempt to create shared applicative procedures that are most of the time only theorized or included in some software without a clear definition of the methods. The purpose is to detect most types of errors according to the procedures for data validation prescribed by the World Meteorological Organization, defining practical operations for each of the five types of data controls: gross error checking, internal consistency check, tolerance test, temporal consistency, and spatial consistency. Temperature and precipitation data over the period 1931–2014 were investigated. The outcomes of this process have led to the removal of 375 records (0.02%) of temperature data from 40 weather stations and 1286 records (1.67%) of precipitation data from 118 weather stations, and 171 data points reconstructed. In conclusion, this work contributes to the development of standardized methodologies to validate climate data and provides an innovative procedure to reconstruct missing data in the absence of reliable reference time series.
1. Introduction
Climate analysis is taking on an increasingly central role in the life of mankind. Climate has a great impact on many environmental issues and requires reliable, as well as complete, data. The procedure for deleting possible errors from the data is called validation, while the completion of missing data in a time series is called reconstruction. In this context, the aim of the present study is to define a practical method of data validation and reconstruction that, in the future, could be automated by software. The issue of validation and reconstruction of missing data has been analysed by computer since the 1950s [1]. A growing awareness of the need for more accurate and truthful analyses led the scientific community to considerable development in this field. On the one hand, studies have been focused on the identification of the different types of errors [2], while, on the other hand, the goal has been the reconstruction of missing data. The quality control and climate data processing methods are developed and standardised through the work of the World Meteorological Organization (WMO), which has been active on this theme since the early1960s, publishing important reports (for example, [3]) and adopting the most relevant advances in this theme. The study of quality control is very complex and has gone through a constant refinement of techniques. Temporal consistency of observations and attributing flags to data took hold in the 1990s [4]. Almost simultaneously, other important concepts, such as duplicate profile and range checks, were introduced [5]. Subsequently, spatial consistency and the detection of false positives took a leading role [6]. Furthermore, there were many efforts to start a possible standardization of quality control rules with the increased number of automatic weather stations, and investigations of high-low range limit, rate of change limit, or persistence analyses [7]. To date, the increasing development of computer technology has generated automated systems for the analysis of meteorological and climatological data. Some investigations have considered data in real-time at hourly or semi-hourly scale (for example, [8,9,10]) in order to detect the error immediately, while other studies of automatic analyses for quality control were based on daily data [11]. There are objective difficulties in quality control through daily precipitation data because of the spatial discontinuity of the variable. However some studies have obtained good results [12,13,14,15]. Moreover, some software developed in the ‘R’ environment not only check the quality of the data, but also calculate extreme climate indices [16]. In this context the WMO has the aim of summarizing the latest improvement in atmospheric science by creating standards for the international community, and identifies some quality control procedures [17]. These quality control procedures are based on five different tests [18] that analyse spatial, temporal, and absolute relationships of climate time series. For data reconstruction, the studies have been developed more recently, due to software that allows spatial interpolations [19]. In particular, geostatistics have played a key role in the reconstruction of climate data, with extensive use of neural networks [20] and kriging methods [21]. Thus, the present study aims to contribute to quality control by providing an operational procedure, starting from WMO prescriptions. A system based on five different tests for validation of daily and monthly climate data has been adopted. Quality controls are planned through a procedure that differs for temperature and precipitation because of their inner diversity in data range and variability. This research is innovative because it emphasizes relations between neighbouring weather stations, in order to detect errors in the data, even if they belong to different climates, as in this case. Moreover, this analysis implements a method to reconstruct missing data in the absence of a reliable reference time series. This method does not take into account validation of weather station data to obtain the average ratios with the raw ones to reconstruct missing data, but it interpolates many values of temperature and precipitation of the weather stations surrounding the missing one.
Geographical Boundaries of the Analysis
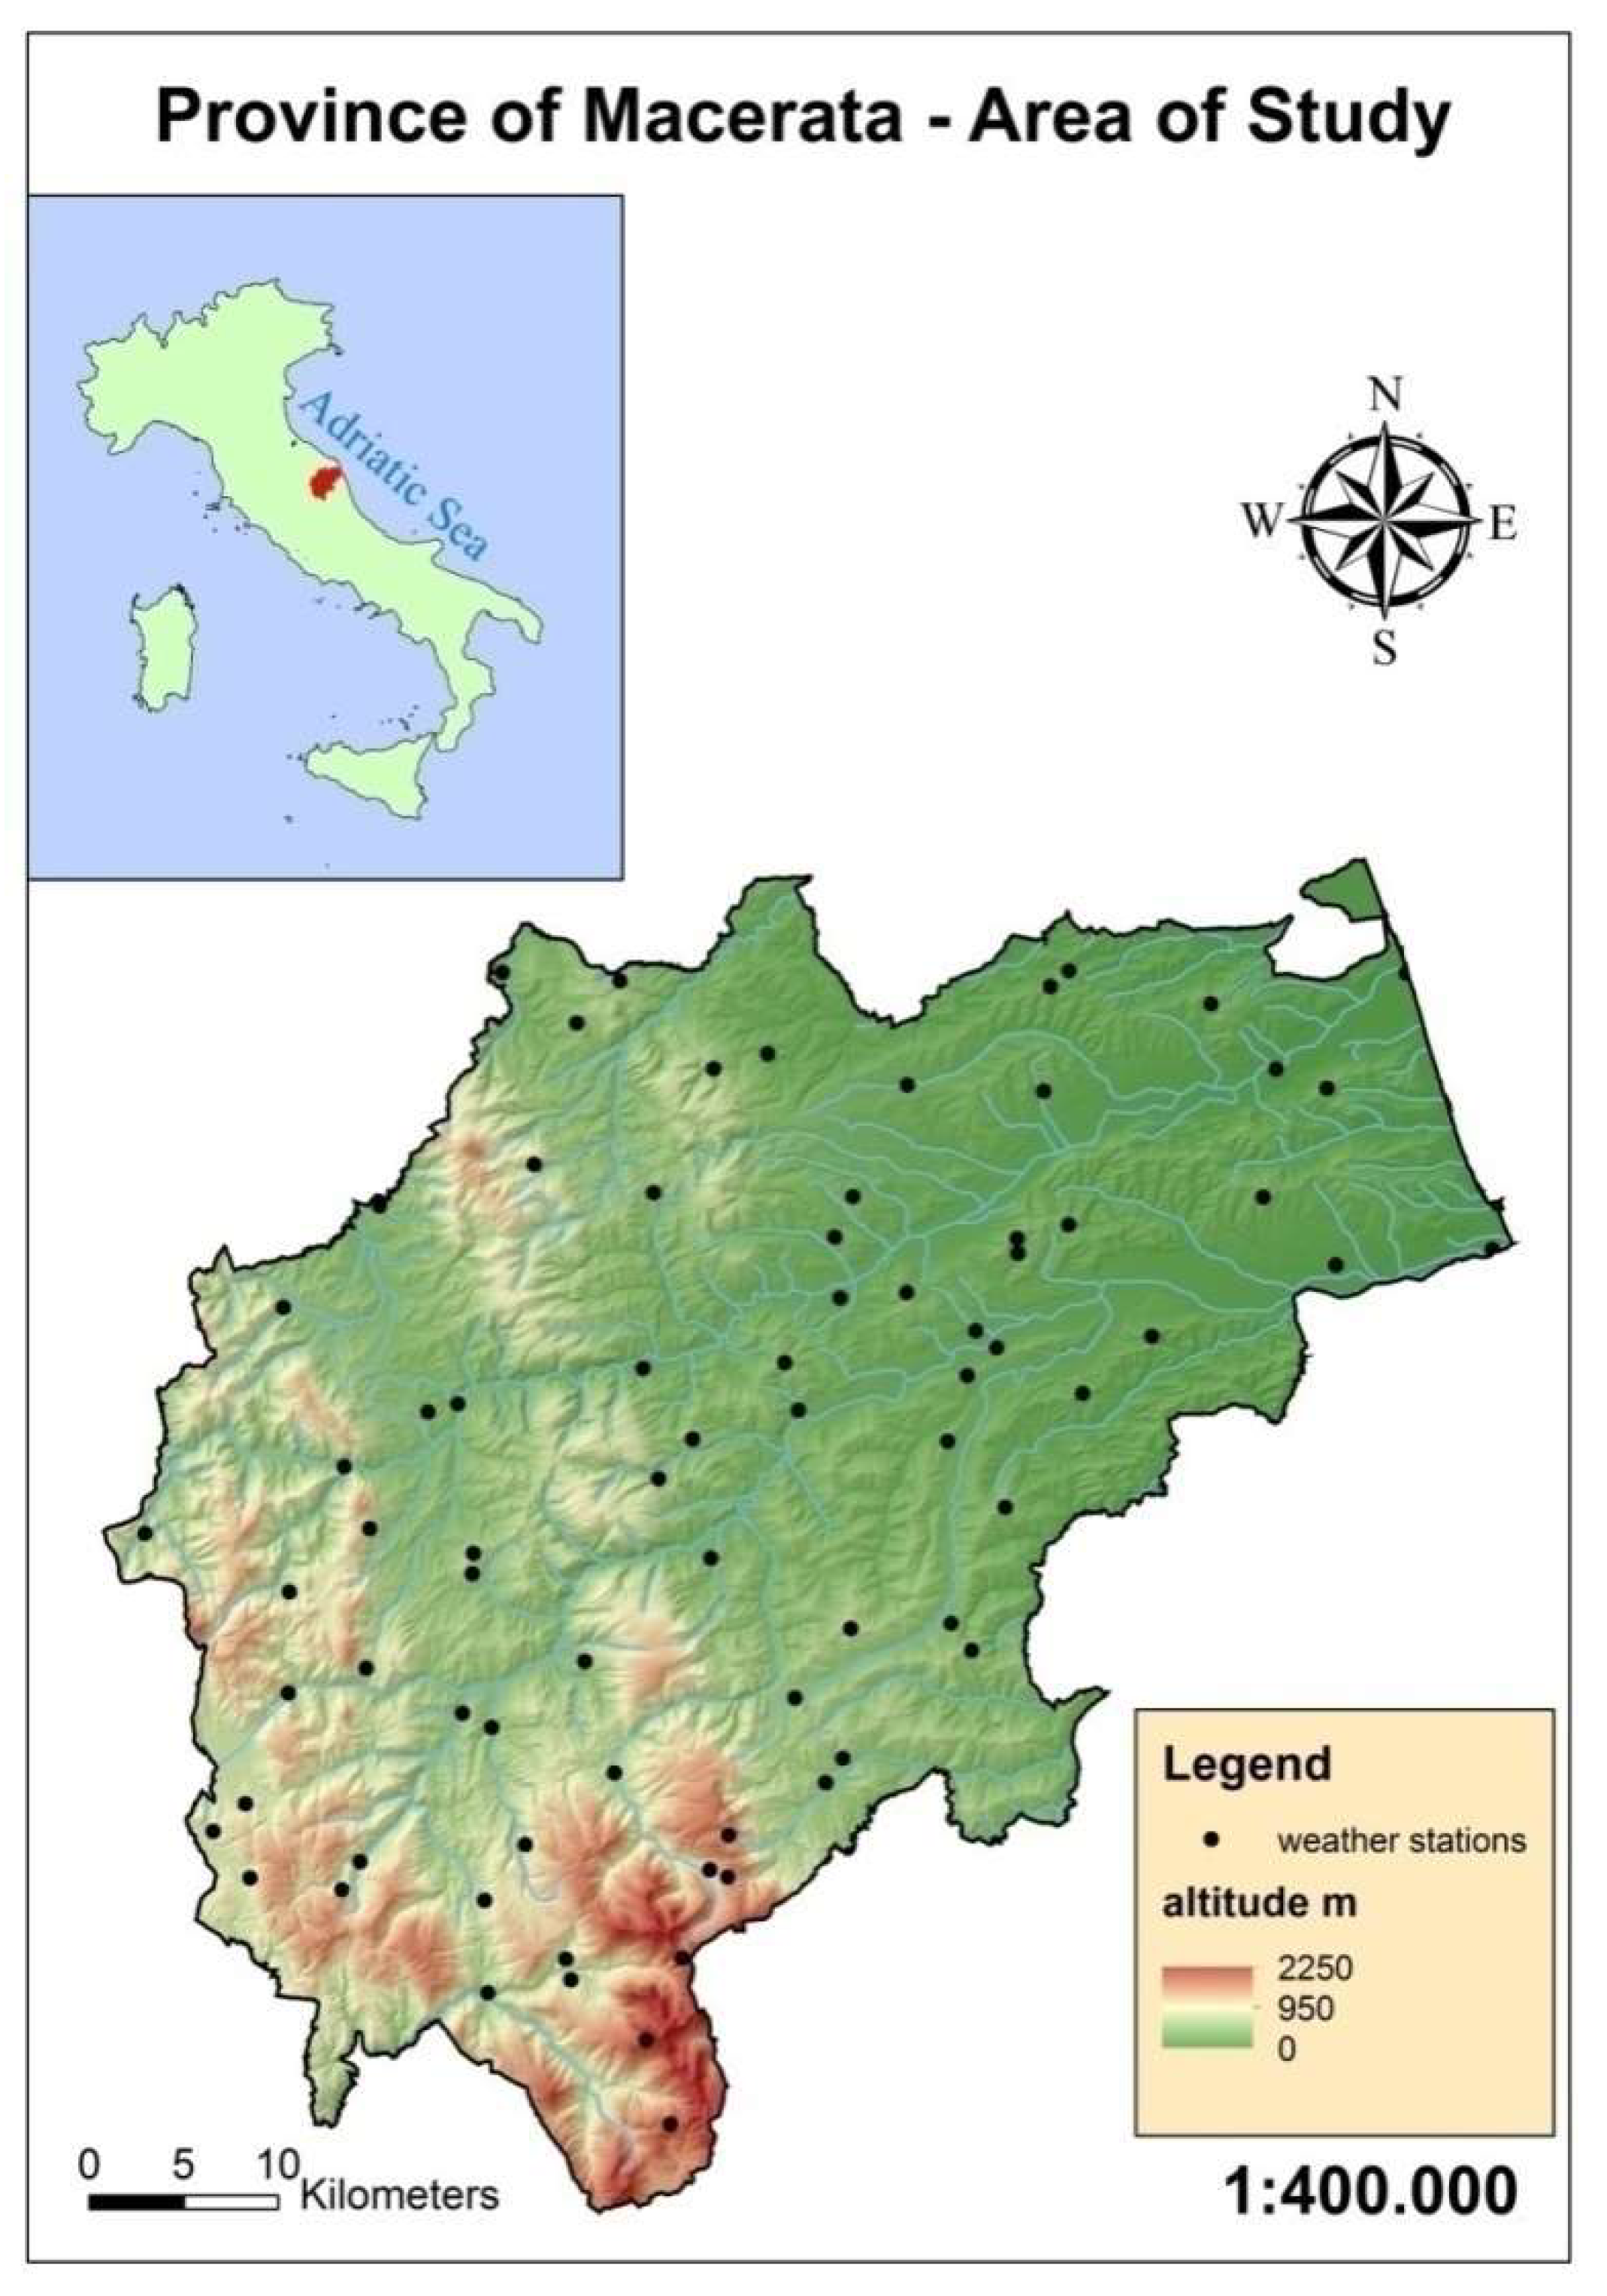
The study site is located between the Adriatic Sea and the Appennine Mountains (Figure 1) in the province of Macerata (Marche, Middle Italy) and some of the surrounding territories. The elevation gradient ranges from sea level on the Adriatic coast to 2233 m asl (above sea level) (the Porche Mountain). This difference in altitude makes quality control of climate data very difficult and requires a method to compare mountain weather stations.
Figure 1.
Area of study (without weather stations outside study area), province of Macerata, Central Italy.
This area is characterized by heterogeneous environments. On the basis of the classification of Köppen–Geiger [22] it is possible to identify three main climate zones [23]: ‘Cs’ (C-temperate climate with s-dry summer) in the coastal area and its surroundings, ‘Cf’ (f-humid) until 1400 m, and above this elevation up to the highest peak the climate type is ‘H’ (high altitude climates).
The wide diversity of climate conditions in Macerata province means that it is increasingly difficult to perform data validation tests common to all the weather stations because quality controls should work for different types of climate.
2. Methodology
2.1. Climate Data
The climate data have been supplied by the ‘Annali Idrologici’ (Hydrological Yearbooks http://www.acq.isprambiente.it/annalipdf/), the ‘Dipartimento della Protezione Civile’, Regione Marche’ (Dept. of Civil Protection http://www.protezionecivile.gov.it/jcms/en/home.wp), the ‘Centro Funzionale dell’Umbria’ (Functional Center of Umbria http://www.cfumbria.it/), and the Agenzia Servizi Settore Agroalimentare delle Marche (Agency for Agro-food Sector Services of the Marche Region http://www.assam.marche.it/en/). The data cover the years from 1931 to 2014, however, the analysis is divided into three standard periods of 30 years: 1931–1960; 1961–1990; and 1991–2014. The division into periods allows a good continuity of weather stations that must have at least 15 years of continuous data to be part of the analysis. The total number of weather stations is 40 for temperature data and 118 for precipitation data (Table 1). Their numbers have changed during the period of analysis (1931–2014), due to changes of instruments or removal of weather stations. The instruments were initially mechanical, above all in the period when the data were recorded by ‘Annali Idrologici’. Since the 1990s, almost all weather stations have been automated with an integrated wireless telemetry system. Finally, mean daily values of temperature were calculated from hourly and half-hourly data at each station when possible, only if at least 75% of the data in a given day were available. For precipitation, the monthly data value is considered only if all daily observations in a month are available. If these conditions regarding temperature and precipitation are not satisfied, the data are considered missing. For temperature, daily data were analysed because this variable shows a gradual distribution in the environment, i.e., it follows Tobler’s Law [24] with gradients typical of each area; daily precipitation, on the other hand, is often not correlated with nearby rain gauges, due to atmospheric dynamics, although on a monthly scale the correlation returns.

Table 1.
Weather stations for precipitation and temperature (St. N. = number of each weather station; PDA = period of data availability; Sensor = if weather station detect temperatures, precipitation, or both).
2.2. Data Analysis
The analysis was performed by using the spreadsheet and GIS (Geographic Information Systems) software. A spreadsheet was used to carry out the sequence of controls and GIS was used for data reconstruction by applying geostatistical methods. Concerning data reconstruction, each candidate weather station was reconstructed with some neighbouring ones. The clustering of the sample was primarily investigated with the “average nearest neighbour” tool, which returned a good result with a p-value higher than 95% [25]:
where is the distance between feature i and its nearest feature, corresponds to the total number of features, and is the total study area.
Subsequently, the data have been evaluated through a Voronoi diagram based on clustering, with altitude as an attribute, in order to identify the similarity between a candidate weather station and surrounding neighbours [26]. The Empirical Bayesian Kriging method is a geostatistical method which has been used for interpolation, reconstructing the missing data at the exact co-ordinates of the candidate weather station.
The control procedure is more complicated than the reconstruction one and required that values be ranked on the basis of some quality control flags (QC). For example, missing datum (QC = −1), correct or verified datum (QC = 0), datum under investigation (QC = 1), datum removed after the analysis (QC = 2), and datum reconstructed through interpolation or by estimating the errors of digitization (QC = 3).
There are five main tests both for temperature and precipitation:
- Gross error checking
- Internal consistency check
- Tolerance test
- Temporal consistency
- Spatial consistency
‘Gross error checking’ was performed for both temperature and precipitation in the same way; each daily or monthly data outside the established threshold was deleted. At the end of this part of the analysis of only two QC values are allowed: 0 or 2 (if it is not possible to solve the error by using the metadata of the source). The threshold was analysed in order to check for both digitizing errors and values exceeding the measurement range for a sensor problem. The accepted range is from +50 °C to −40 °C for daily temperature [27], while 2000 mm is the limit in monthly precipitation and it represents the maximum annual amount of precipitation in Marche Region. In these data there are no gross errors.
The ‘internal consistency check’ is a type of control that assesses the consistency of climate data. For example, when temperature has a maximum value lower than minimum one is an error of consistency, and when there is a negative rainfall value. Any values outside these ranges were removed when it was not possible to correct them through the metadata analysis. The internal consistency check, in the same way of gross error checking, led to corrected or deleted data (QC flag 0 or 2).
Before applying the remaining three tests, the normality of data distribution was assessed in order to choose the most suitable statistical instrument for each parameter (temperature, precipitation). The Gaussian distribution was verified in all the weather stations by using statistical indicators of normality as:
- ‘QQ plot’ performed with ArcGis to evaluate graphically the normality of data distribution [28];
- The ‘Kolmogorov-Smirnov test’, set with a confidence interval of 95% [29];
- Calculation of skewness; if skewness values are between 2 and −2 the distribution of values is considered ‘normal’ [30].
The tolerance test was applied to check each weather station on the basis of its historical time series. The test investigates the upper and lower thresholds that are 3σ ± µ (where σ is standard deviation of the time series, and µ is the mean of the time series) for daily temperature (maximum, mean, minimum, and difference between maximum and minimum) and monthly precipitation. Moreover, the months with 0 mm of precipitation were further investigated, because the method detects them as lower values even though 0 mm can be a real value in summer months. It can be concluded that the tolerance test defines ‘data under investigation’ (QC = 1) and ‘correct data’ (QC = 0). Subsequently, the data under investigation were analysed in more detail by applying the following controls. They were tested by spatial consistency, which takes into account the neighbouring weather stations to identify if there are at least two of them that exceed the threshold of 2σ, as this would provide a clear indication of the suitability of data. The data were previously analysed by using the “Nearest Neighbour” tool to analyse their distribution (if random or cluster) with an interval of confidence (p-value) above 95%. Instead, the Voronoi map, with altitude as attribute, was used to group similar weather stations. Spatial consistency of temperatures take into account daily data, while for precipitation monthly and annual ones. Precipitation was analysed to an annual scale because it is easier to highlight the differences between neighbouring stations before the monthly analysis. The formula below was used to set the threshold [31]:
where µ is the mean of five neighbouring weather stations, σ is the standard deviation of them, and n is the number of samples.
Precipitation and temperature data outside the established range were assigned a VC=1 (data under investigation) after they were analysed in the temporal consistency test. Temporal consistency differs between temperature and precipitation because of the difference of data in the continuity of temperature and precipitation. Temperatures were analysed for persistence by removal (QC = 2) of the values that occur for more than one following day unless it was confirmed by at least two neighbouring weather stations, with a difference lower than 0.2 °C between contiguous days; while for precipitation there is persistence if the same value to one decimal place occurred for more than one following day without the need to investigate any neighbouring weather stations. The maximum difference between contiguous days was analysed by applying a mean of all differences between the maximum and minimum values for the entire duration of the data time series. Thus, the limits were calculated by using the median of variations and summed or subtracted to three times the standard deviation (µ ± 3σ), in order to verify if the investigated weather station exceed the established thresholds [32].
Temporal consistency of precipitation is composed of two main points:
- 1.
- The rain gauges that show QC = 1 after the spatial consistency because of very low precipitation were analysed through a test composed by the calculation of the squared correlation coefficient (R2) [33]:
R2 was calculated for the investigated rain gauge and the most similar one differentiated in four cases:
- R2 > 0.7: the rain gauge value is accepted for all months only if it is above its minimum limit as calculated by the time series, for at least 9 out of 12 months;
- R2 < 0.7: the months below the lower threshold of the time series are removed only if at least 9 out of 12 months are above this limit;
- If there are less than nine months above the lower limit but the value of R2 is greater than 0.7; it is necessary to calculate the median of each month and of each year in the five nearby rain gauges in the lifetime of the investigated one and subtract 1.5 times the standard deviation, thus obtaining another threshold value. When the rain recording station shows three years or more below the lower threshold the whole year is deleted, otherwise it is accepted completely without removing any months;
- When there are less than nine months above the minimum limit and R2 < 0.7 the whole suspect year is deleted.
- 2.
- The rain gauges, which had a QC = 1 after the spatial consistency analysis due to the exceeding of 3σ threshold for annual values, required use of a procedure slightly different from the gauges with very little precipitation. The monthly data of the weather station under investigation were analysed with its historical time series and accepted if they were lower than 2σ + µ (QC = 0), investigated if they were between 2σ + µ and 3σ + µ (QC = 1), or removed if they were above 3σ + µ (QC = 3). The suspect rainfall stations with at least 10 years of observations and no more than 20, were analysed in comparison with the neighbouring stations through the following procedure:
- If the similarity is greater than 0.7 (R2), the rain gauges would remain for all the months if they are below the threshold value for at least 9 out of 12 months. If the threshold value is above the limit for more than four months, it should be compared with five nearby rain gauges. This comparison allowed calculation of a median that should be multiplied by two times the standard deviation: Th.Max.Neigh.pt = Me + 2σ. When the record exceeded this limit for more than three months the whole year is removed (QC = 3): otherwise, only the months above the threshold would be deleted (QC = 3);
- When R2 was < 0.7, the records were deleted for all the values above the set limit if at least 9 out of 12 months were below the limit (Th.Max.Neigh.pt = Me + 2σ); however, if there were four months above the limit, data were removed for the whole year.
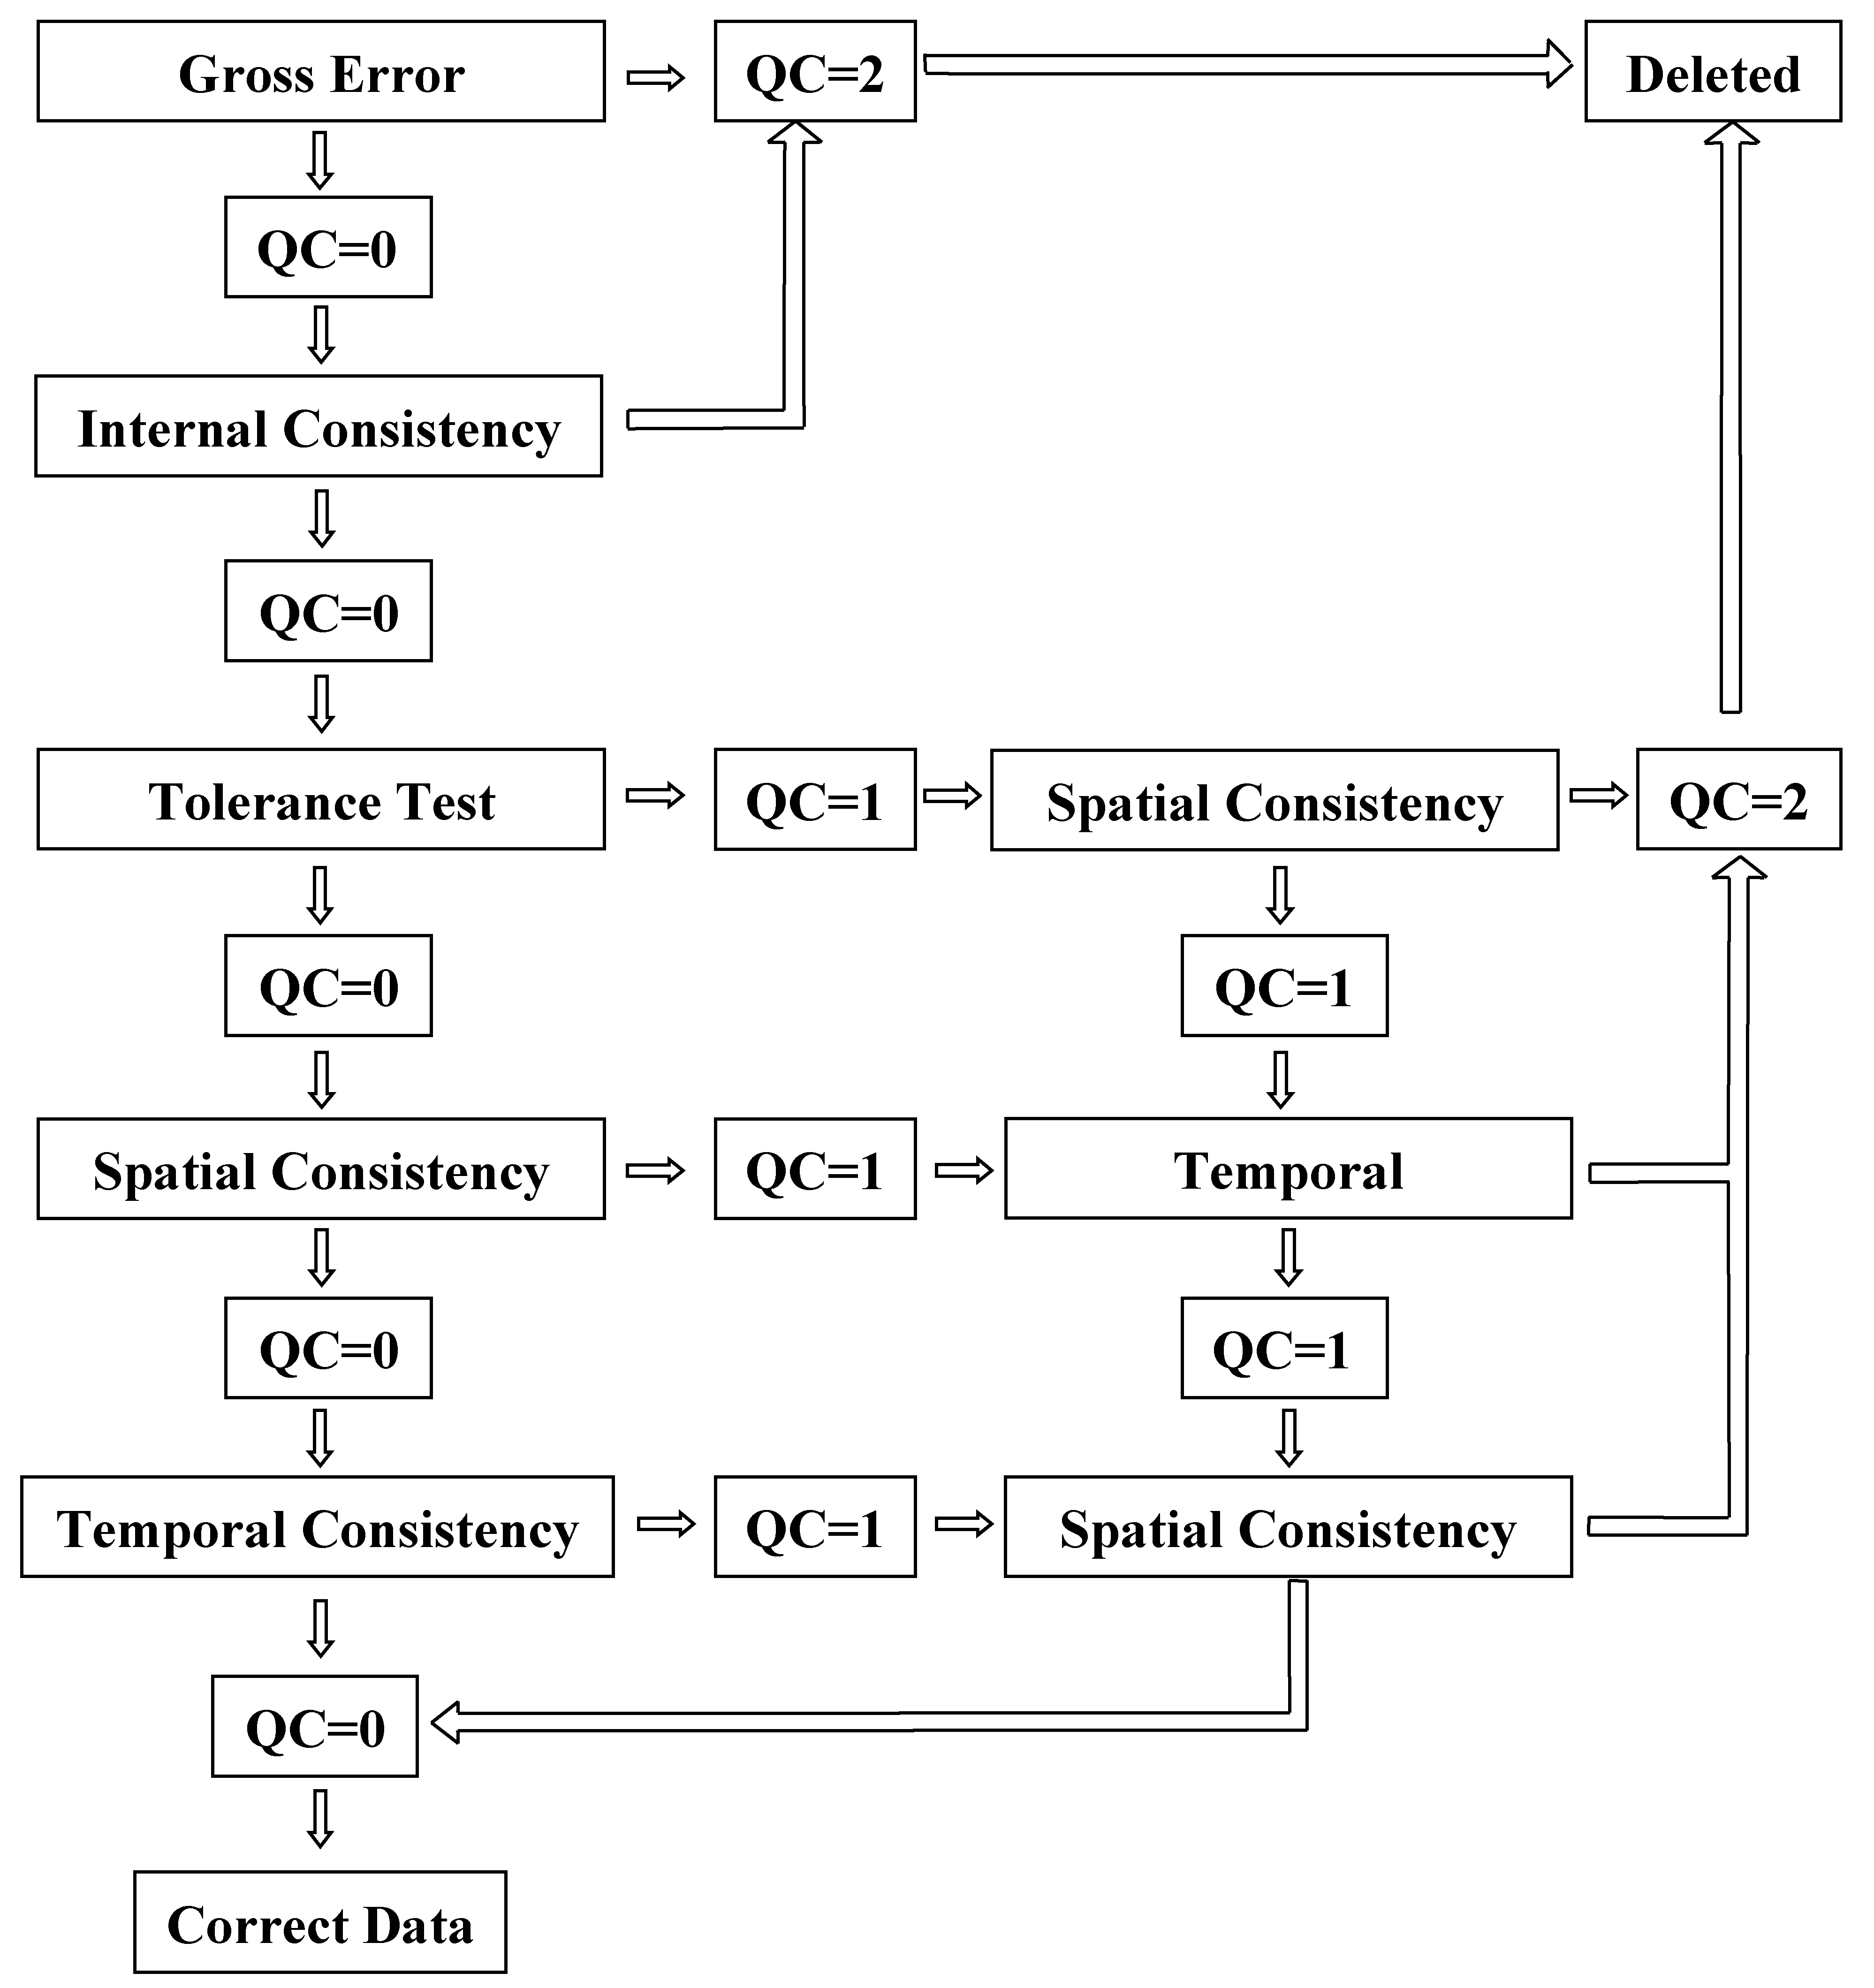
After the temporal consistency check was completed, it was necessary to assess again the spatial consistency by taking into consideration the monthly data (previously this procedure was based on annual values) in order to have a scaling up and achieve a higher accuracy. The same method of three standard deviations above/below the mean was used to remove the data out of the threshold (QC = 3): the data inside this were accepted (QC = 0). Finally, it is necessary to specify that any data are accepted (QC = 0) if an extreme climatic event was historically documented in the metadata, and only three errors solved in this way. The complex procedure adopted is summarized in the mind-map graph (Figure 2).
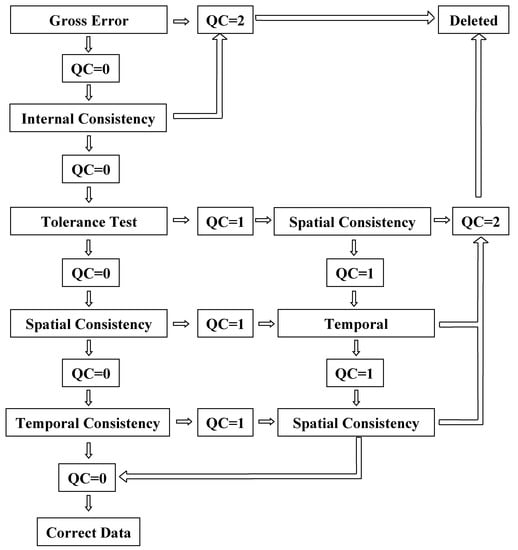
Figure 2.
Mind-map graph of data validation.
2.3. Reconstruction of Missing Data
The reconstruction of missing data (VC= −1) was analysed on the basis of 10 day intervals for temperature and on monthly intervals for precipitation. The procedure of reconstruction of missing data was divided into two phases [34]:
- the investigation of the difference between reference and candidate time series [35];
- the reconstruction of data through the addition of the difference to the reference time series in order to reconstruct the candidate one [36].
The method of the reconstruction of data can be classified as indirect. As there is no reference time series that could be considered reliable with reasonable certainty, the reconstruction has been created with at least five neighbouring weather stations as reference time series through the comparison of three statistical techniques with GIS software:
- inverse distance weighted (IDW) [37]:
= predicted value.
= number of neighboring point used to predict .
= weight assigned to each point considered for the prediction. It depends from the distance of each point to .
= observed value in the location (si).
= distance between predicted and measured location.
= reduction factor of the weight of each data in function of the increasing distance from the predicted location.
- Empirical Bayesian Kriging(EBK) allows an automatic estimate of the semivariogram through GIS software. It is possible to set the number of attempts, 1000 in this case with 60 points in each subset and an overlap factor equal to 1 (empirically demonstrated assessing the greatest minimization of the error). This method is very convenient when the data are non-stationary and with a great extension in the territory, because it uses a local model and, with 1000 attempts, it is possible to obtain the best fit for each value [38].
- ordinary co-kriging method [37]:
= a vector of parameters for the k-th type of variable with the following assumptions:
= a smooth second order stationary process whose range of autocorrelation is detectable with an empirical semivariogram or covariance.
= a smooth second order stationary process whose variogram range is so close to zero that it is shorter than all practical distances between real and predicted data.
Co-kriging in geostatistical analysis is obtained from the linear predictor:
= Cov(zk, S1(s0)) It’s the covariance of zk that it’s the vector observed to the location S1(s0).
= resolution of the matrix between the two Lagrange multipliers.
X = matrix of regression.
Replacing λ gives:
if (this condition shows evidence that the ordinary co-kriging can be seen as a particular case of the universal co-kriging):
= nugget effect, it is composed of microscale variations added to the measurement error (this tool measuring the starting point of the semivariogram is far from the origin of the axis that is the point of null error).
= this coefficient multiplied by allows the definition of .
Empirical Bayesian Kriging was chosen compared to the IDW and co-kriging based on altitude, which is the most correlated topographical parameter [39]. EBK was chosen compared to IDW because of a lower statistical error, while it was chosen for different reasons in comparison with co-kriging. In fact, EBK gives worse results than co-kriging, even if it was much faster in the application (Table 2).

Table 2.
Example of comparison between three interpolation methods for reconstruction of daily temperatures.
The Empirical Bayesian Kriging function was used to calculate the reference time series of both precipitation and temperature. It takes up to the maximum 10 neighbouring weather stations and the simulations were set to 1000. The values of the reference time series were calculated through the interpolation of the neighbouring values, in the same point of the candidate one for each interval of sampling (10 days temperature and monthly precipitations) [40].
This reconstructed reference time series was subtracted from the candidate one for each value of temperature or precipitation in the period of study. Thus, the resulting values were averaged to identify a mean difference between reference and candidate time series for the period of study in each interval of sampling. Lastly, the difference between reference and candidate time series was subtracted from the reference one to predict the values of the candidate in the time intervals where data are missing.
3. Results
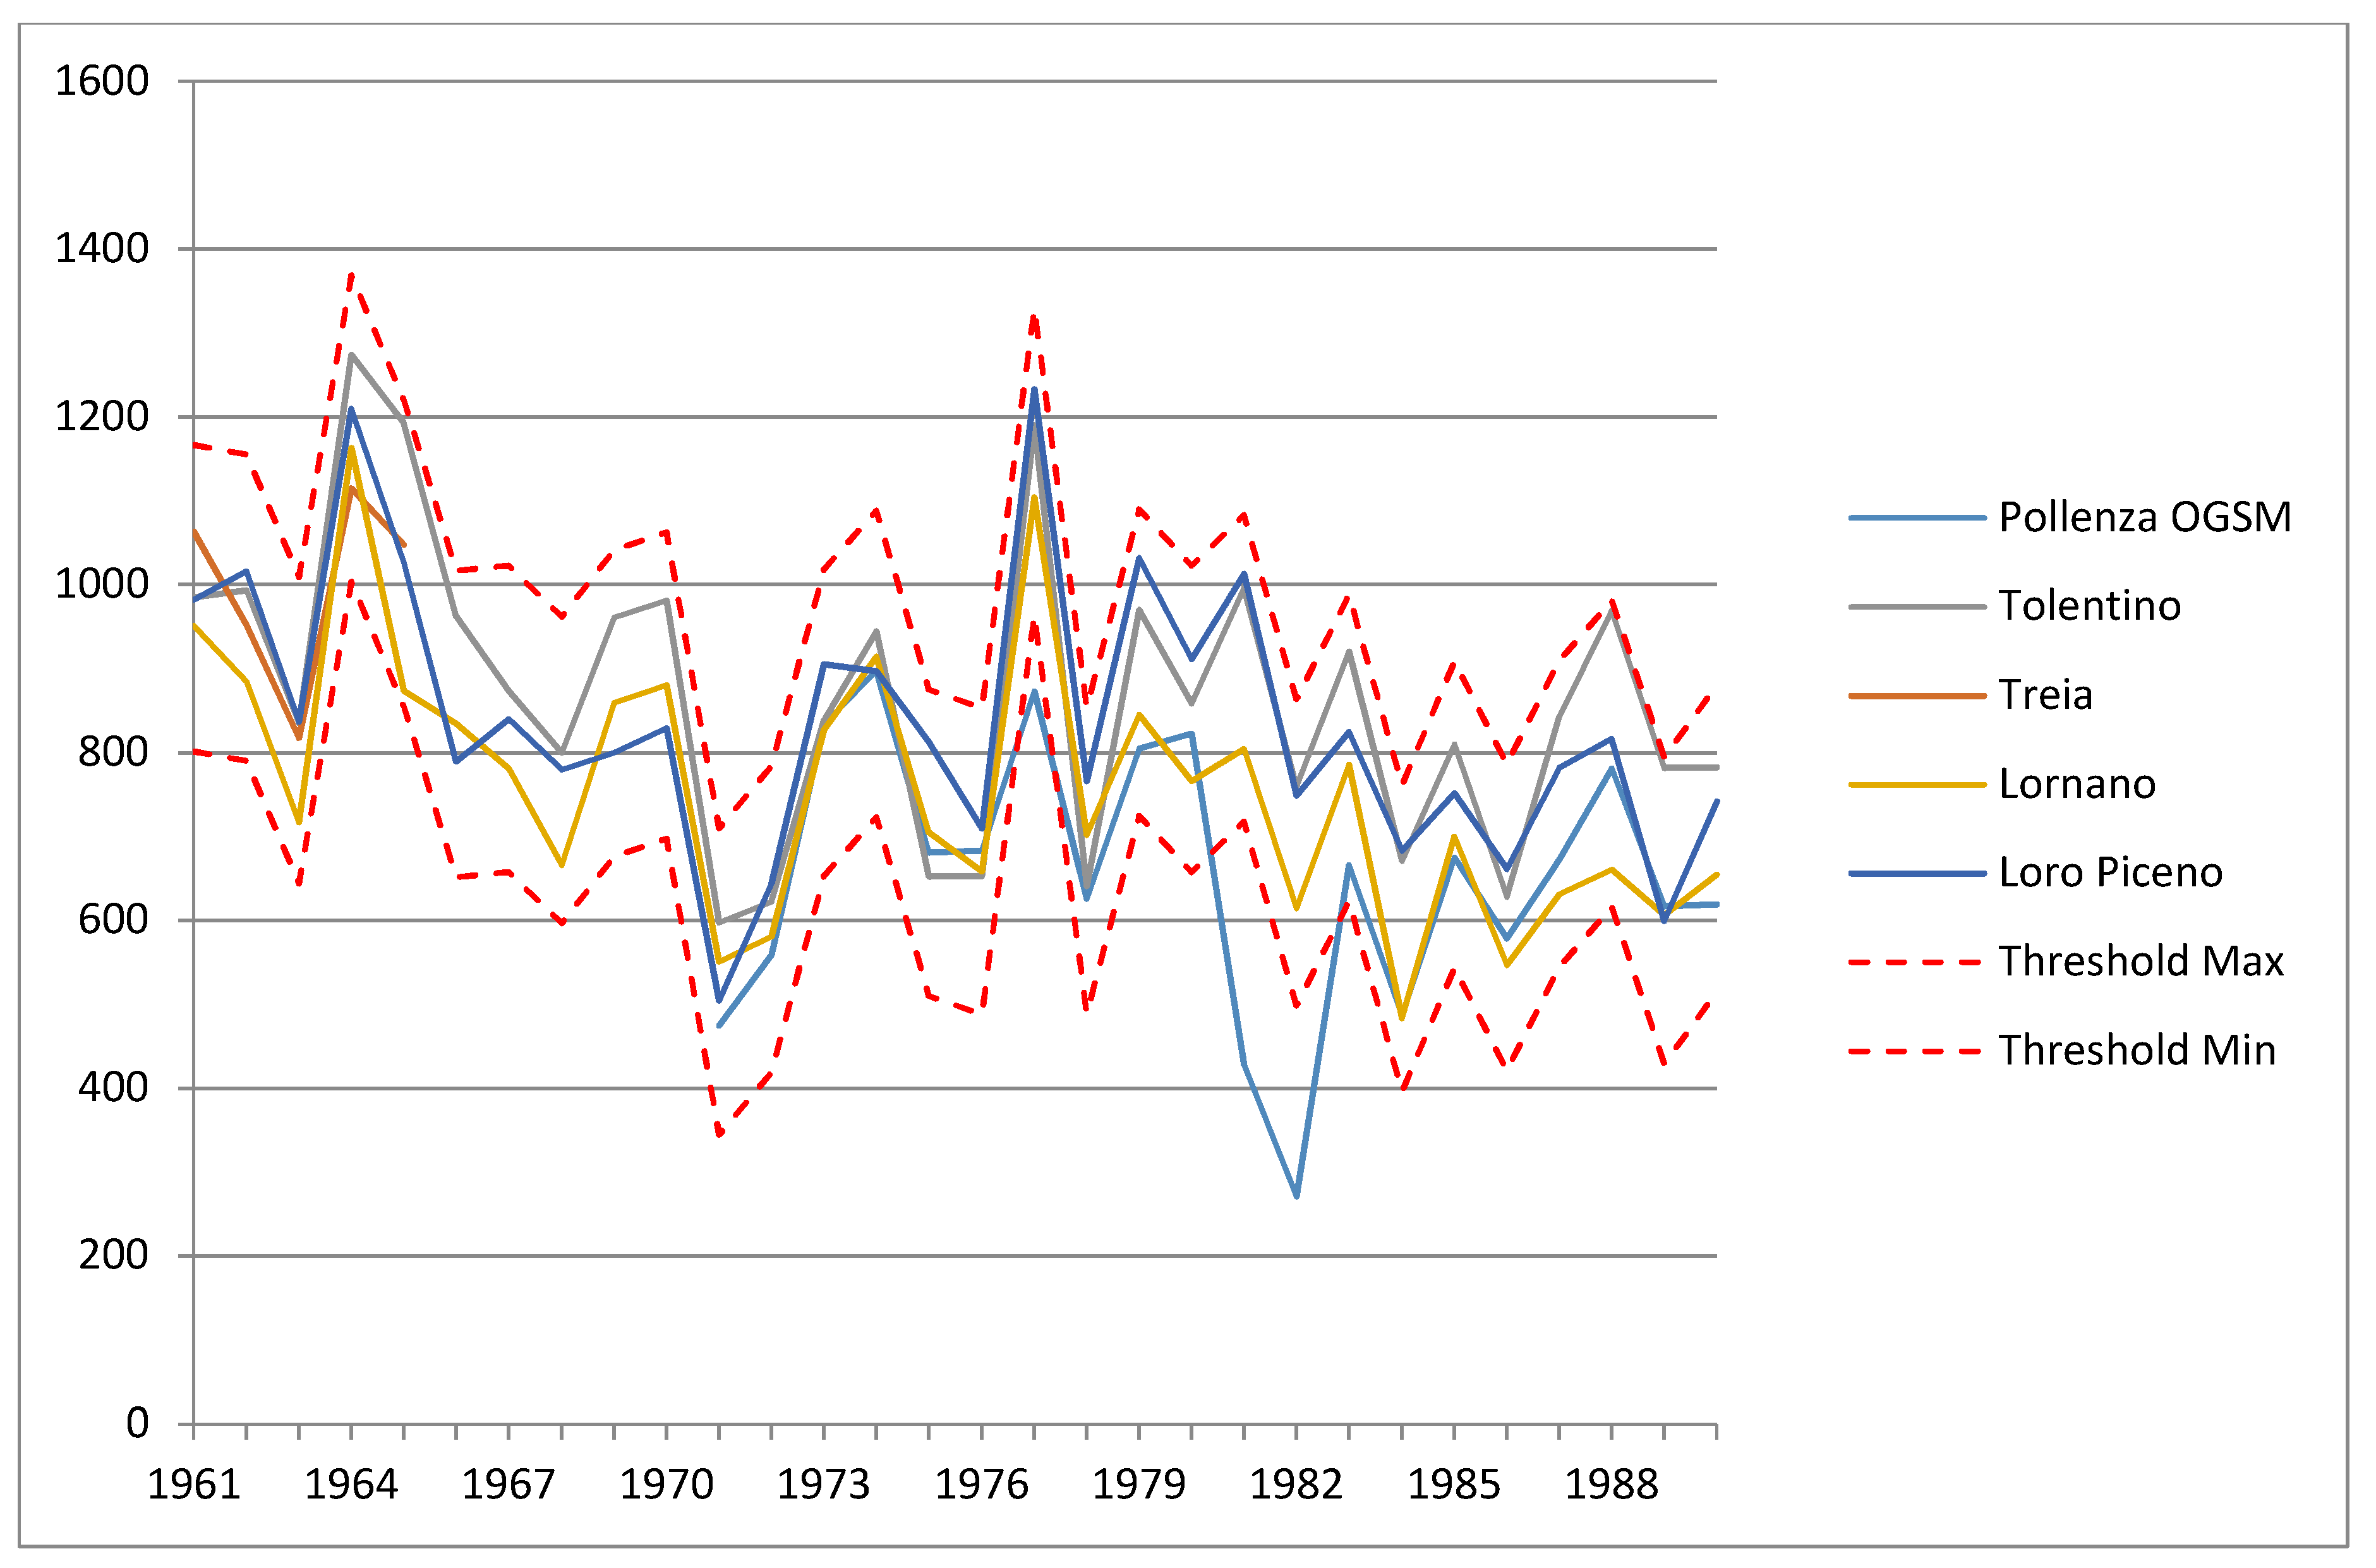
Gross error checking and internal consistency checking detected 75 erroneous data points for temperature and 200 for precipitation. Some of these were typographical errors which have been corrected: thus, only 47 temperature and 152 precipitation data points have been removed (Table 3). The tolerance test has detected several errors in the data, even if in this test there is the chance to have QC = 1 (data under investigation) QC = 0 (correct data). The same codes are detected from the first spatial consistency and the temporal consistency. Finally, with the last spatial consistency the codes are QC = 2 or QC = 0, in order to know if the data under investigation should be deleted or accepted (Figure 3).

Table 3.
Temperature and precipitation data removed after the last spatial consistency (example) from 1931–1960; data removed from temperature QC = 2 T; data removed from precipitation QC = 2 P.
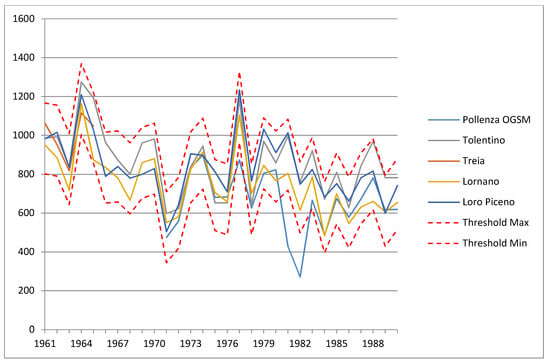
Figure 3.
An example of spatial consistency QC = 2 for Pollenza OGSM in the period 1961–1990.
Therefore, it is useful to assess (Table 4) how many false positive and real positive results were detected in the analysis. Some data after the tolerance test and temporal consistency have been placed under investigation, although most of the QC = 2 have been detected after the spatial consistency.

Table 4.
Summarizing table temperature and precipitation data removed after the spatial consistency check.
The outcome of this analysis is the elimination of 375 records from 1,821,054 (0.02%) temperature data points and 1286 out of 77,021 (1.67%) precipitation data points during the period 1931–2014 in the province of Macerata. Table 5 shows the distribution of temperatures and precipitation in each standard period with the higher amount of incorrect data in the last period, although the most recent period lacks sixyears of data to complete the new reference standard period, as prescribed by the WMO (1991–2020).

Table 5.
Data deleted for each WMO standard period.
However, whilst this augmentation of incorrect data in the last period could be caused by the greater number of weather stations, it could also be due to some weather stations being affected by systematic errors for several years. The increase of incorrect data with the number of rain gauges has also been observed. Furthermore, one of the most important goals is represented by the reconstruction of 112 data points for temperature and 59 for precipitation. In this case, after the definition of the reference weather stations for each candidate one, the Empirical Bayesian Kriging (EBK) process was carried out. The EBK obtained good results after the cross-validation with a test dataset needed to compare the measured value with the predicted one. The difference between the predicted data value and the measured one at the location of the candidate weather station, analysed with statistical operators (mean error (ME), root mean square error (RMSE), average standardized error (ASE), mean standardized error (MSE), root mean square error standardized (RMSSE)) allowed an estimation of the goodness of the interpolation [41]. Temperature and precipitation are both well interpolated by the EBK (Table 6), although the temperature result is definitely better than for precipitation because daily data temperature have been tested, instead of monthly ones for precipitation.

Table 6.
Average results for goodness of reconstruction: statistical operators.
4. Conclusions
This procedure may contribute a standard way to validate and reconstruct climate data. The WMO prescribes some procedures for quality control without specific sequences and operational processes. However, if a standard procedure for each climate or geographical condition was established it should be possible to produce more reliable data for climate analysis. Instead, the data reconstruction can be considered as a standard process that can be used in each region without calibration, provided that an appropriate proximity of weather stations is available. In this case, on the basis of root mean square error observations, the presence of at least five weather stations within a distance of 10 km from the reconstructed one for precipitation, and 20 km for temperature, can be considered adequate. A limit of the quality control method is that it can be applied only in regions with temperate climate, as the thresholds used to analyse the data take into account the variability of typical temperate zones. However, this procedure can be a useful tool to validate data under different climate patterns after an accurate calibration. It is also important to note that spatial consistency analysis can adequately assess the values of mountain weather stations. In fact, the percentage of data with QC = 2 is the same for all weather stations and for mountain weather stations as far as temperatures are concerned. For precipitation, the percentage with code QC = 2 is clearly increasing, probably due to strong winds thatdo not allow a correct calculation of the rain, which is always underestimated. In fact, the precipitation values of mountain weather stations are, in some cases, lower than those of the hills and this may be a point to investigate further. In conclusion, these procedures are indispensable for climate and for all sciences in which data can be affected by errors, to obtain an analysis of proven accuracy.
Author Contributions
M.G., M.B., P.B. and F.’. analyzed data. M.G. and M.B. conceived and designed the experiments. M.G. and F.D’. wrote the paper. P.B. checked the language.
Acknowledgments
No funds of any kind have been received for this study.
Conflicts of Interest
The authors declare no conflict of interest.
References
- Cressman, G.P. An operational objective analysis system. Mon. Weather Rev. 1959, 87, 367–374. [Google Scholar] [CrossRef]
- Zahumenský, I. Guidelines on Quality Control Procedures for Data from Automatic Weather Stations; WMO (World Meteorological Organization): Geneva, Switzerland, 2004. [Google Scholar]
- Filippov, V.V. Quality Control Procedures for Meteorological Data; Tech. Rep. 26; WMO (World Meteorological Organization): Geneva, Switzerland, 1968. [Google Scholar]
- Eischeid, J.K.; Bruce Baker, C.; Karl, T.R.; Diaz, H.F. The Quality Control of Long-Term Climatological Data Using Objective Data Analysis. J. Appl. Meteorol. 1995, 34, 2787–2795. [Google Scholar] [CrossRef] [Green Version]
- Boyer, T.; Levitus, S. Quality Control and Processing of Historical Oceanographic Temperature, Salinity, and Oxygen Data; NOAA Technical Report NESDIS 81: Washington, DC, USA, 1994. [Google Scholar]
- Peterson, T.C.; Vose, R.; Schmoyer, R.; Razuvaëv, V. Global historical climatology network (GHCN) quality control of monthly temperature data. Int. J. Climatol. 1998, 18, 1169–1179. [Google Scholar] [CrossRef] [Green Version]
- Meek, D.W.; Hatfield, J.L. Data quality checking for single station meteorological databases. Agric. For. Meteorol. 1994, 36, 85–109. [Google Scholar] [CrossRef]
- Cheng, A.R.; Lee, T.H.; Ku, H.I.; Chen, Y.W. Quality Control Program for Real-Time Hourly Temperature Observation in Taiwan. J. Atmos. Ocean. Technol. 2016, 33, 953–976. [Google Scholar] [CrossRef]
- Qi, Y.; Martinaitis, S.; Zhang, J.; Cocks, S. A Real-Time Automated Quality Control of Hourly Rain Gauge Data Based on Multiple Sensors in MRMS System. J. Hydrometeor. 2016, 17, 1675–1691. [Google Scholar] [CrossRef]
- Svensson, P.; Björnsson, H.; Samuli, A.; Andresen, L.; Bergholt, L.; Tveito, O.E.; Agersten, S.; Pettersson, O.; Vejen, F. Quality Control of Meteorological Observations. Available online: https://www.researchgate.net/publication/238738578_Quality_Control_of_Meteorological_Observations_Description_of_potential_HQC_systems (accessed on 3 June 2018).
- Boulanger, J.P.; Aizpuru, J.; Leggieri, L.; Marino, M. A procedure for automated quality control and homogenization of historical daily temperature and precipitation data (APACH): Part 1: Quality control and application to the Argentine weather service stations. Clim. Chang. 2010, 98, 471–491. [Google Scholar] [CrossRef]
- Acquaotta, F.; Fratianni, S.; Venema, V. Assessment of parallel precipitation measurements networks in Piedmont, Italy. Int. J. Climatol. 2016, 36, 3963–3974. [Google Scholar] [CrossRef]
- Mekis, E.; Vincent, L. An overview of the second generation adjusted daily precipitation dataset for trend analysis in Canada. Atmos. Ocean 2011, 2, 163–177. [Google Scholar] [CrossRef]
- Sciuto, G.; Bonaccorso, B.; Cancelliere, A.; Rossi, G. Probabilistic quality control of daily temperature data. Int. J. Climatol. 2013, 33, 1211–1227. [Google Scholar] [CrossRef]
- Wang, X.; Chen, H.; Wu, Y.; Feng, Y.; Pu, Q. New techniques for the detection and adjustment of shifts in daily precipitation data series. J. Appl. Meteorol. Climatol. 2010, 49, 2416–2436. [Google Scholar] [CrossRef]
- Alexander, L.; Yang, H.; Perkins, S. ClimPACT—Indices and Software in User Manual. In Guide to Climatological Practices; WMO (World Meteorological Organization): Geneva, Switzerland, 2009; Available online: http://www.wmo.int/pages/prog/wcp/ccl/opace/opace4/meetings/documents/ETCRSCI_software_documentation_v2a.doc (accessed on 3 June 2018).
- Aguilar, E.; Auer, I.; Brunet, M.; Peterson, T.C.; Wieringa, J. Guidance on Metadata and Homogenization; WMO (World Meteorological Organization): Geneva, Switzerland, 2003. [Google Scholar]
- Jeffrey, S.J.; Carter, J.O.; Moodie, K.B.; Beswick, A.R. Using spatial interpolation to construct a comprehensive archive of Australian climate data. Environ. Model Softw. 2001, 16, 309–330. [Google Scholar] [CrossRef]
- Coulibaly, P.; Evora, N.D. Comparison of neural network methods for infilling missing daily weather records. J. Hydrol. 2007, 341, 27–41. [Google Scholar] [CrossRef]
- Eccel, E.; Cau, P.; Ranzi, R. Data reconstruction and homogenization for reducing uncertainties in high-resolution climate analysis in Alpine regions. Theor. Appl. Climatol. 2012, 110, 345–358. [Google Scholar] [CrossRef] [Green Version]
- Mitchel, A. The ESRI Guide to GIS analysis, volume 2: Spatial measurements and statistics. In ESRI Guide GIS Analysis; FAO: Rome, Italy, 2005. [Google Scholar]
- Kolahdouzan, M.; Shahabi, C. Voronoi-based k nearest neighbor search for spatial network databases. In Proceedings of the Thirtieth International Conference on Very Large Data Bases-Volume 30; VLDB Endowment: San Jose, CA, USA, 2004; pp. 840–851. [Google Scholar]
- Köppen, W. Versuch einer Klassifikation der Klimate, vorzugsweise nach ihren Beziehungen zur Pflanzenwelt. Geogr. Zeitschr. 1900, 6, 593–611. [Google Scholar]
- Geiger, R. Landolt-Börnstein—Zahlenwerte und Funktionenaus Physik, Chemie, Astronomie, Geophysik und Technik; alte Serie Vol. 3; der Klimatenach, C.K., Köppen, W., Eds.; Springer: Berlin, Germany, 1954; pp. 603–607. [Google Scholar]
- Fratianni, S.; Acquaotta, F. Landscapes and Landforms of Italy; Marchetti, M., Soldati, M., Eds.; Springer: Berlin, Germany, 2017; pp. 29–38. [Google Scholar]
- Tobler, W.R. A computer movie simulating urban growth in the Detroit region. Econ. Geogr. 1970, 46, 234–240. [Google Scholar] [CrossRef]
- Grykałowska, A.; Kowal, A.; Szmyrka-Grzebyk, A. The basics of calibration procedure and estimation of uncertainty budget for meteorological temperature sensors. Meteorol. Appl. 2015, 22, 867–872. [Google Scholar] [CrossRef] [Green Version]
- Martin, W.B.; Gnanadesikan, R. Probability plotting methods for the analysis for the analysis of data. Biometrika 1968, 55, 1–17. [Google Scholar]
- Lilliefors, H.W. On the Kolmogorov-Smirnov test for normality with mean and variance unknown. J. Am. Stat. Assoc. 1967, 62, 399–402. [Google Scholar] [CrossRef]
- Hae-Young, K. Statistical notes for clinical researchers: Assessing normal distribution (2) using skewness and kurtosis. Restor. Dent. Endod. 2013, 38, 52–54. [Google Scholar]
- Hackshaw, A. Statistical Formulae for Calculating Some 95% Confidence Intervals. In A Concise Guide to Clinical Trials; Wiley-Blackwell: West Sussex, UK, 2007; pp. 205–207. [Google Scholar]
- Omar, M.H. Statistical Process Control Charts for Measuring and Monitoring Temporal Consistency of Ratings. J. Educ. Meas. 2010, 47, 18–35. [Google Scholar] [CrossRef]
- Schönwiese, C.D. Praktische Methoden für Meteorologen und Geowissenschaftler; Schweizerbart Science Publishers: Stuttgart, Germany, 2006; pp. 232–234. [Google Scholar]
- Bono, E.; Noto, L.; La Loggia, G. Tecniche di analisi spaziale per la ricostruzione delle serie storiche di dati climatici. In Atti del Convegno 9a Conferenza Nazionale ASITA; CINECA IRIS: Catania, Italy, 2005. [Google Scholar]
- Easterling, D.R.; Peterson, T.C. A new method for detecting undocumented discontinuities in climatological time series. Int. J. Clim. 1995, 15, 369–377. [Google Scholar] [CrossRef]
- Jung-Woo, K.; Pachepsky, Y.A. Reconstructing missing daily precipitation data using regression trees and artificial neural networks for SWAT stream flow simulation. J. Hydrol. 2010, 394, 305–314. [Google Scholar]
- Johnston, K.; VerHoef, J.M.; Krivoruchko, K.; Lucas, N. Appendix A. In Using ArcGIS Geostatistical Analyst; ESRI: Redlands, CA, USA, 2001; pp. 247–273. [Google Scholar]
- Krivoruchko, K. Empirical Bayesian Kriging; Esri: Redlands, CA, USA, 2012. [Google Scholar]
- Gentilucci, M.; Bisci, C.; Burt, P.; Fazzini, M.; Vaccaro, C. Interpolation of Rainfall Through Polynomial Regression in the Marche Region (Central Italy). In Lecture Notes in Geoinformation and Cartography; Mansourian, A., Pilesjö, P., Harrie, L., van Lammeren, R., Eds.; Springer: Cham, Switzerland, 2018. [Google Scholar]
- Vicente-Serrano, S.M.; Beguería, S.; López-Moreno, J.I.; García-Vera, M.A.; Stepanek, P. A complete daily precipitation database for northeast Spain: Reconstruction, quality control, and homogeneity. Int. J. Climatol. 2010, 30, 1146–1163. [Google Scholar] [CrossRef] [Green Version]
- Robinson, T.P.; Metternicht, G. Testing the performance of spatial interpolation techniques for mapping soil properties. Comput. Electron. Agric. 2006, 50, 97–108. [Google Scholar] [CrossRef]
© 2018 by the authors. Licensee MDPI, Basel, Switzerland. This article is an open access article distributed under the terms and conditions of the Creative Commons Attribution (CC BY) license (http://creativecommons.org/licenses/by/4.0/).

