Article

Response of Soils and Soil Ecosystems to the Pennsylvanian–Permian Climate Transition in the Upper Fluvial Plain of the Dunkard Basin, Southeastern Ohio, USA

by
Daniel I. Hembree
* and
Jennifer L. Carnes
Department of Geological Sciences, Ohio University, 316 Clippinger Laboratories, Athens, OH 45701, USA
*
Author to whom correspondence should be addressed.
Geosciences 2018, 8(6), 203; https://doi.org/10.3390/geosciences8060203
Submission received: 1 May 2018 / Revised: 30 May 2018 / Accepted: 1 June 2018 / Published: 5 June 2018
(This article belongs to the Section Biogeosciences)

Abstract

:
Direct exposure of paleosols to the atmosphere during formation make them ideal for reconstructing paleoclimate. Paleosol and ichnofossil properties are dependently linked making it important to study them in tandem, to avoid errors in interpretation. Small scale studies (<1 km) yield high resolution data that can be used to assess allogenic processes through comparison of spatial and temporal trends. This study used field and laboratory analyses to gather data from Late Pennsylvanian to Early Permian Upper Monongahela and Lower Dunkard group paleosols on Ohio Route 33 in Meigs County, OH, USA. The physical and geochemical properties of the paleosols from the field sites indicate that channel migration was the primary control on paleosol formation in the study area, however, a clear climate signal was observed. The change in paleosol type and calculated mean annual precipitation (MAP) values indicate that the climate became more strongly seasonal and drier over the course of the Pennsylvanian–Permian transition with a temporary excursion to a more ever-wet climate with higher MAP, marked by the occurrence of the Waynesburg Coal at the Pennsylvanian–Permian boundary.

1. Introduction

Paleosols and continental ichnofossils are vital to the interpretation of terrestrial paleoenvironments and paleoecosystems as well as paleoclimate. The direct exposure of soils to the atmosphere during formation makes paleosols an indispensable tool in the reconstruction of paleoclimate [1,2,3,4,5,6,7]. However, soil formation is not exclusively influenced by climate; it is also a function of organisms, topography, parent material and time [1]. Autogenic processes, such as local hydrology or topography, produce complex variation in paleosols within and between environments, e.g., [1,2,3,4,5]. This variability necessitates the distinction of the products of both autogenic and allogenic processes within the soil system in order to accurately identify paleoclimate signatures. Lateral and vertical variation in paleosols identified in small-scale studies (<1 km) can be compared to evaluate the average response of soils and their ecosystems to allogenic processes over time, i.e., [6,7]. The small-scale study approach yields high resolution data normally not available from studies involving outcrops spread over larger geographic areas. Small-scale studies are vital for understanding paleosols because lateral changes in hydrology, local topography, sediment source area, proximity to channels, and organisms all affect the physical and chemical composition of soils and soil organisms [6].
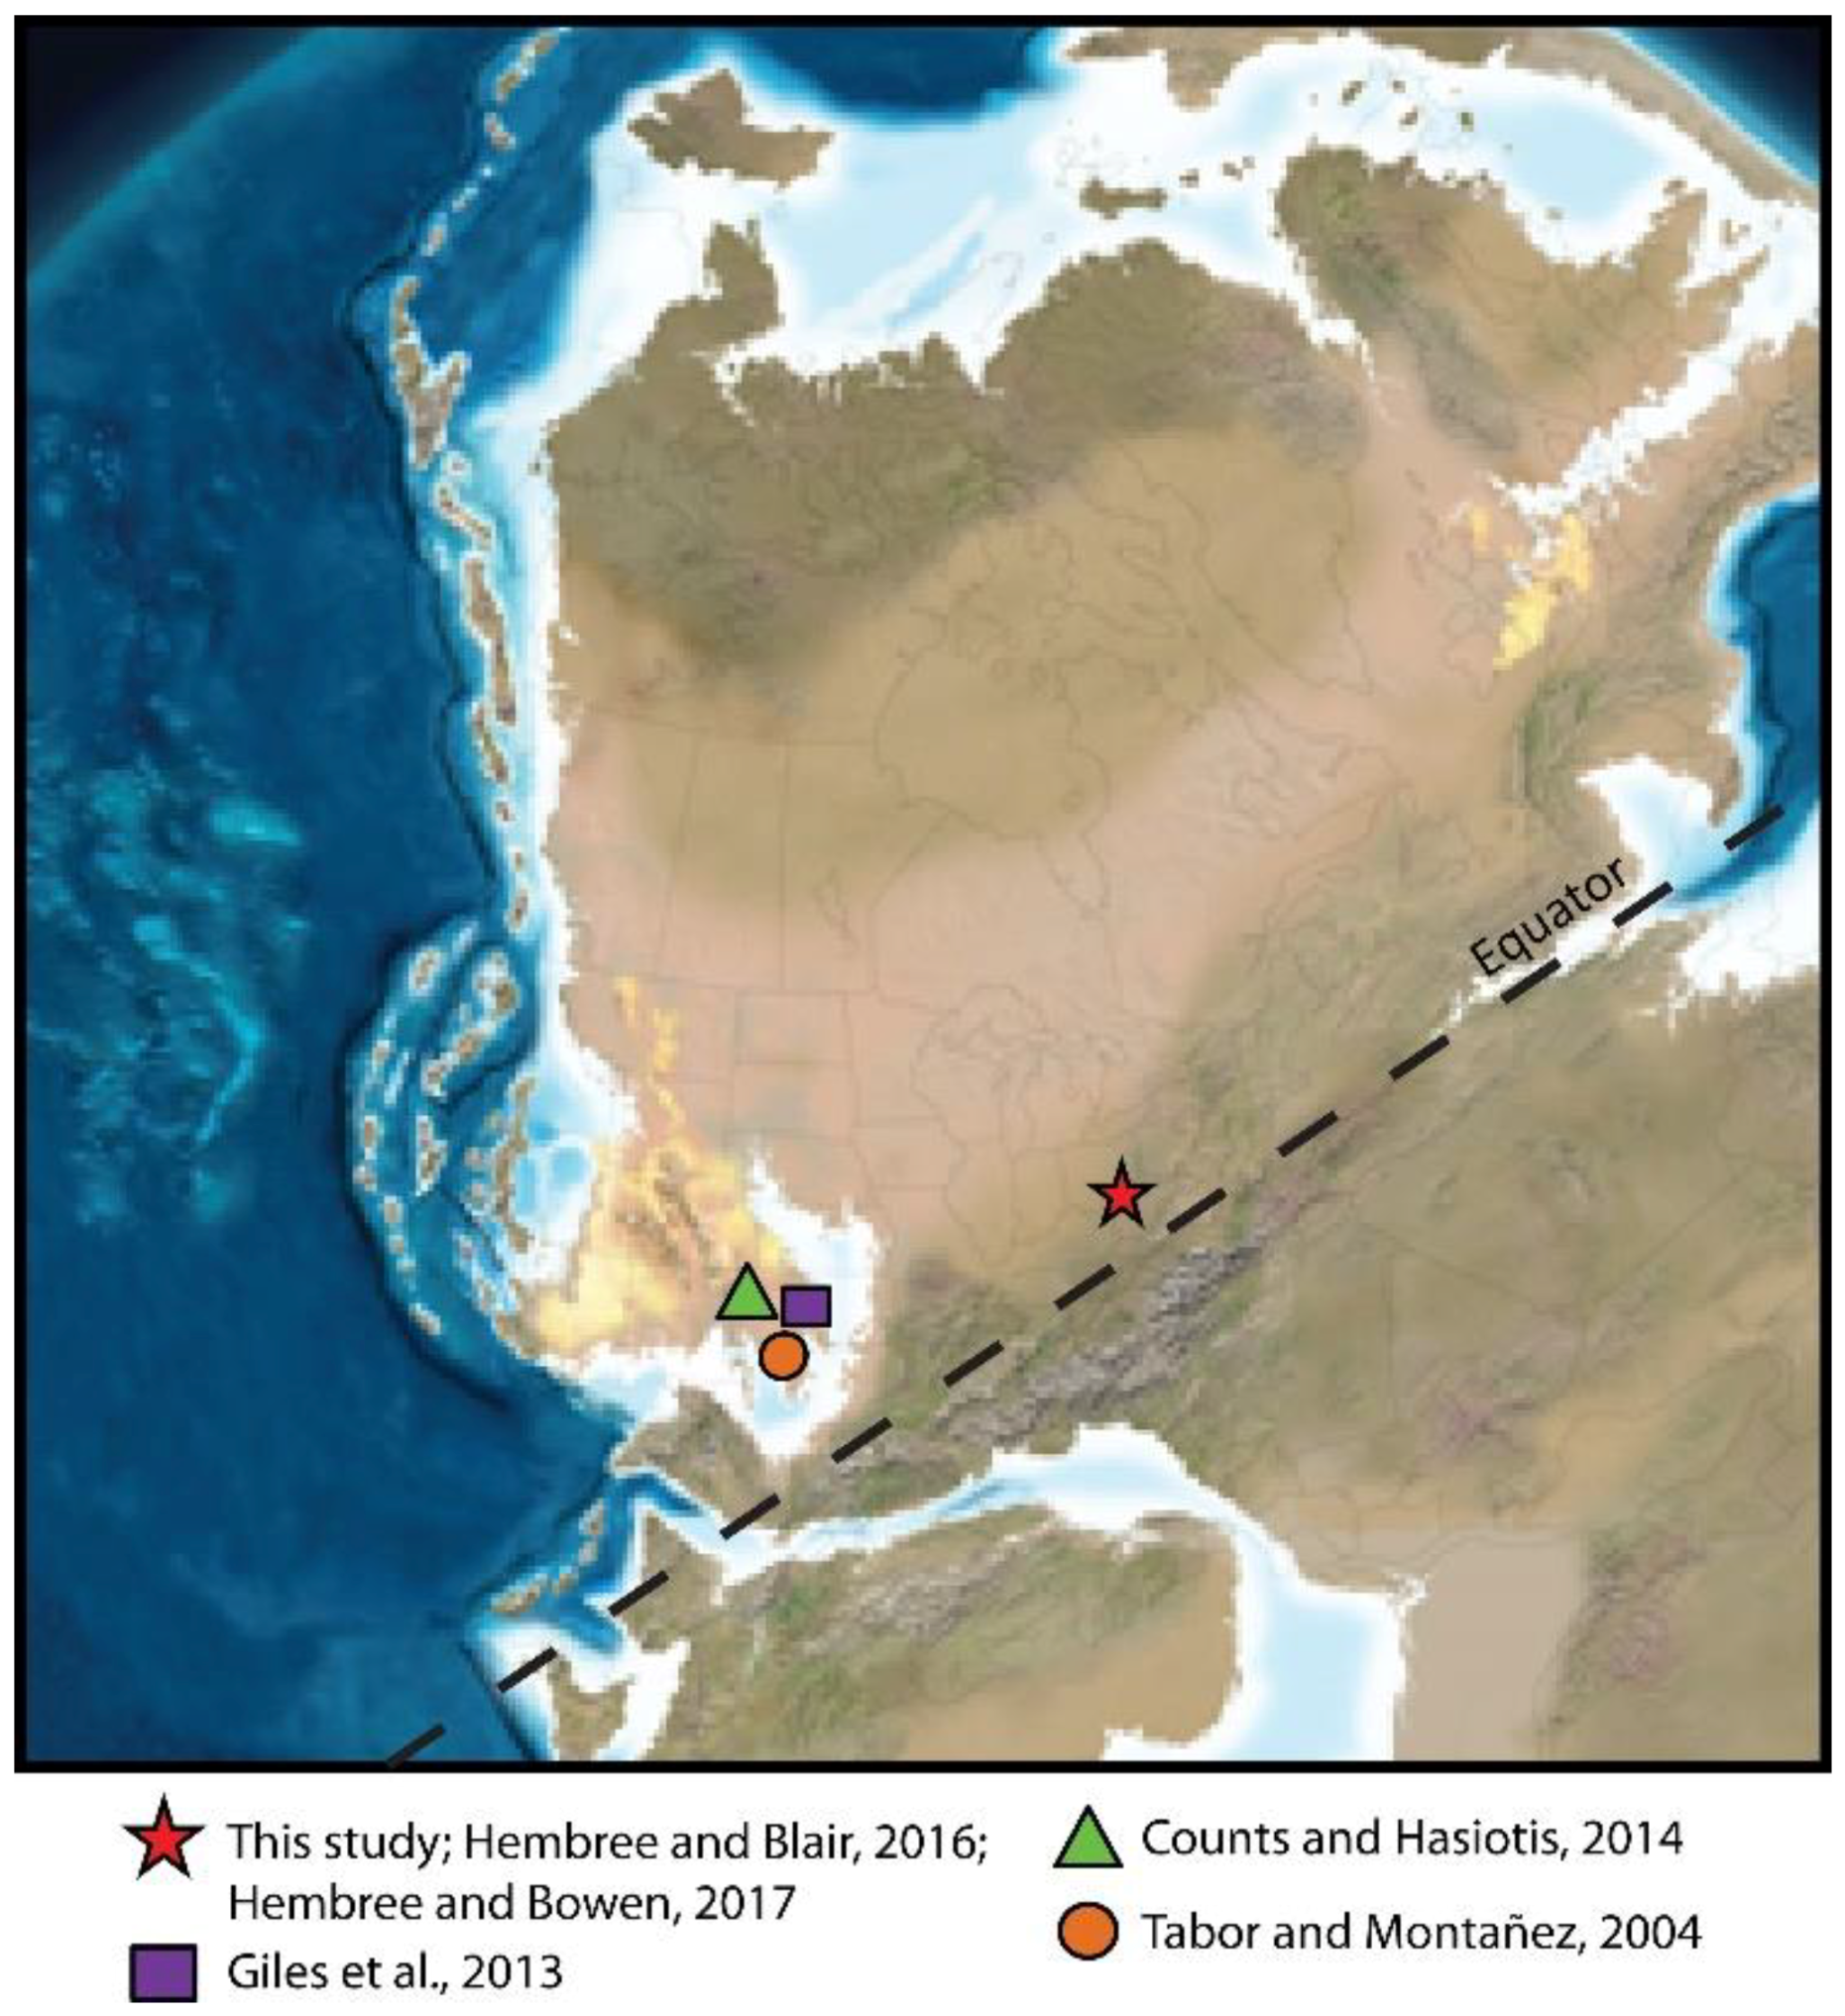
The goal of this study was to use the small-scale study approach to identify the average response of soils and soil ecosystems to climatic variation in the Dunkard Basin during the Late Pennsylvanian–Early Permian period. This was achieved through investigation of Upper Monongahela and Lower Dunkard group paleosols and associated ichnofossils exposed in a series of three closely spaced roadcuts in Meigs County, southeastern Ohio (Figure 1). Four main hypotheses were tested in this study: (1) lateral and vertical changes in ichnofossil assemblages largely result from autogenic processes such as channel migration or changes in depth to the water table, which affect the type and maturity of soils, as well as, the type and distribution of plants and soil animals; (2) allogenic processes associated with a shift to a drier, more seasonal climate overprint autogenically controlled vertical changes in paleosol properties and ichnofossil assemblages; (3) paleosols and ichnofossil assemblages in the study area exhibit properties of being drier and better drained than those described by Hembree and Bowen [8] from more lowland settings to the north; (4) paleosols exhibit pedogenic features similar to those of contemporaneous paleosols described from continental basins in the western United States reflecting the same regional-scale change in climate [9,10,11]; however, differences in autogenic processes as well as the effects of other allogenic processes, such as eustasy, produce some variations in paleosol properties.

2. Geologic Setting

Monongahela and Dunkard Groups

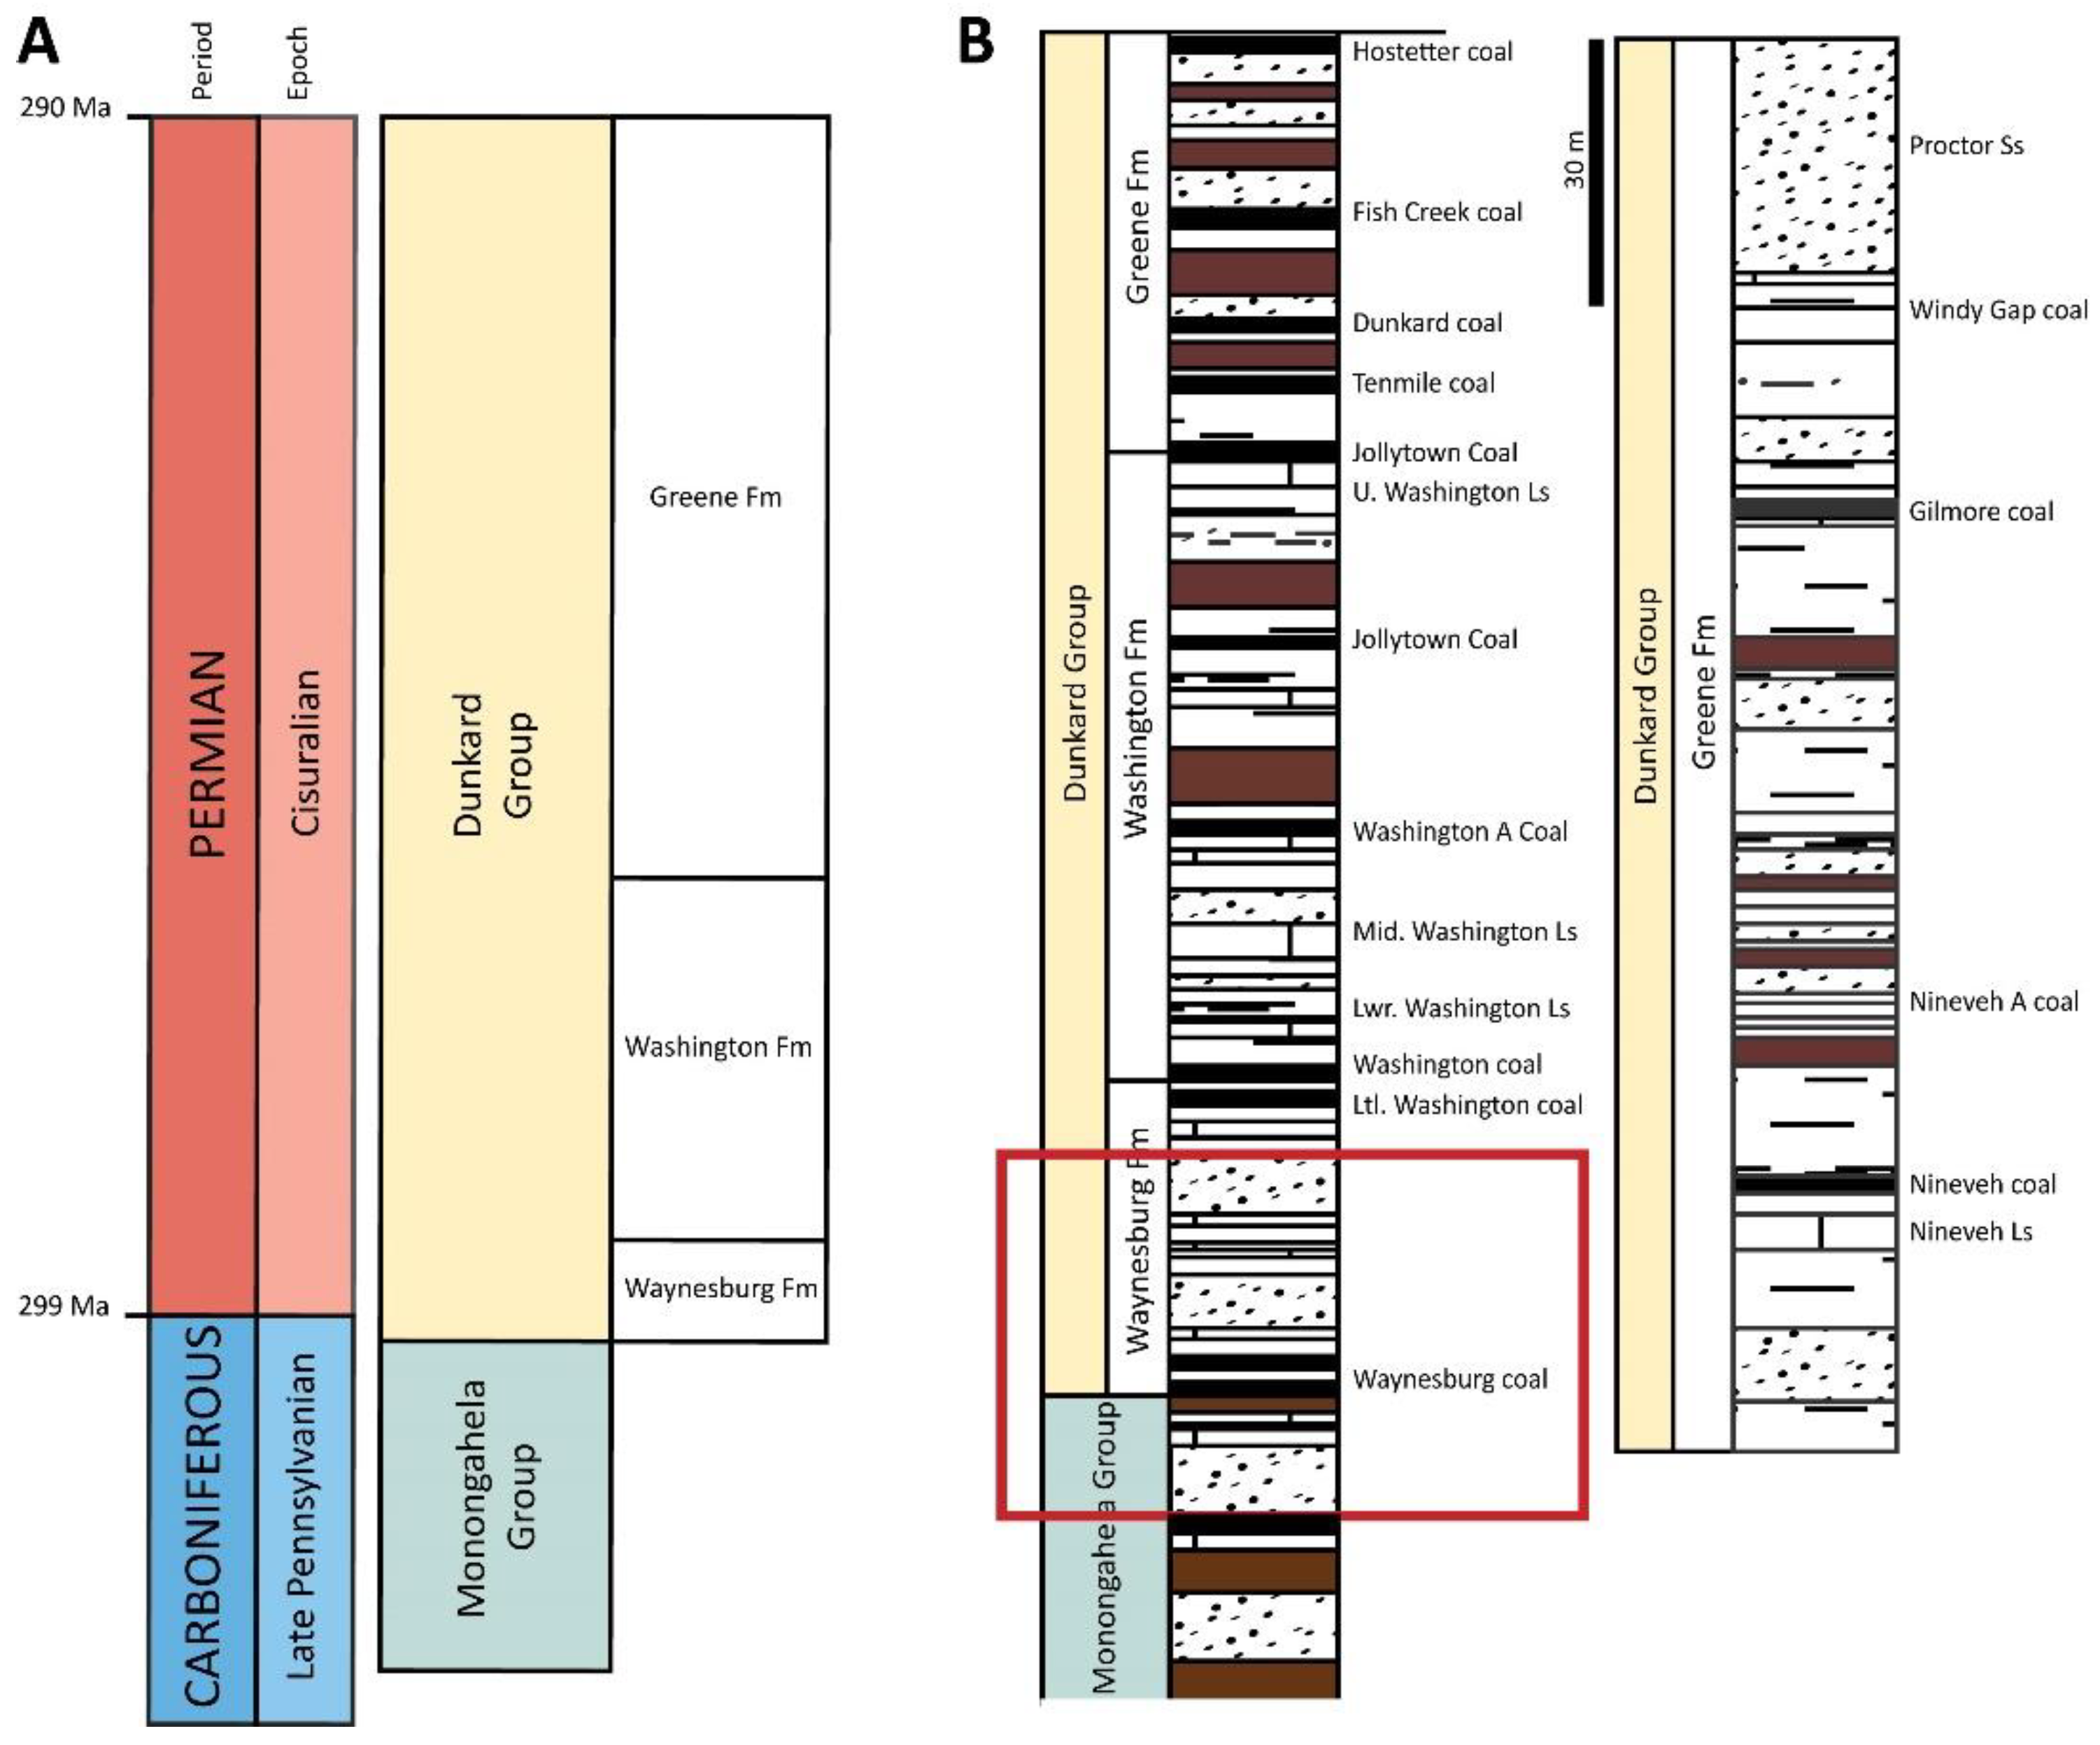
Underlying parts of Ohio, West Virginia, Pennsylvania and Maryland, the Late Pennsylvanian Monongahela Group is ~80–125 m thick and consists of coal, clastics, and lacustrine limestone [13]. The Late Pennsylvanian–Early Permian Dunkard Group overlies the Monongahela Group and consists of up to 360 m of coal, clastics and carbonates deposited in a continental basin that now crops out in Ohio, Pennsylvania, and West Virginia spanning ~12,800 km2 [5,12,13]. The base of the Dunkard Group is defined as the Waynesburg coal (Figure 2) [5,12,14]. A recent vertebrate study by Lucas [15] concluded that the entire Dunkard Group is likely Early Permian and includes the Wolfcampian–Leonardian boundary based on comparison with the Coyotean fauna from Archer City Formation in Texas. Likewise, the occurrence of Sysciophlebia balteata in the Cassville Shale near the base of the Washington Formation has been used to suggest an Early Permian (Asselian-Sakmarian) age for the Dunkard Group since the first known appearance of S. balteata is in the Asselian [16]. Previously, the absence of conifer pollen in the Dunkard Group has been used to infer a Pennsylvanian age [17,18]; however, Eble et al. [19] showed the absence of conifer pollen is likely a sampling bias and that Pennsylvanian flora persisted into the Permian where local conditions were favorable.
The Monongahela and Dunkard groups consist of fluvial sandstone, bedded shales, paleosols, coal and lacustrine limestone [12,14,20]. Coals of the Monongahela are generally thick and laterally continuous, whereas Dunkard coals are thin and laterally discontinuous [13]. Monongahela and Dunkard strata were deposited in an elliptical basin that parallels the Appalachian fold belt (Figure 1A) [12,13]. The Dunkard Basin averaged a northwest paleocurrent during the Permian and sediment input was primarily from the Allegheny Mountains to the southeast [12]. Input from a northern source may have been dominant during the deposition of the underlying Monongahela Group [12].
The Dunkard Basin is divided into three facies provinces based on lateral variation in lithology: a southern upper fluvial plain, central lower fluvial plain and a northern fluvial-lacustrine-deltaic plain (Figure 1A) [12]. The upper fluvial plain is dominated by sandstone as well as red mudstones that contain carbonate nodules and vertic features representing well-drained paleosols [12,14]. The lower fluvial plain consists of a few discontinuous coals, sandstone, and lacustrine limestones, as wells as red mudstones that transition northward to drab gray-green mudstones representing a lateral shift to more water-saturated conditions [12,14]. The fluvial-lacustrine-deltaic plain contains abundant lacustrine limestone and coal as well as a few drab gray-green mudstone and sandstone interpreted as being deposited in an anastomosing river system where the water table was very near the surface [12,14]. These facies changes reflect differences in local topography and hydrology from more highland settings in the south to more lowland settings in the north, consistent with a northwest paleocurrent [12].
During the Late Pennsylvanian, the study area was located at approximately 7°S paleolatitude and to the northwest of the epicenter of the Allegheny orogeny; by the early Permian the region was located between 15° N and S (Figure 3) [5,12,21]. Climate was the main allogenic process affecting variations in paleosol development in the Dunkard Basin [5]. Climate, especially the annual amount and distribution of precipitation an area receives, impacts terrestrial organic productivity, sediment supply, pedogenesis, geochemistry and molecular weathering ratios, as well as, soil moisture and local base level [2,3,5]. Tectonic subsidence governs accommodation and basin architecture, however, faulting and deformation seem to have been absent in the Appalachian Basin during the time of Dunkard deposition [5]. Sea level change was also not a factor in the formation of Dunkard strata due to the basin’s location in the continental interior of Pangea [5]. The exclusion of tectonics and glacioeustasy as major allogenic processes in the formation of Dunkard paleosols enables the refinement of paleoclimate at the time of deposition. The usefulness of paleosols in the reconstruction of Late Paleozoic climate has been demonstrated by several studies [9,10,11,22]; however, few have focused on the Appalachian Basin.

3. Methods

3.1. Field Methods

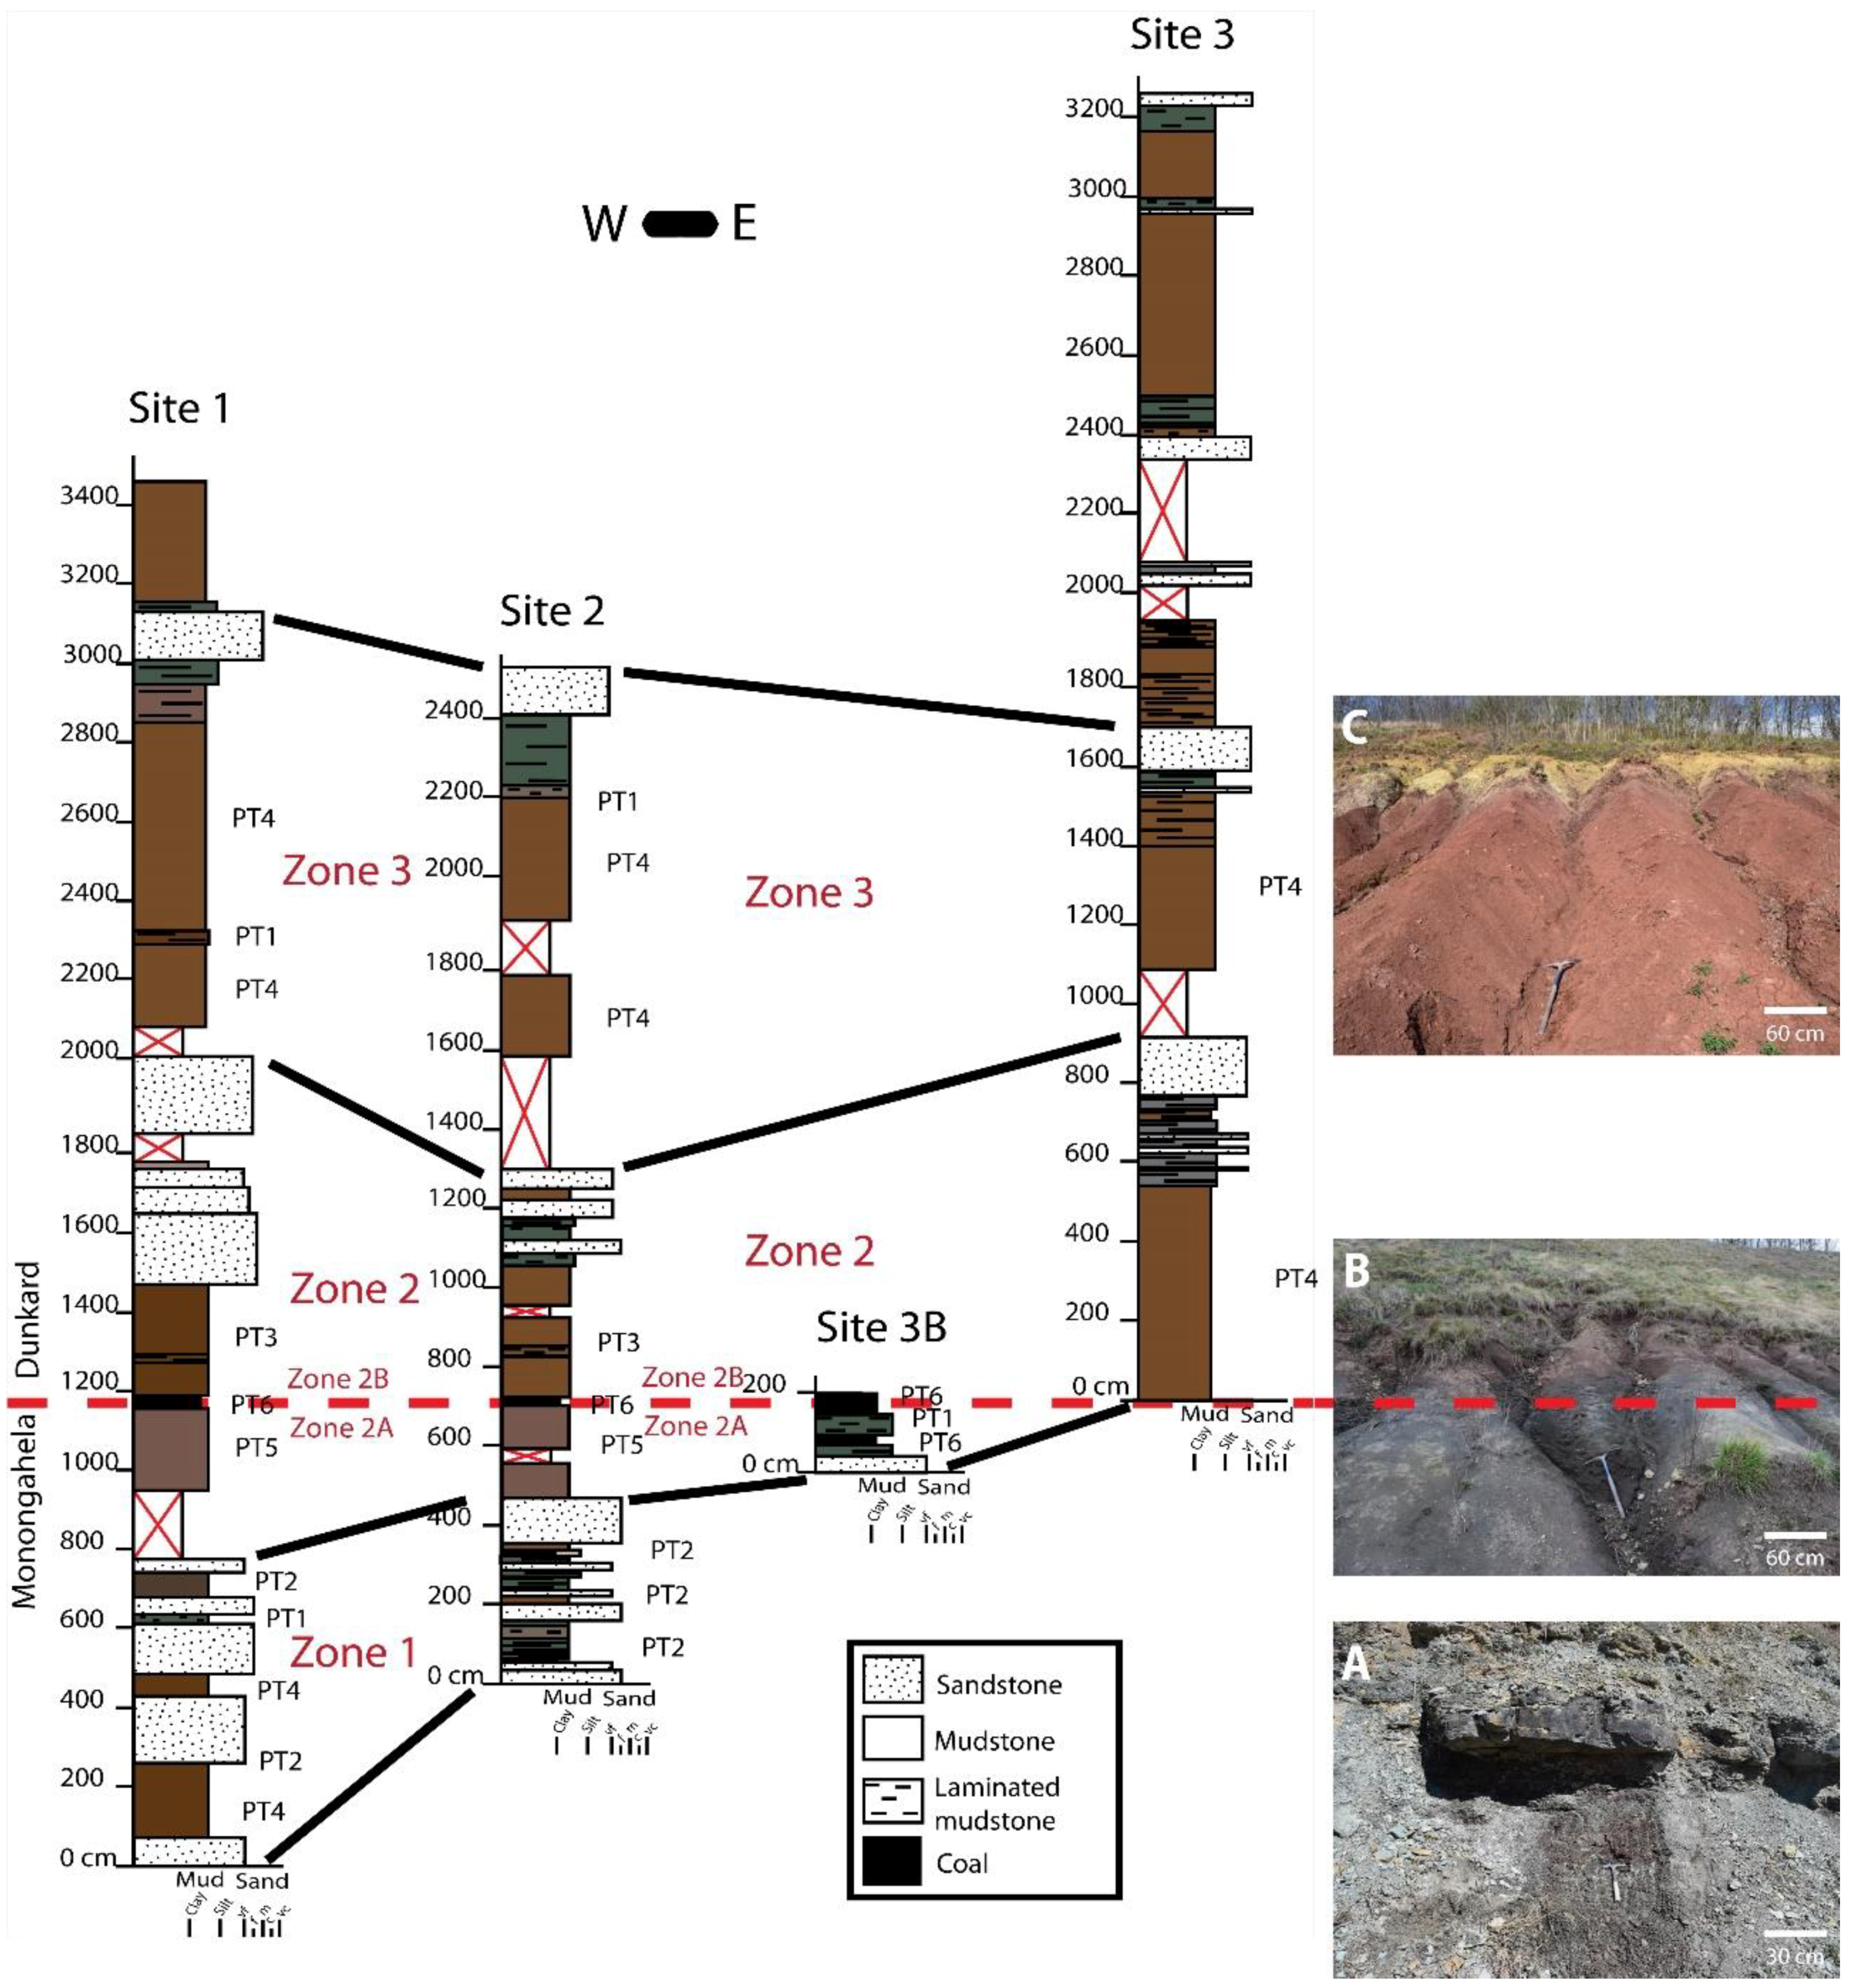
Physical and chemical properties of paleosols and ichnofossils were examined at outcrop, hand sample, and thin section scales. The study area consisted of three northwest-southeast trending outcrops in Meigs County, Ohio along ~1300 m of Ohio Route 33 near the West Virginia border (Figure 1). This site was chosen due to its excellent exposure of multiple paleosols and presence of Monongahela-Dunkard group contact contemporaneous to the site explored by Hembree and Bowen [8] allowing direct comparison between sites. Both studies involve strata deposited in the upper fluvial plain of the Late Pennsylvanian–Early Permian Dunkard Basin, i.e., [12]. The three outcrops were designated as Sites 1, 2, and 3 from west to east and are located at ~38°57′56″N, 81°49′34″W; ~38°57′49″N, 81°49′23″W; and ~38°57′31″N, 81°49′12″W, respectively (Figure 1B). Site 1 has a length of ~250 m and a height of ~35 m, Site 2 has a length of ~224 m and a height of ~40 m, and Site 3 has a length of ~200 m and a height of ~43 m. One stratigraphic section was constructed near the center of each outcrop, documenting major lithologies and identifying paleosols. Paleosol sections from three observed paleosol-bearing zones (Zones 1–3) separated by laterally continuous sandstone beds, were excavated in 2 m wide and ~20–30 cm deep trenches for detailed study and sampling (Figure 1C). Properties including the nature of contacts, lithology, color, structure, horizons, and ichnofossils were described every 20–40 vertical cm (20 cm most commonly) and detailed sections were created. Color was described from moist surfaces using the Munsell color chart [24]. Ichnofossils including rhizohaloes, rhizoconcretions, root casts, and passively filled burrows (thin section only) were described (morphology, size, branching, lining, bioglyphs, fill, and color variation) and the representative behaviors and potential tracemakers were interpreted based on comparison with the results of previous studies of rhizoliths and neoichnological studies. The distribution and density of rhizoliths every 20 vertical cm was determined for each paleosol section. Samples were taken every 20–40 vertical cm from paleosols for X-ray fluorescence, X-ray diffraction, and thin section analyses.

3.2. Laboratory Methods

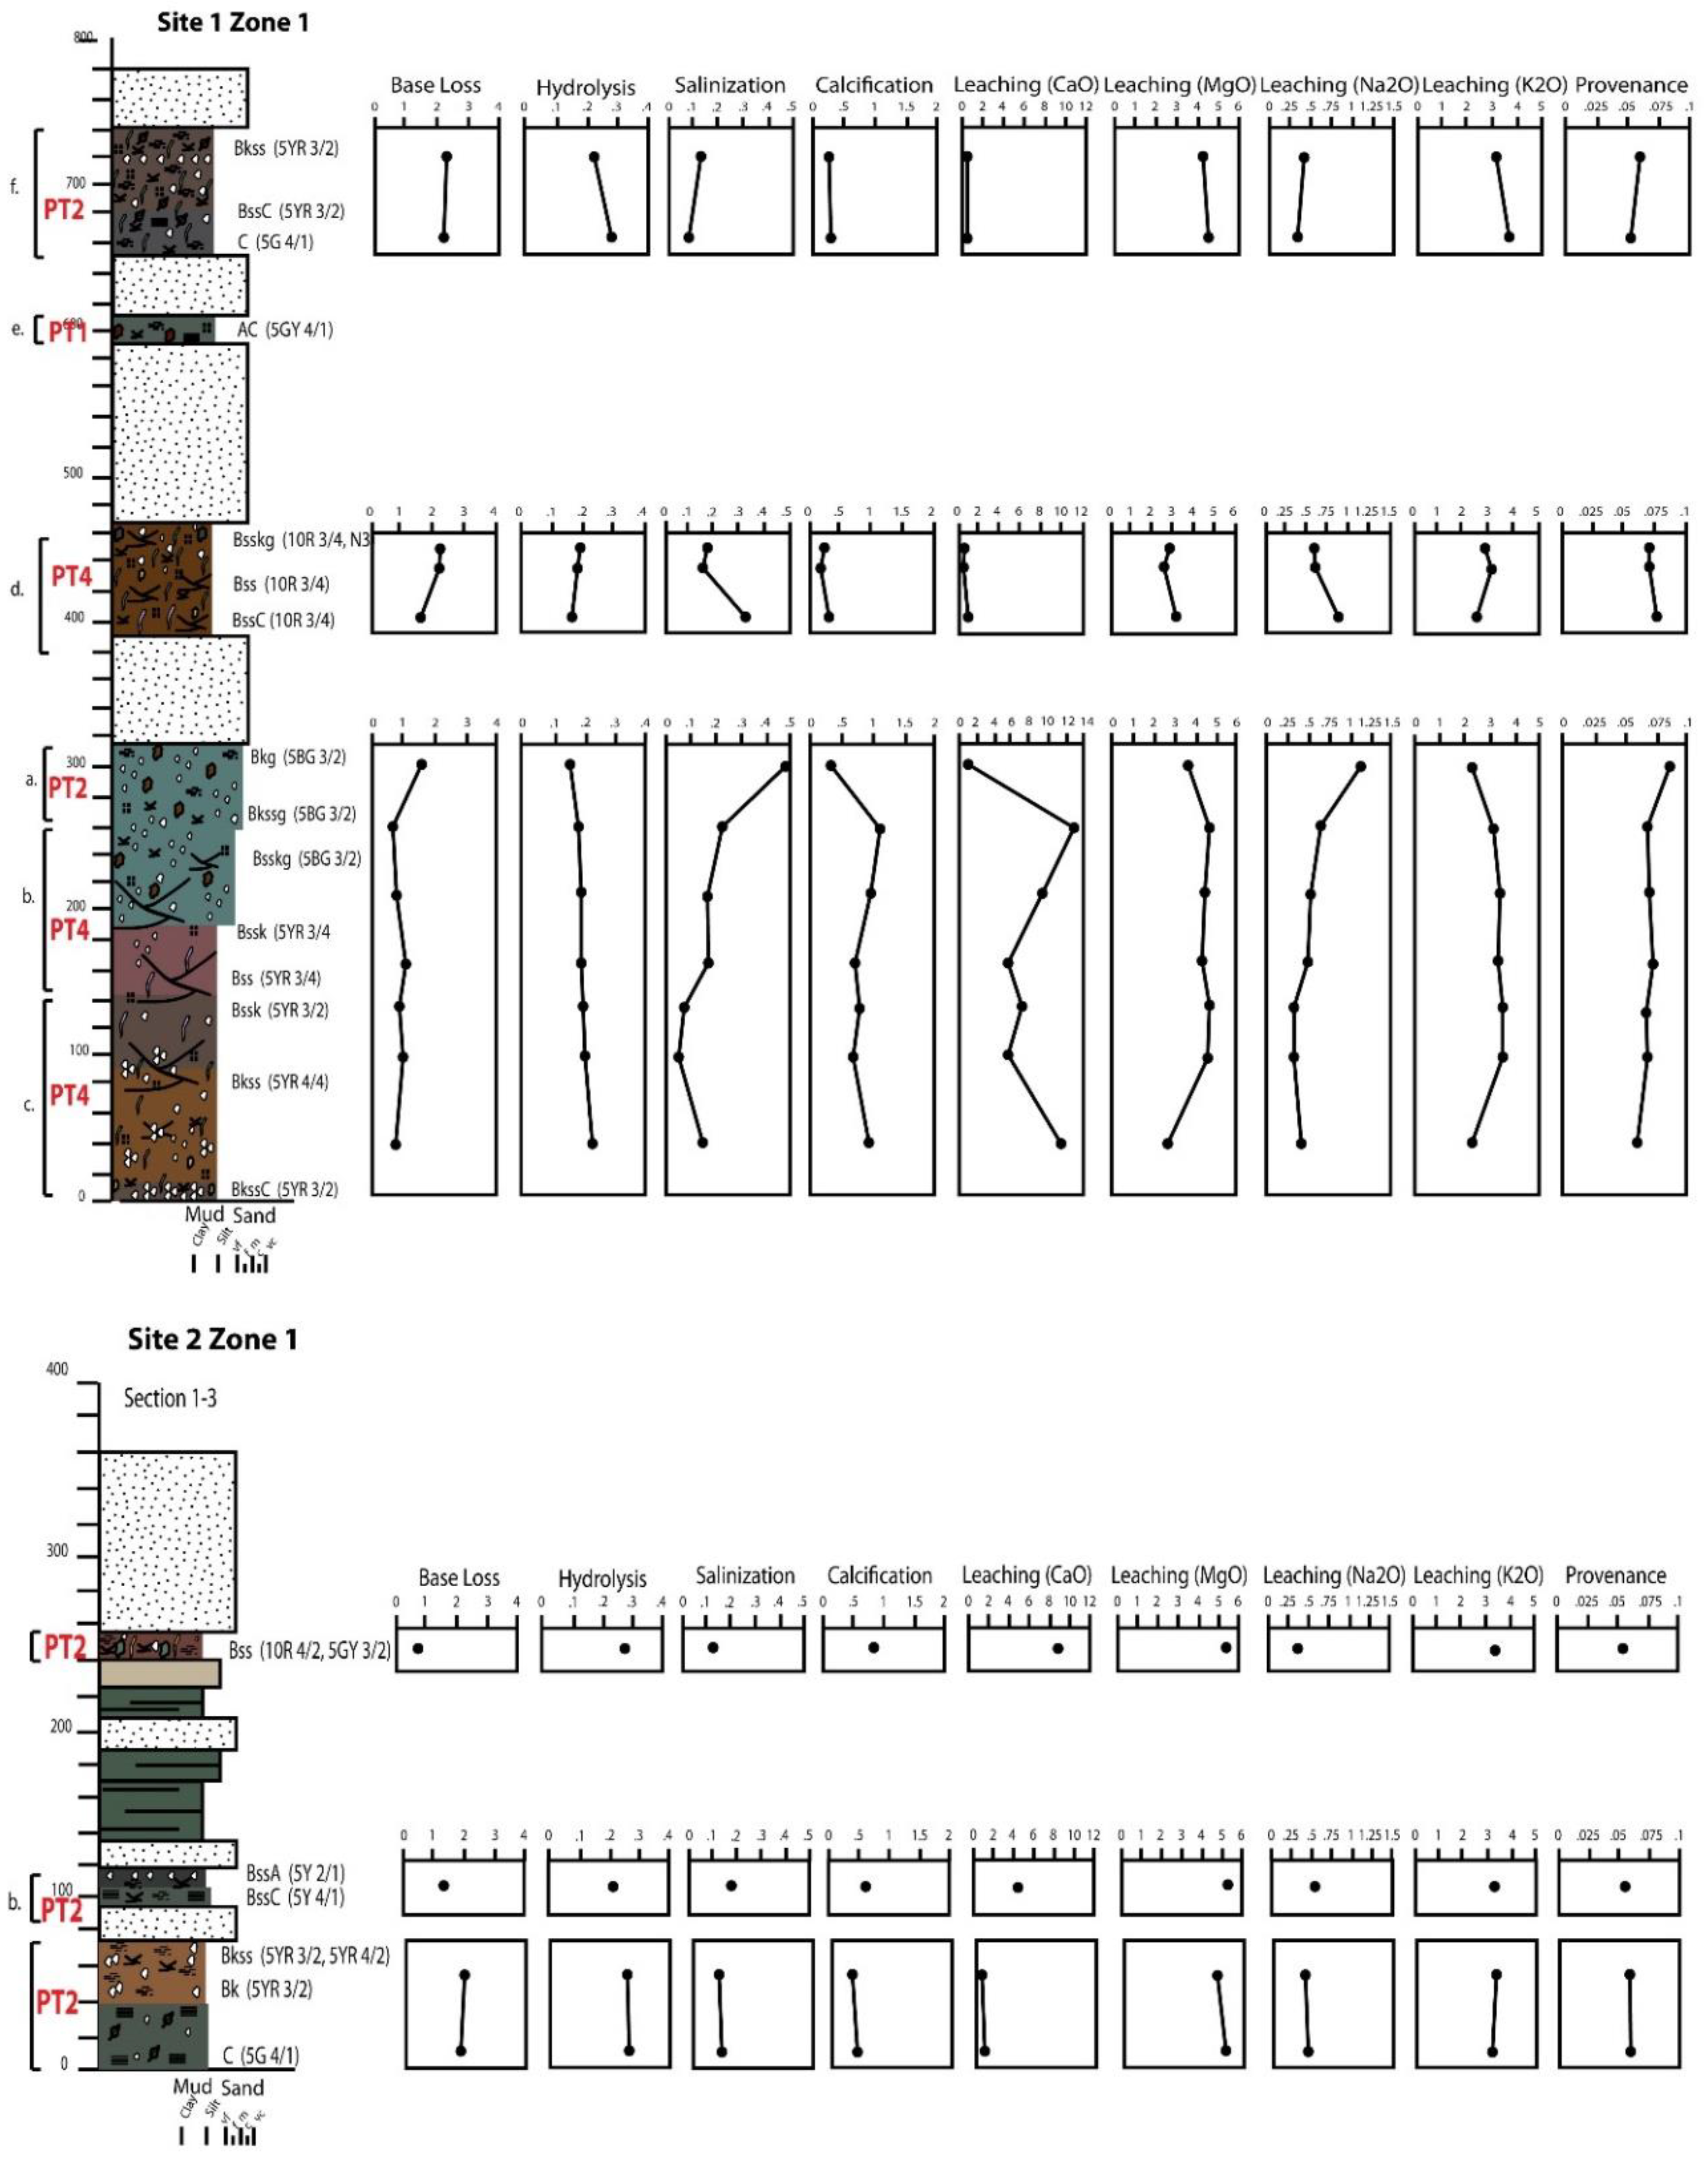
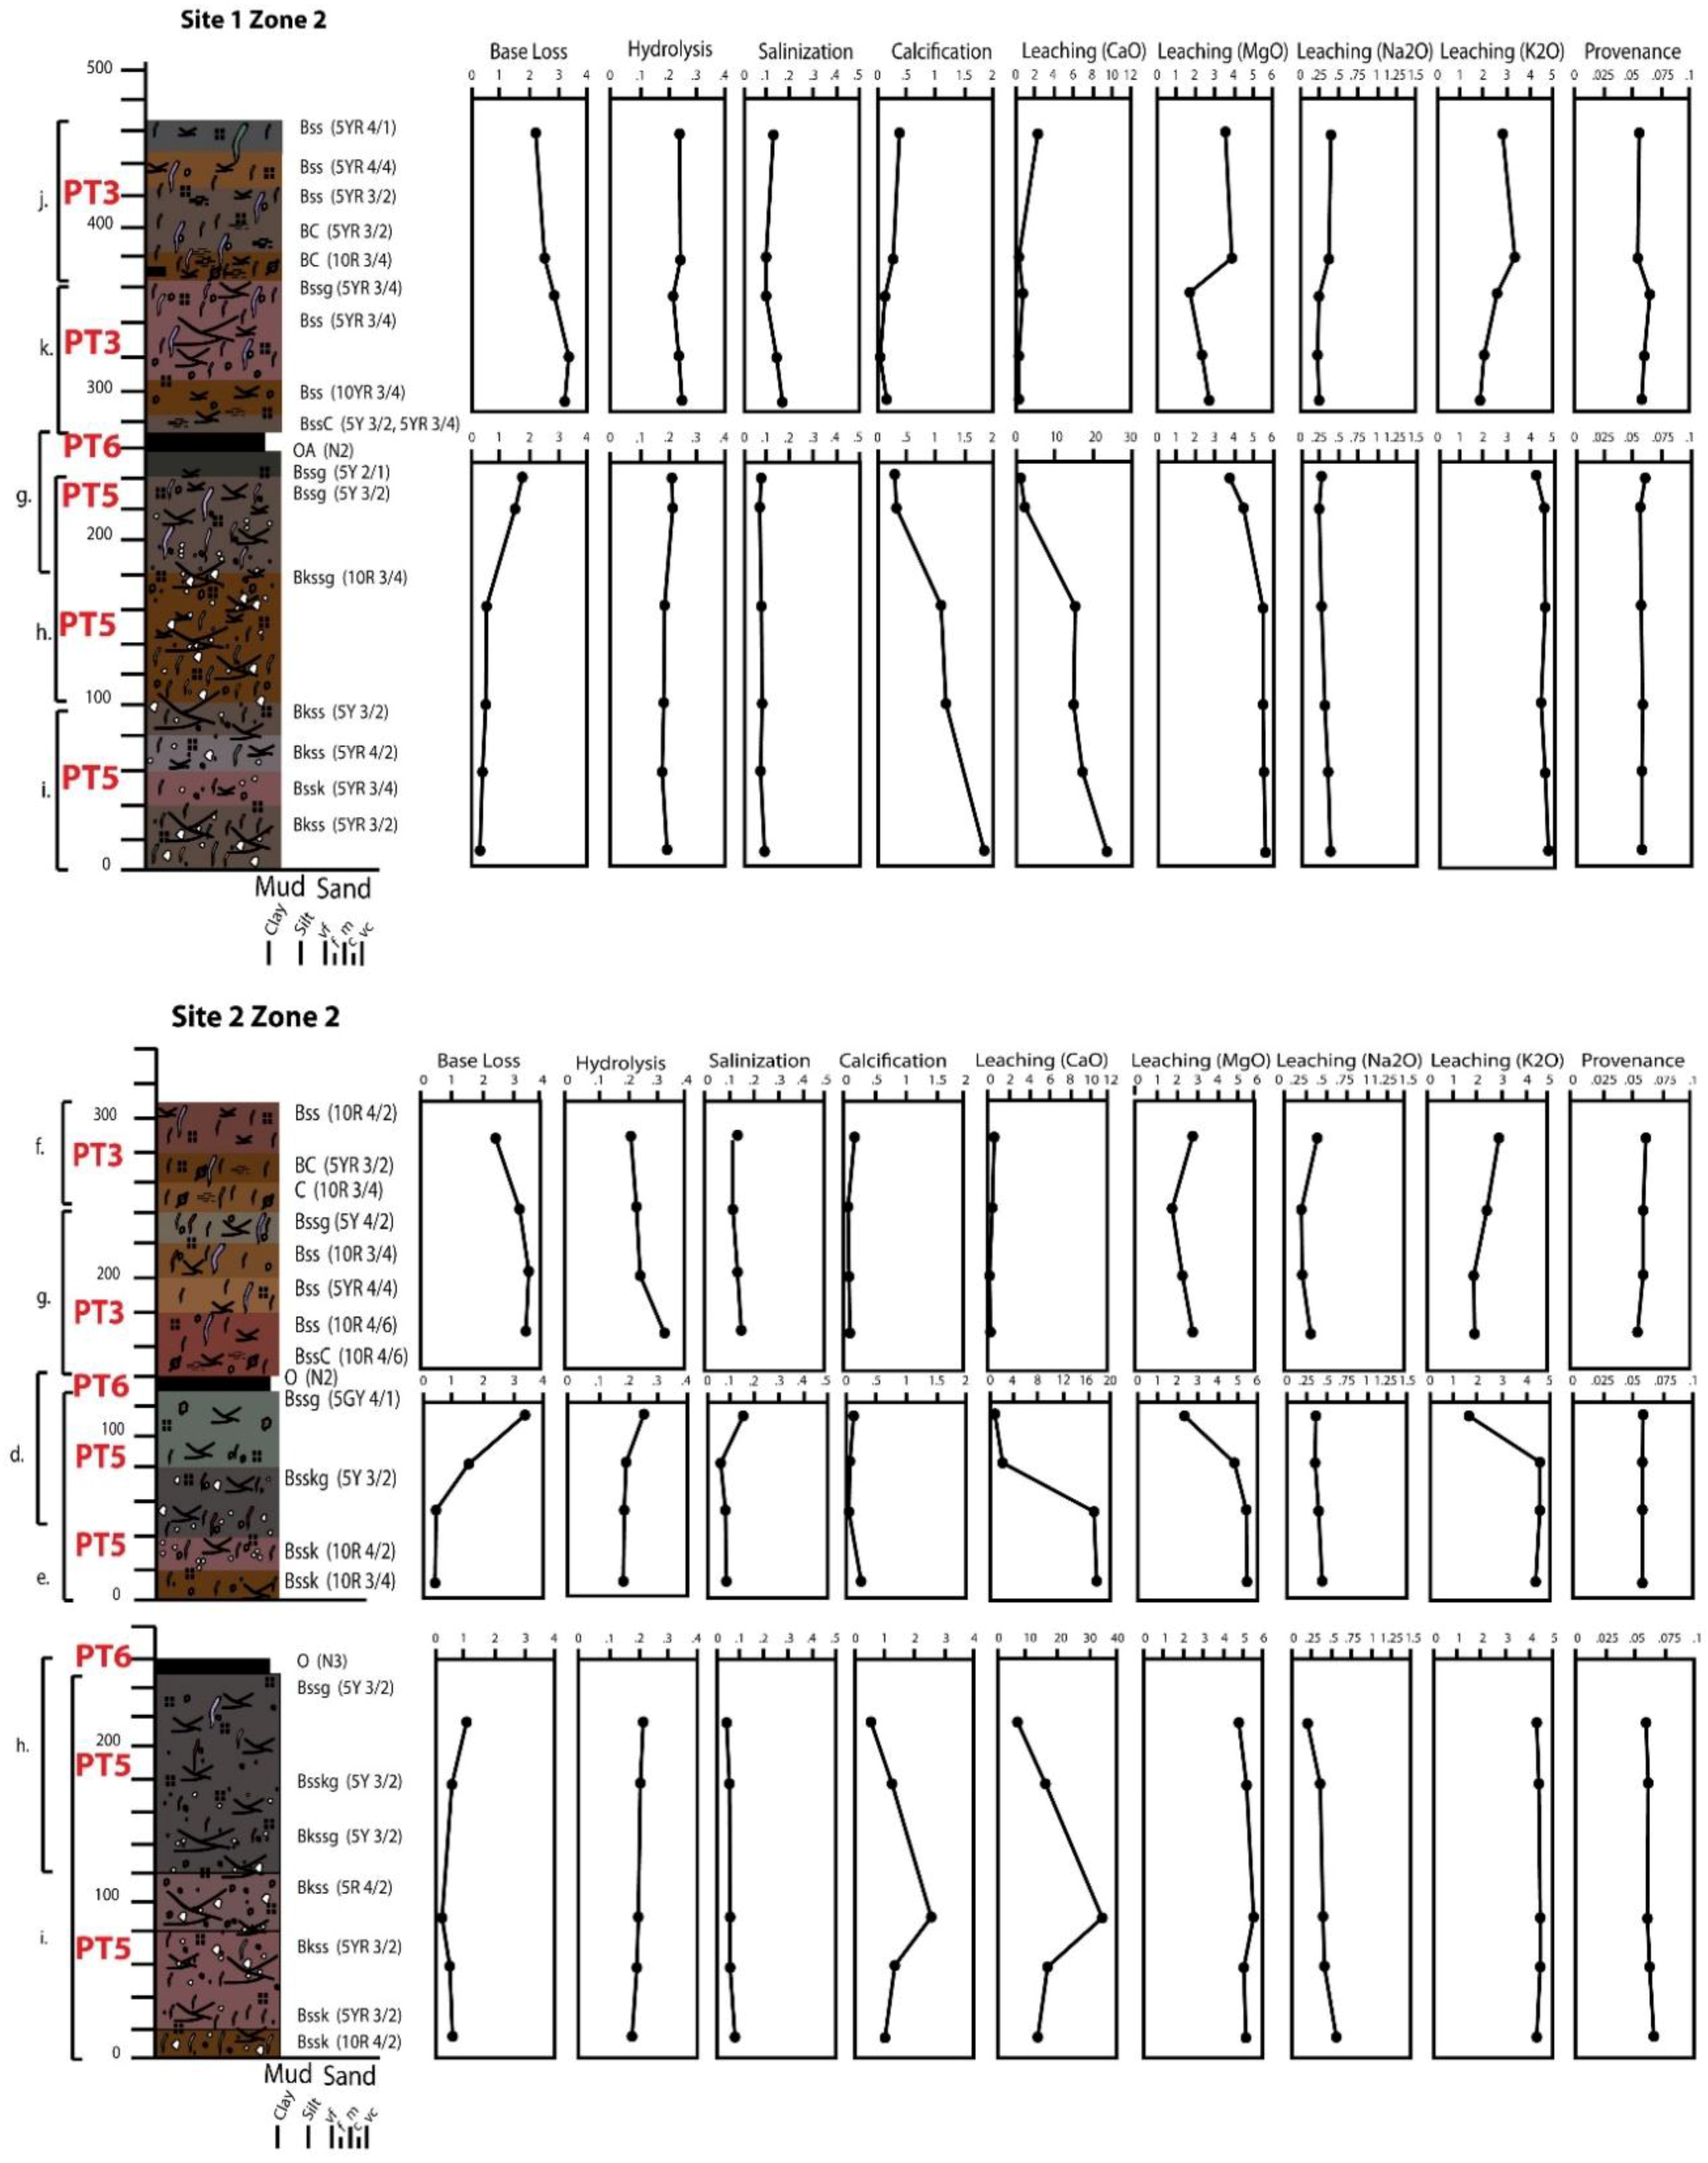
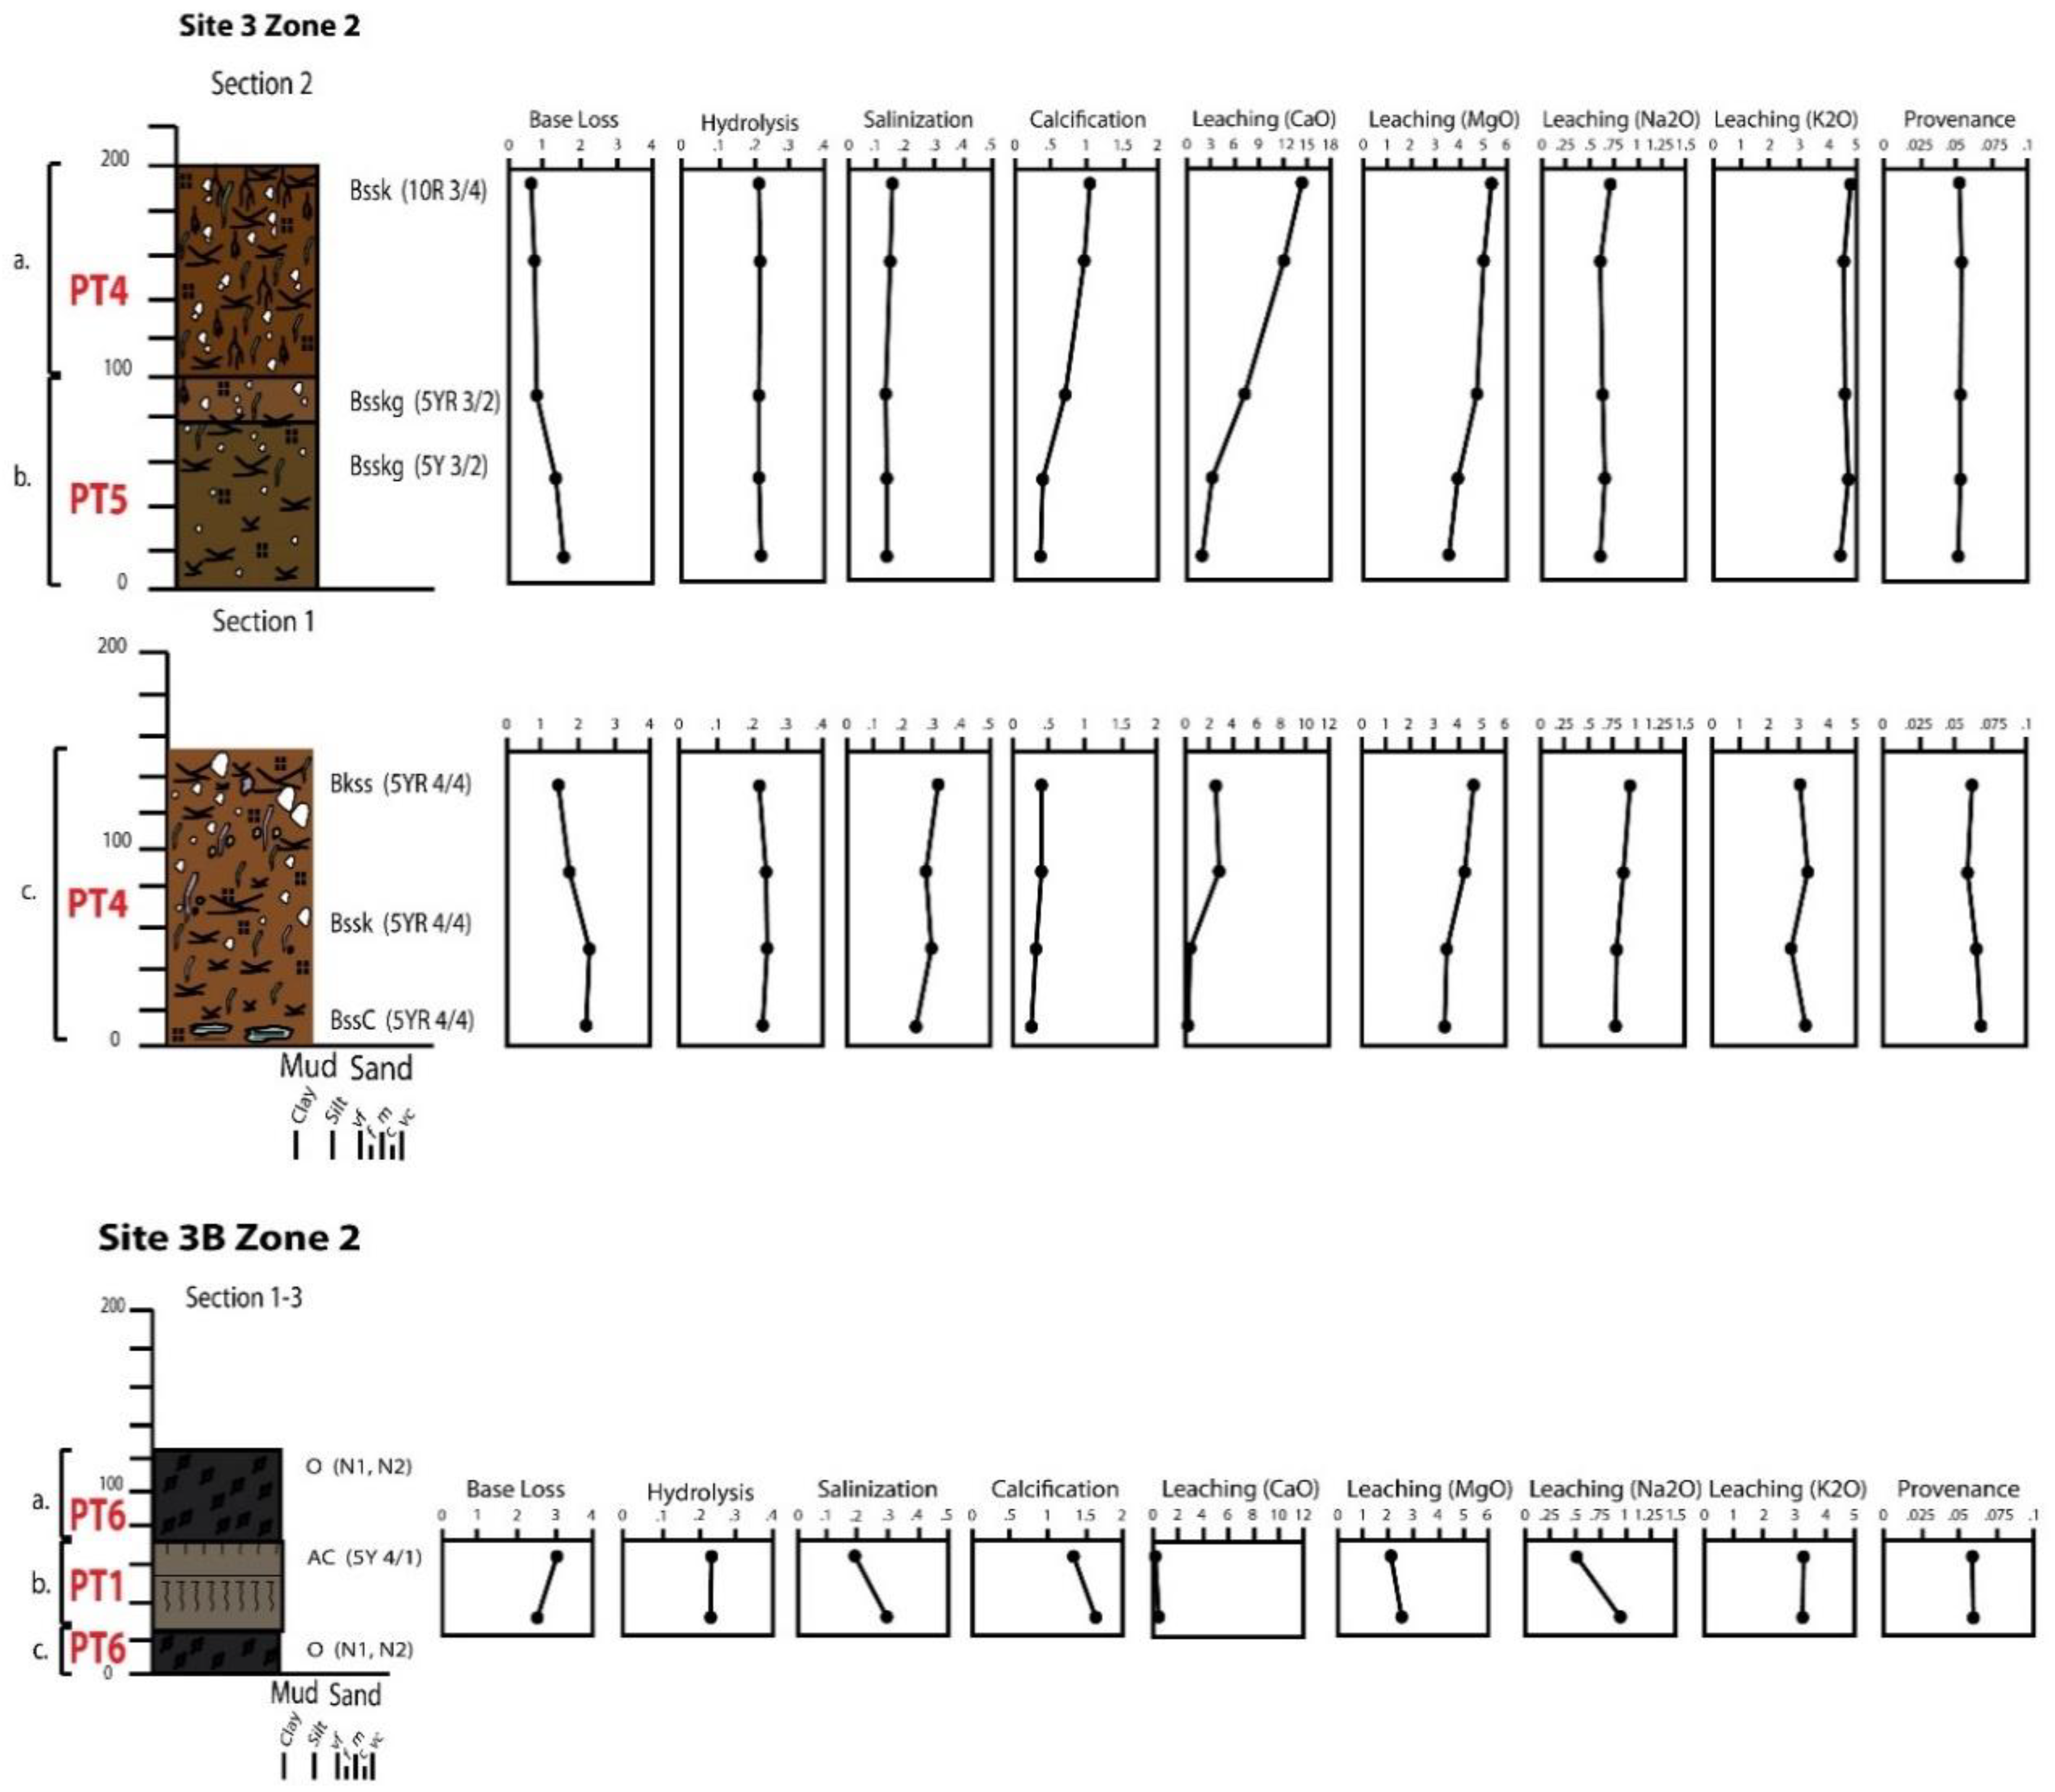
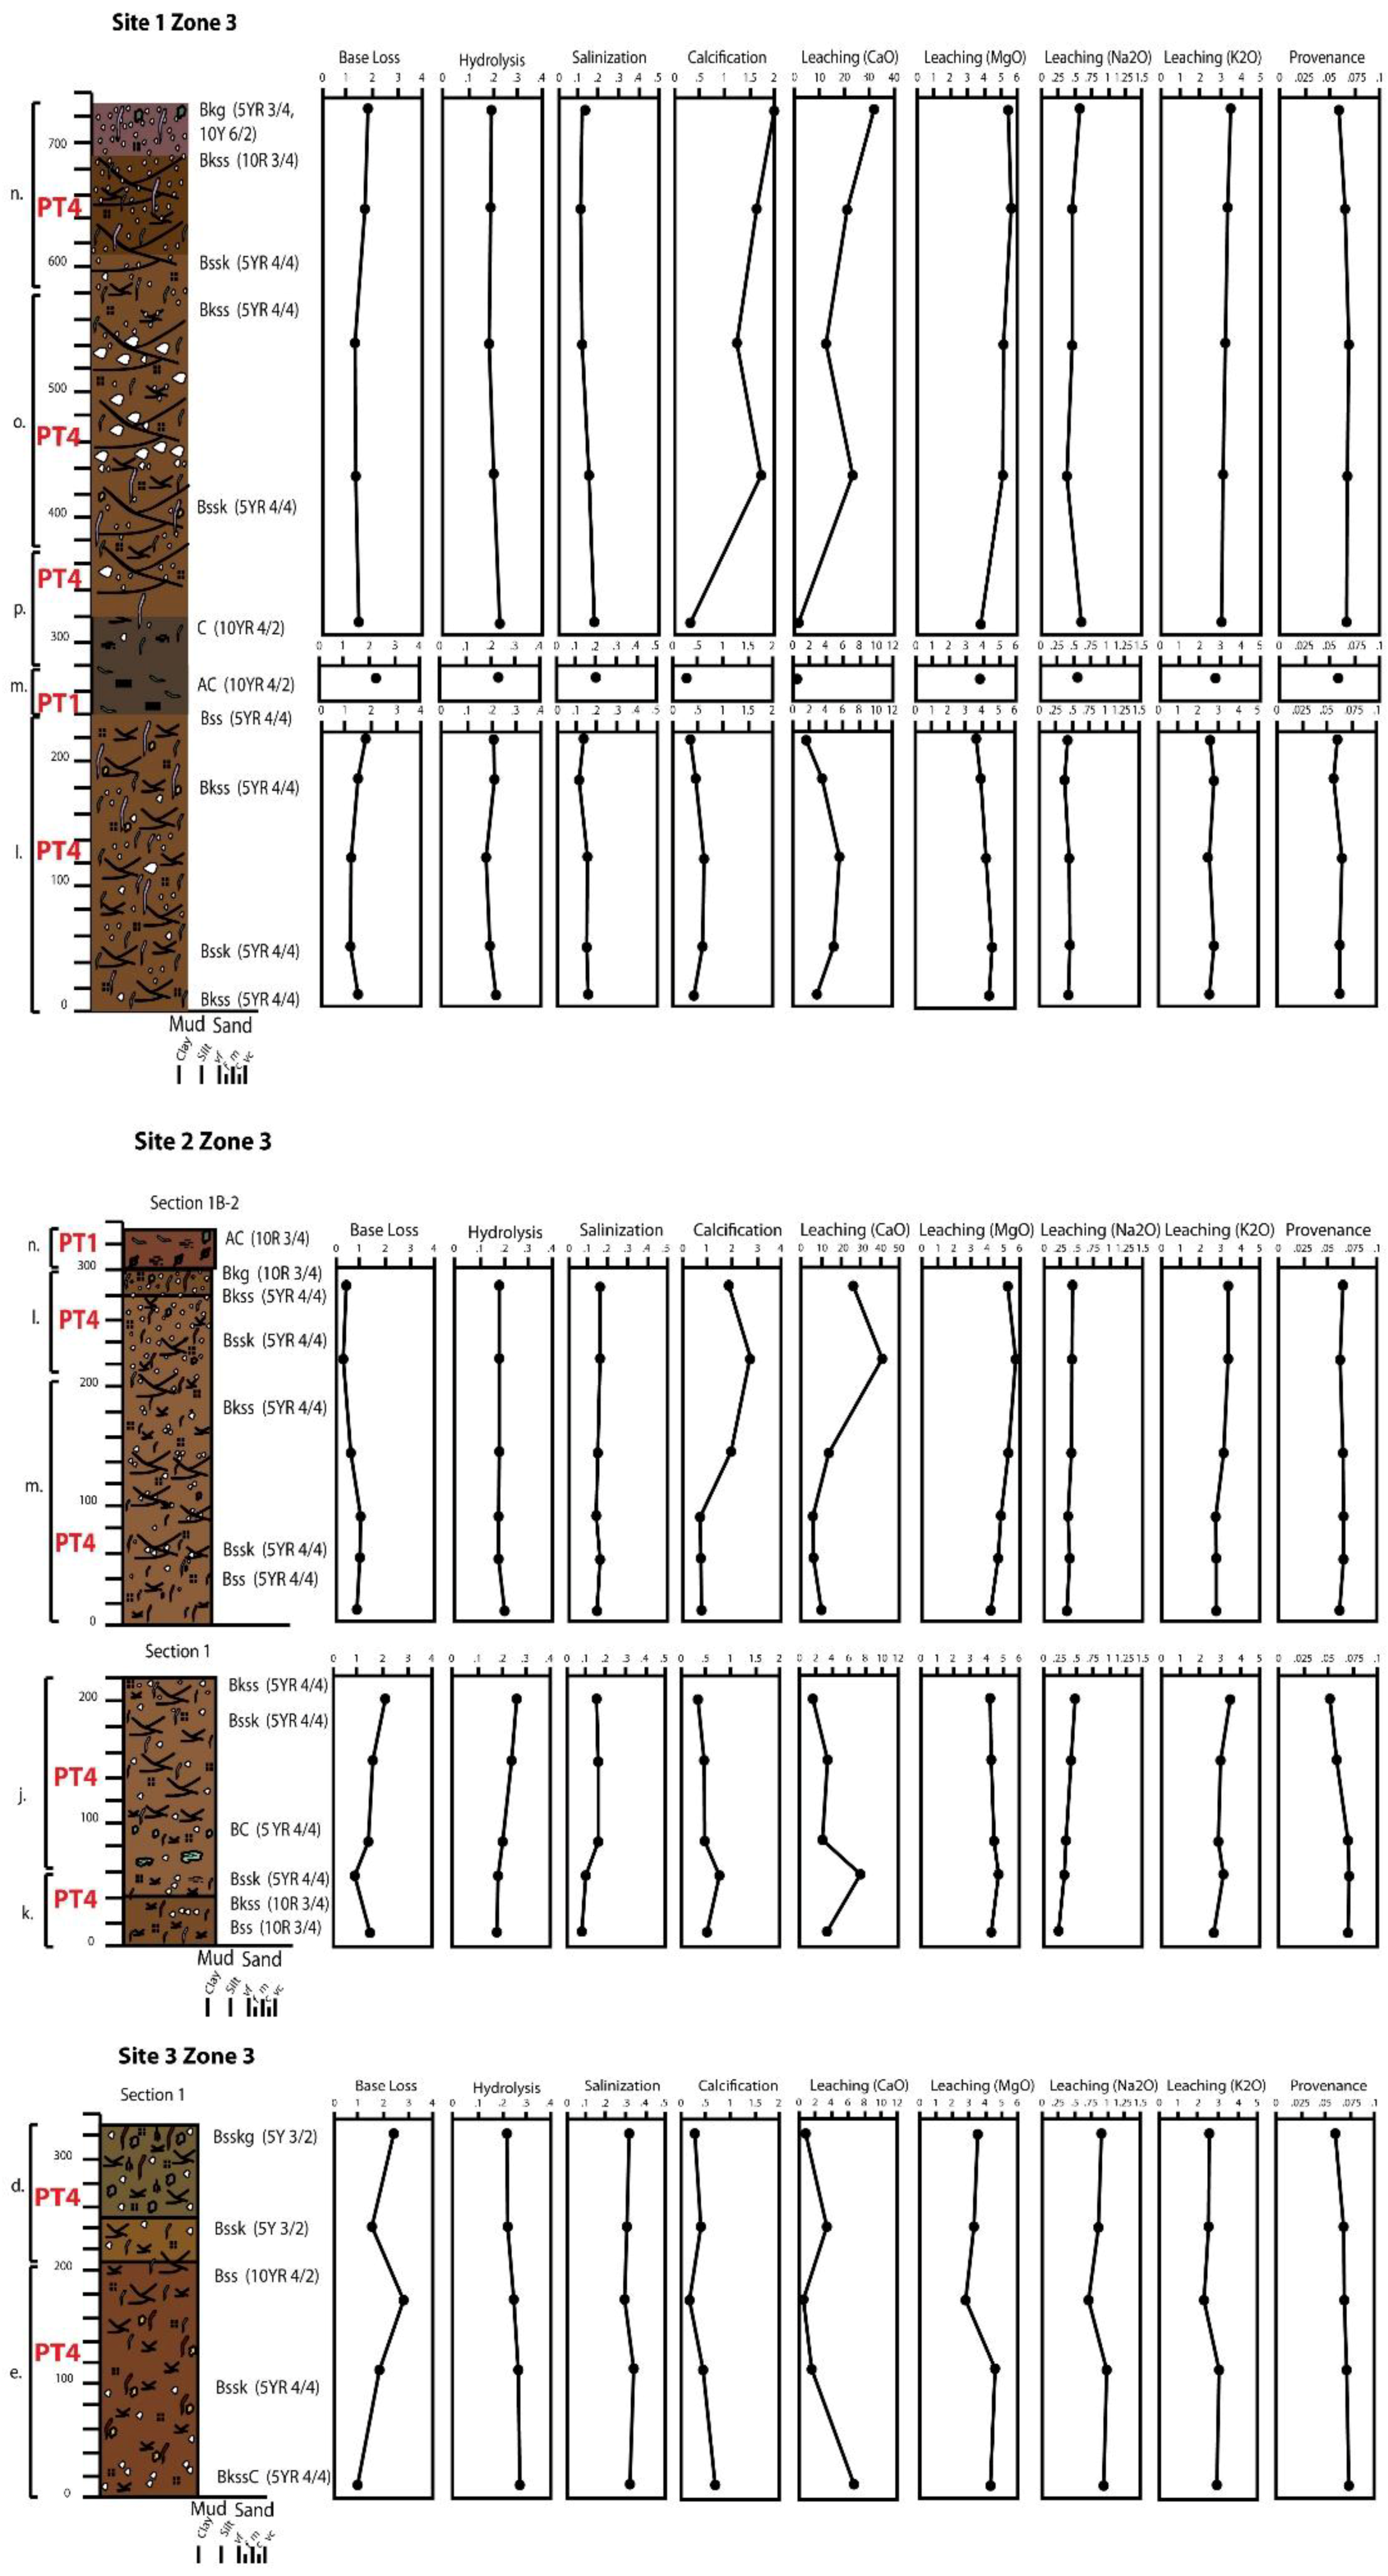
Thin sections (n = 95) were prepared by Texas Petrographic (Houston, TX, USA) and analyzed for grain size, mineral composition, plasmic microfabric, grain microfabric, small-scale pedogenic structures and ichnofossils. These data were used to interpret original soil structures and the intensity of soil formation. Bulk geochemistry of paleosol samples (n = 79) including weight percent of major oxides (Al, Si, Ca, K, Na, Fe, Mg, Mn, Zr, and Ti) were determined using X-ray fluorescence (XRF) by ALS Minerals (Reno, NV, USA). Powdered samples were analyzed using lithium borate fusion XRF. The results were reported as weight percentages of oxides which were then normalized to molecular weights (Supplement 1). These were used to semi-quantitatively assess chemical weathering and climate by calculating several molecular weathering ratios, the chemical index of alteration and mean annual precipitation [25,26,27] (Table 1). Base loss was calculated as Al2O3/(CaO + MgO + Na2O + K2O); higher values indicate a greater amount of base loss relative to aluminum. Hydrolysis was calculated as Al2O3/SiO2; higher values suggest higher concentrations of clays due to the prevalence of Al in clay minerals. Salinization was calculated as Na2O + K2O/Al2O3 with higher values indicating greater concentration of alkali elements. Calcification has been calculated as (CaO + MgO)/Al2O3 with higher values indicating greater concentration of carbonate minerals. Leaching of bases was calculated as (CaO, MgO, Na2O, K2O)/TiO2; smaller values indicate greater leaching of specific bases. The chemical index of alteration minus potassium (CIA-K) and flux of magnesium and calcium (CALMAG) were calculated using the mole fraction of oxides obtained from XRF analyses (Table 1) [25,27]. MAP was calculated using equations derived from geochemical relationships found in modern soils and reported in mm/year [25,27].
Clay mineralogy was determined using X-ray diffraction (XRD) by K/T Geoservices (Boulder, CO, USA) and was used to qualitatively assess chemical weathering and climate. Samples (n = 50) were disaggregated and spun in a centrifuge to separate the clay-sized (<4 micron) fraction. The clay-sized fraction was decanted and oriented mounts produced by vacuum filtration. Mounts were exposed to ethylene glycol vapors for a 24-h period to detect expandable clays. Clay mineralogy was determined with a Siemens D500 powder diffractometer with a CuKα radiation source (40 Kv, 35 mA). Clay mounts were analyzed over a range of 2–36° 2θ at a scan rate of 1°/min. Results were reported as a percent of the clay-sized fraction.

4. Results

4.1. Sedimentology and Stratigraphy

4.1.1. Upper Monongahela Group

The lowermost portion of the exposed Monongahela Group is dominated by laterally discontinuous, planar laminated and cross-bedded (uncommon), fine-grained, tabular sandstones which thin to the east (0.37–1.72 m to 0.15–1.06 m; W–E) (Figure 4). These sandstones are interbedded with platy to angular blocky, calcareous mudstones, often separated by sharp, erosional contacts. Individual mudstone beds are discontinuous between Sites 1 and 2 and vary from dark olive gray to reddish-brown with purple, grayish-green, and yellow mottling (Figure 4). The mudstones are typically thin (<0.7 m), however, one bed at Site 1 is ~3 m thick which grades into the overlying sandstone. These units are included within Zone 1. Above the interbedded sandstone-mudstone interval is a is ~1.4–2.6 m thick, calcareous, dark olive brown, reddish-brown and reddish gray, angular blocky mudstone that becomes increasingly drab colored upwards; it contains abundant purple, grayish-green, and yellow mottles (Figure 4). This mudstone is laterally continuous across Sites 1 and 2, but not exposed at Site 3. This mudstone comprises Zone 2A.

4.1.2. Lower Dunkard Group

The base of the Dunkard Group is marked by a thin to thick (2–50 cm) coal layer (Waynesburg Coal) which thickens to the east (Figure 4). Sites 1 and 2 contain a 2–3 cm thick coal layer, however, Site 3B possess two successive coal beds, ~25 cm and ~50 cm thick respectively, separated by a 48 cm thick, olive gray, laminated claystone. Farther east at Site 3, the coal pinches out entirely into a grayish-green, fine-grained sandstone. Above the coal and contemporaneous sandstone is a dusky red to reddish-brown, angular blocky mudstone which is non-calcareous in Sites 1 and 2, but calcareous in Site 3 (Figure 4). These mudstones vary from ~2.5–3.5 m thick in the west to just over 5 m thick in the east. The top of the mudstone unit is truncated by fine-grained sandstone (0.15–1.72 m thick) interbedded with fissile shale or platy mudstone (~0.25–0.38 m thick) at Sites 2 and 3 and repeating fine-grained sandstone beds at Site 1 (Figure 4). These units were included in Zone 2B. Overlying the interbedded sandstone interval is a reddish-brown, calcareous, angular blocky mudstone with dusky red, purple, grayish-green, and yellow mottling (~3–5 m thick) (Figure 4). This mudstone is truncated in all three sites by olive green to reddish-brown shale (~1–2 m thick) which is capped by thin, fine-grained sandstone (0.10–1.25 m thick). This final interval comprised Zone 3.

4.2. Continental Ichnofossils

4.2.1. Rhizoliths

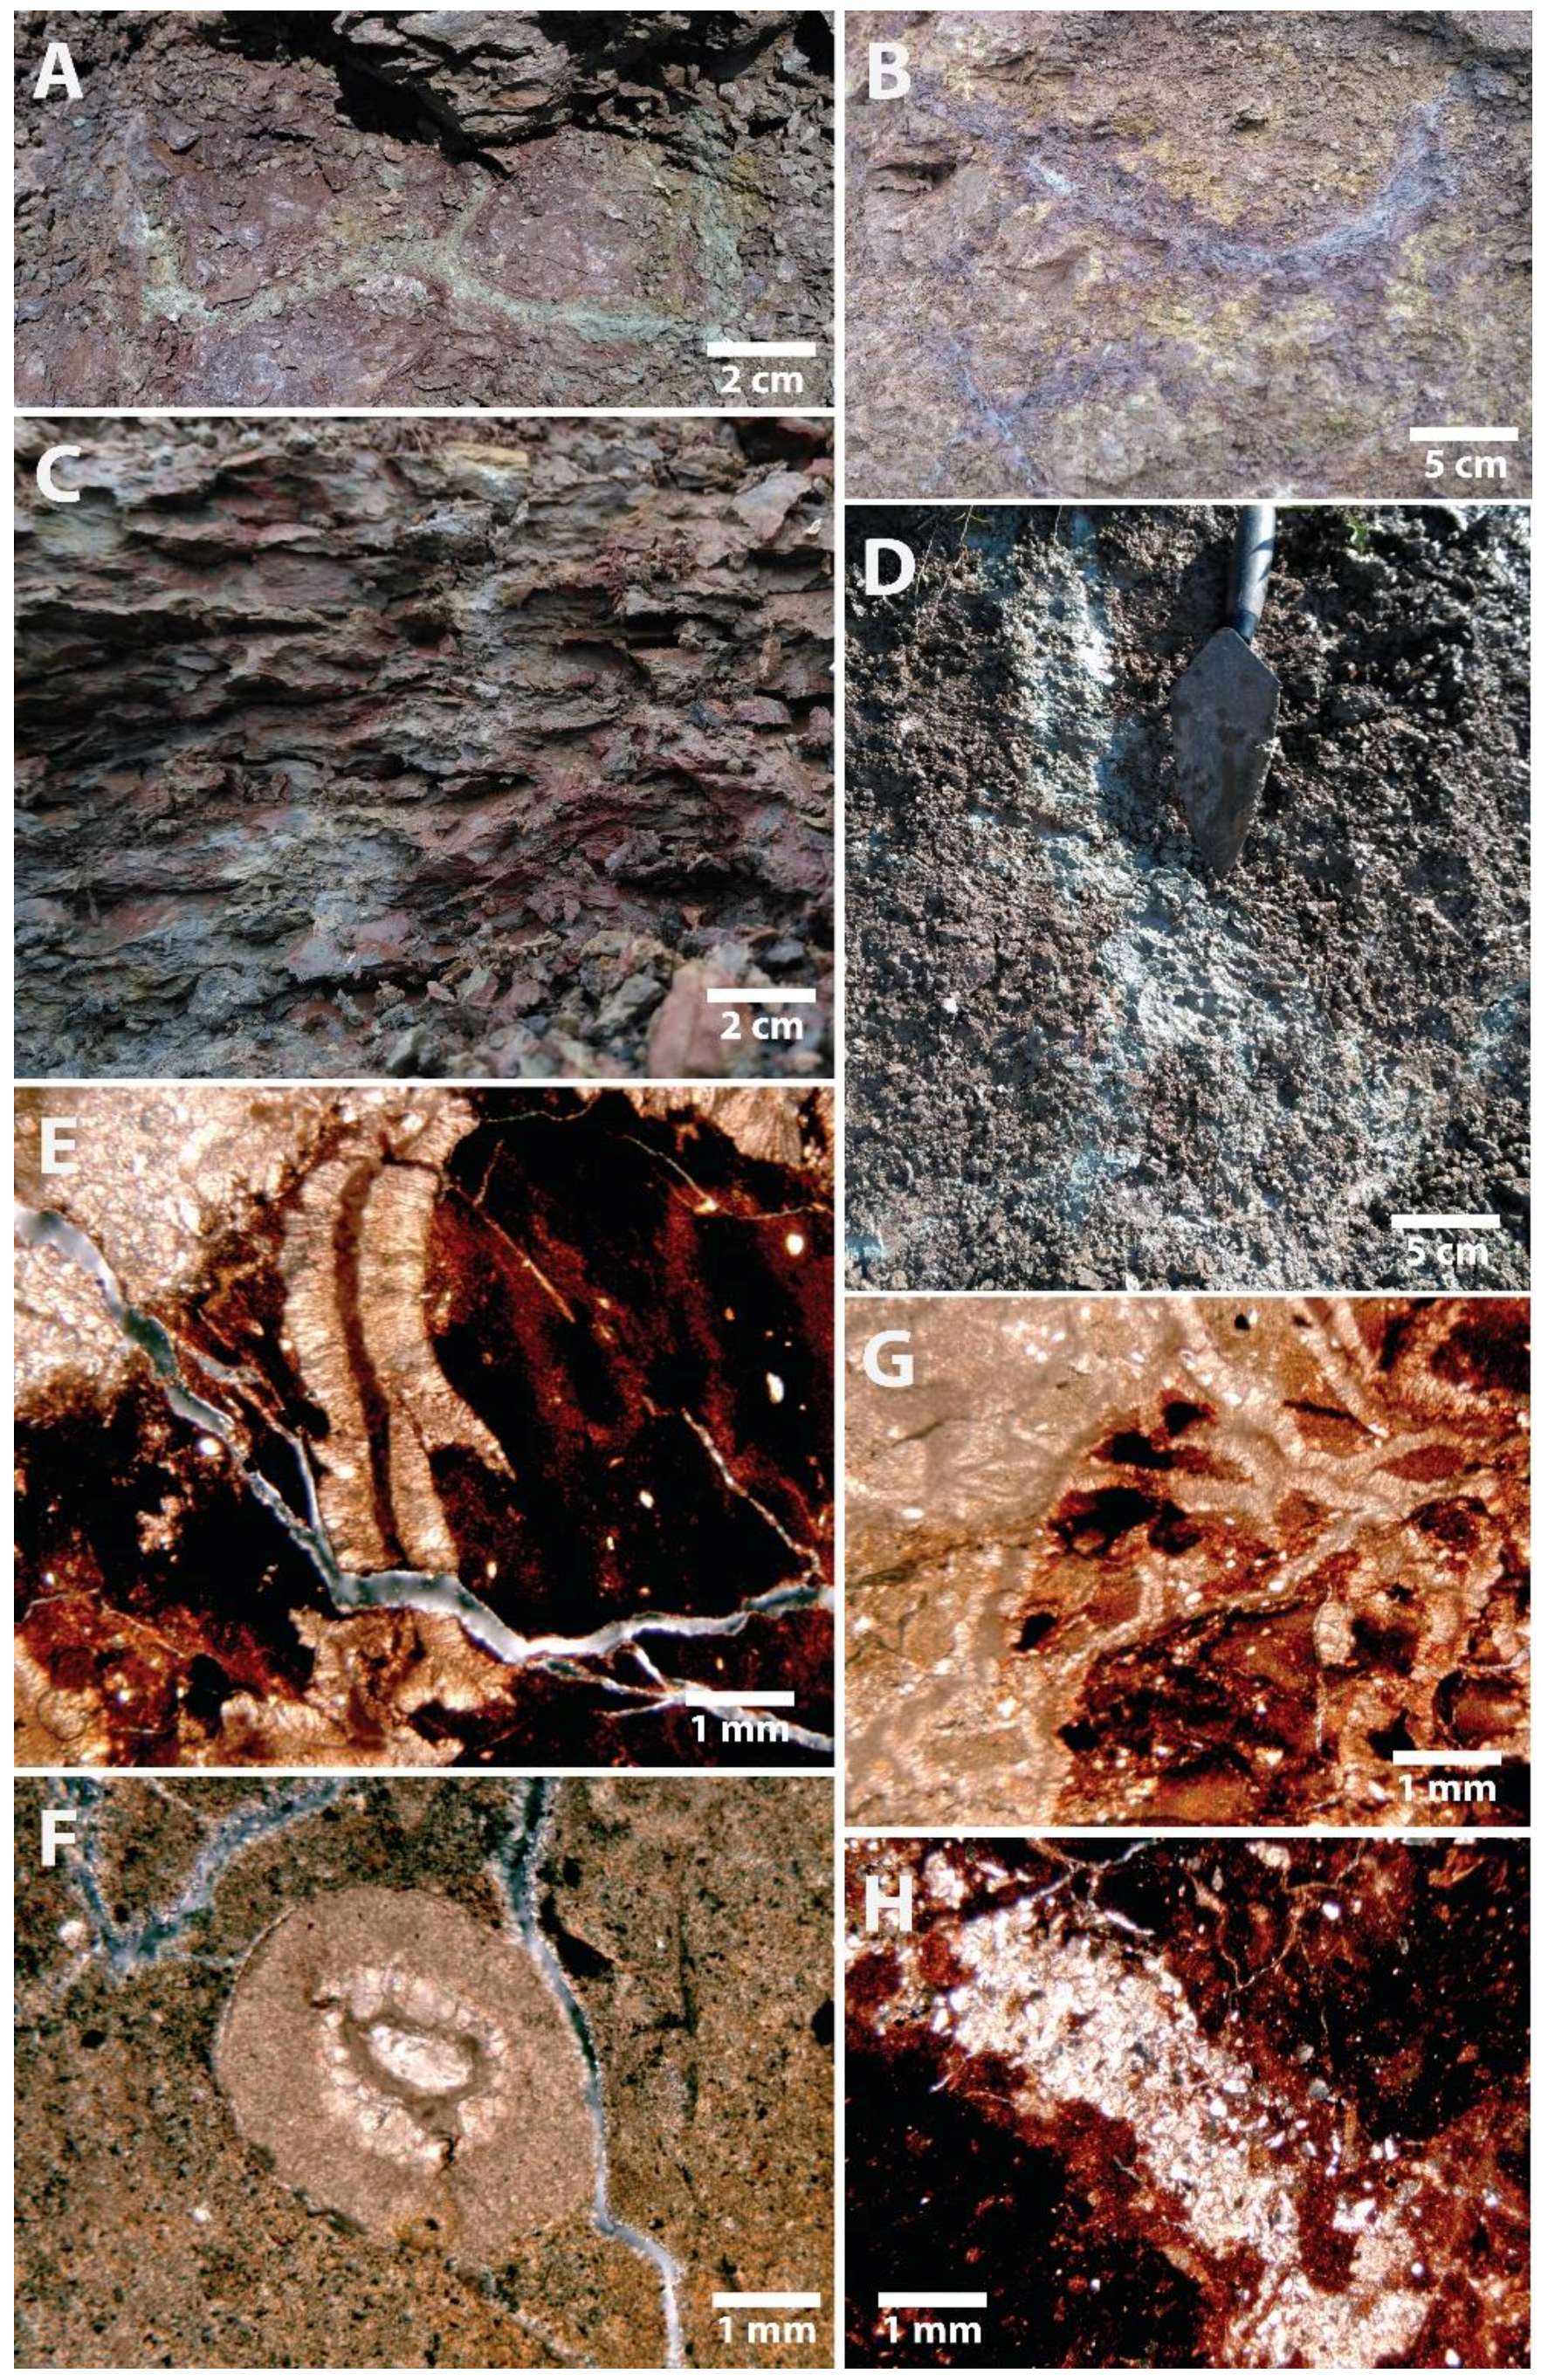
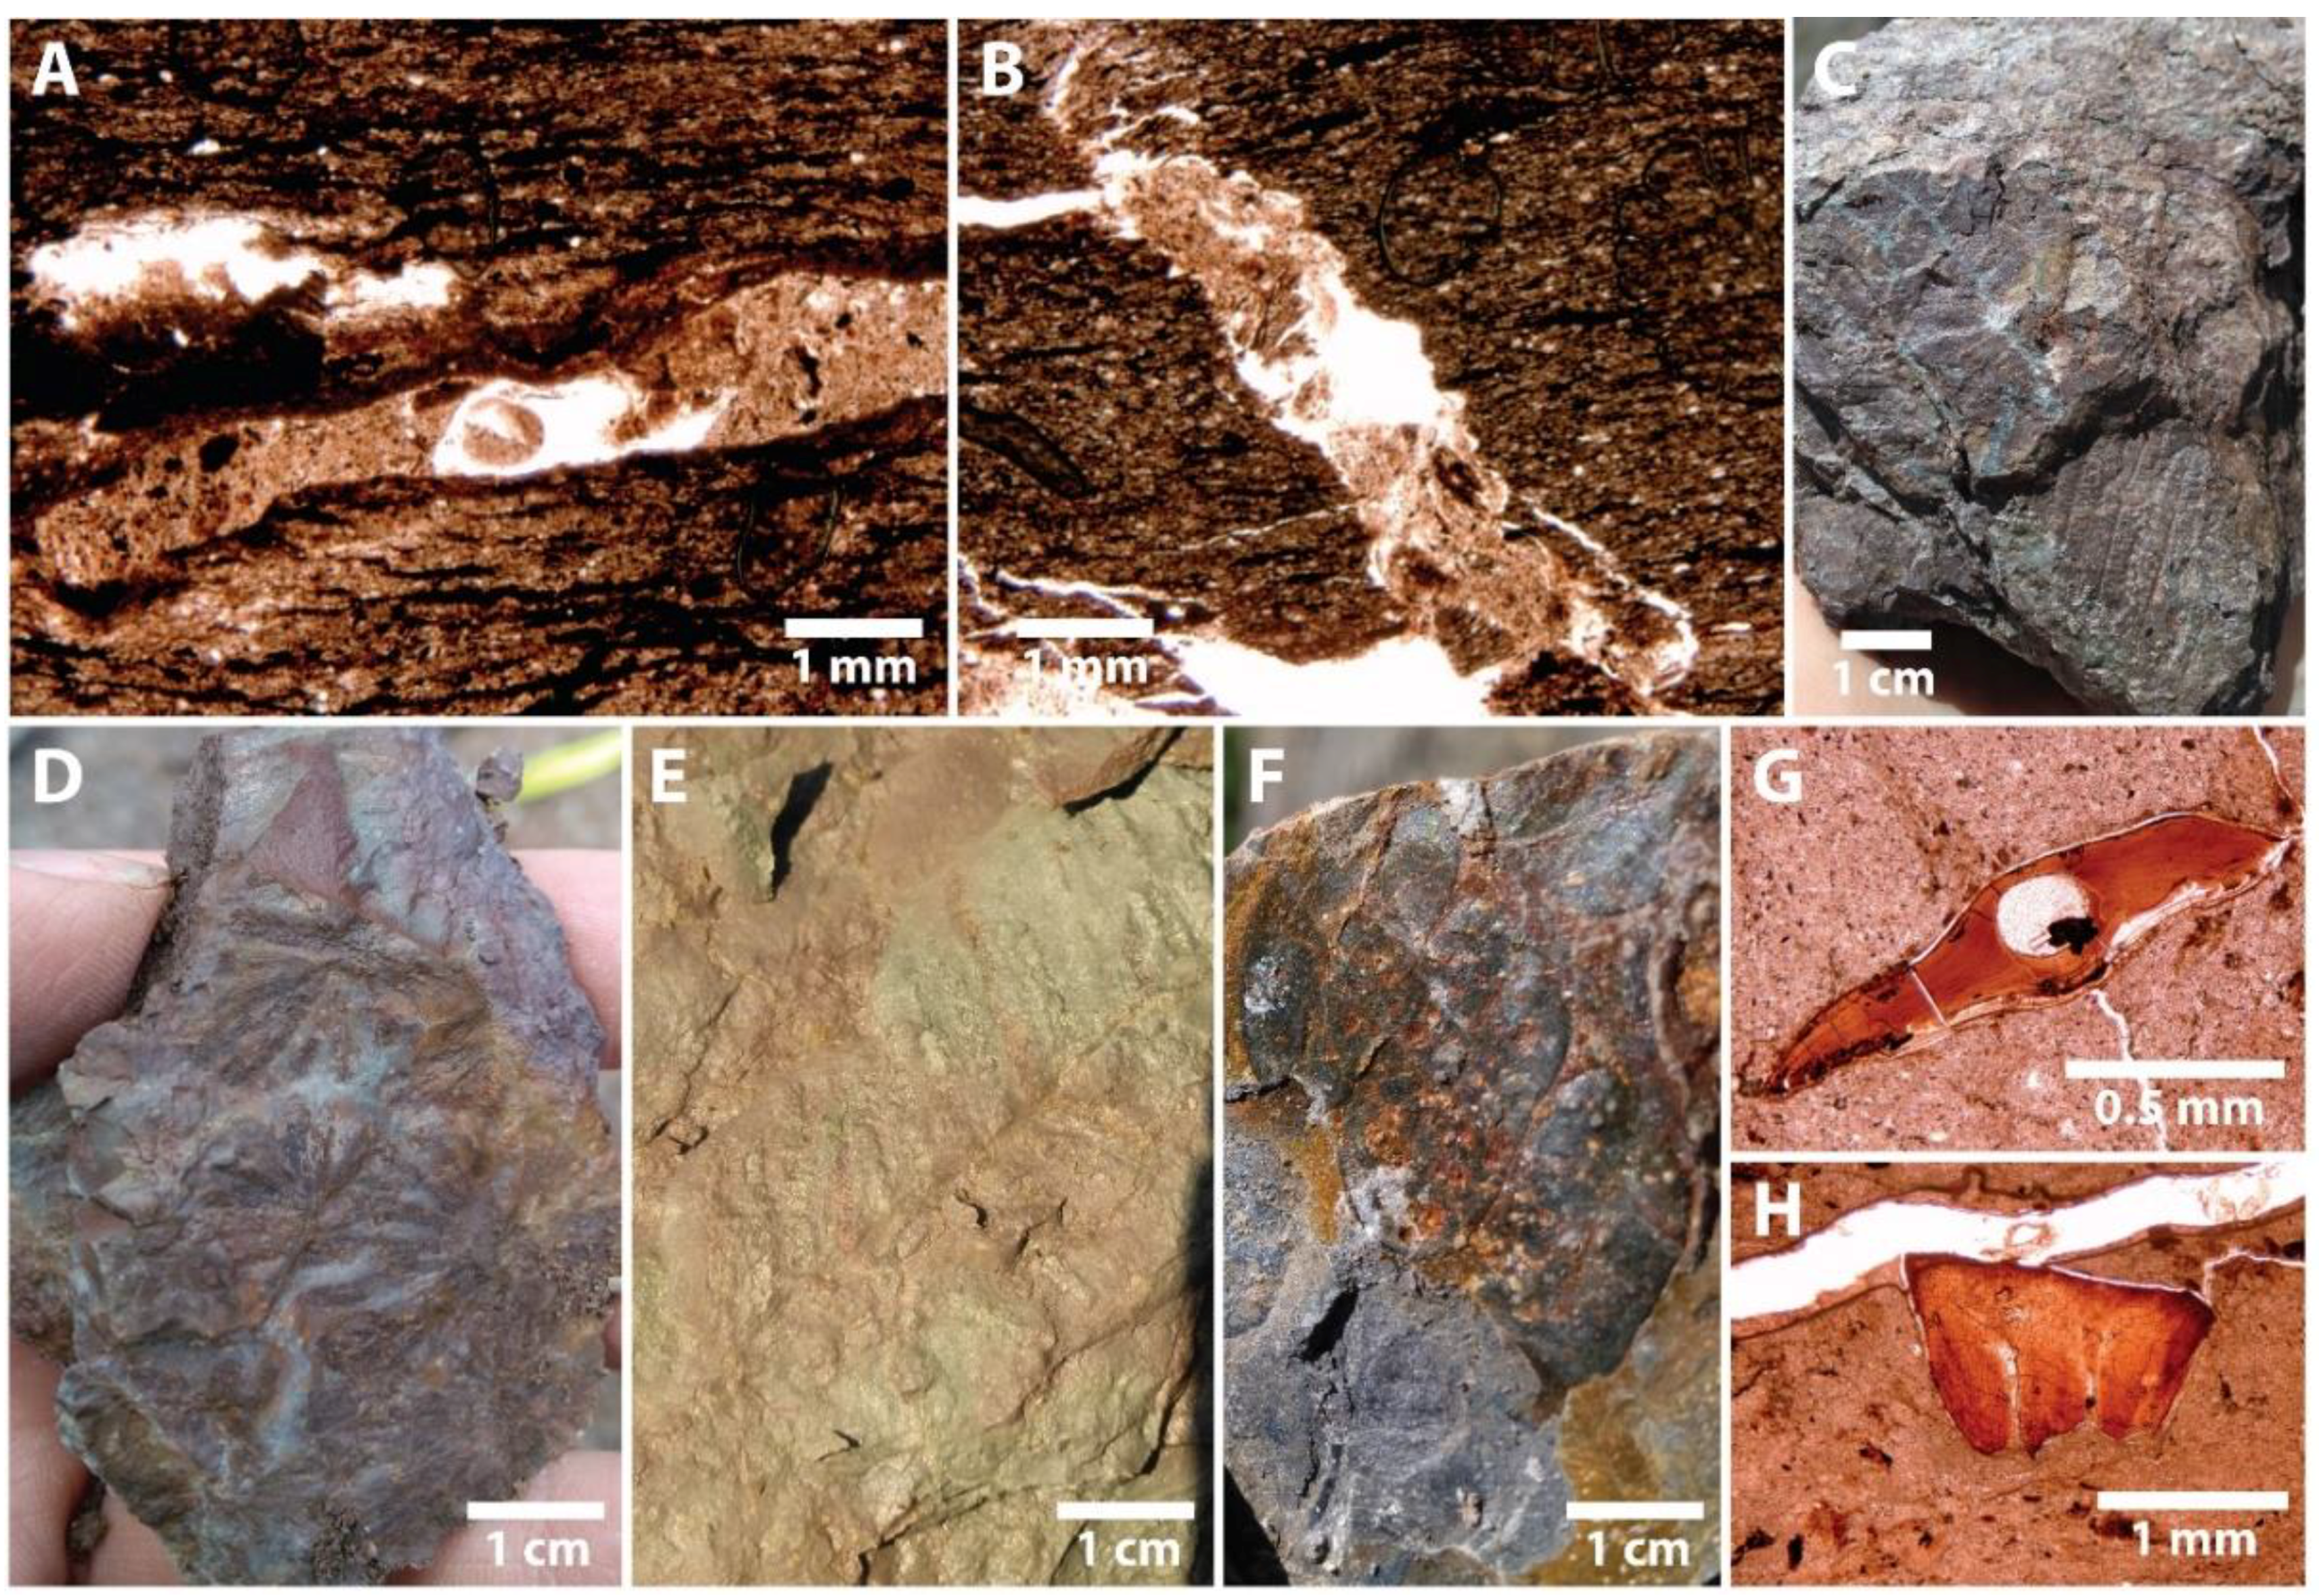
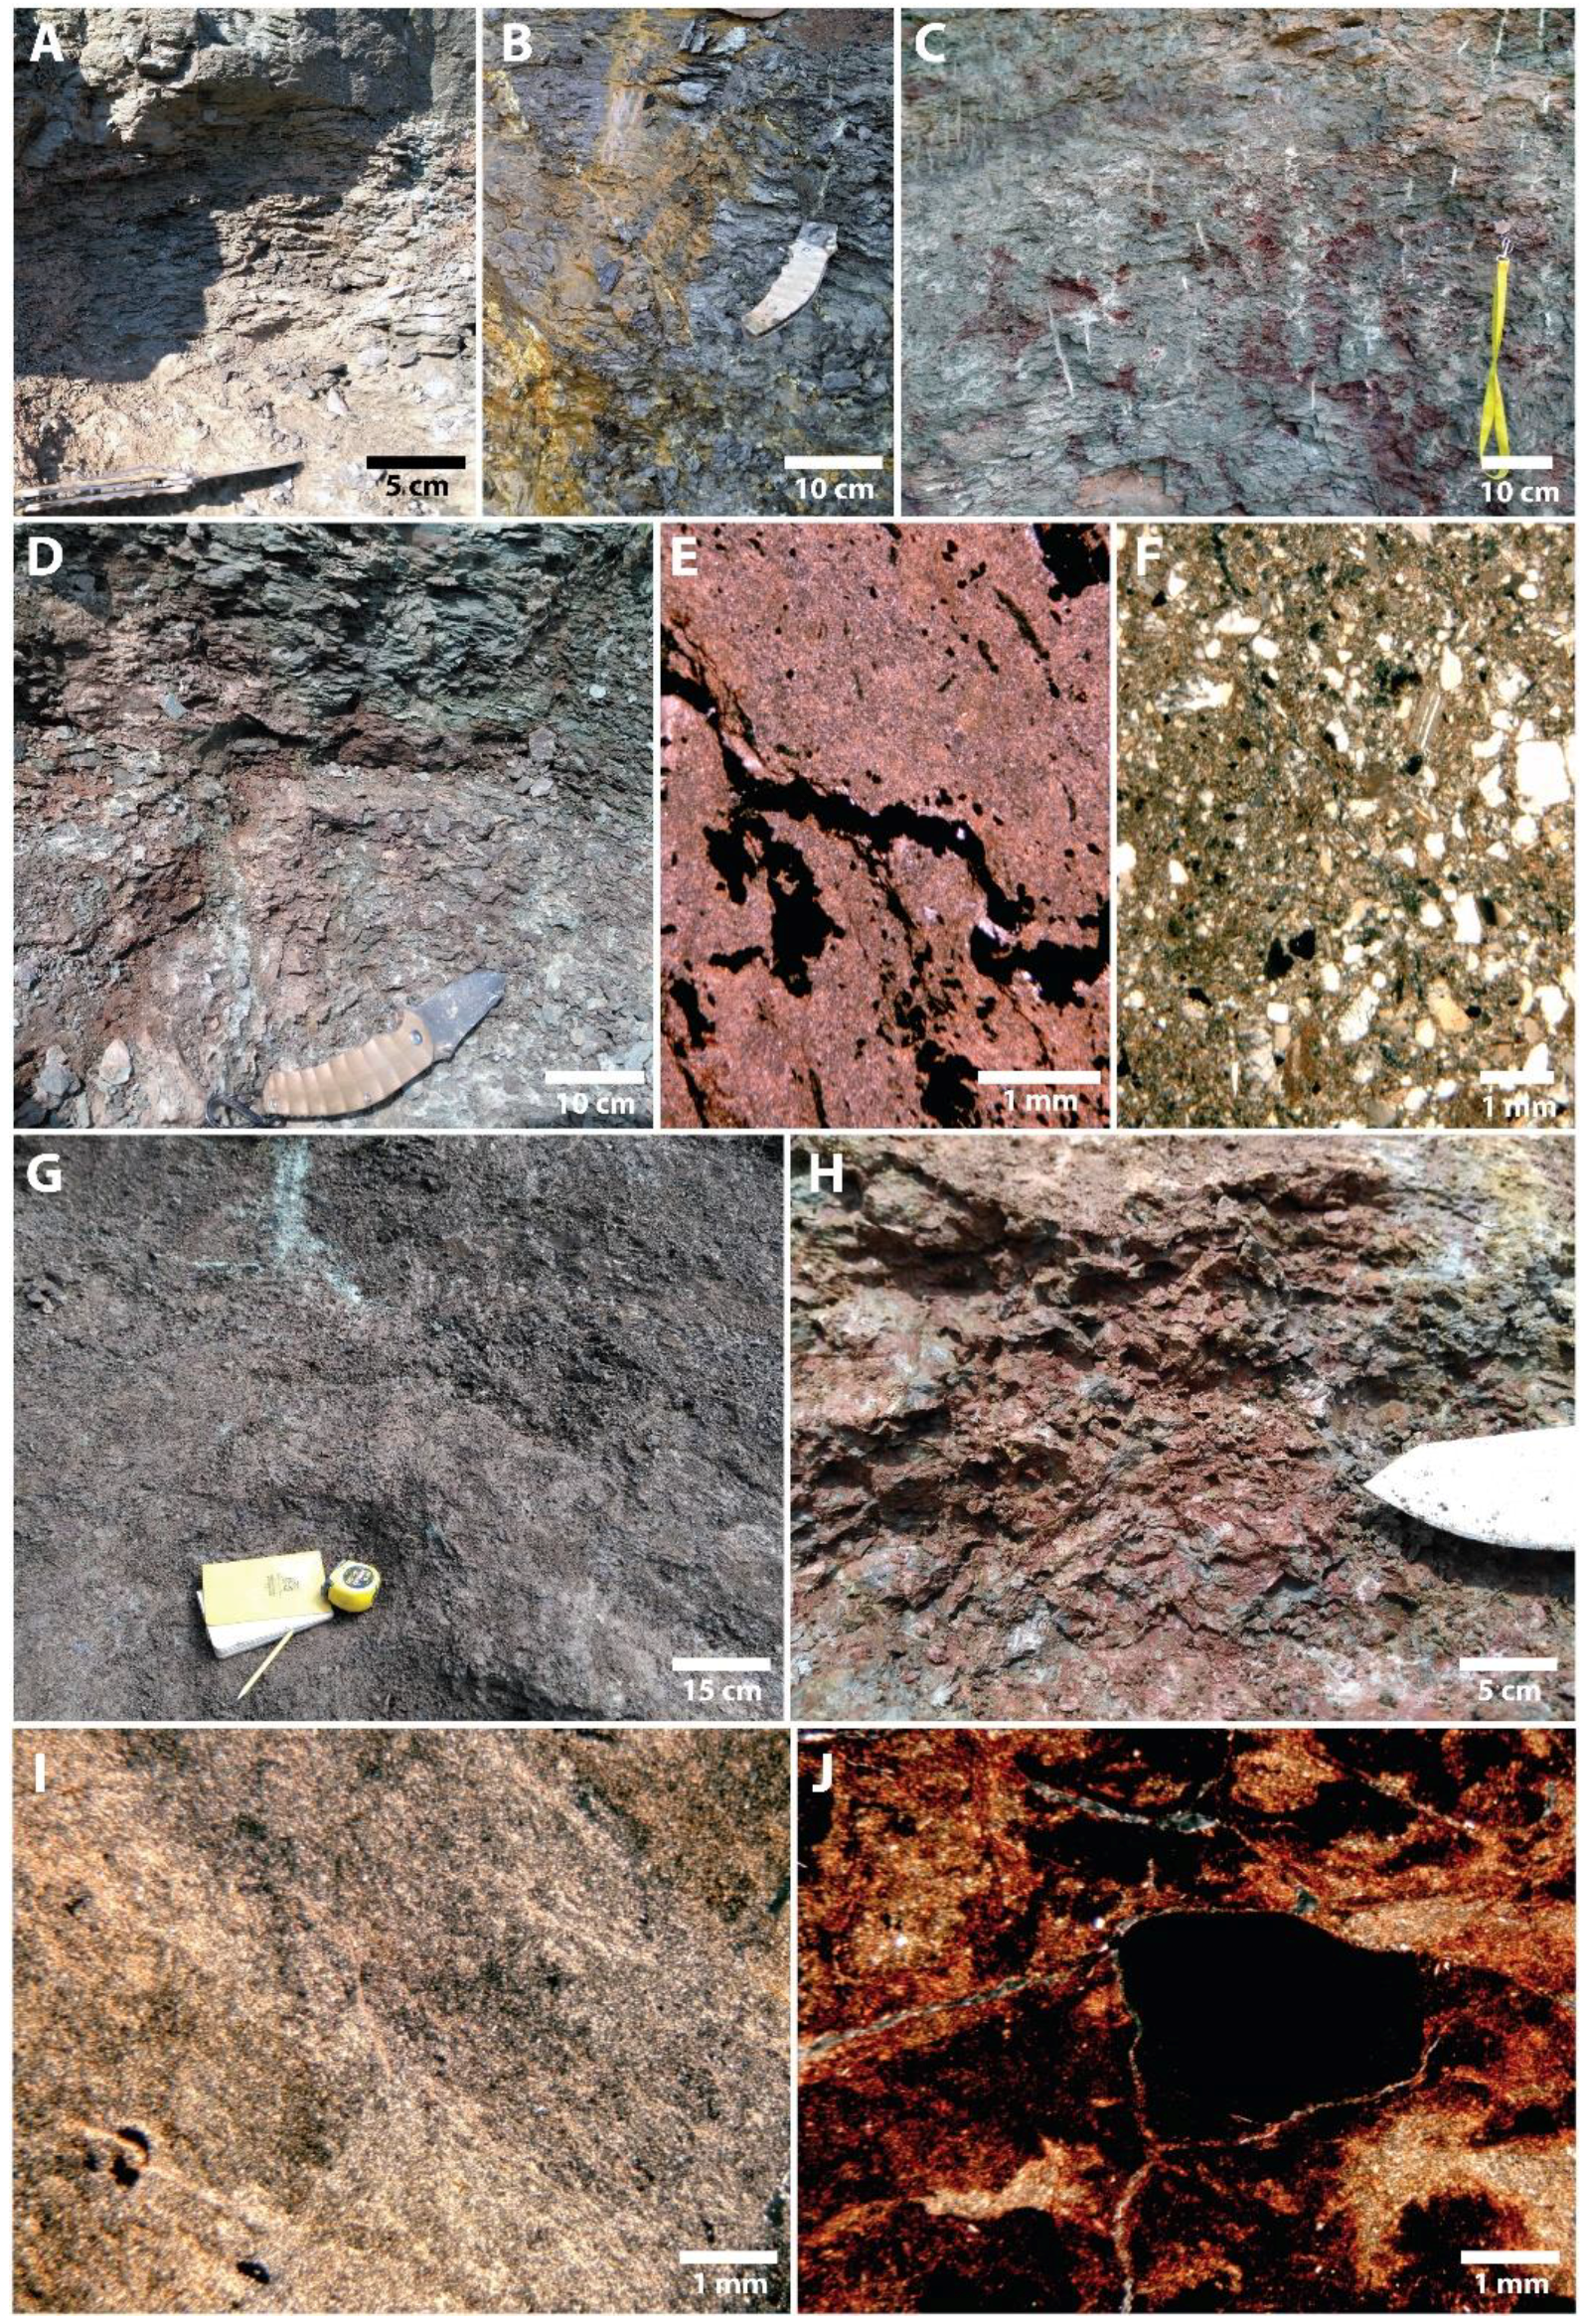
Rhizoliths, or root traces, observed in the study area include rhizohaloes, calcareous rhizoconcretions, and root casts. Rhizohaloes are the most common rhizoliths observed; whereas, root casts are the least common and typically only visible in thin section. Rhizohaloes are elongate reddish purple, grayish purple, grayish green, olive brown, and yellow mottles which branch downward or laterally and taper in the direction of branching; they are circular to elliptical in cross section, but may be irregular (Figure 5A–D). Rhizohaloes may consist of multiple colors, typically with a drab center, and rarely an organic center. Rhizohaloes range from horizontal to vertical; however, the dominant orientation is vertical to subvertical. Horizontal rhizohaloes are uncommon, occurring alongside vertical rhizohaloes or in thin, immature paleosols. Size of rhizohaloes varies by color. Purple rhizohaloes are 0.5–60.0 cm (typically 3–20 cm) long and 1–5 cm wide. Yellow and olive brown rhizohaloes are typically <10 mm long and <1 mm wide. Grayish green rhizohaloes are 1–8 cm (typically <3 cm) long and 0.5–20.0 mm (commonly <2 mm) wide. Rhizohaloes are commonly uniformly distributed throughout paleosols, but grayish green rhizohaloes can be patchy or clustered. Rhizoconcretions are generally rare in the study area and only occur in a few paleosols.
Calcareous rhizoconcretions occur in outcrop as vertically stacked clusters of downward tapering, calcareous nodules. Rhizoconcretions commonly associated with gray green rhizohaloes are small (~0.5–1.0 mm diameter), whereas larger (2–3 cm long and 0.5–1 cm wide) rhizoconcretions are not associated with rhizohaloes. Rhizoconcretions observed in thin section consist of a central, dark, branching shaft surrounded by radiating calcite crystals that taper downward (Figure 5E,F). These rhizoconcretions are ~0.2–0.7 mm wide and ~2.5–3.5 mm long. Root casts were observed in thin section only and consist of ~3–5 mm long and ~0.5–1.0 mm wide, vertical, downward tapering shafts passively filled with silt-sized quartz and fine-grained clay material (Figure 5H). Commonly, root casts are surrounded by drab colored rhizohaloes that taper and branch downward.

4.2.2. Passively Filled Burrows

Passively filled burrows were found in two different lithologies, an olive gray, laminated claystone and a gleyed calcareous mudstone. Passively filled burrows consist of lined and unlined tunnels with homogenous clastic fill that is similar in composition to the host lithology. Both lined and unlined burrows are ~2–6 mm long and ~0.15–0.50 mm wide and are only observed in thin section. Lined burrows possess an outer zone of compacted clay and are typically subhorizontal to subvertical; lined burrows are found only in laminated claystone. Unlined burrows are horizontal to vertical and typically exhibit greater sinuosity than lined burrows. The lined burrows are classified as Palaeophycus based on the absence of branching, distinct lining, orientation, and passive fill. The unlined burrows are classified as cf. Palaeophycus based on the absence of branching, orientation, and passive fill (Figure 6A,B).

4.3. Pedotypes

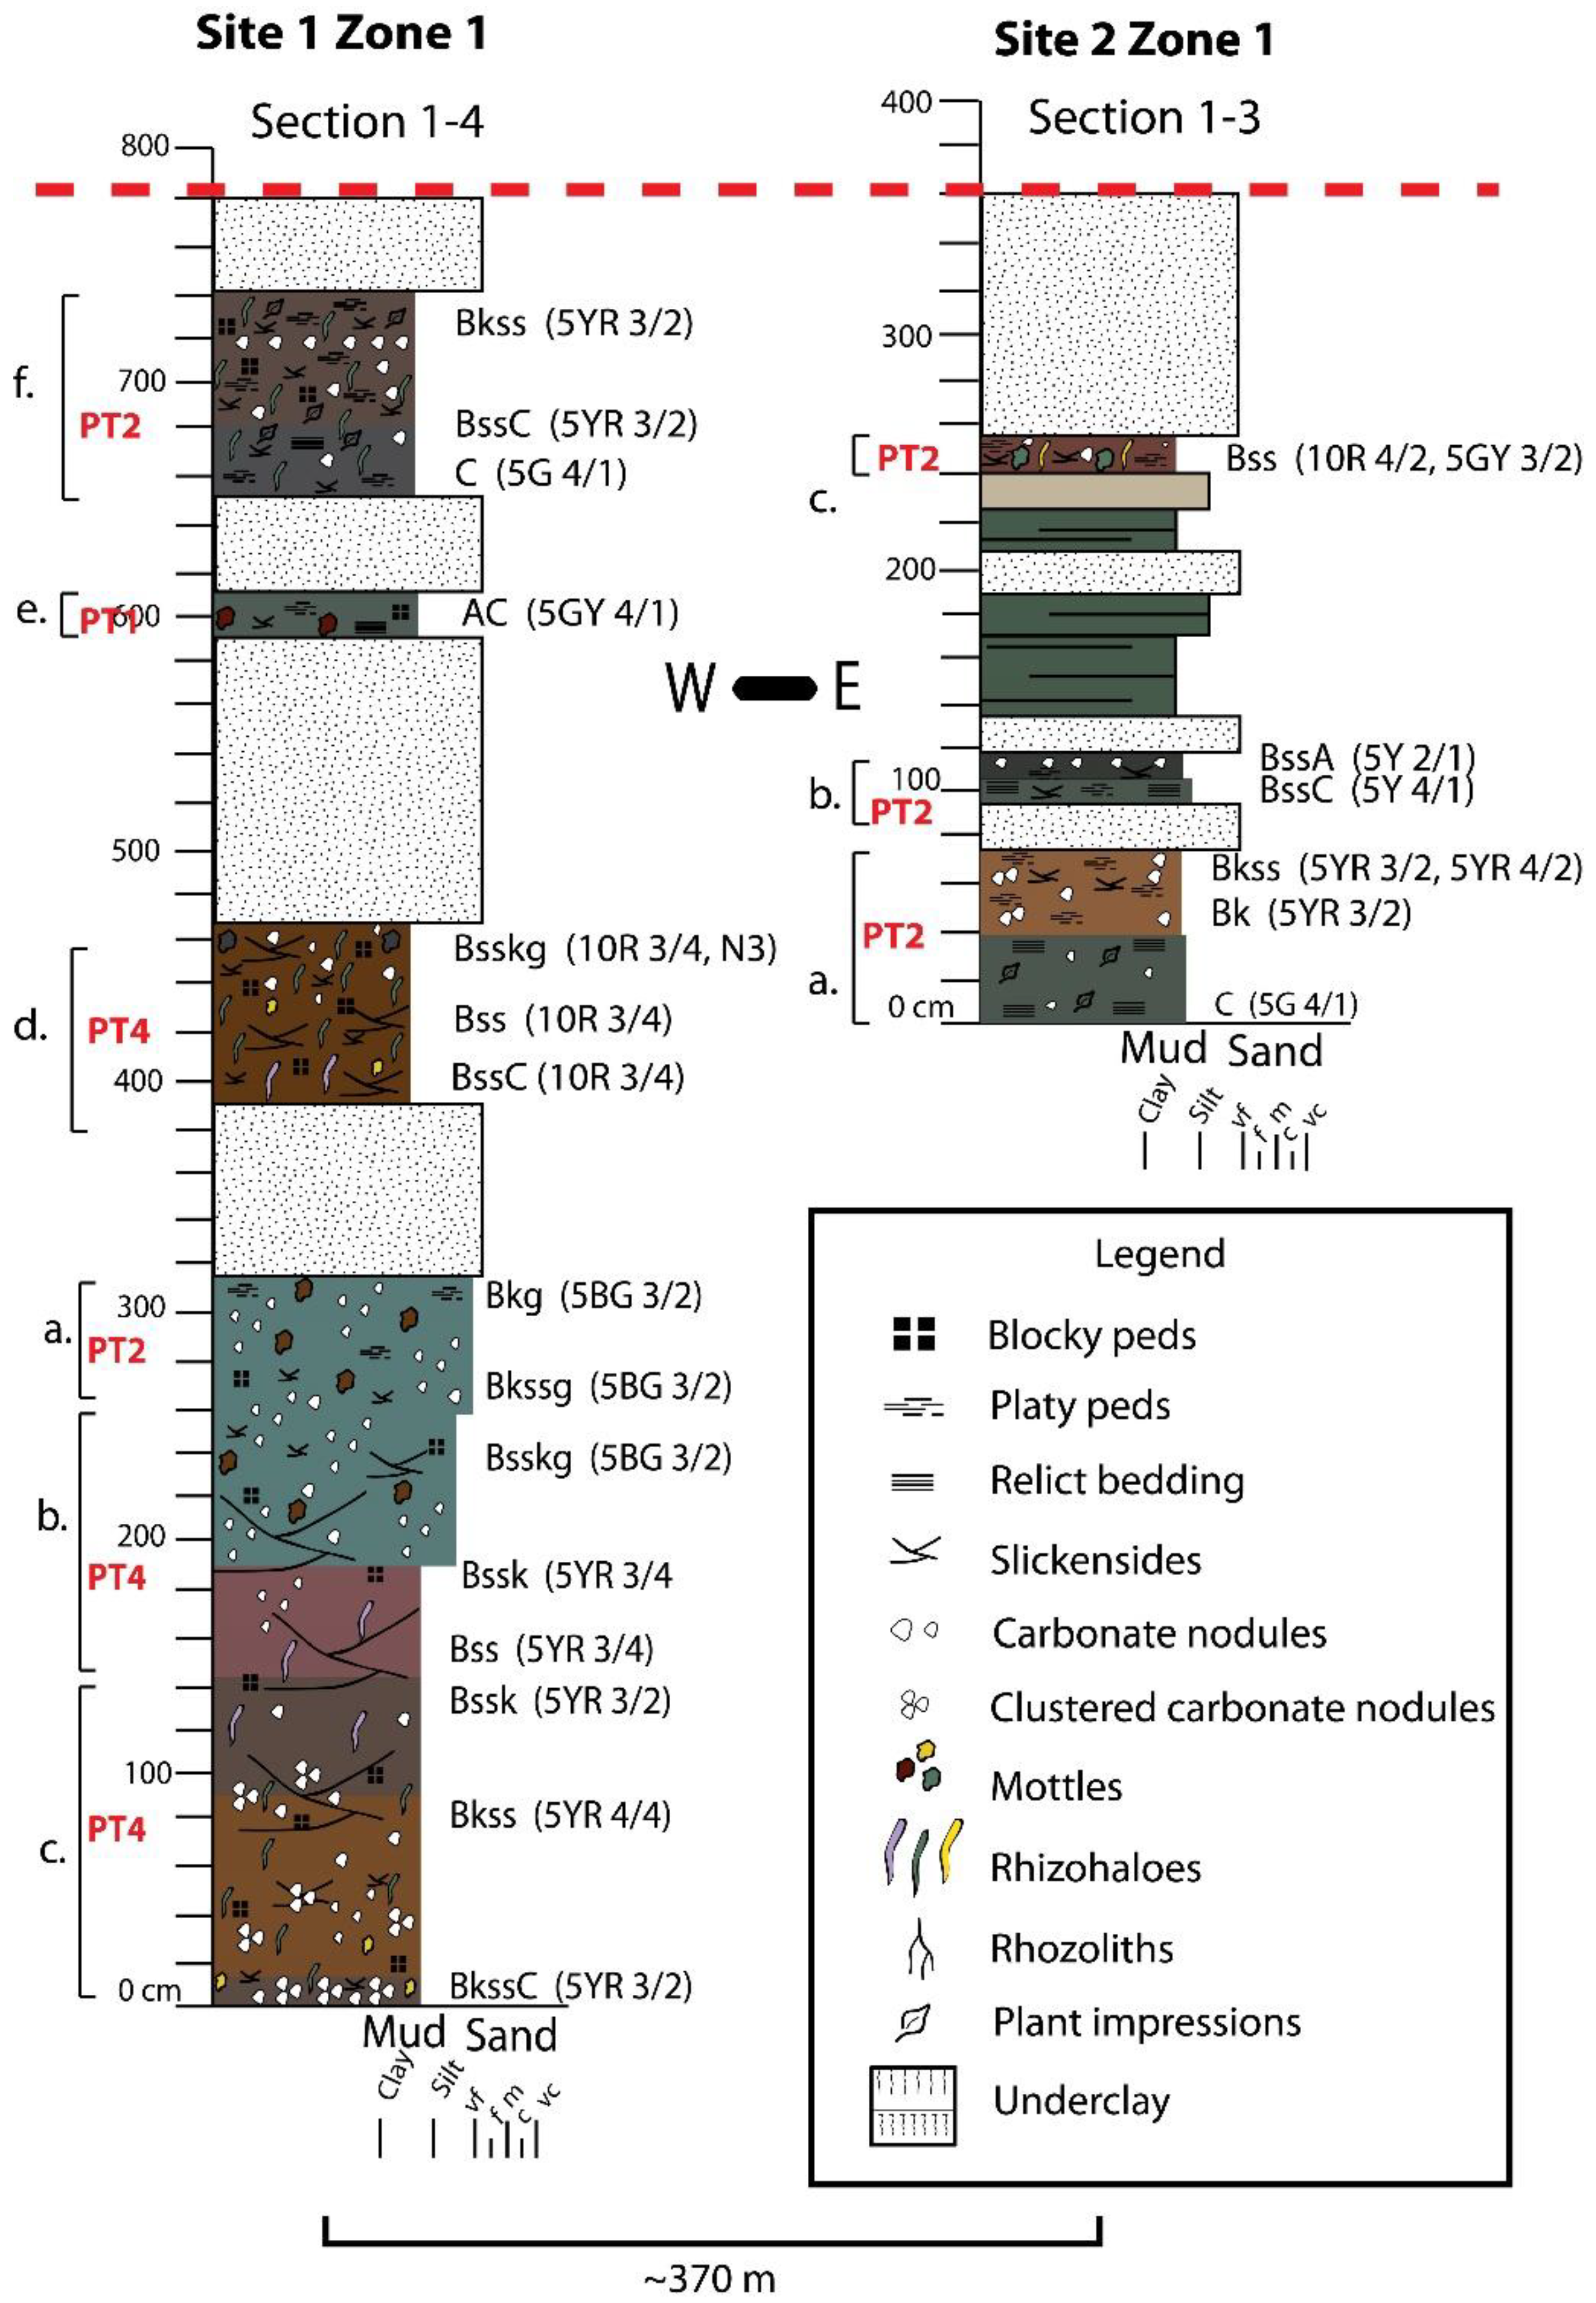
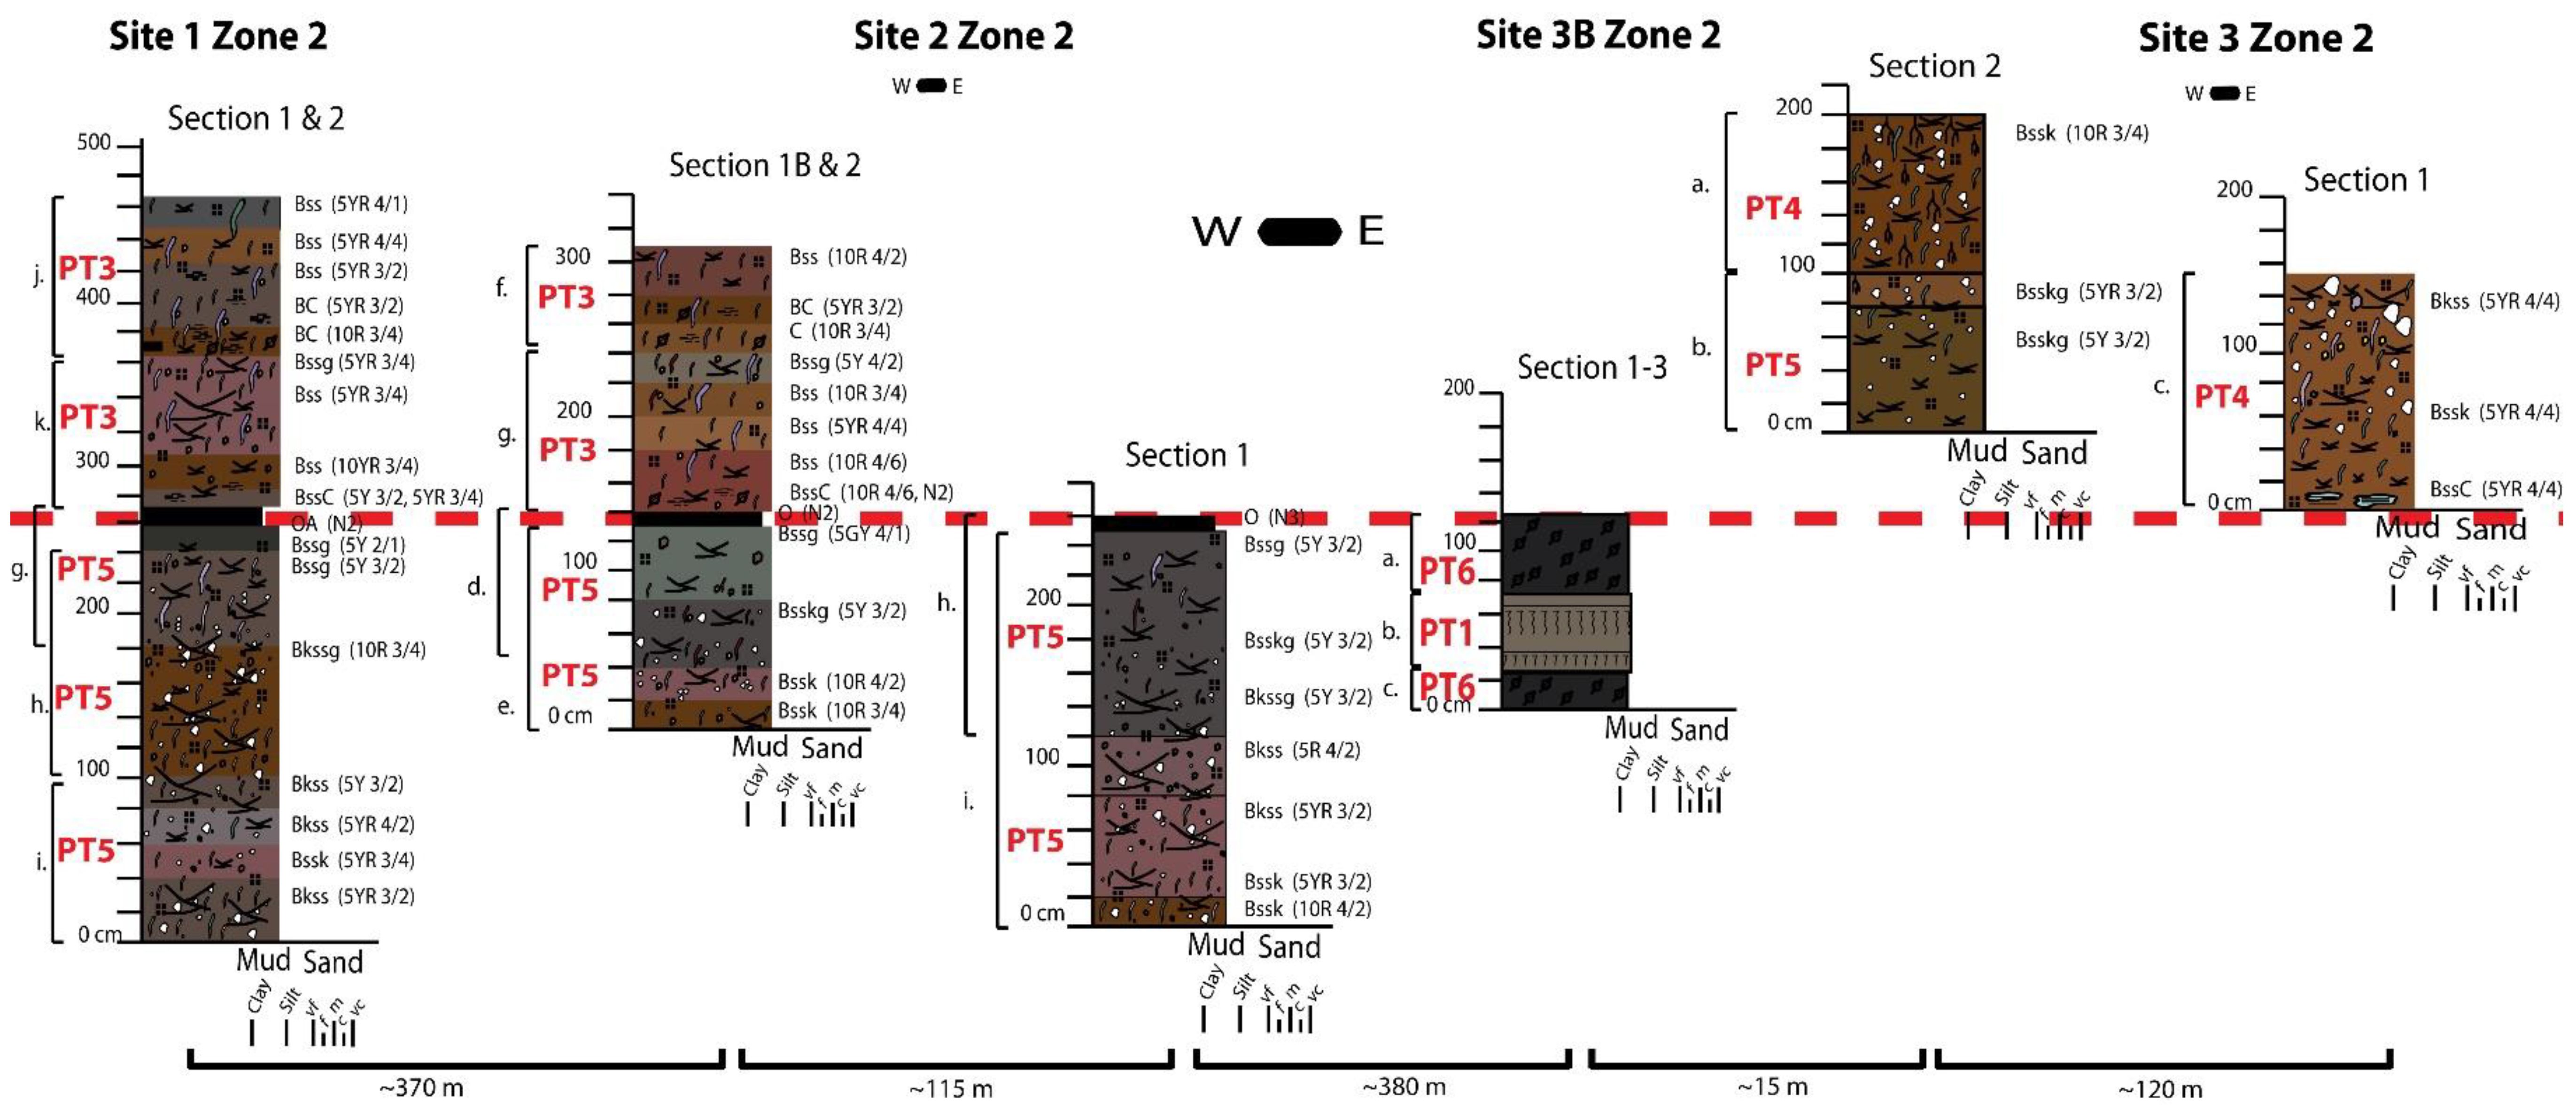
Thirty-eight paleosols of the Upper Monongahela and Lower Dunkard groups from Sites 1–3 have been grouped into six pedotypes (Figure 7, Figure 8 and Figure 9; Table 2) based on macro- and micromorphological features, as well as, similarities in molecular weathering ratios (Figure 10, Figure 11, Figure 12 and Figure 13; Supplements 2–4) and clay mineralogy (Supplement 5). Sixteen paleosols were identified in the Monongahela Group divided into four pedotypes and 22 paleosols were identified in the Dunkard Group divided into five pedotypes. Of the six pedotypes identified, one is unique to the Monongahela Group and two are unique to the Dunkard Group.

4.3.1. Pedotype 1 (PT1) Monongahela and Dunkard Groups (Protosol)

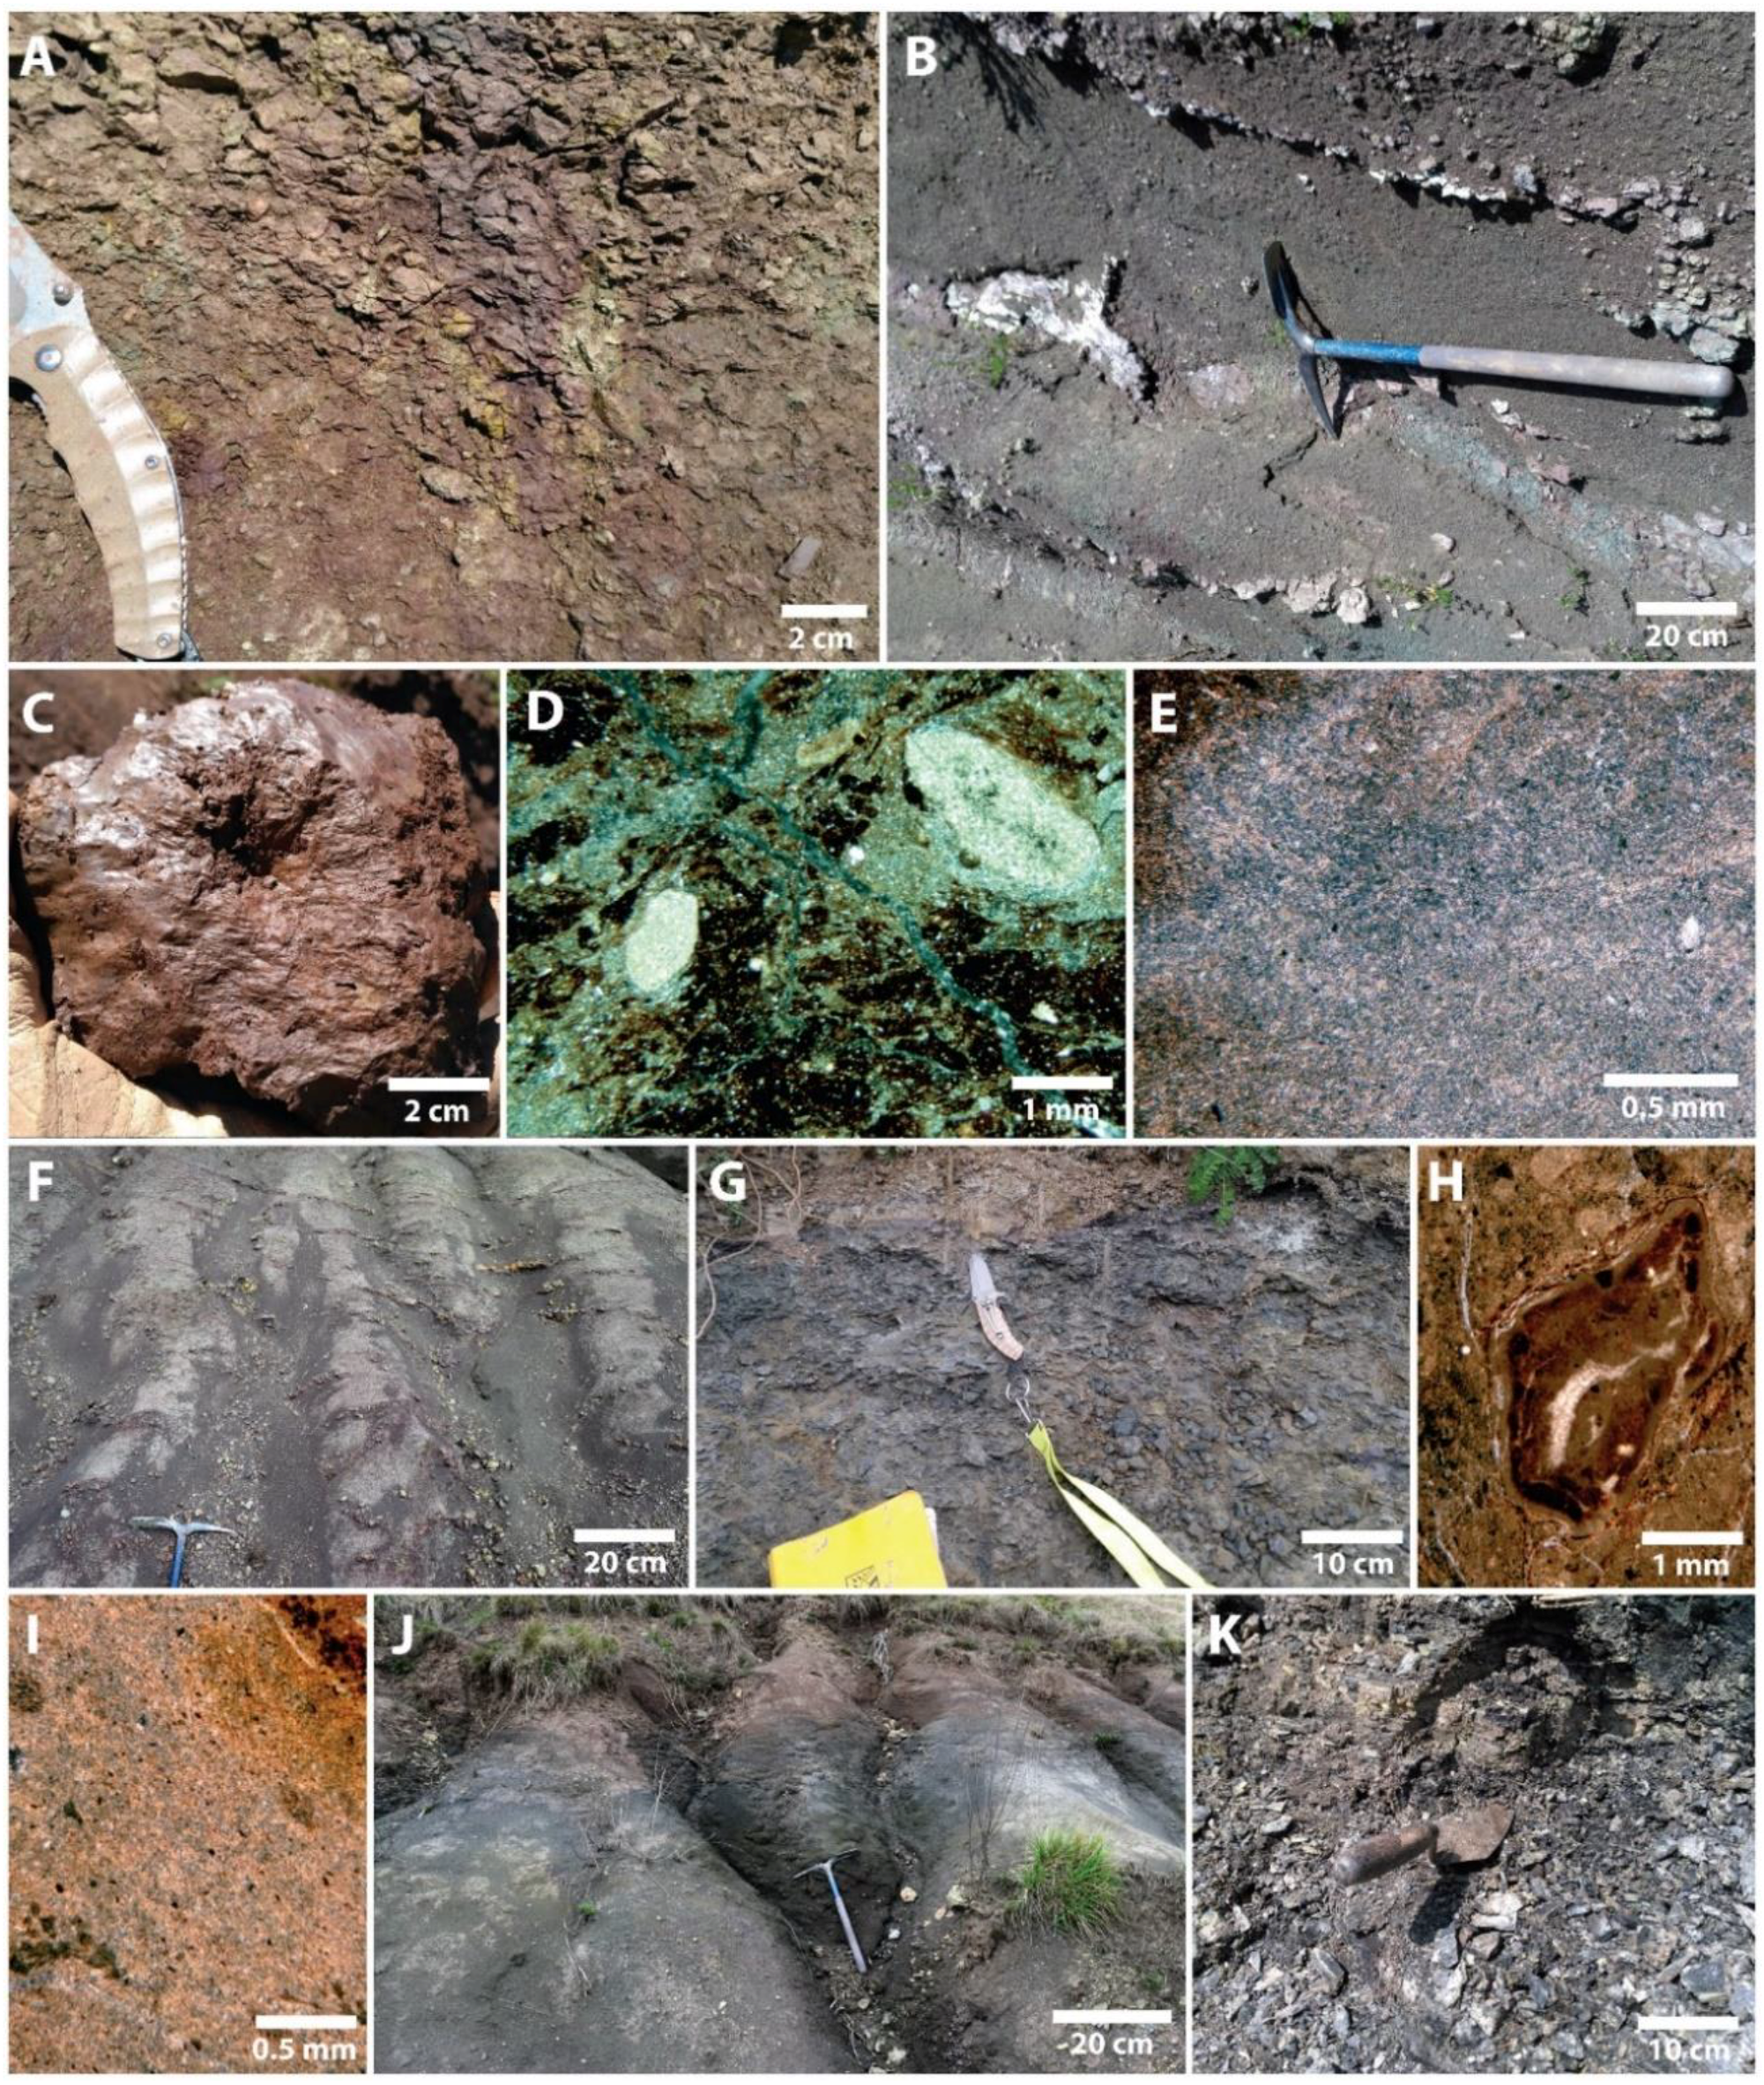
PT1 profiles (n = 4) are 0.3–0.5 m thick and characterized by immaturity, lacking definitive horizonation (Figure 7, Figure 8 and Figure 9). They consist of dusky red, platy mudstone, reddish-brown and grayish-green, variegated, platy mudstone, and olive gray and black, laminated claystone (Figure 14A,B). PT1 profiles are silty, containing silt-sized quartz grains and, less commonly, silt-sized flakes of mica. Relict bedding is common throughout much of the PT1 profiles and they commonly contain abundant fragments of organic matter and plant body fossils (small ferns, horsetails, and woody/fibrous stem material) (Figure 6C–F). Palaeophycus and cf. Palaeophycus were observed in the laminated claystone. The platy mudstones contain sparse and patchy, small (~1 mm wide), horizontal, grayish-green rhizohaloes, whereas the claystone contains thin (1–2 mm) stringers of coal and abundant organic matter dispersed throughout. In the platy mudstones, small (<1 mm) micritic carbonate nodules occur uncommonly in thin section associated with secondary spar. PT1 plasmic microfabrics are skelsepic and mosepic to argillasepic; grain fabrics are porphyroskelic. Clay minerals in PT1 profiles are dominated by kaolinite, illite, and mica and contain lesser quantities of mixed layer illite-smectite (Supplement 5). Base loss is greatest in the uppermost portion of PT1 profiles (Figure 10, Figure 12 and Figure 13, Supplements 2–4).

4.3.2. Pedotype 2 (PT2) Monongahela Group (Calcic Protosol)

PT2 profiles (n = 5) are 0.15–0.92 m thick and are characterized by weak horizonation (Figure 7). PT2 consists of reddish-brown, dark olive gray, and variegated (reddish-brown and olive green), platy to angular blocky, silty mudstones and blueish green-gray and reddish-brown, variegated sandstone and mudstone (Figure 14C,D). The mudstones contain some relict lamination and bedding which tends to be concentrated in the lowermost part of the profiles. PT2 profiles contain small (~1–40 mm) carbonate nodules and very small (~1–2 cm) slickensides and poorly developed argillans which vary from rare to common. PT2 profiles commonly contain gray green rhizohaloes and uncommonly yellow rhizohaloes, carbonate nodules, and rare root casts. Rhizohaloes are small (~1–3 cm long, 1–3 mm wide), vertical to subvertical and typically evenly dispersed, but sometimes have a patchy distribution. Plant body fossils may be present in the lowermost portions of PT2 profiles and at the tops of truncated profiles, but are uncommon. Grain microfabrics for PT2 profiles are commonly porphyroskelic to uncommonly granular or intertextic. Plasmic microfabrics range from silasepic (uncommon), insepic, and mosepic to masepic (Figure 14E,F). Quartz grains in fine-grained clay matrix are common to abundant and sometimes form the infill of vertical root casts that can be observed in thin section. Small (<1 mm) nodules of hematite and stippling are uncommonly observed in some thin sections from PT2 profiles. PT2 profiles are dominated by kaolinite, illite and mica, and uncommonly chlorite and contain lesser amounts of mixed layer illite-smectite (Supplement 5).

4.3.3. Pedotype 3 (PT3) Dunkard Group (Ferric Vertisol)

PT3 profiles (n = 4) are 0.32–0.50 m thick and are dominated by abundant small- (~3 mm) to medium-scale (15 cm) slickensides (Figure 8). PT3 consists of dark olive gray to reddish-brown and red to reddish-brown and dusky red, silty, angular blocky mudstone that are generally non-calcareous (Figure 14G). Vertical to subvertical, purple, grayish purple, grayish-green, and yellow (less common) rhizohaloes are evenly distributed and abundant throughout PT3 profiles and are most abundant in profile tops (Figure 14H). Grayish-green rhizohaloes are typically small (~1–4 cm long, 1–3 mm wide), whereas purple mottles are larger (~5–35 cm long, 1–5 cm wide). Argillans and weakly-developed metallic argillans are observed in repeating horizons and are often associated with slickensides. The grain microfabric in PT3 profiles is porphyroskelic whereas plasmic microfabrics are argillasepic (uncommon), skelsepic, mosepic (most common), masepic and bimasepic (Figure 14I). Silt-sized quartz grains are common throughout PT3 profiles. Small (<1 mm) nodules of hematite and iron stippling are commonly observed in most thin sections (Figure 14J). Clay mineralogy is primarily dominated by kaolinite and chlorite concentrated heavily in the lowermost portions of the profiles and by lesser amounts of illite and mica and mixed layer illite-smectite throughout the profiles (Supplement 5). Molecular weathering ratios indicate greater base loss and increased hydrolysis in the bottoms of PT3 profiles (Figure 11, Supplement 3).

4.3.4. Pedotype 4 (PT4) Monongahela and Dunkard Groups (Calcic Vertisol)

PT4 profiles (n = 15) are 0.50–2.10 m thick and are characterized by abundant carbonate nodules and slickensides (Figure 7, Figure 8 and Figure 9). PT4 consists of reddish-brown to dusky red, subangular to angular blocky mudstones containing clustered to diffuse, purple and reddish purple, yellow, and gray green, vertical to subhorizontal, small (~1–3 cm long, 1–4 mm wide) to large (~4–40 cm long, 2–6 cm wide) rhizohaloes (Figure 15A–C). Cf. Palaeophycus was observed in one profile in Zone 3 Site 3 (Figure 6A,B). PT4 profiles contain abundant small- (~1–5 cm) to large-scale (>20–50 cm) slickensides, as well as, abundant small (<1–10 mm) to large (~2–4 cm) carbonate nodules often occurring along slickenside planes or as rhizoconcretions and associated with grayish-green or purple mottles (Figure 15D). Less commonly rhizoconcretions occur as well-defined, dendritically branching, solid shafts of carbonate; these tend to directly underlie truncation surfaces. Slickensides and carbonate nodules commonly occur in repeating horizons. Weakly-developed argillans and metallic argillans are common and generally occur in association with slickensides. Relict bedding is present in the lowermost portion of profiles, but is uncommon. PT4 profiles are commonly silty and silt-sized grains are dominantly quartz. Plasmic microfabrics are mainly mosepic to masepic (Figure 15E), sometimes calciasepic and crystic or uncommonly argillasepic, isotic, or bimasepic; grain PT4 profiles are illite and mica as well as kaolinite; less common clay minerals are mixed layer illite-smectite and chlorite (Supplement 5). Leaching of bases tends to be a dominant process in PT4 profiles and greater leaching occurs in horizons with reduced or absent carbonate nodules (Figure 10, Figure 12 and Figure 13, Supplements 2–4).

4.3.5. Pedotype 5 (PT5) Monongahela and Dunkard Groups (Gleyed Calcic Vertisol)

PT5 profiles (n = 5) are 1.00–2.45 m thick and are characterized by the presence of deep gleization features, as well as carbonate nodules and slickensides (Figure 8). PT5 consists of silty, olive gray green and olive gray, platy to angular blocky mudstones that grade downward into red to reddish-brown mudstone or, rarely silty, olive brown to reddish-brown, angular blocky mudstone (Figure 15F,G). PT5 profiles contain vertical to subhorizontal, grayish-green and dusky red rhizohaloes and yellow and olive brown mottles. Grayish-green rhizohaloes have a range from small to large (~1–20 cm long, 1–30 mm wide), whereas purple mottles are typically larger (~5.0–35.0 cm long, 0.5–5.0 cm wide). PT5 profiles contain abundant small- (<3 cm) to large-scale (~3–>30 cm) slickensides as well as abundant small (~1–2 mm) to large (~10–40 mm) carbonate nodules which are often coalescent along slickenside surfaces (Figure 15H). Weakly-developed argillans and metallic argillans are common and generally occur in association with slickensides. PT5 profiles may also contain rhizoconcretions. Silt-sized grains of quartz are abundant. Small (<1 mm) bone fragments were observed in thin section in one PT5 profile at Zone 2 Site 3 (Figure 6G,H). Grain microfabrics for PT5 are porphyroskelic and plasmic microfabrics are skelsepic, mosepic and masepic and, less commonly, argillasepic or calciasepic (Figure 15I). The dominant clay minerals are mixed layer illite-smectite and illite and mica with lesser amounts of kaolinite and chlorite. In the olive brown blocky mudstones, illite and mica is dominant with lesser amounts of all other clay minerals (Supplement 5). Base loss for PT5 profiles is greatest in the tops of profiles. Calcification increases downward, whereas the leaching of bases is greatest in the uppermost portions of the profiles (Figure 11 and Figure 12, Supplement 3).

4.3.6. Pedotype 6 (PT6) Dunkard Group (Histosol)

PT6 profiles (n = 5) are 0.02–0.50 m thick and are characterized by accumulation of organic matter at the uppermost portion of the profiles (Figure 8). PT6 contains black to gray black coal and olive gray, platy, carbonaceous mudstone (Figure 15J,K). Plant body fossils observed are small ferns and fibrous stem material; however, most plant material has been completely coalified and is generally indistinguishable. Underlying the PT6 profiles are red to reddish-brown or olive gray, angular blocky mudstone containing carbonate nodules and slickensides; olive gray to black, laminated claystone; or olive gray silty laminated mudstone. All underlying strata exhibit deep gleization features.

5. Discussion

5.1. Paleosol Interpretations

Paleosols can be used to reconstruct landscape properties such as paleotopography and proximity to fluvial channels which can subsequently be used to interpret alluvial paleoenvironments and subenvironments [2,28,29,30,31,32]. Local paleohydrology, erosional landscapes, sedimentation rates, and the time of formation can be interpreted using such properties as rhizoliths and gleization, truncation surfaces, paleosol type (cumulative, composite, compound), and paleosol maturity [2,3,33,34].

5.1.1. Pedotype 1 (PT1) Landscapes

PT1 paleosols are Protosols [35] interpreted as Ustifluvents and Epiaquents [4,36]. Ustifluvents are Entisols that form in non-sand alluvium under an ustic soil moisture regime and Epiaquents are Entisols defined by episaturation, e.g., [4,36]. PT1 paleosols consist of simple AC horizons that are reddish-brown to dark olive gray indicating variable oxidizing and reducing soil environments, respectively (Figure 7, Figure 8 and Figure 9; Table 2) e.g., [3,37]. Relict bedding, abundant organic matter, plant impressions, and sparse to absent grayish-green horizontal rhizohaloes indicate weak soil development and short exposure time, ~101–102 years, e.g., [3,34,38]. PT1 paleosols often occur above truncation surfaces of underlying paleosols or between crevasse splay sandstone units and, therefore, represent composite and compound paleosols, e.g., [2,38]. Abundant plant matter and horizontal grayish-green rhizohaloes indicate high soil moisture, e.g., [2,3,32,33]. The abundance of kaolinite also indicates a high soil moisture regime, e.g., [9,25,39]. PT1 plasmic microfabrics indicate some downward illuviation of clay minerals in Ustifluvents, but a lack of illuviation in Epiaquents, e.g., [3]. The abundant quartz silt and sand throughout the profiles, as well as relict bedding and the interpreted high soil moisture, indicate that these composite and compound paleosols formed due to channel switching and likely represent levee or proximal floodplain environments, e.g., [2,3,38].

5.1.2. Pedotype 2 (PT2) Landscapes

PT2 paleosols are calcic Protosols [35] interpreted as Calciusteps and Quartzipsamments, e.g., [4,36]. Calciusteps are Inceptisols defined by the occurrence of a calcic horizon within 100 cm of the soil surface and Quartzipsamments are Entisols defined by a quartz grain content of >90% in their sand fraction, e.g., [4,36]. PT2 paleosols consist of Bssk, Bsskg, Bkss, and BC horizons truncated by channel sandstone indicating periodic landscape instability (Figure 7; Table 2) e.g., [2,39]. PT2 paleosols are, therefore, interpreted to be composite and compound (most common) paleosols, e.g., [2,39]. The reddish-brown to variegated reddish-brown and grayish-green color indicate variable hydrology, e.g., [3,37]. Yellow and grayish-green horizontal to vertical (most common) rhizohaloes suggest that this variation involves periodic high soil moisture with a fluctuating water table, e.g., [3,34]. Dominance of kaolinite and the common occurrence of grayish-green rhizohaloes also support a high soil moisture regime, e.g., [9,26,40]. However, the reddish-brown matrix color and the purple and yellow rhizohaloes indicate that the paleosols were generally well-drained, e.g., [3,37]. Plasmic microfabrics in PT2 paleosols indicate variable degrees of downward illuviation of clay minerals within profiles [3]. Slickensides and carbonate nodules indicate a seasonal precipitation pattern with a distinct dry season, e.g., [3,21,39]. Plant impressions and relict bedding suggest relative paleosol immaturity, yet the slickensides and carbonate nodules indicate greater development than PT1 paleosols, e.g., [39]. PT2 paleosols are, therefore, interpreted to have had an exposure time of ~102–103 years, e.g., [38]. Abundant quartz silt and sand, truncation by channel sandstone, and the presence of slickensides and carbonate nodules indicate that PT2 paleosols formed on a relatively stable landscape punctuated by intervals of channel switching and flooding events, e.g., [2,39]. PT2 paleosols likely formed in proximal floodplain environments, e.g., [3].

5.1.3. Pedotype 3 (PT3) Landscapes

PT3 paleosols are ferric Vertisols [35] interpreted as Haplusterts, or Vertisols that contain open cracks at least 90 days of the year and form in a seasonal or monsoonal climate, e.g., [4,36]. PT3 paleosols consist of Bss, Bssg, Bsskg, BssC, and BC horizons (Figure 8; Table 2). Their reddish-brown color indicates formation in a well-drained, oxidizing environment, e.g., [3,37]. Abundant slickensides indicate periodic wetting and drying that causes the swelling and shrinking of expandable clays, e.g., [3,21,26,39]. BC horizons with relict bedding, platy peds, organic matter and plant impressions overlie laterally continuous erosional surface separating stacked profiles, therefore, PT3 paleosols are interpreted as compound paleosols, e.g., [2,39]. Abundant, vertical to subvertical, purple, grayish purple, grayish-green, and yellow rhizohaloes concentrated in the tops of the Bss horizons and extending down to BC horizons indicate a periodic low water table, e.g., [3]. The grayish-green rhizohaloes indicate reducing conditions during periods of high soil moisture, whereas the purple and yellow rhizohaloes indicate moderate to well-drained oxidizing conditions with periods of reducing conditions, e.g., [2,3,33,34,40]. Abundant kaolinite and chlorite concentrated heavily in the lowermost portions of the profiles also indicate high soil moisture, e.g., [3,26]. Hematite observed in thin section suggests a well-drained, oxidized soil, supported by plasmic microfabrics showing the illuviation of clay minerals, e.g., [3,37]. Abundant, well-developed slickensides, hematite nodules and carbonate nodules indicate greater soil maturity than PT1 or PT2 paleosols. Exposure time is estimated to be ~102–103 years, e.g., [38]. Abundant quartz silt and sand indicates a steady influx of sediment; however, the sedimentation rate appears to have been low enabling maturation of the soil, e.g., [2,39]. PT3 paleosols likely formed in a moderately to well-drained environment with long periods of landscape stability and periodic flooding, likely a proximal to distal floodplain, e.g., [3].

5.1.4. Pedotype 4 (PT4) Landscapes

PT4 paleosols are calcic Vertisols [35] interpreted as Calciusterts, or Vertisols that have a calcic horizon within 100 cm of the surface, e.g., [4,36]. PT4 paleosols often occur in repeating and sometimes over-thickened Bss, Bssk, Bsskg, Bkss, Bkg, BkssC, and BC horizons (Figure 7, Figure 8 and Figure 9; Table 2). They are, therefore, interpreted to represent composite and cumulative paleosols, e.g., [2,39]. Abundant carbonate nodules, small- and large-scale slickensides, and argillans indicate a well-drained environment with wet and dry periods, e.g., [2,21,26,39]. Purple and reddish purple, yellow, and gray green, vertical to subhorizontal rhizohaloes indicate alternating oxidizing and reducing conditions, e.g., [2,3,33,34]. Illite and mica as well as kaolinite are also suggestive of a variable soil moisture regime, e.g., [3,26]. In addition, the reddish-brown matrix color and near opacity of some thin sections are evidence of hematite which indicates well-drained oxidizing conditions, whereas the presence of grayish-green rhizohaloes indicate periodic reducing conditions, e.g., [2,3,33,34,37]. PT4 plasmic microfabrics indicate downward illuviation of clay minerals as well as fluctuating soil moisture which enabled the formation of pedogenic carbonate, e.g., [3]. Based on the level of development, exposure time for PT4 paleosols is estimated to be ~103–104 years, e.g., [38]. Common quartz silt throughout PT4 profiles and truncation by sandstone or shale indicate close channel proximity. PT4 profiles are typically thick (>1 m) and the total accumulation of composite paleosols can be up to 5 m indicating a long period of landscape stability and infrequent flooding events, e.g., [2,39]. PT4 paleosols likely represent distal floodplain environments, e.g., [3].

5.1.5. Pedotype 5 (PT5) Landscapes

PT5 paleosols are gleyed calcic Vertisols (35) interpreted as Calciusterts that transition to Calciaquerts (Vertisols) e.g., [4,36]. Calciaquerts are defined by a calcic horizon within 100 cm of the surface, but indicate greater soil moisture than Calciusterts, e.g., [4,36]. PT5 paleosols consist of repeating Bssg, Bssk, Bsskg, Bkss, and Bkssg horizons (Figure 8; Table 2) with gleization that penetrates up to 1 m into the profile in the uppermost paleosols. They are, therefore, interpreted as composite paleosols, e.g., [2,39]. The reddish-brown color of the lower horizons indicates an originally well-drained, oxidizing environment, whereas the overprinting olive gray color indicates poorly-drained, reducing conditions, e.g., [2,3,33,34,37,40]. Abundant carbonate nodules and small- and large-scale slickensides, and argillans indicate periodic wetting and drying, e.g., [3,21,39]. The dusky red, yellow, and grayish-green, vertical to subhorizontal rhizohaloes also indicate oxidizing conditions followed by periods of reducing conditions and a fluctuating water table, e.g., [2,3,33,34]. Plasmic microfabrics indicate downward illuviation of clay as well as the formation of pedogenic carbonate, e.g., [3]. Dominance of mixed layer illite-smectite and illite and mica further indicate a variable soil moisture regime with distinct wet and dry periods, e.g., [3,26]. Exposure time for PT5 profiles is estimated to be ~103–104 years, e.g., [38]. Repeating horizons of carbonate nodules associated with large-scale slickensides indicates an initially well-drained environment with wet and dry periods; however, the overprinting deep gleization indicates a change in the hydrology to a high soil moisture regime with more ever-wet conditions, e.g., [3,33]. Initially, PT5 profiles likely represent a distal floodplain environment that is well-drained with periodic, wet and dry cycles and oxidizing conditions followed by a transition to a marsh or fen environment, e.g., [3]. Subsequently, water saturation occurred causing reducing conditions. The widespread nature of this transition across the three sites and the depth of gleization suggest that this transition represents a regional scale change in precipitation, e.g., [3,41].

5.1.6. Pedotype 6 (PT6) Landscapes

PT6 paleosols are Histosols [35] interpreted as Hemists, or Histosols defined by the moderate decomposition of plant remains concentrated in an O horizon, e.g., [4,36]. Abundant moderately decayed preserved organic matter indicates continuous water saturation and anoxia which prevented the complete decomposition of plant matter by microorganisms (Figure 8; Table 2) e.g., [3,33]. PT6 paleosols directly overlie gleyed calcic Vertisols and underlie ferric Vertisols and are, therefore, interpreted to be composite paleosols, e.g., [3,39]. Exposure time for PT6 profiles is estimated to be ~102–103 years, e.g., [38] and they are interpreted to represent marshes or swamps on the proximal to distal floodplain, e.g., [3].

5.2. Vegetation and Soil Ecosystems

PT1 profiles contain sparse, unevenly distributed rhizohaloes that indicate patchy vegetation, e.g., [3,42]. These rhizohaloes are horizontal and grayish-green indicating that the plant life would have had to be resistant to water saturation, e.g., [3,42]. The diameter of rhizohaloes indicates that most root diameters were <1 mm. Plant impressions observed included horsetails and small ferns resembling Autunia conferta described from other locations [43,44]. Autunia conferta is an extinct pteridosperm common in Dunkard Group flora where seasonally dry conditions occurred [44]. Calamites, a giant horsetail, is commonly found in Dunkard Group coal beds and was a likely component of wet floral assemblages [19,45]. Fossil burrows (Palaeophycus and cf. Palaeophycus) indicate that soil moisture may have been at least periodically favorable for soil organisms, e.g., [3,42]. The horizontal orientation, lining, and passive fill of these burrows indicates that they were likely formed as permanent dwellings by a predatory arthropod, e.g., [46,47]. PT1 paleosols likely represent early successional vegetation in a levee or proximal floodplain, e.g., [3]. Early colonizing plants would have been at an advantage in PT1 paleosols which were low-lying in relation to the paleochannel and seasonally inundated with water, e.g., [20,45].
PT2 profiles also have unevenly distributed rhizohaloes; however, rhizohaloes are more abundant in PT2 than in PT1. This, coupled with the increased maturity of PT2 paleosols, indicates that plants were more established in PT2 paleosols. Rhizohalo diameters are still small, indicating root diameters of <1 mm. Impressions of small ferns and horsetails were also observed in PT2 paleosols, but were restricted to BC horizons. These also likely represent Calamites and small pteridosperms, e.g., [44]. Preservation of the plant impressions only in the lower horizon indicates a more stable landscape than PT1 paleosols; however, truncation of the upper surface of PT2 paleosols by sandstone is common so the landscape was still relatively unstable indicating that rhizohaloes likely represent opportunistic early colonizers, e.g., [3]. Burrows were not observed in PT2 paleosols likely due to either increased pedoturbation collapsing and obscuring burrows or to the relatively high soil moisture that may have excluded burrowing animals, e.g., [3,42]. PT2 paleosols represent early successional vegetation or, possibly, early brakeland establishment in a proximal floodplain environment, e.g., [3].
PT3 paleosols contain abundant rhizohaloes concentrated in the tops of the paleosol profiles. The distribution of these rhizohaloes transitions from uniform in the tops of profiles to patchy in the lower portions. Rhizohaloes observed in PT3 paleosols indicate a slightly broader variation in root sizes, <1 cm, but more commonly <1 mm. Rhizohaloes indicative of larger root diameter are restricted to the upper ~40–50 cm of PT3 profiles, whereas smaller rhizohaloes extend down to the BC horizons. This pattern indicates the shallow and deep tiered rooting of plants indicative of seasonal water table fluctuation, e.g., [3,42]. BC horizons contain small impressions of fossil ferns and other plant fragments. PT3 paleosols likely represent a brakeland environment, covered with ferns and other herbaceous vegetation, on a proximal to distal floodplain with long periods of stability enabling establishment of extensive flora with periodic low energy erosional flooding events, e.g., [3].
PT4 paleosols contain abundant rhizohaloes and some rhizoconcretions typically dispersed vertically throughout the profiles with a patchy or clumped distribution. Rhizohaloes are dominantly indicative of root diameters of <1 mm; however, larger roots of ~1 cm occur and extend deep into paleosol profiles. The cumulative and composite nature of these paleosols is seen in the vertically overlapping distribution of the rhizohaloes and rhizoconcretions, e.g., [2,31,39]. The patchy nature of rhizoliths coupled with the evidence of expandable clays and pedogenic carbonate indicates that vegetation would have been tolerant of a seasonal precipitation pattern with an extended dry season, e.g., [3,42]. Vegetation may have consisted of seasonally tolerant pteridosperms and some slightly larger shrub-like plants, e.g., [3,19,45]. Fossil burrows (cf. Palaeophycus) indicate some active burrowing and likely represent the dwelling behavior of a predatory arthropod, e.g., [46,47]. PT4 paleosols represent an open brakeland or shrubland environment on a distal floodplain where precipitation was a limiting factor, e.g., [3].
PT5 paleosols share a similar distribution of rhizohaloes and rhizoconcretions in the lowermost paleosol profiles to PT4 paleosols; however, rhizohaloes are more abundant in the uppermost profiles that contain deep gleization and underlie the Waynesburg Coal. In the top ~40–50 cm of these uppermost profiles, the slightly larger diameter rhizohaloes indicating root diameters of <1 cm are more common than in PT4 paleosols. Rhizohaloes indicative of root diameters <1 mm are more evenly distributed in the tops of the uppermost profiles, but gradually returns to a patchy distribution below the top ~40–50 cm. This distribution indicates initially sparse vegetation that was likely tolerant to seasonal dry periods followed by a shift to denser vegetation that could thrive in an ever-wet climate, e.g., [3,19,45]. Bone fragments indicate that vertebrates were present in the study area. PT5 profiles likely represent an open brakeland that transitions to a marsh or fen environment in a proximal to distal floodplain, e.g., [3].
PT6 paleosols contain abundant preserved organic matter indicating dense vegetation that would have been resistant to water-logged soil conditions, e.g., [3,19,45]. Preservation of partially undecomposed plant material indicates at least periodic anoxia of soil water occurred preventing decomposition of plant remains by microorganisms, e.g., [4,38]. Anoxia occurs in soils that are water saturated and poorly-drained which prevents the mixing of atmospheric O2 into groundwater [48]. Vegetation in PT6 paleosols likely consisted of Calamites and water tolerant pteridosperms which are typical of wetland flora in the Late Pennsylvanian, e.g., [20,45]. PT6 profiles are interpreted to represent an extensive marsh environment within the proximal to distal floodplain, e.g., [3].

5.3. Paleoclimatic Significance

Paleosols from the study area show evidence of strong seasonality with a general decrease in precipitation up section (Figure 7, Figure 8 and Figure 9, Table 3). However, a distinct paleoclimate humidification excursion is observed in Zone 2A paleosols. Through the entire section the range for MAP (CIA-K) is ~700–1300 mm/year in non-Vertisols, whereas the range for MAP (CALMAG) is ~170–1500 mm/year in Vertisols (Table 3). Depth to calcic horizon was not used as a precipitation proxy due to the prevalence of paleosol truncation. There is some lateral variation in the calculated paleoprecipitation values, especially in Vertisols; however, this is likely due to differences in microtopography. Gilgai microtopography is common in Vertisols and is caused by the seasonal expansion and contraction of expandable clays such as smectite [1,3,48]. When gilgai microtopography is present, some precipitation from micro-highs will be lost in surface runoff into micro-lows creating the possibility of producing disparate calculated MAP values from adjacent paleopeds depending on their microtopographical relationship [49].
Zone 1 paleosols represent a mildly seasonal precipitation pattern indicated by the occurrence of a few carbonate nodules and slickensides, e.g., [3,4]. MAP values for Zone 1 paleosols range from 905–1314 mm/year and 746–1411 mm/year for CIA-K and CALMAG, respectively (Table 3). Zone 1 MAP values for Site 1 paleosols indicate an initial drying trend followed by an increase in precipitation, whereas Site 2 paleosols only indicate a decrease in precipitation up section. This different pattern is likely due to the occurrence of thinner and less developed paleosols at Site 2 which may not be fully reflective of climatic conditions, e.g., [3,4]. The dominance of kaolinite with lesser amounts of illite and mixed layer illite/smectite indicates that, while seasonal precipitation and shrink-swell processes influenced pedogenesis, they were less dominant than the effect of high soil moisture, likely due to the proximity to the channel, e.g., [3,4,8]. Therefore, the climate signal of Zone 1 paleosols is likely muted due to local environmental controls (i.e., channel switching, short exposure times).
Zone 2A paleosols represent a strongly seasonal precipitation pattern overprinted by a more ever-wet precipitation pattern resulting in the accumulation of organics in a distinct O horizon. MAP for Zone 2A paleosols ranges from 705–1340 mm/year and 510–648 mm/year for CIA-K and CALMAG, respectively (Table 3). MAP values show an upward increase in precipitation. Abundant carbonate nodules and large, deep slickensides in Zone 2A paleosols indicate that a significant dry season occurred each year resulting in significant precipitation of pedogenic carbonate, e.g., [4,48]. Dominance by mixed layer illite/smectite indicate that shrink-swell processes played a significant role in the formation of Zone 2A paleosols, strengthening the interpretation of strong seasonality, e.g., [3,4]. This strong seasonality then transitioned to a more ever-wet precipitation pattern indicated by the deep gleization of the calcic Vertisols and the presence of the laterally continuous and regionally mappable coal (Waynesburg Coal) e.g., [3,4,48].
Zone 2B paleosols represent a gradual return to a seasonal precipitation pattern. Seasonality was weak at first, but became stronger, evidenced by the lack of carbonate nodules in the bottom ~1.5–2.0 m of paleosols directly above the coal and the appearance of small (~1–5 mm) carbonate nodules in stratigraphically higher paleosols at Site 3. MAP values for Zone 2B paleosols range from 728–1545 mm/year (Table 3). Lower MAP values are observed from Site 3, whereas higher values are observed from Sites 1 and 2; however, the general trend is a decrease in precipitation up section. Zone 2B paleosols from Sites 1 and 2 just above the coal possess the three highest calculated MAP values in the study area. Dominance by kaolinite and illite with lesser amounts of mixed layer illite/smectite suggesting that seasonality was not as influential as in Zone 2A paleosols, e.g., [3,4].
Zone 3 paleosols represent a return to a strongly seasonal precipitation pattern containing a distinct dry season for part of the year represented by the return of abundant carbonate nodules and large-scale slickensides, e.g., [3,4,48]. Kaolinite and illite are the most dominant clay minerals in Zone 3; however, some paleosols include small amount of mixed layer illite/smectite. This suggests that some of the illite may have been formed by burial diagenesis, e.g., [50]. MAP values for Zone 3 paleosols range from 728–1545 mm/year, decreasing up section indicating a drying trend (Table 3). MAP values for Zone 3 showed significant lateral variability. This variability is likely due to gilgai microtopography based on the vertic nature of the paleosols. The MAP values obtained for Zone 3 are, therefore, likely overestimates for microlows and underestimates for microhighs, e.g., [49].

5.4. Autogenic vs. Allogenic Controls

Much of the variation in the paleosols and associated facies in the study area can be explained by local-scale environmental changes within the fluvial system. The type and maturity of paleosols and the abundance of vegetation reflects the distance from the paleochannel as well as the frequency of flooding and sedimentation rates [2,3,4,39]. Paleosols formed on a channel levee or proximal floodplain will be frequently inundated with water and sediment producing immature compound paleosols [2,31,39]. In contrast, paleosols formed on a distal floodplain will be less frequently flooded and experience lower rates of sedimentation producing more mature paleosols [2,31,39]. However, these are two end-members and variations in microtopography or hydrologic conditions within an environment can produce different paleosols in close proximity to one another [38].
In Zone 1, most paleosols were relatively immature, bounded or truncated by crevasse splay and channel sandstone, and exhibited very few rhizohaloes. Better-developed paleosols exhibited more abundant rhizohaloes which often displayed tiering within profiles. The abundance of sandstone beds and the frequency of truncation of Zone 1 paleosols by sandstone indicate formation in close proximity to a paleochannel, e.g., [2,31,39]. Zone 1 paleosols formed in a levee or proximal floodplain environment where frequent burial by sediment during floods prevented maturation and excluded most plants with the exception of opportunistic early colonizers, e.g., [4,48].
Dominance of autogenic processes also occurs in Zone 2A. The Histosol is relatively thin in Sites 1 and 2, thickens toward Site 3B, and then pinches out entirely by the end of Site 3 into grayish-green sandstone. The thicker Histosol likely represents a more central location within a widespread paleomire, whereas the thinner Histosol is on the edge, e.g., [4]. The underclay separating the upper and lower portions of the Histosol at Site 3B likely represents an increase in clastic input due to channel migration, e.g., [3,4]. The lateral continuity of the Histosols and the underlying gleyed calcic Vertisols indicates that Zone 2A paleosols were initially formed in a distal floodplain environment with good drainage which was subsequently water saturated to form an open mire system in which peat accumulated, e.g., [3,4]. Zone 2A paleosols are mature indicating that they formed in a relatively stable environment with minimal influence from channel migration, e.g., [4,38].
Zone 2B paleosols contain more evidence of seasonal influence in Site 3 than in Sites 1 or 2. Site 3 paleosols contain soil carbonate within ~20–40 cm of Zone 2A, whereas paleosols from Sites 1 and 2 do not contain soil carbonate for ~2 m above Zone 2A. This lateral variation indicates a more lowland setting for paleosols in Sites 1 and 2 than for paleosols in Site 3, e.g., [4,38]. Surface runoff from local topographic highs would collect in topographic lows preventing the accumulation of soil carbonates if drainage was inhibited, e.g., [38,48]. Zone 2B ferric and calcic Vertisols likely formed in a distal to proximal floodplain environment that was more affected by channel migration than the gleyed calcic Vertisols of Zone 2A as indicated by the laterally continuous erosional surface that separates Zone 2B paleosols in Sites 1 and 2. However, paleosols from Zone 2B are still relatively mature indicating that flooding events were infrequent, e.g., [2,3,4].
Zone 3 paleosols were also influenced by channel switching despite their strong development. A few small-scale erosional events occurred lower in Zone 3, but are not laterally extensive. Higher in Zone 3, however, channel migration becomes a more influential process as paleosols are truncated by sandstone and shale. The over-thickened nature of Zone 3 paleosols indicates they likely formed in a stable, well-drained, distal floodplain with infrequent localized flooding events, e.g., [2,3,4]. However, channel migration becomes a major control and the accumulation of channel sandstone indicates that channel switching brought the paleochannel proximal to the study area.
Overprinting these local scale variations in paleosols is an average vertical change in paleosol properties and rhizolith distribution that point to an allogenically controlled shift to a drier, more seasonal climate, albeit with a more complex pattern than originally anticipated. Zone 1 paleosols exhibit a variety of MAP values, some of which are likely due to proximity to the paleochannel since greater MAP values are observed in less-developed paleosols which are bounded by channel sandstone, e.g., [8,51]; however, the general trend is increased MAP up section with other features indicating mild seasonality, as previously discussed. The pattern becomes more complex within Zone 2. MAP values decrease significantly from the top of Zone 1 to the bottom of Zone 2A. Zone 2A paleosols display properties of both strong seasonality as well as an increased precipitation up section that culminates in the formation of the Histosol. The laterally continuous and regionally mappable nature of the Histosols (Waynesburg Coal) indicates that it was the result of a regional change in precipitation pattern rather than a change in local environmental conditions. The rhizohaloes of Zone 2A reflect this change as well. In the lower red calcic Vertisols of Zone 2A, rhizohaloes are less dense and display a patchy distribution compared to rhizohaloes in the gleyed calcic Vertisols directly below the coal. This change in rhizolith distribution indicates that water was a more abundant resource during the formation of the uppermost Zone 2A paleosols than in the lower paleosols, e.g., [3,42]. Above the coal in Zone 2B, MAP values are still initially high, but do display a trend towards less precipitation and mildly seasonal conditions. Zone 3 paleosols represent a definite drying trend. MAP values decrease up section and the lowest MAP values in the study area occur in Zone 3. Rhizohaloes confirm this trend; they exhibit a patchy distribution and are less abundant than in Zone 2, e.g., [3,42]. Altogether, the trends depict a decrease in precipitation up section with a seasonally dry climate in Zone 1, a strongly seasonal precipitation pattern followed by an excursion to a more humid ever-wet climate in Zone 2A, and finally, an initially gradual return to a strongly seasonal precipitation pattern with a trend towards decreased precipitation up section through Zones 2B and 3.

5.5. Comparison with Contemporaneous Paleosols

5.5.1. Dunkard Basin

The paleosols and ichnofossil assemblages from this study were hypothesized to exhibit properties of having been drier and better drained than those paleosols from more lowland settings to the north (Coolville locality) (Figure 1) [8]. Both studies are located in upper fluvial plain facies province [8,12]; however, the Coolville locality would have represented paleosols formed bordering the lower fluvial plain based on previously interpreted paleoflow direction and facies provinces [12].
Seven pedotypes were identified from the Coolville locality interpreted to be Entisols, gleyed and non-gleyed Inceptisols, Vertisols, calcic Vertisols, and ferric concretionary Vertisols [8]. Gleization was found to be most common in the lower part of the outcrop and was likely associated with surface or groundwater processes (bottom up gleization) [8]. These pedotypes are not dissimilar from those observed in the current study; however, the paleosols described here contain greater soil carbonate and less frequent gleization. Evidence of extensive activity by soil organisms was found at the Coolville locality including evidence of rooting in the form of rhizohaloes, rhizoconcretions and root casts, as well as evidence of soil animals including coprolites, passively filled burrows, and meniscate back-filled burrows [8]. These trace fossils were found in abundance in the Coolville locality in contrast to the paucity of evidence of soil animals in the current study area. This difference suggests that the southern locality was either: (1) less favorable for the survival of soil organisms or (2) the better drainage and development of the paleosols of the current study area coupled with the shrink and swell properties of expandable clays due to seasonality was more destructive. Given the abundance of plant fossils in the associated strata, the latter hypothesis is the most likely. MAP values calculated from CIA-K for the Coolville locality ranged from 130 to 1330 mm/year [8] which are similar to the MAP values determined from the current study’s paleosols (~170–1500 mm/year). Precipitation values increased in the lower portion of the Coolville locality followed by an up-section drying trend. This indicates initially dry conditions, followed by an increase in precipitation and then a decrease in precipitation up section. All paleosols from the Coolville locality also had features suggestive of seasonally distributed precipitation [8].
The general climatic trends indicated by the paleosols from this study and those of the Coolville locality are similar. Both studies show an increase in precipitation from the lower portions of the sections up to the contact of the Monongahela and Dunkard groups followed by a decrease in precipitation. Evidence of seasonality was seen in both localities; however, the Coolville paleosols did not show as strong of a seasonality signal as was found in this study which could be due to its lowland setting. Evidence of a palustrine environment was found in the Coolville locality indicating that some of the paleosols were at least partly submerged by ponded water for a portion of the year [8]. This occurrence, coupled with the commonality of groundwater gleization, indicates that the paleosols of the Coolville locality were likely more poorly-drained; however, the lateral variation in the Coolville location exhibits the same influence of channel migration as a primary control in paleosol development [8]. This is especially apparent towards the top of the Coolville site where paleosols become more well-drained, likely representing a change to a more upland environment as a result of channel incision [8].

5.5.2. Contemporaneous Basins

The results of this study were also compared to the findings of contemporaneous paleosols from the North American midcontinent and Texas (Figure 3) [9,10,11] to determine if the paleosols from this study exhibited similar pedogenic features and the same general temporal trend in climate. Outcrops of the Pennsylvanian–Permian Wichita and Bowie Groups of Texas show a shift from Histosols and Ultisols in the Late Pennsylvanian to Vertisols and Aridisols in the Early Permian with some lateral variation due to changes in local topography, parent material and drainage conditions [9]. The appearance and disappearance of different pedotypes was found to display a longer-term average trend that was more dominant than the lateral variation in pedotypes indicating that these vertical changes were the result of a climate shift rather than changes in local environmental conditions [9]. This climatic shift represented a change from a humid, ever-wet climate to a seasonal, semi-arid to arid climate over the Pennsylvanian–Permian boundary [9]. The thickness of the section studied was ~1250 m, which is much greater that the ~35 m covered in this study, and pedotypes described covered a greater range of paleosol types than observed in the current study. These differences can be accounted for by higher accommodation and rates of aggradation. The climatic trends over equivalent times, however, are similar.
The Lower Permian Council Grove Group of Kansas is characterized by cumulative Inceptisols containing carbonate nodules, cutans, blocky peds and abundant gleization features indicating formation in a semi-arid climate with seasonal wet-dry cycles [11]. Paleosols in the lower portion of the section contained fewer carbonate nodules than the upper portion suggesting a drying trend up section. MAP was estimated to be several hundred mm/year based on the pedogenic carbonate content [11]. The authors also found evidence for cyclical changes in climate that were interpreted as 5th order glacioeustatic cycles that caused wetter climates during glacial lowstands and a drier climate during glacial highstands [11]. However, these perturbations were considered secondary to a larger-scale drying trend [11]. The overall trend found by Counts and Hasiotis is, therefore, similar to the trend found in this study, with an overall increase in drying up section punctuated by a temporary shift to a wetter climate early in the transition.
Similar trends in increased drying were observed in the Early-Middle Permian Wellington Formation of Oklahoma [10]. The study found laminated dolomitic lacustrine deposits and Vertisols with large-scale slickensides, blocky peds, root traces, and clinobimasepic plasmic microfabrics [10]. Planar laminated, vertically oriented gypsum formed sharp contacts with underlying mudstone which contained complex systems of mudcracks, randomly oriented slickensides, and brecciated fabric [10]. The sequence of sedimentary facies indicated a succession from a perennial freshwater lake, to a perennial saline lake, to an ephemeral playa followed by loess deposition [10]. This succession indicates a shift to an increasingly semi-arid seasonal climate with the loess deposition interpreted to be the most arid interval [10].
Overall, these three studies from the midcontinent indicate a trend from a humid climate in the Late Pennsylvanian to a drier more seasonal climate in the Permian of the North American midcontinent. The paleosols from the study area show similar pedogenic features as other studies from contemporaneous locations, albeit with some variation due to local environmental differences.

6. Conclusions

Six pedotypes (PT1–PT6) were observed in the Late Pennsylvanian–Early Permian Monongahela and Dunkard groups in southeastern Ohio, each representative of a distinct soil environment within a fluvial system. PT1 and PT2 paleosols (Entisols and Inceptisols) represent the most proximal environments within the floodplain and display the greatest lateral variation due to channel migration and flooding events. Vegetation was sparse within these pedotypes and likely represented early colonizing vegetation and early brakeland establishment in the case of Inceptisols. PT3 paleosols (ferric Vertisols) represent more stable proximal floodplain environments with an established brakeland type flora. PT4 paleosols (calcic Vertisols) represent stable distal floodplain environments with scarce brakeland or shrubland flora. PT5 paleosols (gleyed calcic Vertisols) represent distal floodplain environments with an open brakeland flora which experienced long periods of landscape stability. PT5 paleosols were subsequently overprinted as a result of a regional increase in precipitation resulting in the formation of a widespread marsh. This transition is represented by deep gleization of PT5 paleosols followed by the formation of an overlying Histosol (PT6). The size and abundance of carbonate nodules and slickensides in the paleosols increases from Zone 1 to Zone 3 indicating a change from a mildly seasonal climate in Zone 1 to a strongly seasonal climate in Zone 3 with prolonged dry seasons. The formation of the laterally continuous coal mid-outcrop represents a shift to a more humid ever-wet climate; however, this shift was temporary and was followed by a return to a seasonally dry precipitation pattern. Estimated MAP values range from ~170–1500 mm/year which were calculated using CIA-K and CALMAG from Inceptisols and Vertisols, respectively. The overall trend observed for MAP was decreased precipitation up section in Zone 1, followed by increased precipitation in Zone 2A, and then followed by decreased precipitation through Zones 2B and 3.
Autogenic and allogenic processes both exert influence on the formation of paleosols; however, autogenic processes are the primary controls on paleosol properties. Environmental variation such as changes in topography or channel migration can cause the formation of different types of soils even within a few meters of each other. However, the lateral variation in soil type and maturity will then be overprinted by allogenic processes such as climate change. Changes in the pattern or amount of precipitation can be seen in the average vertical change in paleosol properties. For example, a change from calcic Vertisols to Histosols indicates an increase in precipitation and likely a decrease in seasonality. Comparisons with contemporaneous Dunkard paleosols as well as contemporaneous paleosols from the midcontinent and Texas area of the United States show similar climatic trends. Pennsylvanian paleosols are found to exhibit typically wetter climates than Permian paleosols; however, cyclical variation due to glacioeustatic cycles can be observed in some locations. Overall, paleosols do show that climate during the Pennsylvanian–Permian transition became more strongly seasonal and more arid with some differences occurring due to lateral variation in environmental conditions.
Paleosols are useful for reconstructing past landscapes and ecosystems. Paleosol properties and ichnofossil assemblages are indicative of specific environments and so, by observing paleosols and ichnofossils using the small-scale study format, the lateral changes in paleosols over <1 km can be used to reconstruct the paleoenvironment in which they formed, as well as the type and distribution of vegetation and soil animal communities. Paleosols are also useful for reconstructing paleoclimate. By taking lateral variation in paleosols into account, the average vertical variation can be used to show climatic trends. Changes in paleosol properties and molecular weathering ratios, as well as ichnofossil (especially rhizolith) distribution, can be used to identify changes in precipitation patterns and abundance.

Supplementary Materials

The following are available online at https://www.mdpi.com/2076-3263/8/6/203/s1, Supplement 1: Bulk geochemistry data, Supplement 2: Calculated molecular weathering ratios from paleosols of Zone 1, Supplement 3: Calculated molecular weathering ratios from paleosols of Zone 2, Supplement 4: Calculated molecular weathering ratios from paleosols of Zone 3, Supplement 5: Clay mineralogy from X-ray diffraction (XRD) of the <4 micron fraction of paleosols from Zones 1–3.

Author Contributions

D.I.H. conceived the study and supervised field and laboratory work. J.L.C. conducted the field work and thin section analyses. D.I.H. and J.L.C. analyzed and interpreted the results. D.I.H. and J.L.C. wrote the paper.

Funding

This research was funded by the Ohio University Department of Geological Sciences Alumni Graduate Research Grant and the American Chemical Society Petroleum Research Fund (52708-UR8).

Acknowledgments

We would like to thank Seth Barot, Brandi Hamilton, and Emma Swaninger for her assistance in the field as well as David Kidder and Craig Grimes for invaluable discussions on various aspects of this project. Clay mineralogy was determined by James Talbot, K-T Geoservices Inc. (Gunnison, CO, USA). Thin sections were prepared by Texas Petrographic Services Inc. (Houston, TX, USA).

Conflicts of Interest

The authors declare no conflict of interest.

References

  1. Jenny, H. Factors of Soil Formation: A System of Quantitative Pedology; McGraw-Hill Book Company: New York, NY, USA, 1941; 281p. [Google Scholar]
  2. Kraus, M.J. Paleosols in clastic sedimentary rocks: Their geologic applications. Earth-Sci. Rev. 1999, 47, 41–70. [Google Scholar] [CrossRef]
  3. Retallack, G.J. Soils of the Past: An Introduction to Paleopedology; Blackwell Science: Oxford, UK, 2001; 404p. [Google Scholar]
  4. Buol, S.W.; Southard, R.J.; Graham, R.C.; McDaniel, P.A. Soil Genesis and Classification, 5th ed.; Iowa State University Press: Ames, IA, USA, 2003; 494p. [Google Scholar]
  5. Cecil, C.B. An overview and interpretation of the autocyclic and allocyclic processes and the accumulation of strata during the Pennsylvanian-Permian transition in the central Appalachian Basin, USA. Int. J. Coal Geol. 2013, 119, 21–31. [Google Scholar] [CrossRef]
  6. Hembree, D.I.; Nadon, G.C. A paleopedologic and ichnologic perspective of the terrestrial Pennsylvanian landscape in the distal Appalachian Basin, USA. Palaeogeogr. Palaeoclimatol. Palaeoecol. 2011, 312, 138–166. [Google Scholar] [CrossRef]
  7. Rosenau, N.A.; Tabor, N.J.; Elrick, S.D.; Nelson, W.J. Polygenetic history of paleosols in Middle-Upper Pennsylvanian cyclothems of the Illinois Basin, USA: Part I. Characterization of paleosol types and interpretation of pedogenic processes. J. Sediment. Res. 2013, 83, 606–636. [Google Scholar] [CrossRef]
  8. Hembree, D.I.; Bowen, J. Paleosols and ichnofossils of the Upper Pennsylvanian-Lower Permian Monongahela and Dunkard groups: A multi-proxy approach to unraveling complex variability in ancient terrestrial landscapes. PALAIOS 2017, 32, 295–320. [Google Scholar] [CrossRef]
  9. Tabor, N.J.; Montañez, I.P. Morphology and distribution of fossil soils in the Permo-Pennsylvanian Wichita and Bowie Groups, north-central Texas, USA: Implications for western equatorial Pangean palaeoclimate during icehouse–greenhouse transition. Sedimentology 2004, 51, 851–884. [Google Scholar] [CrossRef]
  10. Giles, J.M.; Soreghan, M.J.; Benison, K.C.; Soreghan, G.S.; Hasiotis, S.T. Lakes, loess, and paleosols in the Permian Wellington Formation of Oklahoma, USA: Implications for paleoclimate and paleogeography of the Midcontinent. J. Sediment. Res. 2013, 83, 825–846. [Google Scholar] [CrossRef]
  11. Counts, J.W.; Hasiotis, S.T. Distribution, paleoenvironmental implications, and stratigraphic architecture of paleosols in Lower Permian continental deposits of western Kansas, USA. J. Sediment. Res. 2014, 84, 144–167. [Google Scholar] [CrossRef]
  12. Martin, W.D. Geology of the Dunkard Group (Upper Pennsylvanian-Lower Permian) in Ohio, West Virginia, and Pennsylvania. Ohio Dep. Nat. Resour. Div. Geol. Surv. Bull. 1998, 73, 1–49. [Google Scholar]
  13. Sturgeon, M.T. The geology and mineral resources of Athens County, Ohio. Ohio Dep. Nat. Resour. Div. Geol. Surv. Bull. 1958, 57, 1–598. [Google Scholar]
  14. Fedorko, N.; Skema, V. A review of the stratigraphy and stratigraphic nomenclature of the Dunkard Group in West Virginia and Pennsylvania, USA. Int. J. Coal Geol. 2013, 119, 2–20. [Google Scholar] [CrossRef]
  15. Lucas, S.G. Vertebrate biostratigraphy and biochronology of the upper Paleozoic Dunkard Group, Pennsylvania-West Virginia-Ohio, USA. Int. J. Coal Geol. 2013, 119, 79–87. [Google Scholar] [CrossRef]
  16. Schneider, J.W.; Lucas, S.G.; Barrick, J.E. The Early Permian age of the Dunkard Group, Appalachian basin, USA, based on spiloblattinid insect biostratigraphy. Int. J. Coal Geol. 2013, 119, 88–92. [Google Scholar] [CrossRef]
  17. Clendening, J.A. Stratigraphic placement of the Dunkard according to palynological assemblages. Castanea 1972, 37, 258–287. [Google Scholar]
  18. Clendening, J.A.; Gillespie, W.H. Stratigraphic placement of the Dunkard: A review of the paleobotanical and other evidence. Castanea 1972, 37, 26–48. [Google Scholar]
  19. Eble, C.F.; Grady, W.C.; Blake, B.M. Dunkard Group coal beds: Palynology, coal petrography and geochemistry. Int. J. Coal Geol. 2013, 119, 32–40. [Google Scholar] [CrossRef]
  20. DiMichele, W.A.; Tabor, N.J.; Chaney, D.S.; Nelson, J.W. From wetlands to wet spots: Environmental tracking and the fate of Carboniferous elements in Early Permian tropical floras. Geol. Soc. Am. Spec. Pap. 2006, 399, 223–248. [Google Scholar]
  21. Tabor, N.J.; Poulsen, C.J. Palaeoclimate across the Late Pennsylvanian–Early Permian tropical palaeolatitudes: A review of climate indicators, their distribution, and relation to palaeophysiographic climate factors. Palaeogeogr. Palaeoclimatol. Palaeoecol. 2008, 268, 293–310. [Google Scholar] [CrossRef]
  22. De La Horra, R.; Benito, M.I.; López-Gómez, J.; Arche, A.; Barrenechea, J.F.; Luque, J. Paleoenvironmental significance of Late Permian paleosols in the South-Eastern Iberian Ranges, Spain. Sedimentology 2008, 55, 1849–1873. [Google Scholar] [CrossRef] [Green Version]
  23. Tibert, N.E.; Rygel, M.C.; Sanders, S.C.; Elrick, S.D.; Nelson, J. Temporal and spatial distribution of ostracodes across the Pennsylvanian-Permian boundary interval in eastern North America. Int. J. Coal Geol. 2013, 119, 93–105. [Google Scholar] [CrossRef]
  24. Munsell Color. Munsell Soil Color Charts; Munsell Color: Baltimore, MD, USA, 1975; 24p. [Google Scholar]
  25. Sheldon, N.D.; Retallack, G.J.; Tanaka, S. Geochemical climofunctions from North American soils and application to paleosols across the Eocene-Oligocene boundary in Oregon. J. Geol. 2002, 110, 687–696. [Google Scholar] [CrossRef]
  26. Sheldon, N.D.; Tabor, N.J. Quantitative paleoenvironmental and paleoclimatic reconstruction using paleosols. Earth-Sci. Rev. 2009, 95, 1–52. [Google Scholar] [CrossRef]
  27. Nordt, L.; Driese, S. New weathering index improves paleorainfall estimates from Vertisols. Geology 2010, 38, 407–410. [Google Scholar] [CrossRef]
  28. McCarthy, P.J.; Martini, I.P.; Leckie, D.D. Pedosedimentary history and floodplain dynamics of the Lower Cretaceous upper Blairmore Group, southwestern Alberta, Canada. Can. J. Earth Sci. 1997, 34, 598–617. [Google Scholar] [CrossRef]
  29. McCarthy, P.J.; Plint, A.G. Recognition of interfluve sequence boundaries: Integrating paleopedology and sequence stratigraphy. Geology 1998, 26, 387–390. [Google Scholar] [CrossRef]
  30. McCarthy, P.J.; Plint, A.G. Spatial variability of palaeosols across Cretaceous interfluves in the Dunvegan Formation, NE British Columbia, Canada: Palaeohydrological, palaeogeomorphological and stratigraphic implications. Sedimentology 2003, 50, 1187–1220. [Google Scholar] [CrossRef]
  31. Kraus, M.J. Lower Eocene alluvial paleosols: Pedogenic development, stratigraphic relationships, and paleosol/landscape associations. Palaeogeogr. Palaeoclimatol. Palaeoecol. 1997, 129, 387–406. [Google Scholar] [CrossRef]
  32. Hembree, D.I.; Hasiotis, S.T. Paleosols and ichnofossils of the White River Formation of Colorado: Insight into soil ecosystems of the North American Midcontinent during the Eocene-Oligocene transition. PALAIOS 2007, 22, 123–142. [Google Scholar] [CrossRef]
  33. PiPujol, M.D.; Buurman, A.P. The distinction between ground-water gley and surface-water gley phenomena in Tertiary paleosols of the Ebro basin, NE Spain. Palaeogeogr. Palaeoclimatol. Palaeoecol. 1994, 110, 103–113. [Google Scholar] [CrossRef]
  34. Kraus, M.J.; Hasiotis, S.T. Significance of different modes of rhizolith preservation to interpreting paleoenvironmental and paleohydrologic settings: Examples from Paleogene paleosols, Bighorn Basin, Wyoming, USA. J. Sediment. Res. 2006, 76, 633–646. [Google Scholar] [CrossRef]
  35. Mack, G.H.; James, W.C.; Monger, H.C. Classification of paleosols. Geol. Soc. Am. Bull. 1993, 105, 129–139. [Google Scholar] [CrossRef]
  36. Soil Survey Staff. Keys to Soil Taxonomy, 12th ed.; U.S. Government Printing Office: Washington, DC, USA, 2014; 324p.
  37. Hurst, V.J. Visual estimation of iron in saprolite. Geol. Soc. Am. Bull. 1977, 88, 174–176. [Google Scholar] [CrossRef]
  38. Birkeland, P.W. Soils and Geomorphology, 3rd ed.; Oxford University Press: New York, NY, USA, 1999; 430p. [Google Scholar]
  39. Marriott, S.B.; Wright, V.P. Palaeosols as indicators of geomorphic stability in two Old Red Sandstone alluvial suites, South Wales. J. Geol. Soc. 1993, 150, 1109–1120. [Google Scholar] [CrossRef]
  40. Retallack, G.J.; Germán-Heins, J. Paleosol evidence for the geological antiquity of rain forests. Science 1994, 265, 499–502. [Google Scholar] [CrossRef] [PubMed]
  41. Driese, S.G.; Ober, E.G. Paleopedologic and paleohydrologic records of precipitation seasonality from Early Pennsylvanian “underclay” paleosols, USA. J. Sediment. Res. 2005, 75, 997–1010. [Google Scholar] [CrossRef]
  42. Lavelle, P.; Spain, A.V. Soil Ecology; Kluwer Academic Publishers: Dordrecht, The Netherlands, 2001; 654p. [Google Scholar]
  43. Fontaine, W.M.; White, I.C. The Permian or Upper Carboniferous Flora of West Virginia and S.W. Pennsylvania, 2nd ed.; Geological Survey of Pennsylvania: Harrisburg, PA, USA, 1880; 143p.
  44. DiMichele, W.A.; Kerp, H.; Sirmons, R.; Fedorko, N.; Skema, V.; Blake, B.M., Jr.; Cecil, C.B. Callipterid peltasperms of the Dunkard Group, Central Appalachian Basin. Int. J. Coal Geol. 2013, 119, 56–78. [Google Scholar] [CrossRef] [Green Version]
  45. DiMichele, W.A.; Pfefferkorn, H.W.; Gastaldo, R.A. Response of late Carboniferous and Early Permian plant communities to climate change. Annu. Rev. Earth Planet. Sci. 2001, 29, 461–487. [Google Scholar] [CrossRef]
  46. Buatois, L.; Mángano, M.G. Ichnology: Organism-Substrate Interactions in Space and Time; Cambridge University Press: New York, NY, USA, 2011; 366p. [Google Scholar]
  47. Hasiotis, S.T. Continental Trace Fossils; Society for Sedimentary Geology: Tulsa, OK, USA, 2006; 132p. [Google Scholar]
  48. Schaetzl, R.J.; Anderson, S. Soils: Genesis and Geomorphology; Cambridge University Press: Cambridge, MA, USA, 2005; 817p. [Google Scholar]
  49. Nordt, L.; Orosz, M.; Driese, S.; Tubbs, J. Vertisol carbonate properties in relation to mean annual precipitation: Implications for paleoprecipitation estimates. J. Geol. 2006, 119, 501–510. [Google Scholar] [CrossRef]
  50. Retallack, G.J. Untangling the effects of burial alteration and ancient soil formation. Annu. Rev. Earth Planet. Sci. 1991, 19, 183–206. [Google Scholar] [CrossRef]
  51. Hembree, D.I.; Blair, M.G. A paleopedological and ichnological approach to interpreting spatial and temporal variability in Early Permian fluvial deposits of the lower Dunkard Group, West Virginia, USA. Palaeogeogr. Palaeoclimatol. Palaeoecol. 2016, 454, 246–266. [Google Scholar] [CrossRef]
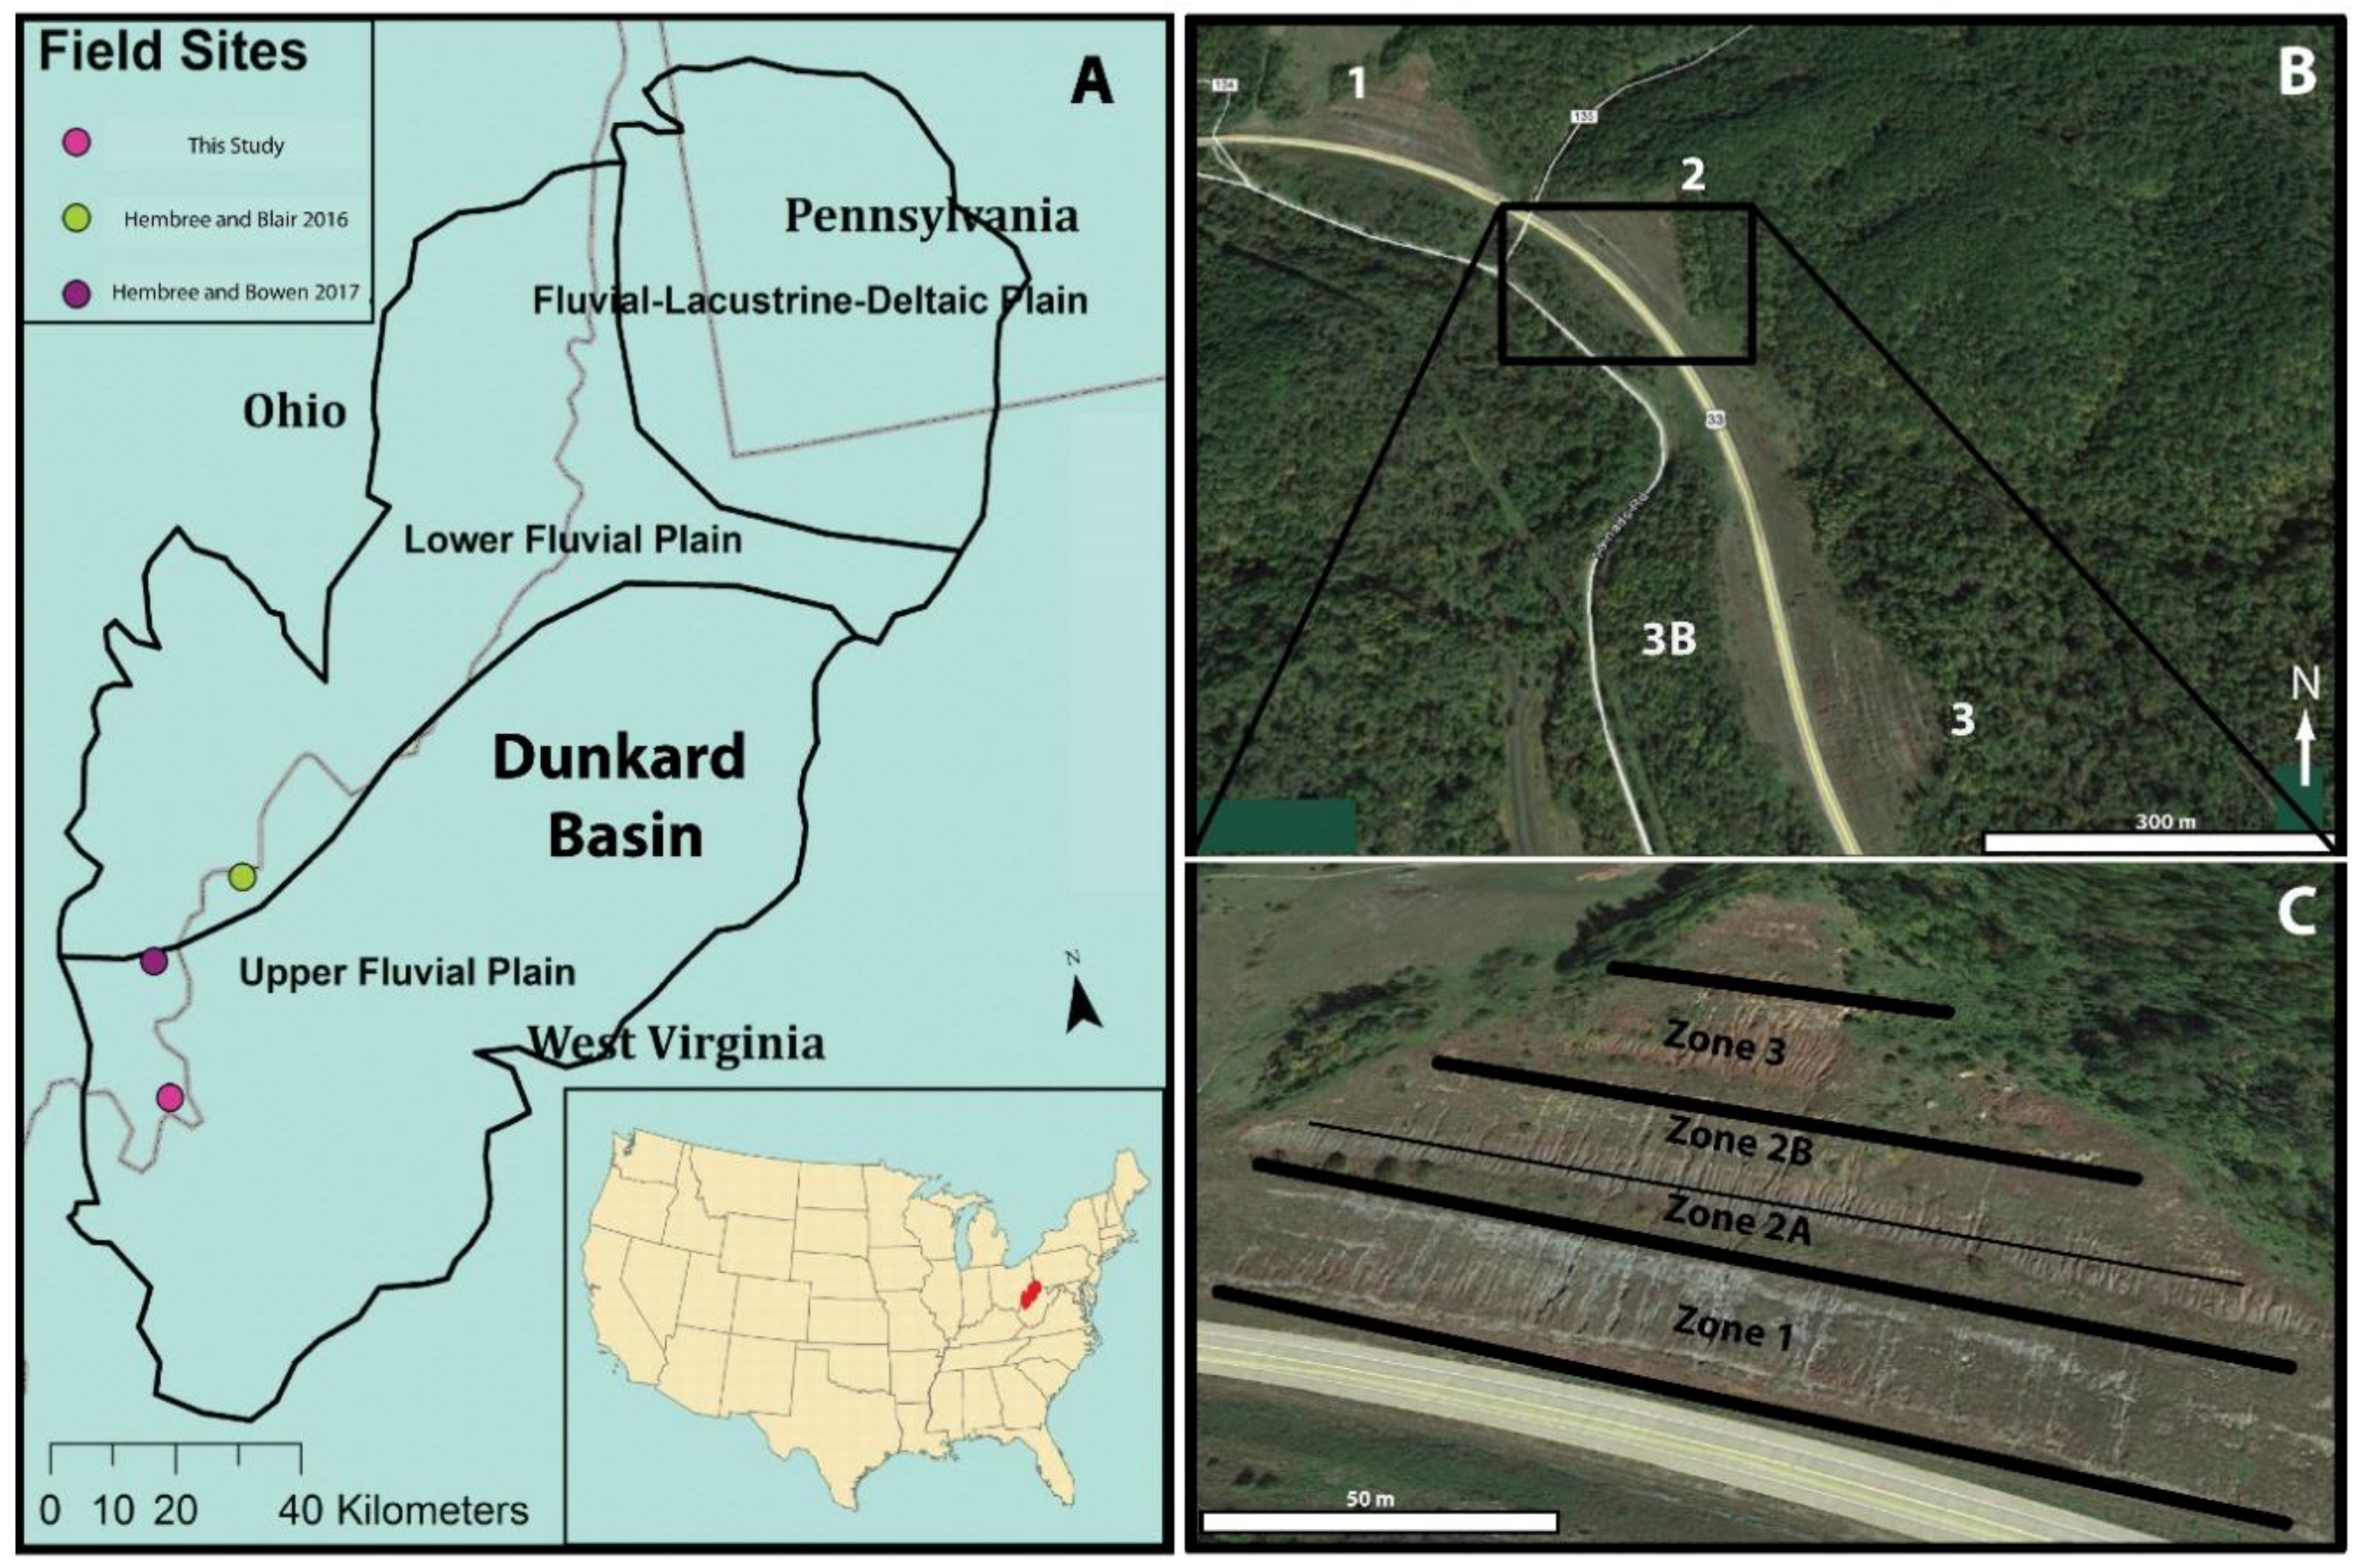
Figure 1. (A) Simplified outline of the Dunkard Basin with upper fluvial plain, lower fluvial plain, and fluvial-lacustrine-deltaic plain facies provinces demarcated, after [12]. Sites of this and recent studies on Dunkard Group paleosols are indicated. Inset map shows the location of the field site in relation to the USA. (in red); (B) Satellite image of the succession of outcrops (Sites 1–3B) along S.R. 33 in Meigs County, Ohio (Image ©2017 CNES/Astrium, ©2017 Google); (C) Close-up image of Site 2 with Zones 1–3 demarcated (Image ©2017 CNES/Astrium, ©2017 Google).
Geosciences 08 00203 g001
Figure 2. Stratigraphic column of Monongahela and Dunkard Groups. (A) Interpreted ages of upper Monongahela and Dunkard Group deposits based on recent biostratigraphic evidence [15,16,19,23]; (B) Stratigraphic column showing general lithologies of the Upper Monongahela and Dunkard groups modified from [14].
Geosciences 08 00203 g002
Figure 3. Early Permian paleogeographic locations of the Monongahela and Dunkard groups (red star) as well as the three contemporaneous basins used to make comparisons with the results of the current study. (Maps ©Ron Blakey, Northern Arizona University).
Geosciences 08 00203 g003
Figure 4. Correlated general stratigraphic columns assembled from the measurements and descriptions of lithologies from Sites 1–3B. (A) Drab paleosol and overlying sandstone bed from Zone 1; (B) Red to drab paleosols and coal horizon of Zone 2. The red dashed line indicates the position of the Monongahela-Dunkard boundary; (C) Deep red, calcareous paleosols of Zone 3.
Geosciences 08 00203 g004
Figure 5. Rhizoliths. (A) Subhorizontal grayish-green rhizohaloes from Zone 2B; (B) Vertical to horizontal reddish-purple rhizohalo from Zone 3; (C) Vertical grayish-green rhizohalo from Zone 3; (D) Vertical grayish-green rhizohalo from Zone 2B; (E) Rhizoconcretion from Zone 1; (F) Cross-sectional view of a rhizoconcretions from Zone 2A; (G) Rhizoconcretions from Zone 1. (H) Root cast from Zone 1.
Geosciences 08 00203 g005
Figure 6. (A) Palaeophycus from Zone 2A paleosol; (B) Cf. Palaeophycus from Zone 2A paleosol; (C) Impression of a small fern within relict bedding of Zone 2B paleosol; (D) Impression of horsetails within relict bedding of Zone 2B paleosol; (E) Impression of small fern from Zone 2B; (F) Carbonized fern from relict bedding in Zone 3; (G,H) Bone fragments under normal light (Zone 2B Site 3).
Geosciences 08 00203 g006
Figure 7. Detailed paleosol sections for Zone 1. Sections are correlated by the uppermost bench-forming sandstone. Individual paleosol profiles are indicate by brackets and labelled by letters. Paleosol horizons and colors are to the rights of each column. Pedotype assignments are in red text (PT#) and paleosol letters are to the left of each bracket.
Geosciences 08 00203 g007
Figure 8. Detailed paleosol sections for Zone 2. Sections are correlated based on the upper contact of the coal indicated by the dashed red line. Individual paleosol profiles are indicate by brackets and labelled by letters. Paleosol horizons and colors are to the rights of each column. Pedotype assignments are in red text (PT#) and paleosol letters are to the left of each bracket. See Figure 7 for legend of sedimentologic and pedogenic features.
Geosciences 08 00203 g008
Figure 9. Detailed paleosol sections for Zone 3. Sections are correlated by the uppermost erosional contact in all three sites as indicated by the dashed red line. Individual paleosol profiles are indicate by brackets and labelled by letters. Paleosol horizons and colors are to the rights of each column. Pedotype assignments are in red text (PT#) and paleosol letters are to the left of each bracket. See Figure 7 for legend of sedimentologic and pedogenic features.
Geosciences 08 00203 g009
Figure 10. Molecular weathering ratios plotted with Zone 1 paleosols from Sites 1 and 2. All values are unitless. See Figure 7 for section key. See Supplement 2 for calculated weathering ratios.
Geosciences 08 00203 g010
Figure 11. Molecular weathering ratios plotted with Zone 2 paleosols from Sites 1 and 2. All values are unitless. See Figure 7 for section key. See Supplement 3 for calculated weathering ratios.
Geosciences 08 00203 g011
Figure 12. Molecular weathering ratios plotted with Zone 2 paleosols from Sites 3 and 3B. All values are unitless. See Figure 7 for section key. See Supplement 3 for calculated weathering ratios.
Geosciences 08 00203 g012
Figure 13. Molecular weathering ratios plotted with Zone 3 paleosols from Sites 1–3. All values are unitless. See Figure 7 for section key. See Supplement 4 for calculated weathering ratios.
Geosciences 08 00203 g013
Figure 14. (A) Platy mudstone of PT1 from Site 1 Zone 1; (B) Laminated claystone of PT1 from Site 3B; (C) Blocky mudstone with grayish-green rhizohaloes of PT2 from Zone 1 Site 1; (D) Variegated mudstone of PT2 from Site 2 Zone 1; (E) Insepic to mosepic plasmic microfabric of PT2; (F) Intertextic grain microfabric of PT2 from Site 1 Zone 1; (G) Blocky mudstone of PT3 from Zone 2B with a large grayish-green rhizohalo; (H) Subangular blocky mudstone of PT3 with grayish-green rhizohaloes; (I) Hematite nodule from PT3 in thin section; (J) Mosepic to masepic microfabric of PT3.
Geosciences 08 00203 g014
Figure 15. (A) Blocky mudstone of PT4 with reddish-purple rhizohalo and diffuse yellow outer zone; (B) Large-scale slickensides with coalescent carbonate nodules from PT4 paleosol; (C) PT4 ped bounded by slickensides; (D) Masepic microfabric of PT4; (E) Thin section of large carbonate nodules from PT4 Zone 3; (F) PT5 paleosol with large-scale slickensides in Zone 2A Site 1; (G) Top of PT5 paleosol from Zone 2A Site 2; (H) Thin section of carbonate nodule with iron staining from PT5 paleosol, (I) Masepic microfabric of PT5 paleosol from Zone 2A; (J) PT6 paleosol from Zone 2A at Site 3B; (K) Thick coal of PT6 from Site 3B.
Geosciences 08 00203 g015
Table 1. Molecular weathering ratios and paleoprecipitation proxies used in this study and their significance equations after [3,25,26].
Weathering ProxyEquationSignificance
Base LossAl2O3/(CaO + MgO + Na2O + K2O)Accumulation of alumina relative to base cations
Hydrolysis (Clayeyness)Al2O3/SiO2Al accumulates as clay minerals form
SalinizationNA2O + K2O/Al2O3Accumulation of salts in the subsurface
Calcification(CaO + MgO)/Al2O3Accumulation of Ca, Mg in the subsurface
Leaching (CaO, MgO, Na2O, K2O)(CaO, MgO, Na2O, K2O)/TiO2Base cations leached during weathering and Ti accumulated in normal conditions
CIA-K[(Al2O3)/(Al2O3 + CaO + Na2O)] × 100Weathering of feldspars and the formation of clay minerals
MAP (CIA-K)14.265(CIA-K) − 37.632Estimate of precipitation
CALMAG[(Al2O3)/(Al2O3 + CaO + MgO)] × 100Flux of Ca and Mg from CaCO3, detrital clays, and exchangeable Ca2+ and Mg2+
MAP (CALMAG)22.69(CALMAG) − 435.8Estimate of precipitation specific to Vertisols
Table 2. Defining properties of the six described pedotypes (PT1–PT6) and their interpreted soil order, paleoenvironment, and vegetation.
PedotypeColor and LithologyPedogenic FeaturesIchnofossils/FossilsPlasmic and Grain MicrofabricsDominant Molecular Weathering RatiosDominant Clay MineralogyHorizonsClassification (Mack)Classification (Soil Survey)PaleoenvironmentVegetation/Ecosystem
PT1dusky red, platy mudstone, reddish-brown and grayish-green, variegated, platy mudstone, and olive gray and black, laminated claystonesmall (<1 mm) micritic carbonate nodules, some relict bedding and/or stringers of coalPalaeophycus and cf. Palaeophycus, plant body fossils (small ferns, horsetails, and woody/fibrous stem material), horizontal, grayish-green rhizohaloes, abundant organic matterskelsepic and mosepic to argillasepic; porphyroskelicbase losskaolinite, illite, and mica and contain lesser quantities of mixed layer illite-smectiteACProtosolsUstifluvents and Epiaquents (Entisols)levee or proximal floodplainearly successional vegetation
PT2reddish-brown, dark olive gray, and variegated (reddish-brown and olive green), platy to angular blocky, silty mudstones and blueish green-gray and reddish-brown, variegated sandstone and mudstonesmall (~1–40 mm) carbonate nodules and very small (~1–2 cm) slickensides and poorly developed argillans which vary from rare to commongray green rhizohaloes and uncommonly yellow rhizohaloes (patchy distribution) which are sometimes associated with carbonate nodules, root casts (rare)silasepic (uncommon), insepic, and mosepic to masepic; porphyroskelic to uncommonly granular or intertexticvariablekaolinite, illite and mica, and uncommonly chlorite and contain lesser amounts of mixed layer illite-smectite Bssk, Bsskg, Bkss, and BCcalcic ProtosolsCalciusteps and Quartzipsamments (Inceptisols and Entisols)proximal floodplain early successional vegetation to early brakeland establishment
PT3dark olive gray to reddish-brown and red to reddish-brown and dusky red, silty, angular blocky mudstoneabundant slickensides ranging from a few mm to 15 cm, argillans and weakly-developed metallic argillans, small (<1 mm) nodules of hematite and iron stippling (thin section) vertical to subvertical, purple, grayish purple, grayish-green, and yellow (less common) rhizohaloes are evenly distributedargillasepic (uncommon), skelsepic, mosepic (most common), masepic and bimasepic; porphyroskelicgreater base loss and increased hydrolysis in the bottoms of profiles kaolinite and chlorite and by lesser amounts of illite and mica and mixed layer illite-smectite throughout the profilesBss, Bssg, Bsskg, BssC, and BCferric VertisolsHaplusterts (Vertisols)proximal to distal floodplain brakeland
PT4reddish-brown to dusky red, subangular to angular blocky mudstonesabundant small- (~1–5 cm) to large-scale (>20–50 cm) slickensides,, abundant small (<1–10 mm) to large (~2–4 cm) carbonate nodules; argillanspurple and reddish purple, yellow, and gray green, vertical to subhorizontal, small to large rhizohaloes (clustered or diffuse); rhizoconcretions; Cf. Palaeophycusmosepic to masepic, calciasepic and crystic or uncommonly argillasepic, isotic, or bimasepic; porphyroskelic to agglomeroplasmic (less common)leaching of bases (greater leaching where lacking carbonate nodules) illite and mica as well as kaolinite; less common are mixed layer illite-smectite and chlorite Bss, Bssk, Bsskg, Bkss, Bkg, BkssC, and BCcalcic VertisolsCalciusterts (Vertisols)distal floodplainopen brakeland or shrubland
PT5olive gray green and olive gray, platy to angular blocky mudstones that grade downward into red to reddish-brown mudstone or, rarely silty, olive brown to reddish-brown, angular blocky mudstoneabundant small- (<3 cm) to large-scale (~3–>30 cm) slickensides; abundant small (~1–2 mm) to large (~10–40 mm) carbonate nodules coalescent along slickenside surfaces; argillansvertical to subhorizontal, grayish-green and dusky red rhizohaloes and yellow and olive brown mottles; rhizoconcretions; small (<1 mm) bone fragmentsskelsepic, mosepic and masepic and, less commonly, argillasepic or calciasepic; porphyroskelicbase loss in the tops of profiles, calcification increases downward, leaching of bases in tops profiles mixed layer illite-smectite and illite and mica with lesser amounts of kaolinite and chloriteBssg, Bssk, Bsskg, Bkss, and Bkssg gleyed calcic VertisolsCalciusterts that transition to Calciaquerts (Vertisols) distal floodplain transitioned to marsh or fenopen brakeland that transitions to a marsh or fen
PT6black to gray black coal and olive gray, platy, carbonaceous mudstonecoalified organic matterplant body fossils (small ferns and fibrous stem material)not observednot observednot observedOHistosolsHemists (Histosols) marshes or swamps on the proximal to distal floodplainextensive marsh
Table 3. Estimated mean annual precipitation (MAP) using CIA-K for Inceptisols and CALMAG for Vertisols. See Figure 10, Figure 11, Figure 12 and Figure 13 for each sample location and Table 1 for the formulas used in each calculation.
Site 1Site 2Site 3
SamplePaleosolPedotypeHorizonCIA-KCALMAGMAP (CIA-K)MAP (CALMAG)SamplePaleosolPedotypeHorizonCIA-KCALMAGMAP (CIA-K)MAP (CALMAG)SamplePaleosolPedotypeHorizonCIA-KCALMAGMAP (CIA-K)MAP (CALMAG)
Zone 3S1Z3-2-4S1 nPT4Bssk42.737.5 415S2Z3-1b-4S2 lPT4Bssk29.126.6 168S3Z3-1-1tS3 dPT4Bsskg91.879.1 1359
S1Z3-2-9S1 oPT4Bkss40.135.9 379S2Z3-1b-11S2 mPt4Bkss68.657.3 865S3Z3-1-4bS3 ePT4Bss92.082.1 1427
S1Z3-1-1S1 lPT4Bss89.675.0 1267S2Z3-1b-13S2 mPt4Bssk68.657.7 872S3Z3-1-6tS3 ePT4Bss87.172.8 1217
S1Z3-1-10S1 lPT4Bssk77.063.8 1012S2Z3-1-3S2 jPT4Bssk89.976.6 1303
S2Z3-1-1S2 jPT4Bss95.680.2 1384
S2Z3-1-11S2 kPT4Bkss80.566.4 1070
S2Z3-1-9S2 kPT4Bssk70.058.5 891
Zone 2S1Z2-2-1S1 jPT3Bss87.676.4 1297S2Z2-2-5S2 fPT3Bssg95.687.3 1545S3Z2-2-3S3 aPT4Bssk58.351.3 728
S1Z2-2-6S1 kPT3Bssg93.986.0 1515S2Z2-2-3S2 gPT3Bss96.086.0 1515S3Z2-2-6S3 bPT5Bsskg67.359.6 917
S1Z2-1-2S1g, hPT5Bssg91.7 1271 S2Z2-1-3S2 h, iPT5Bssg69.7 957 S3Z2-2-8S3 bPT5Bsskg82.071.7 1192
S1Z2-1-10S1 iPT5Bssk51.044.2 567S2Z2-1-5S2 h, iPT5Bsskg52.1 705 S3Z2-1-4S3 cPT4Bssk85.974.7 1260
S2Z2-1-13S2 iPT5Bssk55.747.8 648S3BZ2-2-1S3B bPT1AC96.6 1340
S2Z2-1b-1S2 dPT5AO95.3 1322
S2Z2-1b-6S2 ePT5Bssk47.641.7 510
Zone 1S1Z1-4-1S1 fPT2Bkss94.7 1313 S2Z1-3-1S2 cPT2Bss66.1 905
S1Z1-2-2S1 dPT4Bss93.081.4 1411S2Z1-2-1S2 bPT2AC77.8 1073
S1Z1-1-6S1 bPT4Bssk60.352.1 746S2Z1-1-1S2 aPT2Bk94.7 1314
S1Z1-1-8S1 bPT4Bssk69.959.3 910
S1Z1-1-10S1 bPT4Bssk66.055.6 826