Abstract
Derived digital elevation models (DEMs) are high-resolution acoustic technology that has proven to be a crucial morphometric data source for research into submarine environments. We present a morphometric analysis of forty deep seafloor edifices located to the west of Canary Islands, using a 150 m resolution bathymetric DEM. These seafloor structures are characterized as hydrothermal domes and volcanic edifices, based on a previous study, and they are also morphostructurally categorized into five types of edifice following an earlier classification. Edifice outline contours were manually delineated and the morphometric variables quantifying slope, size and shape of the edifices were then calculated using ArcGIS Analyst tools. In addition, we performed a principal component analysis (PCA) where ten morphometric variables explain 84% of the total variance in edifice morphology. Most variables show a large spread and some overlap, with clear separations between the types of mounds. Based on these analyses, a morphometric growth model is proposed for both the hydrothermal domes and volcanic edifices. The model takes into account both the size and shape complexity of these seafloor structures. Grow occurs via two distinct pathways: the volcanoes predominantly grow upwards, becoming large cones, while the domes preferentially increase in volume through enlargement of the basal area.
1. Introduction
The interdisciplinary science of geomorphometry, the quantitative representation of topography and terrain modeling [1], has entered a new era taking advantage of the constant advancements in elevation data acquisition and the spatial resolvability of digital elevation models (DEMs). DEM-based applications in underwater exploration were previously limited by the dimensionality and low resolution of the available bathymetric data [2]. However, the improvement in acoustic technology over the last two decades has resulted in increasing use of digital elevation models [3]. The advent of new echo-sounding techniques is improving traditional geomorphometric techniques, including quantitative measurements derived from marine DEMs, despite the fact that submarine environments are inherently more difficult to sample. Most DEM-based studies highlight particular submarine patterns and model different geomorphic feature values in the seascapes (i.e., they analyze morphometric attributes). These involve general geomorphometric techniques for characterizing ocean floor physiographic domains [4,5,6], mapping habitats [7,8], analyzing textures [9,10] and studying hydrodynamics [11,12].
For characterizing and classifying specific seascapes, DEM-based studies are still relatively nascent and less numerous in the marine environment than terrestrial landscapes. Other authors have focused on modeling submarine mass movements [13,14], canyons [15,16] and pockmarks [17,18,19]. In vulcanology, this type of study is used for determining the key processes involved in the construction and modification of seamounts [20,21,22], calculating lava volumes [23] and looking at the evolution of volcanic areas such as the mid ocean ridges [24]. DEMs are combined with similar acoustic datasets, such as backscatter and sonar imagery, in order to increase the potential for understanding volcanic and tectonic processes [25]. In this sense, significant volcano-related studies, in which geomorphology and the statistical analyses of volcanic features have become essential for morphometric studies, have been carried out over the past 20 years. Some of the most notable of these studies are those that geomorphometrically determined the evolution and development of cones in ridge areas such as the Mid-Atlantic Ridge and the Azores Plateau ([25,26,27], and references therein). Moreover, abundant links have been found between the geological and geomorphic characteristics of volcanic landforms (e.g., [28,29]) and biological habitats [30,31] with geomorphic characteristics such as size, shape, and degree of isolation being key.
Landform characterizations based on specific morphometric attributes are of fundamental importance in the theory of geomorphometry [32]. Standardized, comparable and systematic methods for extracting DEM-based morphometric information on seafloor elevations are still scarce. Even so, several approaches can be found in literature that have been successfully applied in sub-aerial environments for mapping and quantifying volcanic landforms [33,34]. In particular, the authors of [35,36] developed a quantitative well-formalized method of systematically studying the morphometry of volcanic edifices by delimiting the basal contour and extracting morphometric attributes (i.e., size, slope, and shape descriptors). This method has been widely applied to arc volcanoes [35] and cinder cone fields [37] in Central America; to glacio-volcanoes and shield volcanoes in Iceland [38]; as well as in a global dataset of composite volcanoes [39]. There are no comparable studies in the submarine environment, and novel applications of morphometric analyses to submarine structures are needed. Research in this direction will contribute to comprehensively classifying and morphometrically characterizing different positive seascapes namely seamounts, cold-water coral mounds, mud volcanoes, and other features of the seabed such as pockmarks, bedforms, and landslides.
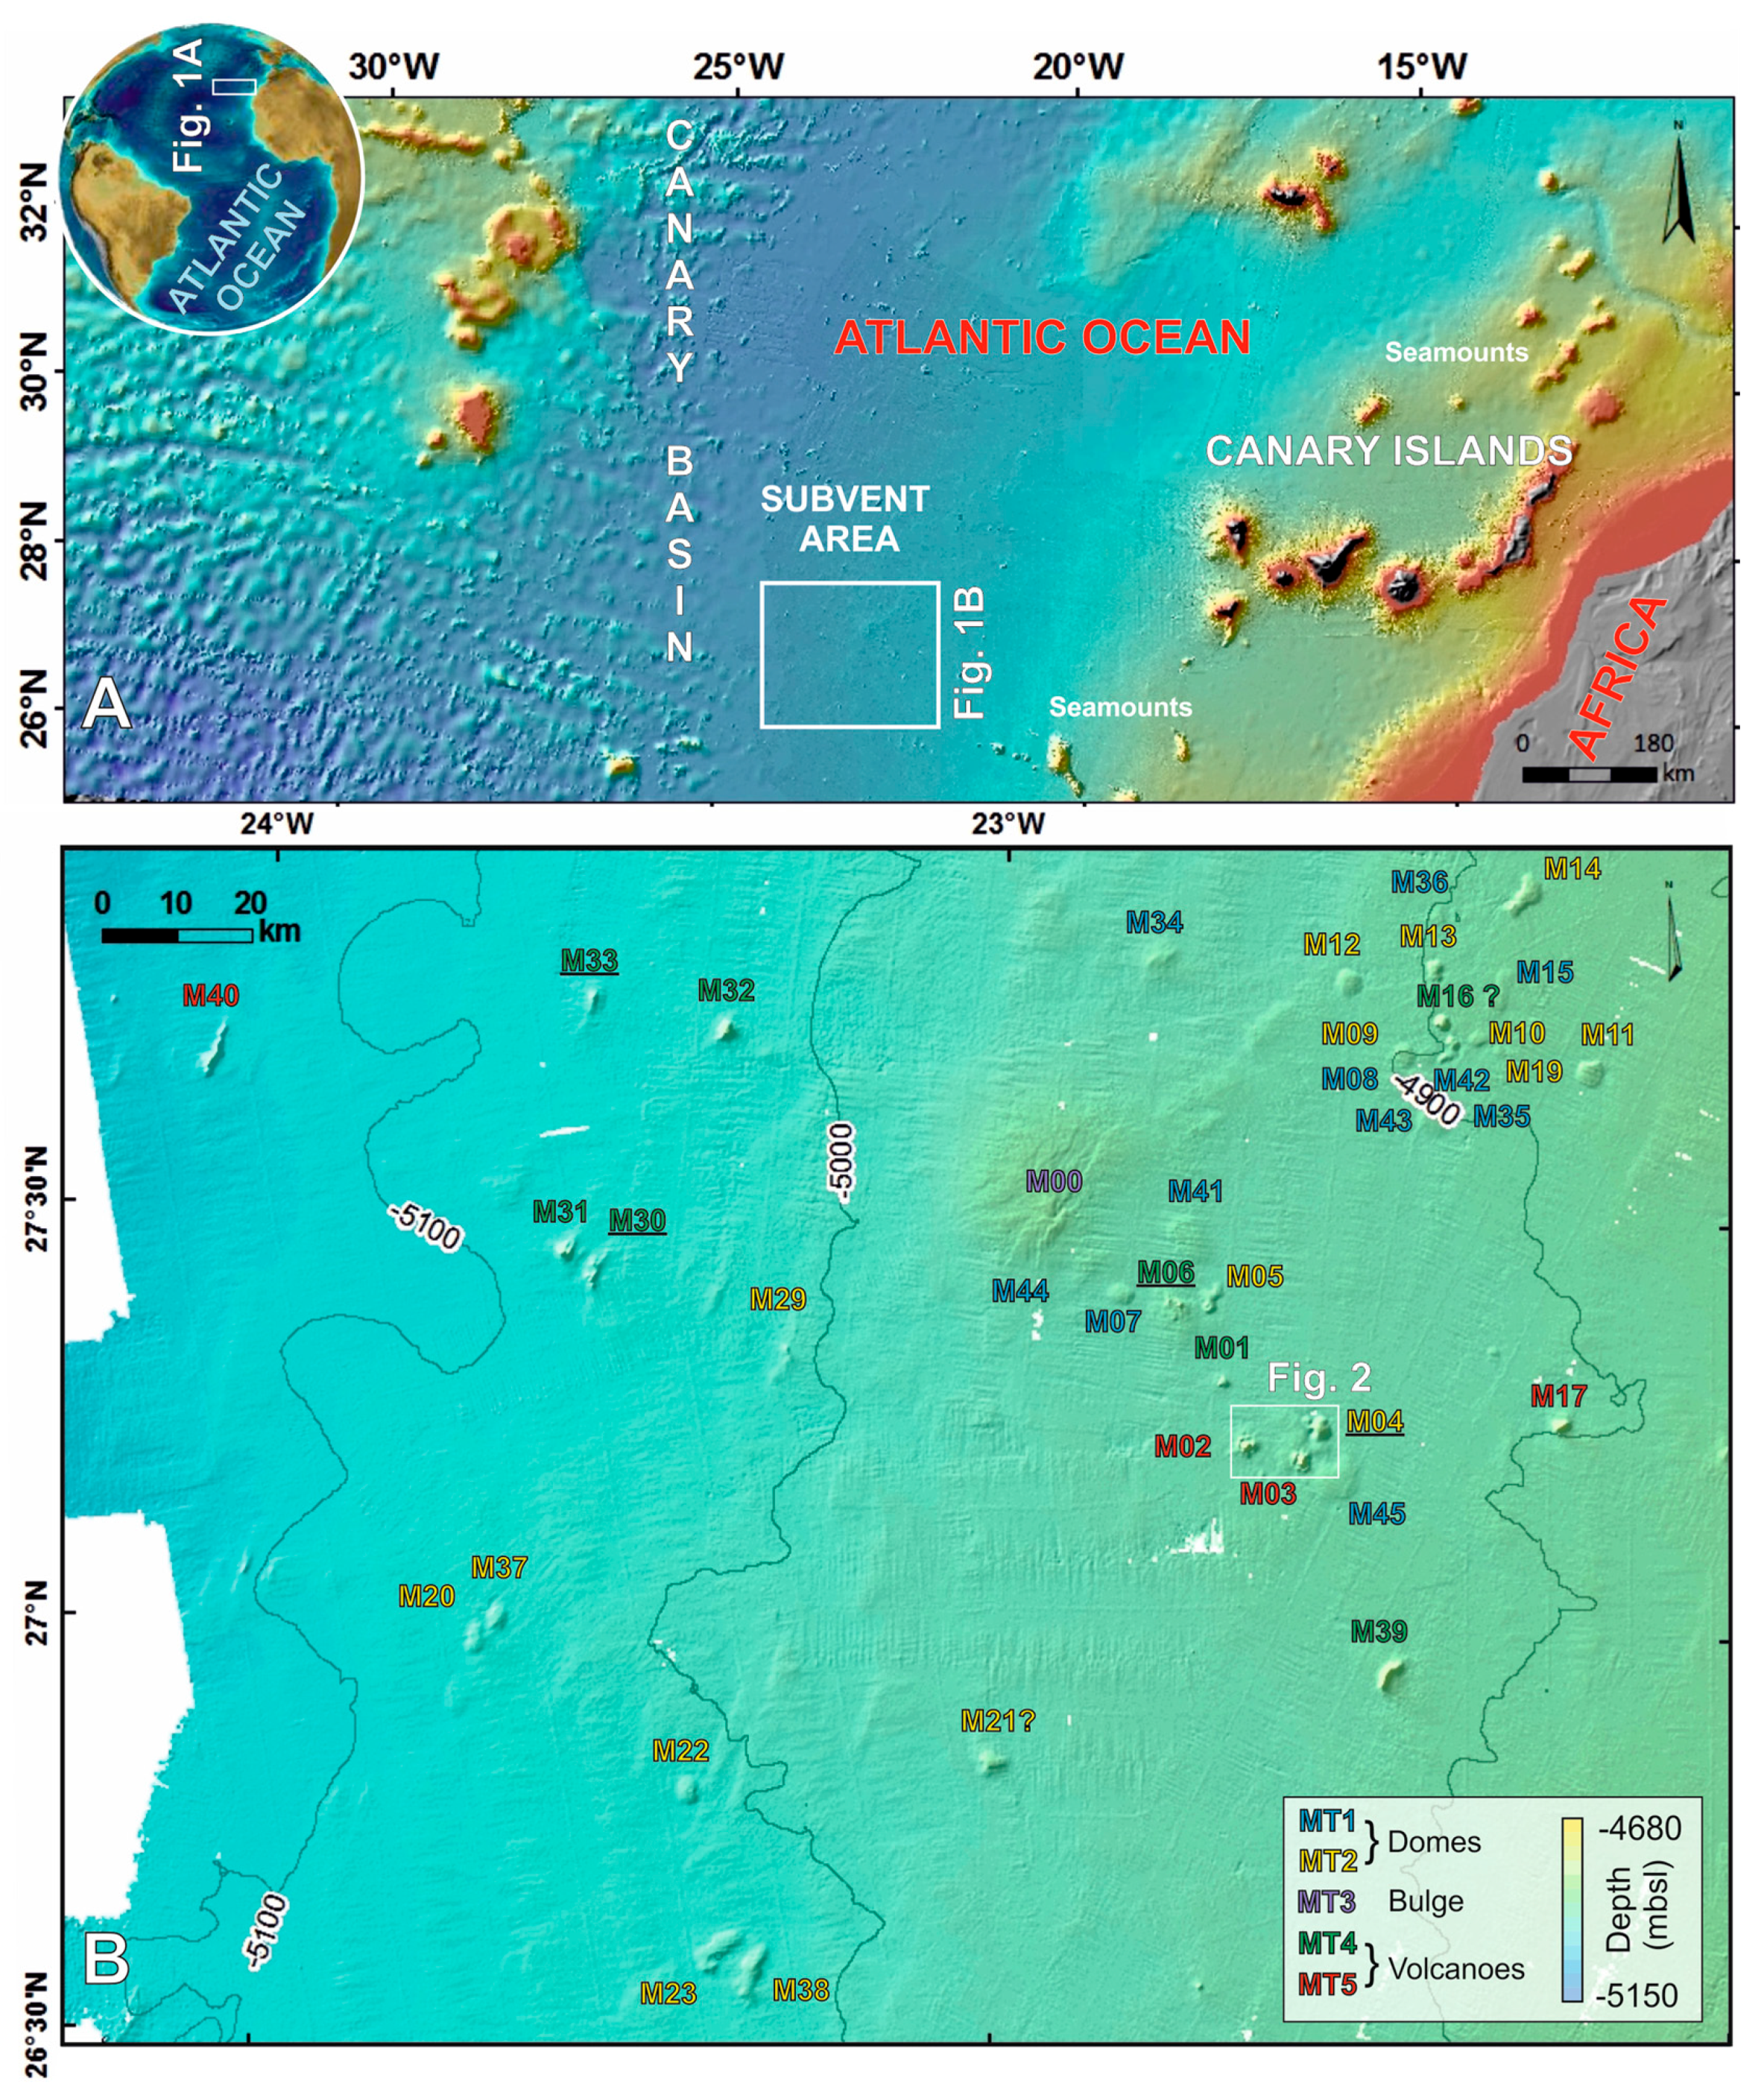
This paper aims to further this objective by focusing on a set of seabed features located west of the Canary Islands (Eastern Atlantic) at a depth of 4800–5200 m, for which a new detailed morphometric method based on DEM analysis (Figure 1A) has been used. The study analyses and characterizes submerged volcanic structures and their driving processes and proposes evolutionary trends. These seafloor features are both circular and elongated in shape, with diameters ranging from 2 to 24 km, heights of up to 250 m, and flank slopes ranging from 2 to 24° [40]. In earlier studies, they were characterized by [41] as various types of structures including both hydrothermal domes and different types of volcanoes related to recent volcanic and intrusive activity. The authors of [42] also classified them into five morphostructural types of edifices (MT1 to MT5), intimately linked to specific origins (Figure 1B). These forty structures were selected with the aim of analyzing edifices with different sizes, shapes, and morphostructural settings, in order to explore the efficacy of the current and well-tested systematic method of [36], rigorously characterizing the morphometric footprint of these submarine edifices. We have applied statistical analysis methods to determine which morphometric variables correlate most strongly in the characterization of the complex morphology of these edifices. Finally, we have used these quantitative characteristics to establish a morphometric growth model that includes the complexity of size and shape of the different seafloor edifices.
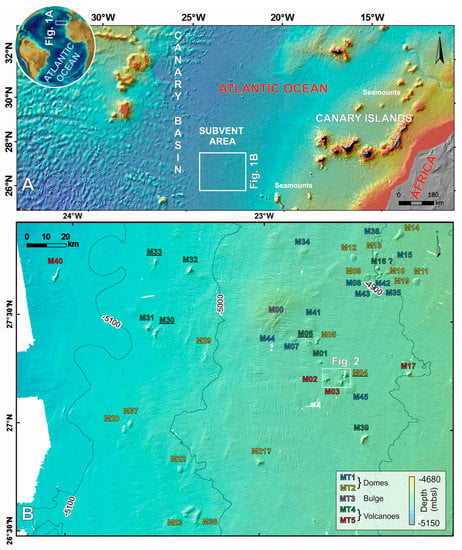
Figure 1.
Location of the study area. (A) Overview map of the western Canary lower continental slope and location of the study area in the Canary Basin (Central Eastern Atlantic Ocean); (B) Subvent Area bathymetric base map where the forty mounds are morphostructurally classified into five types of edifices [42]. The highlighted mounds are categorized according to their origin following [41].
2. Study Area
The study area is situated in the central Canary Basin, approximately 500 km west of the volcanic archipelago of the Canary Islands (Figure 1). The Canary Basin is located in an intraplate setting over Jurassic to present oceanic crust [43]. This basin has been characterized as having a heterogeneous distribution of various volcanic elevations including seamounts, hills, and seafloor mounds [42,44]. Nevertheless, in the central area of this basin, known as the Subvent Area, these seafloor mounds are hydrothermal domes and scattered volcanoes related to Quaternary intrusive activity that gave rise to a huge magmatic sill complex together with volcanic activity [41]. Indeed, different morphostructural types (MT) of seafloor mounds have been differentiated according to the height, slope and basal area of these seafloor elevations [42] in agreement with various linked sill intrusions and volcanoes, as reported by [41].
The different genetic processes occurring in the Subvent Area have resulted in a striking seabed landscape including: hydrothermal domes formed above inclined but mainly saucer-shaped intrusions (MT1 and MT2); a huge bulge with a central depression associated with inclined sills at the top of a buried seamount (MT3); volcanic mounds developed at the top of basement highs and hydrothermal volcanic complexes associated with stratified sills (MT4 and MT5) [41,42] (Figure 1B). The classification according to size and slope variables has proved successful in discriminating hydrothermal domes from volcanic edifices, and just a few mismatches in the classification have been identified (i.e., M04, M06, M30, and M33) [42]. M06, M30 and M33 were morphostructurally classified as hydrothermal domes (MT2) despite the fact they have been confirmed as volcanic edifices, whereas M04 was regarded as volcanic mounds (MT4) even though it had been characterized as a peripheral dome of a volcanic/sill complex [41]. All the mounds have been labeled in accordance with the aforementioned classification, but the highlighted mounds are reclassified in regard to their confirmed origin (Figure 1B).
3. Method
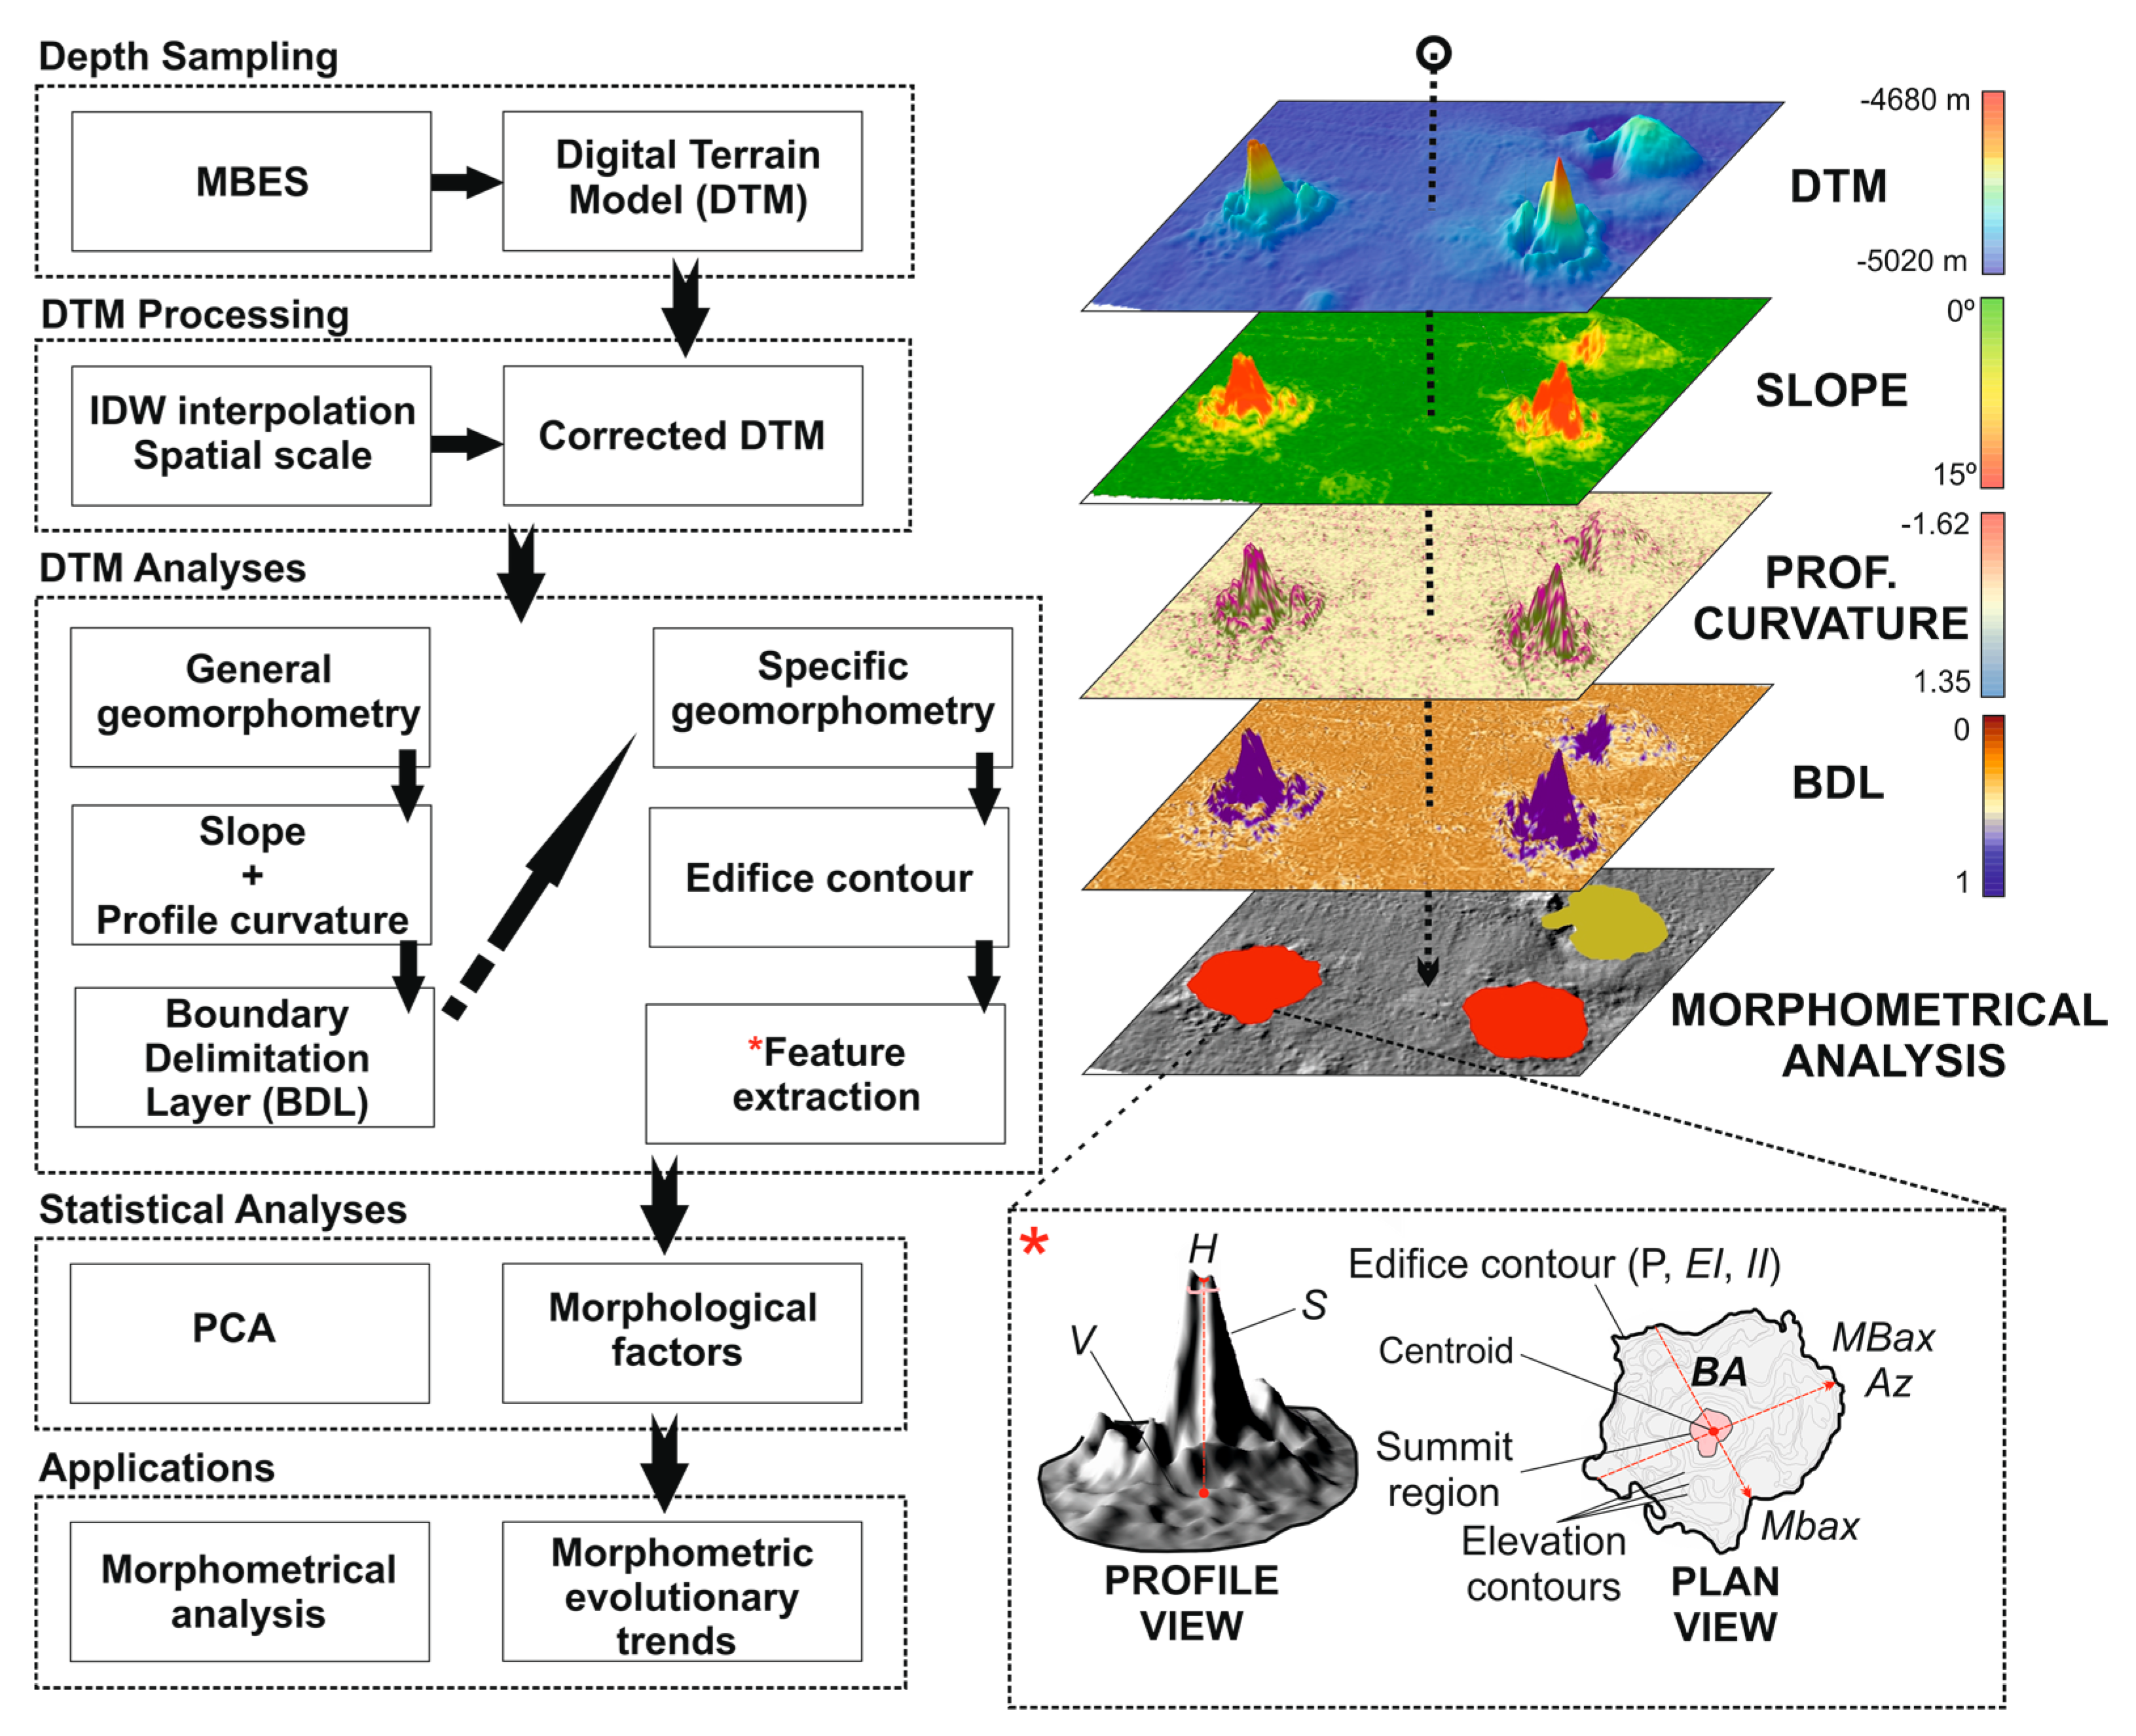
Geomorphometric methods are commonly implemented in several steps, beginning with the acquisition, processing, and analyses of the bathymetric data, followed by Geographic Information System (GIS) applications (Figure 2). The methodological approach to computing features extracted from the DEM is based on multibeam data and its subsequent analysis using the ArcGIS © desktop v. 10.4.1 software packages. This contains various applications for the nearly automated extraction of variables from DEMs and further analyses based on these.

Figure 2.
Methodological workflow for the acquisition, processing, analyses, and applications of DEM in this study. The main features extracted are listed as follows: H (m) height; S (degrees) slope; V (km3) volume; BA (km2) basal area; P (km) perimeter; EI—ellipticity index; II—irregularity index; MBax and mBax (km) major and minor basal axes and Az (degrees) azimuth.
3.1. Dataset Sampling and Processing
To record seafloor depth, four oceanographic cruises (GAROÉ-2010, GAIRE-2011, AMULEY-ZEEE-2012 and MAEC-SUBVENT-2013) were undertaken, from 2010 to 2013, by the Spanish R/V Hespérides and R/V Sarmiento de Gamboa. The datasets obtained cover the lower and middle continental slope offshore the Canary Islands up to 5400 m below sea level (mbsl) (Figure 1). Full coverage and high-resolution bathymetric datasets were acquired using Kongsberg-Simrad EM-120 and Atlas Hydrosweep DS-3 multibeam echosounder systems (MBES). The sonar frequency of the Simrad EM-120 deep system was 13 kHz, with an angular coverage sector of up to 150 degrees and 191 beams. The transducer opening was as narrow as 1 degree. The achievable swath width was normally up to 3.5 times the water depth. The angular coverage sector and beam pointing angles were set to vary automatically with depth according to achievable coverage. The beam spacing was normally equidistant with available equiangle. Atlas Hydrosweep DS system was operated at a frequency of 14 to 16 kHz with a maximum of 345 beams spread over 140 degrees. The bathymetric across-track coverage was 3.5 times the water depth. The acoustic footprints were arranged in either an “equal-angle” or “equal-distant” pattern. In the Subvent Area (5000 m water depth), the vertical resolution and was 10 m and the footprint range was between approximately 50 and 90 m. Obtaining the DEMs required the sampled depths to be processed using CARIS HIPS and SIPS © software (i.e., sound velocity correction, noise filtering, cleaning of the data, interpolation, and choice of optimal spatial scale) in order to generate a corrected surface model yielding a DEM with 150 m of spatial resolution (Figure 1B). This resolution was chosen following the full homogenization of the data by hydrographers from the Spanish Navy’s Hydrographic Institute.
3.2. DEM Analyses: Delimiting the Contour and Morphometric Variables
From the corrected DEM, we undertook topographic modeling based on the aforementioned method [36], which blends both primary and secondary DEM-derived products; slope and profile curvature; into a single boundary delimitation layer (BDL), using ArcGIS Analysis tools (Figure 2). This final product was used for the next step where each edifice analyzed was spatially delimited based on concave breaks in slope around it. All outlined edifices had distinct positive topographies, with a relief of more than 10 m, basal diameters of greater than 1 km, and areas not smaller than 2 km2 (i.e., 90 pixels) according to the available spatial resolution. Based on these criteria, we analyzed forty mounds consisting of topographically recognized shapes.
The edifice boundary was used to directly compute the following size variables: Perimeter (P), which is the outlining edifice contour; Basal and summit areas (Ba and Sa), and edifice Height and Volume (H, V) were measured as the absolute difference between the summit and basal relief points or surfaces of the selected edifice outline, respectively, using ArcGIS Analysis tools. Major and minor basal and summit axis (MBax, mBax, MSax and mSax), so called diameters or widths, were manually measured to calculate the aspect ratio of the edifices. Other morphological size ratios were calculated including Flatness (FL = MBax/MSax and Sa/Ba) [45,46], defined as the ratio of the summit diameter or area to the basal diameter or area; and Sigma Value (SV = 2 × H/(MBax−MSax)), normally inversely proportional to FL (1-FL) [46]. Aspect ratios such as Eccentricity (mBax/MBax) and the H/MBax index were also calculated [47]. Slope (S) was calculated as the first derivative of the DEM [48], also using also ArcGIS Analysis tools. This corresponds to the maximum elevation change over a given distance and is indicated in degrees. The plan shape of the edifices was characterized using the Ellipticity Index (EI = Π × (MBax)2/Ba), which quantifies edifice elongation, and the Irregularity Index (II = (P/2 × Ba) × (√Ba/Π)-1), which quantifies edifice complexity (for details see [36]). Orientation variables were represented by the azimuth of the MBax (Az), which was calculated from the most northerly to the most southerly point, indicating the edifice elongation orientation.
The morphological variables used in this study should be highly correlated because they derive from a unique source (DEM). All these variables contain relevant information on the geometry of the edifices since they have previously proven to be good indicators for correlating seafloor features with constructive- and destructive-related processes. They are used in correlation and statistical analyses to examine whether these edifices display similar morphometries (i.e., maintaining a uniform H/MBax) as observed in other morphometric analyses [27,45,47].
3.3. Principal Components Analysis
Once all the aforementioned variables and ratios had been calculated for each edifice, we applied a principal components analysis (PCA [49]) method to the data using XLSTAT software v.7.5. This is a common statistical procedure used to convert a set of observations into uncorrelated groups of correlated variables (i.e., principal components (PCs) or factors (F)) (e.g., [16]). The use of PCA is a standard practice in current exploratory data analysis [50], used for extracting the dominant patterns from the datasets in terms of loading plots and reducing the non-relevant information. Each PC explains a percentage of the total variability of the original dataset. The first PC accounts for the highest variance, the second accounts for the next most important variance, and so on. A decision criterion based on the eigenvalues is often used to determine how many PCs are relevant in the analysis [51]. In this study, only factors with eigenvalues higher than 1 were considered, following the Kaiser-Harris criterion, because this metric represents the most useful factors. PCAs and their key applications in oceanography can be considered diagnostic tools for multivariate analysis since they enable the simplification of the complex variance patterns found in many physical and geological systems.
4. Results
The forty mounds analyzed comprise a wide spectrum of seafloor forms and sizes. The integrated combination of automatic morphological attributes mapping and feature-based quantitative representation was useful for extracting the relevant morphometric information. We assessed which were the most highly correlated and well-determined variables (Figure 3) in the morphometric relationships among the mounds and related variables. These relationships were plotted to evaluate whether there are any natural clusters in the data (Figure 4 and Figure 5), as well as the size and shape growth patterns of the various types of mounds (Figure 6 and Figure 7).
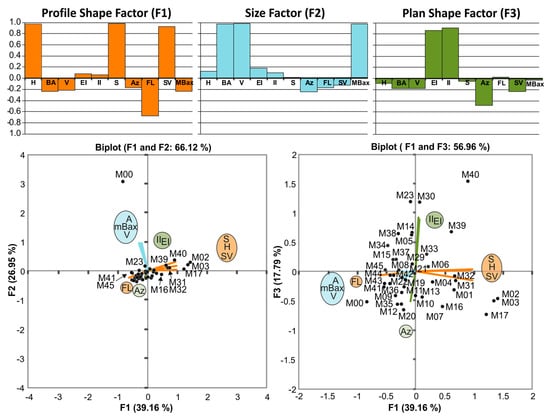
Figure 3.
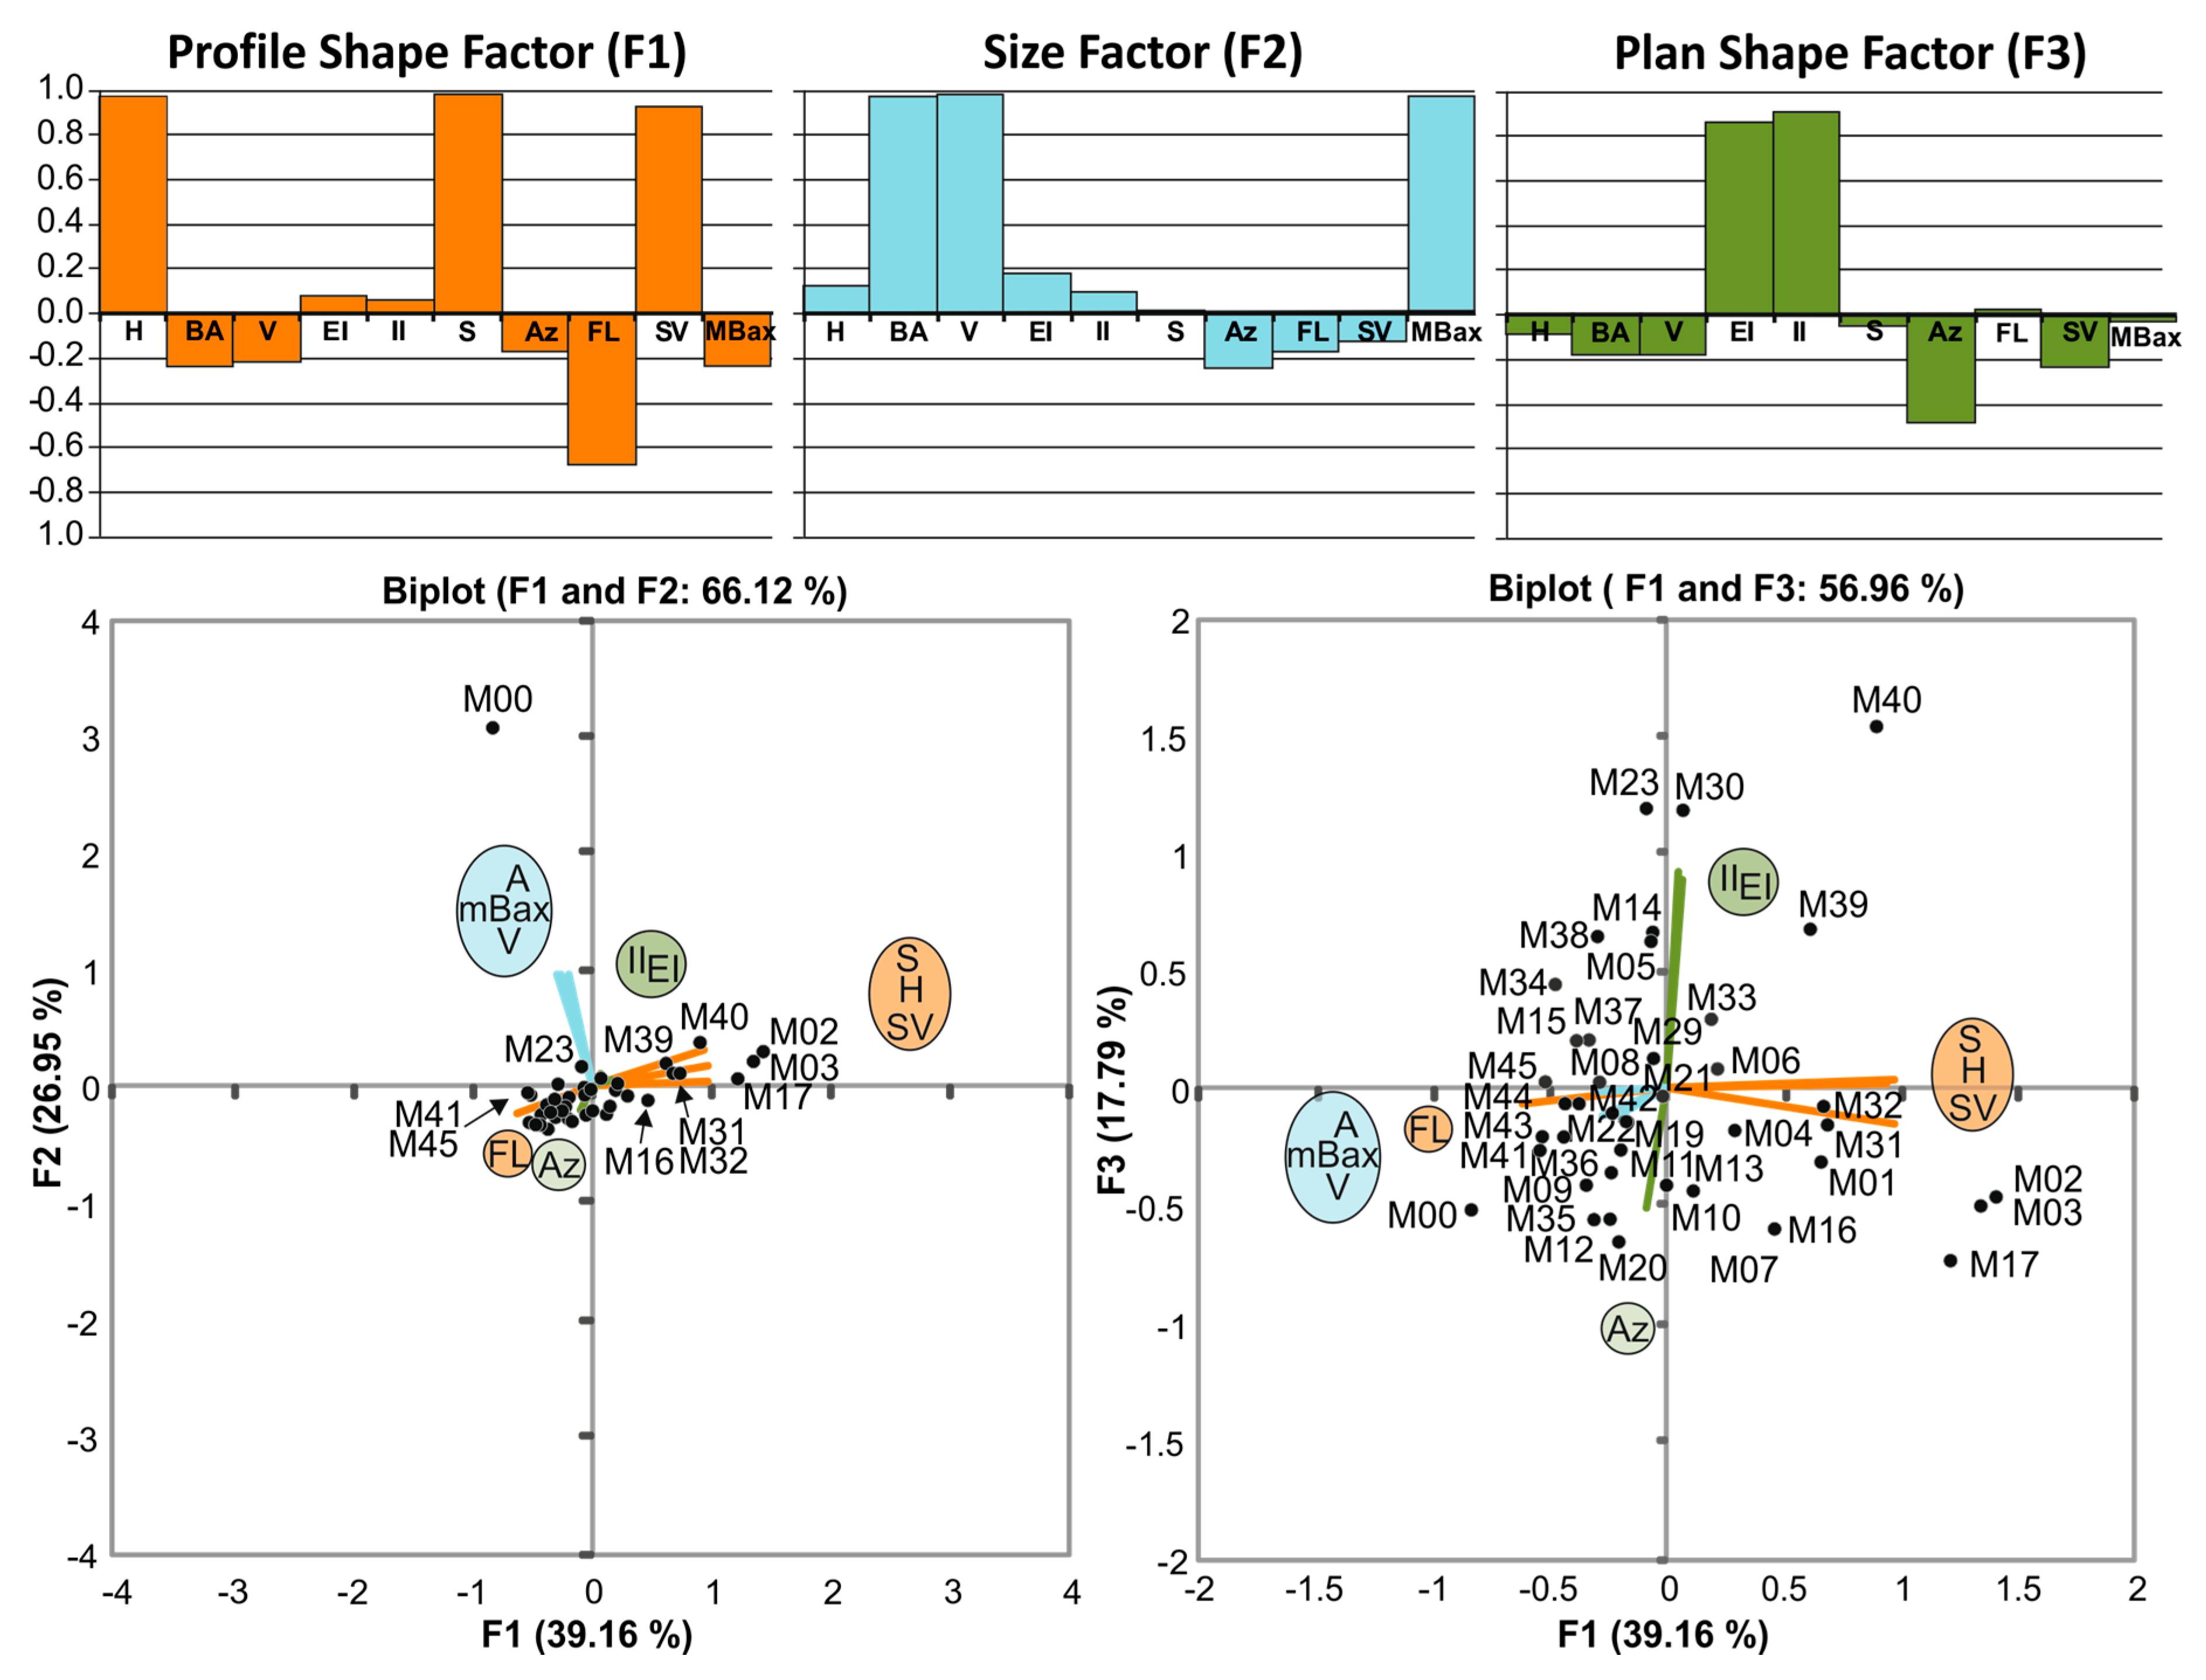
Factor loading plots of the three main principal components that account for 84% of the total variance of the edifices. Factor loads explain the correlations between the PCs and the original variables. Bar plots illustrate which variables are driving the PCs. We have named each factor according to the most significant variables of the analysis. The PCA biplots allow visualization of both the observations (edifices) and the variables among F1-F2 and F1-F3 relationships. Edifices are displayed as points while variables are displayed as linear axes. Standardized values are used to represent the factors.

Figure 4.
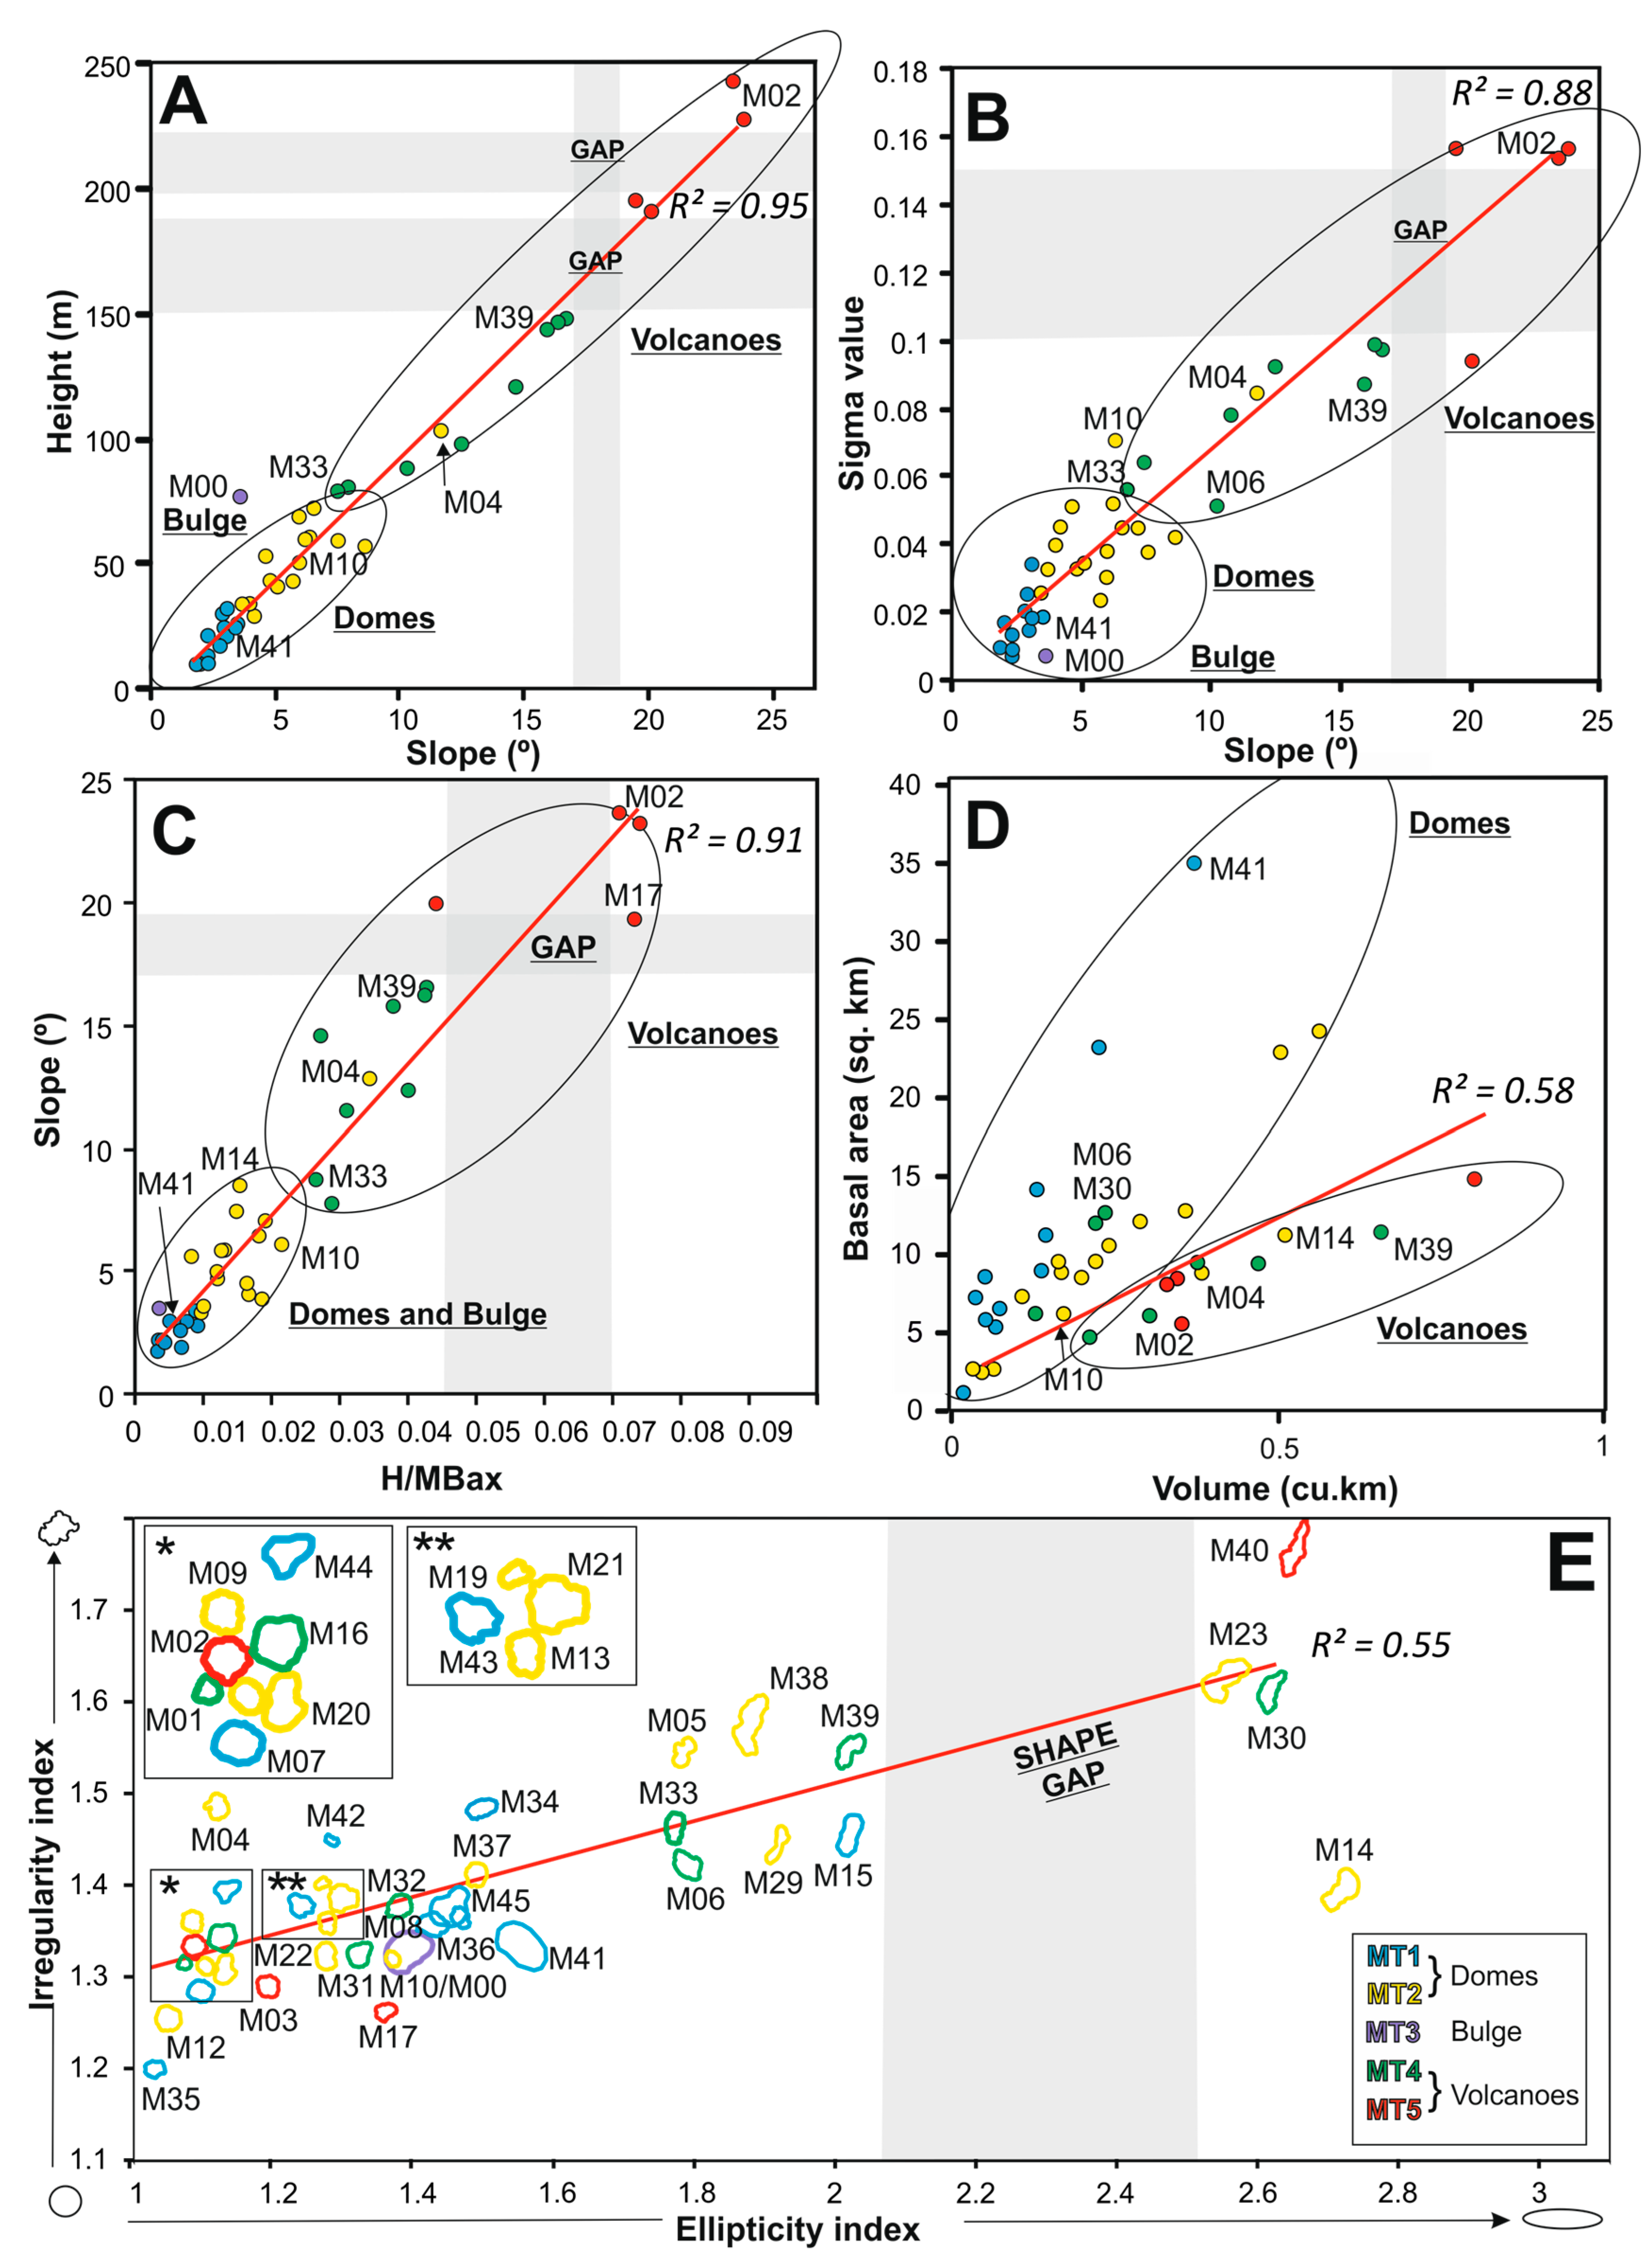
XY scatter plots of correlated variables for the forty mounds (n: 40). (A,B) Slope (X) vs. Height (Y) and Sigma Value, respectively; (C) Height/Basal length (X) vs. Slope (Y); (D) Volume (X) vs. Area (Y) where M00 is excluded being considered an outlier for Size Factor (F2); and (E) Ellipticity index (X) vs. Irregularity index (Y). The basal contour of each of the forty mounds is shown. All the mounds conserve their scale with the exception of M00. The red lines indicate the trend of each correlation and the R2 coefficient is displayed next to them. The ellipses indicate the natural tendency of the edifices types to cluster, and gaps in the distribution are highlighted by shaded regions.
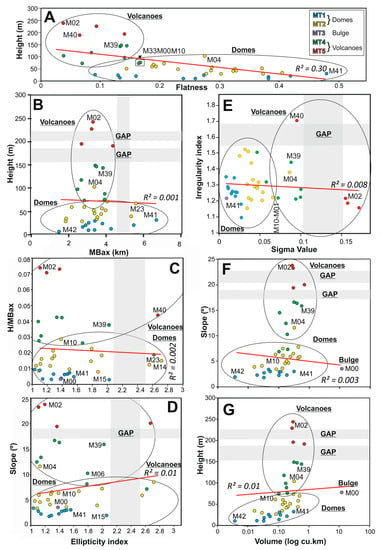
Figure 5.
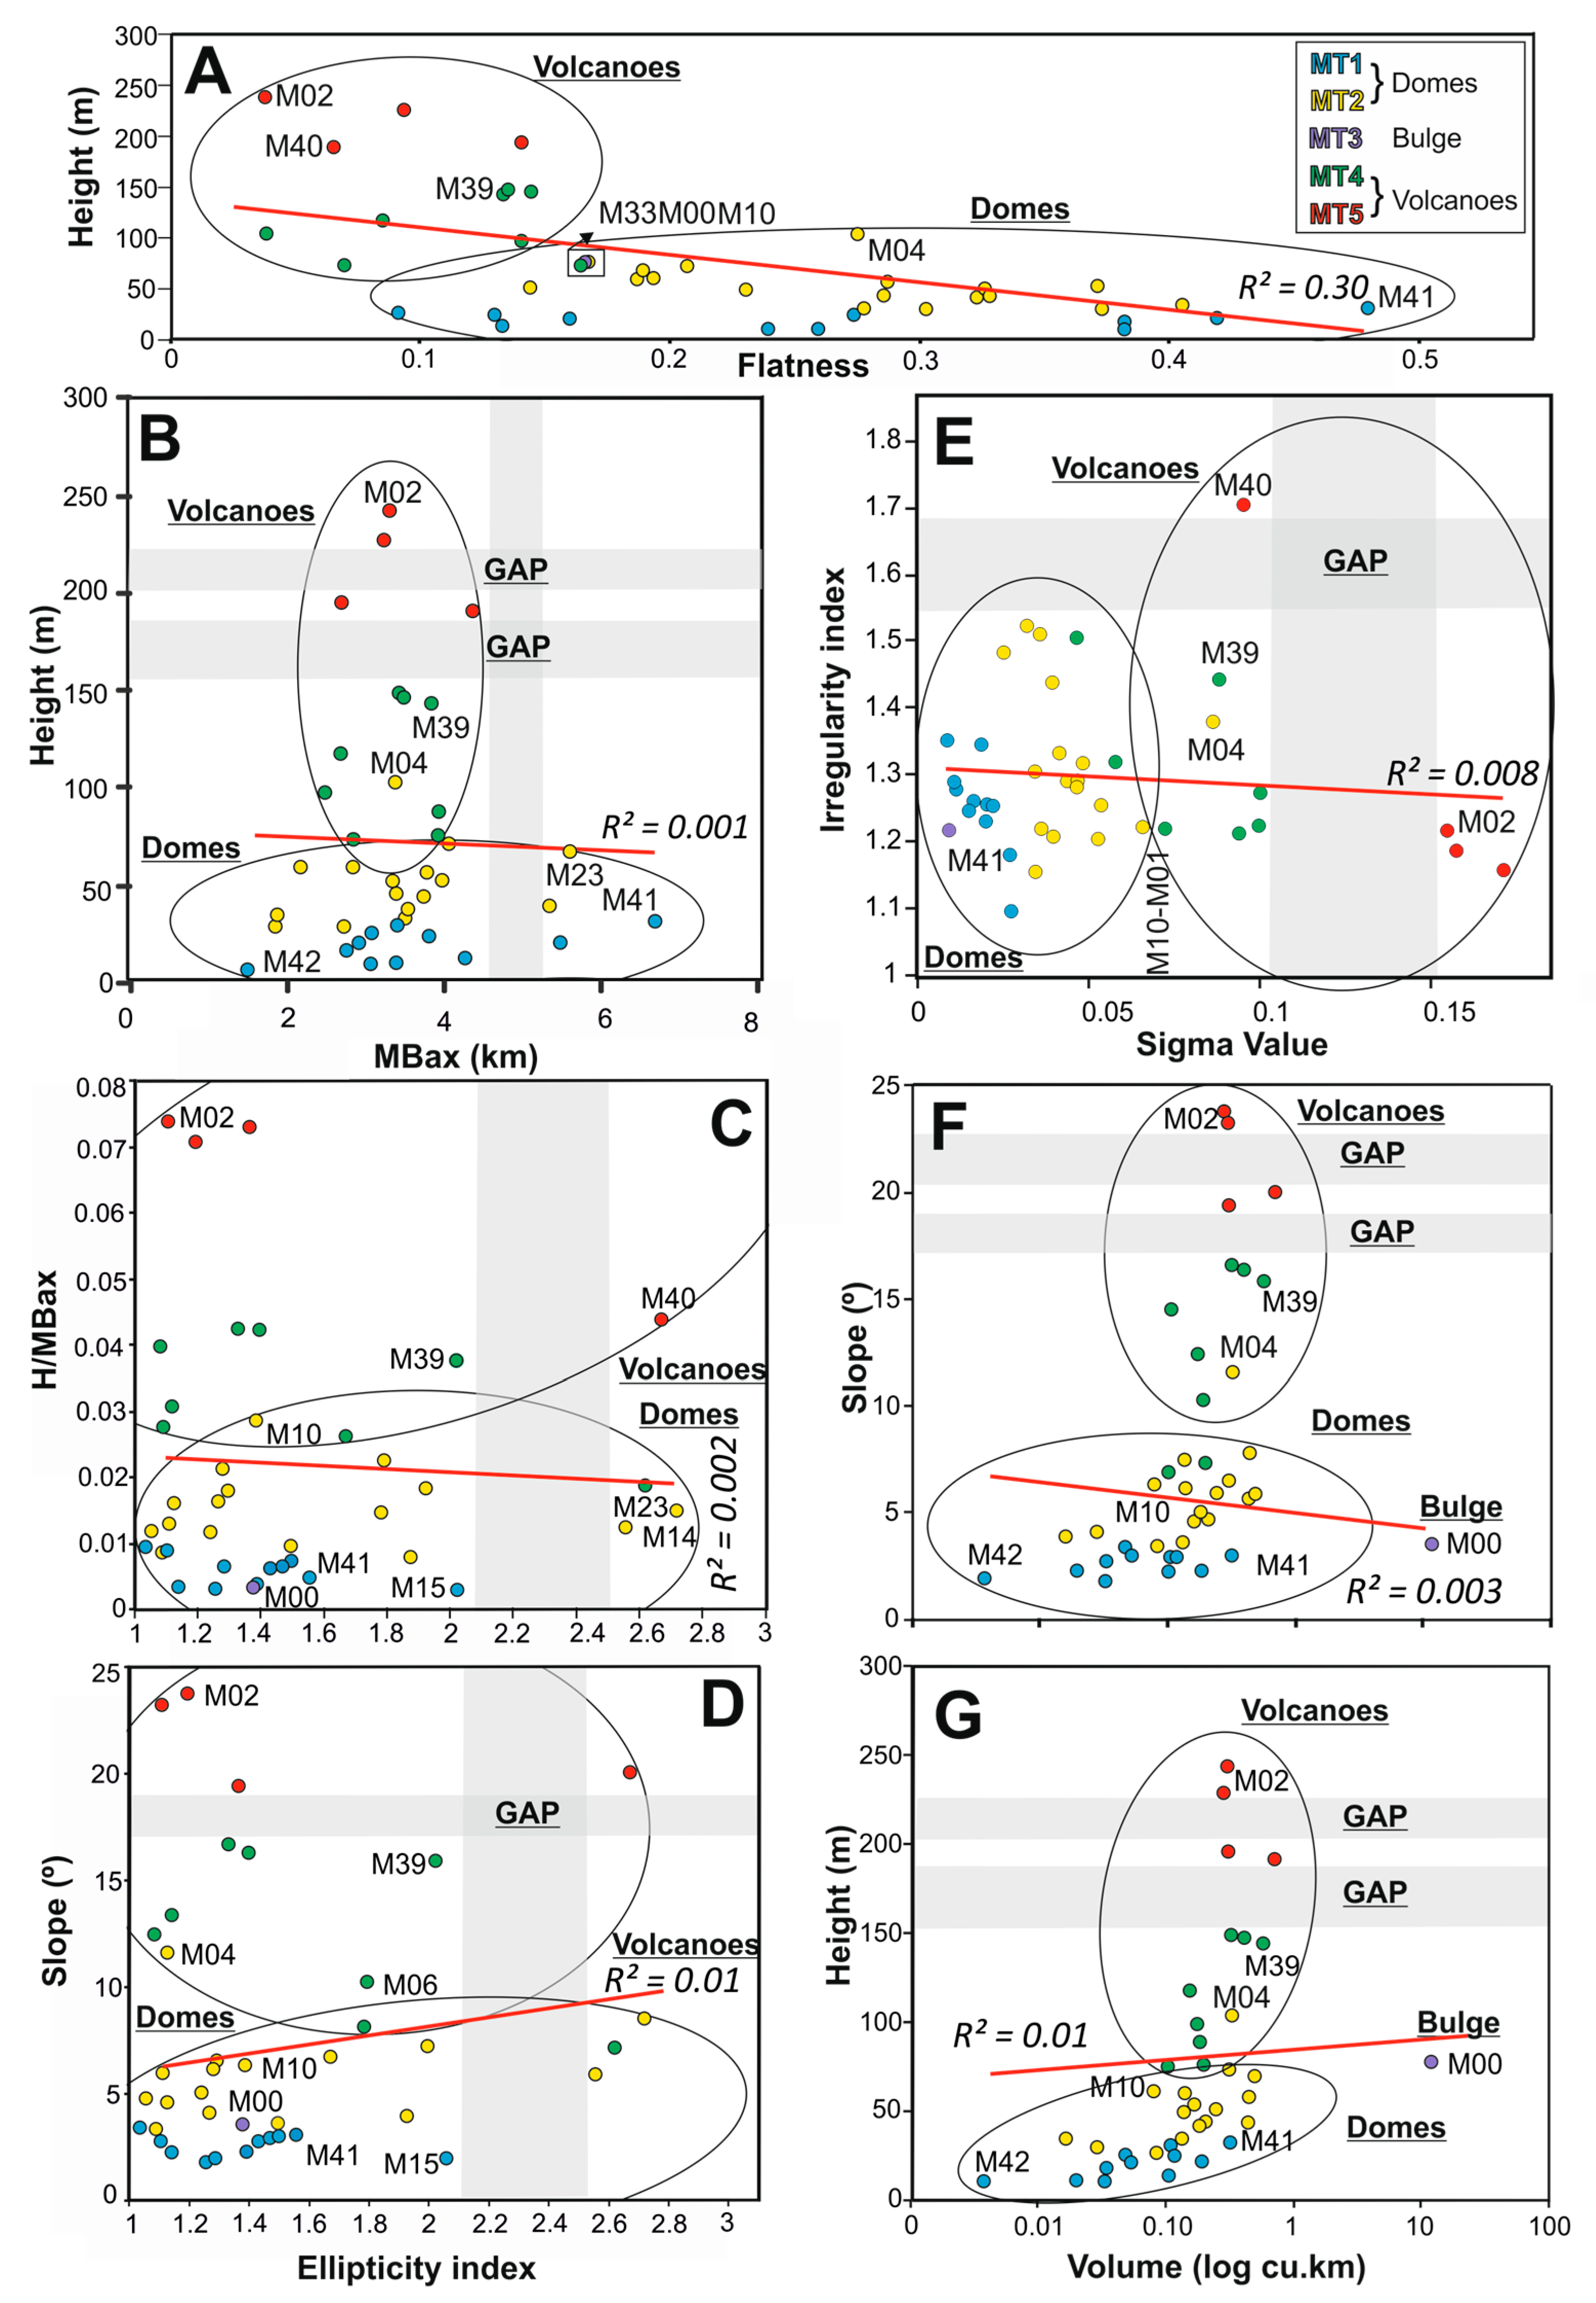
XY scatter plots of the main variables for the forty edifices (n: 40). (A) Flatness (X) vs. Height (Y); (B) Basal length (X) vs. Height (Y) excluding M00 that is considered an outlier; (C and D) Ellipticity index (X) vs. Height/Basal length (Y) and Slope (Y), respectively; (E) Sigma value (X) vs. Irregularity index (Y); and (F and G) Logarithmic (log 10) Volume (X) vs. Slope (Y) Height and (Y), respectively. The five morphometric edifice types are shown and some mismatched edifices are highlighted. The red lines indicate the trend line of each correlation and the R2 coefficient is displayed next to them. The ellipses indicate the natural tendency of the edifice types to cluster, and gaps in the distribution are highlighted by shaded regions.
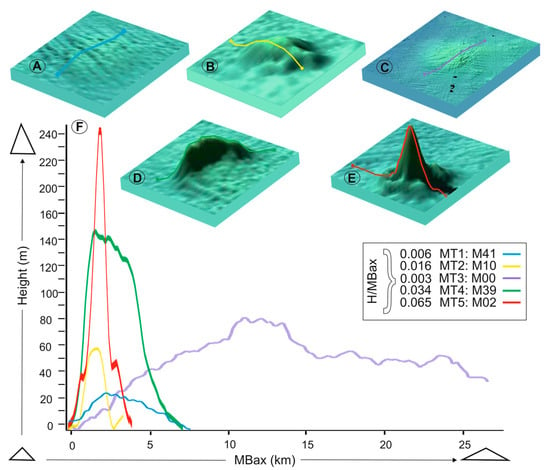
Figure 6.
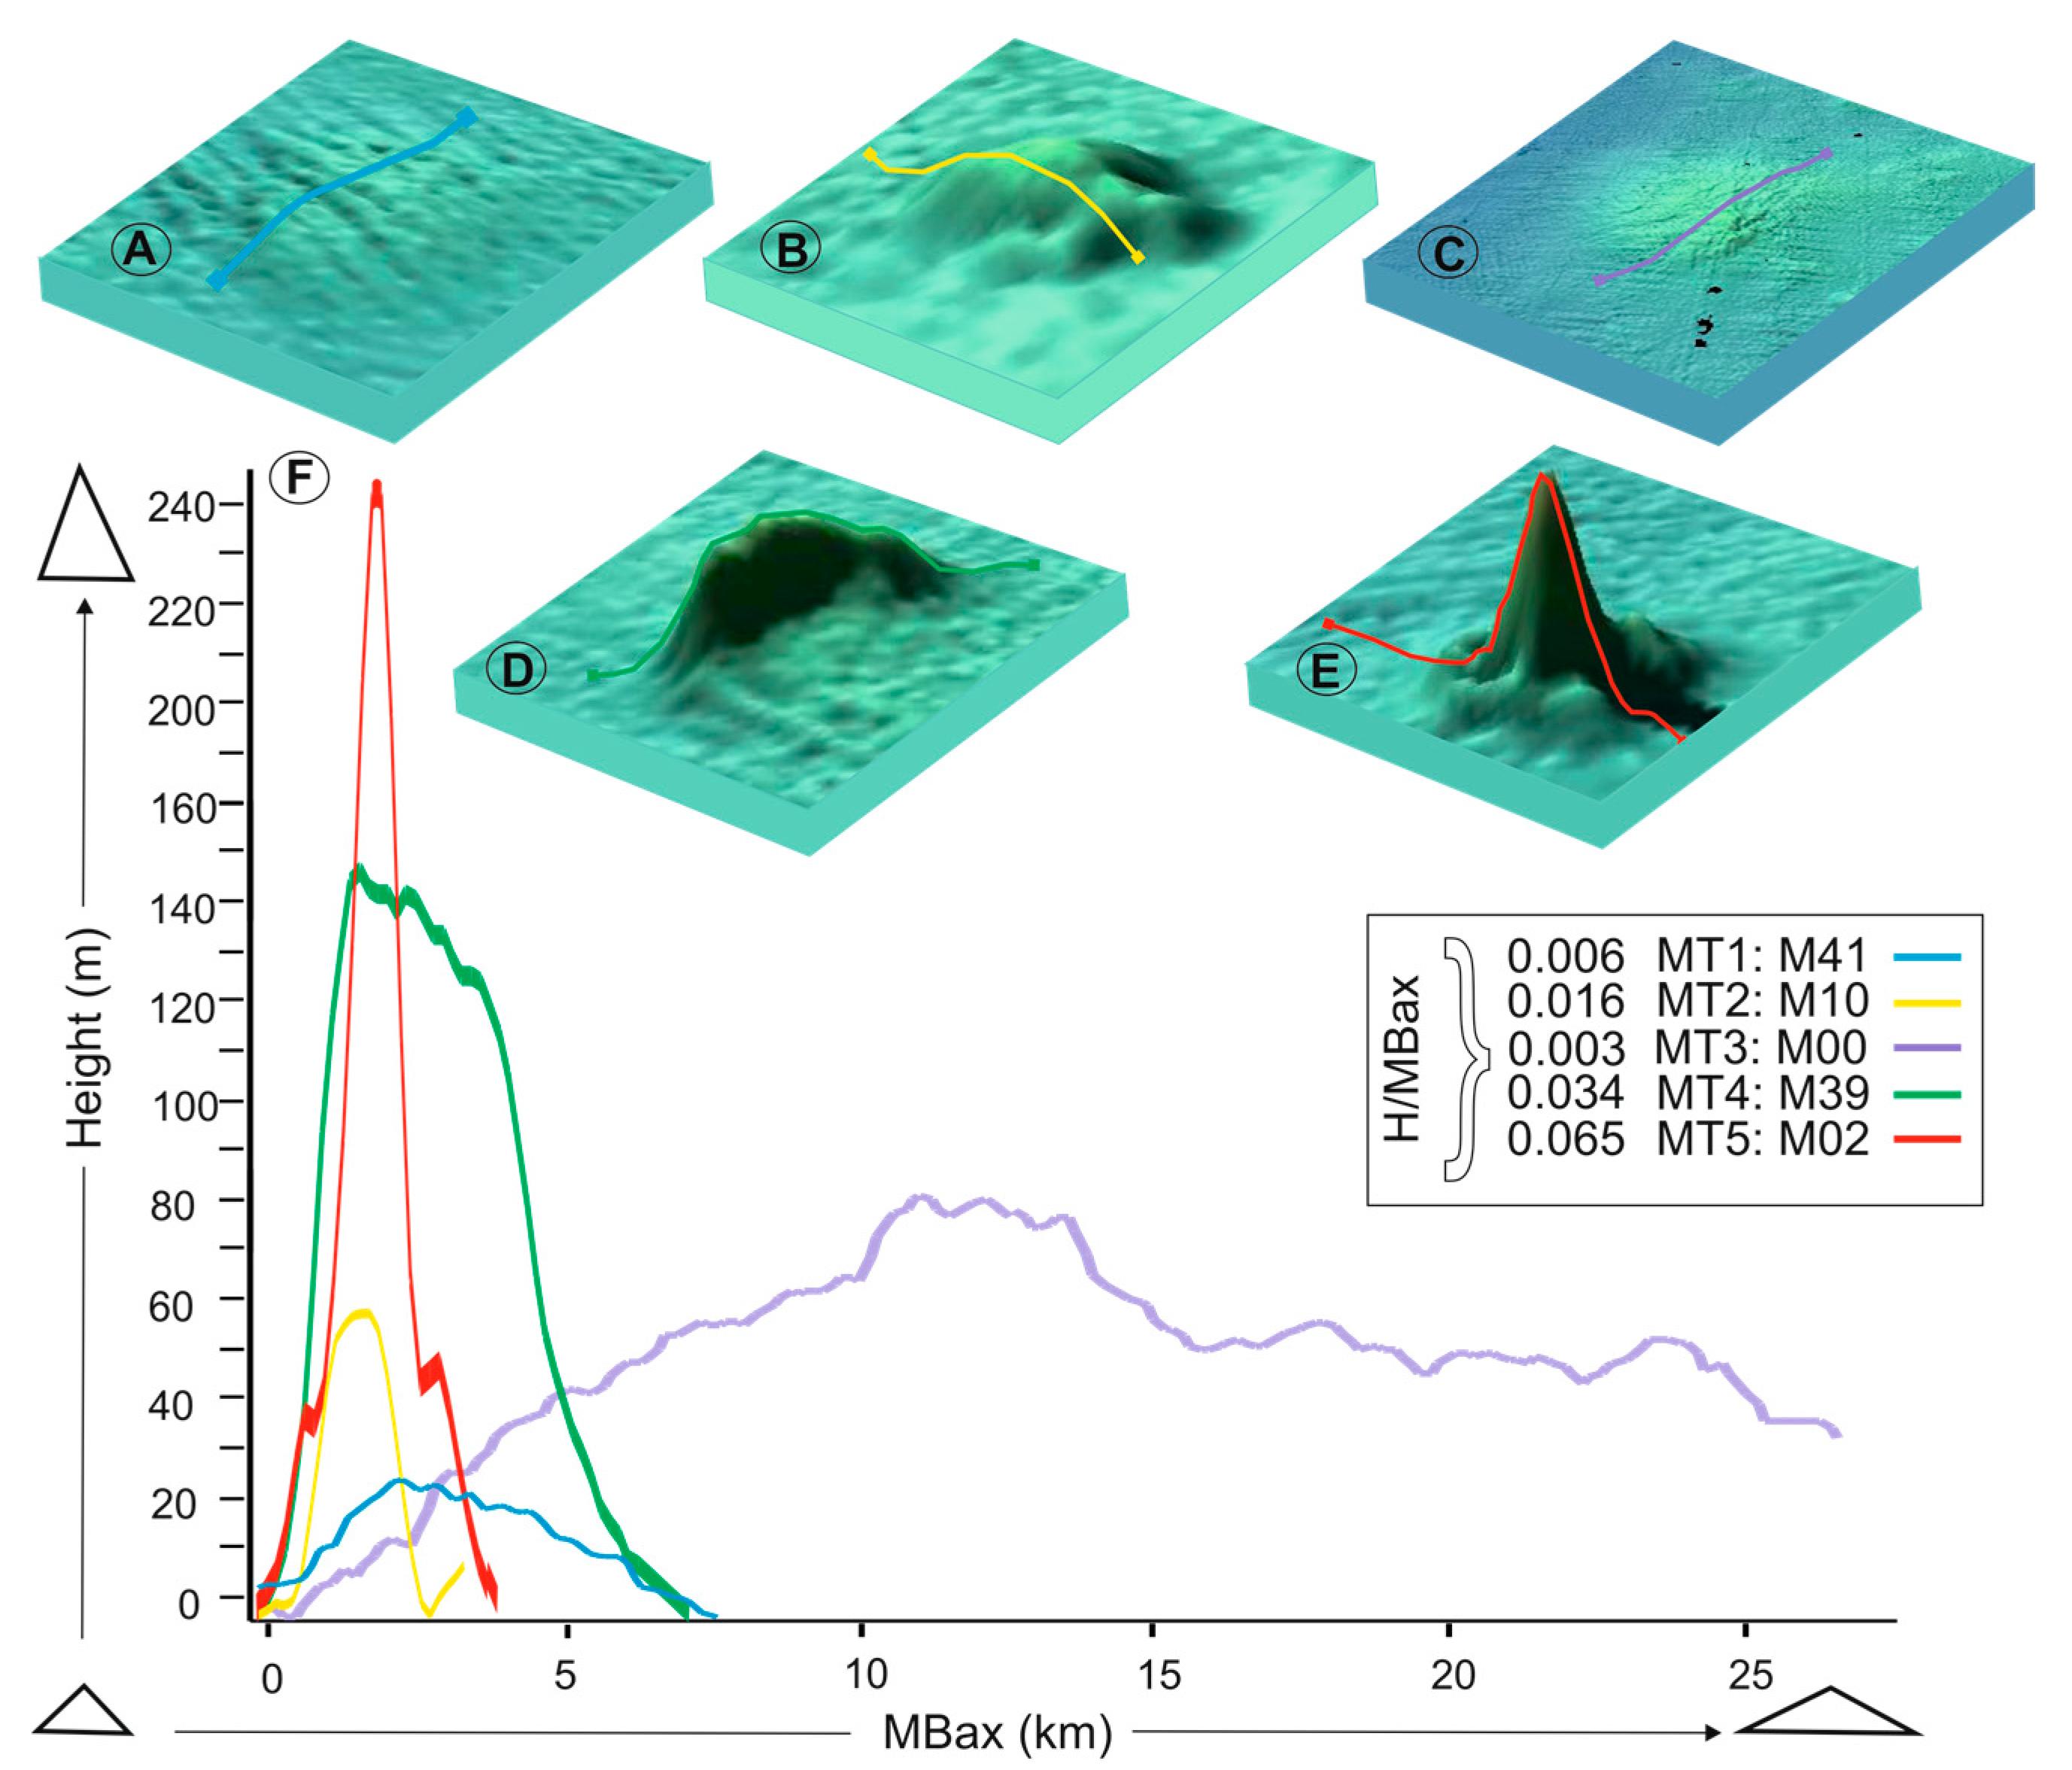
Representative geometry and bathymetric profiles for each type of edifice illustrating the variation in profile shapes. (A) M41 (MT1); (B) M10 (MT2); (C) M00 (MT3); (D) M39 (MT4); (E) M02 (MT5) and (F) Bathymetric profiles of five types of morphometries. The mean aspect H/MBax ratio of each MT indicates that domes are considerably lower than volcanoes.
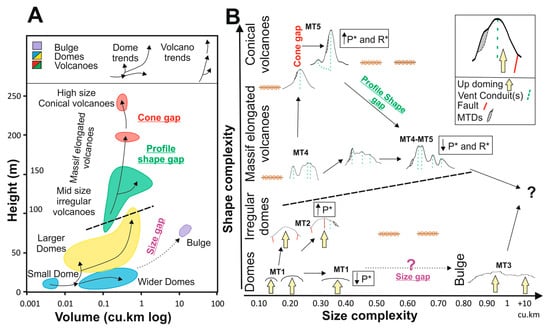
Figure 7.
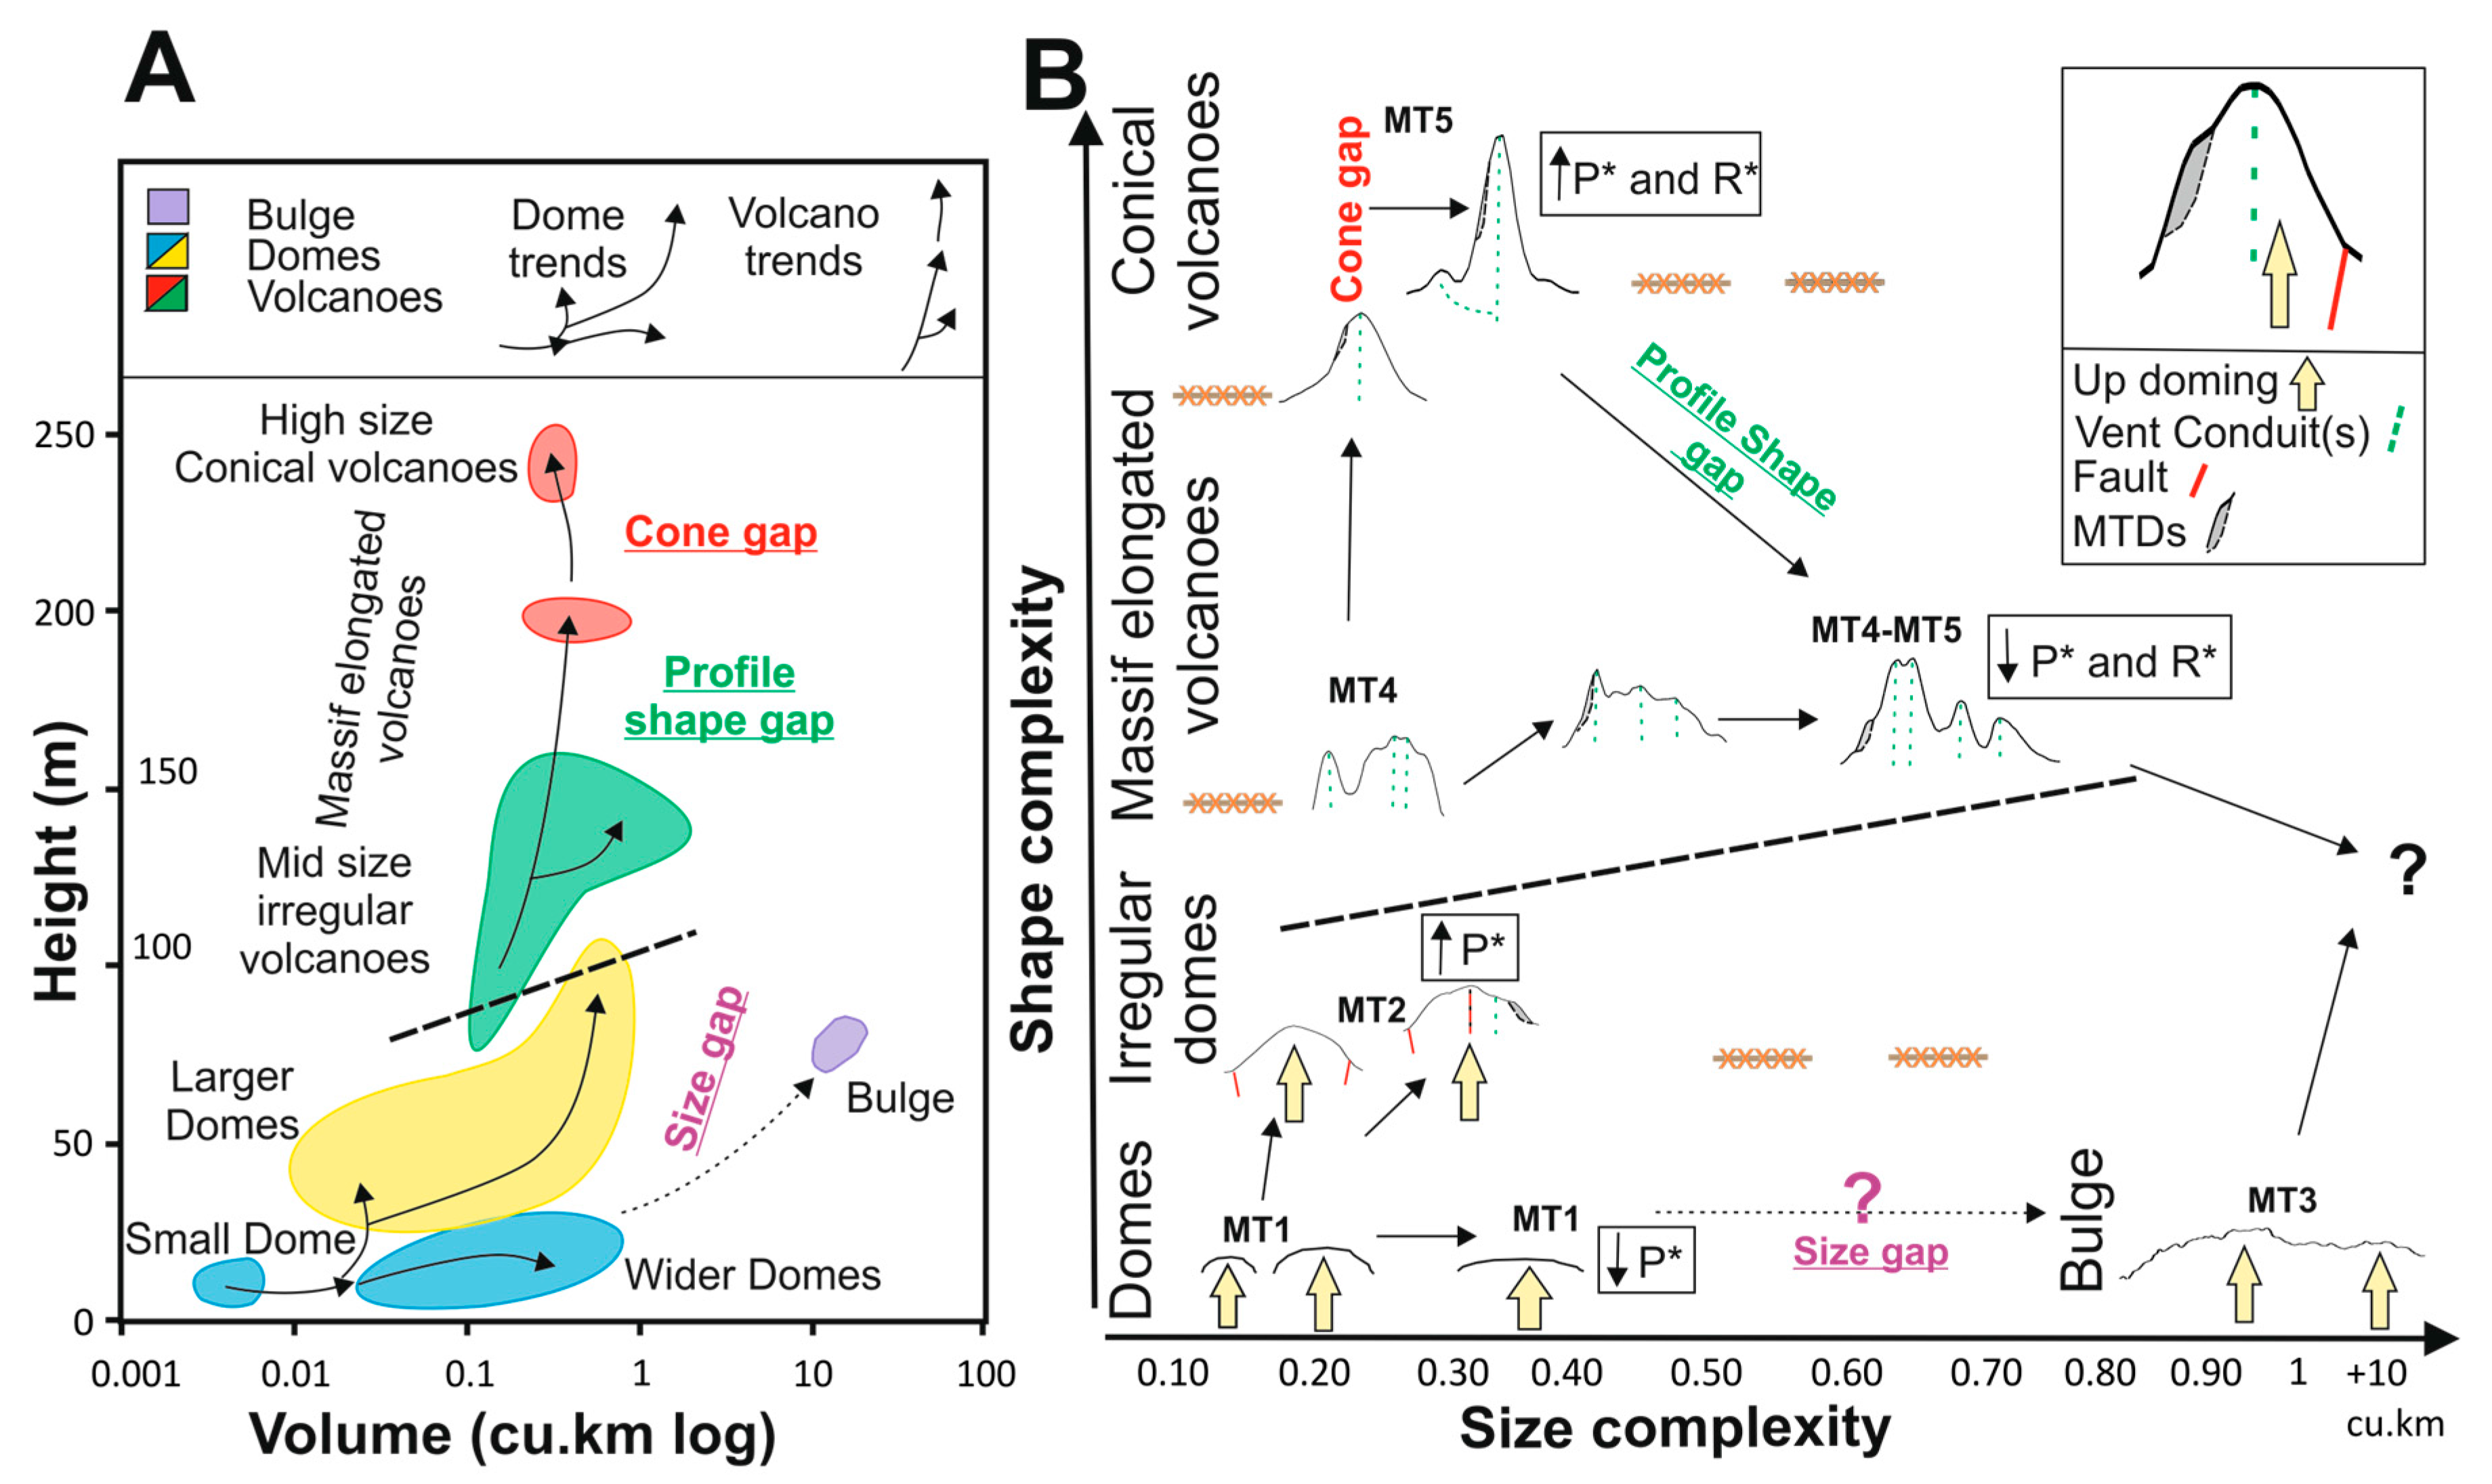
Morphometric model that incorporates different types of seafloor edifices. (A) Height versus volume diagram showing best-fit fields for the five types of seafloor edifice and possible evolutionary trends. The straight dashed line is the threshold used to separate domes from volcanoes; (B) Possible evolutionary growth paths of domes and volcanoes are highlighted. P* is pressure balance and R* is resistance balance, according to the model proposed by [35]. Arrows represent edifice growth trends and orange crosses represent size and shape morphometries that do not occur in the Subvent Area.
4.1. Main Morphometric Variables
The PCA (Figure 3) was conducted using ten of the seventeen variables listed in Section 3.2. The variables driving the PCA were height, slope, sigma value, flatness, basal area, volume, diameter, irregularity and ellipticity indexes, and azimuth. These variables display loading of more than ±0.5 and contribute to defining the main factors explaining 84% of the total variance (in geometric variability (size and shape) of the mounds), with eigenvalues larger than one. H, S, and SV are positively loaded in Factor 1, while FL is negatively loaded; together these explain 39% of the variance in these seafloor edifices. This factor has been considered an indicator of the overall vertical growth and inclination of the edifice and we have denominated it Profile Shape Factor (F1). BA, V, and MBax contribute to defining Factor 2, which we have called Size Factor (F2). This explains 27% of the variability in the seafloor edifices. Finally, Factor 3 explains 18% of the variance and is considered the Plan Shape Factor (F3) since it is positively determined by the shape descriptors EI and II, and negatively loaded by the azimuth of the edifices.
The relationships among the edifices and the variables are plotted in the F1 vs. F2 and F3 biplots (Figure 3) where each dot represents one of the forty edifices and the ten variables are represented by linear vectors. Axis X (F1) relates to the height and slope measurements, with edifices on the left having both lesser heights and slopes (i.e., M41 and M45), while the edifices on the right have larger values (i.e., M02 and M03). Axis Y (F2) is a measure of the basal size, with most of the edifices on the bottom being small, while edifices on the top are large (i.e., M23) to extreme in size (i.e., M00). Axis Y (F3) is a measure of the shape, with edifices on the bottom being circular (i.e., M07 and M17), while edifices on the top show varied elongation and shape complexity (i.e., M30). Dots that are close together correspond to edifices that have similar values (i.e., M31 and M32, or M15 and M37) (Figure 3). Dots that are relatively far apart correspond to edifices that are different to the others, for example: M02, M03, and M17 have high Profile Shape Factor (F1) values, M00 has the highest Size factor (F2) value and M40 has the highest value for the Basal Shape Factor (F3).
4.2. Relationships between the Main Morphometric Variables
In order to investigate the relationships between the different types of mounds and related variables, several XY scatter plots and their linear correlation coefficients (R2) are shown among the morphometric variables that have determined morphometric factors F1, F2 and F3. The highest correlations measure the strength of the linear relationship between two of the plotted variables and are determined by the size and slope variables. The data is discriminated by the types of edifices in different color-coded tiles (Figure 4A–E).
4.2.1. Profile Shape Factor (F1)
Slope correlates very positively with height, sigma value and height/basal length ratio, having R2 coefficients of 0.95, 0.88 and 0.91, respectively. They have the strongest linear relationship and a large scatter between the mounds generating gaps in the data. Slopes range from 1.8 to 24°, with a mean of 7.7°, while height ranges from 10 to 245 m, with a mean value of 70.5 m (Figure 4A). The sigma value has an inverse relationship with flatness and ranges from 0.005 to 0.16, having a mean value of 0.05 (Figure 4B). In this way, high values of SV= 0.1 indicate conical or multipeaked shapes with high height and slope values. Basal lengths range from 1 to 6.5 km with the exception of M00, which is up to 24 km long, and the H/MBax ratio reaches 0.07, with a mean value of 0.021. A gap in the H/MBax ratio exists between 0.04 and 0.07 (Figure 4C). The data plotted on these graphs shows some overlaps and gaps in the distribution although an important agglomeration is observed at values of less than 80 m in height, 10° of slope, 0.06 SV, and 0.025 H/MBax ratio. This agglomeration of observations includes all the domes apart from M04, whereas the volcanoes are distributed into in several skewed groups at levels of more than from 75 m high, 12° slope, 0.06 SV, and 0.023 H/MBax ratio, with the exception of M30 and M33 (Figure 4A–C). This suggests that processes controlling the size and slope of the domes are not similar to those controlling the volcano building.
4.2.2. Size Factor (F2)
The correlation between basal area and volume is positively proportional and linear, with a high R2 coefficient of 0.58 (Figure 4D). They have a highly linear relationship but there is a large degree of scatter between the mounds and diffuse limits. Basal area range from 2 to 35 km2 and volumes from 0.005 to 0.7 km3, with the exception of M00, which has maximum values of 440 km2 and 11 km3, respectively. The mean values are 20.66 km2 and 0.5 km3. M00 has atypical values in this distribution and is considered an outlier that is 3xIQR (inter-quartile range) above the third quartile and for this reason it has not been included. On this plot, domes and volcanoes are clearly separated into two distinct groups that follow different size increase trends, with the exception of a few edifices (M04, M06, M14 and M30) located on the contrary cluster. This suggests that the smaller volcanoes are morphometrically similar to the domes, and larger domes attain the same size values as volcanoes. Several mounds do not fit the best linear regressions (i.e., M41 in Figure 4D) but most plot fairly close to the rest of the mounds.
4.2.3. Basal Shape Factor (F3)
The ellipticity (EI) and irregularity (II) ratios range from 1 to 2.7 and 1.2 to 1.8, respectively (Figure 4E), with means of 1.5 and 1.4. They have a positive asymmetric correlation with R2 = 0.55. The II distribution is more roughly symmetrical, whereas the EI distribution is largely skewed and unevenly spread with a gap between 2 and 2.6 (Figure 4E). There are no significant relationships between MTs among these descriptors although three slight groupings can be identified in the data: near circular edifices (low II and EI values), such as M03 and M12; more complex forms (from irregular edifices that are not very elongated (i.e., M05) to elongated edifices that are less irregular (i.e., M14); and elongated complex edifices (high EI and II values) such as M40.
4.2.4. Other Morphometric Relationships
The above-mentioned variables do not correlate significantly with others, although natural clusters classifying domes and volcanoes are observed when we plot them against one another (Figure 5). Flatness ranges from 0.05 to 0.47 with a mean value of 0.23. There is a weak correlation between height and flatness, with R2 = 0.3 (Figure 5A). As height increases, flatness decreases; however, there are two further rough trends: at heights above approximately 90 m, flatness invariably ranges from 0.05 to 0.15 in the majority of the volcanoes, except M33. At heights below 90 m, flatness is highly variable and corresponds to the domes (Figure 5A). The greatest range in flatness is observed for mounds with diameters< 5 km and heights of lower than 77 m (Figure 5A,B). This indicates that mean flatness may decrease with diameter, and the most typical shape of larger edifices is pointed or with multipoint geometry (i.e., M02 and M40). Other edifices, whose diameters encompass and extend beyond the sizes of the widest mounds, tend to be flatter (i.e., M41).
The height vs. basal length graph shows no correlation with R2 near 0 showing gaps in both distributions even though there are not many differences in the basal length compared to the height increment (Figure 5B). The height increases roughly with decreasing basal width for large mounds (from 140 m to 240 m and 4.5 km to 3 km), corresponding to volcanoes, whereas domes show a wider range of variability (1 km to 6.5 km). The relationship between H and the basal length (MBax) (H/MBax ratio) suggests a distinct mechanism of growth and, in turn, is indicative of the slope angle and flatness of the mounds (Figure 4 and Figure 5). This suggests that the maximum steepness is not constant, but rather decreases with increasing size. Mounds with basal lengths of less than 3.3 km have higher H/MBax ratios, up to 0.07, while mounds with basal lengths of more than 4 km have smaller H/MBax ratios, lower than 0.03 (Figure 4 and Figure 5).
Similar to the height vs. flatness relationship, the H/MBax ratio shows a rough negative correlation with both shape indices, although not as strong. This suggests that lower H/MBax ratios are related to increasing complexity (i.e., M14 and M23 in Figure 5C). Furthermore, these indices (EI and II) show a lack of correlation with slope and size (i.e., SV) variables (R2 = 0.01) (Figure 5D,E). Therefore, larger edifices tend to be more circular (i.e., M02 in Figure 5C), and steep edifices tend to have higher values for both indexes, even though circular shapes are also seen in intermediate to small edifices (i.e., M10) (Figure 5D). Despite the fact that the slope vs. EI plot shows no correlation and an asymmetrical distribution, domes and volcanic agglomerations are easily distinguished, as the largest and steepest mounds (i.e., M02 and M03) have an antithetic relationship with the elongation (EI) (Figure 4E and Figure 5D). The sigma value is inverse to the flatness and ranges from 0.005 to 0.16, having a mean value of 0.05. Hence, high values of SV= 0.1 indicate conical or multipeaked geometries with high height and slope values. These observations correspond to the majority of the volcanoes with different basal shapes (circular to elongate) (Figure 5E). A medium to low range of SV indicates high degree of flatness with intermediate to low heights and slope angles, corresponding to the majority of the domes. Domes range from circular to irregular and have an II of up to 1.5 (Figure 5E).
Conversely, height and slope seem to correlate positively with volume and basal area (Figure 5F,G), although they do not correlate with R2 near 0. The edifices seem to increase H/V and S/V ratios in two different manners: domes appear to follow the same morphological trend, increasing their volume yet not their height or slope (i.e., M42, M10, and M00); while the development of large volcanic edifices seems to be either through increased height and slope, making them the highest and steepest edifices (i.e., M02), or an enlarged volume and length, where they become the most elongated edifices (i.e., M40) (Figure 5F,G).
4.3. Geomorphometric Observations on the Morphological Types
A comparison of the variables indicates a clear separation between the five morphostructural types. However, there are certain overlaps in MTs and a diffuse spread, together with gaps in the distribution and mismatches in the different type of edifices. In other words, some edifices classified as domes have H/MBax and slope values that are much higher than expected (i.e., M04) and some volcanoes have lower H/MBax and slopes than expected (i.e., M06, M30 and M33) (Figure 4 and Figure 5). Nevertheless, there is a striking difference between domes and volcanoes of increasing size (BA, V and MBax), decreasing slope and aspect, (S, H/MBax) and complexity (EI, II and summit shape (SV, F).
The five types of edifice morphometry are illustrated in Figure 6. MT1has an H/MBax ratio of lower than 0.01 and shows the lowest slope angle of ~2.6°, as well as a high degree of flatness, from 0.1 up to 0.5 (Figure 6A,F). The typical profile shape is a small, smooth, wide dome that gently breaks the surrounding seafloor slope, with a maximum width of 6.8 km (Figure 6F). MT2 has an intermediate H/MBax ratio of 0.016 (from 0.01 to 0.027), a variable slope angle of >2.75 up to 11°, and a mean flatness of 0.25 (varying significantly from 0.15 to 0.4) (Figure 6B,F). This MT has the greatest variety, and ranges from fairly small to intermediate edifices in terms of volume (0.005 to 0.3 km3) and basal area (2 to 13 km2), according to the great variety of edifice shapes (Figure 4, Figure 5 and Figure 6). Its profile ranges from steeply domes to irregular double and crater-topped edifices. MT3 has the lowest H/MBax ratio, 0.003, together with a low slope value of ~3.5° and a low degree of flatness of 0.17 (Figure 6C,F). It is represented by a single elevation (M00), which is remarkably different from the others and should be regarded as an exception in the Subvent Area. Its profile shape is quite irregular, with a small summit area of 5 km length compared with its 25 km basal diameter (Figure 6C,F). MT4 has a variable intermediate to high H/MBax ratio (from 0.02 to 0.044) with a high slope angle of up to 15°, with flatness varying from low to intermediate, i.e., ~0.06 to 0.15 (Figure 6D,F). Some of these edifices have similar elongation azimuths, of between 22.5° and 40° and large profile shapes, up to 6 km in length (Figure 6D,F). Finally, MT5 has an H/MBax ratio of ~0.065, including a maximum value of 0.07, and shows the highest slope angle, up to 24°, and the lowest flatness value, ~0.04 (Figure 6E,F). Some of these structures have an approximately conical geometry with profile shapes of less than 5 km in length (Figure 6F).
5. Discussion
The results of this study illustrate how a morphometric sub-aerial method [35,36] can be successfully adapted to the submarine environment. This should contribute to further quantitative investigations of the various seafloor elevations. Morphometric relationships based on size, slope and shape variables distinguish volcanic edifices from hydrothermal domes for quantitative purposes. Nonetheless, quantifying the limits between edifice types is difficult due to some mismatching and overlap in form, as identified in several edifices. This morphometric analysis is also used for assessing if there are any evolutionary trends among the different types of edifices analyzed (Figure 7).
5.1. Relevance of Morphological Variables in the Geomorphometry of the Mounds
The three morphological factors are objectively related to the complex interaction between both primary constructive and secondary destructive, geological and geomorphic processes that could have occurred in these edifices [36,39]. Each morphological variable is relevant in regard to the seafloor edifice evolution, and analyzing these through PCA overcomes the problem of the subjectively selecting the variables [16,52]. This analysis reveals that there is a kinship between the geometry of these edifices and the morphological variables used to describe them.
Height and slope provide insight into how all these edifices grow vertically and could be related to gravitational processes, since gravitational force controls the instability of bottom surfaces [53]. In the case of volcanoes, height accounts for how explosive the eruptive event was [54,55] as well as the type of eruption (single point versus fissure-type of opening) [56]. Both height and slope, and the average values, have been strongly related to the evolution of edifices towards steady state or equilibrium concave-up profiles controlled by gravity-driven mass transfer [39]. The height/basal width ratio has also been widely used in previous studies of sub-glacial and post-glacial aerial and sub-aerial volcanic environments [56,57] as well as arc volcanoes [35], and has been considered a useful profile estimator due to the fact it correlates positively with the slope, which tends to decrease with size [39]. This relationship also is evidenced in this deep submarine environment (Figure 4C). Furthermore, this measurement contributes to better understanding the geometry and mechanics in the up-doming processes related to intrusions [40], as it is considered in theoretical and laboratory models [58].
According to these assumptions, the edifices described have experienced different growth patterns that reflect the various mechanisms causing their increased vertical growth and steepness, as domes range from heights of 10 to 90 m and volcanoes can be up to 250 m high (i.e., M42 and M02), with mean slope values varying from <11° to >11°, up to 25°. The volcanoes seem also seem to have experienced different extrusion rates, and they display both spire and multiple-peaked summits (Figure 6).
Basal area and volume provide an indicative measure of the geometry (size and shape) of the plumbing system and magmatism (eruption size) [22]. MT1, MT2 and MT3 domes are related to sill intrusion geometry, whereas MT4 and MT5 are regarded as volcanic systems. Major size differences suggest that more than one variable (e.g., magma emplacement, magma volume at depth, effusion rate, and pre-existing topography) could distinctly govern the size and shape formation of these edifices, from gentle domes to volcanic cones (Figure 6). In volcanoes, gravitational processes could mask the real eruptive volume of the edifice affected by flank instabilities (i.e., M06 and M39). This could imply that the original volumes of MT4 and MT5 edifices, preferentially affected by mass transports deposits [40,42], could be diminished.
Finally, the shape ratios of these edifices are quite diverse, as evidenced by the spread in the plan shape plot (Figure 4E). This suggests that the differing morphological evolution could be related to instability (erosion) processes. Variations in the irregularity are influenced by the local tectonic setting, as well as the thickness and cohesion of the sediment cover [36,58]. These indices do not correlate with size and aspect variables (Figure 5), although the predominant shape of both domes and volcanoes is circular, whereas elongated edifices tend to be volcanoes. Volcanic edifices with a low degree of elongation are interpreted to be central-vent controlled edifices (i.e., M02) while high EI values are related to fissure-controlled edifices (i.e., M40), as suggested in previous morphometric studies of volcanoes [39]. According to [59], discontinuous eruptive events may be related to multiple point sources and be suitable models for larger, elongated edifices, as observed in MT4 (i.e., M40).
5.2. Morphometry of the Domes
As expected, the clearest difference between edifice types is that domes are generally lower and smoother than volcanic edifices, with lower H/MBax ratios and slopes, high degree of flatness (Figure 5 and Figure 6). The H/MBax distributions in domes are positively more uniform (around 40 m high in height and 3.5 km in length) than in volcanic edifices. They increase in gradient toward the base (MBax up to 90 times their heights, therefore having a ratio of 1:90). This implies that domes primarily grow by increasing their diameters and not significantly altering their height. In turn, domes exhibit no trend in flatness with respect to doming size, suggesting that doming processes and the basal diameters of the resulting seafloor domes do not have a linear relationship. Domes span a wide range of sizes and shapes, and this heterogeneity complicates size parameterization in other small seafloor morphologies such as pockmarks [17,60].
Small domes (i.e., M35 in MT1) that do not exceed 30 m in height, are quite circular (mean II ~1.33) with an elongation of up to 1.5 (Figure 4E). However, intermediate and larger sized domes (up to 90 m high) (i.e., M37 and M21 in MT2) domes are steeper and have a lower degree of flatness than the former, yet are quite irregularly shaped (mean value of II and EI greater than 1.5). Therefore, a 1.5 EI value seems to be a threshold in differentiating dome type, while II values do not appear to be diagnostic variables for domes (Figure 4 and Figure 5). Domes such as M14 and M15 show the greatest elongations (up to 2.6) related to the occurrence of two merged domes and mass transport deposits extending westwards [42]. This EI range (1.5 to 2.6) could be considered a threshold value for detecting merging in domes.
The primary circular structure of larger domes could have been modified by the formation of major collapse/deformation features, erosion, and mass wasting processes [46]. It has been observed that domes need to reach a height up to 60 m high and mean slope of at least 6.5° before being possibly affected by sector collapses [42] (i.e., M04 and M13). In this way, M10 is regarded as a transitional edifice between the two types of domed edifices (MT1 and MT2) with threshold morphometric characteristics of 60 m height, 6.5° of slope, and 0.08 km3 of volume, and around 1.35 for plan shape (Figure 6). This morphometric factor may be an indicator representing the morphologic trigger of possible lateral instabilities in domes in the Subvent Area. These results demonstrate that most of the domes share a common profile and size, regardless of their more or less complex basal shape, and indicate that their formation has common controls. Nevertheless, two types of domes are present, with morphometric distinctions seeming to occur from heights of 60 m.
The flat or unrecognizable summits of domes must be related to constructional processes (i.e., folding and faulting). Hydrothermal domes are often small structures but their heterogeneity depends on the distinct geometry and size of the intrusions at depth (i.e., inclined or saucer-shaped sills) [41,58] that cause the different uplifting, forced folding, and faulting of the overburden. Intermediate to larger domes manifest boundary faults vertically linked to the tips of the underlying sills that induce hot fluid flow transport to surficial units, as in the case of M12, M13 and M14 (MT2) [41]. Differences in doming linked to faulting have played a key role in dome formation: faulting during magmatic intrusions is likely to be an important process in the northeastern part of the Subvent Area (Figure 1B), where larger domes are ubiquitously distributed, whereas in the central and southern parts peripheral domes are scattered and show lower and more irregular shapes. One of these peripheral domes is M04, which does not match in the existing morphometric dome variability, reaching up to 100 m in height and having a slope of 11.6° (Figure 4 and Figure 5). This exception reflects drawbacks in dome morphometrics, likely related to incompleteness of the delimitation of summit and basal contours due to the presence of two larger collapse depressions at the base that could have altered its real shape.
The above observations agree well with the models proposed by [58] in laboratory experiments. These authors associated gradual slope (up to 4.5°) and H/MBax ratio (<0.03) to variations in seafloor (surface) deformation linked to both types of sheet intrusions and cohesion of the overburden. In this sense, it can be assumed that the aspect H/MBax ratio is a good estimator of the shapes of the intrusions, generating similar morphometric trends in the two types of domes in the Subvent Area (MT1 and MT2) related to saucer-shaped sill intrusions [41].
5.3. Morphometry of the Volcanoes
In contrast to domes, volcanic edifices have varied summit morphologies and dimensions, including single and multi-peaked as well as spire mounds and summit craters [40,42]. Summits may reflect the width of the conduit(s) feeding the volcano [61] yielding either a near-flat surface if lava has cooled at the top (i.e., M31 and M32), a spire cone (i.e., M02 and M03), multi-peaked edifices if the edifice continues growing to a critical height when it starts building outwards (i.e., M06, M30, M39 and M40), or a summit crater if there is drain-back of the lava occurs (i.e., M16). The profile of these volcanoes also varies widely, from smooth shapes (i.e., M16) to more complex geometries (i.e., M39) (Figure 6), mostly with sharp slopes.
The height of the volcanic mounds increases with decreasing or holding diameters, presenting shapes similar to seamounts. Their height and MBax profile distributions are lower than in domes and quite variable, with mean values of around 140 m height and 3.5 km length (MBax about 25 times the height, thus 1:25), which normally increase in gradient toward the summit (Figure 4, Figure 5 and Figure 6). Previous studies have determined similar aspect ratios for intraplate seamounts, such as 1:6 [46]; higher, 1:10 to 1:15 [62], for Indian seamounts; and 1:8 being observed in Pacific Seamounts [63]. Flatness does not have a positive relationship with respect to eruption size (volume), suggesting that the height of the edifices follows a variable and unremarkable relationship with formation type (central or fissure controlled) [46], basal shape, and eruptive size of the volcanic edifices [22] (Figure 7). The volumes of the seafloor volcanic structures suggest a predominance of central vent formation (3.1 km3) compared to the fissure ridges (2.8 km3). However, this takes into account neither secondary mass transport deposits (MTD) dropping down the slopes nor the material intruded at depth.
Nonetheless, two different trends can be observed in this relationship: firstly, most of the MT5 edifices increase positively towards the summit (from 190 to 250 m high, holding diameters of around 3.3 km wide) (i.e., 1:15) while MT4 edifices, although being high (up to 200 m high), are also more elongated (1:32), usually following a NE trend, and they consequently have an increase volume (Figure 5, Figure 6 and Figure 7). This fact implies that volcanoes grow primarily by increasing their heights, probably connected to a central-controlled source, and later they also start to grow also laterally, in relation to multiple-point sources. This suggests a different style of volcanic growth [64]. In this sense, volcanoes grow vertically up to a critical height, becoming unstable with respect to their base, and secondary destructive processes may affect the edifice geometry. Instability processes play an important role in shaping the seafloor, and calculating the dimensions of submarine volcanoes is essential for understanding their consequent morphological changes [44].
At lower to intermediate sizes (from 75 to 150 m high, 11° of mean slope, and volumes of greater than 0.20 km3 up to 0.60 km3), volcanoes tend to be either complex-massif elongated edifices or irregularly circular volcanoes (i.e., M30 and M31 in MT4) with II values ~1.4 and EI up to 2. The smallest volcano is at least 75 m high, with this height value being regarded as a lower threshold in volcano growth in the Subvent Area. The morphometry of some of the small volcanoes (M06, M30 and M33) is similar to that of domes in terms of height, slope, and volume [42], but clearly differs in complexity, with 1.8 being the threshold value in volcanoes (Figure 4E). In this sense, basal shape descriptors are regarded as key contributors to distinguish edifice type. Mid-sized volcanoes that continue growing up to 200 m in height, maintaining their plan shape as elongated ridge volcanoes (II and EI further than 1.8 and 2.6, respectively), evolve towards more complex shapes (i.e., M39 and M40 in MT4 and MT5). This suggests a migration in the location of the volcanic vent and a sort of linear fissure, from single to multiple conduits [38,53], as observed in the neighboring seamounts of Drago and The Paps, in the Canary Islands Volcanic Province [44]. Multipeak elongated edifices, such as M06, M30, M39 and M40, seem to grow from independent branches of the main eruptive conduit, channelizing multiple but small paths towards the seafloor, so their summits do not reach to similar heights.
At larger sizes (up to 250 m in height, 24° of slope, and 0.3 km3), volcanoes tend to have the smallest flatness values and therefore more pointed top(s) (highest H/MBax ratios) (i.e., M02 in MT5), suggesting this shape becomes preferential as edification progresses, regardless of origin [63]. In addition, it seems that the tallest and most conical mounds (MT5) do not require a larger base for support, as they are formed by intermediate and lower volcanoes, with irregularly circular and elongated shapes (MT4). Hence, the height and summit radius ratio shows little correlation, also finds in H/MBax ratio, the biggest one (up to 0.07, thus around 1:15 for M02 and M03).
The complex shapes of these volcanic edifices could also be the result of later modifications related to flank instabilities together with MTD processes (i.e., M30 and M40) [42] that typically affect seamounts morphology (e.g., [44,65,66]) and which are widely recorded in complex-shaped edifices in the Atlantic Ocean [24]. Favored by the steep slopes (Figure 4C), erosion participates in the dismantling of these elongated volcanoes (Figure 6 and Figure 7). An EI threshold of greater than 1.8 is used to distinguish fissure-controlled volcanic edifices from other types of eruptive edifices (Figure 4E). This limit is very similar to that proposed by [38] to differentiate tindars from the other three types of glacio-volcanic edifices.
The volcanoes of the Subvent Area are related to both buried oceanic basement highs (i.e., M32 and M33) and a deep Quaternary volcanic hydrothermal system related to an intraplate hotspot (M01, M02 and M03) [41]. The increase in size and shape of these volcanoes is favored by repeated magmatic extrusions along the summit that would work as a siphon conduit, as observed in other seamounts affected by hydrothermal circulation through ridge flanks [67]. In this way, M02 and M03 may represent faster or higher extrusion events than MT4 volcanoes, meaning a significant variation in height, summit morphology (FL and SV values), and others morphological features, such as hydrothermal rings [41,42], where height and slope gaps point to a distinct mode of origin (Figure 6 and Figure 7).
5.4. A Morphometric Evolution Model for the Seafloor Edifices
The wide spectrum of profile and plan shapes and sizes seems to represent specific and recognizable different growth trends. Previous studies have suggested a striking, positive relationship in their morphological, generalized evolutionary model of arc volcanoes shapes [35]. These authors related the Pressure balance (P* = PM/PL; the balance between magma (or forced folds) pressure (PM) or (PF), in volcanoes or domes, respectively and lithostatic pressure (PL)), and the Resistance balance (R* = RE/RC; established among conduit resistance (RC) and edifice resistance (RE)), with the size and shape complexity of the edifices [35]. Pressure factors are commonly used to explain maximum edifice heights while resistance factors depend on the predominant edifice material and the degree of faulting, which are related to structural conditions [35], especially in volcanoes. These relationships have been applied in other vulcanology studies (e.g., [54,68]), and are here used to assess the different morphometric trends in volcanoes and hydrothermal domes that depend on the predominant genetic processes and which may be controlled by the pressure and resistance balances (P* and R*) (Figure 7).
From the smallest morphometries represented by MT1 domes (i.e., <0.004 km3 and 10 m height, thus M42) the most recognizable trends are: (1) the smallest irregularly circular domes (MT1) maintain their height but not their volume, suggesting low PF that is possibly enabled by the high RE attributed to wider domes (i.e., M41 in MT1); and (2) the near circular domes increase in height and volume becoming larger domes (MT2), suggesting high PF maintaining a high pressure balance and continued upward grow (i.e., M22) (Figure 7A). It also suggests that a low RE could be attributed to the bending of the sedimentary units [42]. The threshold limits for this change are 60 m in height and a 6.5° of slope (i.e., M10). This evolution both in height and volume is continuous until a height of 100 m high and slopes of 10° of slope is reached (i.e., M04 in MT2) (Figure 7A). This coincides with an interval of abundant mounds where both the domes and volcanoes overlap and there are still morphometric mismatches between edifices (M04, M06, M30 and M33), which can be differentiated by their shape complexities (M04 has lower II-EI ratios). Pressure balance (P*) and conduit resistance (RC) in these domes seem to be high enough, possibly related to a combination of PM and PF in sub-shallow depths [35]. At this morphometric point (domes of more than 60 m in height, 10° of slope, and II and EI higher than 1.5) (i.e., M04 and M13), the domes are characterized by irregular basal perimeters related to the shape of the intrusive systems [41] (doming and faulting) and the MTD processes [42] (Figure 7B).
The evolutionary trend of domes is therefore characterized by significant volume increases with minor height increments, enlargement of the basal and summit area (Sa/Ba increases) and low complexity growth (Figure 7B). There is the suggestion of possible evolution from dome to a bulge (MT3) (Figure 7A). It would maintain a height of 77 m. This type of seafloor edifice is related to intrusive systems and major tectonic structures, such as basement highs [41], is here considered an outlier with a unique morphometry [40].
There is a morphometric evolution from mid-sized, irregularly sub-conical volcanoes towards both elongated and conical volcanic edifices, through either preferentially increased volume (MT4) or height (MT5), respectively. This may reflect a critical height range, where two distinct evolutionary paths are possible; irregular sub-cones either continue growing upwards and become large cones (MT5), or grow sideways and become large massif edifices (MT4), resulting in a scarcity of cones in this height range (150–240 m high) (Profile Shape gap) (Figure 7A). The change in eruptive characteristics and features, and consequently volcanic edifice size (Figure 7B), supports an evolution towards these complex shapes with large, high summit areas. MT4 volcanoes may have more than one main vent, thus P* and R* are lower, and evolve from initially smaller, sub-conical volcanoes by vent-up migration. These volcanoes usually have a smooth conical profile in the mBax direction but another that is multi-peaked in the MBax direction (Figure 6 and Figure 7B), as also observed in the morphometric evolutionary trends of American arc volcanoes [35].
Elongated massif volcanoes are characterized by volume increases with minor height increases (H/MBax is similar or slightly decreased compared to circular volcanoes, from 1:32 to 1:50); there is enlargement of the basal and summit areas (Sa/Ba increases), and major growth complexity (II and EI increase). Once these mid-sized massif volcanic edifices have formed, they can continue growing, becoming the largest and most elongated volcanic edifices with increasing complexity (e.g., M39 and M40). Even so, the largest elongated massif volcanoes may also have evolved from larger conical MT5 volcanoes, producing a massif trend reaching the threshold of 200 m in height and a volume of 0.7 km3 (Figure 7B). In this sense, the high PM and subsequent P* in these edifices seem to be related to shallow magma reservoirs where low RE or high RC promote multiple new volcanic vent sites as suggested by [35].
Occasionally, sub-conical shapes evolve greater heights, and another height gap is observed where the volume is maintained (up to a height of 243 m high and a volume of 0.3 km3) (i.e., M02 and M03 in MT5, Figure 6 and Figure 7). This gap in the morphometric trend of the volcanic cones could reflect a critical height from which a second process may take over, allowing the top of the cones to continue growing; it is possible that this process is linked to hydrothermal circulation after the eruption. This evolutionary trend of cones is characterized by height increases with a conserved volume (H/MBax is greatly increased from 1:32 to 1:15); there is decreased conicality of the summit area (Sa/Ba), and reduced complexity (the lowest II and EI), suggesting a predominantly centrally controlled activity. Once these largest edifices are formed, they can continue growing toward the summit, either increasing the H/MBax ratio and reaching typical seamount ratios (around 1:6) [46,62], or the very large elongated volcanic edifices could develop increasing complexity, becoming even larger than M39 and M40 (Figure 7B). Eventually, the P* in these edifices is expected to be the highest, with open magmatic fluid-filled conduits, meaning they are dominated by hydrothermal migration. The cone height gap may be the point where P* and R* reduce to a critical threshold [35].
Finally, it is important to mention the influence of flank instabilities on these evolutionary trends. Elongated volcanoes are most prone to flank collapses and these rapidly reduce the height and regularity of the structures (e.g., M39 and M40). On the other hand, sub-conical and higher cones (e.g., M02) tend to maintain their conical shape after suffering these erosive processes, although they may become shorter and wider [69].
6. Conclusions and Outlook
The application of a GIS-based method for delimiting sub-aerial edifice boundaries and automatically extracting the morphometry has proven to be effective regardless of edifice type or origin. Correlation and principal component analyses have enabled the identification of ten main variables (accounting for 84% of the total variance) that define edifice profile shape, basal size and basal shape, including flatness, elongation and irregularity. Several threshold limits aid in the identification of domes and volcanoes in the complex Subvent Area. Evolutionary trends between contrasting morphologies are proposed in a new scheme using the concepts of size and shape complexity. We have found that these evolutionary trends can be characterized, for volume and height increases, into two distinct pathways; volcanoes mainly grow upward and become large cones, while domes preferentially increase in volume, enlarging their basal area.
The evolutionary model presented may have implications for other works that rely on the understanding volcanoes and other seafloor edifices through the analysis of bathymetric datasets acquired at this spatial resolutions or great depths. Our morphometric model links morphological trends to tectonic and magmatic (intrusive and extrusive) phenomena, thus providing a framework for future marine morphometric studies integrating geophysical and geochemical data.
Acknowledgments
This work is a contribution to SUBVENT (CGL2012-39524-C02-01), EXPLOSEA (CTM2016-75947-R) and EXARCAN (CTM2010-09496-E) projects (Spanish MINECO) and the Marine and Coastal Geophysical and Geology PAIDI Group (RNM328). Olga Sánchez Guillamón is benefited by a MINECO doctoral grant (BES-867 2013-062657). We thank the crews as well as the technical staff of the UTM and the scientific party of SUBVENT and EXARCAN projects. Thanks are extended to the two anonymous reviewers and academic editors who have provide very helpful and constructive comments that greatly helped to improve the manuscript.
Author Contributions
Olga Sánchez Guillamón and Luis Miguel Fernández Salas conceived the idea of the study and wrote the paper. Juan Tomás Vázquez was the main researcher of the SUBVENT project and Luis Somoza was the main researcher of the EXARCAN project and the coordinator of the work for the Submission of Data and Information on the Limits of the Continental Shelf of Spain to the West of the Canary Islands. Desiree Palomino and Ricardo León were responsible of the bathymetric data processing. Olga Sánchez Guillamón, Juan Tomás Vazquez and Luis Miguel Fernández-Salas interpreted the bathymetric data to carry out the morphometric analyses. Nieves Lopez-Gonzalez performed and interpreted the statistical analyses. Ricardo León, Teresa Medialdea and Luis Somoza had substantively revised the final manuscript. All authors provided guidance for the analysis and assist with the realization of the figures. They all also have collaborated in the data acquisition during the oceanographic cruises.
Conflicts of Interest
All authors have approved the manuscript and they agree with submission to the Special issue in “Marine Geomorphometry” in Geosciences journal. There are no conflicts of interest to declare among authors. The founding sponsors had no role in the design of the study; in the collection, analyses, or interpretation of data; in the writing of the manuscript, and in the decision to publish the results.
References
- Pike, R.J. Geomorphometry—Diversity in quantitative surface analysis. Prog. Phys. Geogr. 2000, 24, 1–20. [Google Scholar]
- Krause, D.C.; Menard, H.W. Depth distribution and bathymetric classification of some seafloor profiles. Mar. Geol. 1965, 3, 169–193. [Google Scholar] [CrossRef]
- Lecours, V.; Dolan, M.F.J.; Micallef, A.; Lucieer, V.L. A review of marine geomorphometry, the quantitative study of the seafloor. Hydrol. Earth Syst. Sci. 2016, 20, 3207–3244. [Google Scholar] [CrossRef]
- Fox, C.G.; Hayes, D.E. Quantitative methods for analyzing the roughness of the seafloor. Rev. Geophys. 1985, 23, 1–48. [Google Scholar] [CrossRef]
- Gorini, M.A.V. Physiographic classification of the ocean floor: A multiscale geomorphometric approach. In Proceedings of the geomorphometry, Zurich, Switzerland, 31 August–2 September 2009. [Google Scholar]
- Harris, P.T.; Macmillan-Lawler, M.; Rupp, J.; Baker, E.K. Geomorphology of the oceans. Mar. Geol. 2014, 352, 4–24. [Google Scholar] [CrossRef]
- Wilson, M.F.J.; O’Connell, B.; Brown, C.; Guinan, J.C.; Grehan, A.J. Multiscale Terrain Analysis of Multibeam Bathymetry Data for Habitat Mapping on the Continental Slope. Mar. Geodesy 2007, 30, 3–35. [Google Scholar] [CrossRef]
- Micallef, A.; Berndt, C.; Masson, D.G.; Stow, D.A.V. A technique for the morphological characterization of submarine landscapes as exemplified by debris flows of the Storegga Slide. J. Geophys. Res. 2007, 112, F02001. [Google Scholar] [CrossRef]
- Orpin, A.R.; Kostylev, V.E. Towards a statistically valid method of textural sea floor characterization of benthic habitat. Mar. Geol. 2006, 225, 209–222. [Google Scholar] [CrossRef]
- Lucieer, V.; Lucieer, A. Fuzzy clustering for seafloor classification. Mar. Geol. 2009, 264, 230–241. [Google Scholar] [CrossRef]
- Sandwell, D.T.; Gille, S.T.; Smith, W.H.F. Bathymetry from Space: Oceanography, Geophysics, and Climate; Geoscience Professional Service: Bethesda, MD, USA, 2002. [Google Scholar]
- Gille, S.T.; Metzger, E.J.; Tokmakian, R. Seafloor topography and ocean circulation. Oceanography 2004, 17, 47–54. [Google Scholar] [CrossRef]
- Micallef, A.; Le Bas, T.P.; Huvenne, V.A.I.; Blondel, P.; Hühnerbach, V.; Deidun, A. A multi-method approach for benthic habitat mapping of shallow coastal areas with high resolution multibeam data. Cont. Shelf Res. 2012, 39, 14–26. [Google Scholar] [CrossRef]
- Rovere, M.; Gamberi, F.; Mercorella, A.; Leidi, E. Geomorphometry of a submarine mass-transport complex and relationships with active faults in a rapidly uplifting margin (Gioia Basin, NE Sicily margin). Mar. Geol. 2014, 356, 31–43. [Google Scholar] [CrossRef]
- Porter-Smith, R.; Lyne, V.D.; Kloser, R.J.; Lucieer, V.L. Catchment-based classification of Australia’s continental slope canyons. Mar. Geol. 2012, 303, 183–192. [Google Scholar] [CrossRef]
- Ismail, K.; Huvenne, V.A.I.; Masson, D.G. Objective automated classification technique for marine landscape mapping in submarine canyons. Mar. Geol. 2015, 362, 17–32. [Google Scholar] [CrossRef]
- Andrews, B.D.; Brothers, L.L.; Barnhardt, W.A. Automated feature extraction and spatial organization of seafloor pockmark, Belfast Bay, ME, USA. Geomorphology 2010, 124, 55–64. [Google Scholar] [CrossRef]
- Harrison, R.; Bellec, V.K.; Mann, D.; Wang, W. A new approach to the automated mapping of pockmarks in multi-beam bathymetry. IEEE Image Proc. 2011, 18, 2777–2780. [Google Scholar]
- León, R.; Somoza, L.; Medialdea, T.; González, F.J.; Giménez-Moreno, C.J.; Pérez-López, R. Pockmarks on either side of the Strait of Gibraltar: Formation from overpressured shallow contourite gas reservoirs and internal wave action during the last glacial sea—Level lowstand? Geo-Mar. Lett. 2014, 34, 131–151. [Google Scholar] [CrossRef]
- Mitchell, N.C. Susceptibility of mid-ocean ridge volcanic islands and seamounts to large-scale landsliding. J. Geophys. Res. 2003, 108, 2397–2419. [Google Scholar] [CrossRef]
- Passaro, S.; Milano, G.; D’Istanto, C.; Ruggieri, S.; Tonielli, R.; Bruno, P.P.; Sprovieri, M.; Marsella, E. DTM-based morphometry of the Palinuro seamount (Eastern Tyrrhenian Sea): Geomorphological and volcanological implications. Geomorphology 2010, 115, 129–140. [Google Scholar] [CrossRef]
- Wormald, S.C.; Wright, I.C.; Bull, J.M.; Lamarche, G.; Sanderson, D.J. Morphometric analysis of the submarine arc volcano Monowai (Tofua-Kermadec Arc) to decipher tectono-magmatic interactions. J. Volcanol. Geotherm. Res. 2012, 239, 69–82. [Google Scholar] [CrossRef]
- Caress, D.W.; Clague, D.A.; Paduan, J.B.; Martin, J.F.; Dreyer, B.M.; Chadwick, W.W.; Denny, A.; Kelley, D.S. Repeat bathymetric surveys at 1-metre resolution of lava flows erupted at Axial Seamount in April 2011. Nat. Geosci. 2012, 5, 483–488. [Google Scholar] [CrossRef]
- Mitchell, N.C.; Tivey, M.A.; Gente, P. Seafloor slopes at mid ocean ridges from submersible observations and implications for interpreting geology from seafloor topography. Earth Planet. Sci. Lett. 2000, 183, 543–555. [Google Scholar] [CrossRef]
- Mitchell, N.C.; Livermore, R.A. Speiss Ridge: An axial high on the slow-spreading Southwest Indian Ridge. J. Geophys. Res. 1998, 103, 15457–15471. [Google Scholar] [CrossRef]
- Head, J.W.; Wilson, L.; Smith, D.K. Mid-ocean ridge eruptive vent morphology and substructure: Evidence for the dike widths, eruption rates, and axial volcanic ridges. J. Geophys. Res. 1996, 101, 28265–28280. [Google Scholar] [CrossRef]
- Stretch, R.C.; Mitchell, N.C.; Portaro, R.A. A morphometric analysis of the submarine volcanic ridge south-east of Pico Island, Azores. J. Volcanol. Geotherm. Res. 2006, 156, 35–54. [Google Scholar] [CrossRef]
- Macdonald, G.A. Volcanoes; Prentice-Hall: Upper Saddle River, NJ, USA, 1972; p. 510. [Google Scholar]
- Francis, P.W. Volcanoes. A planetary Perspective; Oxford University Press: Oxford, UK, 1993; p. 443. [Google Scholar]
- Rowden, A.A.; Clark, M.R.; Wright, I.C. Physical characterization and a biologically focused classification of “seamounts” in the New Zealand region. N. Z. J. Mar. Freshw. Res. 2005, 39, 1039–1059. [Google Scholar] [CrossRef]
- Clark, M.R.; Watling, L.; Rowden, A.A.; Guinotte, J.M.; Smith, C.R. A global seamount classification to aid the scientific design of marine protected area networks. Ocean Coast Manag. 2011, 54, 19–36. [Google Scholar] [CrossRef]
- Florinsky, I.V. Digital Terrain Analysis in Soil Science and Geology; Elsevier: London, UK, 2012; pp. 7–30. [Google Scholar]
- Camiz, S.; Poscolieri, M.; Roverato, M. Geomorphometric comparative analysis of Latin-American volcanoes. J. S. Am. Earth Sci. 2017, 76, 47–62. [Google Scholar] [CrossRef]
- Favalli, M.; Fornaciai, A. Visualization and comparison of DEM-derived parameters. Application to volcanic areas. Geomorphology 2017, 290, 69–84. [Google Scholar] [CrossRef]
- Grosse, P.; van Wyk de Vries, B.; Petrinovic, I.A.; Euillades, P.A.; Alvarado, G. Morphometry and evolution of arc volcanoes. Geology 2009, 37, 651–654. [Google Scholar] [CrossRef]
- Grosse, P.; van Wyk de Vries, B.; Euillades, P.A.; Kervyn, M.; Petrinovic, I.A. Systematic morphometric characterization of volcanic edifices using digital elevation models. Geomorphology 2012, 136, 114–131. [Google Scholar] [CrossRef]
- Di Traglia, F.; Morelli, S.; Casagli, N.; Garduño-Monroy, V. Semi-automatic delimitation of volcanic edifice boundaries: Validation and application to the cinder cones of the Tancitaro Nueva Italia region (Michoacán-Guanajuato Volcanic Field, Mexico). Geomorphology 2014, 219, 152–160. [Google Scholar] [CrossRef]
- Pedersen, G.B.M.; Grosse, P. Morphometry of subaerial shield volcanoes and glaciovolcanoes from Reykjanes Peninsula, Icealnd: Effects of eruption environment. J. Volcanol. Geotherm. Res. 2014, 282, 115–133. [Google Scholar] [CrossRef]
- Grosse, P.; Euillades, P.A.; Euillades, L.D.; de Vries, B.V.W. A global database of composite volcano morphometry. Bull. Volcanol. 2014, 76, 784. [Google Scholar] [CrossRef]
- Sanchez-Guillamón, O.; Vázquez, J.T.; Somoza, L.; Palomino, D.; Fernández-Salas, L.M.; Medialdea, T.; León, R.; López-Gonzalez, N.; y González, F.J. Morphological characteristics and superficial structure of submarine mounds in the lower slope of the Canary continental margin (W of Canary Islands). In Volumen de Comunicaciones Presentadas en el VIII Simposio Sobre el Margen Ibérico Atlántico; del Río, V.D., Barcenas, P., Fernández-Salas, L.M., López-Gonzalez, N., Palomino, D., Rueda, J., Sánchez-Guillamón, O., Vázquez, J.T., Eds.; Ediciones Sia Graf: Málaga, Spain, 2015; pp. 177–180. [Google Scholar]
- Medialdea, T.; Somoza, L.; González, F.J.; Vázquez, J.T.; de Ignacio, C.; Sumino, H.; Sánchez-Guillamón, O.; Orihashi, Y.; León, R.; Palomino, D. Evidence of a modern deep-water magmatic hydrothermal system in the Canary Basin (Eastern Central Atlantic Ocean). Geochem. Geophys. Geosyst. 2017, 18. [Google Scholar] [CrossRef]
- Sánchez-Guillamón, O.; Vázquez, J.T.; Palomino, D.; Medialdea, T.; Fernández-Salas, L.M.; León, R.; Somoza, L. Morphology and shallow structure of seafloor mounds in the Canary Basin (Central Eastern Atlantic Ocean). Geomorphology 2018. under revision. [Google Scholar]
- Ranero, C.R.; Banda, E. The crustal structure of the Canary Basin: Accretion processes 1064 at slow spreading centers. J. Geophys. Res. 1997, 102, 10185–10201. [Google Scholar] [CrossRef]
- Palomino, D.; Vázquez, J.T.; Somoza, L.; León, R.; López-González, N.; Medialdea, T.; Fernández-Salas, L.M.; González, F.J.; Rengel, J.A. Geomorphological features in the southern Canary Island Volcanic Province: The importance of volcanic processes and massive slope instabilities associated with seamounts. Geomorphology 2016, 255, 125–139. [Google Scholar] [CrossRef]
- Smith, D.K. Shape analysis of Pacific seamounts. Earth Planet. Sci. Lett. 1988, 90, 457–466. [Google Scholar] [CrossRef]
- Das, P.; Iyer, S.D.; Kodagali, V.N. Morphological characteristics and emplacement mechanism of the seamounts in the Central Indian Ocean Basin. Tectonophysics 2007, 443, 1–18. [Google Scholar] [CrossRef]
- Clague, D.A.; Moore, J.G.; Reynolds, J.R. Formation of flat topped volcanic cones in Hawaii. Bull. Volcanol. 2000, 62, 214–233. [Google Scholar] [CrossRef]
- Wood, J.D. The Geomorphological Characterisation of Digital Elevation Models. Ph.D. Thesis, University of Leicester, Leicester, UK, 1996. [Google Scholar]
- Jolliffe, I.T. Principal Component Analysis, 2nd ed.; Springer Series in Statistics: New York, NY, USA, 2002. [Google Scholar]
- Lebart, L.; Piron, M.; Morineau, A. Statistique Exploratoire Multidimensionnelle, Visualisation et Inférence en Fouille de Données; Dunod: Paris, France, 2006; 464p. [Google Scholar]
- Kabacoff, R.I. R in Action, 2nd ed.; Manning Publication: Shelter Island, NY, USA, 2013; pp. 378–380. [Google Scholar]
- Al-Hamdani, Z.; Reker, J. Towards Marine Landscapes in the Baltic Sea. BALANCE Interim Report #10. 2007. Available online: http://balance-eu.org/ (accessed on 10 November 2017).
- Pain, C.F. Size does matter: Relationships between image pixel size and landscape process scales. In MODSIM 2005 International Congress on Modelling and Simulation Modelling and Simulation Society of Australia and New Zealand; Zerger, A., Argent, R.M., Eds.; MSSANZ: Perth, Australia, 2005; pp. 1430–1436. [Google Scholar]
- Eaton, J.P.; Murata, K.J. How volcanoes grow? Science 1960, 132, 925–938. [Google Scholar] [CrossRef] [PubMed]
- Bolongaro-Crevenna, A.; Torres-Rodríguez, V.; Sorani, V.; Frame, D.; Ortiz, M.A. Geomorphometric analysis for characterizing landforms in Morelos State, Mexico. Geomorphology 2005, 67, 407–422. [Google Scholar] [CrossRef]
- Rossi, M.J. Morphology and mechanism of eruption of postglacial shields in Iceland. Bull. Volcanol. 1996, 57, 530–540. [Google Scholar] [CrossRef]
- Smellie, J.L. Quaternary volcanism: Subglacial landforms. In Encyclopedia of Quaternary Sciences; Elias, S.A., Ed.; Elsevier: Amsterdam, The Netherlands, 2007; pp. 784–798. [Google Scholar]
- Schmiedel, T.; Galland, O.; Breitkreuz, C. Dynamics of sill and laccolith emplacement in the brittle crust: Role of host rock strength and deformation mode. J. Geophys. Res. Solid Earth 2017, 122. [Google Scholar] [CrossRef]
- Smith, D.K. Comparison of the shapes and sizes of seafloor volcanoes on Earth and “pancake” domes on Venus. J. Volcanol. Geotherm. Res. 1996, 73, 47–64. [Google Scholar] [CrossRef]
- Judd, A.G.; Hovland, M. Seabed Fluid Flow: The Impact of Geology, Biology and the 1182 Marine Environment; Cambridge University Press: Cambridge, UK, 2007; 475p. [Google Scholar]
- Fornari, D.J.; Ryan, W.B.F.; Fox, P.J. The evolution of craters and calderas on young seamounts: Insights from Sea MARC I and Sea Beam sonar surveys of a small seamount group near the axis of the East Pacific Rise at ~10°N. J. Geophys. Res. 1984, 89, 11069–11083. [Google Scholar] [CrossRef]
- Mukhopadhyay, R.; Iyer, S.D.; Ghosh, A.K. The Indian Ocean nodule field: Petrotectonic evolution and ferromangenese deposits. Earth-Sci. Rev. 2002, 60, 67–130. [Google Scholar] [CrossRef]
- Smith, D.K.; Jordan, T.H. Seamount statistics in the Pacific Ocean. J. Geophys. Res. 1988, 93, 2899–2918. [Google Scholar] [CrossRef]
- Chaytor, J.D.; Keller, R.A.; Duncan, R.A.; Dziak, R.P. Seamount morphology in the Bowie and Cobb hot spot trails, Gulf of Alaska. Geochem. Geophys. Geosyst. 2007, 8, 9. [Google Scholar] [CrossRef]
- McGuire, W.J. Volcano instability: A review of contemporary themes. In Volcano Instability on the Earth 200 and Other Planets; McGuire, W.J., Jones, A.P., Neuberg, J., Eds.; Geological Society of London Special Publications: London, UK, 1996; pp. 1–23. [Google Scholar]
- Tempera, F.; Hipolito, A.; Madeira, J.; Vieira, S.; Campos, A.S.; Mitchell, N.C. Condor seamount (Azores, NE Atlantic): A morpho-tectonic interpretation. Deep-Sea Res. 2013, 98, 7–23. [Google Scholar] [CrossRef]
- Fisher, A.T.; Wheat, C.G. Seamounts as conduits for massive fluid, heat, and solute fluxes on ridge flanks. Oceanography 2010, 23, 74–87. [Google Scholar] [CrossRef]
- Davison, J.; De Silva, S. Composite volcanoes. In Encyclopedia of Volcanoes; Sigurdsson, H., Ed.; Academic Press: New York, NY, USA, 2000; pp. 663–681. [Google Scholar]
- Vezzoli, L.; Tibaldi, A.; Renzulli, A.; Menna, M.; Flude, S. Faulting-assisted lateral collapses and influence on shallow magma feeding system at Ollagüe volcano (Central Volcanic Zone, Chile-Bolivia Andes). J. Volcanol. Geotherm. Res. 2008, 171, 137–159. [Google Scholar] [CrossRef]
© 2018 by the authors. Licensee MDPI, Basel, Switzerland. This article is an open access article distributed under the terms and conditions of the Creative Commons Attribution (CC BY) license (http://creativecommons.org/licenses/by/4.0/).

