Aerosol Optical Properties of Pacaya Volcano Plume Measured with a Portable Sun-Photometer


Abstract
1. Introduction
2. Instruments and Methods
2.1. The Microtops-II “Sun Photometer”
2.2. Observations of Volcanic Plume Optical Properties with Portable Photometry
3. Campaign Conditions
4. Results and Discussion
5. Conclusions
Acknowledgments
Author Contributions
Conflicts of Interest
References
- Von Glasow, R.; Bobrowski, N.; Kern, C. The effects of volcanic eruptions on atmospheric chemistry. Chem. Geol. 2009, 263, 131–142. [Google Scholar] [CrossRef]
- Sellitto, P.; Zanetel, C.; di Sarra, A.; Salerno, G.; Tapparo, A.; Meloni, D.; Pace, G.; Caltabiano, T.; Briole, P.; Legras, B. The impact of Mount Etna sulfur emissions on the atmospheric composition and aerosol properties in the central Mediterranean: A statistical analysis over the period 2000–2013 based on observations and Lagrangian modelling. Atmos. Environ. 2017, 148, 77–88. [Google Scholar] [CrossRef]
- Gassó, S. Satellite observations of the impact of weak volcanic activity on marine clouds. J. Geophys. Res. Atmos. 2008, 113, D14S19. [Google Scholar] [CrossRef]
- Sellitto, P.; di Sarra, A.; Corradini, S.; Boichu, M.; Herbin, H.; Dubuisson, P.; Sèze, G.; Meloni, D.; Monteleone, F.; Merucci, L.; et al. Synergistic use of Lagrangian dispersion and radiative transfer modelling with satellite and surface remote sensing measurements for the investigation of volcanic plumes: the Mount Etna eruption of 25–27 October 2013. Atmos. Chem. Phys. 2016, 16, 6841–6861. [Google Scholar] [CrossRef]
- Ridley, D.A.; Solomon, S.; Barnes, J.E.; Burlakov, V.D.; Deshler, T.; Dolgii, S.I.; Herber, A.B.; Nagai, T.; Neely, R.R.; Nevzorov, A.V.; et al. Total volcanic stratospheric aerosol optical depths and implications for global climate change. Geophys. Res. Lett. 2014, 41, 7763–7769. [Google Scholar] [CrossRef]
- Sellitto, P.; Briole, P. On the radiative forcing of volcanic plumes: modelling the impact of Mount Etna in the Mediterranean. Ann. Geophys. 2015, 58. [Google Scholar] [CrossRef]
- McCormick, M.P.; Thomason, L.W.; Trepte, C.R. Atmospheric effects of the Mt Pinatubo eruption. Nature 1995, 373, 399–404. [Google Scholar] [CrossRef]
- Malavelle, F.F.; Haywood, J.M.; Jones, A.; Gettelman, A.; Clarisse, L.; Bauduin, S.; Allan, R.P.; Karset, I.H.H.; Kristjánsson, J.E.; Oreopoulos, L.; et al. Strong constraints on aerosol-cloud interactions from volcanic eruptions. Nature 2017, 546, 485–491. [Google Scholar] [CrossRef] [PubMed]
- Watson, I.M.; Oppenheimer, C. Particle size distributions of Mount Etna’s aerosol plume constrained by Sun photometry. J. Geophys. Res. Atmos. 2000, 105, 9823–9829. [Google Scholar] [CrossRef]
- Watson, I.M.; Oppenheimer, C. Photometric observations of Mt. Etna’s different aerosol plumes. Atmos. Environ. 2001, 35, 3561–3572. [Google Scholar] [CrossRef]
- Porter, J.N.; Horton, K.A.; Mouginis-Mark, P.J.; Lienert, B.; Sharma, S.K.; Lau, E.; Sutton, A.J.; Elias, T.; Oppenheimer, C. Sun photometer and lidar measurements of the plume from the Hawaii Kilauea Volcano Pu’u O’o vent: Aerosol flux and SO2 lifetime. Geophys. Res. Lett. 2002, 29, 30-1–30-4. [Google Scholar] [CrossRef]
- Martin, R.S.; Mather, T.A.; Pyle, D.M.; Power, M.; Tsanev, V.I.; Oppenheimer, C.; Allen, A.G.; Horwell, C.J.; Ward, E.P.W. Size distributions of fine silicate and other particles in Masaya’s volcanic plume. J. Geophys. Res. Atmos. 2009, 114, D09217. [Google Scholar] [CrossRef]
- Mather, T.A.; Tsanev, V.I.; Pyle, D.M.; McGonigle, A.J.S.; Oppenheimer, C.; Allen, A.G. Characterization and evolution of tropospheric plumes from Lascar and Villarrica volcanoes, Chile. J. Geophys. Res. Atmos. 2004, 109, D21303. [Google Scholar] [CrossRef]
- Sawyer, G.; Salerno, G.; Blond, J.L.; Martin, R.; Spampinato, L.; Roberts, T.; Mather, T.; Witt, M.; Tsanev, V.; Oppenheimer, C. Gas and aerosol emissions from Villarrica volcano, Chile. J. Volcanol. Geotherm. Res. 2011, 203, 62–75. [Google Scholar] [CrossRef]
- Ilyinskaya, E.; Tsanev, V.; Martin, R.; Oppenheimer, C.; Blond, J.L.; Sawyer, G.; Gudmundsson, M. Near-source observations of aerosol size distributions in the eruptive plumes from Eyjafjallajokull volcano, March-April 2010. Atmos. Environ. 2011, 45, 3210–3216. [Google Scholar] [CrossRef]
- Sellitto, P.; Salerno, G.; La Spina, A.; Caltabiano, T.; Terray, L.; Gauthier, P.J.; Briole, P. A novel methodology to determine volcanic aerosols optical properties in the UV and NIR and Ångström parameters using Sun photometry. J. Geophys. Res. Atmos. 2017, 122, 9803–9815. [Google Scholar] [CrossRef]
- Morys, M.; Mims, F.M.; Anderson, S.E. MICROTOPS II, Ozone Monitor and Sunphotometer: User’s Guide; Technical Report; Solar Light Company: Glenside, PA, USA, 2001. [Google Scholar]
- Morys, M.; Mims, F.M.; Hagerup, S.; Anderson, S.E.; Baker, A.; Kia, J.; Walkup, T. Design, calibration, and performance of MICROTOPS II handheld ozone monitor and Sun photometer. J. Geophys. Res. Atmos. 2001, 106, 14573–14582. [Google Scholar] [CrossRef]
- Porter, J.N.; Miller, M.; Pietras, C.; Motell, C. Ship-Based Sun Photometer Measurements Using Microtops Sun Photometers. J. Atmos. Ocean. Technol. 2001, 18, 765–774. [Google Scholar] [CrossRef]
- Angström, A. The parameters of atmospheric turbidity. Tellus 1964, 16, 64–75. [Google Scholar] [CrossRef]
- Kitamura, S.; Matias, O. Tephra Stratigraphic Approach to the Eruptive History of Pacaya Volcano, Guatemala; Seventh Series: Geography 45; Technical Report; Tohoku University: Sendai, Japan, 1995; pp. 1–41. [Google Scholar]
- Global Volcanism Program. Report on Pacaya (Guatemala). In Smithsonian Institution and US Geological Survey Weekly Volcanic Activity Report, 5 January–11 January 2011; Sennert, S.K., Ed.; Smithsonian Institution and US Geological Survey: Washington, WA, USA, 2011. [Google Scholar]
- Carr, M.J.; Rose, W.I., Jr.; Stoiber, R.E. Volcanism in Central America. In Orogenic Andesites and Related Rocks; Thorpe, R.S., Ed.; Wiley and Sons: New York, NY, USA, 1982; pp. 149–166. [Google Scholar]
- O’Neill, N.T.; Eck, T.F.; Smirnov, A.; Holben, B.N.; Thulasiraman, S. Spectral discrimination of coarse and fine mode optical depth. J. Geophys. Res. Atmos. 2003, 108, 4559. [Google Scholar] [CrossRef]


| Day | Type | Time Interval |
|---|---|---|
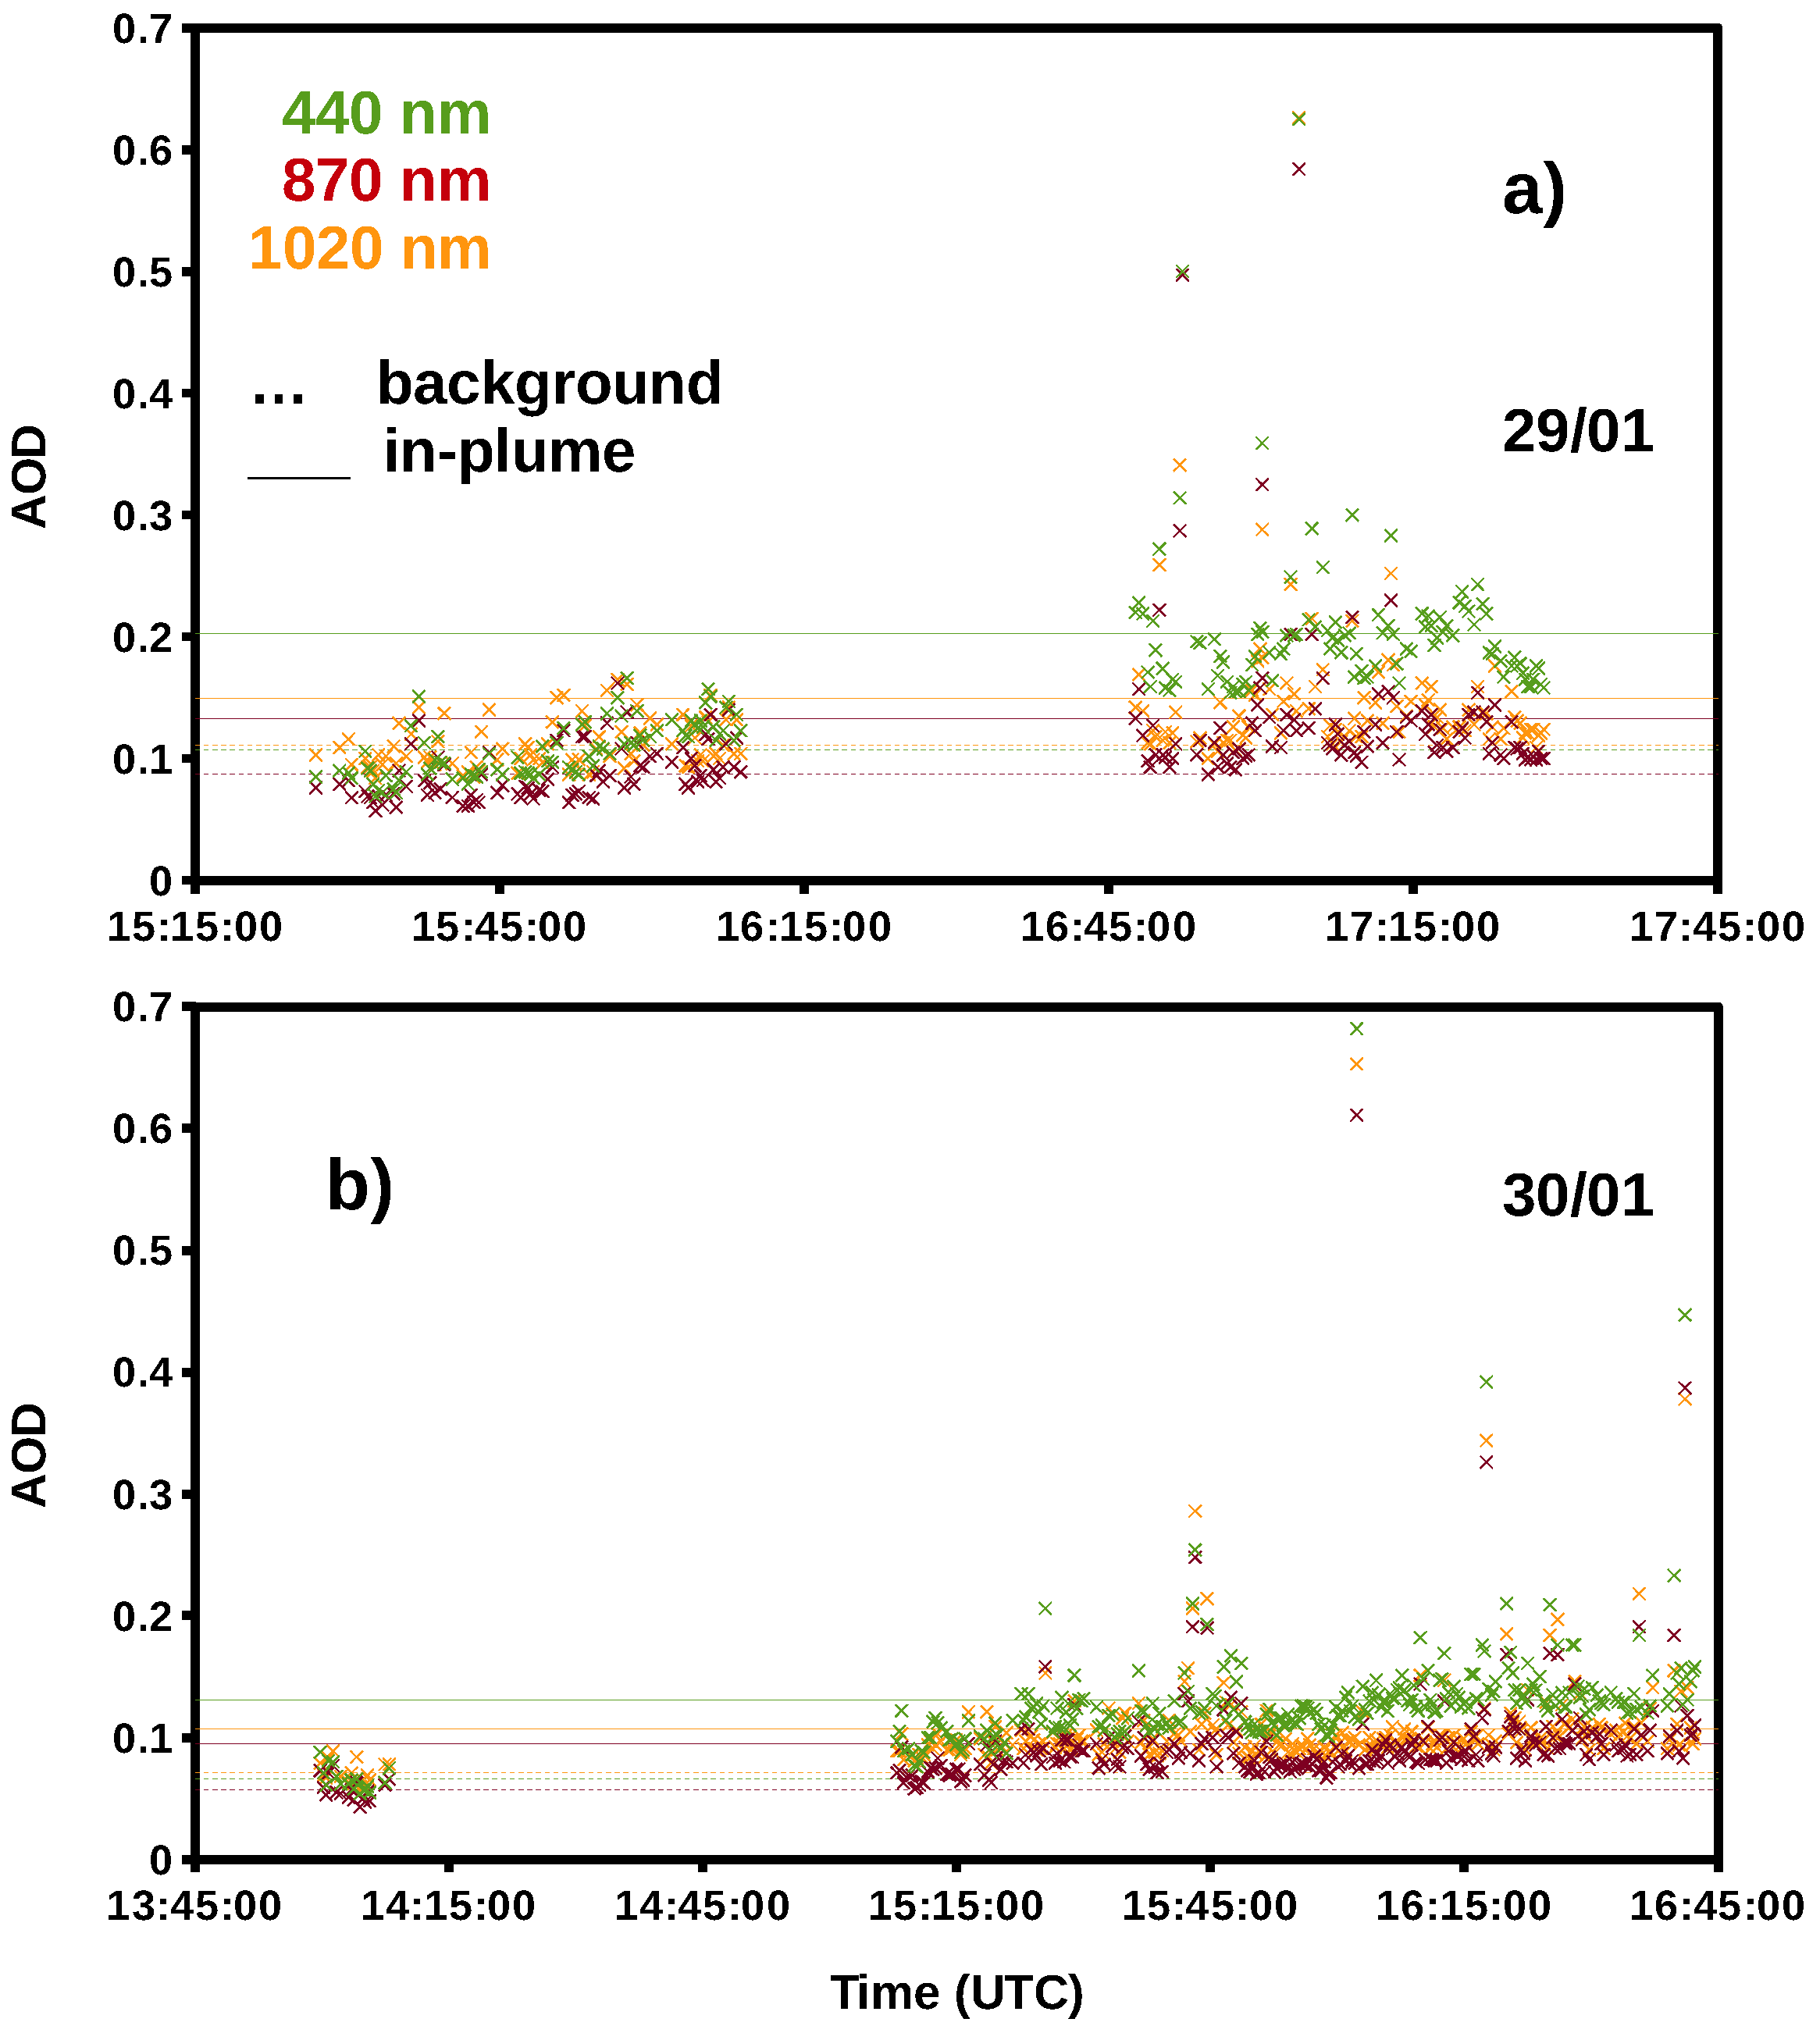
| 29 January | Background | 15:25–16:00 |
| 29 January | In-plume | 16:45–17:30 |
| 30 January | Background | 14:00–14:10 |
| 30 January | In-plume | 15:10–16:40 |
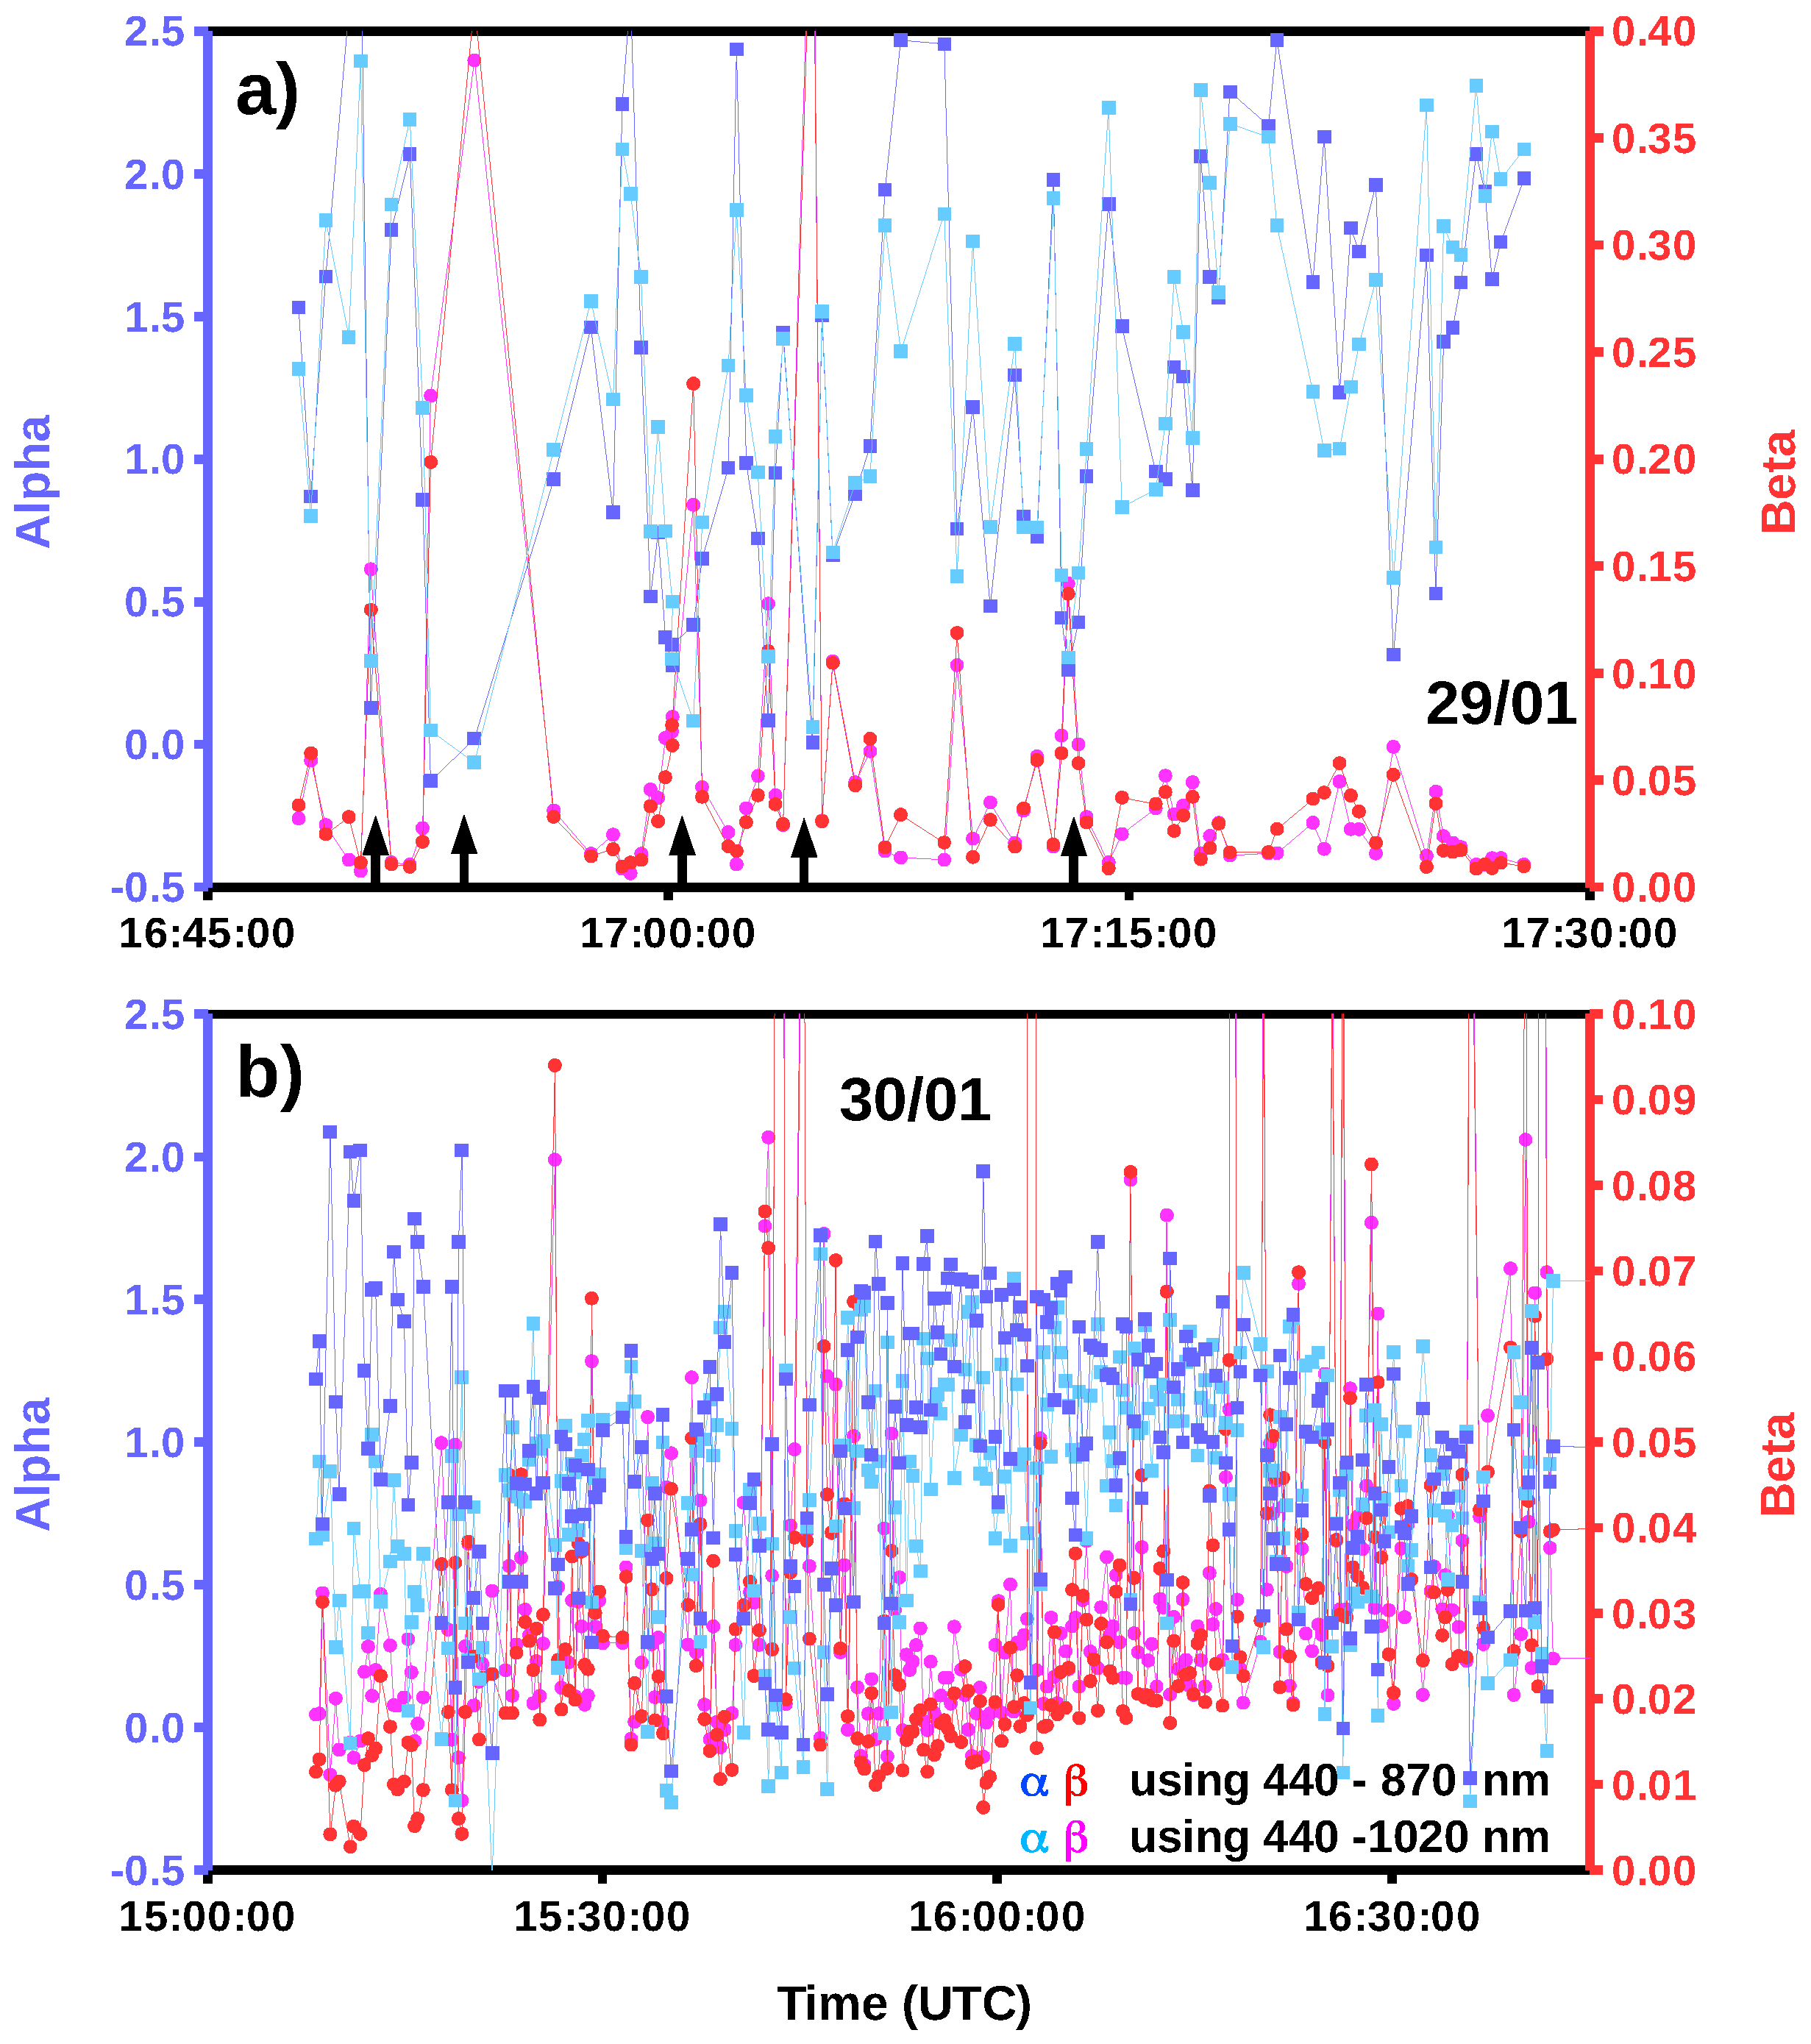
| Day | Alpha (440–1020 nm) | Alpha (440–870 nm) | Beta (440–1020 nm) | Beta (440–870 nm) |
|---|---|---|---|---|
| 29 January | ||||
| 30 January |
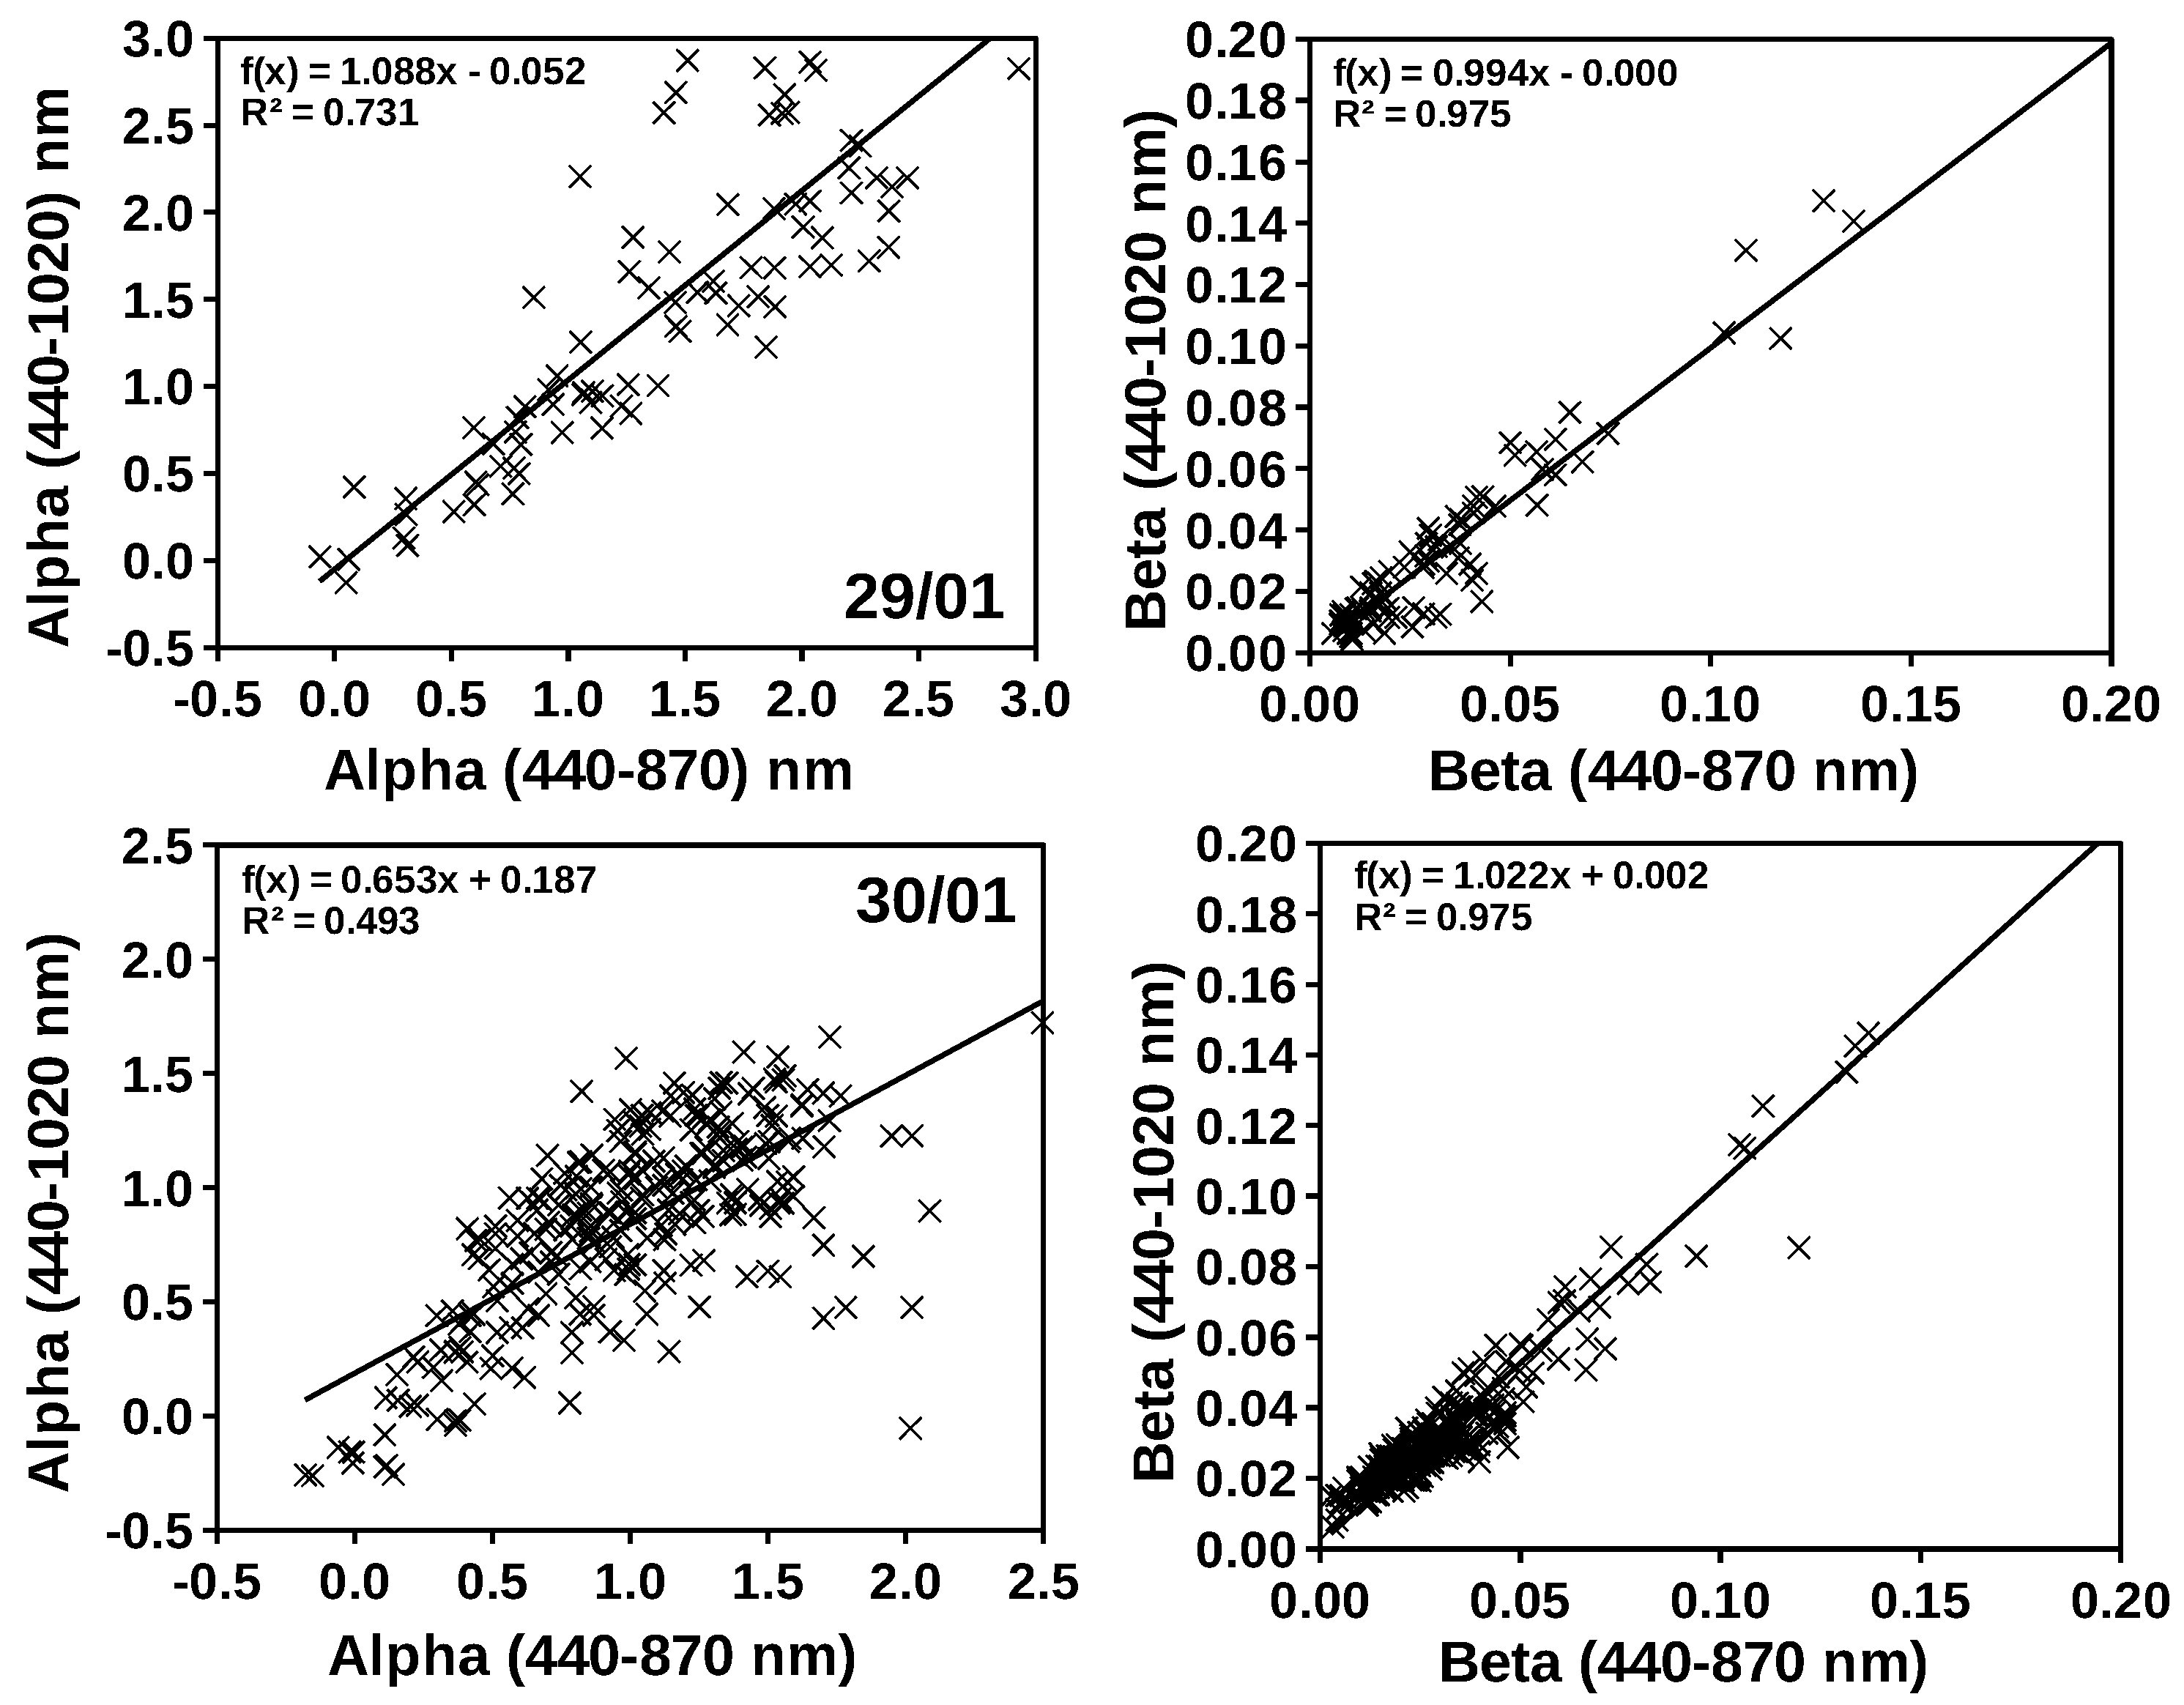
| R | RMSE | Bias | |
|---|---|---|---|
| —29 January | 0.73 | 28.2% | +14.7% |
| —30 January | 0.49 | 47.8% | −17.9% |
| —29 January | 0.97 | 25.7% | +6.9% |
| —30 January | 0.97 | 22.2% | −2.7% |
© 2018 by the authors. Licensee MDPI, Basel, Switzerland. This article is an open access article distributed under the terms and conditions of the Creative Commons Attribution (CC BY) license (http://creativecommons.org/licenses/by/4.0/).
Share and Cite
Sellitto, P.; Spampinato, L.; Salerno, G.G.; La Spina, A. Aerosol Optical Properties of Pacaya Volcano Plume Measured with a Portable Sun-Photometer. Geosciences 2018, 8, 36. https://doi.org/10.3390/geosciences8020036
Sellitto P, Spampinato L, Salerno GG, La Spina A. Aerosol Optical Properties of Pacaya Volcano Plume Measured with a Portable Sun-Photometer. Geosciences. 2018; 8(2):36. https://doi.org/10.3390/geosciences8020036
Chicago/Turabian StyleSellitto, Pasquale, Letizia Spampinato, Giuseppe G. Salerno, and Alessandro La Spina. 2018. "Aerosol Optical Properties of Pacaya Volcano Plume Measured with a Portable Sun-Photometer" Geosciences 8, no. 2: 36. https://doi.org/10.3390/geosciences8020036
APA StyleSellitto, P., Spampinato, L., Salerno, G. G., & La Spina, A. (2018). Aerosol Optical Properties of Pacaya Volcano Plume Measured with a Portable Sun-Photometer. Geosciences, 8(2), 36. https://doi.org/10.3390/geosciences8020036