Abstract
Field studies of biochar addition to soil and nutrient cycling using 15N fertilizers in temperate agriculture are scant. These data are required in order to make evidence based assessments. This study was conducted to test the hypothesis that biochar application can increase crop yields through improving the nitrogen uptake and utilization of added inorganic fertilizer, whilst sequestering significant quantities of carbon. Results showed that although biochar addition led to significant spring barley grain yield increases in the first year of biochar application, an unusually dry year; this was possibly not solely the result of improved nitrogen uptake, as total crop N was similar in both treatments. Results suggested it was improved water utilization, indicated by the crop carbon isotope values and soil moisture characteristics. In the second year, there were no significant effects of the previous year’s biochar addition on the sunflower yield, N status, fertilizer recovery or any signs of improved water utilization. These data add to a growing body of evidence, suggesting that biochar addition has only slightly positive or neutral effects on crop growth and fertilizer retention but has the potential to sequester vast amounts of carbon in the soil with minimal yield losses in temperate agriculture.
1. Introduction
Ancient Amazonian soil practices of nurturing Terra Preta through the addition of charcoal to soil and its modern equivalent, biochar production followed by soil incorporation, could provide humanity, one of many carbon farming solutions to global climate change and escalating food demand. Indeed, it has been suggested that biochar addition to soil could sequester 0.7 GtCeq yr−1 globally approximately one tenth of the annual anthropogenic fossil fuel flux [1]. However economic incentives will be required to stimulate this transformational change in farming behaviour, this could be in the form of yield increases or compensatory payments, for example, an agri-environment scheme for carbon sequestration. Despite the failures in carbon trading schemes, scholars have suggested the social cost of carbon is in the region of $100/125 t Ceq−1 and that a global carbon tax and coupled negative emission technology (NET) credit, levied at this rate could avoid catastrophic climate change [2]. Exploring the risks and potential of these scenarios requires agro-ecozone specific field data utilizing common or feasible farming practices and determining how these practices effect important aspects of crop production such as fertilizer use.
These scenarios highlight the important role soils could play in balancing global carbon exchanges. Currently, soils account for two-thirds of the terrestrial carbon pool [3] and the flux to the atmosphere from soil respiration is ten times greater than that from fossil fuel combustion [4]. Within this context, biochar addition to soils is a feasible strategy of carbon sequestration, particularly in tropical soils, where biochar has been shown to improve soil properties and increase crop yields [5,6,7,8]. Biochar additions have also been shown to reduce greenhouse gas emissions of carbon dioxide, methane and nitrous oxide (CO2, CH4 and N2O) [9,10,11,12]. It is these important agronomic properties, in addition to the potential to sequester significant amounts of carbon from centuries to millennia [13,14,15,16,17,18], that has stimulated a wealth of research into biochar. However relatively few studies have investigated the impact of biochar in temperate agronomic systems; most are focused on C cycling rather than N cycling. Moreover, very few studies have used labelled N fertilizer to investigate its agronomic fate when used in combination with biochar. The inherent fertility, neutral pH and higher organic matter contents associated with temperate soils, suggest that biochar addition would not lead to significant improvements in crop yields [5,19]. Nevertheless, given the changing political and agronomic landscape of European farming there may be opportunities for carbon-farming with associated economic gains for the farmers as discussed above.
Jeffery et al. [20] suggested that the main mechanisms for yield increase following biochar addition were the liming effects and improved water holding capacity of the soils, in addition to improved crop nutrient availability. Given this, we wanted to investigate the impacts of biochar addition on fertilizer use efficiency and related parameters such as yield, whilst also attempting to understand biochar’s impact on soil water availability to the crop, in a temperate farming system.
We set out to trace the fate of fertilizer nitrogen into the soil and crop and to determine whether the addition of significant quantities of biochar to soil had an effect on the plant fertilizer utilization. We hypothesize that biochar does not lead to the significant immobilization of essential crop nutrients. Immobilization of nutrients specifically nitrogen-N, in-part has hampered the wide spread adoption of practices such as no-till, where straw is left on the soil [21]. This is because the untimely incorporation of un-charred carbon can lead to significant immobilization of essential N for plant growth and thus depress yields, unless sufficient inorganic N is added. The reason for this is that the dominant biogeochemical processes of mineralization and nitrification are mediated by the soil microbial biomass (SMB), which requires N for metabolism, maintenance, growth and enzyme production. On addition of high carbon-C containing substrates, such as straw with a high C:N ratio ~100:1, to soil, the microbial biomass will respond to exploit the carbon input as a new energy source. This response requires N to fuel enzyme production, maintenance and growth. In order to sustain its C:N ratio, the SMB will take up available inorganic soil-N, in-turn leaving less N available for plant uptake and consequently temporarily depressing yields, as the dominant SMB constituents, fungi and bacteria have C:N ratios of 15:1 and 5:1 respectively [22].
Nitrogen immobilization is one of the main problems of nitrogen fertilizer management. The key role that inorganic fertilizer N has played in increasing crop yields, in particular of cereals, is widely recognized [23]. Nitrogen deficiency can have adverse effects on crop development and yield. Stable isotope techniques have played a major role in understanding the fate of applied N fertilizer. Soil processes are notoriously complex and interdependent; stable isotopes facilitate element tracing with minimal perturbation to the on-going agronomic operations. Stable isotope labelling (i.e., producing chemically “identical” fertilizers with different isotopic signatures) allows us to follow the fate of fertilizer nitrogen into the crop, soil, microbial biomass, water and air, giving the opportunity to trace the fate of the fertilizer and make sensible management decisions about fertilizer management [24,25]. This is of particular importance when new agricultural practices are introduced such as the application of biochar to soils, as stable isotope tracing allows us to directly follow the fate and efficiencies of the fertilizer under the new proposed practices.
Nitrogen and water are the main constraints to crop growth in agriculture [26] but it can be difficult to disentangle their impacts. The naturally occurring differences in plant carbon isotope signatures, as a result of differences in water use efficiency, can offer some insights into crop water usage. Carbon isotope signatures can reveal useful information about the water status of the crop and can assist in untangling the interactions of nutrient and water limitations on crop growth. This study offered the opportunity to investigate if the addition of Biochar with its porous structure influences the soils capacity to store water and deliver water to the crop. Carbon isotope discrimination (Δ) is linearly related to the ratio of the intercellular and atmospheric partial pressures of CO2 in the C3 plants [27]. The degree of 13C discrimination is directly proportional to the length of time the stomata are open. When open, stomata permit the escape of water (which cools the plant and facilitates the mass transfer of nutrients), ensuring free assimilation of CO2 and maximum discrimination against the heavier 13CO2. When stomata are closed the availability of CO2 is limited and plants must take what is there, so discrimination is minimum [27]. As water availability is one of the major controllers of stomatal conductance Δ¹³C serves as a proxy for water availability. Δ is the suggested convention, as the Δ values are the deviation from unity; which basically means the values take into account variation differences in atmospheric isotopic differences in 13CO2 abundance across the globe (see Equation (5)). In effect, Δ normalizes two values into one [27] and therefore makes it easier to directly compare with other results from around the world. Foliar values have been used as an integrated measure of the response of photosynthetic gas exchange to environmental variables such as water availability [28], light [29], humidity [30] and salinity [31] and have been proposed as an indicator of high water use efficiency in C3 plants (WUE -biomass production per unit water consumed or crop/drop), since a negative correlation between WUE and Δ has been reported for a number of plant species [32]. Conversely high Δ values have been associated with plant water availability in spring barley, with Δ values decreasing as water becomes limited due to stomatal closure and consequent reduction in isotope discrimination against the heavier 13CO2 [27,33,34].
We set out to test the hypothesis that biochar application can increase crop yields through improving the nitrogen uptake and utilization of added inorganic fertilizer. In addition, we investigated the effects of biochar on plant water status using carbon isotope discrimination. Field experiments were conducted in a continental Austrian climate, using local agricultural practices.
2. Materials and Methods
2.1. Experimental Design
The experiments were established to follow the fate of nitrogen fertilizer in the field, amended with biochar under common agricultural practice. This was achieved by applying stable isotope labelled nitrogen fertilizer to sub-plots of an on-going biochar field experiment [35] and harvesting and analysing the plant material obtained from the subplots, to determine the uptake of the 15N fertilizer added. We did this using elemental analysis isotope ratio mass spectrometry (EA-IRMS). The focus was on comparable rather than absolute values. The rates of Biochar application (<5% W/W based on an approximate 40 cm plough depth) were intended be high concentrations to determine measurable effects of Biochar addition and to determine maximum soil carbon addition using biochar; these rates were comparable with many pot studies of the time. The size and nature of the experiment, which was established to mimic true farmer practice, this meant that it was only feasible to use the labelled fertilizer as a top dressing, as this was a single application and not a standard mixed nutrient formulation as used in the base dressing.
2.1.1. Spring Barley Field Experiment in 2011
The field experiment was established in Traismauer, Lower Austria (48°19′52.6″ N, 15°44′20.5″ E;) in March 2011 (Figure 1). The climate is temperate and has a strong continental influence (Pannonian climate), with mean annual precipitation of 550 mm and mean annual temperature of 10 °C. The arable soil was a deep sandy-loamy-silt (18.3% sand, 57.2% silt and 24.5% clay), classified as a calcareous Chernozem on loess. Soil pH of non-biochar treated soil was 7.5 in 10 mM CaCl2, (1:2.5 soil: CaCl2, ratio) the carbonate content was 15.8% and organic matter content 2.4%. Cation exchange capacity of the soil was 22.5 cmol kg−1, dominated by Ca2+ (~90%) and Mg2+ (~7%), with a small contribution by K+ (2%), available inorganic nitrogen prior to the experiment was approximately 5 μg N g−1 soil. The site has been used for agriculture for >100 years. Hardwood-derived biochar (80% beech, rest derived from other hardwoods) was produced by pyrolysis at 550 °C for two hours and was purchased from S.C. Romchar S.R.L. (Harghita, Romania). This biochar had a pH of 8.6 in water (1:2.5 biochar:water ratio) and 7.5 in 10 mM CaCl2 (1:2.5 biochar: CaCl2, ratio) and had the following elemental concentrations: 80.3% C, 9.9% O, 0.4% N and 1.6% H. Volatiles made up 11.1% and ashes 15.2% of biochar dry mass (determined at 550 °C). The Biochar had an H/Corg ratio of 0.3 and a PAH content (∑ 16 EPA PAH) of 9 mg kg−1 [35]. Further details of the Biochar are described in Sigmund et al., 2017 [36]. Biochar was applied once to the field at a dry mass rate of 0 and 72 t ha−1 in March 2011 and incorporated to a depth of 10 cm using a rotary hoe. There were originally four treatments but only three were used for this study as the forth treatment did not involve matched inorganic-fertilizer applications. The treatments were: control, that is, NPK (no biochar application, NPK added), BCN (72 t biochar ha−1 and NPK added) and for yield and N yield comparison only BC3 (72 t biochar ha−1, no nitrogen fertilizer but 26/31 and 50/100 kg P and K ha−1 in 2011/2012 respectively). The main treatment plots were arranged according to a Latin square design and replicated four times in circular plots of 6.5 m diameter. For yield analysis, net plots of 9.6 m2 each in the centre of each gross plot were harvested. Harvest products were separated into the different components and weighed, dried and milled separately.
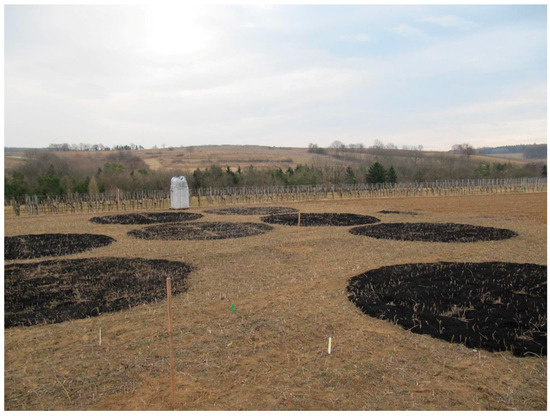
Figure 1.
Application of biochar in Traismauer, Austria.
Spring barley (Hordeum vulgare L.) was sown on the 12 April 2011. NPK fertilizer (Linzer Star N:P2O5:K2O 15:15:15) was applied as a base dressing providing an N input of 60 kg N ha−1 with a P input of 26 kg P ha−1 and K input of 50 kg K ha−1, however the nitrogen application was a split dressing with a further top dressing of nitrogen 60 kg N ha−1 in the form of nitromoncal (ammonium nitrate) applied on 10 May 2011.
On the labelled sub-plots the equivalent of 60 N kg ha−1 of 2 atom % 15N labelled ammonium nitrate (labelled on both moieties) was carefully broadcast on a 1 square meter sub-plot of the main plots, substituting the regular May top dressing of broadcast Nitromoncal (ammonium nitrate). Fertilizer was applied by marking and subdividing the sub-plot into four segments and carefully applying pre-weighed and bagged labelled fertilizer evenly across the plots by hand. Plots were marked with tags for re-identification.
At harvest, on the 21 July 2011, a 40 by 40 cm inner-square (to overcome edging effects) from the sub plot was harvested 2 cm above ground level using shears. Plants were subdivided into shoots and ears (grain), dried (60 °C), chopped and rigorously homogenized. A sub sample of each fraction was finely ground using a Retch ball mill; duplicate subsamples of each treatment were analysed.
To confirm the immobilization hypothesis a greenhouse pot experiment was set-up. Traismauer soil was excavated in 2018 and four treatments were set up with the identical biochar, with five replicates: control, that is, NPK (no biochar application, NPK added), BCN (72 t biochar ha−1, NPK added), SD120N (120 t sawdust ha−1, NPK added), SD1N (1 t sawdust ha−1, NPK added). Both treatments, BCN (80.3% C) and SD120N (48.3% C), added 58 t ha−1 C content to soil. Spring barley was sown on the 21 March 2018, nine seeds were sown in each pot and thinned to six plants after germination. As in the field trial, NPK fertilizer was applied (input of 60 kg N ha−1, 26 kg P ha−1 and 83 kg K ha−1). A top dressing of 60 kg N ha−1 of 2 atom % 15N labelled ammonium nitrate was applied to each pot on 23 April 2018. The ripe spring barley was harvested on the 4 July 2018. Plant parts were dried (50 °C) and further processed as mentioned above and analysed as mentioned below.
2.1.2. Sunflower Field Experiment in 2012
In 2012, sunflower (Helianthus annuus L.) was sown on the 20 April. A base dressing was applied providing an N input of 25 kg N ha−1 with a P input of 31 kg P ha−1 and K input of 100 kg K ha−1 on the 3 May 2012, a top dressing of Nitramoncal (ammonium nitrate) was applied at a rate of 50 kg N ha−1 to the main plot applied on the 11 June of 2012. On a different sub plot the equivalent of 50 N kg ha−1 of 2 atom % 15N labelled ammonium nitrate (labelled on both moieties) was applied in a similar manner to that described above on at sufficient distance from the 2011 subplots to avoid cross contamination. Similarly, at harvest on the 26 September 2012 a 50 by 50 cm inner-square from the sub plot was sampled 2 cm above ground level using shears, again the inner was to avoid edging effects. Plants were subdivided into stems, leaves and heads (grain); these were then prepared for isotope analysis as described above. We did not de-hull the seeds, that is, separate seeds from kernels. To calculate back to the seed value, we assumed that kernals account for ~20–30% of the total dry weight, although they only contain an average 0.64% N compared to the seeds which contain 3.3% N. Our average grain values were 2.2% N compared to 3.3% N, the average seed value suggesting a slightly higher kernel: seed ratios ~ 40:60.
Soil samples were taken from the top 10 cm of the subplot and sieved through a 2 mm sieve and dried and analysed as below.
2.2. Soil and Plant Analysis
For measurements of extractable C, fresh soil aliquots of 4 g were extracted for 30 min with 30 mL 0.5 M K2SO4, subsequently filtered through ash-free cellulose filters and extracts kept frozen at −20 °C for later analyses. Dissolved organic carbon was measured as non-purgeable organic carbon by high temperature catalytic oxidation on a Shimadzu TOC-VCPH with TNM-1 unit and ASI-V autosampler (Shimadzu Austria, Korneuburg, Austria).
Soil microbial biomass was determined from 2 g of fresh soil aliquots extracted twice on a rotary shaker for 60 min with 15 mL 0.5 M K2SO4. This slurry devoid of inorganic or soluble organic N was subsequently made up to original volume with mL 0.1 M K2SO4, where upon 0.5 mL of chloroform was added. These samples were subsequently filtered through ash-free cellulose filters. A 5 mL of sample was purged in a stream of nitrogen for 1 h to remove traces of chloroform and then dried at 40 °C, the entire dried residue was placed into a tin cup and analysed for 15N as described below.
For total N, C, 15N and 13C analysis dried ground duplicate plant, K2SO4. or soil samples were placed into 8 by 5 mm tin and analysed at SILVER (Stable Isotope Laboratory at the University of Vienna) and at the University of Natural Resources and Life Sciences (BOKU), using an isotope ratio mass spectrometer (Delta PLUS, Thermo Finnigan, Bremen Germany) interfaced with an elemental analyser (Flash EA, CE Instruments, UK) [37]. A full complement of internal and external international IAEA standards was run with the samples to calculate the isotopic ratios and % N and % C values, standard error of measurement is typically 0.2‰ for carbon and 0.2‰ for nitrogen.
Atom % 15N excess = 15N abundance − background abundance. Natural background abundance is generally accepted as 0.3663% and was used in these experiments; as the measured background values of the grain were very close to this value (0.3664). We used isotope labelled fertilizer which for simplicity assumed would have swamped the signal of any small initial natural abundance differences in soil inorganic N values [38].
Delta carbon values (δ) are defined as the isotopic ratio of a sample standardized to the isotopic ratio of the internationally defined reference Vienna Pee Dee Belemnite (VPDB):
where RS is the isotopic ratio of the sample and RR is the isotopic ratio of the reference standard. The equations used to calculate N uptake and allocations are derived from first principles and have been previously described [39]. They are presented and described here for clarification.
[(RS − RR)/RR] × 1000 = δ which can also be written as [(RS/RR) − 1] × 1000 = δ
% Nitrogen derived from fertilizer (%Ndff), that is, the percentage nitrogen in the plant has come from the labelled fertilizer application.
Ndff amount, that is, mass of nitrogen in the plant derived from the labelled fertilizer applied.
% Fertilizer use (%FU), that is, the amount of labelled fertilizer applied which ends up in the crop as a percentage of the labelled fertilizer initially applied to the crop.
% Fertilizer nitrogen allocation (%FNA), that is, mass of labelled fertilizer nitrogen allocated to the specific plant part as a percentage of the total above ground fertilizer uptake.
Carbon isotope discrimination (Δ) was calculated as:
where δa and δp are the carbon isotope delta values of source air and plant material, respectively, relative to the international standard Vienna Pee Dee Belemnite (VPDB), note δ values are usually quoted as ‰, that is, δ/1000. Carbon isotope composition of air was taken as −8.00‰ for Austria [40].
All statistical analysis was carried out using Sigma Plot 12. Systat Software Inc. (Chicago, IL, USA). All data was tested for normality and equal variance and transformed if not conforming. Initially, two-way ANOVA’s to determine influence of block effects, were run. If these were insignificant, which was true in all cases, one-way ANOVA’s were used. If only two treatments were compared paired student T-tests used to determine significant differences (p < 0.05). We strived to use the most parsimonious statistical approaches.
3. Results
We set out to investigate the effects of biochar application on crop yield and nitrogen fertilizer usage in a series of field experiments using 15N labelled fertilizers.
3.1. Results of Spring Barley Field Experiment in 2011
3.1.1. Spring Barley Nitrogen Yields Did Not Differ in Fertilized Treatments
The year 2011 was a particularly dry in Austria with a pronounced precipitation deficit 270 mm compared to the usual 550 mean annual precipitation, with only fifty percent of the long term mean (1971–2000) falling on the site [35]. Under these solely rain fed conditions yields were lower than the mean long-term averages. Grain yields as determined from the whole plot measurements and that have been previously reported, were significantly higher in the BCN treatment (6065 ± 427 kg ha−1), than in the NPK treatment (5488 ± 756 kg ha−1) and were significantly lower in the BC3 treatment (4800 ± 110 kg ha−1) than in both fertilizer treatments (p < 0.05) [35].
Yet mean total crop nitrogen yields were not significantly different between the fertilized treatments NPK and BCN (157 and 160 kg N ha−1 respectively), although when biochar was applied without fertilizer (the BC3 treatment), N yields were significantly lower (98 kg N ha−1) (Table 1).

Table 1.
Above ground, total plant biomass-yield, nitrogen uptake and fertilizer usage (%) in barley and sunflower following biochar soil application in 2011 (mean ± 1 standard deviation). Different letters within a column indicate significant differences between treatment means within single years (p < 0.05; n = 4, using Student’s t-test, when only two treatments; ANOVA when 3 treatments; all values based on dry weight basis.
3.1.2. Fertilized Biochar Incorporation Increased C:N Ratio (Grain) and %Ndff Values (Grain & Shoots)
The C:N ratio in the grain was significantly higher (p < 0.05) in the BCN treatment (22:1) than in the NPK treatment (20:1).
In the BCN treatment above ground crop N uptake from the top-dressed labelled fertilizer was almost double that of the NPK treatment (39 and 22 kg N ha−1 respectively) but not significantly different (Table 1). Moreover, the average percentage of fertilizer (% FU) applied that was taken up by the crop was almost double in the BCN treatment (64% ± 8a) than that of the NPK treatment (37% ± 28a) although not significantly different (p = 0.06, Table 1). However, mean %Ndff-values were significantly different between treatments (p < 0.05); twice as high in the BCN treatment (24% & 26%), compared to the NPK treatment (13% & 12%) in both the grain and shoots, respectively (Table 2).
Table 2.
% Nitrogen derived from top dressing fertilizer (Ndff) and % fertilizer nitrogen allocated (FNA) to the various plant parts. Carbon isotope discrimination in spring barley and sunflower following biochar soil application in 2011 (mean ± standard deviation). Different letters indicate significant differences between treatment means within single years (p < 0.05; n = 8, using Student’s t-test).
Fertilizer nitrogen allocation was significantly different between the two treatments with the NPK treatment allocating slightly, although significantly more of the labelled fertilizer to grain filling (86%). The % N of the grain was also marginally but significantly higher (p < 0.05) in the NPK treatment (2.1 ± 0.13), compared to (1.92 ± 0.15) in the BCN treatment.
3.1.3. Fertilized Biochar Incorporation Increased C Isotope Discrimination (Grain)
There was a significant difference in the carbon isotope discrimination (CID) of the grain between the BCN and NPK treatment (p < 0.05), with the BCN treatment exhibiting more discrimination (Table 2). There was a strong and significant correlation between % nitrogen and the carbon isotope discrimination (r2 = 0.79, p < 0.0001) with a trend of decreasing discrimination with increasing in nitrogen content (for both plant parts). Although this was only a significant correlation for the grain when analysed separately (r2 = 0.33, p < 0.05) from the shoots.
3.1.4. Treatment Differences in the Greenhouse Experiment in 2018
Results of the greenhouse pot experiment in 2018 showed significant differences (p < 0.05) between the treatments. Significantly lower plant and grain yields were measured in the saw dust treatment (SD120N) compared to the biochar (BC72N) treatment, while the biochar treatment yields did not differ from the control (NPK: 871 ± 157; BC72N: 912 ± 156; SD120N: 513 ± 130 in kg ha−1). The amount of nitrogen taken up from the fertilizer was lowest in the SD120N treatment (NPK: 16.33 ± 6.41; BC72N: 19.15 ± 4.14; SD120N: 8.14 ± 2.13; in kg) in the grains, although the %Ndff in the plant was slightly lower in the SD120N treatment (NPK: 58.6 ± 1.5; BC72N: 59.8 ± 2.1; SD120N: 55.3 ± 2.0). The fertilizer use (%FU) did not differ between the biochar treatment and the control but was significantly depressed in the saw dust treatment SD120N (NPK: 41.09 ± 3.24, BC72N 41.93 ± 4.22, SD120N 15.30 ± 1.91 in %).
3.2. Results of Sunflower Field Experiment in 2012
In both 2011 and 2012, additional soil measurements on the top 10 cm were made (Table 3). Total fertilizer N recovery (in plant and soil) was not significantly different between the NPK and BCN treatments and very close to the 50 kg N that was added as labelled fertilizer in 2012, nor was there any difference in the % total N or δ15N of the soil under the two treatments in 2012. However, in 2011 not surprisingly % total C was significantly (p < 0.05) higher in the biochar treatment, this was also reflected in the isotope signature of the carbon in the soil and the C:N ratio of the soil, however notably soluble organic carbon was about 10% lower in the biochar treatment. Soil moisture content measured at harvest in 2012 was significantly higher in the BCN compared to the NPK treatment 0.31 versus 0.21 g H2O g−1 DW, reflecting the significantly higher rainfall in 2012.
Table 3.
Soil data. C:N ratio, carbon content and isotope ratios of the soil following sunflower harvest. Total nitrogen derived from top dressing fertilizer (Ndff) recovered in sunflower and soil following harvest. % moisture content of soil at following harvest in 2012 (all values mean ± standard deviation, n = 4). Different letters indicate significant differences between treatment means within single years, p < 0.05; based on Student’s t-test).
3.2.1. Sunflower Nitrogen Yields Did Not Differ in Fertilized Treatments
No additional biochar was added in 2012 and it was a mildly dry year, with a cumulative precipitation in the first nine months reaching 93.1% of the long term mean (420 mm—2012 total annual rainfall, 550 mm a−1 long-term average). Again, labelled fertilizer was applied as a top dressing, in late spring on new sub-plots which had previously received no labelled fertilizer. Seed-head yields (referred to from herein as grain) as determined from sub plot measurements, were not significantly different between the fertilized treatments, in the NPK treatment mean grain yield was 5145 ± 129 kg ha−1 and in the BCN treatment 5103 ± 393 kg ha−1, although they were both significantly higher than the un-fertilized biochar BC3 treatment (4900 ± 300 kg ha−1) and conferred well with whole plot data [35]. Again, mean total crop nitrogen yields were not significantly different between the fertilized treatments NPK and BCN (151 and 139 kg N ha−1 respectively) but in the BC3 treatment, N yields were significantly lower (98 kg N ha−1) and extremely similar to the previous year’s spring barley 2011-N yield data for the BC3 treatment (Table 1). An average of ~26 kg N ha−1 derived from the added top dressing of fertilizer (Table 1).
3.2.2. Fertilized Biochar Incorporation Did Not Affect Mean %Ndff Value and C Isotope Discrimination
Mean %Ndff was not significantly different between plant parts or treatments with an average of around 17% of the nitrogen in the plant being derived from the labelled fertilizer added (Table 2).
Ndff, the % of nitrogen in the plant that was derived from the fertilizer, was on average ~18% and for each component plant part, ~18% of the nitrogen in that part was derived from the second fertilizer application (Table 2).
Above ground crop N uptake from the labelled fertilizer was very similar and not significantly different between the BCN and NPK treatments (25 and 26 kg N ha−1 respectively, Table 1). Accordingly, mean fertilizer recovery from the applied labelled fertilizer was also not significantly different and very similar in both the NPK (51%) and BCN (52%) treatments but slightly higher than the average recovery in spring barley in 2011 (Table 1). Fertilizer nitrogen allocation showed a slight, difference (p = 0.051) between the two treatments with the NPK treatment allocating slightly less of the labelled fertilizer taken up to grain filling (75%) compared to the BCN treatment (79%) (Table 2). There were no significant differences in the % N of the grain or in the carbon isotope discrimination of the grain, shoots or leaves between the BCN and NPK treatments but minor differences between plant parts (Table 2).
4. Discussion
4.1. Spring Barley Field Experiment in 2011
4.1.1. Yield Response after Biochar Incorporation Minimal in Temperate Soils
Contrary to our 2011 spring barley results, significant yield increases in European temperate arable systems with inorganic fertilizer applications have not often been observed following biochar applications in field trials, although substantial but not significant increases of greater than 20% have been observed in German sandy soils amended with biochar [41], highlighting the difficulty in overcoming heterogeneity in field experiments [42,43,44,45]. Although many positive increases in yield have been shown in tropical and oceanic cropping systems [46,47,48], these increases have not been so dramatic in temperate soils as they generally have sufficient inherent fertility, high CEC and neutral pH [5].
The yield responses for biochar reported herein were lower than to those found for winter barley grown on volcanic soils in an oceanic climate near Tumuco, Chile, with an annual rainfall of around 1100 mm a−1. In that experiment, the addition of biochar at the rate of 20 mg ha−1 significantly increased grain yield by 31.3% and 21.8% in the Inceptisol and Ultisol, respectively, relative to the control [47]. Although they did not measure N yields, chlorophyll measurements indicated biochar addition had a significant negative impact on N yields.
In our experiment, overall the amount of fertilizer recovered in the plant from the fertilizer added in the NPK treatment was in a similar range to previous studies of wheat, in which around 40% of the total fertilizer N added as ammonium sulphate was recovered in the above ground crop [48]. The higher than average fertilizer recoveries in the biochar treatment (~64%) need to be further verified, as this could be extremely useful biochar induced effect as N pollution from fertilizer is a major contributor to agricultural pollution, through greenhouse gas emissions and nitrate leaching, therefore any improvements in fertilizer use efficiency should be investigated thoroughly.
Similar N allocation patterns were also observed in the Garabet study [48], with 79% of the N accumulated in grain and 21% in straw, in comparison to ~85 and ~15% in the grain and shoots respectively in our barley experiments. These slight differences could be attributable to differences in wheat and barley or to different sampling methods but overall they show plant nitrogen is preferentially allocated to grain filling.
In our soil it was clear in the first year after biochar application that there was insufficient N in the native soil for optimum crop growth, evident from the BC3 biochar-no-fertilizer N treatment, however there was no significant difference in the total crop N uptake in both the NPK and BCN treatments, suggesting that fertilizer application was adequate to overcome the plant nutritional constraint. This similarity in crop N uptake after biochar and mineral fertilizer addition has been observed in American temperate maize cropping systems [44] and again highlights the need for identifying soil productivity constraints if biochar is to be used to improve crop yields [10,45]. Our results are in line with Glaser et al. [41] although they observed 20% average increases in maize yields in sandy German soils with the addition of biochar but they also failed to observe significant differences in either grain yield or N uptake when inorganic-fertilized and non-fertilized treatments were compared.
4.1.2. Stabile Isotope Analysis Indicates Biochar Incorporation to Overcome Water Constraints and Increase Fertilizer Efficiency
Although %Ndff values were significantly different in the NPK and BCN treatments in the field experiment, this did not translate into significant differences in the amount of fertilizer N uptake, this could be attributable to the high combined error generated when calculating both crop N uptake and fertilizer recovery, as they are calculated from a combination of %N, dry matter yield and 15N enrichment data. %Ndff, however, is based on a single isotope measurement of the plant material and the fertilizer used which is constant for all treatments. However, what it does highlight is that there was sufficient soil N mineralization or basal fertilizer to compensate for the short fall of labelled fertilizer in the NPK treatment and it suggests in that dry year that water was constraining crop growth to a greater degree than N deficiency in both the NPK and BCN treatments. There is evidence for this from the 13C carbon isotope discrimination data.
The carbon isotope discrimination (CID) was significantly higher in the BCN treatment, which in turn suggests it was less water stressed. As under water stress there is increased stomatal closure this leads to less discrimination against the heavier 13C containing carbon dioxide molecules [40]. In addition, the C:N ratio in the grain was significantly higher (p < 0.05) in the BCN treatment (22:1) than in the NPK treatment (20:1) again suggesting, water was constraining photosynthesis and carbon accumulation rather than nitrogen constraining growth. It is possible that the discrimination is seen more profoundly in the grain rather than the shoots as it is an integrated measure over many weeks of carbon export during grain filling. Leaf carbon values more likely reflect the initial water status of the plant in terms of structural leaf production and the current status of photosynthate and may explain why we only saw the effects in the grain. Craufurd et al. [49] demonstrated that isotope discrimination was a good indicator of yield in dry land barley and it has been attributed to improved water use efficiency [34].
The average increase in fertilizer efficiency could be linked to the improved water availability and increased mass flow of nitrate into the crop in the biochar treatments. Mass flow has been shown to be responsible for the majority of nutrient uptake in agronomic crops, for example in Zea mays grown in a fertile loam soil accumulated 79% of its nitrogen (N), by mass-flow, the rest being taken up by diffusion and interception by the roots [50]; moreover, nitrate has higher mobility and is obviously more available than ammonium, which is generally bound to clays or organic matter. We have previously demonstrated that nitrification rates were very high in these soils and higher in the BCN treatment than the NPK treatment [51] and that there were significant differences in the soil volumetric water contents between the two treatments throughout the growing season, with average g H2O g−1 DW, 0.17 and 0.14 for the BCN and NPK treatments respectively [51]. Indeed, Karer et al. [35], had observed significantly greater water holding capacity at low water tension (0 pF) and field capacity (1.8 pF) but not at higher water tensions in the biochar treatments, suggesting there may have been more plant water available water as a consequence of higher soil water storage in the biochar treatment over the whole growing season, which could account for the higher carbon isotope discrimination in the biochar treatment crop.
4.2. Sunflower Field Experiment in 2012
We conjecture that the biochar treatment yield increases we observed in 2011 were more linked with the increased availability of water consequently affecting nitrogen uptake rather than nitrogen effects per-se. This is supported by the 2012 observations. In that mildly dry year there were no significant nitrogen effects of biochar treatment on sunflower grain yield or total above ground biomass accumulation, when it was added with fertilizer; although yields were significantly lower in the un-fertilized biochar treatment. Overall grain yields were much higher in the fertilizer treatments (5100 kg ha−1, equivalent to 3060 kg seeds ha−1) than the average for Austria in 2012 (2270 kg ha−1) [52]. These values are much lower than the values for sunflower grown in in Argentina and reported by Scheiner et al. [53], of 51% Ndff but reflect the fact that in these experiments we are only looking at the fate of the second top dressing of N fertilizer and not the total fertilizer application of 150 kg N ha−1 as they did in Argentina.
The significantly higher %N recovery in the NPK 2012 treatment compared to the previous year was possibly a result of the improved water availability in 2012. Atta & Van Cleemput [54] had studied the fate of labelled fertilizer ammonium-N applied to sunflower in a sandy soil and concluded that only 30% of the fertilizer nitrogen was recovered in the plant, a lower value than in our experiments and possibly the result of the sandy soil type with a high leaching potential in their experiments. Our soil however was a sandy loam with 25% clay which possibly prevented excessive leaching as evident from the overall fertilizer recovery data in the above ground and soil components, as the amount of fertilizer recovered was 47 and 53 kg N ha−1 in the NPK and BCN treatments, respectively and which was similar to the 50 kg N ha−1 that was added as the N top dressing which was labelled. The allocation data again shows N is dominantly allocated to grain filling with ~80% of the fertilizer nitrogen taken up ending up in the seed tissues, similar to the cereal allocation and an obvious consequence of the combined effects of breeding selection and evolution.
There were no significant differences in the carbon isotope discrimination between the NPK and BCN treatments, although previous studies have shown that in field grown sunflower plants is strongly correlated with stomatal conductance (r g = 0.64, p < 0.01) and the ratio of net assimilation rate (A) to growth (r g = −0.86, p < 0.001), an instantaneous measure of transpiration efficiency [55]. The lack of difference was probably due to the lack of water constraint during 2012, as it was a much wetter year than 2011 particularly in the growing season and evident from the soil moisture contents at harvest.
It is difficult to completely reject our original hypothesis that biochar application can increase crop yields through improving the nitrogen uptake and utilization of added inorganic fertilizer, as we did see increased yield and improved fertilizer nitrogen uptake in the biochar treatment in the first year. However, it did not translate to increased overall N status in the crop at harvest suggesting the water rather than nitrogen was the yield limiting factor. In the second year, we can reject our hypothesis for this soil type, crop and agro-ecosystem.
It can be clearly seen from these experiments that biochar additions of up to 72 tonnes ha−1 did not cause significant N yield or plant yield depression as a consequence of N immobilization when mineral N fertilizer was added. In contrast, Recous et al. [56] showed that a year after wheat straw application of only 4000 kg C ha−1 to a loamy soil that immobilization of nitrogen was in the order of 380 kg N ha−1; three times higher in the straw amended soils compared to the non-amended controls. Moreover, when one tonne ha−1 of un-charred maize carbon was added to a temperate Austrian soil with similar climatic conditions to this experiment, it resulted in a significant 20% decrease in maize N yield compared to controls over similar time scales [57]. Glasshouse experiments herein confirmed when similar quantities of un-pyrolyzed carbon was added to the soils as sawdust that grain yields were halved as a consequence of immobilization. This was evident from the significantly higher 15N enrichment of the soil microbial biomass in the sawdust treatment (615‰ ± 115) which was twice that of the both the NPK (332‰ ± 128) and BCN (278‰ ± 23) treatment. Indeed, these experiments suggest that immobilization of nitrogen on the addition of ~58,000 kg of C ha−1 in the form of biochar resulted in similar if not improved rates of plant fertilizer nitrogen uptake, with a potential maximum carbon credit value of around $7000 ha−1 based on values stated above.
Biochar addition appeared not to have any immobilization impacts over and above those of the native soil, as confirmed by the results of our greenhouse pot experiment. In their recent meta-analysis, Liu et al. [58] found soil N mineralization to remain stable after biochar addition. Despite the fact that we have previously shown that there is a microbial response to biochar addition, with soil microbial DNA concentrations being significantly higher in the biochar treatment (18.0 to 12.4 μg DNA g−1 soil BCN and NPK, respectively) [51], this increase in microbial biomass appears to have had little impact on the inorganic nitrogen availability. Taken together with some experimental results from our detailed nitrogen cycling measurements on the same plots, we suspect that the addition of carbon in the form of biochar does not induce the primary signalling of the eukaryotic nitrate reductase activity (EukNR) in the soil microbial biomass, in the same way that addition of other carbon based carbohydrates have been shown to Gorfer et al. (2011), as biochar is not a readily available energy source for the microbial biomass. Indeed, over the long term, biochar could further reduce the EukNR signalling response, as it was shown that there was significantly lower availability of soluble organic carbon in biochar-amended soils. In this context, 13C labelling of biochar revealed that soil microorganisms took up only little amounts of biochar-C in the study of Watzinger et al. [13] and consequently no biochar C degradation within two years was observed [59].
Moreover, further evidence comes from the detailed N experiments, where the gross nitrate consumption: production rates were 3:1 and 1:1 in the NPK and BC3 treatments respectively in 2011 [51], again suggesting lower nitrate consumption in the biochar treatments and are confirmed by SMB N uptake data in these experiments. This nascent novel “no-EukNR” hypothesis, which suggests biochar does not induce primary signalling of nitrate reductase activity, offers some explanation for the observed effects of biochar on immobilization in contrast to other uncharred carbon sources but needs further verification based on experimental and molecular analysis.
5. Conclusions
Massive biochar additions to soil did not cause significant N yield or plant yield depression as a consequence of N immobilization when mineral N fertilizer was added in both field and glasshouse experiments. This is of paramount agronomic importance as addition of non-charred carbon sources often leads to significant microbial immobilisation of inorganic N and causing a depression in plant growth and yield [60]. As previously stated, it is this aspect of non-charred soil carbon incorporation for sequestration that makes it a difficult proposition to sell to profit-focused farmers. If biochar addition has minimal impacts on inorganic nitrogen immobilization but improves soil nitrogen retention as has been suggested here and recently by Güereña et al. [44], then it becomes an attractive option for increasing the profitability of marginal cropping lands. Here we offer some mechanistic explanation for these observations allowing us to further understand and manage the role of biochar in an agro-economic system.
In the context of agronomy for sustainable development this could mean that the peripheral benefits associated with soil carbon addition such as, carbon sequestration, improving cation exchange capacity and water holding capacity, could be reaped without the negative effects of yield loss due to nutrient immobilization. Indeed, another factor that these experiments emphasised was the positive influence of biochar on soil water status with its inherent implications for the biogeochemical processes. The impact of biochar on soil water status during the extremely dry year and evaluated using the described carbon isotope discrimination approach is an area worthy of further research. Especially following global research, which suggests that cereal yields are reduced by as much as 10% in climate change driven, hot and dry extreme weather years in developed countries [61].
Given this and the changing landscape of European agriculture biochar-based carbon farming may become a viable agribusiness for marginal cropping lands in temperate agricultural climates.
Author Contributions
R.H.-N. designed, conducted and analysed the experiments and wrote the first draft of the paper. A.W. (Anna Wawra) conducted and analysed the greenhouse pot experiment, revised and edited the manuscript. G.S. designed and implemented the original biochar field experiments and edited the manuscript. A.W. (Andrea Watzinger) oversaw the sample analysis in the stable isotope lab.
Funding
This research was funded by Austrian Science Fund (FWF) grant number V138-B17 (RCHN) and Austrian Research Promotion Agency (FFG) grant number 825438 (GS).
Acknowledgments
We thank the Austrian Institute of Technology (AIT) team for setting up the main field experiment. Isotope analyses were performed at SILVER, University of Vienna and particularly thank Judith Prommer, for her assistance with the field work and sample preparation and Margarete Watzka for her patience and efforts in analysing the samples and Wolfgang Wanek for his support. We would particularly like to thank Rudolf Hofman for letting us onto his field to set up this biochar project.
Conflicts of Interest
The authors declare no conflict of interest.
References
- Smith, P. Soil carbon sequestration and biochar as negative emission technologies. Glob. Chang. Biol. 2016, 22, 1315–1324. [Google Scholar] [CrossRef] [PubMed]
- Van den Bergh, J.; Botzen, W. A lower bound to the social cost of CO2 emissions. Nat. Clim. Chang. 2014, 4, 253. [Google Scholar] [CrossRef]
- Schimel, D.S. Terrestrial ecosystems and the carbon cycle. Glob. Chang. Biol. 1995, 1, 77–91. [Google Scholar] [CrossRef]
- Schlesinger, W.H.; Andrews, J. Soil respiration and the global carbon cycle. Biogeochemistry 2000, 48, 7–20. [Google Scholar] [CrossRef]
- Jeffery, S.; Abalos, D.; Prodana, M.; Bastos, A.C.; Van Groenigen, J.W.; Hungate, B.A.; Verheijen, F. Biochar boosts tropical but not temperate crop yields. Environ. Res. Lett. 2017, 12, 053001. [Google Scholar] [CrossRef]
- Singh, B.P.; Cowie, A.L. Long-term influence of biochar on native organic carbon mineralisation in a low-carbon clayey soil. Sci. Rep. 2014, 4, 3687. [Google Scholar] [CrossRef] [PubMed]
- Steiner, C.; Teixeira, W.G.; Lehmann, J.; Nehls, T.; de Macêdo, J.L.; Blum, W.E.; Zech, W. Long term effects of manure, charcoal and mineral fertilization on crop production and fertility on a highly weathered Central Amazonian upland soil. Plant Soil 2007, 291, 275–290. [Google Scholar] [CrossRef]
- Eykelbosh, A.J.; Johnson, M.S.; de Queiroz, E.S.; Dalmagro, H.J.; Couto, E.G. Biochar from sugarcane filtercake reduces soil CO2 emissions relative to raw residue and improves water retention and nutrient availability in a highly-weathered tropical soil. PLoS ONE 2014, 9, e98523. [Google Scholar] [CrossRef] [PubMed]
- Song, X.; Pan, G.; Zhang, C.; Zhang, L.; Wang, H. Effects of biochar application on fluxes of three biogenic greenhouse gases: A meta-analysis. Ecosyst. Health Sustain. 2016, 2, 01202. [Google Scholar] [CrossRef]
- Van Zwieten, L.; Kimber, S.; Morris, S.; Chan, K.Y.; Downie, A.; Rust, J.; Joseph, S.; Cowie, A. Effects of biochar from slow pyrolysis of papermill waste on agronomic performance and soil fertility. Plant Soil 2010, 327, 235–246. [Google Scholar] [CrossRef]
- Case, S.D.C.; McNamara, N.P.; Reay, D.S.; Whitaker, J. The effect of biochar addition on N2O and CO2 emissions from a sandy loam soil—The role of soil aeration. Soil Biol. Biochem. 2012, 51, 125–134. [Google Scholar] [CrossRef]
- Cayuela, M.L.; van Zwieten, L.; Singh, B.P.; Jeffery, S.; Roig, A.; Sánchez-Monedero, M.A. Biochar’s role in mitigating soil nitrous oxide emissions: A review and meta-analysis. Agric. Ecosyst. Environ. 2014, 191, 5–16. [Google Scholar] [CrossRef]
- Watzinger, A.; Feichtmair, S.; Kitzler, B.; Zehetner, F.; Kloss, S.; Wimmer, B.; Zechmeister-Boltenstern, S.; Soja, G. Soil microbial communities responded to biochar application in temperate soils and slowly metabolized 13C-labelled biochar as revealed by 13C PLFA analyses: Results from a short-term incubation and pot experiment. Eur. J. Soil Sci. 2014, 65, 40–51. [Google Scholar] [CrossRef]
- Glaser, B.; Haumaier, L.; Guggenberger, G.; Zech, W. The ‘Terra Preta’ phenomenon: A model for sustainable agriculture in the humid tropics. Naturwissenschaften 2001, 88, 37–41. [Google Scholar] [CrossRef] [PubMed]
- Lehmann, J.; Gaunt, J.; Rondon, M. Bio-char Sequestration in Terrestrial Ecosystems—A Review. Mitig. Adapt. Strateg. Glob. Chang. 2006, 11, 395–419. [Google Scholar] [CrossRef]
- Steiner, C.; Glaser, B.; Teixeira, W.G.; Lehmann, J.; Blum, W.E.H.; Zech, W. Nitrogen retention and plant uptake on a highly weathered central Amazonian Ferralsol amended with compost and charcoal. J. Plant Nutr. Soil Sci. 2008, 171, 893–899. [Google Scholar] [CrossRef]
- Kuzyakov, Y.; Subbotina, I.; Chen, H.; Bogomolova, I.; Xu, X. Black carbon decomposition and incorporation into soil microbial biomass estimated by 14C labeling. Soil Biol. Biochem. 2009, 41, 210–219. [Google Scholar] [CrossRef]
- Lehmann, J.; Joseph, S. Biochar for environmental management: An introduction. In Biochar for Environmental Management—Science and Technology; Routledge: Abingdon, UK, 2009; Volume 1, pp. 1–12. [Google Scholar]
- Jeffery, S.; Abalos, D.; Spokas, K.A.; Verheijen, F.G.A. Biochar effects on crop yield. In Biochar for Environmental Management: Science, Technology and Implementation; Lehmann, J., Joseph, S., Eds.; Earthscan: London, UK, 2015; pp. 301–325. [Google Scholar]
- Jeffery, S.; Verheijen, F.G.A.; van der Velde, M.; Bastos, A.C. A quantitative review of the effects of biochar application to soils on crop productivity using meta-analysis. Agric. Ecosyst. Environ. 2011, 144, 175–187. [Google Scholar] [CrossRef]
- Malhi, S.S.; Grant, C.A.; Johnston, A.M.; Gill, K.S. Nitrogen fertilization management for no-till cereal production in the Canadian Great Plains: A review. Soil Tillage Res. 2001, 60, 101–122. [Google Scholar] [CrossRef]
- Lavelle, P.; Spain, A.V. Soil Ecology; Cambridge University Press: Cambridge, UK, 2007. [Google Scholar]
- Ladha, J.K.; Pathak, H.; Krupnik, T.J.; Six, J.; van Kessel, C. Efficiency of Fertilizer Nitrogen in Cereal Production: Retrospects and Prospects. Adv. Agron. 2005, 87, 85–156. [Google Scholar]
- Hauck, R.D.; Bremmer, J.M. Use of Tracers for Soil and Fertilizer Nitrogen Research; American Society of Agronomy: Madison, WI, USA, 1976. [Google Scholar]
- Hood, R.; Bautista, E.; Heiling, M. Gross mineralization and plant N uptake from animal manures under non-N limiting conditions, measured using 15N isotope dilution techniques. Phytochem. Rev. 2003, 2, 113–119. [Google Scholar] [CrossRef]
- Mueller, N.D.; Gerber, J.S.; Johnston, M.; Ray, D.K.; Ramankutty, N.; Foley, J.A. Closing yield gaps through nutrient and water management. Nature 2012, 490, 254–257. [Google Scholar] [CrossRef] [PubMed]
- Farquhar, G.; Richards, R. Isotopic Composition of Plant Carbon Correlates With Water-Use Efficiency of Wheat Genotypes. Aust. J. Plant Physiol. 1984, 11, 539. [Google Scholar] [CrossRef]
- Condon, A.G.; Richards, R.A.; Rebetzke, G.J.; Farquhar, G.D. Improving Intrinsic Water-Use Efficiency and Crop Yield. Crop Sci. 2002, 42, 122–131. [Google Scholar] [CrossRef] [PubMed]
- Zimmerman, J.K.; Ehleringer, J.R. Carbon isotope ratios are correlated with irradiance levels in the Panamanian orchid Catasetum viridiflavum. Oecologia 1990, 83, 247–249. [Google Scholar] [CrossRef] [PubMed]
- Winter, K.; Holtum, J.A.M.; Edwards, G.E.; O’Learry, M.H. Effect of Low Relative Humidity on δ13C Value in Two C 3 Grasses and in Panicum milioides, a C3–C4 Intermediate Species. J. Exp. Bot. 1982, 33, 88–91. [Google Scholar] [CrossRef]
- Rasmuson, K.; Anderson, J. Salinity affects development, growth, and photosynthesis in cheatgrass. J. Range Manag. 2002, 55, 80–87. [Google Scholar] [CrossRef]
- Wallace, M.; Jones, G.; Charles, M.; Fraser, R.; Halstead, P.; Heaton, T.H.; Bogaard, A. Stable carbon isotope analysis as a direct means of inferring crop water status and water management practices. World Archaeol. 2013, 45, 388–409. [Google Scholar] [CrossRef]
- Condon, A.; Farquhar, G.; Richards, R. Genotypic Variation in Carbon Isotope Discrimination and Transpiration Efficiency in Wheat. Leaf Gas Exchange and Whole Plant Studies. Aust. J. Plant Physiol. 1990, 17, 9. [Google Scholar] [CrossRef]
- Anyia, A.O.; Slaski, J.J.; Nyachiro, J.M.; Archambault, D.J.; Juskiw, P. Relationship of carbon isotope discrimination to water use efficiency and productivity of barley under field and greenhouse conditions. J. Agron. Crop Sci. 2007, 193, 313–323. [Google Scholar] [CrossRef]
- Karer, J.; Wimmer, B.; Zehetner, F.; Kloss, S.; Soja, G. Biochar application to temperate soils: Effects on nutrient uptake and crop yield under field conditions. Agric. Food Sci. 2013, 22, 390–403. [Google Scholar] [CrossRef]
- Sigmund, G.; Bucheli, T.D.; Hilber, I.; Micić, V.; Kah, M.; Hofmann, T. Effect of ageing on the properties and polycyclic aromatic hydrocarbon composition of biochar. Environ. Sci. Process. Impacts 2017, 19, 768–774. [Google Scholar] [CrossRef] [PubMed]
- Hood-Nowotny, R.; Schwarzinger, B.; Schwarzinger, C.; Soliban, S.; Madakacherry, O.; Aigner, M.; Watzka, M.; Gilles, J. An Analysis of Diet Quality, How It Controls Fatty Acid Profiles, Isotope Signatures and Stoichiometry in the Malaria Mosquito Anopheles arabiensis. PLoS ONE 2012, 7, e45222. [Google Scholar] [CrossRef] [PubMed]
- Junk, G.; Svec, H.J. The absolute abundance of the nitrogen isotopes in the atmosphere and compressed gas from various sources. Geochim. Cosmochim. Acta 1958, 14, 234–243. [Google Scholar] [CrossRef]
- International Atomic Energy Agency (IAEA). Use of Isotope and Radiation Methods in Soil and Water Management and Crop Nutrition; International Atomic Energy Agency: Vienna, Austria, 2001. [Google Scholar]
- Farquhar, G.D.; Ehleringer, J.R.; Hubick, K.T. Carbon Isotope Discrimination and Photosynthesis. Annu. Rev. Plant Biol. 1989, 40, 503–537. [Google Scholar] [CrossRef]
- Glaser, B.; Wiedner, K.; Seelig, S.; Schmidt, H.-P.; Gerber, H. Biochar organic fertilizers from natural resources as substitute for mineral fertilizers. Agron. Sustain. Dev. 2015, 35, 667–678. [Google Scholar] [CrossRef]
- Jones, D.L.L.; Rousk, J.; Edwards-Jones, G.; DeLuca, T.H.H.; Murphy, D.V.V. Biochar-mediated changes in soil quality and plant growth in a three year field trial. Soil Biol. Biochem. 2011, 45, 113–124. [Google Scholar] [CrossRef]
- Unger, R.; Killorn, R. Effect of Three Different Qualities of Biochar on Selected Soil Properties. Commun. Soil Sci. Plant Anal. 2011, 42, 2274–2283. [Google Scholar] [CrossRef]
- Güereña, D.; Lehmann, J.; Hanley, K.; Enders, A.; Hyland, C.; Riha, S. Nitrogen dynamics following field application of biochar in a temperate North American maize-based production system. Plant Soil 2012, 365, 239–254. [Google Scholar] [CrossRef]
- Zhang, A.; Bian, R.; Pan, G.; Cui, L.; Hussain, Q.; Li, L.; Zheng, J.; Zheng, J.; Zhang, X.; Han, X.; et al. Effects of biochar amendment on soil quality, crop yield and greenhouse gas emission in a Chinese rice paddy: A field study of 2 consecutive rice growing cycles. Field Crops Res. 2012, 127, 153–160. [Google Scholar] [CrossRef]
- Major, J.; Rondon, M.; Molina, D.; Riha, S.J.; Lehmann, J. Maize yield and nutrition during 4 years after biochar application to a Colombian savanna oxisol. Plant Soil 2010, 333, 117–128. [Google Scholar] [CrossRef]
- Curaqueo, G.; Meier, S.; Khan, N.; Cea, M.; Navia, R. Use of biochar on two volcanic soils: Effects on soil properties and barley yield. J. Soil Sci. Plant Nutr. 2014, 14, 911–924. [Google Scholar] [CrossRef]
- Garabet, S.; Wood, M.; Ryan, J. Nitrogen and water effects on wheat yield in a Mediterranean-type climate. Field Crops Res. 1998, 57, 309–318. [Google Scholar] [CrossRef]
- Craufurd, P.Q.; Austin, R.B.; Acevedo, E.; Hall, M.A. Carbon isotope discrimination and grain-yield in barley. Field Crops Res. 1991, 27, 301–313. [Google Scholar] [CrossRef]
- Barber, S.A. Soil Nutrient Bioavailability: A Mechanistic Approach; John Wiley & Sons: Hoboken, NJ, USA, 1995. [Google Scholar]
- Prommer, J.; Wanek, W.; Hofhansl, F.; Trojan, D.; Offre, P.; Urich, T.; Schleper, C.; Sassmann, S.; Kitzler, B.; Soja, G.; et al. Biochar Decelerates Soil Organic Nitrogen Cycling but Stimulates Soil Nitrification in a Temperate Arable Field Trial. PLoS ONE 2014, 9, e86388. [Google Scholar] [CrossRef] [PubMed]
- Food and Agriculture Organization (FAO). FAOSTAT Data; FAO: Rome, Italy, 2018. [Google Scholar]
- Scheiner, J.D.; Gutiérrez-Boem, F.H.; Lavado, R.S. Sunflower nitrogen requirement and 15N fertilizer recovery in Western Pampas, Argentina. Eur. J. Agron. 2002, 17, 73–79. [Google Scholar] [CrossRef]
- Atta, S.K.; van Cleemput, O. Field study of the fate of labelled fertilizer ammonium-N applied to sesame and sunflower in a sandy soil. Plant Soil 1988, 107, 123–126. [Google Scholar] [CrossRef]
- Lambrides, C.J.; Chapman, S.C.; Shorter, R. Genetic Variation for Carbon Isotope Discrimination in Sunflower. Crop Sci. 2004, 44, 1642. [Google Scholar] [CrossRef]
- Recous, S.; Aita, C.; Mary, B. In situ changes in gross N transformations in bare soil after addition of straw. Soil Biol. Biochem. 1998, 31, 119–133. [Google Scholar] [CrossRef]
- Hood, R.C.; N’Goran, K.; Aigner, M.; Hardarson, G. A comparison of direct and indirect 15N isotope techniques for estimating crop N uptake from organic residues. Plant Soil 1999, 208, 259–270. [Google Scholar] [CrossRef]
- Liu, Q.; Zhang, Y.; Liu, B.; Amonette, J.E.; Lin, Z.; Liu, G.; Ambus, P.; Xie, Z. How does biochar influence soil N cycle? A meta-analysis. Plant Soil 2018, 426, 211–225. [Google Scholar] [CrossRef]
- Rechberger, M.V.; Kloss, S.; Rennhofer, H.; Tintner, J.; Watzinger, A.; Soja, G.; Lichtenegger, H.; Zehetner, F. Changes in biochar physical and chemical properties: Accelerated biochar aging in an acidic soil. Carbon 2017, 115, 209–219. [Google Scholar] [CrossRef]
- Dinnes, D.L.; Karlen, D.L.; Jaynes, D.B.; Kaspar, T.C.; Hatfield, J.L.; Colvin, T.S.; Cambardella, C.A. Nitrogen Management Strategies to Reduce Nitrate Leaching in Tile-Drained Midwestern Soils. Agron. J. 2002, 94, 153–171. [Google Scholar] [CrossRef]
- Lesk, C.; Rowhani, P.; Ramankutty, N. Influence of extreme weather disasters on global crop production. Nature 2016, 529, 84–87. [Google Scholar] [CrossRef] [PubMed]

© 2018 by the authors. Licensee MDPI, Basel, Switzerland. This article is an open access article distributed under the terms and conditions of the Creative Commons Attribution (CC BY) license (http://creativecommons.org/licenses/by/4.0/).