Article

Parameterization for EROSION-3D Model under Simulated Rainfall Conditions in Lower Shivaliks of India

1
TU Bergakademie Freiberg, Soil and Water Conservation Unit, Agricolastraße 22, 09599 Freiberg, Germany
2
Regional Research Station, Punjab Agricultural University, Ballowal Saunkhri, SBS Nagar, Punjab 144521, India
3
Thüringer Landesanstalt für Landwirtschaft, Referat 420|Acker und Pflanzenbau, 07743 Jena, Germany
4
GeoGnostics, Bekassinenweg 30, 13503 Berlin, Germany
5
IPROconsult GmbH, Department Ecology and Environment, Schnorrstraße 70, 01069 Dresden, Germany
*
Author to whom correspondence should be addressed.
Geosciences 2018, 8(11), 396; https://doi.org/10.3390/geosciences8110396
Submission received: 26 July 2018 / Revised: 20 October 2018 / Accepted: 24 October 2018 / Published: 30 October 2018
(This article belongs to the Special Issue Mechanics of Erosion: Process Response to Change)

Abstract

:
The Shivalik foothills of northwestern India are very prone to soil erosion by water due to undulating slopes, highly erodible soils and high intensity rainstorm events during monsoon season. Physically based soil erosion modeling is seen as viable method for planning of measurements to reduce damages done by soil erosion. Nevertheless, parametrization of such models is a major challenge for large inaccessible areas. Several methods do exist for the estimation of the input parameters skin factor, surface roughness and resistance to erosion for the physically based soil erosion model EROSION-3D. Four rainfall experiments, each including dry and wet run, were conducted on different land use conditions on a research farm of the Regional Research Station Ballowal Saunkhri to test estimation methods. Modeling parameters were determined from these experiments. Parameter estimation by two methods for experimental conditions produced values in close range to experimentally determined values for resistance to erosion and surface roughness. Therefore, existing estimation methods are considered to be applicable for the conditions of the Shivalik mountains, except for skin factor. A first modeling with EROSION-3D using preliminary data of a small example catchment shows uncertainties resulting from range of determined and estimated soil parameters.

1. Introduction

Shivalik foothills of India cover a large part of northwestern Indian states Punjab, Haryana, Himachal Pradesh and Jammu and Kashmir. Soil erosion is a main factor leading to land degradation in this fragile ecosystem [1,2]. Lower Shivaliks in state of Punjab cover an area of 5380 km² and are locally known as Kandi area. This region is considered to be one of eight most degraded and fragile agro-ecosystems of India [3]. High intensity rainstorms during monsoon season from July to Mid-September cause severe erosion in croplands, cultivated for example with maize, wheat, mash (black gram) or sesame [4,5]. Agricultural fields are usually affected by sheet and rill erosion, whereas rills concentrate to form gullies in areas with higher slope. Among different types of soil erosion, gully erosion is the most serious one in the region as around 20% of the area is already under gullies [6]. Annual rainfall in the region varies from 800 to 1200 mm, out of which 80% rainfall occurs during monsoon season. A large portion of monsoon rainfall (35–40%) goes as runoff in torrents originating from Shivalik foothills [7]. Annual erosion rate in Shivalik foothills is more than 80 t/ha/year and in some watersheds, it is as high as 244 t/ha/year [8,9].
Yousuf et al. [10] outlined the urgent need of soil conservation or soil protection policy in this area and the importance of a method to quantify runoff and sediment yield to allow an effective implementation of this policy. As most viable option to quantify runoff and sediment yield at watershed scale as well as to design and evaluate alternate land use or management practices Yousuf and Singh [11] suggested the use of mathematical hydrological models in combination with remote sensing and GIS methods, as direct observations of soil loss are seen impractical to impossible for such large remote and inaccessible areas like Shivalik foothills. Recent studies in this area addressed estimation of runoff—as important input parameter for soil loss estimation—or runoff and soil loss on catchment scale by empirical and physically based runoff and soil erosion models.
An estimation of yearly mean annual soil loss can be done with the popular empirical Universal Soil Loss Equation (USLE) or one of its further developments. Bhatt et al. [8] compared USLE and Modified USLE (MUSLE) and found MUSLE estimating closer results to observed soil loss values than USLE. The Revised USLE-3D (RUSLE-3D) was applied to create soil erosion risk maps in a Shivalik sub-watershed [12]. Swarnkar et al. applied RUSLE to the basin of the Garra river covering 7000 km2 and the proposed methods to assess uncertainties in the estimation of soil erosion and sediment yield from ungauged basins, and found modelled confidence interval for sediment yield covering observed values [13]. RUSLE coupled with transport limited sediment delivery model was applied on two watersheds (271.75 km2 and 288.53 km2) under different climatic conditions in Ghats mountains of southern India to identify areas most vulnerable to soil erosion [14,15]. In the smaller of these two watersheds sediment yield (calculated by RUSLE coupled with sediment delivery ratio approach) was compared to a Soil Erosion Potential Index derived from analysis of seven erosion related thematic GIS layers [16]. The empirical method Soil Conservation Services Curve Number (SCS-CN) was applied on several Indian watersheds [17,18] and is seen reasonable for estimation of total runoff from single rainfall events. Jasrotia and Singh [19] combined SCS-CN with the Morgan-Morgan-Finney (MMF) method to estimate spatial annual soil loss from a 181 km2 watershed in Shivaliks of Jammu. The MMF model was also applied to a forest/agriculture watershed of 205.95 km2 in Shivalik mountains of Uttar Pradesh to estimate soil erosion risk classes and suggest possible erosion preventing measurements [20]. A comparative study of MMF, USLE and RUSLE on a catchment of 20,558 km2 found RUSLE to predict results closest to observed values [21].
As physically based model the Water Erosion Prediction Project model (WEPP) was used to simulate runoff from a rangeland watershed of 15.55 ha [22] and to simulate runoff and sediment yield from a forest/Agricultural watershed of 57 ha [23] and from forest watersheds of 21.3 ha [24] and 1.85 ha [10]. From these studies WEPP is seen as reasonable system for simulating runoff and soil loss with better performance on small to medium rainfall events after precise calibration of several very sensitive parameters from long lasting catchment observations. The Soil and Water Assessment Tool (SWAT) was used to simulate runoff from two forest/bushland watersheds of 21 ha and 70.45 ha and was found to simulate reliable runoff values after calibration from multiple years catchment data [25]. The newly developed Distributed Runoff and Erosion Assessment Model (DREAM) was validated in a semi-forested watershed of 3800 ha, modelled hydrographs and sediment yield was comparable to measured data for single rainstorm events [26].
An alternative physical based soil erosion model is EROSION-3D which needs beside rainfall and topographic data only eight soil parameters [27]. Five soil parameters can be acquired with standard methods of soil analysis or estimated from soil maps or remote sensing technology (bulk density, soil texture, total organic carbon, soil cover and soil moisture). The other three soil parameters can be determined from rainfall experiments or estimated by several methods based on an extensive database (surface roughness, resistance to erosion and skin factor) which allows to apply EROSION-3D with moderate calibration effort. Parameter estimation methods become most important on catchment or regional scale, where rainfall experiments cannot be done on each particular land use/soil condition. A further advantage of EROSION-3D is raster-based calculation which allows a detailed spatial analysis of erosion and deposition patterns. It contains a relief processing module which determines connectivity processes between raster cells from digital elevation models (DEM) and therewith ensures proper flow routing through catchments [28]. The model was successfully applied under several international settings [29,30,31]. The model EROSION-3D is therefore seen as well suited for the application on conditions of Shivalik mountains.
As first step for this application, this study describes determination of EROSION-3D soil parameters surface roughness, resistance to erosion and skin factor from four rainfall/runoff experiments conducted on soils in Shivalik foothills and estimation of these parameters with three alternative methods for conditions of rainfall experiments.

2. Materials and Methods
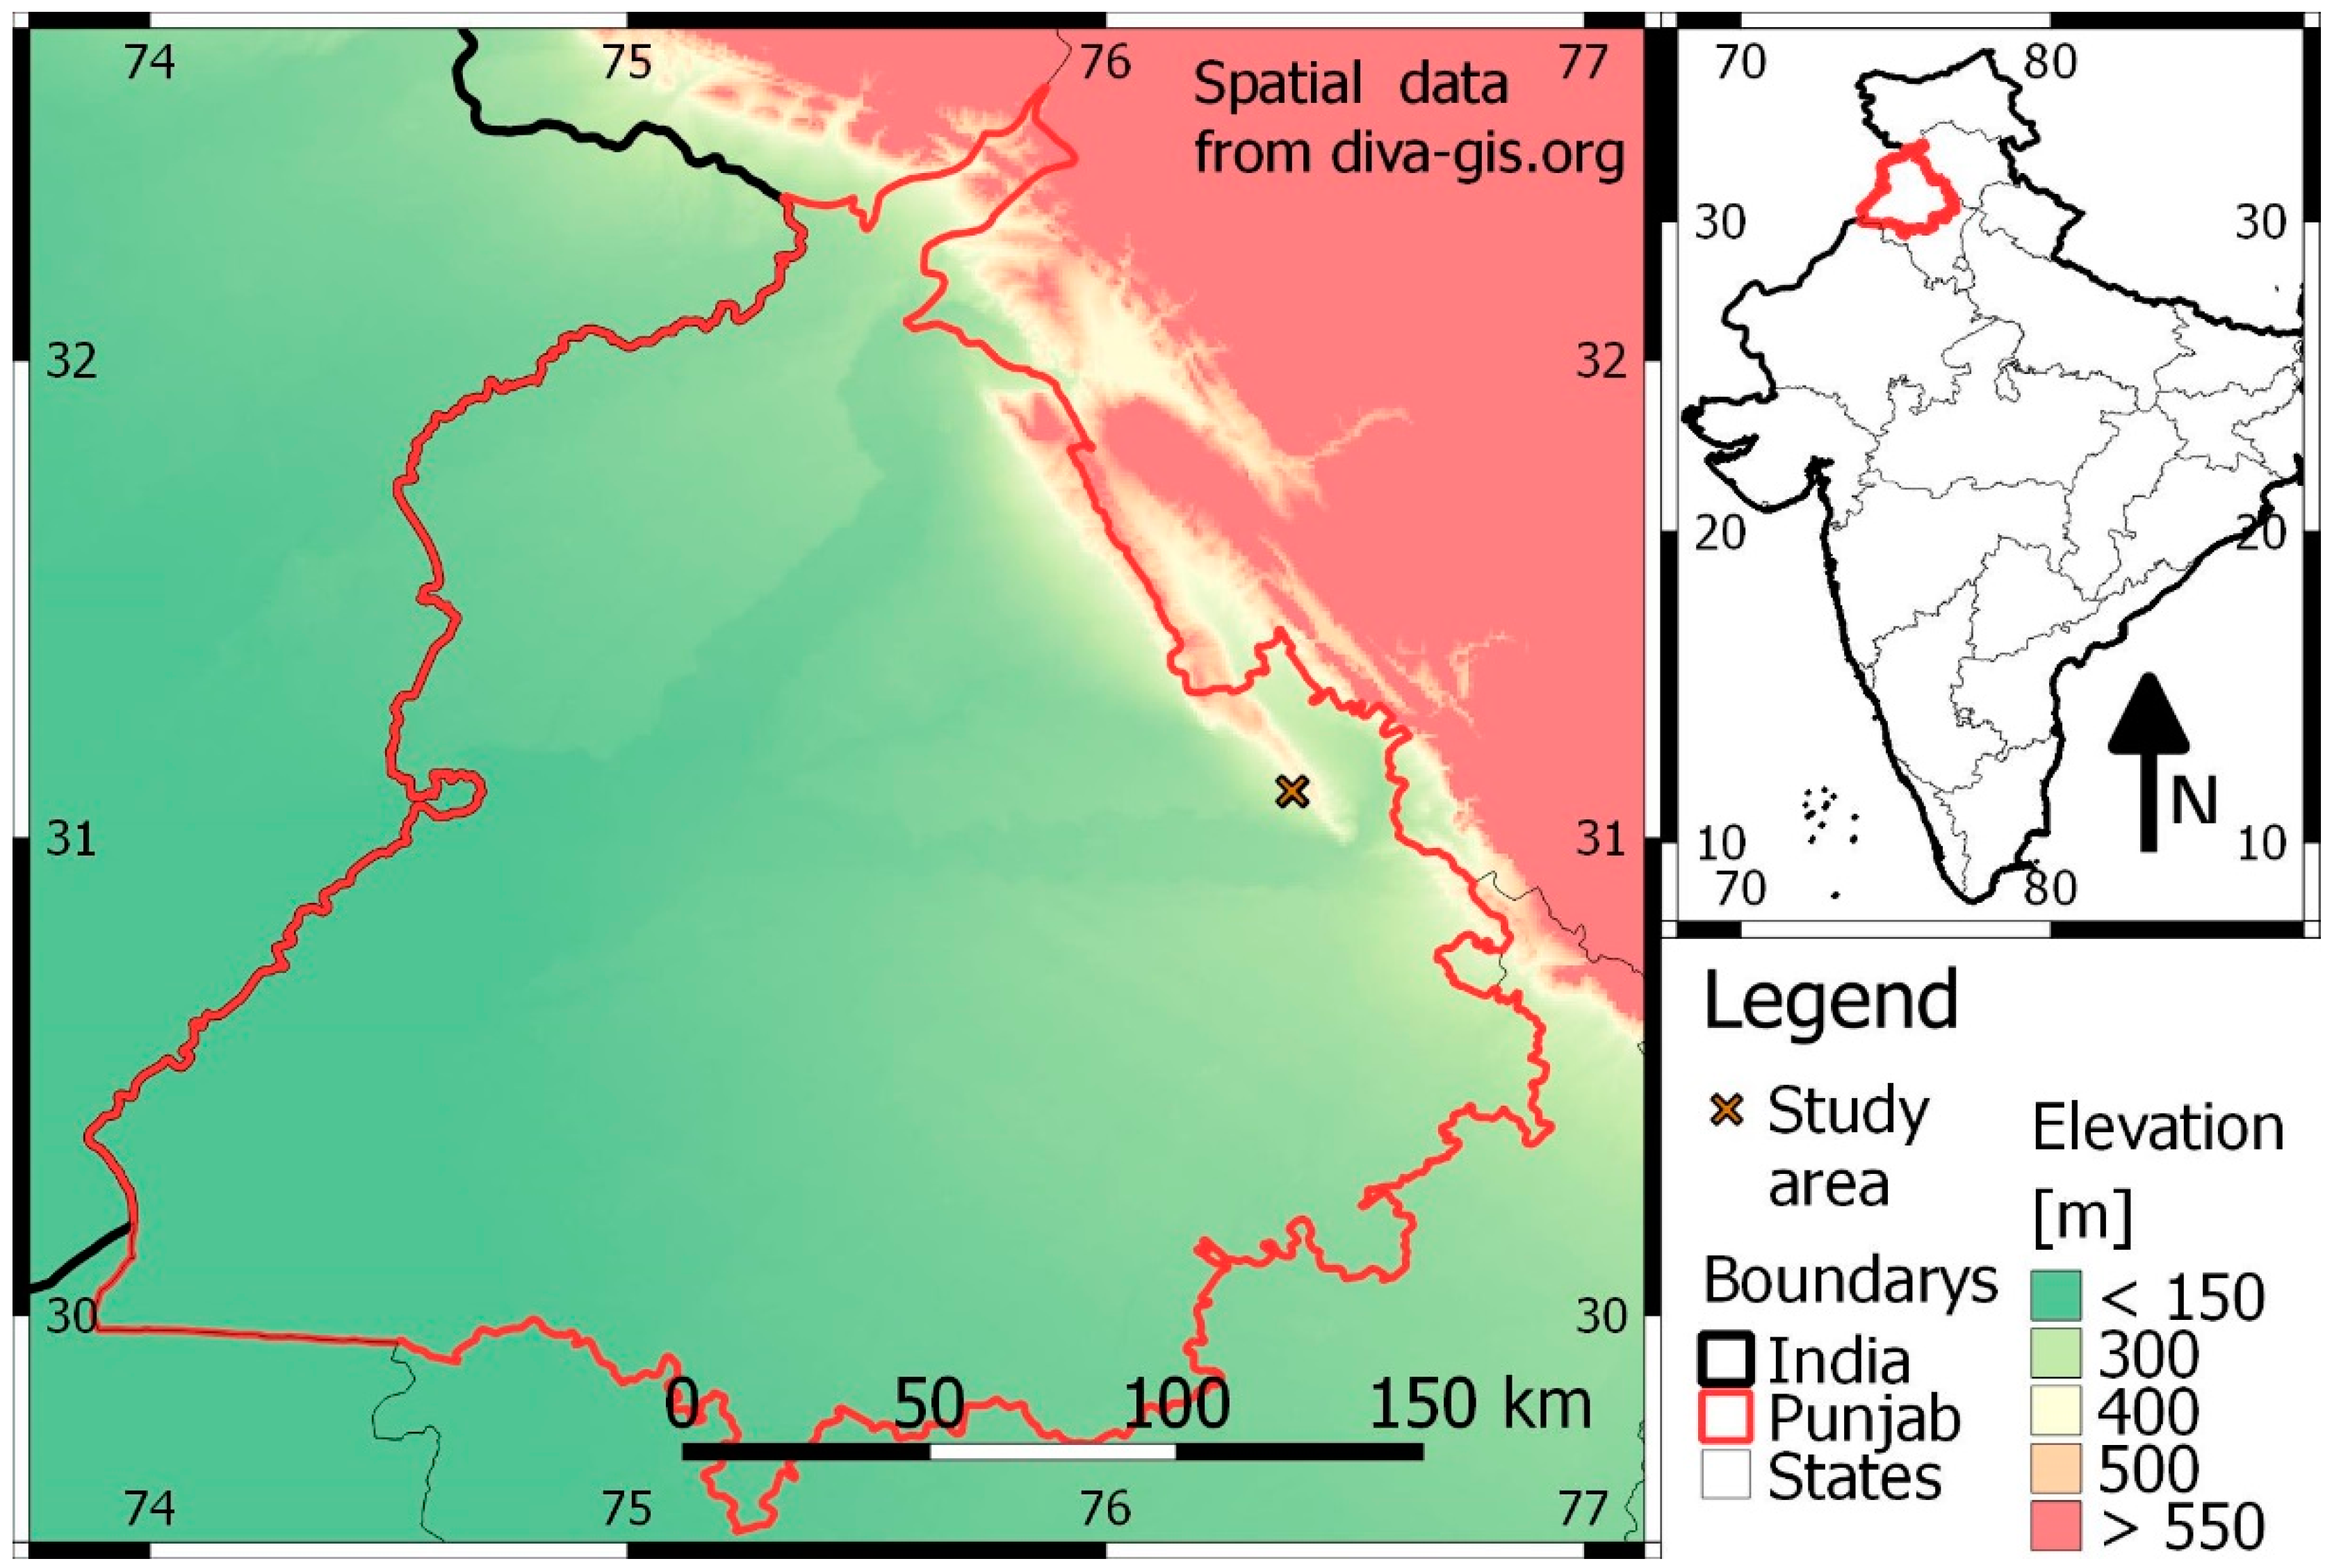
2.1. Study Area

Four rainfall experiments (including dry and wet run) were conducted on the research farm of Regional Research Station (Punjab Agricultural University), Ballowal Saunhkri, located at 76°27′42′′ E and 31°6′24′′ N, 335 m above mean sea level in SBS Nagar district of Punjab (Figure 1). The area receives an average annual rainfall between 800 to 1200 mm. The maximum temperature of about 45 °C is recorded in the month of June and minimum temperature of 1.5 °C is recorded in January. The climate of the region is sub-humid.

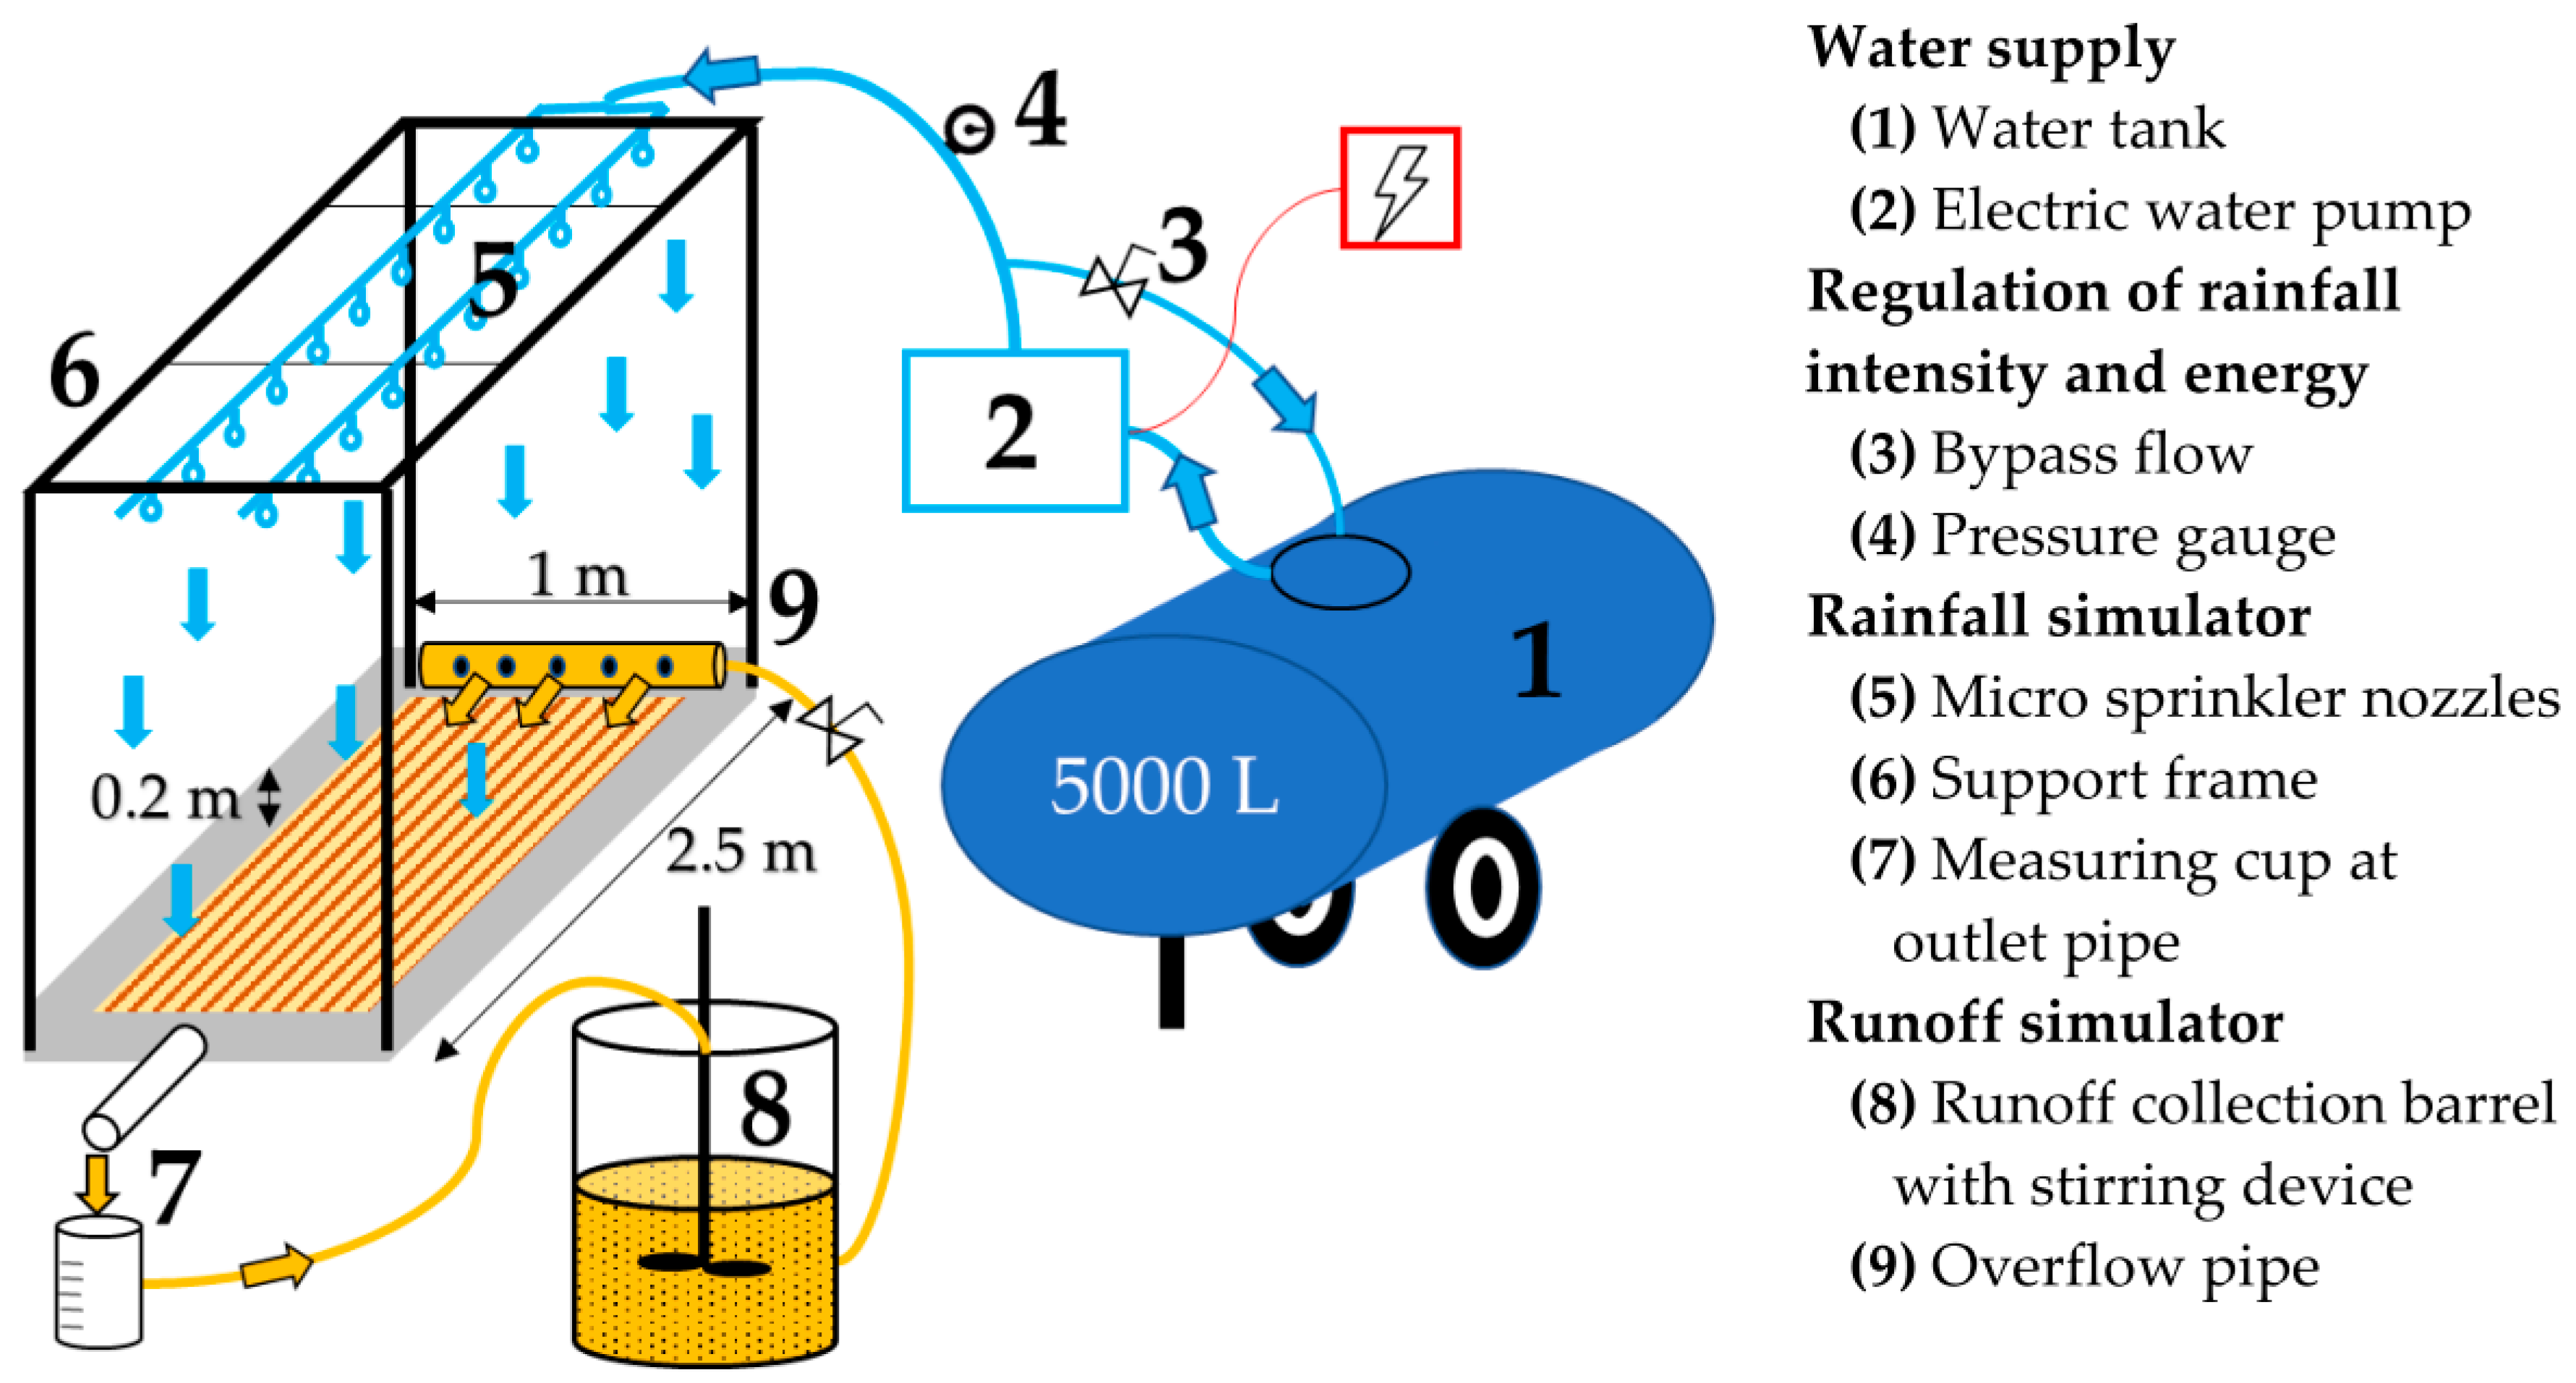
2.2. Rainfall/Runoff Simulator

A rainfall simulator (Figure 2) was available from previous study performed in lower Shivaliks [32]. A plot of 1 m by 2.5 m in direction of highest slope was bounded by plastic sheets set vertically into soil on each test side. A runoff collection pipe was installed at lower end of plot, where runoff could be measured and sampled. Rainfall was simulated with twenty micro sprinkler nozzles attached two meters above plot on a supporting frame. Water was supplied to nozzles by an electric pump from a water tank. Constant water pressure at nozzles over all experiments was calibrated by adjusting bypass flow from a pressure gauge back to water tank prior to experiment. Rainfall intensity was determined at start and end of all experiments by covering plot with a plastic sheet and measuring runoff from this sheet at outlet pipe with a measuring cup.
Runoff water collected at plot outlet was stored in a barrel after measuring of runoff volume in each minute. To simulate greater slope length within limited plot length, additional sediment loaded water from the barrel could be supplied at upper end of plot from an overflow pipe. For even distribution of water over plot width small holes were drilled in this pipe of one-meter length. A small piece of geotextile was attached to the pipe to allow gentle application of water to plot area. This method was introduced on lab scale by Schmidt [34] and validated on a field scale by Schindewolf [33].

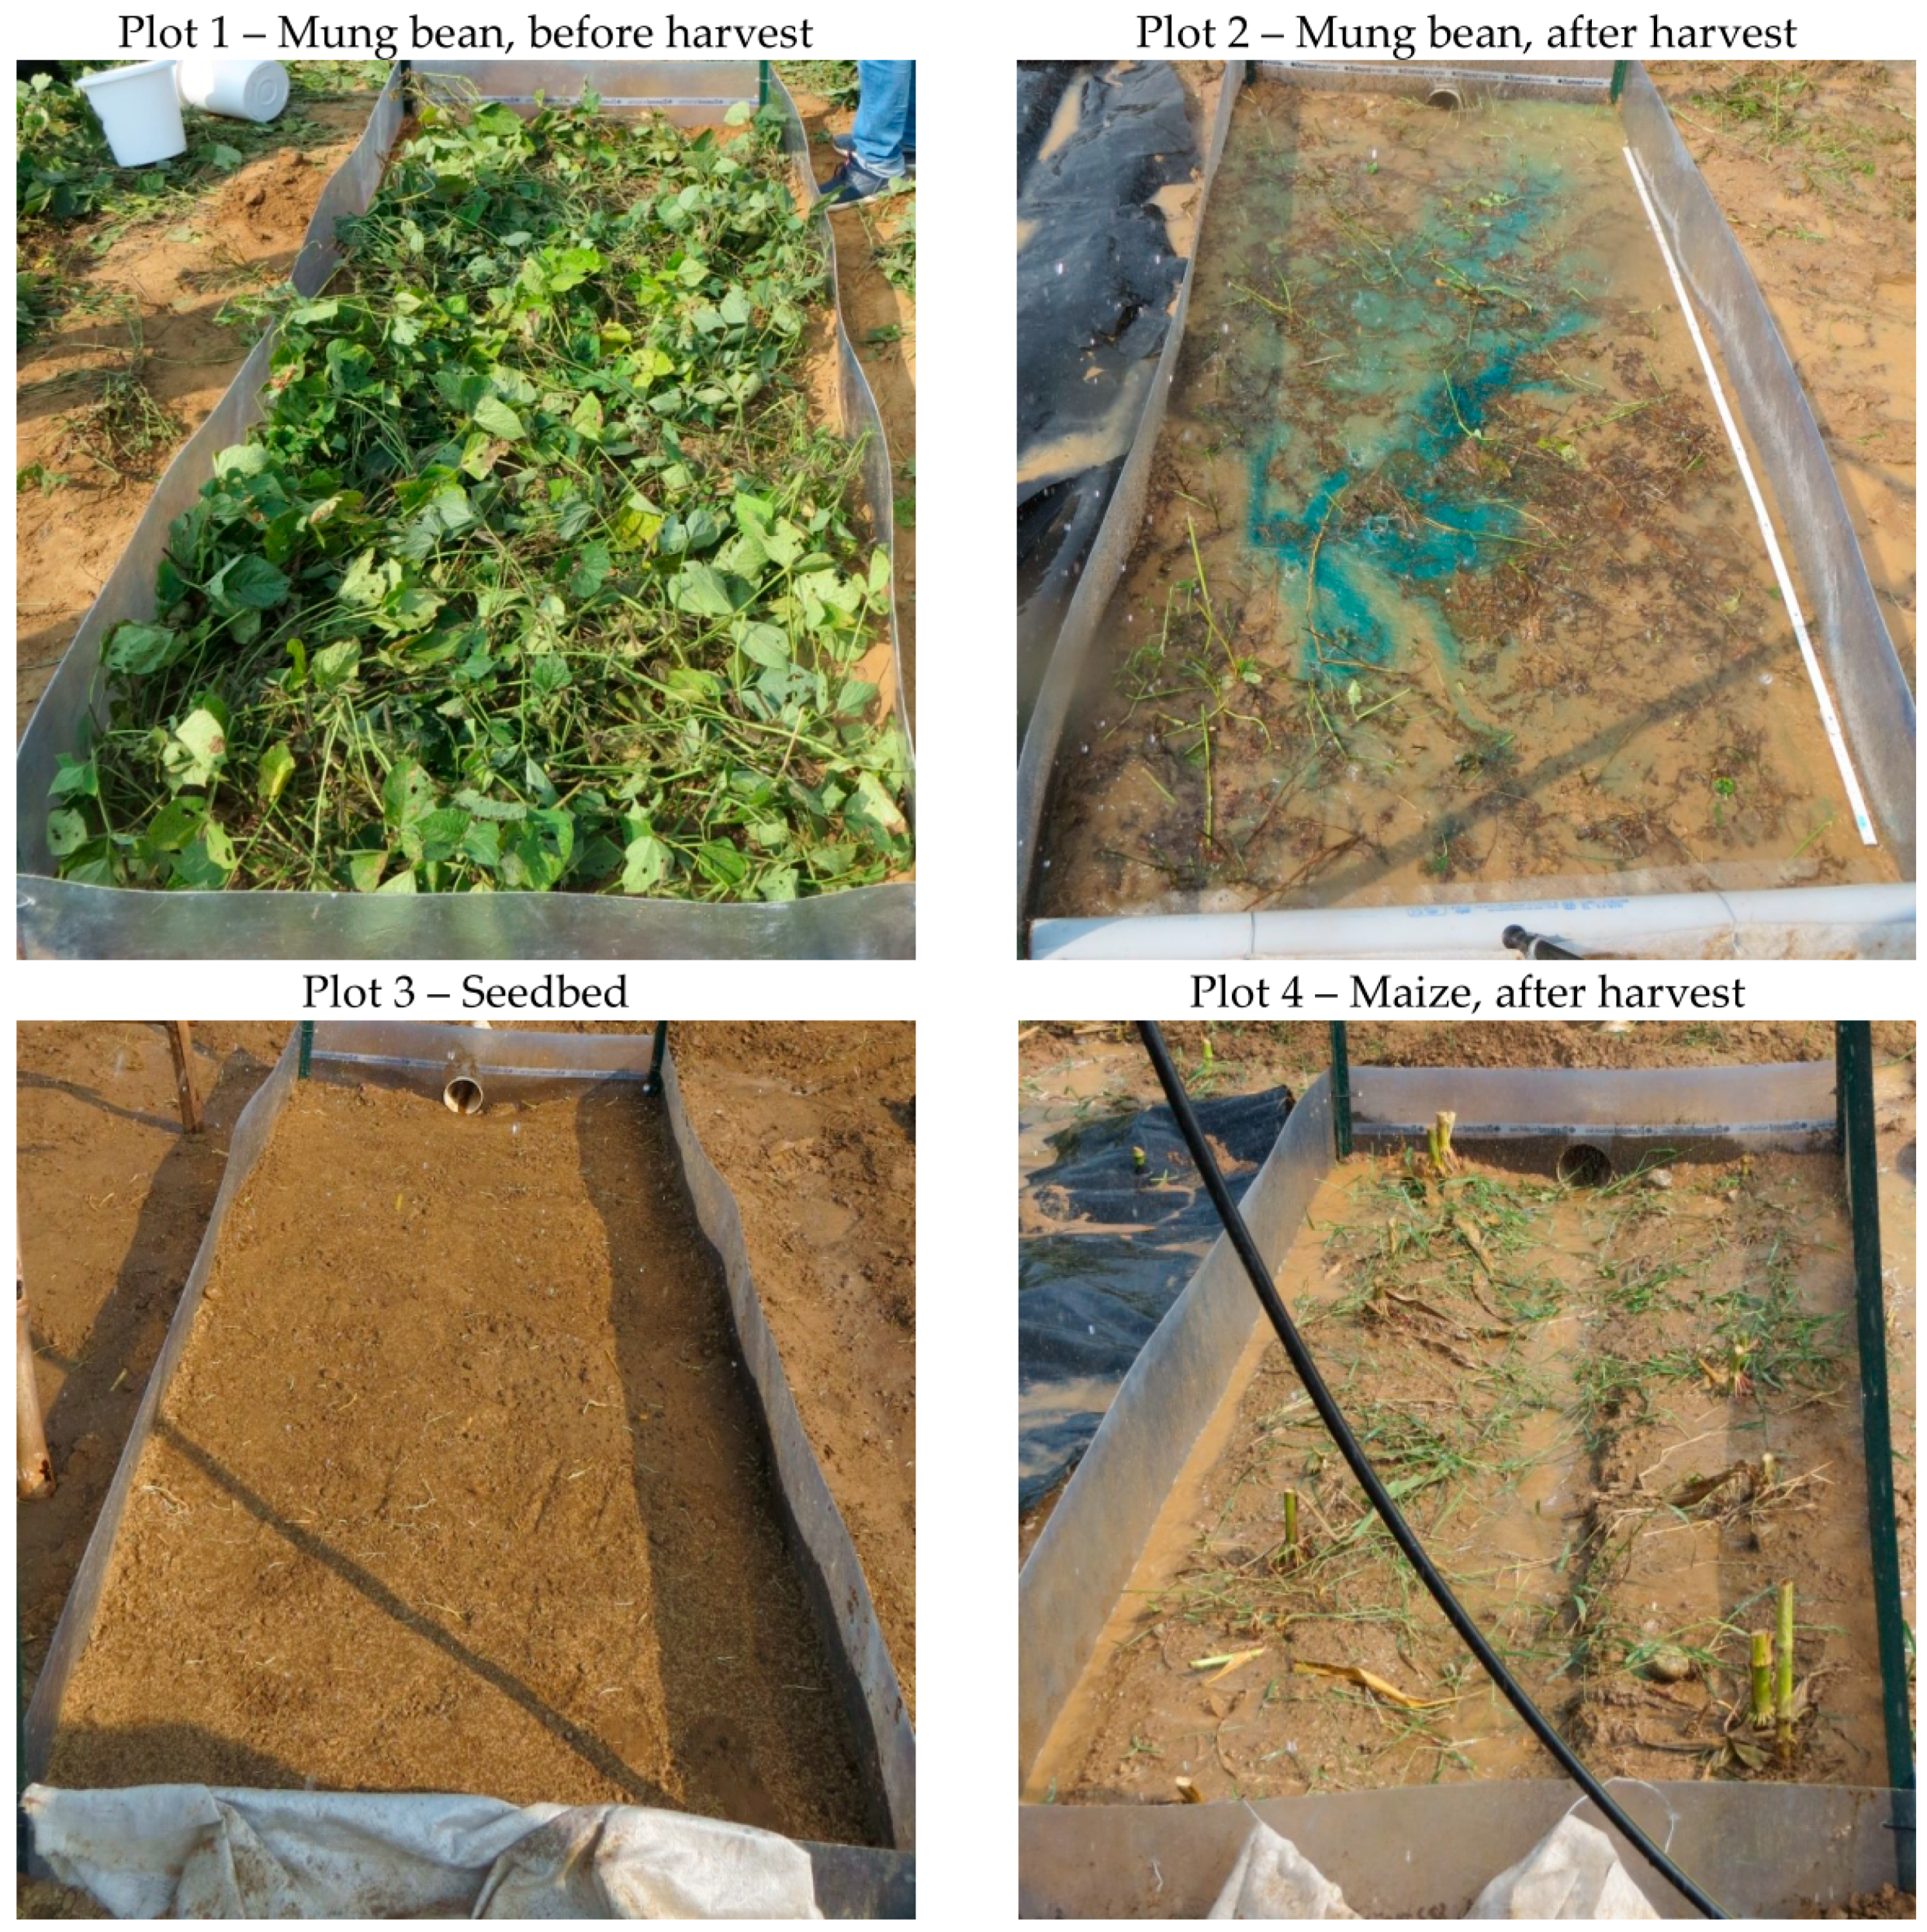
2.3. Experimental Realization

Four different land use conditions were chosen as research plots (Figure 3) on terraced fields. These fields are treated with traditional soil management practices, which are tractor driven ploughing to a depth of 20 cm and planking. Planking is performed by pulling a heavy weight over freshly ploughed field several times, thereby destroying aggregates to develop a thin layer of fine soil on top of soil. When drying, this layer breaks up and acts similar as mulch in conserving soil moisture. In addition to these practices, haloding is conducted on the maize crop, which involves running an inverted plough in one month old maize crop in inter-row spacing of plants [2]. Because of haloding, furrows are created between the plant rows that could be seen on plot 4 during the experiment.
Disturbed soil samples were taken at plot sites, dried at 105 °C and analyzed for total organic carbon by a “multi-EA 2000” (Analytik Jena AG, Jena, Germany) analyzer and soil texture by dry sieving particles larger 63 µm and pipetting smaller particles. A mixed sample was used for plot 1 and 2, because of low distance between these plots. Bulk density and soil moisture (volumetric water content) were analyzed from core sampling cylinders of 284 cm3 and 110 cm3 from a depth of 5 to 10 cm below soil surface. Soil cover was visually estimated in field. Average plot inclination was measured with an inclinometer.
Rainfall sequences including three experimental phases were run on each plot. In first phase "dry run,” constant rainfall was applied on soil with natural moisture conditions. Rainfall intensity was around 1.5 mm/min or 90 mm/h in all experiments, which is comparable to measured peak intensities up to 76 mm/h in 30-min intervals, or up to 120 mm/h in 15-min intervals of extreme natural rainfall events in this region [3]. Runoff was measured every minute until nearly constant runoff occurred for five minutes. Runoff sampling was done every five to ten minutes to measure sediment concentration. In second phase “wet run” was conducted one to two hours after end of dry run using the same procedure. Third phase “overflow” was done immediately after wet run by adding previously collected sediment loaded water through overflow pipe for ten minutes. During overflow phase runoff was sampled and measured every minute and runoff velocity on plot was measured by tracing with brilliant blue.

2.4. Parameter Determination from Experimental Results

EROSION-2D/3D uses a momentum flux based model approach in which particle detachment occurs, when combined momentum flux of surface runoff and droplet impact exceeds soil specific resistance to erosion. Surface roughness is used in calculation of runoff velocity by a Manning equation, which contributes to momentum flux of surface runoff [27]. Excess rainfall is the difference between rainfall intensity and infiltration rate and forms surface runoff. Calculation of infiltration in EROSION-2D/3D is based on a modified Green & Ampt approach assuming a rigid soil matrix, temporal variabilities in soil structure for example, from tillage and crusting (reducing infiltration) or macropores from biological activity or soil shrinking (increasing infiltration) are considered by empirical parameter skin factor [35,36]. Skin factor gets multiplied with saturated hydraulic conductivity, where values less than 1 decrease and greater than 1 increase calculated infiltration rate. If skin factor equals 1 no temporal effects on infiltration process are considered [33,37].
Surface roughness gets calculated by a rearranged Manning’s equation [38],
n = vq−5/3 × qo2/3 × S1/2
in which n is surface roughness according to Manning Strickler [sm−1/3], S is slope inclination [m/m], qo is mean runoff flow rate from overflow phase [m3/(s·m)] and vq runoff velocity [m/s].
Virtual slope length is needed for determination of skin factor and resistance to erosion. It is calculated by equation [33],
vL = qo × L/q
with vL is virtual plot length [m], qo is mean runoff flow rate from overflow phase [m3/(s·m)] and q is runoff flow rate of last minute before overflow phase.
Skin factor is determined by iterative variation in EROSION-2D to match modeled with experimental infiltration rate at end of dry and wet run separately. Resistance to erosion gets iteratively adjusted to match calculated sediment yield to mean measured sediment yield from overflow phase [33].

2.5. Comparative Parameter Estimation for Experimental Conditions

Values for skin factor, surface roughness and resistance to erosion were estimated by three methods for experimental conditions and compared to values determined from experimental results to evaluate estimation methods.
The computer program EROSION-2D includes an option to estimate model parameters from descriptions of soil texture, land use, month, soil treatment, soil moisture, density level of top soil, plant development stage and mulch content [39]. Field crop mung bean was not available in EROSION-2D, so peas were assumed as comparable crop. Months in input do influence soil cover by plants and were chosen to best fit soil cover of experimental plots. Soil conditions used for parameter estimation with EROSION-2D are given in Table 1. In addition to these, plough/seedbed cultivator was chosen as management practice, top soil layer was assumed as consolidated, crop development as mean and 0% for mulch content on all plots. Soil moisture was set to air capacity for dry conditions and field capacity for wet conditions.
A parameter catalogue for EROSION-2D/3D [38] contains tabularized values for resistance to erosion, surface roughness and skin factor. These mean values can be chosen by type of soil and time since last soil treatment, development state of particular crop and soil texture and soil moisture. Where possible similar descriptions as in Table 1 were used for parameter estimation from parameter catalogue.
Michael [41] found empirical transfer functions for calculation of skin factor and resistance to erosion for several textural classes and management practice. Functions for conventional treated, sandy soils are,
E = −0.0074 + 5.2·× 10−6·Bulk + 0.00632·Corg − 0.063·Rough − 3.52 × 10⁻⁴·Cl − 8.2·× 10−5·Si
S = −10.1057 + 0.0048·Bulk + 3.2865·Corg + 0.1487·Moist − 0.2657·Cl − 0.0291·Si
with E is resistance to erosion [N/m2], S is skin factor [-], Bulk is bulk density [kg/m3], Corg is mass of total organic carbon [%], Rough is surface roughness [sm−1/3], Cl is clay content [%], Si is silt content [%] and Moist is soil moisture [%].

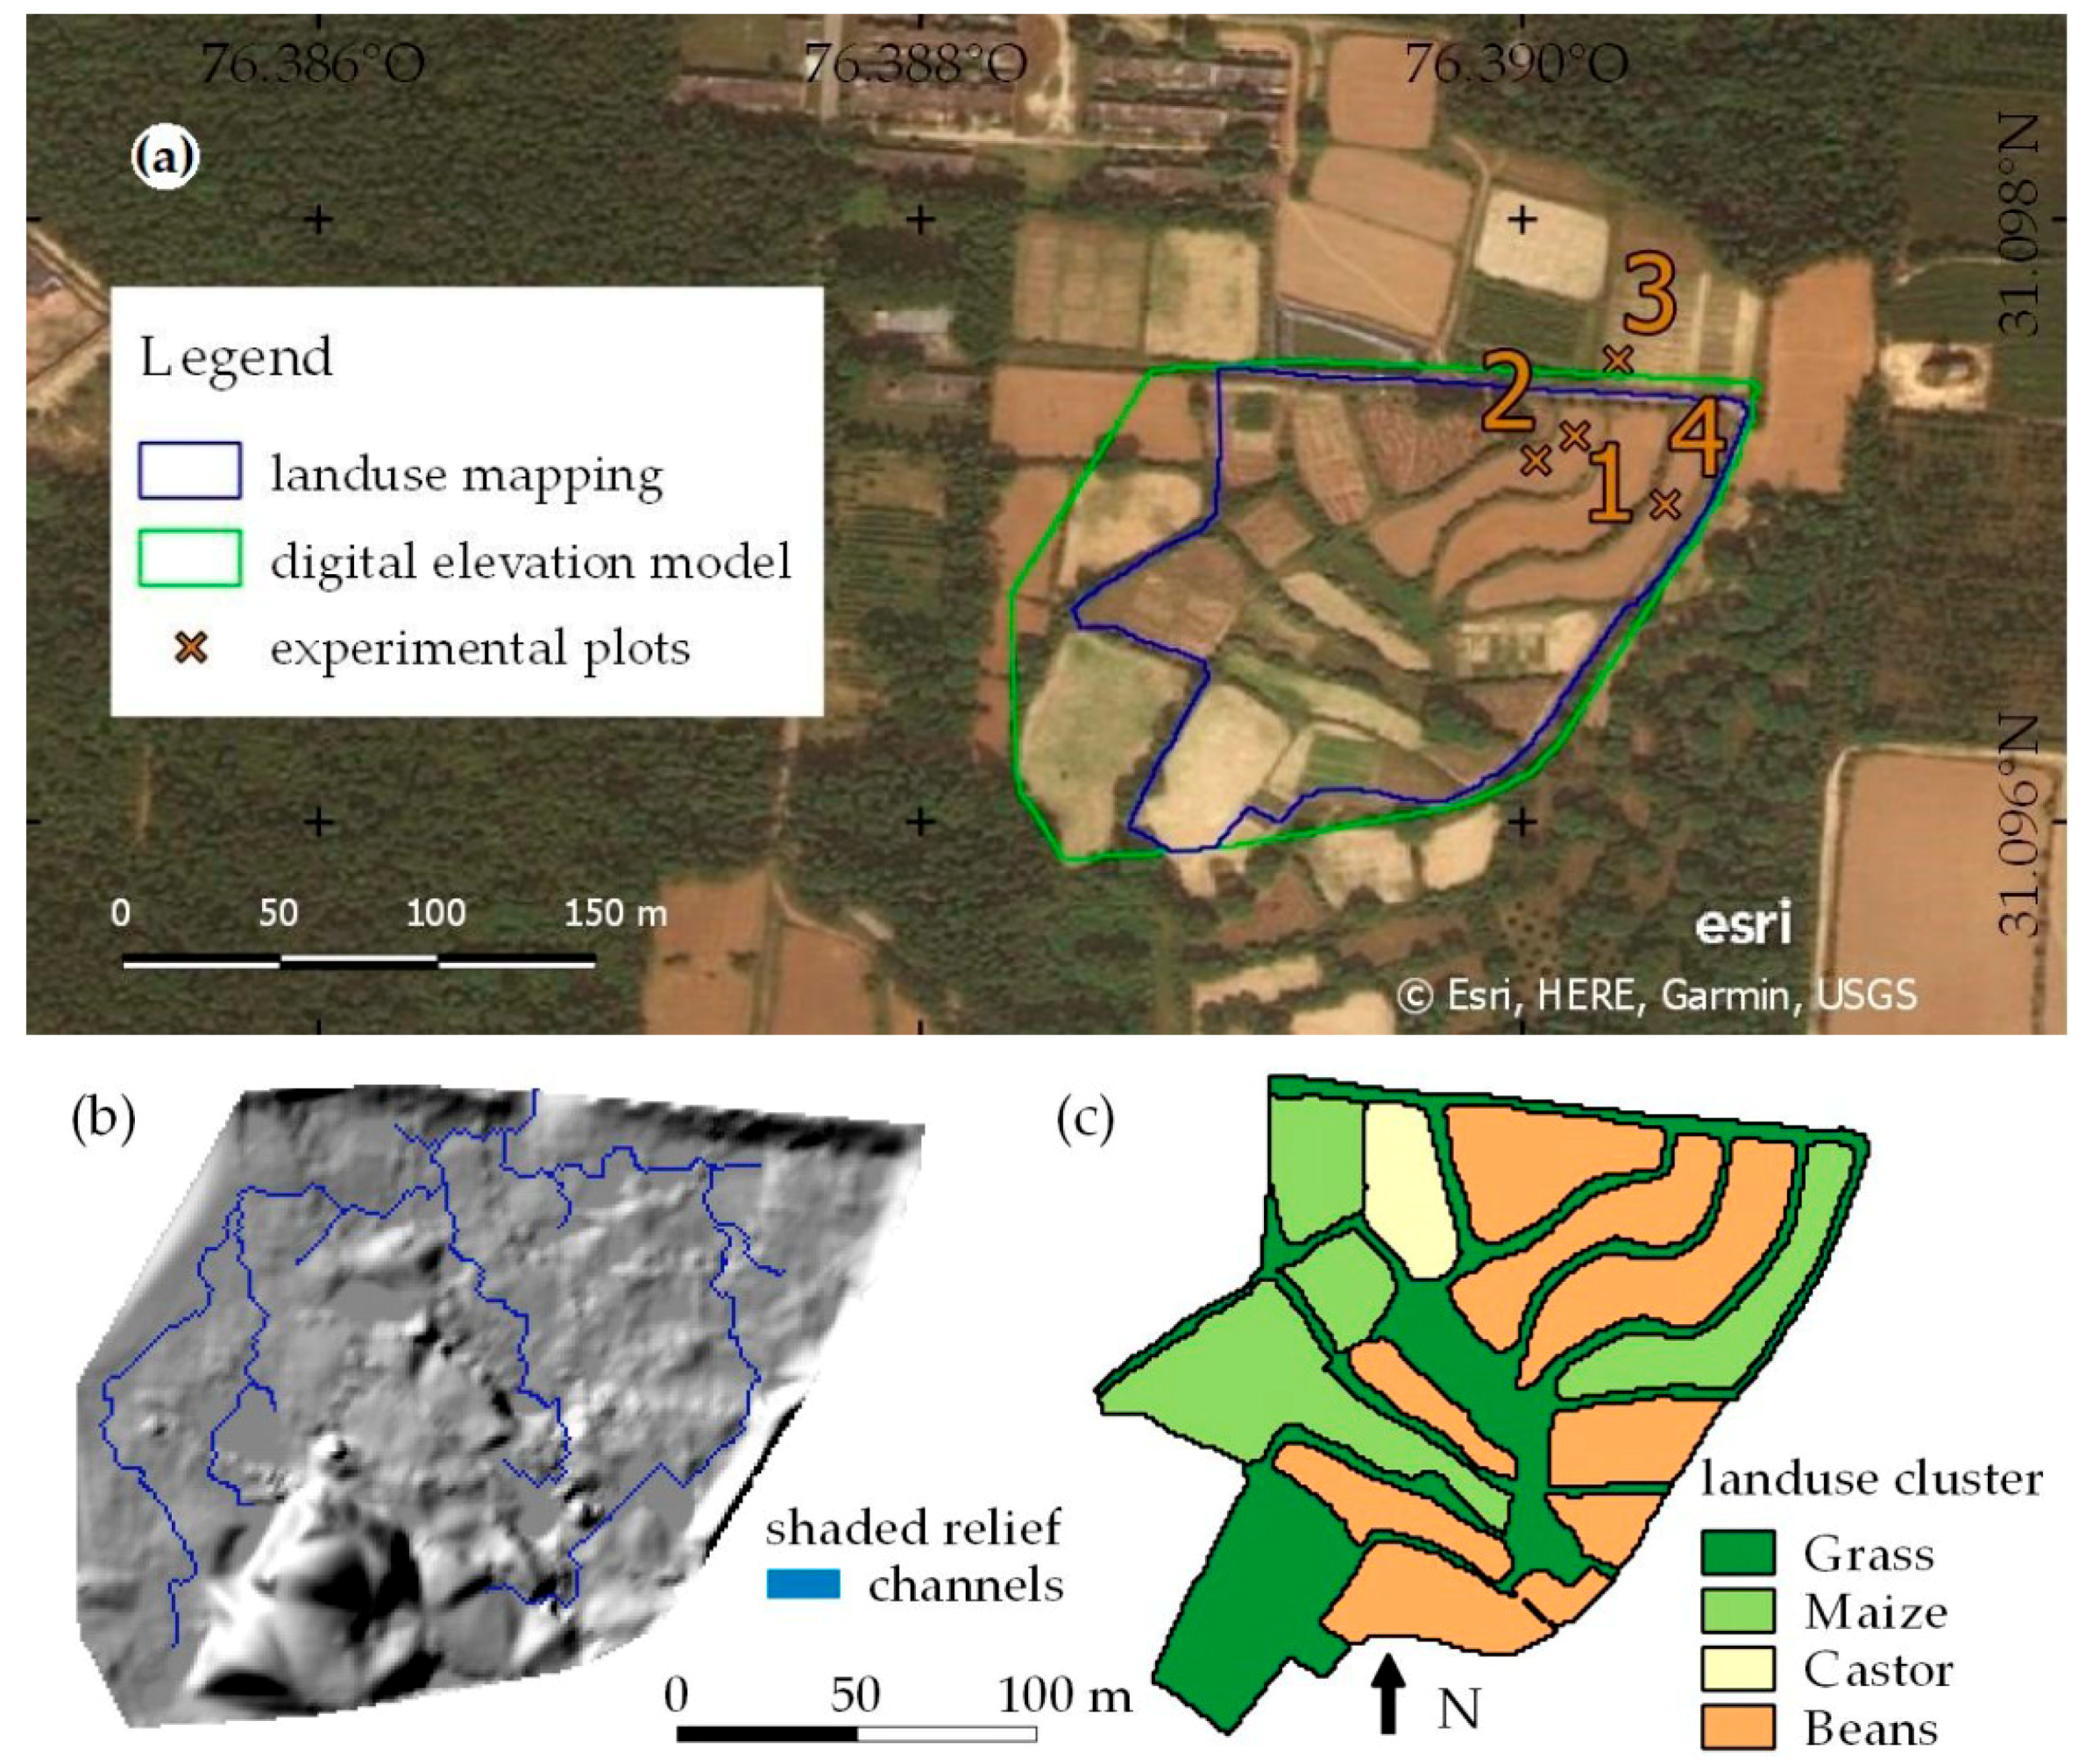
2.6. Parameter Application on Example Watershed

Range of modeling results originating in uncertainties from estimation and determination of skin factor, surface roughness and resistance to erosion is shown in a first modeling of four soil parameter scenarios with EROSION-3D.
A reference scenario (Table 2) was parametrized with most plausible values for surface roughness, skin factor and resistance to erosion from experimental determination for clusters “Beans” and “Maize” and estimation with EROSION-2D for clusters “Grass” and “Castor.” Values for bulk density and soil texture are from soil analysis of plot 2 for clusters “Beans,” “Grass” and “Castor,” values of plot 4 for cluster “Maize.” Values for soil cover and total organic carbon (TOC) are from experimental values for “Beans” and “Maize” and estimated for clusters “Grass” and “Castor.” Soil moisture was set to 25% for mean moisture conditions on all clusters.
Lower values for parameters skin factor, surface roughness and resistance to erosion will increase sediment erosion [41]. Lowest values for these parameters from determination and estimation are used in scenario LowP for clusters “Maize” and “Beans” to show possible range in soil loss prediction resulting from parameter range (Table 3).
To show uncertainties resulting from assumption of initial soil moisture this parameter was set to 30% for scenario M30 and to 20% for scenario M20 while keeping other parameters of reference scenario.
Further input data for EROSION‑3D is a raster DEM, a raster land use map and rainfall data for single rainfall events. Preliminary, unpublished versions of DEM, land use mapping and some hydrological data for a small catchment in lower Shivaliks (~3 ha) were available from an ongoing project [42] (Figure 4). DEM ranging from 335 to 355 m above sea level with a horizontal resolution of 1 m was loaded to EROSION-3D using standard options and setting critical source area (threshold for channel initiation) to 1.000 m2. A recorded event with a total of 80.5 mm rainfall in 280 min and highest intensity of 2.34 mm/min was used in time steps of 5 minutes for simulation. Four land use clusters were selected from preliminary land use map, which contained nine classes in 18 land use units. Land use classes “Bund cover with grass,” “Grass” and “Observatory” were clustered to “Grass” covering 32.7% of mapped land use. “Mash”—vigna mungo, “Moong”—vigna radiata, “Seasame” and “Maize + Cowpea” were clustered to “Beans” covering 38.5%. “Maize” (24.5%) and “Castor”—rizinus communis (4.3%) were assigned with their own clusters. Catchment area not covered by land use mapping (0.95 ha, 29.5% of whole catchment) was assigned to cluster “Grass.”

3. Results

3.1. Soil Analysis Results

Soil analysis showed nearly uniform loamy soils (Table 4) with total organic carbon (TOC) under 1% and high bulk density on all sample points. Slope inclination on terraced fields was overall low.

3.2. Rainfall/Runoff Experiment Results

Progress of rainfall intensity, experimental infiltration rate as difference between rainfall intensity and runoff per m2, calculated infiltration rate from EROSION-2D with Skin factor calibrated to end-infiltration of particular run and measured sediment concentration are shown in Figure 5. Measured values for runoff and sediment concentration can be found in Supplementary Material.
Initial soil moisture at beginning, end-infiltration rates of particular runs, mean runoff velocity, mean sediment concentration and virtual slope length from overflow phase are shown in Table 5.

3.3. Determined and Estimated Model Parameters

Determined and estimated values for surface roughness (Table 6) are nearly similar for plot 1 and 4. Small differences occurred on plot 2 and 3. No value for harvested peas was available from parameter catalogue.
Skin factors determined from experimental wet runs are higher than those from dry runs by one to two orders of magnitude (Table 7). Typical values for skin factors were only available for plot 1 and 3 from parameter catalogue as harvested conditions are not available on sandy soils. Available values are comparable to skin factors determined from dry runs on plot 1 and 3.
EROSION-2D does not differentiate between wet and dry conditions for estimated skin factors. All estimated values lie in between determined values from wet and dry run on all plots.
Transfer functions produce negative values for dry conditions which are obviously wrong. Skin factors calculated with higher initial soil moisture from wet run are three to four times lower than those determined from experiment except for fourth experiment where calculated value is in close range to determined.
Determined and estimated values for resistance to erosion are shown in Table 8. Transfer functions produced negative values which are obviously wrong. Parameter catalogue gives a range for resistance to erosion–values determined from rainfall experiments are in this range for plot 2 and 4. Value determined for plot 1 was two times lower than lowest, for plot 3 two times higher than highest value given in parameter catalogue. Lowest resistance to erosion is determined and estimated on seedbed conditions.

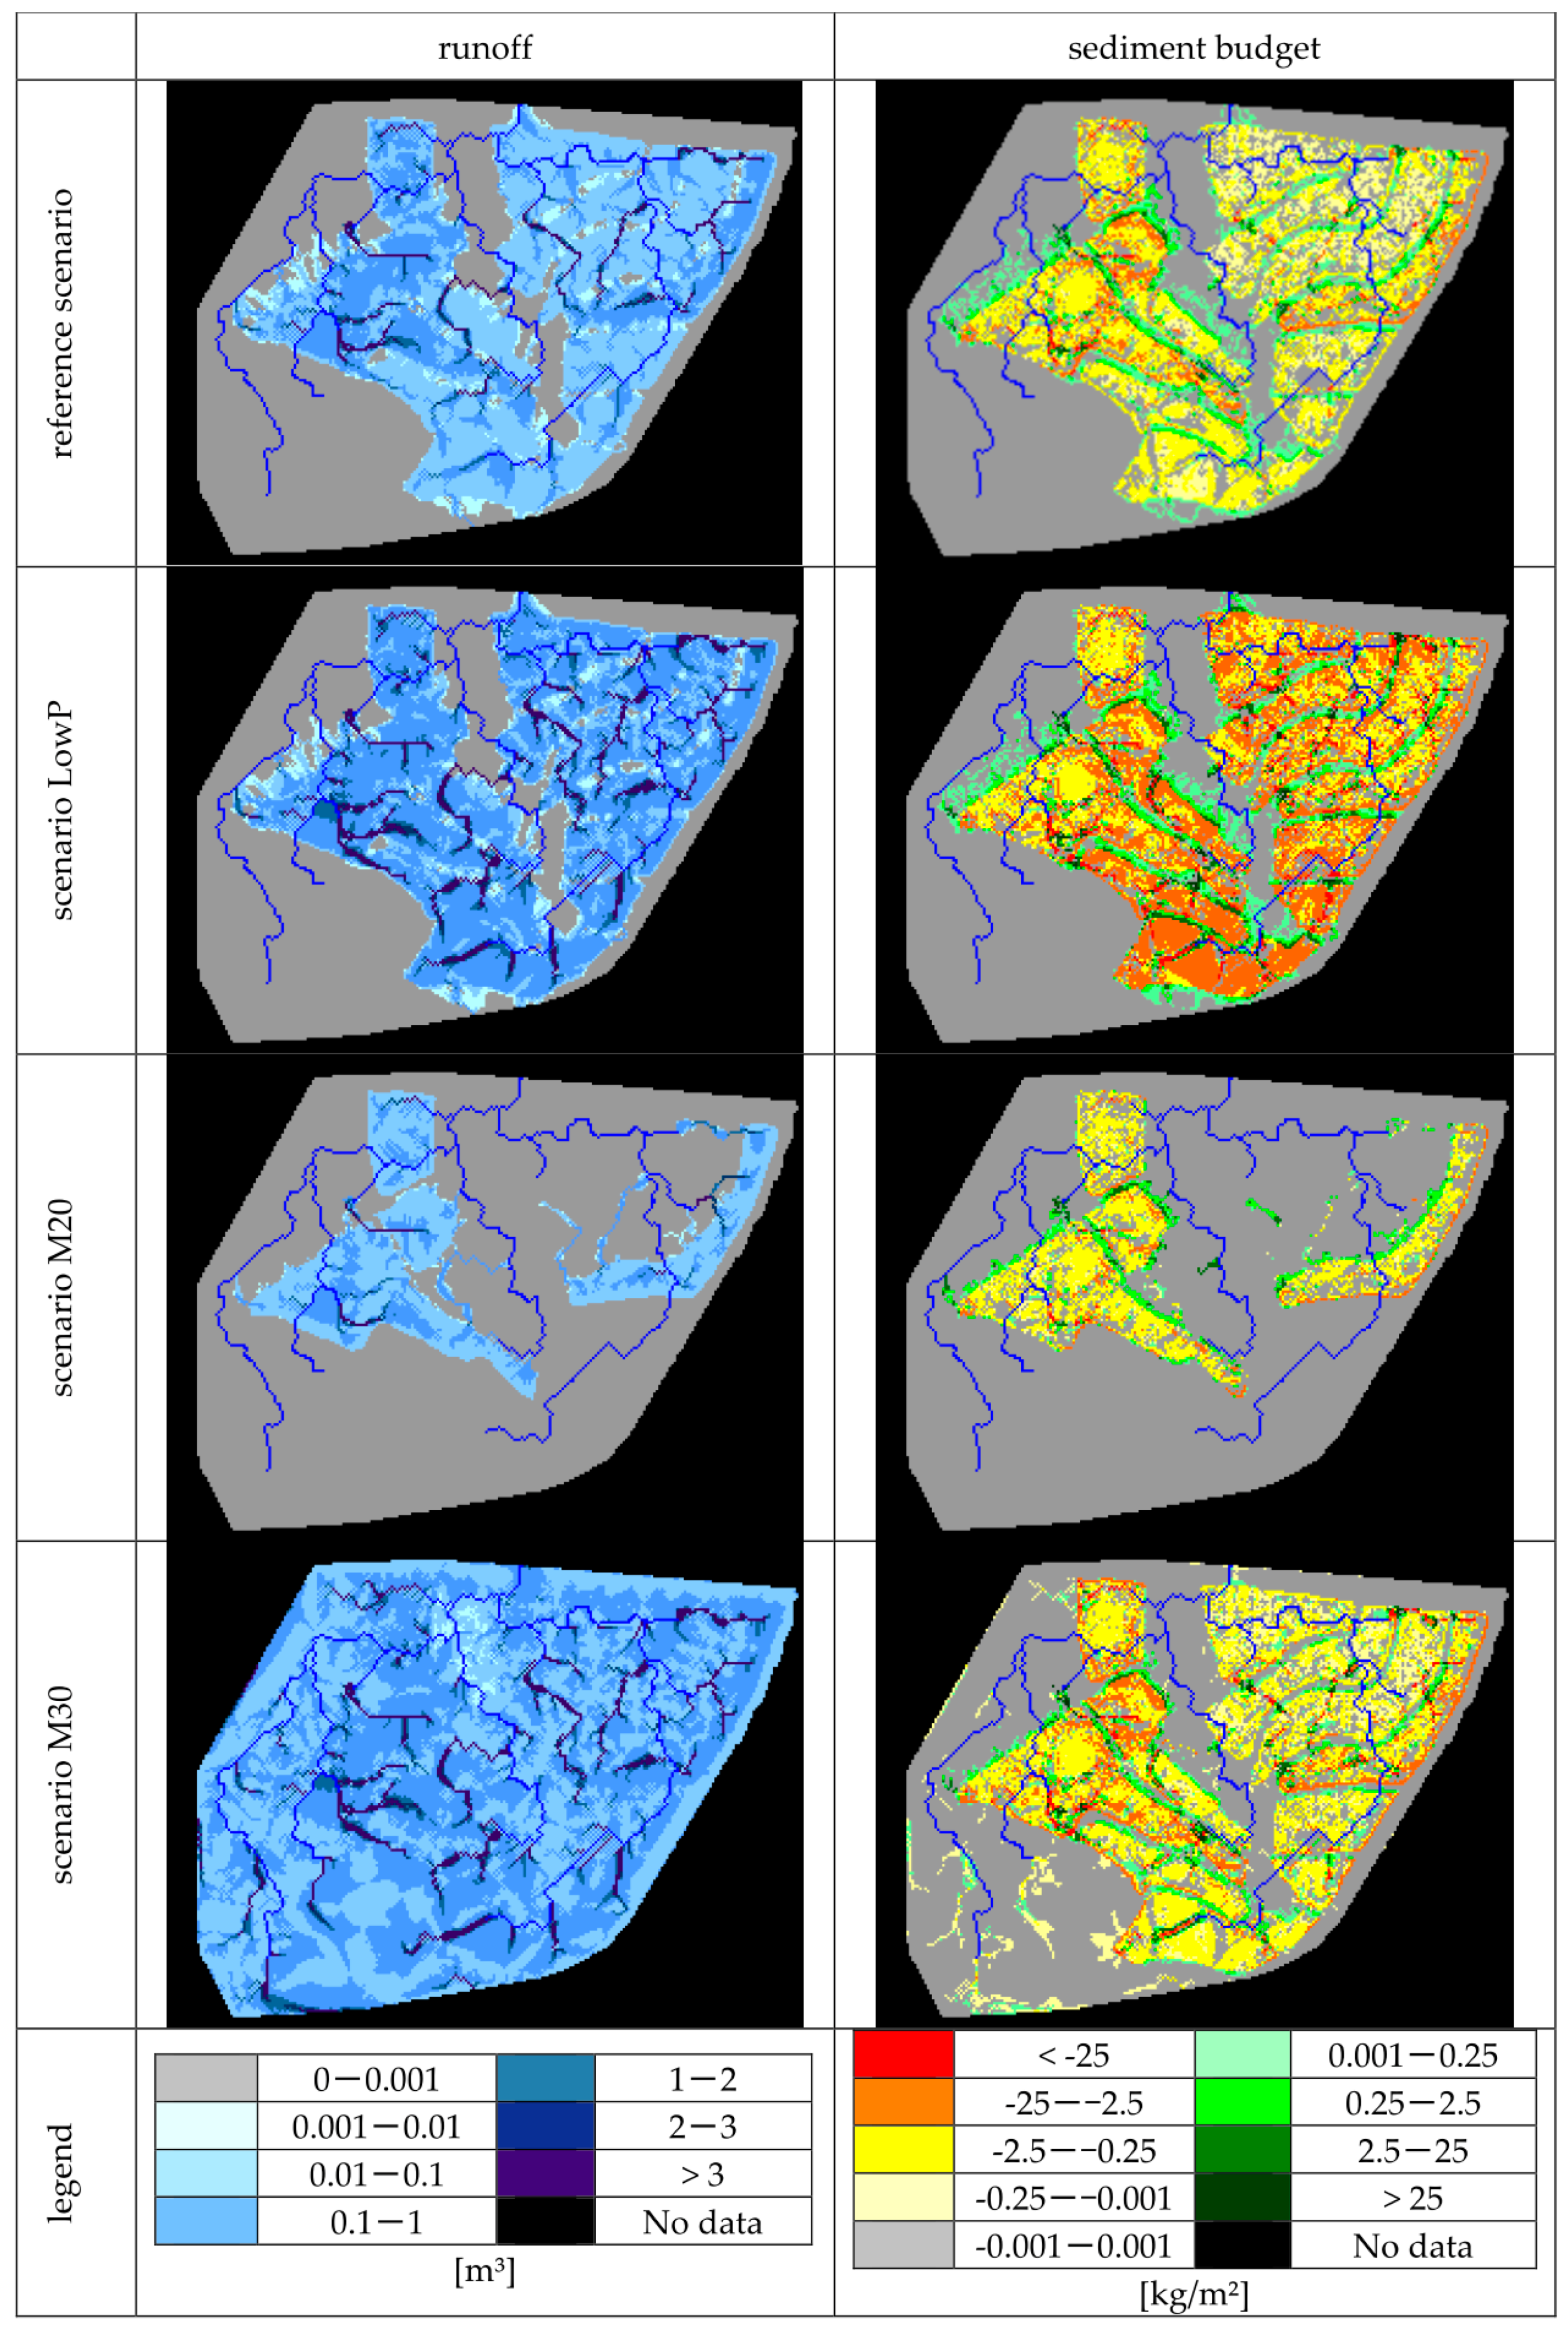
3.4. First Modeling Results

Modeling result maps are shown in Figure 6. Runoff of reference scenario and scenario LowP comes from clusters “Maize” and “Beans,” with higher runoff in scenario LowP. In scenario M30 whole catchment area contributes to runoff, where in scenario M20 runoff comes only from cluster “Maize.” Sediment gets eroded from clusters “Maize” and “Beans” in reference scenario and is partially deposited on clusters “Grass” and “Castor.” Scenario LowP shows higher erosion on “Maize” and “Beans” and greater distribution of deposition areas. In scenario M20 erosion occurs mainly on cluster “Maize, where all clusters in scenario M30 do have areas with soil loss.
Water and sediment from whole catchment area concentrate in last cell of channel network, values from this cell are compared in Table 9 for soil parameter scenarios. Zonal statistics were applied on modelled sediment budget over single land use clusters, mean values for single land use cluster are also compared in Table 9.

4. Discussion

4.1. Soil Analysis and Rainfall/Runoff Simulation

Analyzed values for total organic carbon are comparable to an earlier study on soils of Shivalik mountains. Analyzed bulk densities are higher compared to 1.5 up to 1.65 g/cm3 in the same study, this may result from planking practices and low total organic carbon content, which leads to low aggregate stability [45].
Due to limited resources of this research it was not possible to use a high standard rainfall simulator, the conducted rainfall experiments therefore do not meet the expeditions on rainfall simulations formulated after the International Rainfall Simulator Workshop held in June 2011 in Trier (Germany) [46]. In comparison to this guideline the measurement results of runoff and sediment concentration may get affected because of the following reasons:
  • Drop velocity and drop size spectrum produced by used micro sprinkler nozzles are not studied by now. It can be assumed that final drop velocity is lower than highest possible drop velocity, as drops get sprayed mainly horizontally from the nozzles. This may affect processes like particle detachment, surface sealing and sediment transport.
  • Rainfall intensity was not monitored during experiments. Intensity could be affected by wind, changing pressure provided by electric pump and by failure of single nozzles. Because of high number of nozzles (20) a failure of a single nozzle may not be noticed.
  • Rainfall water quality (temperature, electric conductivity and ionic content) was not measured.
  • A pipe was used at lower end of plot for runoff collecting instead of a Gerlach trough. This may lead to increased sediment detachment at plot outlet.
In addition to these a further constraint may affect measurement results—a small furrow had to be dug at each side of plot for setup of plastic plot frame. Boundary effects (approximately 3 cm inside plot) influencing infiltration process and sediment concentration in runoff are likely higher compared to metal plot frames of the same dimensions which get hammered into soil.
Beside these constraints results of conducted rainfall/runoff experiments are consistent among themselves and overall reasonable, except sediment concentrations measured on plots 1 and 2. Sediment concentration on plot 2 is clearly lower than on plot 1, which is unexpected, as soil and management conditions are same on both plots except for soil cover by plants and lower plant cover often leads to higher sediment concentration in runoff [41]. Unseen small-scale heterogeneities - like surface crusting—may have contributed to this observation but cannot be confirmed without further research. Slower increase of measured runoff on plot 2 in comparison to plot 1 is very likely due to missing water interception by plants on this plot. End infiltration of dry run on first plot is notably higher than in following wet run, which may result from a too early stop of rainfall experiment. End-infiltration rates of wet runs are near 0.3 mm/min on both plots regardless of previous water retention.
Highest sediment concentration in runoff occurred on plot three on seedbed conditions with loose small soil particles. End-infiltration rate on this plot was comparable to plots 1 and 2.
End-infiltration rate on plot 4 (0.15 mm/min) was half of end-infiltration rates on other plots. This observation may be a result from surface crusting or a reduced effective infiltration area, due to water running preferentially in ditches between plant rows on this plot. Sediment concentration was in between concentrations from seedbed (3) and mung bean plots (1 and 2).

4.2. Comparison of Determined and Estimated Parameters

The impact of described technical constraints on parameters determined from experimental results is seen as negligible for surface roughness and resistance to erosion, as these were determined from measurements of overflow phase, where additional runoff water reduces the influence of applied rainfall characteristics on flow velocity, sediment detachment and transport [33]. The impact on determination of skin factor may be relevant, as this parameter gets determined from infiltration rate under steady state conditions without added runoff water, where effects like soil sealing may still be present.
Estimated values for surface roughness are comparable to values determined from experiments, therefore applied estimation methods for this parameter are seen reasonable for conditions of Shivalik mountains.
Values estimated by EROSION-2D and parameter catalogue for skin factor are within high range of experimentally determined skin factors. This high range of determined values may result from described effect of technical constraints or also from very low initial water content before dry run. In very dry soils air can get entrapped and compressed by infiltrating water which results in lower infiltration rates until air escapes. Lower infiltration rates then cause lower skin factors in dry runs. An extension with an additional parameter describing air trapping effect is currently developed for EROSION-2/3D [47]. A relation between skin factor and initial water content was seen by Schindewolf [48] but is not yet implemented as estimation method for skin factor. By now no final conclusions on applicability of estimation methods for skin factor can be drawn, except transfer function, where negative values clearly indicate that these functions are not applicable on experimental soil conditions. Physically based runoff/infiltration models, like ROMO-2D which was calibrated for a Shivalik catchment [49], could be used to model input infiltration capacity for EROSION-3D or for further calibration of skin factor.
Experimentally determined value for resistance to erosion for plot 1 is one order of magnitude lower than for plot 2 which results from higher sediment concentration in runoff and shorter virtual slope length. On plots 2 to 4 determined values are in very close range to values estimated by EROSION-2D and parameter catalogue. Transfer function produced negative values and are therefore not applicable.
Selection of comparable input conditions for parameter estimation by EROSION-2D and by parameter catalogue is subjective and therefore other users of these methods may estimate different values for model parameters.

4.3. First Modeling

Total runoff from example catchment of recorded rainfall event was estimated to 355 m3 (14% runoff coefficient) from water level recording at watershed outlet [42]. Reference scenario comes closest to this estimation. Scenario LowP shows great influence of skin factor on modeled runoff. Sediment yield from catchments show moderate increase with increasing runoff on cluster “Maize” and very high increase with reduced resistance to erosion and surface roughness on cluster “Beans.” As higher values of this parameters are in closer range to estimated, these are more plausible. A verification of this assumption is not possible from available data. Scenarios M20 and M30 show great sensitivity of runoff and sediment yield on initial soil moisture, where higher values for initial soil moisture increase calculated runoff and sediment loss. The hypothetically assignation of catchment area with unknown land use (29.5%) to cluster “Grass” introduces uncertainties to modelling results on catchment scale, as “Grass” contributes less to runoff and sediment loss than “Maize” or “Beans”.
These four scenarios with experimentally determined respectively estimated parameters show great influence of initial soil moisture, skin factor and resistance to erosion on modeling results. Knowledge of initial soil moisture conditions for recorded rainfall events is therefore essentially for validation modeling, as this parameter is highly time dependent. The DEM used in this study is of better resolution (1 m) than freely accessible DEMs (up to 30 m) [50]. Uncertainties might be introduced when applying EROSION-3D to catchments using free DEMs without previous topographic survey. A verification of flow paths calculated by EROSION-3D from DEM within catchment should be done, depending on modeling purpose. As part of the ongoing international cooperation project “Decentralized erosion prevention for selected rain water retention measures in Punjab, India” between German Society for International Cooperation, Punjab Agricultural University and IPROconsult (2016–2019) further extensive data for validation of parametrization and modeling results will be expected. This includes monitoring of soil moisture at representative points in catchment, measuring of sediment concentration in runoff samples as well as recording of rainfall intensity and runoff volume from natural rainfall events.

5. Conclusions

This study compared estimated values of model parameter for EROSION-3D to values determined from rainfall simulations for soils found at RRS Ballowal Saunkhri in lower Shivaliks. It indicates that parameter estimation methods parameter catalogue and EROSION-2D can be applied to estimate surface roughness and resistance to erosion, whereas estimation of skin factor was not reasonable. The latter may be affected by unconsidered infiltration processes or technical constraints of used rainfall simulator and may be solved by using alternative infiltration models calibrated for Shivalik mountains in further studies.
Further validation of estimation methods needs to be done, for example, by watershed modeling with EROSION-3D using measured initial soil moisture at representative points and runoff volume and sediment concentration at (sub-)catchment outlets, to reduce high material and work effort coupled with sophisticated rainfall/runoff experiments.

Supplementary Materials

The protocolized measurement values from rainfall experiments are available online at https://www.mdpi.com/2076-3263/8/11/396/s1.

Author Contributions

Conceptualization, K.H., M.J.S. and J.S.; Methodology, J.L., A.Y., M.S., M.v.W., K.H. and M.J.S.; Software, M.v.W.; Formal Analysis, J.L.; Investigation, J.L., A.Y., M.S., M.v.W., K.H. and M.J.S.; Resources, J.L., A.Y., M.v.W., K.H., and M.J.S.; Data Curation, J.L. and A.Y.; Writing—Original Draft Preparation, J.L.; Writing—Review & Editing, J.L., A.Y., M.S., M.v.W., K.H., M.J.S. and J.S.; Visualization, J.L.; Supervision, M.S., M.v.W., K.H., M.J.S. and J.S.; Project Administration, K.H.; Funding Acquisition, K.H.

Funding

In the context of the ongoing develoPPP.de Project “Decentralized erosion prevention for selected rain water retention measures in Punjab, India” (2016–2019) this research was funded by both GIZ (German Society for International Cooperation ) and IPROconsult GmbH. It is conducted and implemented by the Punjab Agriculture University, IPROconsult GmbH and the GIZ (German Society for International Cooperation).

Acknowledgments

The following software was used in preparation of this paper: RStudio using package raster, Qgis, ArcMap10, EROSION-2D, EROSION-3D. We want to thank the anonymous reviewers for their valuable comments on the manuscript.

Conflicts of Interest

The authors declare no conflict of interest.

References

  1. Hamilton, A.P.F. Siwalik Erosion. Available online: https://www.himalayanclub.org/hj/07/9/siwalik-erosion/ (accessed on 30 October 2018).
  2. Kukal, S.S.; Singh, M.J.; Bawa, S.S. An Appraisal of the Indigenious Technology for Soil and Water Conservation on Lower Shiwaliks—Research Bulletin 2014/3; Department of Soil Science, Punjab Agricultural University: Ludhiana, India, 2014. [Google Scholar]
  3. Singh, M.J.; Khera, K.L. Nomographic estimation and evaluation of soil erodibility under simulated and natural rainfall conditions. Land Degrad. Dev. 2009, 20, 471–480. [Google Scholar] [CrossRef]
  4. Jerath, N.; Ladhar, S.S.; Kaur, S.; Sharma, V.; Saile, P.; Tripathi, P.; Bhattacharya, S.; Parwana, H.K. Punjab State Action Plan on Climate Change. Available online: http://www.moef.nic.in/sites/default/files/sapcc/Punjab.pdf (accessed on 25 October 2018).
  5. Singh, M.J.; Yousuf, A.; Sharma, S.C.; Bawa, S.S.; Khokhar, A.; Sharma, V.; Kumar, V.; Singh, S.; Singh, S. Evaluation of vegetative barriers for runoff, soil loss and crop productivity in Kandi region of Punjab. J. Soil Water Conserv. 2017, 16, 325–332. [Google Scholar] [CrossRef]
  6. Kukal, S.S.; Sur, H.S. Soil erosion hazards in the foothills of lower Shiwaliks. Indian Soc. of Soil Sci. 1992, 40, 162–167. [Google Scholar]
  7. Bhardwaj, A.; Rana, D.S. Torrent control measures in Kandi area of Punjab—A case study. J. Water Manag. 2008, 16, 55–63. [Google Scholar]
  8. Bhatt, V.K.; Tiwari, A.K.; Bhattacharyya, P. Estimation of sediment yield from forest micro-watershed of Shivalik region. Indian J. Soil Conserv. 2012, 40, 207–211. [Google Scholar]
  9. Bhardwaj, A.; Kaushal, M.P. Two-dimensional physically based finite element runoff model for small agricultural watersheds: II. Model testing and field application. Hydrol. Process. 2009, 23, 408–418. [Google Scholar] [CrossRef]
  10. Yousuf, A.; Bhardwaj, A.; Tiwari, A.K.; Bhatt, V.K. Simulation of runoff and sediment yield from a forest micro watershed in Shivalik foothills using WEPP Model. Indian J. Soil Conserv. 2017, 45, 21–27. [Google Scholar]
  11. Yousuf, A.; Singh, M.J. Runoff and soil loss estimation using hydrological models, remote sensing and GIS in Shivalik foothills: A review. J. Soil Water Conserv. 2016, 15, 205–210. [Google Scholar] [CrossRef]
  12. Kumar, S.; Kushwaha, S.P.S. Modelling soil erosion risk based on RUSLE-3D using GIS in a Shivalik sub-watershed. J. Earth Syst. Sci. 2013, 122, 389–398. [Google Scholar] [CrossRef]
  13. Swarnkar, S.; Malini, A.; Tripathi, S.; Sinha, R. Assessment of uncertainties in soil erosion and sediment yield estimates at ungauged basins: An application to the Garra River basin, India. Hydrol. Earth Syst. Sci. 2018, 22, 2471–2485. [Google Scholar] [CrossRef]
  14. Thomas, J.; Joseph, S.; Thrivikramji, K.P. Estimation of soil erosion in a rain shadow river basin in the southern Western Ghats, India using RUSLE and transport limited sediment delivery function. Int. Soil Water Conserv. Res. 2018, 6, 111–122. [Google Scholar] [CrossRef]
  15. Thomas, J.; Joseph, S.; Thrivikramji, K.P. Assessment of soil erosion in a tropical mountain river basin of the southern Western Ghats, India using RUSLE and GIS. Geosci. Front. 2018, 9, 893–906. [Google Scholar] [CrossRef]
  16. Thomas, J.; Joseph, S.; Thrivikramji, K.P. Assessment of soil erosion in a monsoon-dominated mountain river basin in India using RUSLE-SDR and AHP. Hydrol. Sci. J. 2018, 63, 542–560. [Google Scholar] [CrossRef]
  17. Chanu, S.; Thomas, A.; Kumar, P. Estimation of curve number and runoff of a micro-watershed using soil conservation service method. J. Soil Water Conserv. 2015, 14, 317–325. [Google Scholar]
  18. Mishra, S.S. Rainfall analysis and design of water harvesting structure in water scarce Himalayan hilly regions. Int. J. Civ. Struct. Eng. 2014, 5, 29–41. [Google Scholar] [CrossRef]
  19. Jasrotia, A.S.; Singh, R. Modeling runoff and soil erosion in a catchment area, using the GIS, in the Himalayan region, India. Environ. Geol. 2006, 51, 29–37. [Google Scholar] [CrossRef]
  20. Kumar, S.; Harjadi, B.; Patel, N.R. Modeling Approach in Soil Erosion Risk Assessment and Conservation Planning in Hilly Watershed Using Remote Sensing and GIS. Available online: http://citeseerx.ist.psu.edu/viewdoc/download?doi=10.1.1.589.3821&rep=rep1&type=pdf (accessed on 25 October 2018).
  21. Mondal, A.; Khare, D.; Kundu, S. A comparative study of soil erosion modelling by MMF, USLE and RUSLE. Geocarto Int. 2018, 33, 89–103. [Google Scholar] [CrossRef]
  22. Sharma, S.P.; Bhardwaj, A. Runoff quantification from small non-arable rangeland watershed in Shivalik foothills using WEPP model. J. Indian Water Resour. Soc. 2017, 37, 25–36. [Google Scholar]
  23. Kumar, S.; Sterk, G.; Dadhwal, V.K. Process Based Modelling for Simulating Surface Runoff and Soil Erosion at Watershed Basis. Available online: http://citeseerx.ist.psu.edu/viewdoc/download?doi=10.1.1.589.543&rep=rep1&type=pdf (accessed on 25 October 2018).
  24. Yousuf, A.; Bhardwaj, A.; Tiwari, A.K.; Bhatt, V. Modelling Runoff and Sediment Yield from a Small Forest Watershed in Shivalik Foot-Hills using WEPP Model. Int. J. Agric. Sci. Res. 2015, 5, 67–78. [Google Scholar]
  25. Bhatt, V.; Tiwari, A.K.; Sena, D. Application of SWAT model for simulation of runoff in micro watersheds of lower Himalayan region of India. Indian J. Soil Conserv. 2016, 44, 133–140. [Google Scholar]
  26. Ramsankaran, R.; Kothyari, U.C.; Ghosh, S.K.; Malcherek, A.; Murugesan, K. Physically-based distributed soil erosion and sediment yield model (DREAM) for simulating individual storm events. Hydrol. Sci. J. 2013, 58, 872–891. [Google Scholar] [CrossRef] [Green Version]
  27. Schmidt, J. Entwicklung und Anwendung eines Physikalisch Begründeten Simulationsmodells für die Erosion Geneigter Landwirtschaftlicher Nutzflächen; Selbstverlag des Instituts für Geographische Wissenschaften: Berlin, Germany, 1996; p. 148. ISBN 978-3-88009-062-0. [Google Scholar]
  28. Werner, M.V. EROSION-3D Benutzerhandbuch, Ver. 3.15; GeoGnostics Software: Berlin, Germany, 2007; p. 69. [Google Scholar]
  29. Stumpf, F.; Goebes, P.; Schmidt, K.; Schindewolf, M.; Schönbrodt-Stitt, S.; Wadoux, A.; Xiang, W.; Scholten, T. Sediment Reallocations due to Erosive Rainfall Events in the Three Gorges Reservoir Area, Central China. Land Degrad. Dev. 2016, 28, 1212–1227. [Google Scholar] [CrossRef]
  30. Starkloff, T.; Stolte, J. Applied comparison of the erosion risk models EROSION 3D and LISEM for a small catchment in Norway. Catena 2014, 118, 154–167. [Google Scholar] [CrossRef]
  31. Defersha, M.B.; Melesse, A.M.; McClain, M.E. Watershed scale application of WEPP and EROSION 3D models for assessment of potential sediment source areas and runoff flux in the Mara River Basin, Kenya. Catena 2012, 95, 63–72. [Google Scholar] [CrossRef]
  32. Singh, M.J.; Khera, K.L. Physical Indicators of Soil Quality in Relation to Soil Erodibility Under Different Land Uses. Arid Land Res. Manag. 2009, 23, 152–167. [Google Scholar] [CrossRef]
  33. Schindewolf, M.; Schmidt, J. Parameterization of the EROSION 2D/3D soil erosion model using a small-scale rainfall simulator and upstream runoff simulation. Catena 2012, 91, 47–55. [Google Scholar] [CrossRef]
  34. Schmidt, J. Wasserhaushalt und Feststofftransport an Geneigten, Landwirtschaftlich Bearbeiteten Nutzflächen. Ph.D. Thesis, Freie Universität Berlin, Berlin, Germany, 1988. [Google Scholar]
  35. Green, W.H.; Ampt, G.A. Studies on Soil Phyics. J. Agric. Sci. 1911, 4, 1–24. [Google Scholar] [CrossRef]
  36. Weigert, A.; Schmidt, J. Water transport under winter conditions. Catena 2005, 64, 193–208. [Google Scholar] [CrossRef]
  37. Schmidt, J. Modelling long-term soil loss and landform change. In Overland Flow: Hydraulics and Erosion Mechanics; Parsons, A.J., Abrahams, A.D., Eds.; UCL Press: London, UK, 1992; pp. 409–433. ISBN 1-85728-006-7. [Google Scholar]
  38. Michael, A.; Schmidt, J.; Schmidt, W. Band II: Parameterkatalog Sachsen Anwendung. In EROSION 2D/3D Ein Computermodell zur Simulation der Bodenerosion durch Wasser; Sächsische Landesanstalt für Landwirtschaft, Sächsisches Landesamt für Umwelt und Geologie: Dresden, Freiberg, Germany, 1996; p. 121. [Google Scholar]
  39. Werner, M.V. EROSION-2D Benutzerhandbuch, Ver. 5.2; GeoGnostics Software: Berlin, Germany, 2007; p. 53. Available online: http://www.bodenerosion.com/demos/e2d520/manual_d_52.pdf (accessed on 25 October 2018).
  40. Sponagel, H. Ad-Hoc-Arbeitsgruppe Boden der Staatlichen Geologischen Dienste und der Bundesanstalt für Geowissenschaften und Rohstoffe. In Bodenkundliche Kartieranleitung: Mit 103 Tabellen und 31 Listen, 5th ed.; Bundesanstalt für Geowissenschaften und Rohstoffe, Ed.; Schweizerbart: Stuttgart, Germany, 2005; p. 438. ISBN 978-3-510-95920-4. [Google Scholar]
  41. Michael, A. Anwendung des Physikalisch Begründeten Erosionsprognosemodells EROSION 2D/3D—Mpirische Ansätze zur Ableitung der Modellparameter. Ph.D. Thesis, Technische Universität Bergakademie Freiberg, Freiberg, Germany, 2000. [Google Scholar]
  42. Hartsch, K.; Singh, M.J. Decentralised erosion prevention for selected rain water retention measures in Punjab, India. Unpublished work. 2018. [Google Scholar]
  43. World Imagery. World Imagery Provides One-Meter or Better Satellite and Aerial Imagery in Many Parts of the World and Lower-Resolution Satellite Imagery Worldwide; ESRI: Redlands, CA, USA, 2018. [Google Scholar]
  44. Soil Science Division Staff. Soil Survey Manual; United States Department of Agriculture: Washington, DC, USA, 2017; p. 639.
  45. Saha, D.; Kukal, S.S.; Sharma, S. Landuse impacts on SOC fractions and aggregate stability in typic ustochrepts of Northwest India. Plant Soil 2011, 339, 457–470. [Google Scholar] [CrossRef]
  46. Ries, J.B.; Iserloh, T.; Seeger, M.; Gabriels, D. Rainfall simulations—Constraints, needs and challenges for a future use in soil erosion research. J. Geomorphol. Suppl. Issues 2013, 57, 1–10. [Google Scholar] [CrossRef]
  47. Kunth, F.; Schmidt, J. Infiltration and Soil Erosion Modelling on Lausatian Post Mine Sites. Unpublished research report. 2013. [Google Scholar]
  48. Schindewolf, M. Prozessbasierte Modellierung von Erosion, Deposition und Partikelgebundenem Nähr- und Schadstofftransport in der Einzugsgebiets-und Regionalskala. Ph.D. Thesis, Technische Universität Bergakademie Freiberg, Freiberg, Germany, 2012. Available online: http://tubaf.qucosa.de/landing-page/?tx_dlf[id]=http%3A%2F%2Ftubaf.qucosa.de%2Fapi%2Fqucosa%253A22806%2Fmets (accessed on 25 October 2018).
  49. Bhardwaj, A.; Kaushal, M.P. Two-dimensional physically based finite element runoff model for small agricultural watersheds: I. Model development. Hydrol. Process. 2009, 23, 397–407. [Google Scholar] [CrossRef]
  50. Mondal, A.; Khare, D.; Kundu, S. Uncertainty analysis of soil erosion modelling using different resolution of open-source DEMs. Geocarto Int. 2017, 32, 334–349. [Google Scholar] [CrossRef]
Figure 1. Location of Study area in Punjab and India. Areas at northeastern state boundary of Punjab higher than 300 m (colored yellow to red) belong to Shivalik foothills in Punjab.
Geosciences 08 00396 g001
Figure 2. Rainfall/Runoff Simulator; adapted from [32,33].
Geosciences 08 00396 g002
Figure 3. Four plots during rainfall/runoff experiments, blue color on plot 2 comes from measurement of runoff velocity with brilliant blue tracer. A 2 m long white scale bar can be seen on right sight of plot 2.
Geosciences 08 00396 g003
Figure 4. (a) Aerial view of example catchment [43] with boundaries of preliminary DEM and land use mapping; (b) shaded relief of DEM with channels calculated by EROSION-3D; (c) land use clusters chosen from preliminary land use mapping.
Geosciences 08 00396 g004
Figure 5. Experimental and modeled infiltration rates, rainfall intensity and sediment concentration of rainfall experiments.
Geosciences 08 00396 g005
Figure 6. Result maps showing runoff and sediment budget (negative values indicate erosion, positive values deposition) of example watershed.
Geosciences 08 00396 g006
Table 1. Soil conditions used for parameter estimation with EROSION-2D.
PlotKA5-Texture Class 1CropMonth
1SluPeasAugust
2SluPeasSeptember
3Sl3SeedbedAugust
4Sl3MaizeJune
1 soil texture classes according to classification system of German “Bodenkundliche Kartieranleitung KA 5” [40].
Table 2. Soil input parameters for modeling reference scenario in EROSION-3D.
ClusterBulk-Density [kg/m3]TOC [%]Skin Factor [-]Initial Soil Moisture [%]Surface Roughness [sm−1/3]Resistance to Erosion [N/m2]Cover [%]Clay [%]Silt [%]Sand [%]
FineMiddleCoarseFineMiddleCoarse
Grass17201.0011250.30.049086112226261
Maize17520.751.49250.020.0010317106132423222
Castor17201.0018250.160.089086112226261
Beans17200.454.91250.04550.00272586112226261
Table 3. Soil input parameters varied for modeling scenario LowP in EROSION-3D.
ClusterSkin FactorSurface RoughnessResistance to Erosion
-sm−1/3N/m2
Maize0.00610.0190.0009
Beans0.1240.010.00045
Table 4. Soil and plot properties.
PlotBulk Density [g/cm3]Cover [%]TOC [M-%]Soil Texture 1Inclination [°]/[%]
USDAKA5
1Mung bean, before harvest1.70 ± 0.13850.45sandy loamSu3/Sl32/3.5
2Mung bean, after harvest1.72 ± 0.03252/3.5
3Seedbed1.64 ± 0.1400.68LoamSlu2/3.5
4Maize, after harvest1.75 ± 0.04170.75LoamSlu1/1.8
1 soil texture classes according to classification system of USDA [44] and German “Bodenkundliche Kartieranleitung KA 5” [40].
Table 5. Hydraulic parameters from rainfall experiments.
PlotSoil Moisture [%]End-Infiltration Rate [mm/min]Mean Runoff Velocity [m/s]Mean Sediment Concentration [g/L]Virtual Slope Length [m]
1dry13 ± 20.58 ± 0.020.05 ± 0.016.22 ± 1.157.3 ± 0.2
wet360.32 ± 0.04
2dry17 ± 10.33 ± 0.050.09 ± 0.042.08 ± 0.5110.4 ± 2.1
wet350.25 ± 0.04
3dry20 ± 10.38 ± 0.040.08 ± 0.0120.41 ± 2.7610.1 ± 1.0
wet350.31 ± 0.05
4dry13 ± 40.14 ± 0.000.11 ± 0.019.04 ± 1.7511.9 ± 1.6
wet300.16 ± 0.06
Table 6. Determined and estimated values for surface roughness [s/m−1/3].
PlotDetermined from ExperimentEstimated from EROSION-2DParameter Catalogue
10.08440.10.09
20.04550.01-
30.04580.0130.012
40.020.0190.019
Table 7. Determined and estimated values for skin factor [-].
PlotDetermined from ExperimentEstimated from EROSION-2DParameter CatalogueTransfer Function
1Dry0.1490.60.13−1.8
Wet4.910.60.161.6
2Dry0.1240.6-−1.1
Wet4.190.6-1.6
3Dry0.1990.30.2−1.2
Wet6.150.30.31.1
4Dry0.00610.4-−1.2
Wet1.490.4-1.3
Table 8. Determined and estimated values for resistance to erosion [N/m2].
PlotDetermined from ExperimentEstimated from EROSION-2DParameter CatalogueTransfer Function
10.000450.0040.002–0.009−0.0071
20.00270.0040.002–0.009−0.0045
30.000310.00060.00025−0.0048
40.0010.00090.001–0.006−0.0019
Table 9. Runoff and sediment data from catchment area and single clusters.
ScenarioRunoff from Catchment [m3]Runoff Coefficient [%]Sediment Loss from Catchment [t/ha]Mean Sediment Budget [kg/m2] for Land Use Clusters
MaizeBeansGrassCastor
reference278105.8−3.32−0.440.210.04
LowP8363341.7−7.60−12.400.970.05
M205821.6−1.220.000.100.05
M308903514.6−7.32−1.610.460.01

