Article

Groundwater Natural Contamination by Toluene in Beja and Faro Districts, Portugal

by
Gabriel A. Barberes
1,2,*,
Rui Pena dos Reis
1,
André L. D. Spigolon
3,
Paulo E. Fonseca
4,
Carlos Bandeira de Mello
3 and
Maria Teresa Barata
2
1
Department of Earth Science and Center of Geoscience, Faculty of Science and Technology, University of Coimbra, Largo Marquês de Pombal, 3000-272 Coimbra, Portugal
2
Centre for Earth and Space Research of the University of Coimbra, Sta Clara, 3040-004 Coimbra, Portugal
3
Petrobras/CENPES, Geochemistry Division, 21941-915 Rio de Janeiro, Brazil
4
GeoFCUL—Department of Geology at Sciences Faculty of Lisbon & IDL—Instituto Dom Luiz 15, Campo Grande, 1749-016 Lisbon, Portugal
*
Author to whom correspondence should be addressed.
Geosciences 2018, 8(1), 9; https://doi.org/10.3390/geosciences8010009
Submission received: 24 August 2017 / Revised: 23 December 2017 / Accepted: 27 December 2017 / Published: 2 January 2018
(This article belongs to the Special Issue Urban Environmental and Medical Geochemistry)

Abstract

:
The focus area is located along Beja and Faro districts (southwestern of Portugal), where the Baixo Alentejo Flysch Group exists, is composed of the Mértola, Mira, and Brejeira Formations. The aim of this article is to characterize the groundwater contamination by toluene, one of the petroleum products that may originate from natural petroleum systems and have been introduced into the environment by natural seepage. For this study, twenty soil samples and thirty-one water samples were collected, in 2016, from artesian wells, boreholes, and springs, and analyzed in a GC-FID system. Sampling was performed using headspace vials, with distilled water and a bactericide to inhibit any bacterial activities. The results showed that 93.5% of water samples range between 1000 and 6000 μg/L, and 55% are higher than 3000 μg/L of toluene concentration. In soil samples, amounts of toluene are less than 1000 μg/L in general. These levels are much higher than the World Health Organization health-based guideline for drinkable water (700 μg/L) and higher than those usually found in other places, being only comparable with values from severe industrial contamination. Contaminated groundwater represents a serious concern for human health, and residents should be informed to avoid drinking contaminated ground water or using it for other domestic proposes.

1. Introduction

The classic Medical Geology approach considers the inorganic elements and substances with more relevance because of their positive or negative effects on human and animal health. However, the natural organic substances must be considered as responsible for many troubles that affect living beings as well [1,2]. Among the 160 EPA (United States Environmental Protection Agency) priority pollutant volatile and semi-volatile organic compounds, only 20 are petroleum-type hydrocarbons [3]. Bandeira de Mello & Miller [4] emphasized the importance of natural organic compounds, for the Medical Geology. Many of these substances, such as toluene, are present on the “ATSDR’s Substance Priority List [5]” as the most significant potential threat to human health due to their known or suspicious toxicity and potential for human exposure.
The injection of petroleum hydrocarbons into groundwater system is the object of study for many different branches of science such as biology, hydrogeology, environmental geology, environmental geochemistry, etc. Despite the harmful effects on human health, this phenomenon has implications for the exploitation of natural resources, agriculture, environmental management, etc. [6,7,8].

1.1. Toluene

Toluene (also known as methylbenzene by International Union of Pure and Applied Chemistry) is a clear, colorless liquid with a sweet, pungent odor and is a natural component of coal and petroleum [9]. It is a monocyclic aromatic compound with one hydrogen on the benzene ring by replacement of a hydrogen atom by a methyl group, and the molecular formula C6H5CH3. Toluene is a volatile liquid (boils at 111 °C) that is flammable and explosive, and has a relatively high vapor pressure (3.7 kPa at 250 °C). It is produced from two principal sources: catalytic conversion of petroleum and aromatization of aliphatic hydrocarbons. It is also produced by incomplete combustion of natural fuel materials, and as such is released during forest fires [10,11,12,13]. It may therefore be introduced into the environment through petroleum seepage and weathering of exposed coal containing strata and into groundwater from petroliferous rocks. The anthropogenic contaminations forms include chemical spills, spills of petroleum products, and from discharges of industrial effluents [10]. The magnitude of such releases into the environment is unknown [14]. Industrial grade toluene is 98% pure and may contain up to 2% xylenes and benzene [10,11,12,13].
According to Leusch & Bartkow [15], toluene is occasionally detected in drinkable water supplies (this hydrocarbon is one of the volatile organic compounds commonly detected in groundwater), but occurrence is not widespread, and levels are generally below 3 μg/L (but can go as high as 3500 μg/L in groundwater from industrially polluted sites).
Soluble components such as benzene, toluene, ethylbenzene, and the xylenes (BTEX) are washed out of petroleum and fuels, in water presence [16]. According to Zogorski et al. [17], the sources of most gasoline hydrocarbons in aquifers are probably releases of gasoline or other finished fuel products. Estimates for the United States indicate that gasoline and oil spills account for about 90% of all toluene releases into water [18]. Aquifer conditions (aerobic and anaerobic) and microbial metabolism (respiration, fermentation, and co-metabolism) control the environmental degradation of volatile organic compounds in groundwater [19].
According to Maier et al. [20], the soil-gas plumes of aromatic compounds (like benzene and toluene) are much more restricted to the proximity of the source area and somewhat retarded. Toluene shows its maximum spreading around 120 days.

1.2. Unconventional Hydrocarbons

A shale resource system (unconventional) is described as a continuous organic-rich source rock that may be both a source and a reservoir rock for petroleum (oil and gas) production [21]. Unconventional reservoirs contain low to ultra-low permeability and produce mainly dry gas. Reservoirs with permeability greater than 0.1 mD are considered conventional, and those with permeability below 0.1 mD are called unconventional, although there is no scientific basis for this designation [22].
According to the most recent definition published by the US National Petroleum Council (NPC), unconventional gas reservoirs can be operated and produced without a large fluid flow, unless the well is stimulated by hydraulic fracturing or accessed by a horizontal or some other technique that gives more flow from the reservoir to the well [23]. This definition includes tight gas sands and carbonates, as well as resource plays as coal and shales [24].
Resource plays refer to sediments that work as both reservoirs and a source of hydrocarbons. Unlike conventional plays, unconventional plays cover a large area and are generally not restricted to geological structures [22,25].

1.3. Hydrocarbon Seeps

Natural gas seepage (emanations) is constant or episodic, slow or rapid, visible or invisible flow of hydrocarbons from subsurface sources to Earth’s surface [26]. Hydrocarbon seeps occur along a complex interconnected net of fences, joints, microfractures, and stratification planes. When they reach the phreatic level and soil, the fluids start entering the interstitial material, where they can be sampled, detected, and characterized (Figure 1) [27].
The rate and volume of hydrocarbon seepage to near-surface sediments controls the surface expression of geological, geophysical, biological, and geochemical features, which can range from macro to microseepage [28]. According to Etiope [26], the surface expressions of natural gas seepage can be classified on the basis of spatial dimension, visibility, and fluid typology.
Macroseeps (or seeps) are “channeled” flows of gas, typically related to fault systems. Gas flux is expressed in terms of mass/time (e.g., kg/day or t/year). This surface macroseeps (visible gas vents or oil leaks from the soil or rock outcrops) are generally an indication of a fault in an active petroleum seepage system [29] belonging to a total petroleum system [30,31].
Microseepage is the slow, continual, or episodic loss of light hydrocarbons from gas-oil-prone sedimentary basins where thermal degradation of indigenous organic matter occurs [32]. It is essentially the pervasive, diffuse exhalation of gas from soil, independent of the presence of macroseeps [26].
Seepage along faults can be more an effusive process, rather than microseepage [32]. However, pressure gradients cause hydrocarbon fluids to migrate to areas of lower pressure. These migrations may be in directions other than vertical. Natural overburden pressure is a mechanism that forces gas to the surface [33].
Generally, according to Etiope [31], the identification and characterization of hydrocarbon seeps are important for the main reasons:
-
Seeps can be indicators of natural petroleum systems;
-
Seeps indicate the occurrence of a fault. According to Etiope [26], gas, in fact, follows preferential pathways of movement (less resistance paths), as determined by fractures and faults;
-
Seeps can represent a geo-hazard for societal community and industry;
-
Seeps are natural sources of greenhouse gas.

1.4. Objectives

This paper aims to detect and characterize the presence of hydrocarbon fluids, mainly toluene, in soil and groundwater levels of Beja and Faro Districts (Portugal). Following the health-based guideline from World Health Organization, it aims to alert the Portuguese authorities about the potential consequences for the local people. It also aims to discuss the possible sources of these organic compound seeps and compare the results with other available information from other countries.

2. Material and Methods

2.1. Study Area

The focus area is situated in a wide region along Beja and Faro districts (south of Portugal—Figure 2), which include the Baixo Alentejo Flysch Group (BAFG), composed of Mira and Brejeira Formations [34,35]. The SPZ (South Portuguese Zone) is located in the southernmost sector of the pre-Mesozoic Iberian Variscan Chain, which is composed by upper Paleozoic shales and greywackes (interbedded), of low grade metamorphism.
All these formations contain significant thicknesses of black shales (especially the southernmost formation, Brejeira). The SPZ has several wide areas with significant average total organic carbon content (TOC) and thermal maturation values within hydrocarbons generation zones [36,37,38,39]. The BAFG includes also one more formation (fm.), Mértola. However, because of the highest thermal maturation, conjugated with lowest TOC content among SPZ formations, Mértola Fm. was not included in the surface geochemical sampling [39].
From the SPZ hydrogeological point of view, the water is high mineralized, hard, with high concentration of chlorides, sodium, etc. These characteristics are unexpected from water flowing through low reactive materials like shales and greywacke. The causes of these chemistry aspects are still unclear. The spatial distribution of the main species concentrations is not homogeneous, verifying a clear trend for high concentrations at east, close to Guadiana Basin. The water from this lithologic group is not recommended for human consumption, being almost all MRL (maximum recommended value) overpassed, except for hardness and pH [40].

2.2. Surface Geochemical Prospecting

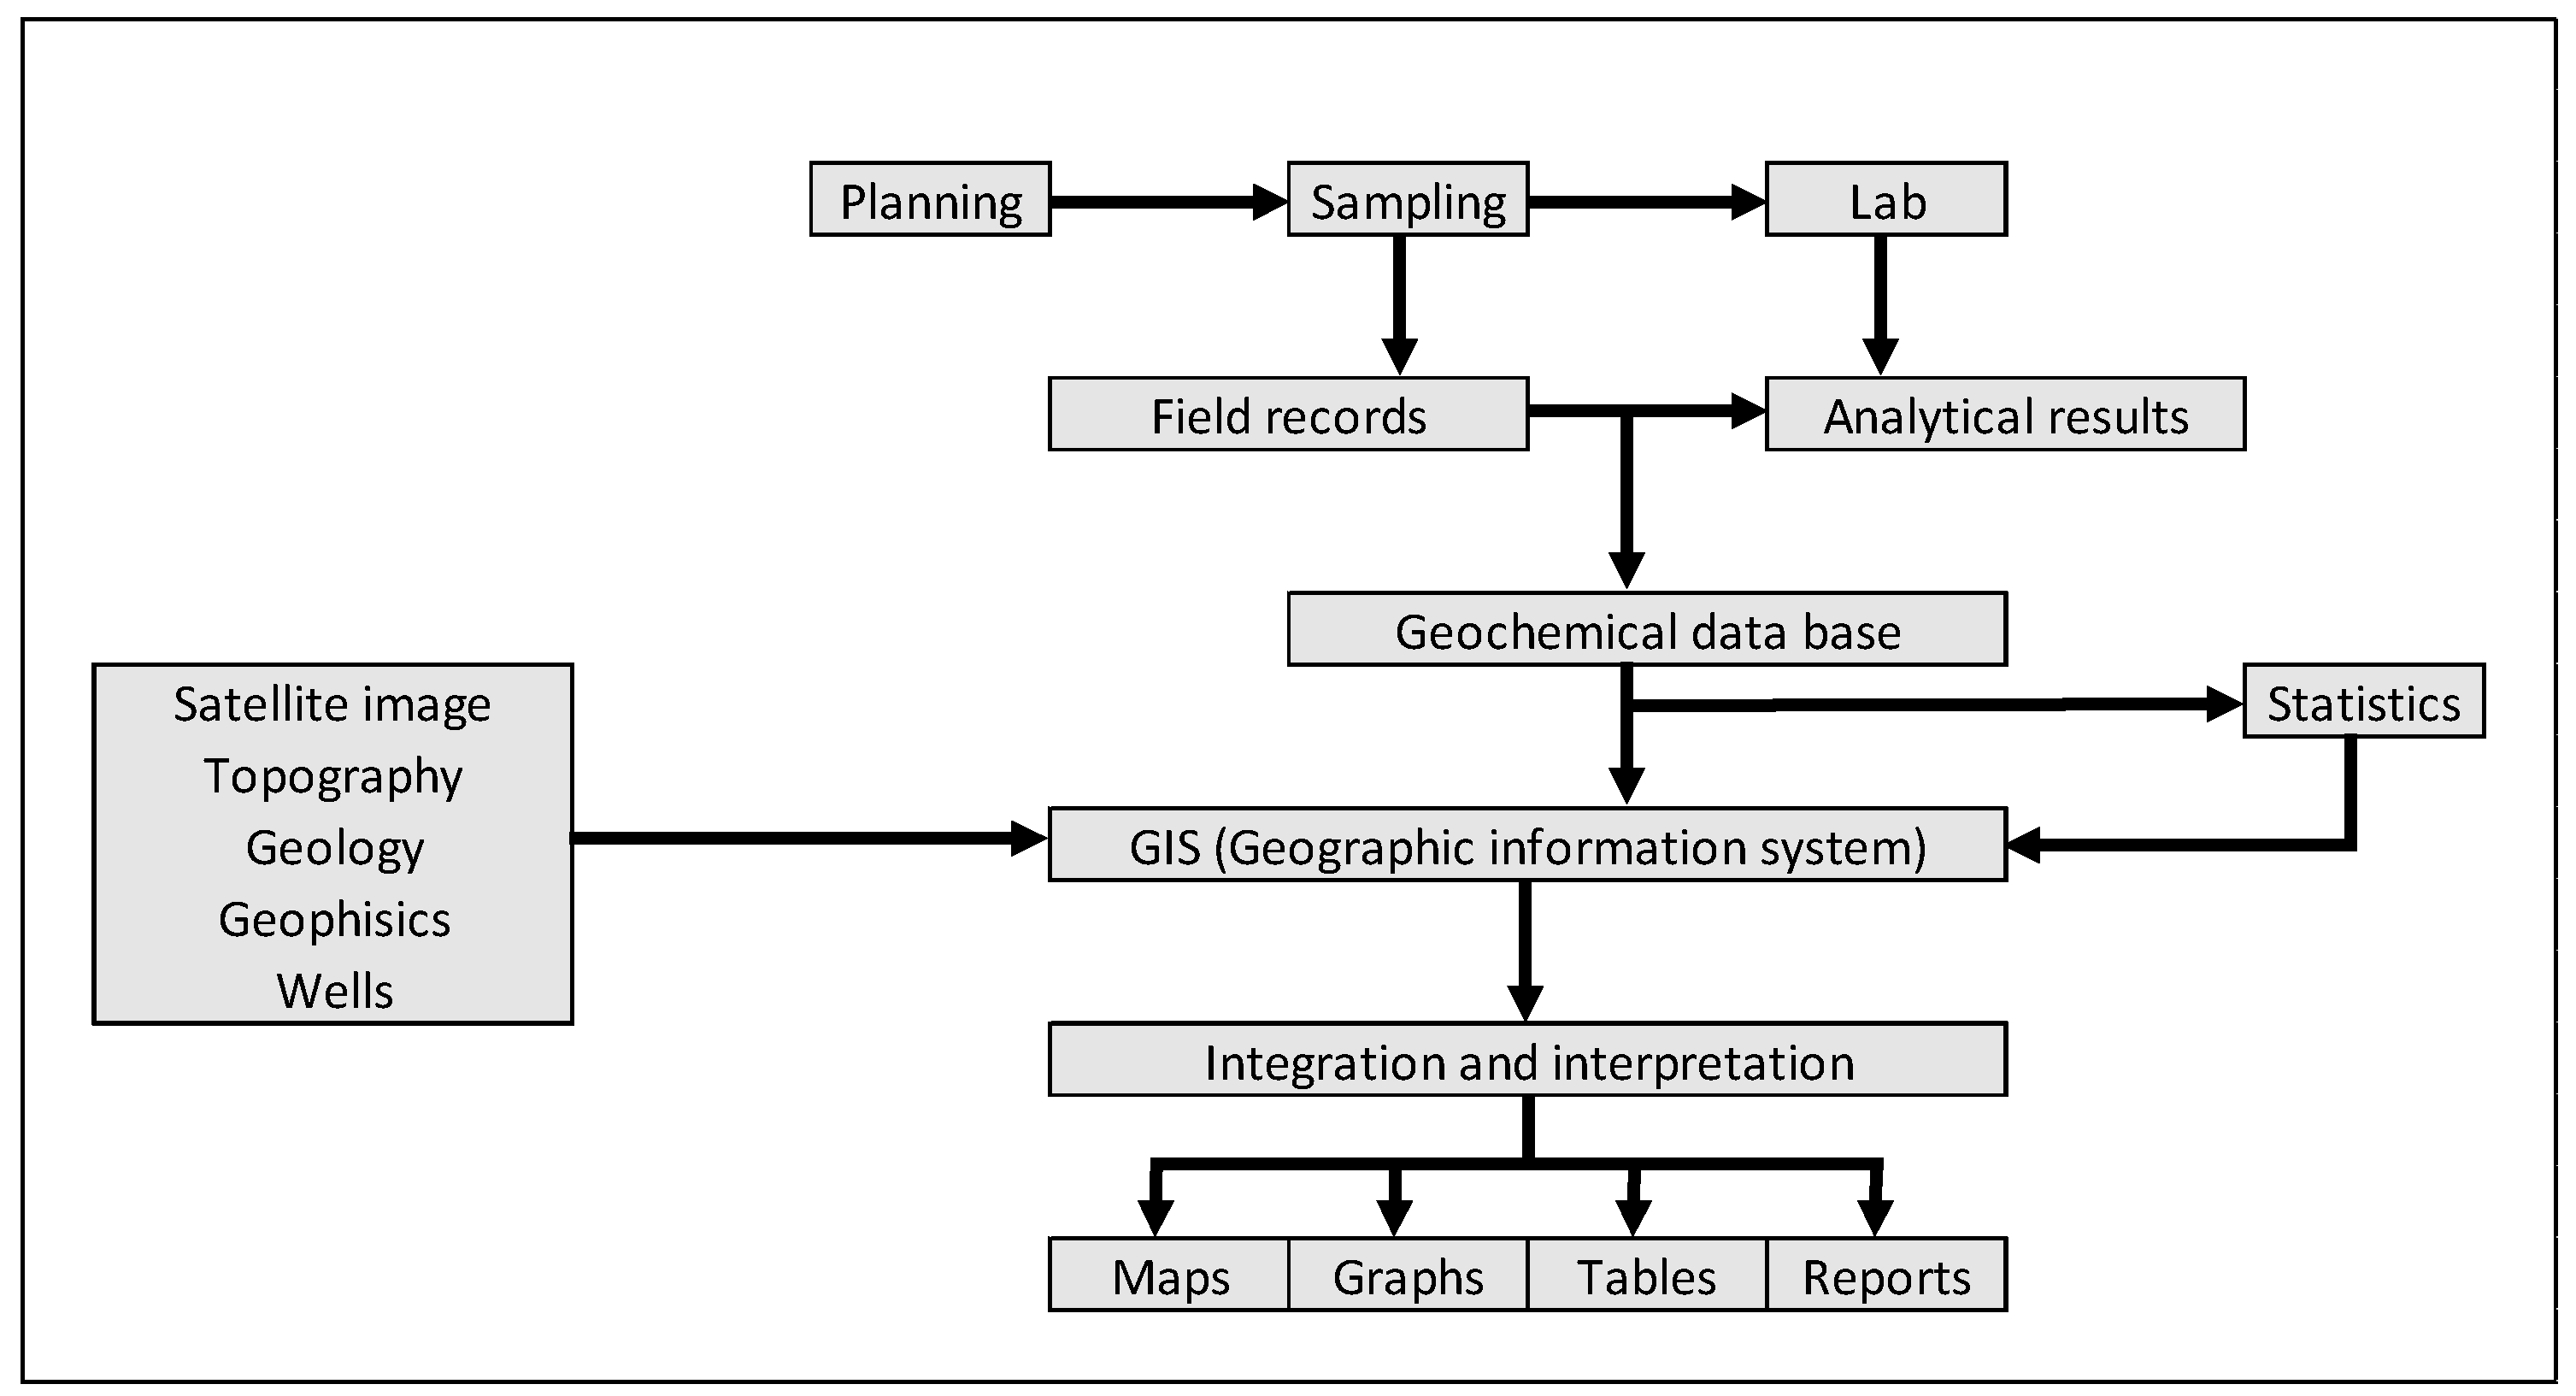
The procedures for surface geochemical sampling campaign begin with preliminary planning actions, such as area selection (target), geological base maps, satellite imagery, etc., as well as choosing the most suitable months for field operations [41]. Once the research area has been established, the efforts are focused on potential hydrocarbon systems (conventional or unconventional), thus defining the positioning of the sampling points. After these adjustments, the most appropriate sampling methodologies and respective standard procedures are defined (Figure 3).
According to Abrams [28], the light hydrocarbons require special handling and containers to limit volatile loss and prevent post-sampling microbial alteration. Several methods are used for direct hydrocarbon sampling such as probe and headspace for free gases, blender and disrupter for occluded gases, and acid extraction for adsorbed gases and adsorbent fibers [41,42].
In general, the research methodologies in surface geochemistry aim to quantify hydrocarbon movement in a medium, on a time scale [43]. Under standard conditions for temperature and pressure (25 °C and 1 atm), light hydrocarbons (methane [CH4], ethane [C2H6], propane [C3H8], isobutane [i-C4H10], and n-butane [n-C4H10]) are present, on the surface, as a gas. Hydrocarbons of slightly larger molecular weights such as n-pentane (n-C5) and n-hexane (n-C6) are present, on the surface, in the liquid phase. However, they can be found as gas (vapor) just with a small increase of the temperature.
The sampled volume goes on to (1) review of research investigations and case history studies of every gas that might act as an indicator or pathfinder; and (2) elaborate on the models that explain the observed results [44].
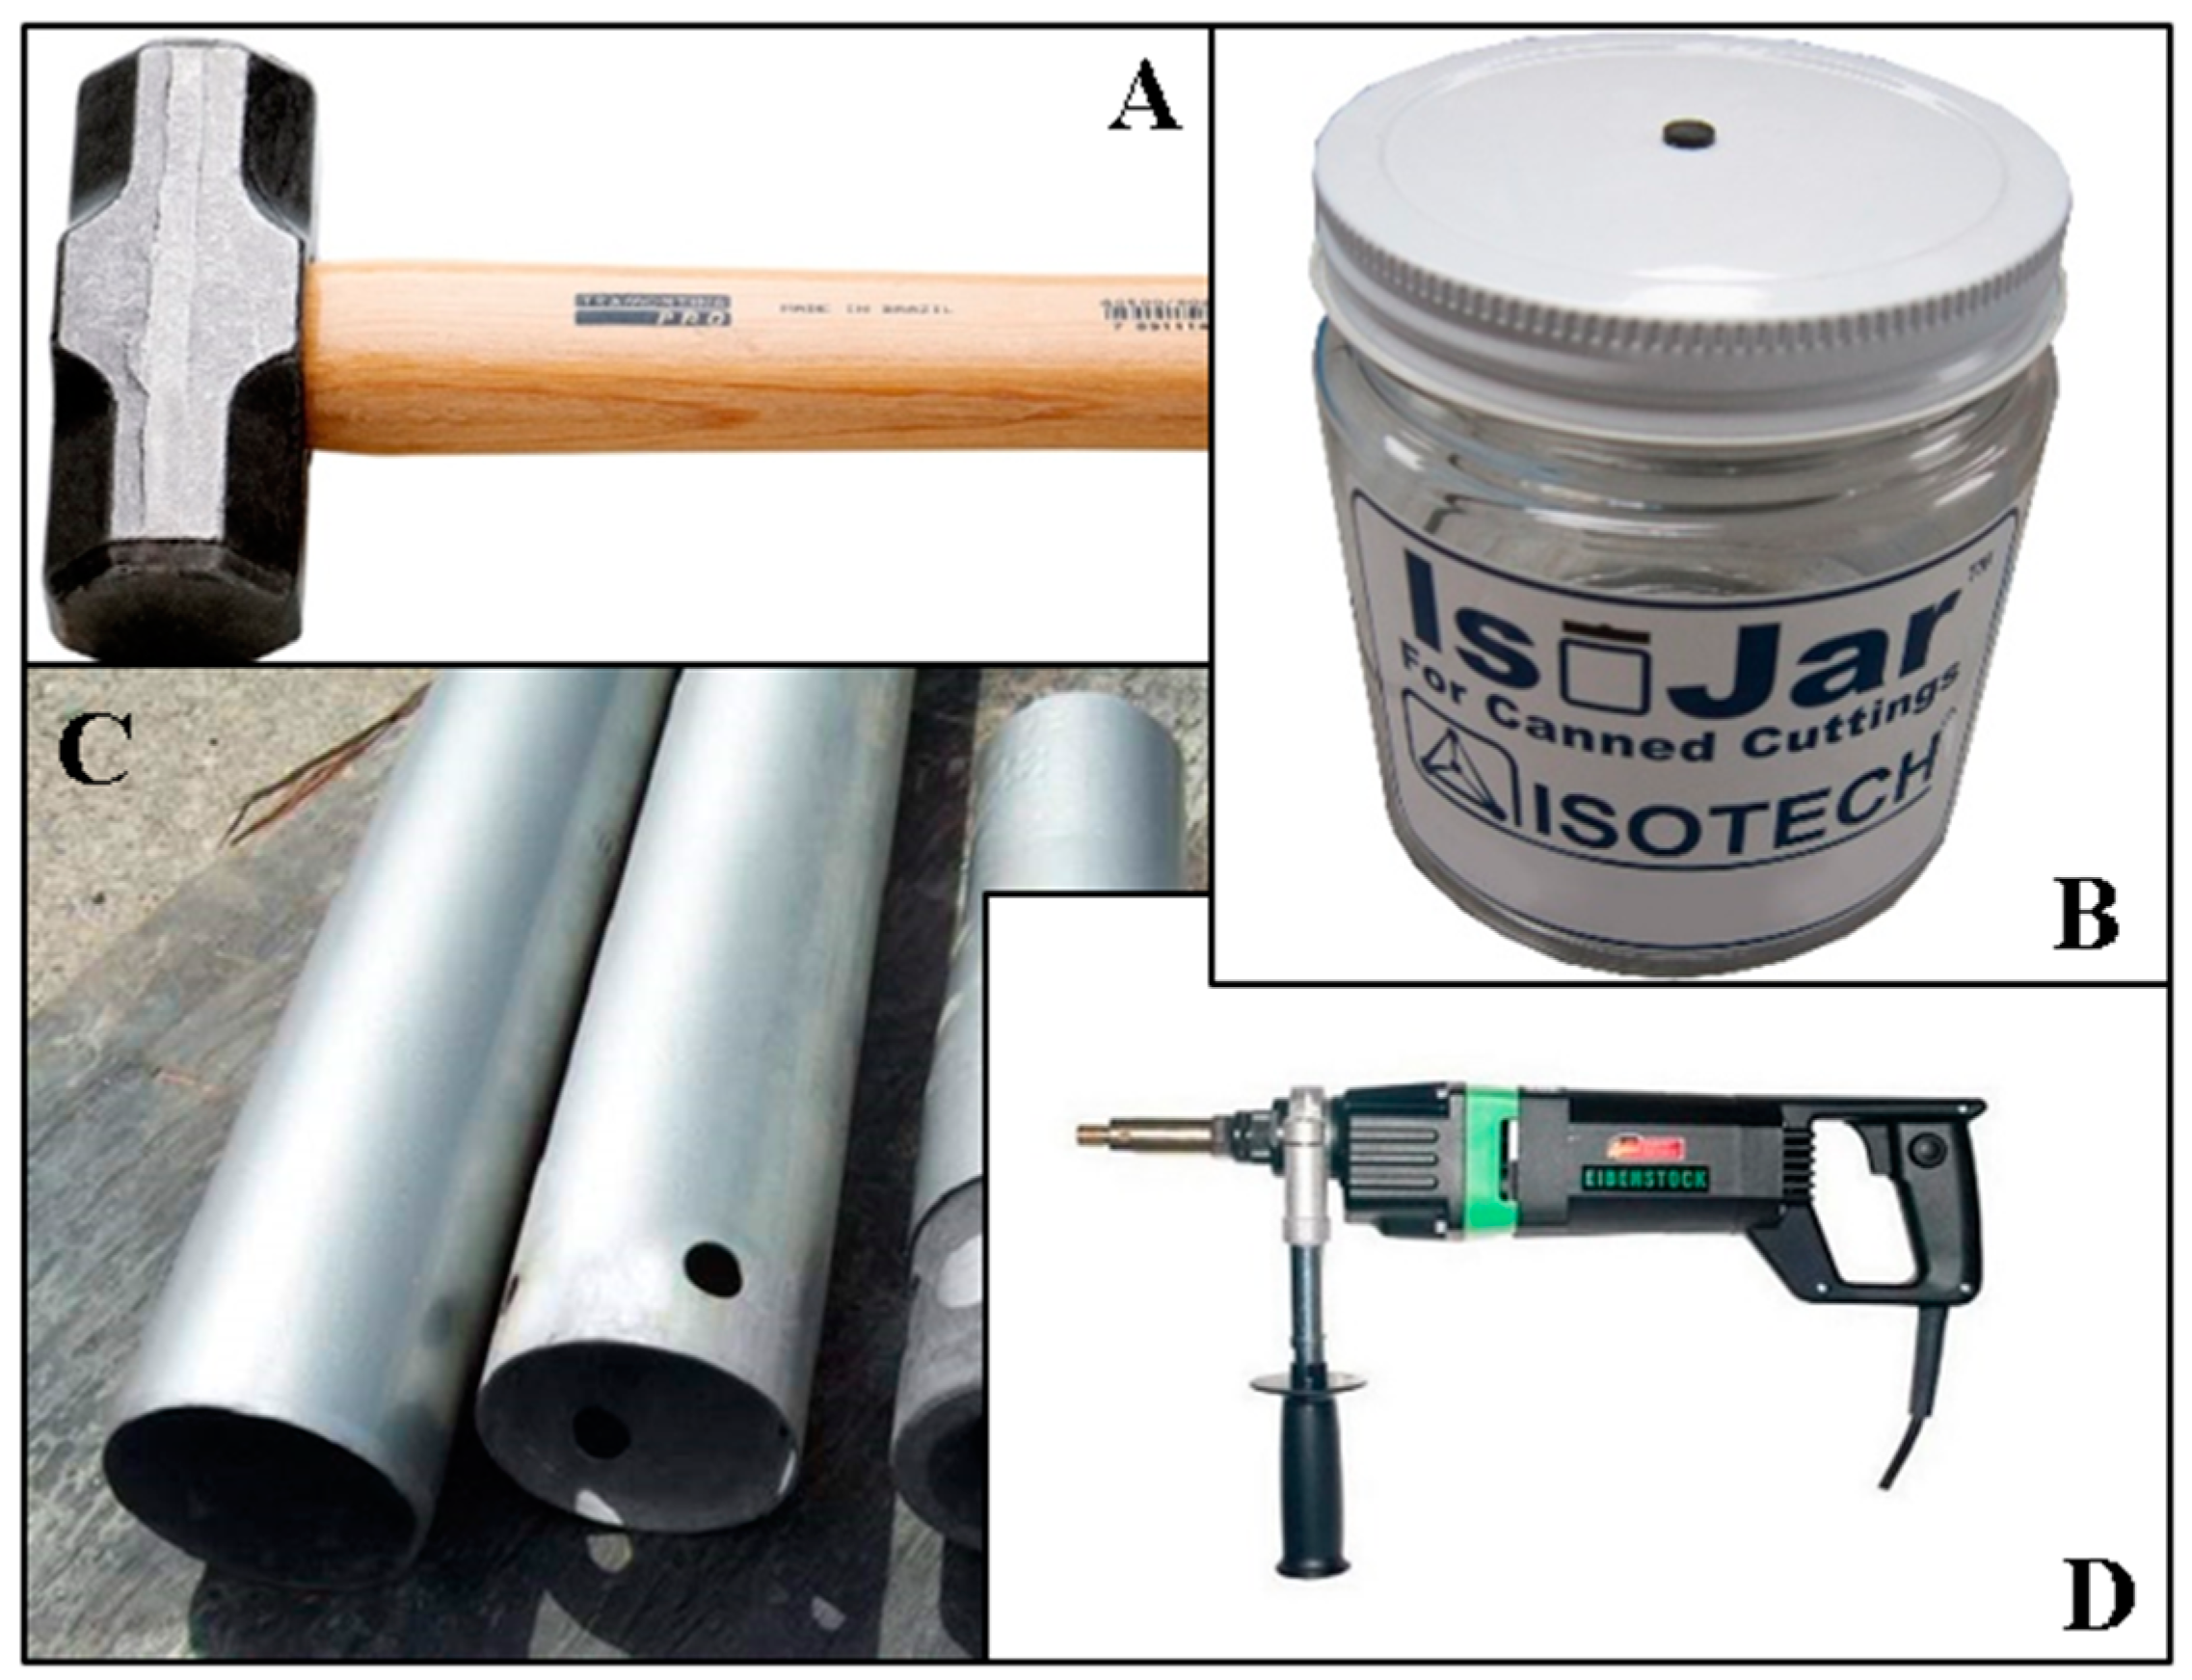
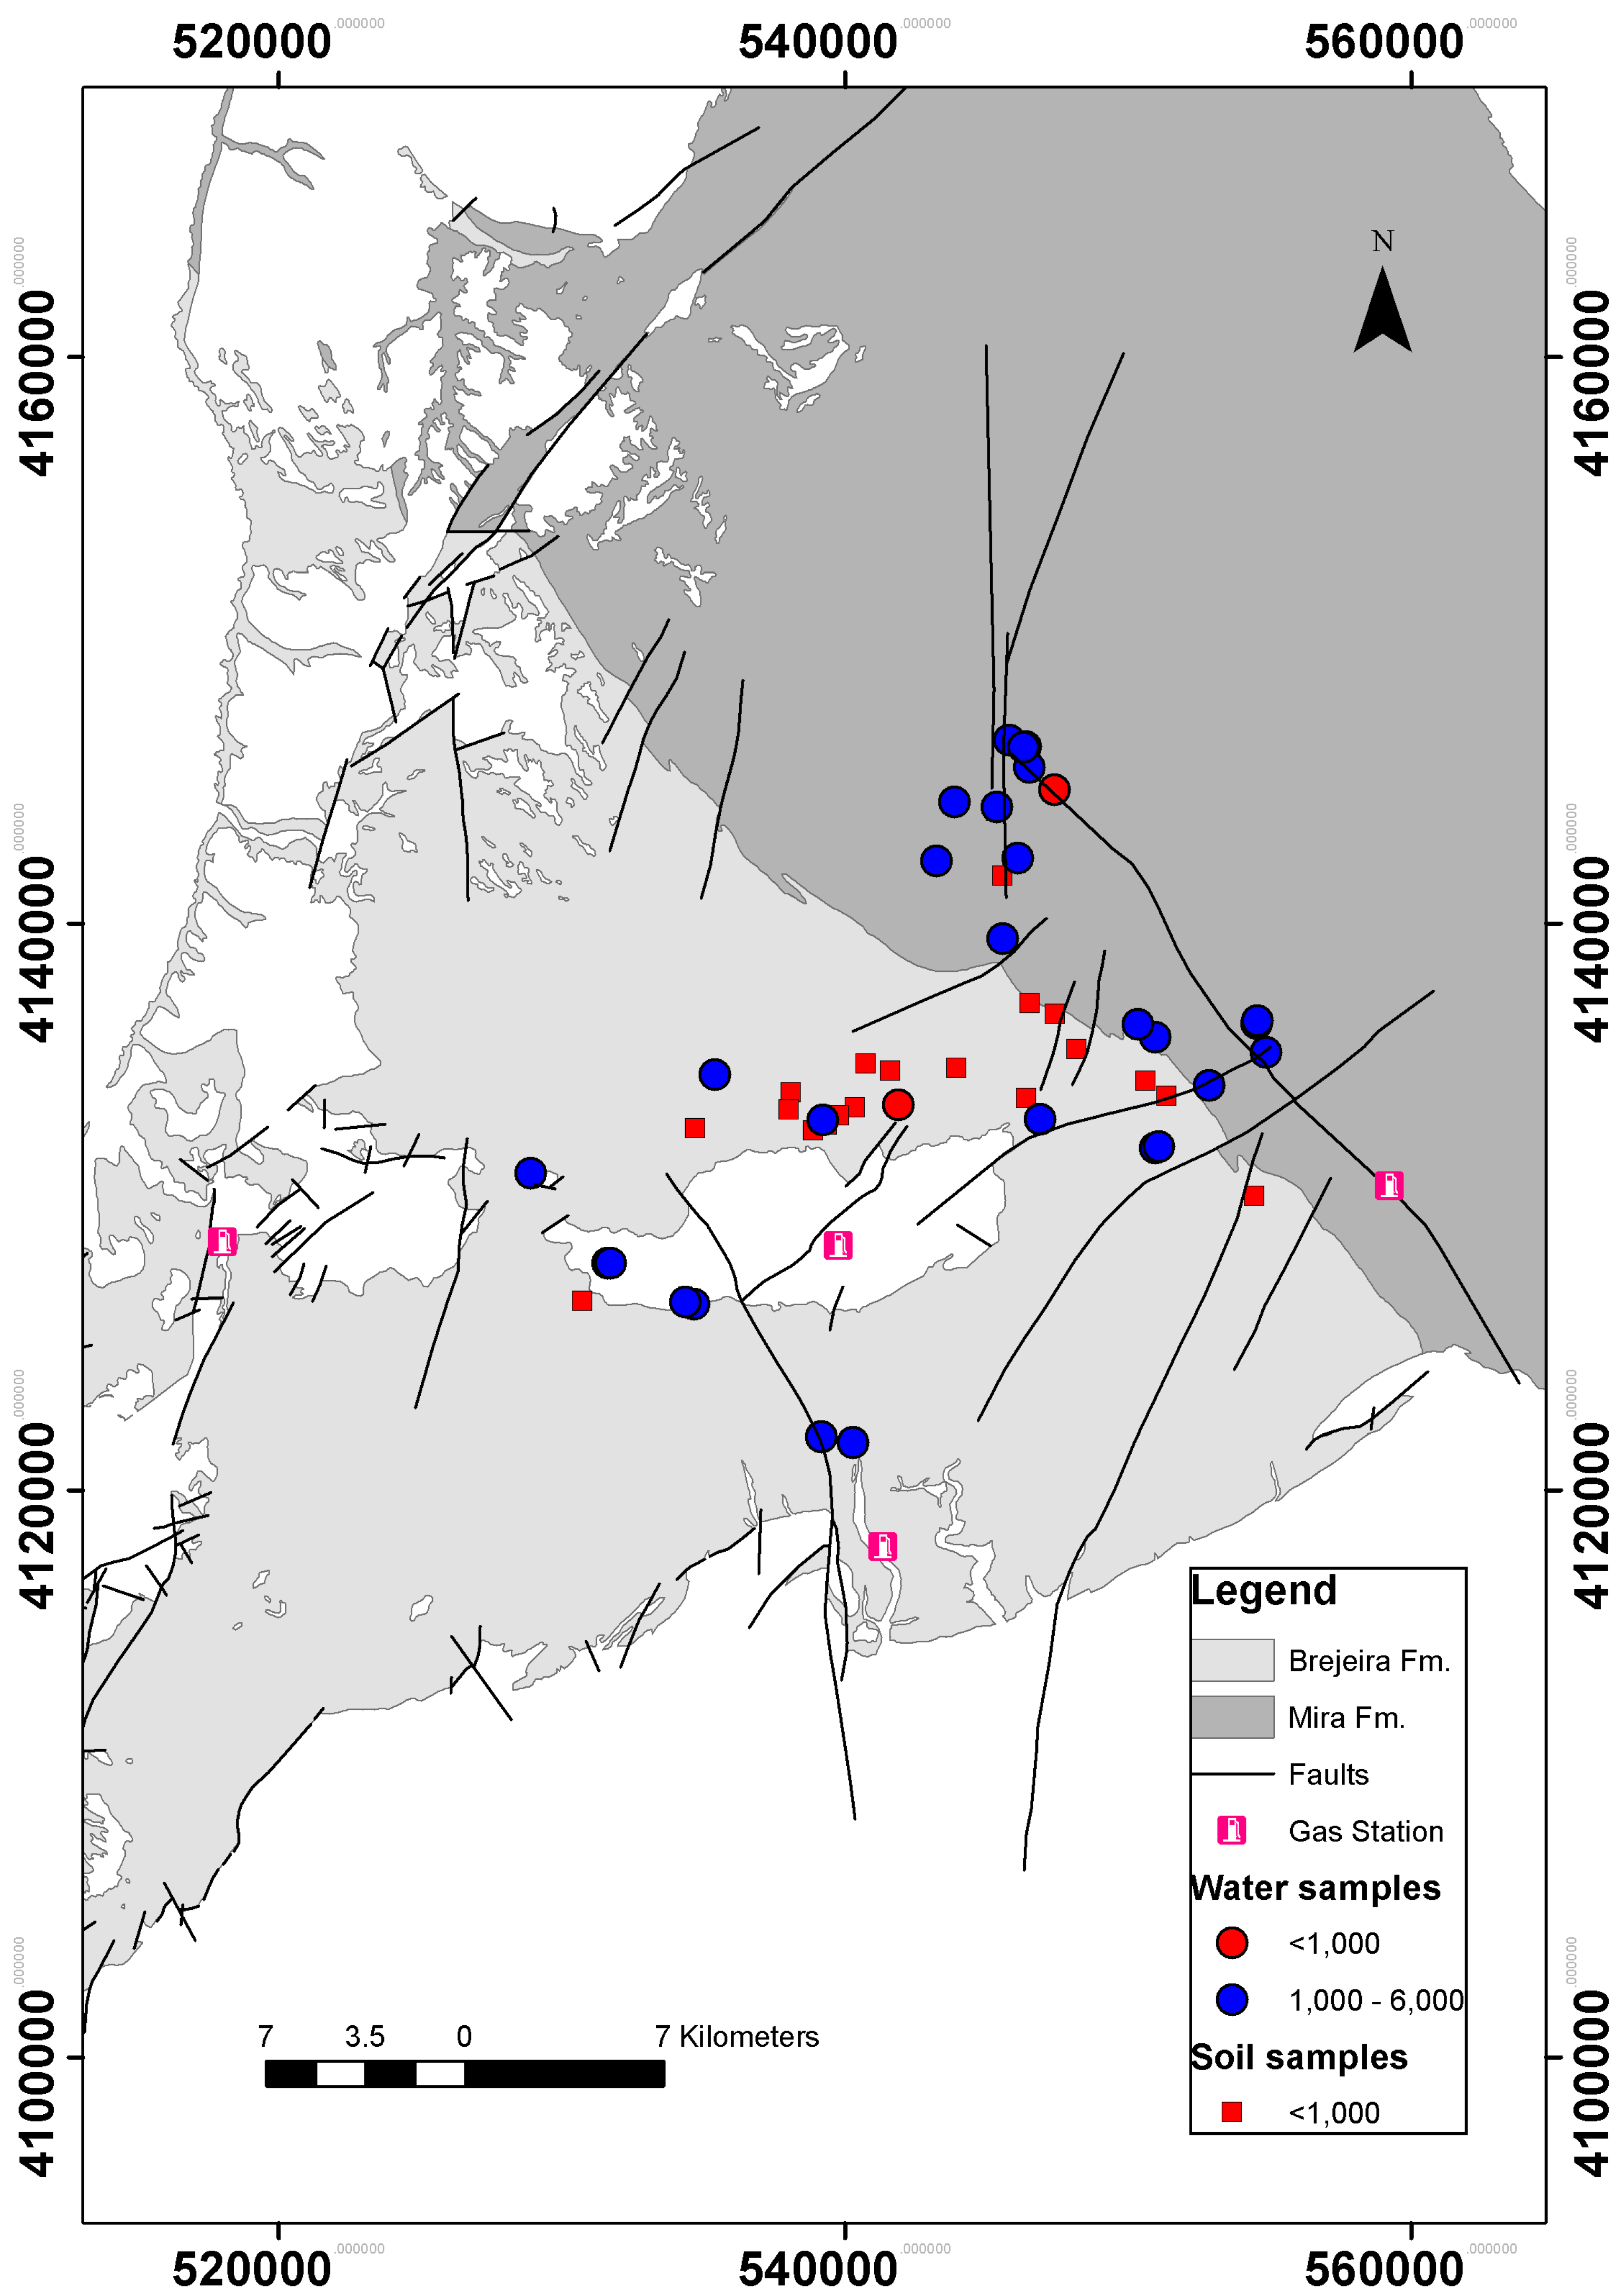
The study sampling zone was selected based on geological features such as faults, folds, and thrusts that could work as pathways for the hydrocarbon migration to groundwater (Figure 1). For this study, the collection of all samples was performed using IsoJar® (Isotech Laboratories Inc., Champaign, IL, USA) (Figure 4B), with distilled water (just for soil/rock samples; water samples do not need to be filled with distilled water) and a bactericide added to inhibit any bacterial activities post sampling. Twenty soil samples were collected for this study, using a drilling machine (Figure 4D), a metal tube, and a hammer (Figure 4A,C). Thirty-one water samples were collected from artesian wells, boreholes, and springs (Figure 2).

2.3. Analytical Methodology

For the analysis of the samples, a gas chromatographer (Agilent 7890B GC; Agilent Technologies, Santa Clara, CA, USA) equipped with a 30 m 0.32 mm Gaspro column and a 50 m 0.32 mm Porabond Q column (both from Agilent) was used. The Gaspro column is coupled to a flame ionization detector and used for analysis of hydrocarbons. The samples were injected into a heated injection valve on the GC using a gastight syringe. The detector responses were calibrated against a reference gas (Scott Specialty Gases Netherlands BV, Breda, The Netherlands) several times a day. Some samples need to be modified for the specific requirement of a particular analytical technique [45]. Most consumer products and geological samples (as hydrocarbons) are composed of a wide variety of compounds that differ in molecular weight, polarity, and volatility [46].
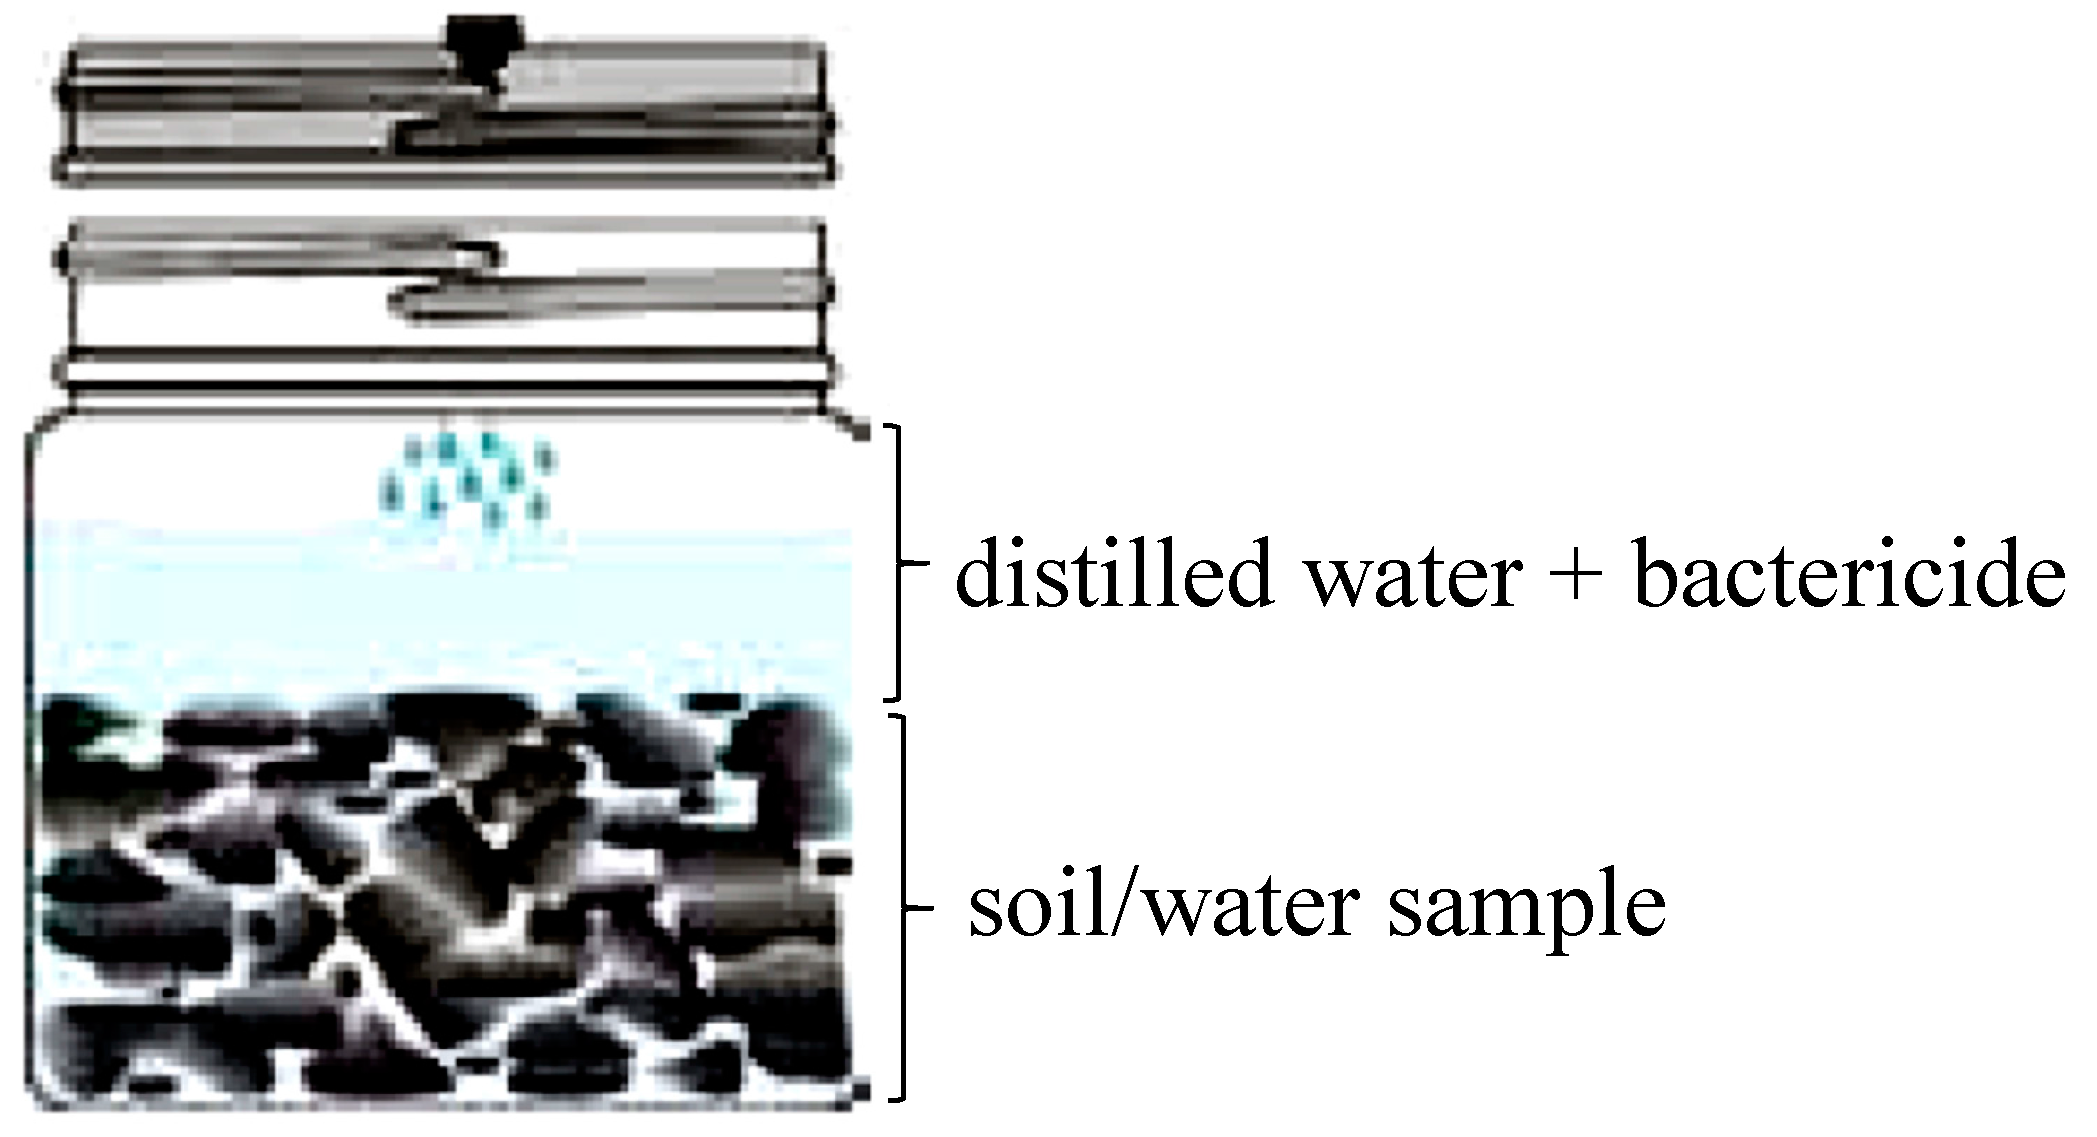
A gas extract is ideally suited for analysis by GC, and this combination is called ‘‘headspace–gas chromatography’’ (HS-GC sampling), the fastest and cleanest method for analyzing volatile organic compounds. A headspace sample is normally prepared in a vial containing the sample, the dilution solvent, a matrix modifier like a bactericide, and the headspace (Figure 5) [45,46].
Volatile components from complex sample mixtures can be extracted from non-volatile sample components and isolated in the headspace or vapor portion of a sample vial. An aliquot of the vapor in the headspace is delivered to a GC system for separation of all of the volatile components [46].
In order to achieve the best performance when using HS-GC, careful attention should be used in sample preparation and instrument setup. Key issues to address when setting up HS-GC systems include minimizing system dead volume, maintaining inert sample flow paths, and achieving efficient sample transfer [46].
The adopted procedures for taking cuttings samples in IsoJar®, following Isotech [42] recommendations, are presented:
  • Put the sample in jar (approximately 1 cup);
  • Only add distilled water to reach the line on the label;
  • Do not fill the jar with water as the headspace gap is needed to allow gas to desorb into the gap;
  • Leave about a 1-inch gap between the water and top of the jar;
  • Add 10 drops of the dilute bactericide, Benzalkonium Chloride, to the jar;
  • Screw the lid on as tight as possible;
  • Tape the lid to keep it tight and from vibrating loose during shipment. Tape in same direction (clockwise) that the lid is screwed on.
According to Abrams [28], the fifth point is used to prevent in-situ microbial activity. The amount of bactericide required to prevent microbial activity has not been rigorously examined. To the best of the author’s knowledge, no comprehensive studies have been conducted to evaluate the effectiveness of these anti-bacterial agents, how much is required, or if the anti-bacterial agents impact the geochemistry results.
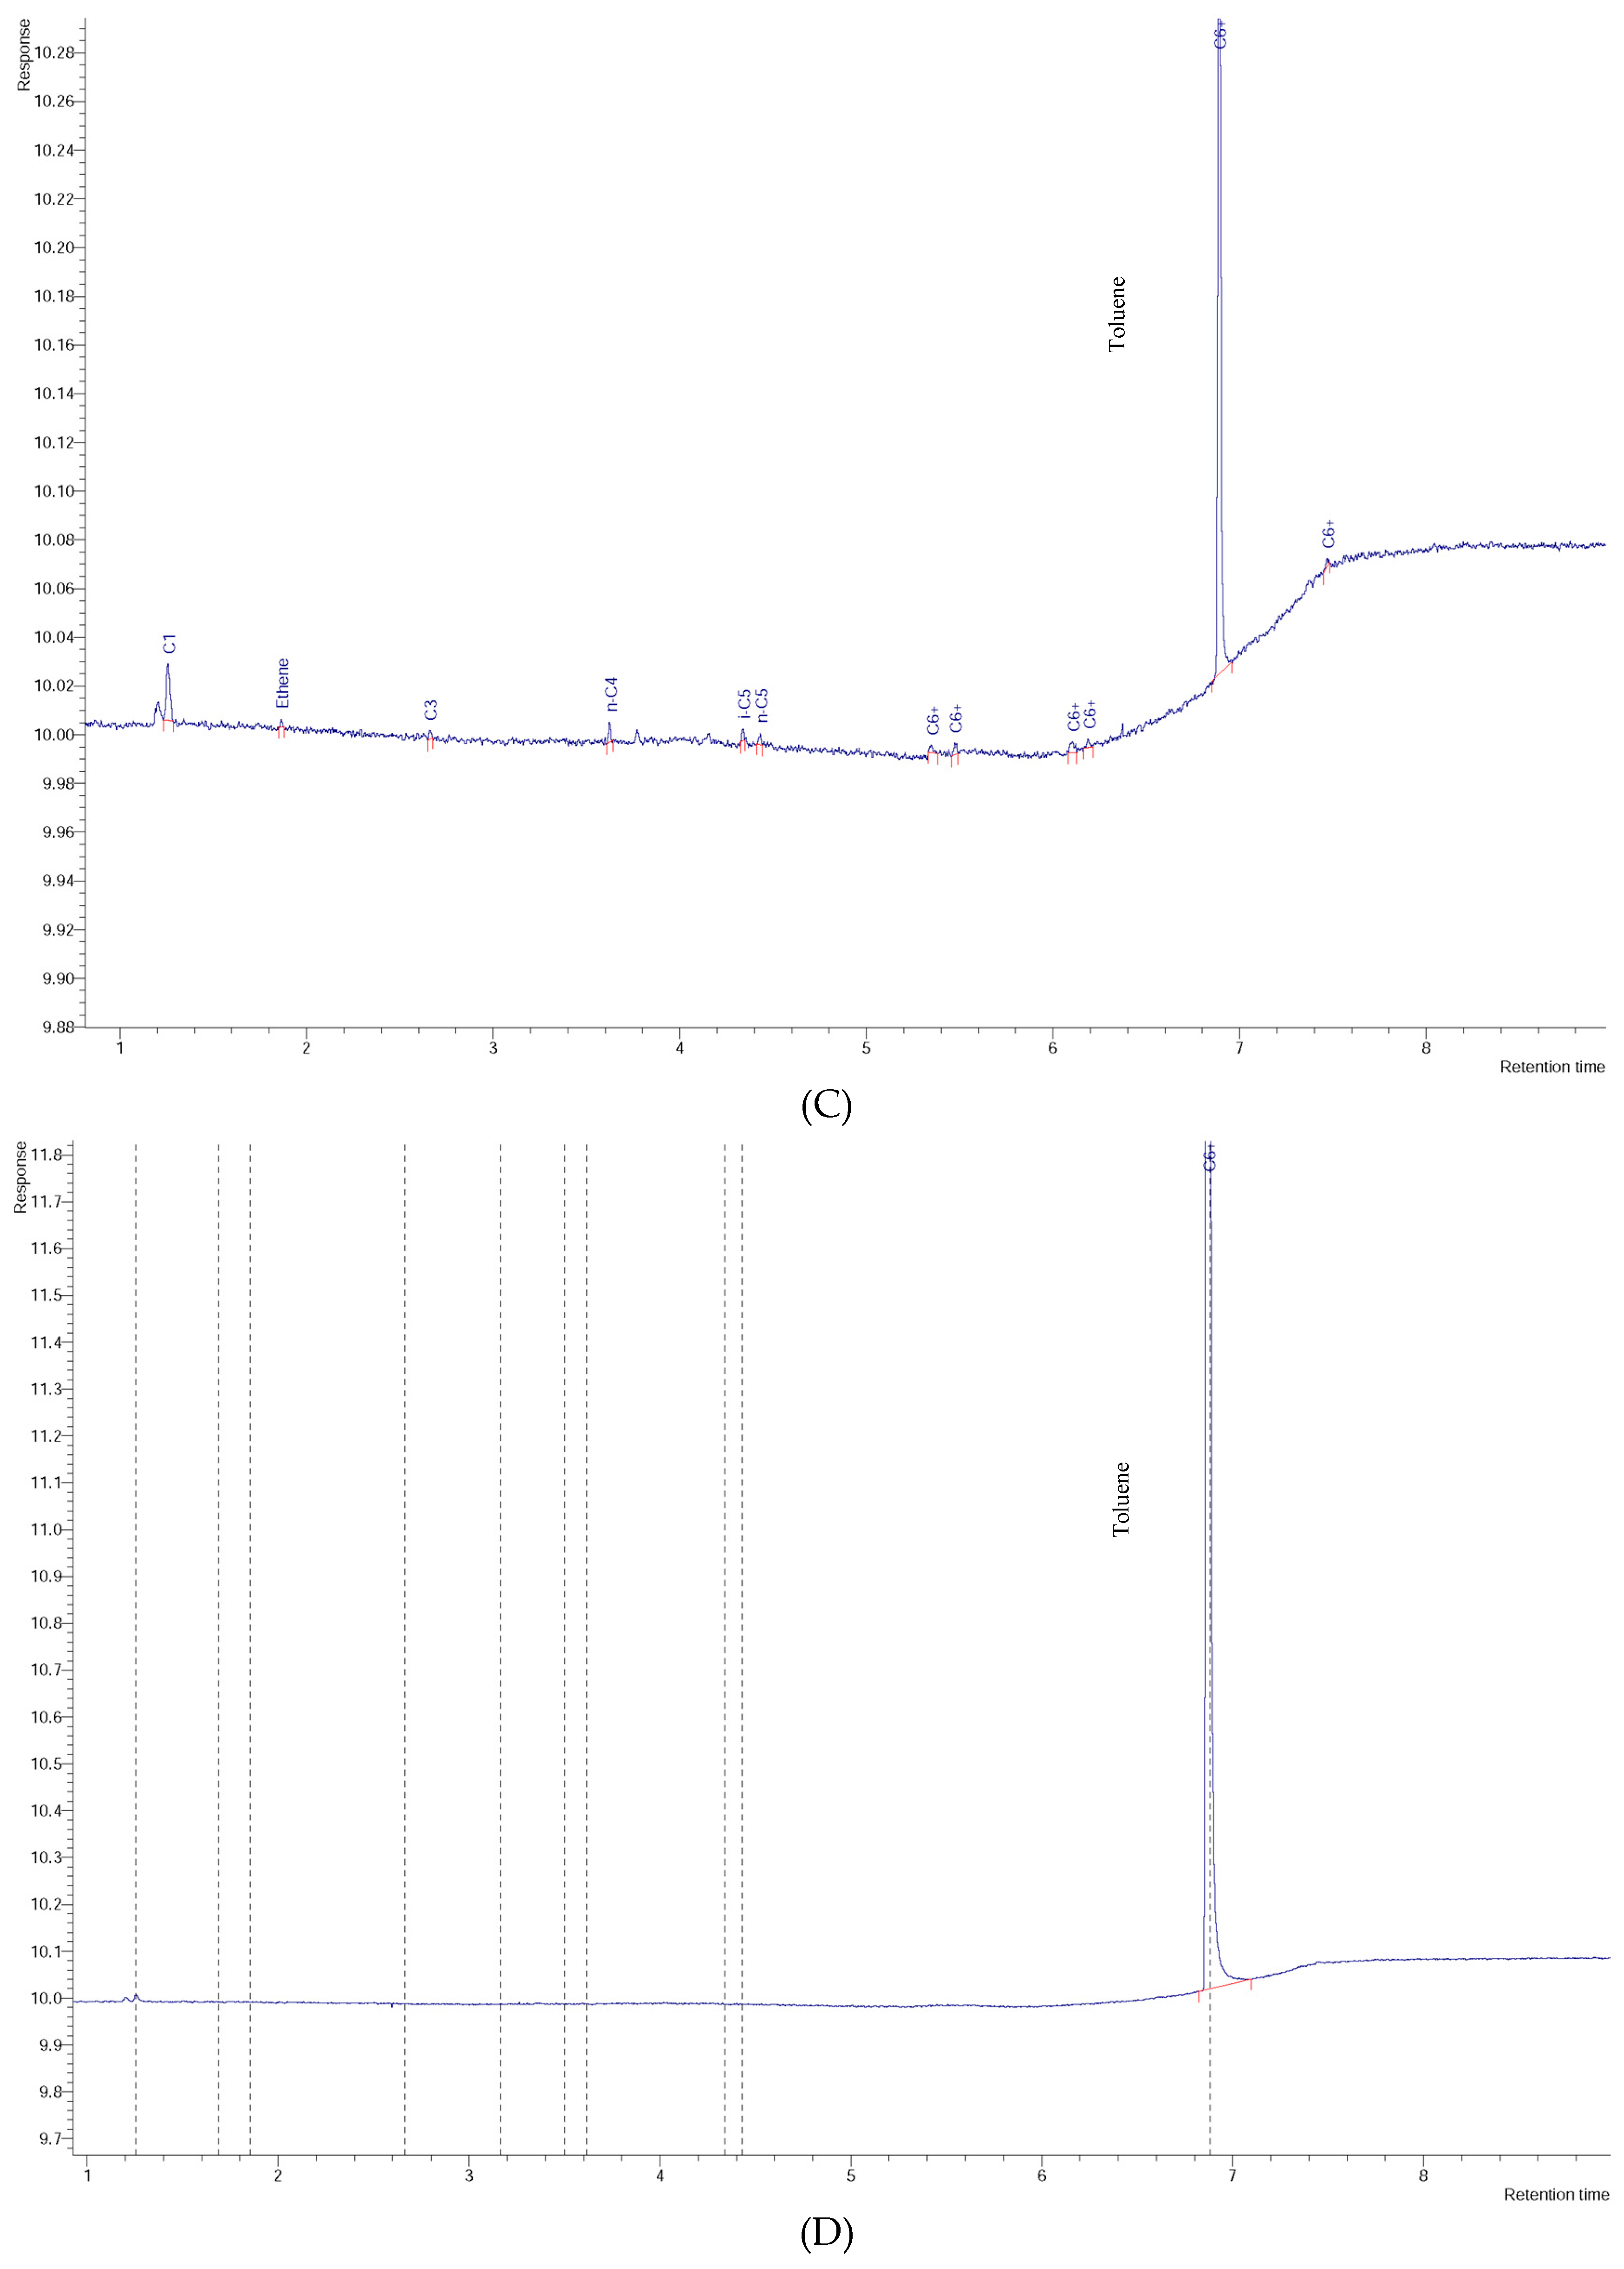
In order to discard the possibility of the expressive amounts of any hydrocarbon coming from the bactericide, the Isotech lab ran a test and kindly shared the results for this study (after sitting 24 h with bactericide the water concentration in C6+ does not changed) and, with the same purpose, the Isolab b.v. injected the used bactericide in the GC-FID. Isolab b.v. also ran a test injecting pure toluene in the GC, in order to confirm the compound vapor pick.

3. Results and Discussion

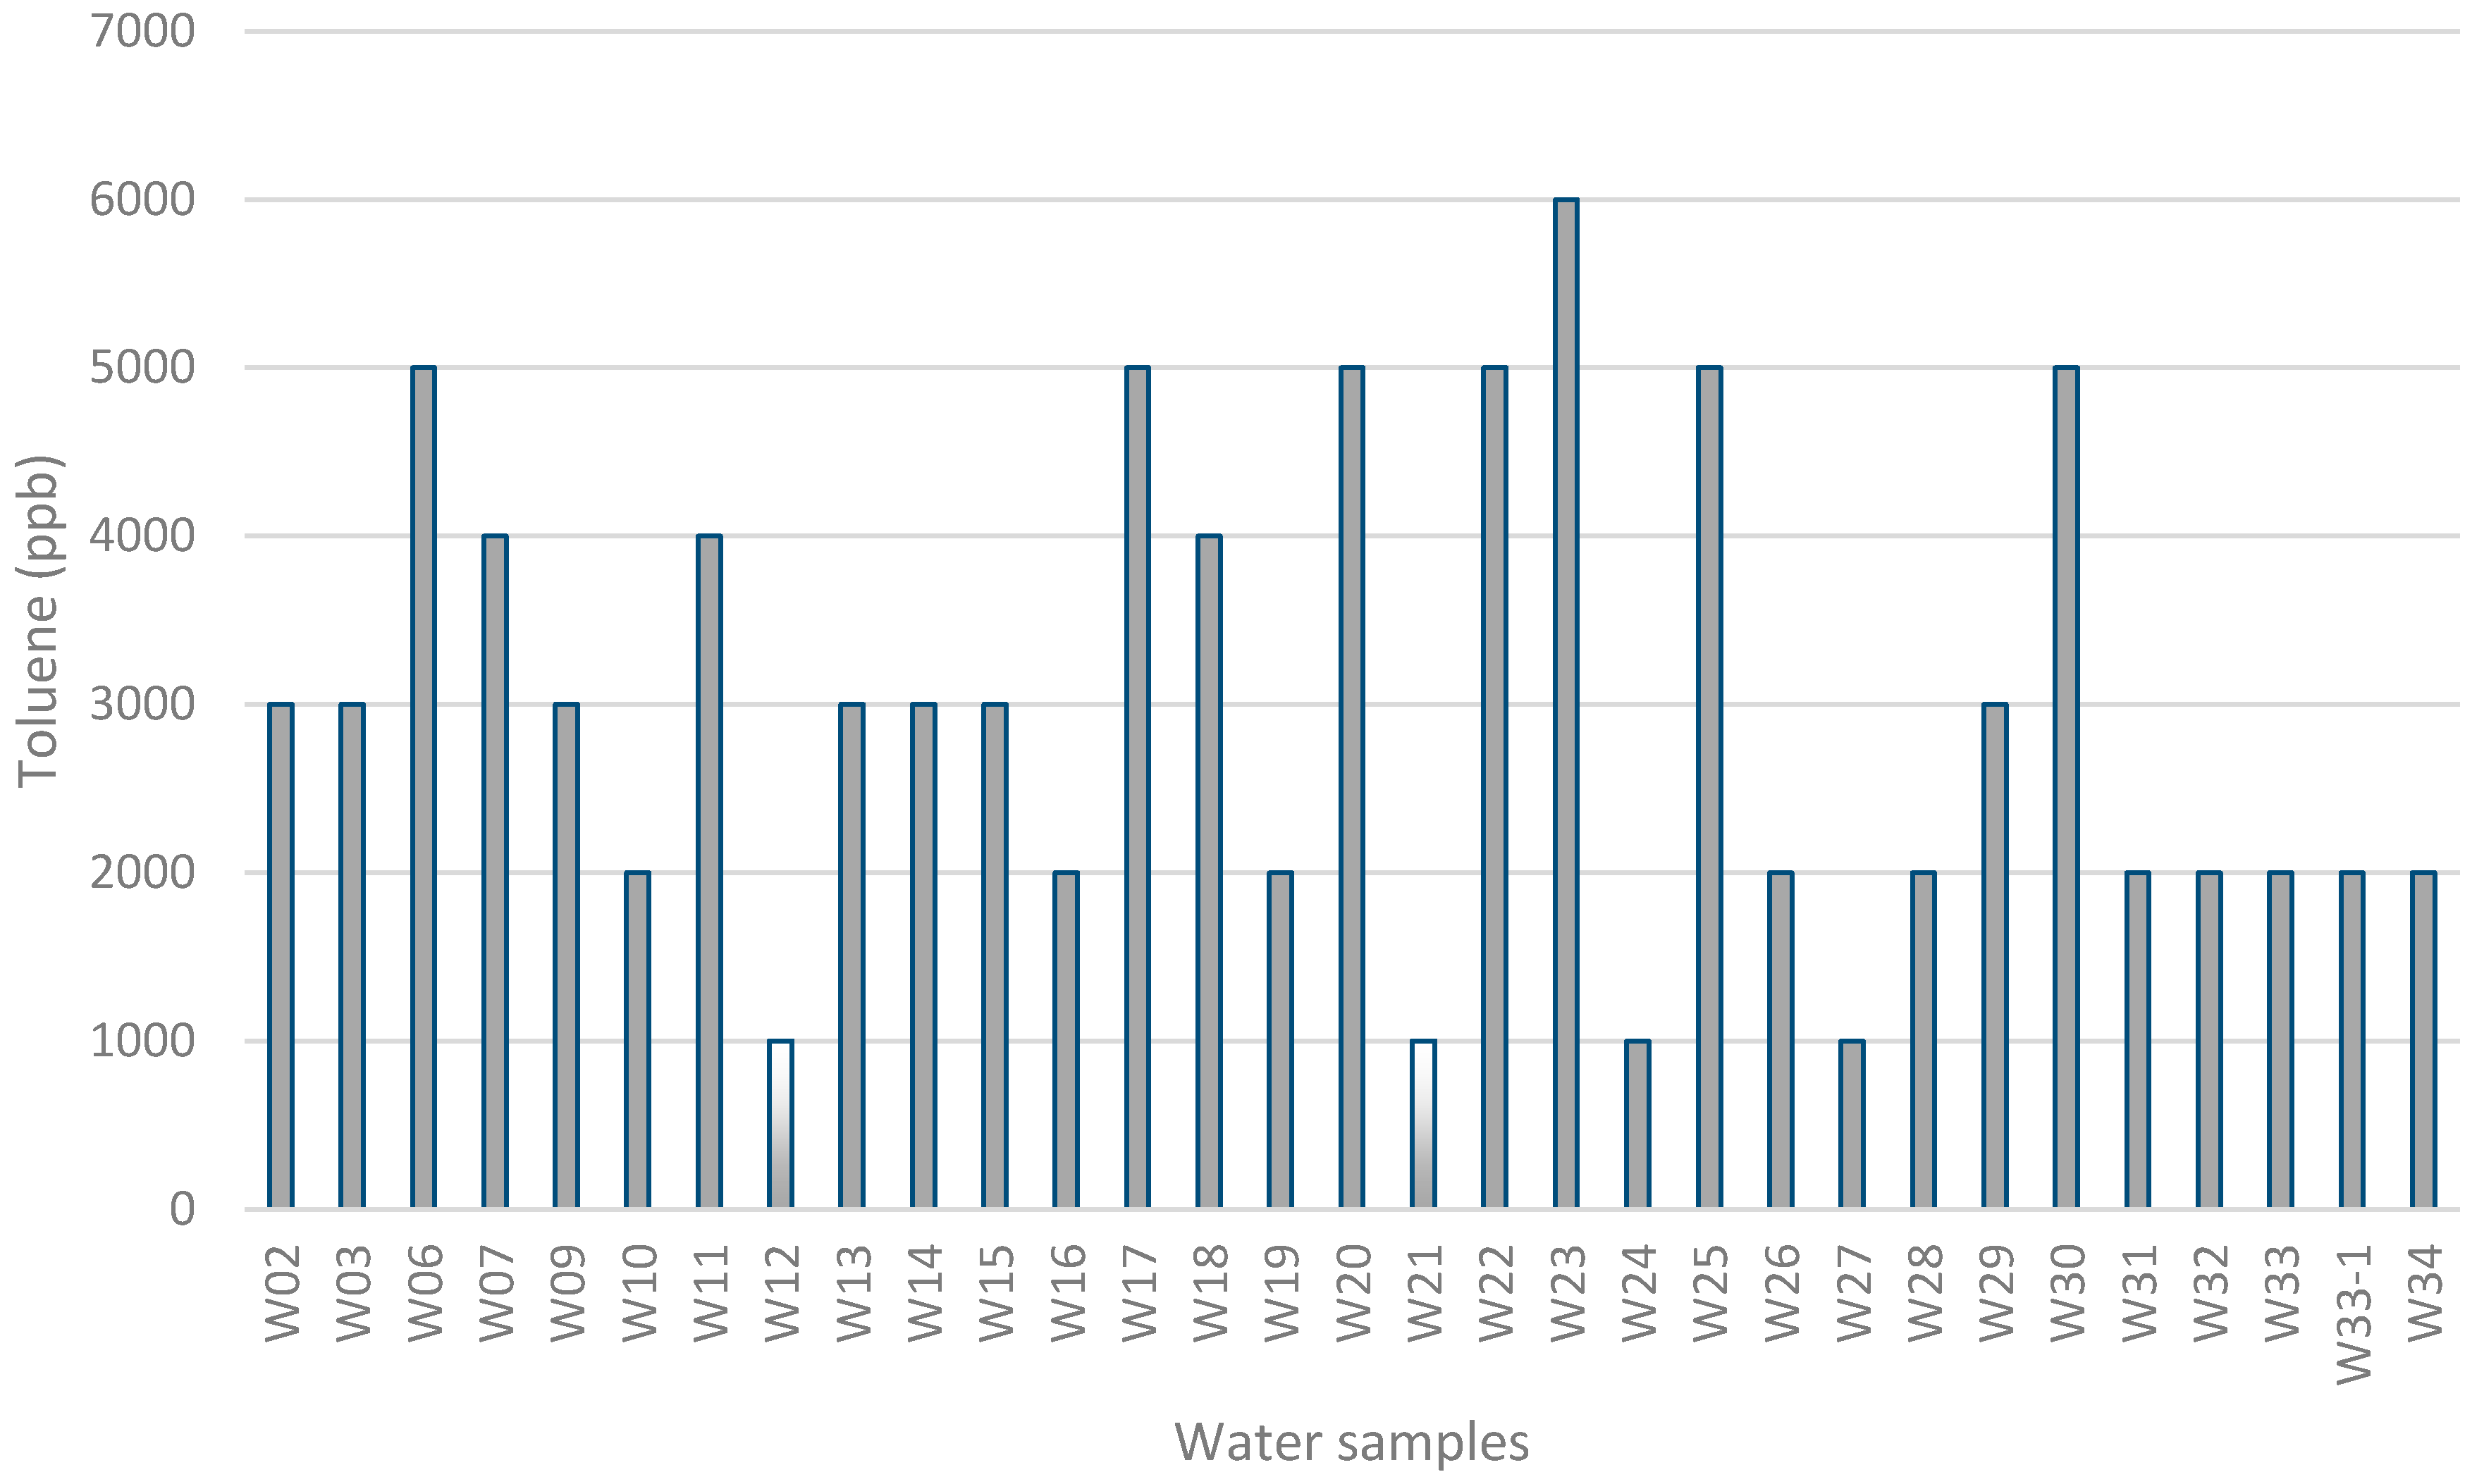
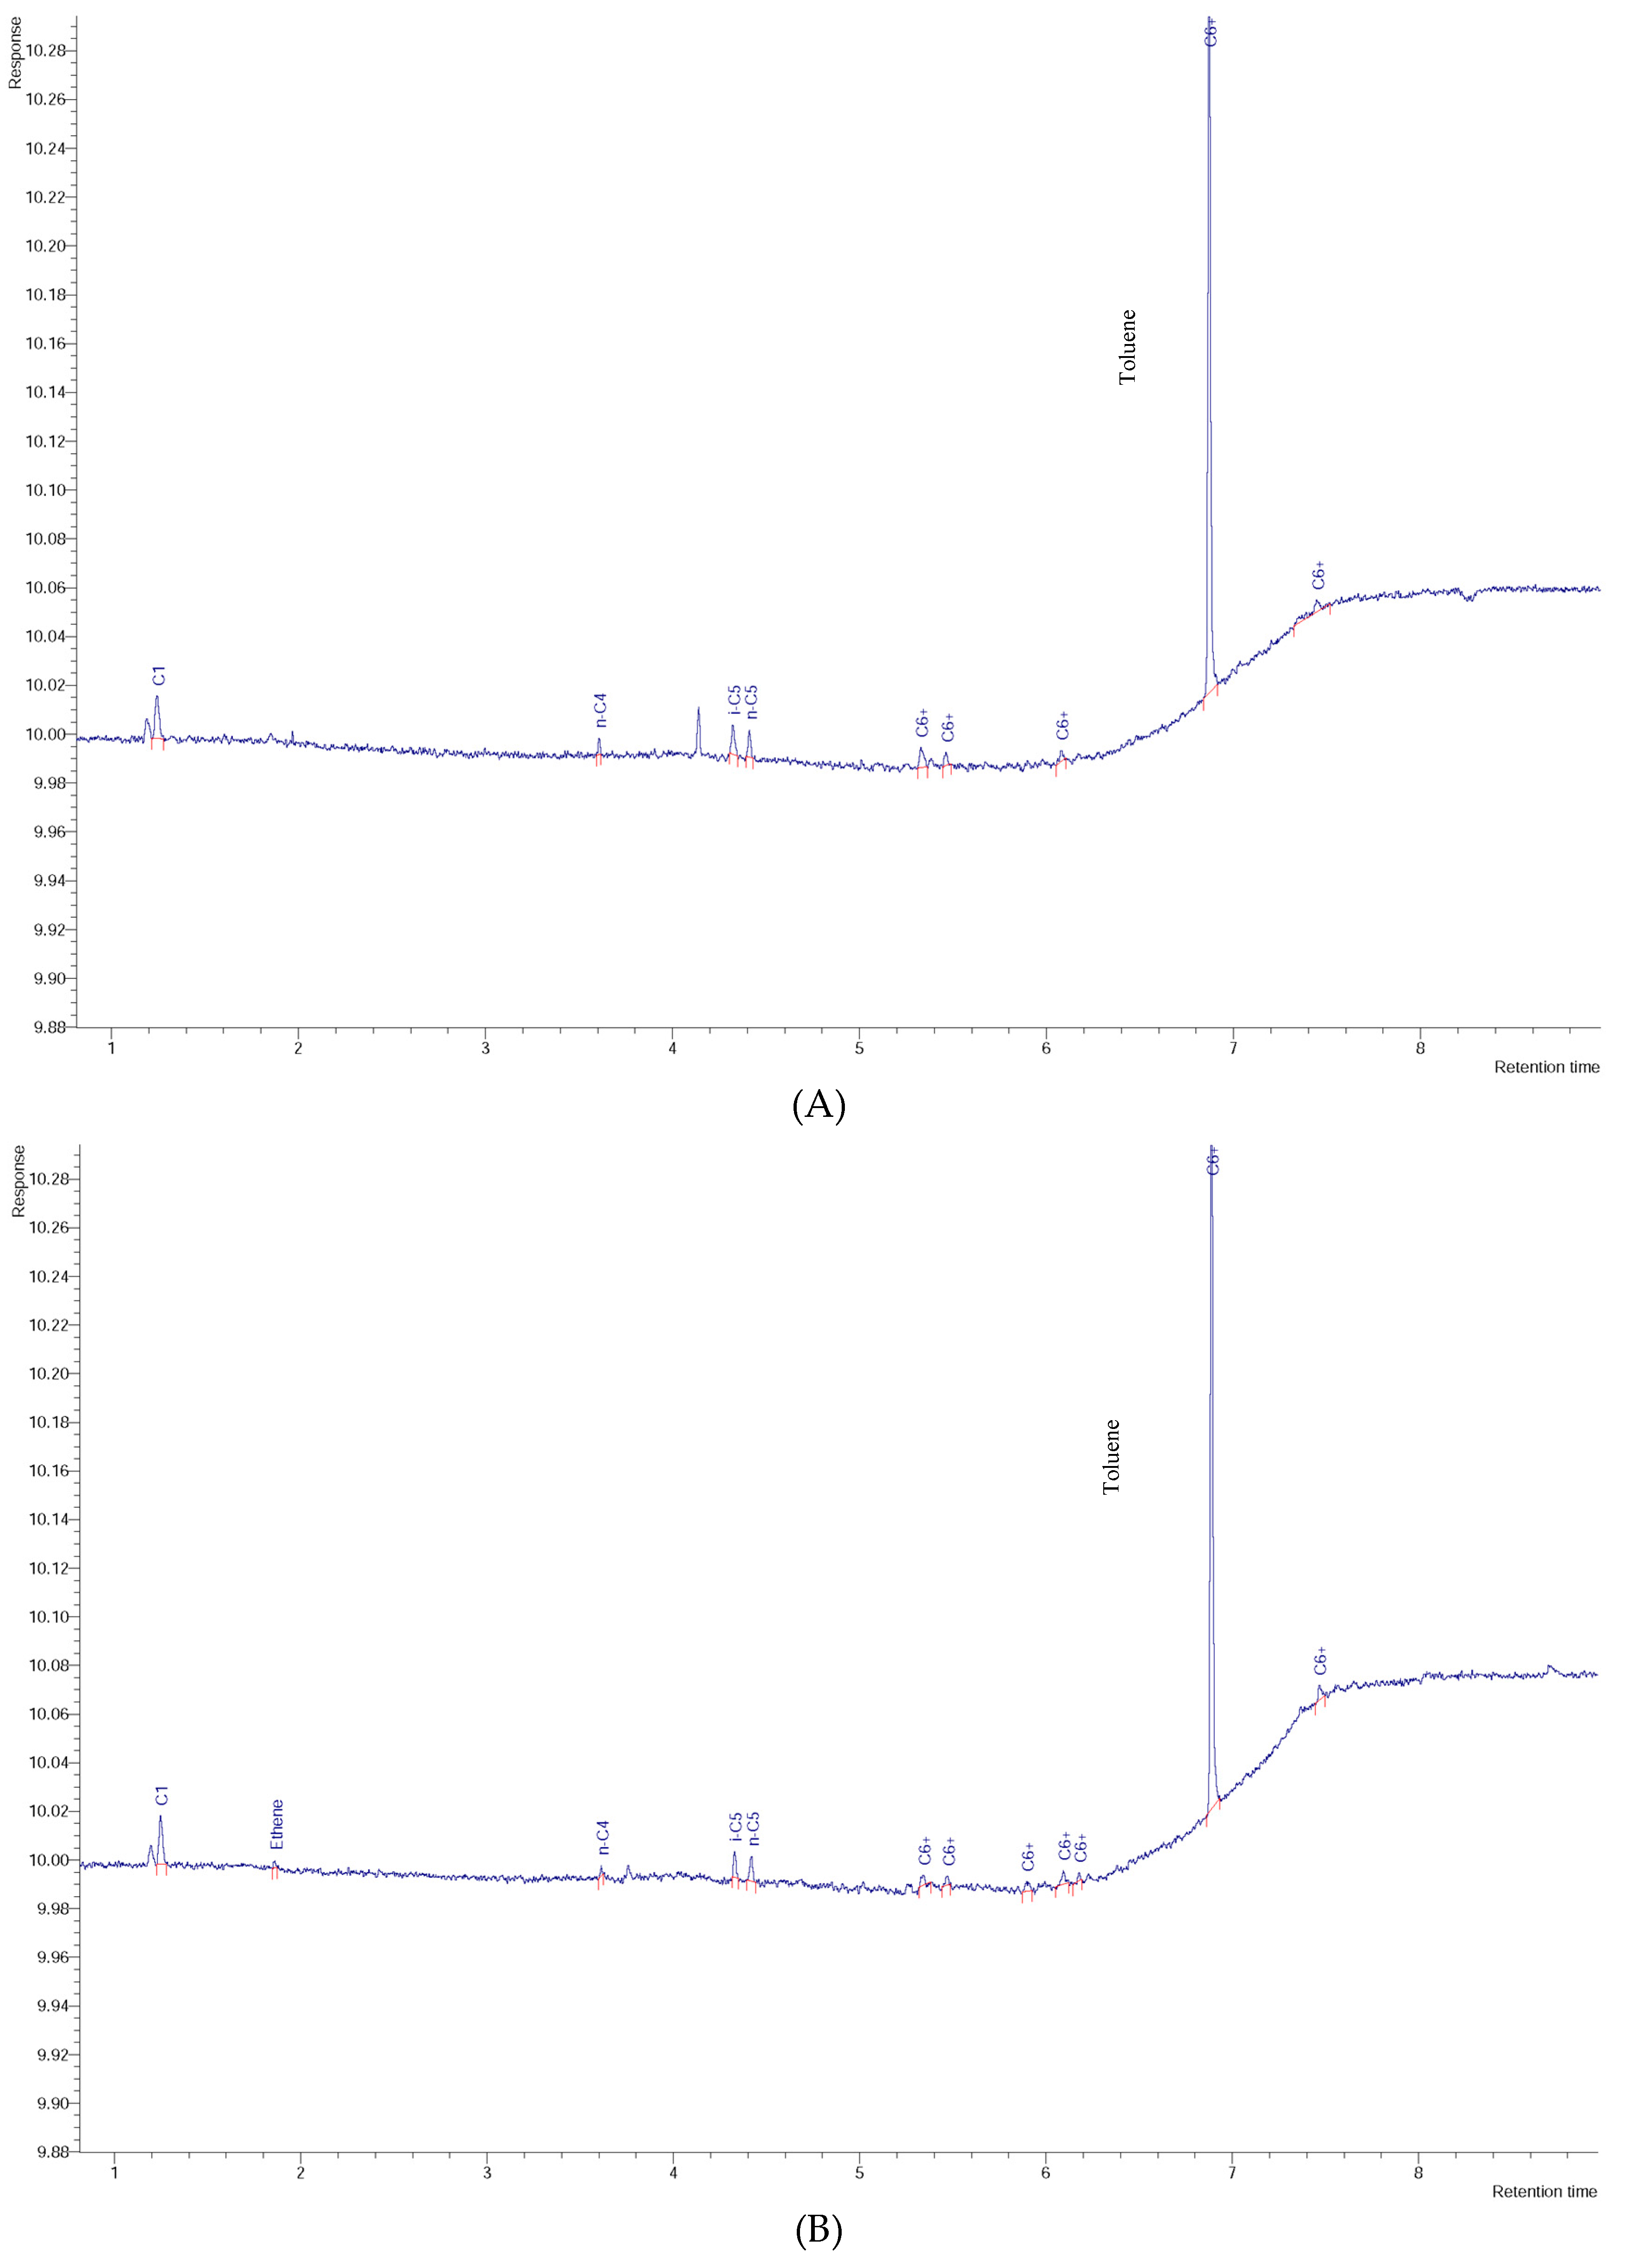
As shown in Figure 6, toluene was detected in all analyzed water samples with 93.5% of the values between 1000 and 6000 μg/L and 55% higher than 3000 μg/L. Figure 7 exemplifies three chromatograms of contaminated water samples (W06, W17, and W23) and the chromatogram of pure toluene. The amounts of toluene in groundwater samples are significantly higher than the values in soil samples, which in general are less than 1000 μg/L. Taking into account that the source of this contamination is the natural petroleum systems, more toluene will likely be found in the groundwater than in the surface (soil). In order to evaluate the spatial distribution of toluene in groundwater, a thematic map was designed (Figure 8), conjugating geological information (faults and formations) with two of concentration values: lower and higher than 1000 μg/L, for water and soil samples.
It is important to note that these amounts were obtained from gas (headspace) phase. This means that, following the partition coefficient of toluene in water-air systems at 20 °C (K = 4.39), the concentration of compound in the original sample (liquid phase), before analysis, is at least 4.39 times bigger [45,46,47]. According to Tipler [47], compounds with a high value for partition coefficients (>1) will favor the liquid phase, whereas compounds with low coefficients (<1) will favor the headspace phase.
The highest level reported in USA groundwater, in 1983, was 1.4 μg/L [2]. Toluene has been reported in industrial effluents in Canada. Raw process effluent from petroleum refineries in Ontario contained an average concentration of toluene of 0.6 μg/L. The average daily concentration for the refinery with the greatest discharge of toluene was 2.1 μg/L (maximum of 17.1 μg/L); the average daily loading was 0.05 kg/day in the process effluent. Still, in Ontario, samples taken in a contaminated shallow aquifer at a depth of 6 m beside an existing industrial chemical waste disposal lagoon, concentrations of toluene above 3900 μg/L were reported [10]. In Europe, maximum toluene levels of 1100 μg/L were reported in groundwater contaminated by point emissions [48].
In a total of more than 800 water samples taken across Canada from 1985 to 1988, concentrations of toluene in only six samples were greater than 0.5 μg/L. These included one surface water sample (0.9 μg/L), one drinking water sample (0.6 μg/L), two groundwater samples (0.6 and 3.9 μg/L), and two samples of undiluted sewage treatment plant effluent (31 and 32 μg/L) [10].
Individual gasoline hydrocarbons were detected infrequently in aquifers in USA. Only one gasoline hydrocarbon, toluene, was detected in more than 1% of aquifer samples, according to Zogorski et al. [17], and in approximately 1% of all groundwater-derived public drinking-water systems in the USA, toluene levels are above 0.5 μg/L [2].
Concentrations of 0.8 μg/L and 1.9 μg/L have been reported in the Rhine River in Germany and Switzerland, respectively [49]. Concentrations in the Morava River in Slovakia range from a winter maximum of 0.58 μg/L to a summer maximum of 3.49 μg/L [2]; in Spain, levels as high as 22 μg/L have been detected at the mouth of the Besos River [50]. In coastal waters, maximum levels of 1 μg/L have been found [2].
According to the ARH Alentejo [51], a measurement of the toluene levels was carried out in the industrial effluent from the Sines refinery, directed for treatment at Ribeira de Moinhos sewage treatment. The results shown toluene levels below 1 μg/L (Figure 2—the refinery is located 62 km from the nearest sampling point and 83 km from the farthest sampling point, on the NW of the sampling zone).
From the health impact point of view and following the health-based guideline (700 μg/L) suggested by the World Health Organization [13], toluene levels of the water for human consumption, in the study area, are of concern. Following the recommended WHO value, considering that the lower measured values (<1000 μg/L) are inserted into this limit, and the values from gas phase are the same as in the original sample (toluene favor the liquid phase in water-air headspace system), the groundwater in the sampling zone is contaminated by toluene (Figure 6 and Figure 8). The analysis of the values mentioned above highlight the degree of contamination reported in this study. The detected levels are much higher than is usually found in groundwater, being only comparable with severe industrial contamination [10,15].
Light hydrocarbons (C1 to C4) very often originate from both thermogenic and biogenic processes. Normally, the hydrocarbons in the gasoline range (that consist of volatile organic compounds between 4 and 12 carbon atoms per molecule, including toluene) originate thermogenically and are therefore associated with petroleum systems [41]. Following the natural contamination point of view, Collins [52] believes that natural concentrations of toluene and benzene in water are hydrochemical indexes that indicate the presence of petroleum system in subsurface. Accumulations of oil and gas can give rise to the presence of a number of low molecular weight hydrocarbons (petroleum is the main source of benzene and toluene in oilfield waters) that have low odor thresholds in drinking-water [13,52].
According to Seneshen et al. [53], there are strong toluene anomalies in soils over the northwest part of Lisbon field (San Juan County, UT, USA) that are upwind of hydrocarbon production. Natural organic contamination of groundwater with BTEX (benzene, toluene, ethyl-benzene, and xylene) are abundant next to oil and gas fields in the Gulf of Mexico [54,55].
No significant benzene levels were detected above GC-FID detection limit, but this absence can be explained by the biodegradation and oxidation in water, which can be more active in benzene than in toluene. According to Prince & Walter [16], it is reasonable to expect that the biodegradation of a broad range of compounds will be enhanced in the presence of toluene. Gülensoy & Alvarez [56] reported enhanced aerobic biodegradation of benzene, p-xylene, and naphthalene by several pseudomonads when toluene was present, and a similar phenomenon occurred under anaerobic conditions [57].
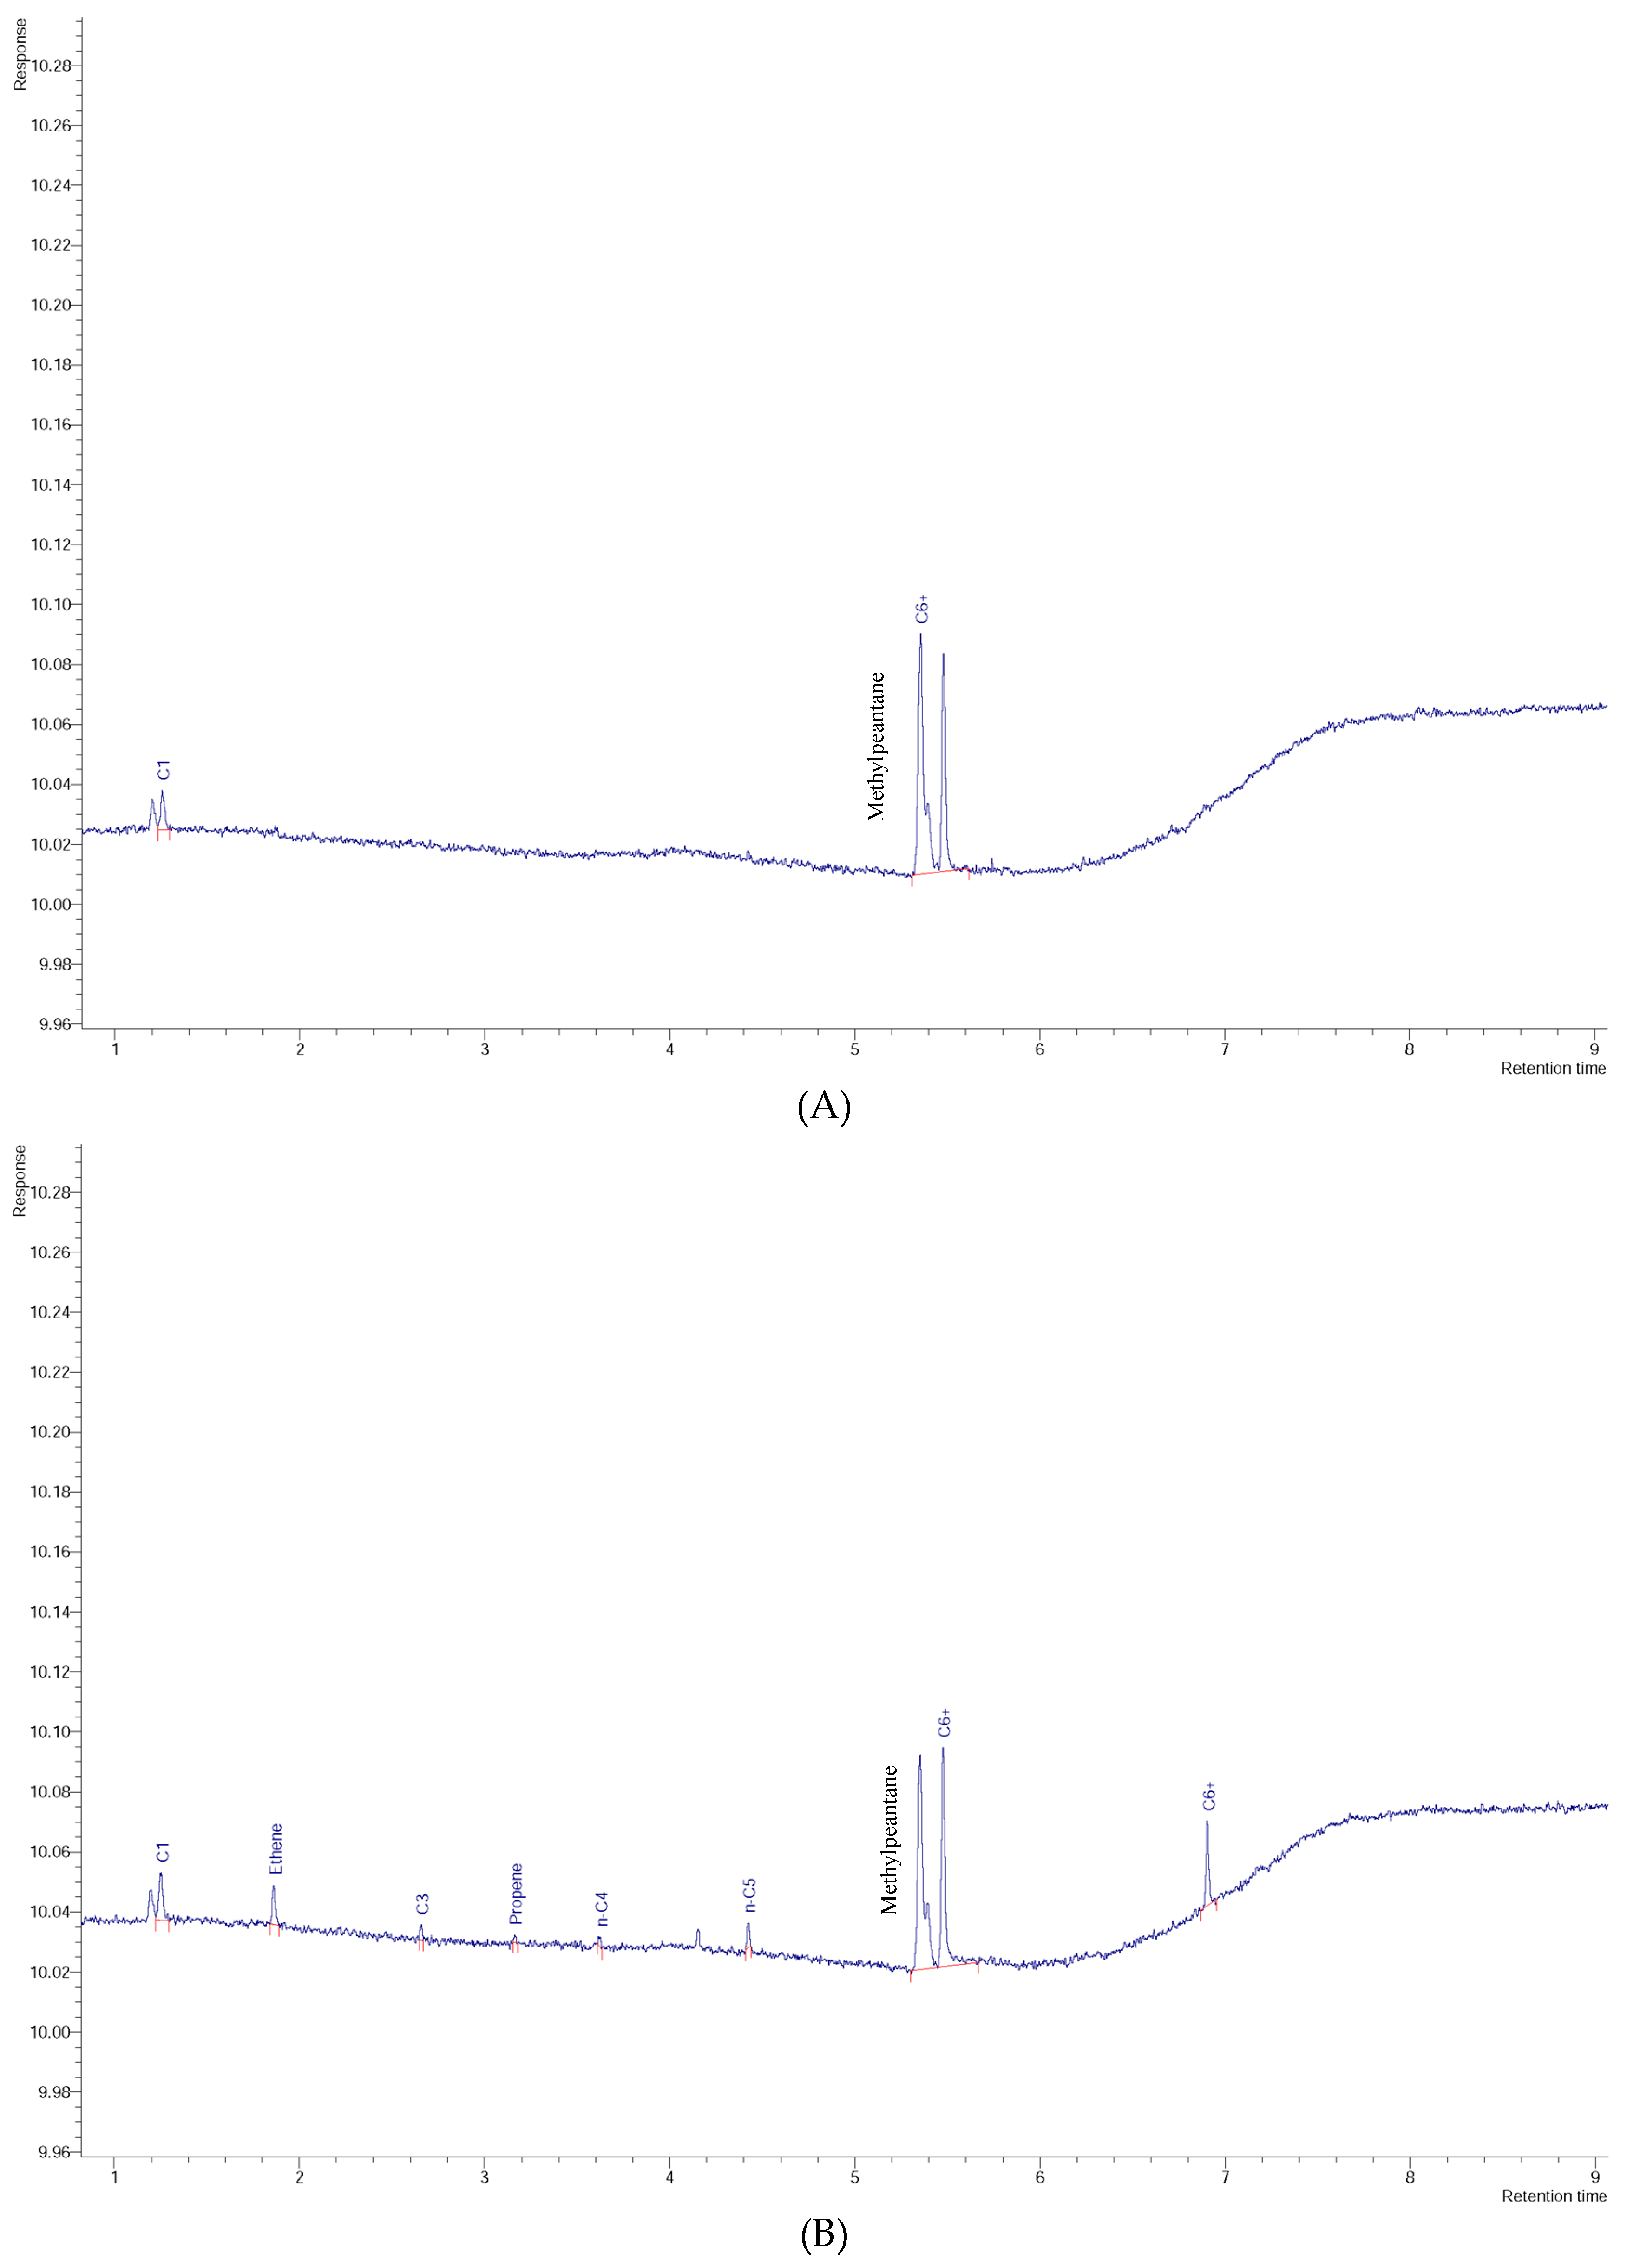
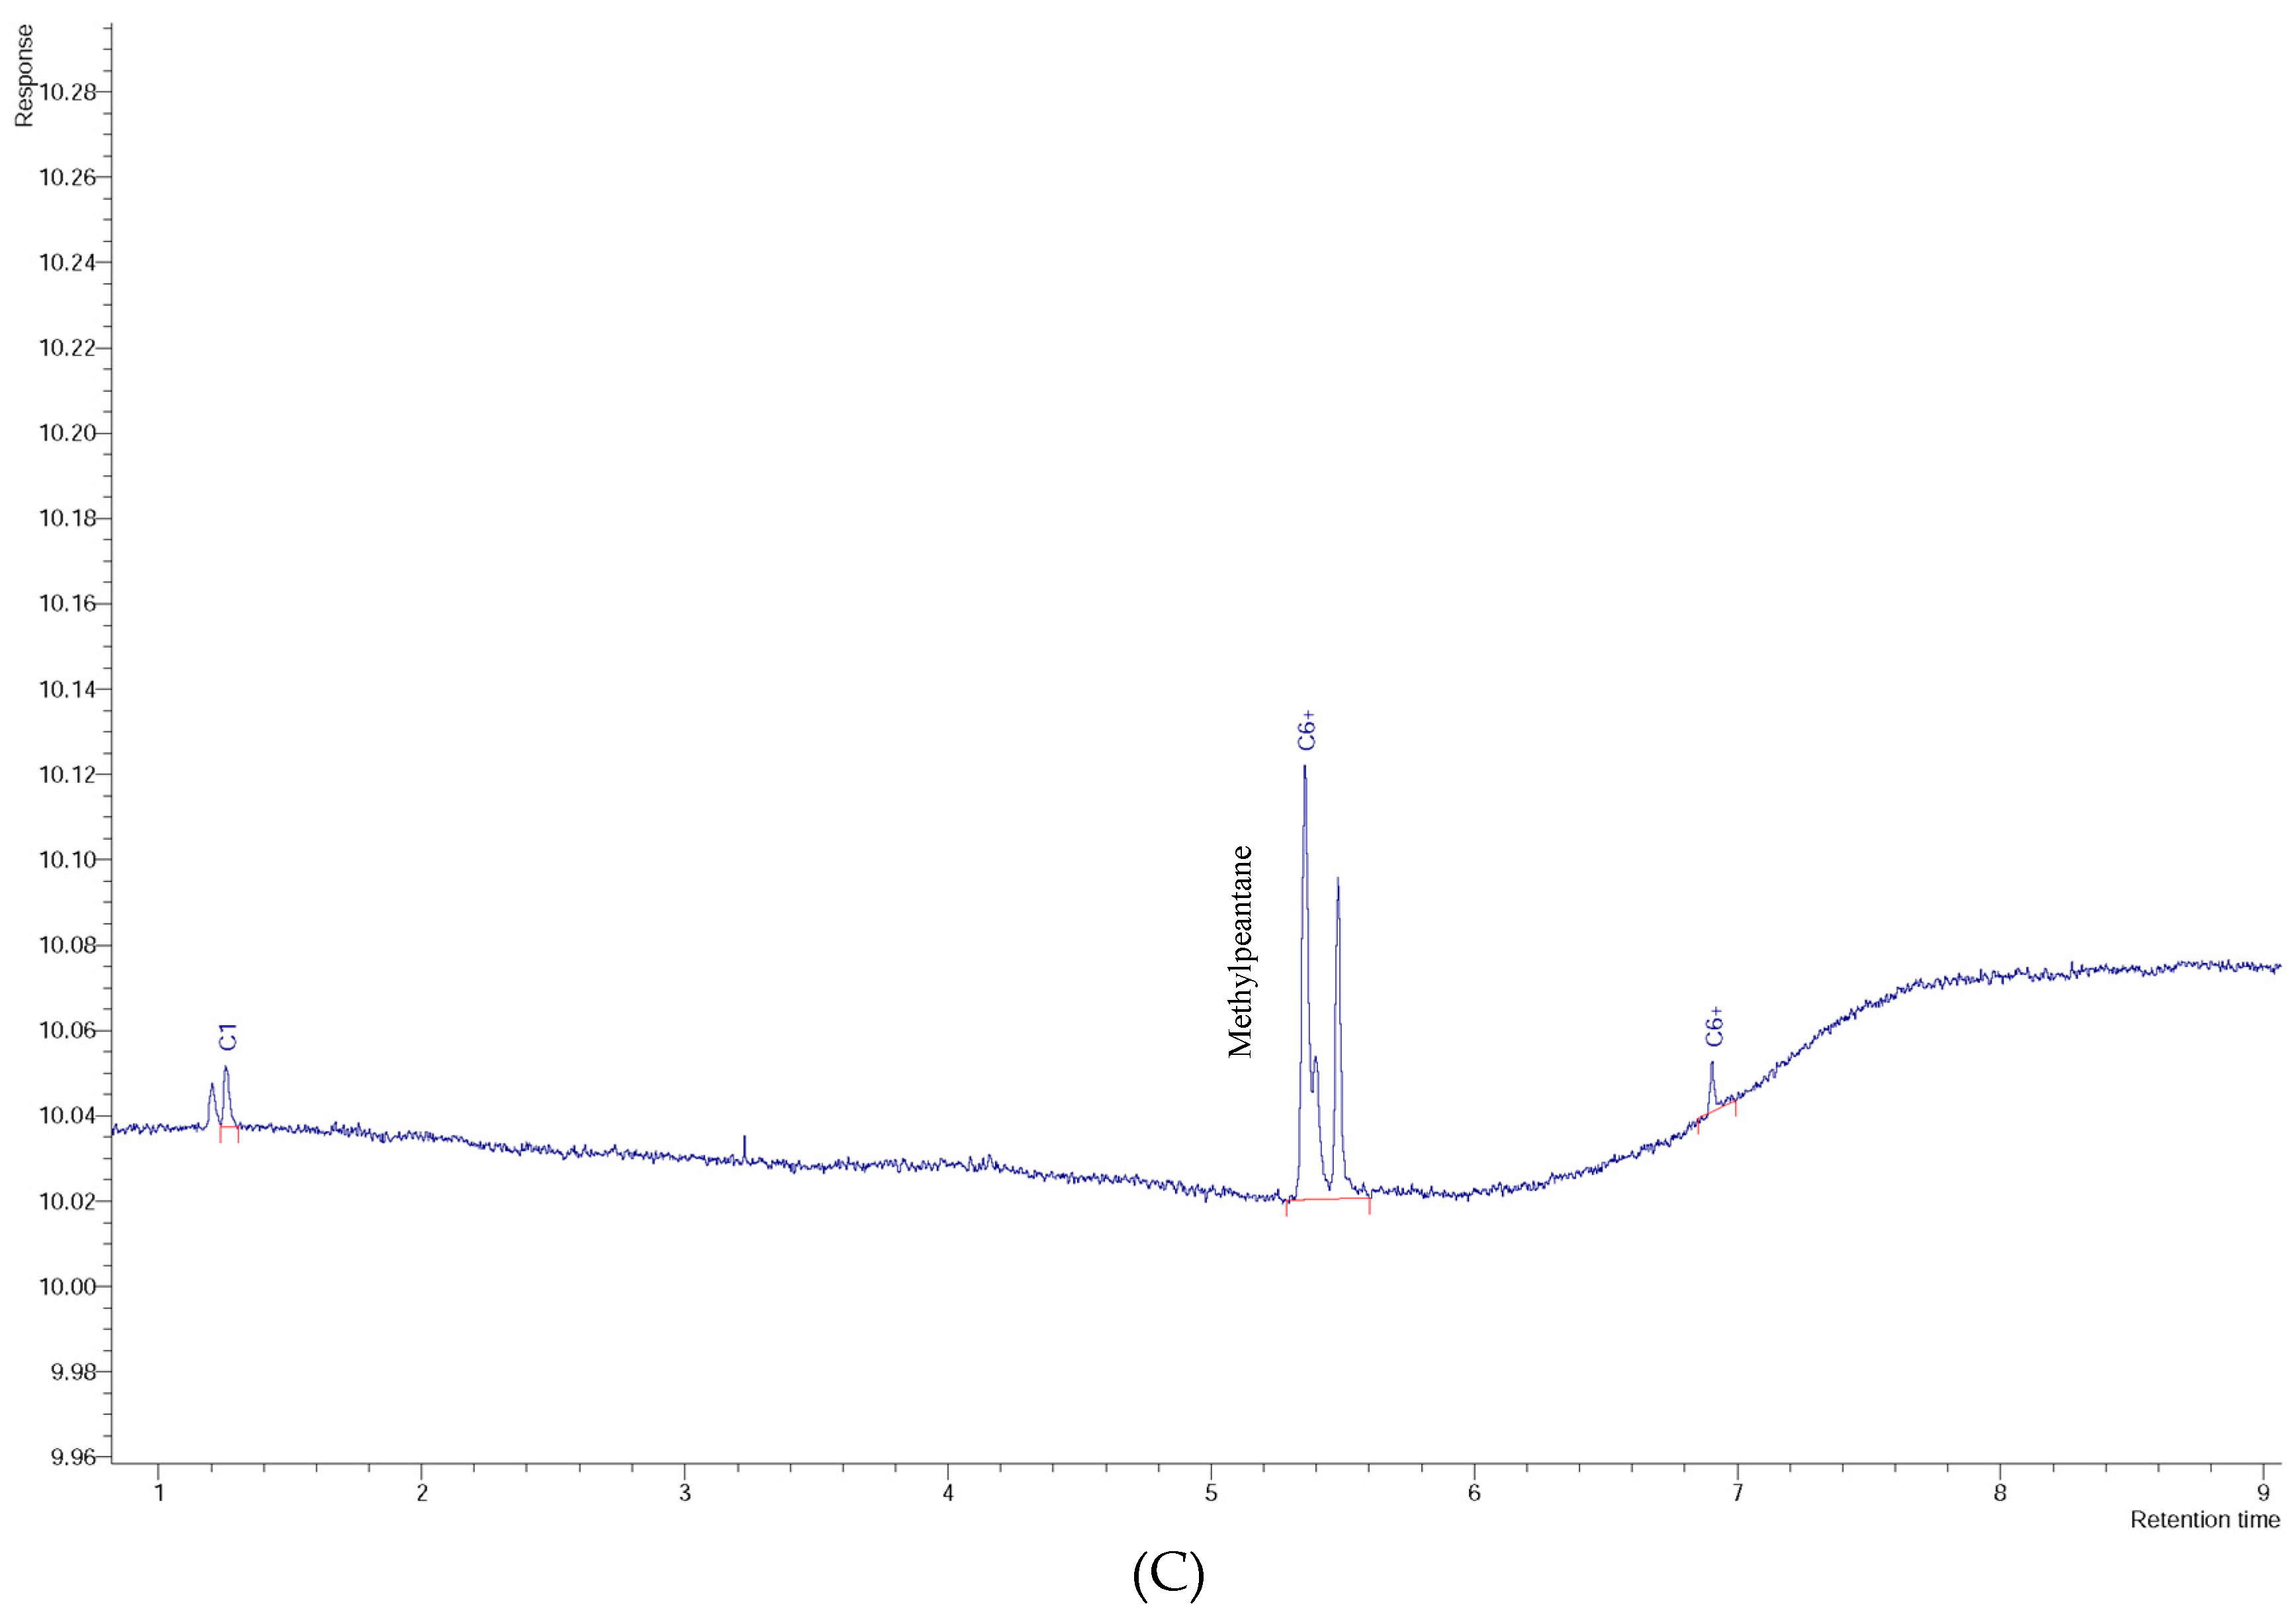
It is also important to note the presence of other two hydrocarbons in soil-water samples in the study area. The significant presence of 2-methylpentane (Figure 9 exemplifies three chromatograms of contaminated soil samples, SPZ-07, SPZ-15, and SPZ-16) in all soil samples, that, according to Seneshen et al. [53], is anomalous in two adjacent samples over a distance of 150 m and in one isolated sample over a gas field in the Lisbon field (San Juan County, UT, USA). Two water samples (W33 and W34) from two different boreholes (a few meters apart) contain worrying levels of methane (CH4). According to Eltschlager et al. [33], recommended action levels for CH4 dissolved in water suggest that when the level is between 10,000 and 28,000 μg/L, monitoring is required, and immediate action is needed above 28,000 μg/L. The sample W33 has a concentration of 12,000 μg/L of CH4, and W34 contains 70,000 μg/L (in the headspace phase), presenting a serious risk of borehole explosion, as the water is fully saturated with methane and the air is now flammable.
According to WHO [13], the maximum contaminant level (MCL), or the health-based guideline, for toluene in drinkable water is 700 μg/L (Table 1). It is readily absorbed completely from the gastrointestinal tract after ingestion and rapidly distributed in the body, with a preference for adipose tissue then for the kidneys, liver, and brain [1,13]. Toluene is rapidly metabolized and, following conjugation, excreted predominantly in urine [13]. Therefore, potential health effects from long-term exposure above the toluene MCL are in nervous systems, brain, kidney, and/or liver, with problems with fatigue and drowsiness being the most obvious symptoms [1,58].
The existence of the vertical or near-vertical migration of hydrocarbons from petroleum systems has been controversial for many years. Arguments against it have included the following. (1) If reservoirs leaked enough to be detected, they would have been depleted a long time ago; (2) If seepage did occur, it would be deflected by groundwater movements, and anomalies would be displaced laterally for relatively long distances [27]. According to Hale [40], the ways that gases move through subsurface natural environment are more diverse and less well characterized than mechanisms of solid and liquid phases dispersion. However, in the gas phase percolation, diffusion and mass flow are both well-established mechanisms and each has a role to play in gas transport in the subsurface. Their relative contributions to gas migration at different positions in the crust are less certain.
A more controversial mechanism, applicable to gas transport through groundwater, is gas streaming [44]. Buoyant hydrocarbon microbubbles rising through the water-filled network of fractures, joints, and bedding planes provide a logical mechanism for vertical migration of hydrocarbons from reservoirs to the surface and commonly occupy the pore voids in rocks, overburden, and soil [27,44]. Kristiansson & Malmqvist [50,59] and Malmqvist & Kristiansson [60,61] hypothesize that, in the zone of saturation, pressure gradients and pressure shocks cause over-saturation, leading to the formation of gas bubbles. These stream upward at a comparatively rapid rate until they reach the water table (any hydrocarbon that dissolves in groundwater could, given the appropriate conditions, migrate by streaming) and mix with the soil air. The resulting mixture is then driven slowly further upward by the pressure gradient caused by the bubble stream [44].

4. Conclusions

The toluene contamination levels, in the water samples from Beja and Faro Districts (1000–6000 μg/L), are much higher than is usually found in other places (even considering just the headspace phase concentration), being only comparable with values from severe industrial contamination. Possible anthropogenic/industrial contamination is practically discarded because the sampling area is isolated, sparsely populated, and with few gas stations. Furthermore, the presence of 2-methylpentane in all soil samples, and high concentration of methane in water samples from boreholes, are an indication that the natural unconventional petroleum system in SPZ is probably responsible for the groundwater and soil contamination by hydrocarbons.
Given that the geographical dispersion of soil and groundwater contamination is not yet known, the results presented in this paper are relevant for the Portuguese and Spanish Governments (SPZ formations are inserted in both territories). According to the MCL for toluene in drinkable water (700 μg/L), determined by WHO [13], contaminated groundwater represents a serious concern to the health of the residents, who should be informed to avoid drinking it or using it for other domestic purposes. Artesian wells with high methane levels represent a serious potential for borehole explosion, and immediate action is necessary to avoid this consequence.

Acknowledgments

This study was financed by CNPq (Brazil), Statoil (Norway-Brazil), FCT (Portugal). The authors would like to thank Isolab b.v. (The Netherlands) and Isotech (USA). The authors also would like to thank Giuliana Gigliotti and anonymous reviewers for the contributions.

Author Contributions

Gabriel A. Barberes, Rui Pena dos Reis, André L. D. Spigolon, and Paulo E. Fonseca conceived and designed the experiments; Gabriel A. Barberes performed the experiments; Gabriel A. Barberes, Rui Pena dos Reis, André L. D. Spigolon, Paulo E. Fonseca, Carlos Bandeira de Mello, and Maria Teresa Barata analyzed the data; Gabriel A. Barberes wrote the paper.

Conflicts of Interest

The authors declare no conflict of interest.

References

  1. Agency for Toxic Substances and Disease Registry (ATSDR). Toxicological Profile for Toluene. US Department of Health and Human Services; Agency for Toxic Substances and Disease Registry: Atlanta, GA, USA, 2017; p. 496.
  2. World Health Organization (WHO). Toluene in Drinking-Water; Background Document for Development of WHO Guidelines for Drinking-Water Quality; WHO Graphics: Geneva, Switzerland, 2004; p. 9. [Google Scholar]
  3. Stout, S.A.; Wang, Z. Chemical fingerprinting methods and factors affecting petroleum fingerprints in the environment. In Standard Handbook Oil Spill Environmental Forensics; Stout, S.A., Wang, Z., Eds.; Elsevier: Amsterdam, The Netherlands, 2016; pp. 61–129. ISBN 9780128096598. [Google Scholar]
  4. Bandeira de Mello, C.S.; Miller, D.J. Risks to Health from Organic Substances. In Workshop International of Medical Geology; Silva, C.R., Figueiredo, B.R., Capitani, E.M., Cunha, F.G., Eds.; CPRM: Belo Horizonte, Brazil, 2005; p. 206. [Google Scholar]
  5. Agency for Toxic Substances and Disease Registry (ATSDR). Support Document to the 2015 Priority List of Hazardous Substances That Will Be Candidates for Toxicological Profiles; Agency for Toxic Substances and Disease Registry Division of Toxicology and Human Health Sciences: Atlanta, GA, USA, 2015; p. 12.
  6. Kaplan, I.R.; Galperin, Y.; Lu, S.T.; Lee, R.P. Forensic Environmental Geochemistry: Differentiation of fuel-types, their sources and release time. Org. Geochem. 1997, 27, 289–317. [Google Scholar] [CrossRef]
  7. Australian Environment Protection Authority (EPA). EPA Guidelines for Environmental Management of On-Site Remediation; Environment Protection Authority: Carlton, Australia, 2006; p. 33. ISBN 192112511X.
  8. Ramachandra, T.V. Soil and Groundwater Pollution from Agricultural Activities; Commonwealth of Learning Indian Institute of Science: Bangalore, India, 2006; p. 352. [Google Scholar]
  9. Kirk, R.E.; Othmer, D.F.; Grayson, M.; Eckroth, D. Kirk-Othmer Encyclopedia of Chemical Technology, 5th ed.; John Wiley: New York, NY, USA, 2004; 22950p, ISBN 9780471238966. [Google Scholar]
  10. Government of Canada. Toluene—Priority Substances List Assessment Report Nº 4; Canadian Environmental Protection Act; Canada Communication Group: Toronto, ON, Canada, 1992; p. 26.
  11. McGraw-Hill (Ed.) Dictionary of Chemistry, 2nd ed.; McGraw-Hill: New York, NY, USA, 2003; p. 431. ISBN 9780071410465. [Google Scholar]
  12. Daintith, J. Dictionary of Science, 15th ed.; Oxford University Press: Oxford, UK, 2005; p. 888. ISBN 9780198738374. [Google Scholar]
  13. World Health Organization (WHO). Guidelines for Drinking-Water Quality; WHO Graphics: Geneva, Switzerland, 2011; p. 541. [Google Scholar]
  14. U.S. Environmental Protection Agency (US EPA). Occurrence of Synthetic Organic Chemicals in Drinking Water, Food, and Air. PB89-192520; Office of Drinking Water: Washington, DC, USA, 1987; p. 175.
  15. Leusch, F.; Bartkow, M. A Short Primer on Benzene, Toluene, Ethylbenzene and Xylenes (BTEX) in the Environment and in Hydraulic Fracturing Fluids; Griffith University Press: Brisbane, Australia, 2010; p. 8. [Google Scholar]
  16. Prince, R.C.; Walters, C.C. Biodegradation of oil hydrocarbons and its implications for source identification. In Standard Handbook Oil Spill Environmental Forensics; Stout, S.A., Wang, Z., Eds.; Elsevier: Amsterdam, The Netherlands, 2016; pp. 869–916. ISBN 9780128096598. [Google Scholar]
  17. Zogorski, J.S.; Carter, J.M.; Ivahnenko, T.; Lapham, W.W.; Moran, M.J.; Rowe, B.L.; Squillace, P.J.; Toccalino, P.L. The Quality of Our Nation’s Waters—Volatile Organic Compounds in the Nation’s Ground Water and Drinking-Water Supply Wells; U.S. Department of the Interior: Washington, DC, USA; U.S. Geological Survey: Reston, VA, USA, 2006; p. 101.
  18. Gilbert, D.; Woodruff, C.; Preston, A.; Thomas, R.; Wood, M. Exposure and Risk Assessment for Toluene. PB8S-221505; National Technical Information Service: Springfield, VA, USA, 1983; p. 182.
  19. Lawrence, S.J. Description, Properties, and Degradation of Selected Volatile Organic Compounds Detected in Ground Water—A Review of Selected Literature; Department of the Interior, U.S. Geological Survey: Reston, VA, USA, 2006; p. 54.
  20. Maier, U.; Mayer, U.; Crathwohl, P. Natural Attenuation of Volatile Hydrocarbons in the Unsaturated Zone—Modeling for the Vaerlose field site. In Bringing Groundwater Quality Research to the Watershed Scale; Thomson, N.R., Ed.; IAHS Public: Hamilton, ON, Canada, 2005; p. 297. [Google Scholar]
  21. Jarvie, D.M. Shale resources systems for oil and gas: Part 1—Shale-gas resources systems. In Shale Reservoirs—Giant Resources for the 21st Century; Breyer, J.A., Ed.; AAPG: Tulsa, OK, USA, 2012; pp. 69–87. ISBN 9780891813798. [Google Scholar]
  22. Boyer, C.; Clark, B. Shale Gas: A Global Resource. OilField Rev. 2011, 23, 28–39. [Google Scholar]
  23. Kent, P.; Lee, J. Unconventional Gas Reservoirs—Tight Gas, Coal Seams, and Shales. Work. Doc. NPC Glob. Oil Gas Study 2007, 29, 54. [Google Scholar]
  24. Ground Water Protection Council and All Consulting. Modern Shale Gas Development in the United States: A Primer; US Department of Energy Office and Fossil Energy and National Energy Technology Laboratory: Washington, DC, USA, 2009; p. 98.
  25. Law, B.E.; Curtis, J.B. Introduction to Unconventional Petroleum Systems. AAPG Bull. 2002, 86, 1851–1852. [Google Scholar] [CrossRef]
  26. Etiope, G. Natural Gas Seepage—The Earth’s Hydrocarbon Degassing; Springer: Cham, Switzerland, 2015; p. 199. ISBN 9783319146010. [Google Scholar]
  27. Saunders, D.F.; Burson, K.R.; Thompson, C.K. Model for Hydrocarbon Microseepage and Related Near-Surface Alterations. AAPG Bull. 1999, 83, 170–184. [Google Scholar] [CrossRef]
  28. Abrams, M.A. Best practices for the collection, analysis, and interpretation of seabed geochemical samples to evaluate subsurface hydrocarbon generation and entrapment. In Proceedings of the Offshore Technology Conference, Houston, TX, USA, 6–9 May 2013. [Google Scholar] [CrossRef]
  29. Abrams, M.A. Significance of hydrocarbon seepage relative to petroleum generation and entrapment. Mar. Pet. Geol. 2005, 22, 457–477. [Google Scholar] [CrossRef]
  30. Magoon, L.B.; Schmoker, J.W. The Total Petroleum System—The Natural Fluid Network That Constraints the assessment Units. In USGS Digital Data SERIES 60; U.S. Geological Survey: Reston, VA, USA, 2000; p. 31. [Google Scholar]
  31. Etiope, G. A global dataset of onshore gas and oil seeps: A new tool for hydrocarbon exploration. Oil Gas Bus. 2009, 1–10. Available online: http://hdl.handle.net/2122/6040 (accessed on 22 August 2017).
  32. Etiope, G.; Klusman, R.W. Geologic emissions of methane to the atmosphere. Chemosphere 2002, 49, 777–789. [Google Scholar] [CrossRef]
  33. Eltschlager, K.K.; Hawkins, J.W.; Ehler, W.C.; Baldassare, F. Technical Measures for the Investigation and Mitigation of Fugitive Methane Hazards in Areas of Coal Mining; U.S. Department of the Interior—Office of Surface Mining: Pittsburgh, PA, USA, 2001; p. 124.
  34. Oliveira, J.T. The marine Carboniferous of South Portugal: A stratigraphic and sedimentological approach. In The Carboniferous of Portugal; Lemos de Sousa, M.J., Oliveira, J.T., Eds.; Memórias dos Serviços Geológicos de Portugal: Lisbon, Portugal, 1983; Volume 29, pp. 3–37. (In Portuguese) [Google Scholar]
  35. Oliveira, J.T.; Relvas, J.; Pereira, Z.; Matos, J.X.; Rosa, C.; Rosa, D.; Munhá, J.M.; Fernandes, P.; Jorge, R.; Pinto, A. Geologia da Zona Sul Portuguesa, com Ênfase na Estratigrafia e Na Vulcanologia Física, Geoquímica e Mineralizações da Faixa Piritosa. In Geologia de Portugal; Dias, R., Araújo, A., Terrinha, P., Kullberg, J.C., Eds.; Escolar Editora: Lisbon, Portugal, 2013; Volume I, pp. 673–767. ISBN 9789725923641. (In Portuguese) [Google Scholar]
  36. Abad, I.; Mata, M.P.; Nieto, F.; Velilla, N. The Phyllosilicates in diagenetic-metamorphic rocks of the South Portuguese Zone, southwestern Portugal. Can. Mineral. 2001, 39, 1571–1589. [Google Scholar] [CrossRef] [Green Version]
  37. McCormack, N.; Clayton, G.; Fernandes, P. The thermal history of the Upper Palaeozoic rocks of southern Portugal. Mar. Pet. Geol. 2007, 24, 145–150. [Google Scholar] [CrossRef]
  38. Fernandes, P.; Musgrave, J.A.; Clayton, G.; Pereira, Z.; Oliveira, J.T.; Goodhue, R.; Rodrigues, B. New evidence concerning the thermal history of Devonian and Carboniferous rocks in the South Portuguese Zone. J. Geol. Soc. Lond. 2012, 169, 647–654. [Google Scholar] [CrossRef]
  39. Barberes, G.A.; Fonseca, P.E.; Pena dos Reis, R.; Pimentel, N.; Azevedo, M. Preliminary assessment of potential for Shale Gas in South Portuguese Zone carboniferous units. Comunicações Geológicas 2014, 101, 737–741. [Google Scholar]
  40. Almeida, C.; Mendonça, J.J.L.; Jesus, M.R.; Gomes, A.J. Sistemas Aquíferos de Portugal Continental; Instituto da Água: Lisboa, Portugal, 2000; p. 42. (In Portuguese) [Google Scholar]
  41. Bandeira de Mello, C.S.; Françolin, J.B.L.; Miller, D.J.; Gonçalves, R.C.S.; Capilla, R.; Lopes, J.P.; Jesuíno, L.S.; Silva Freitas, L.C.; Soares Filho, J.R.S.; Fontes, R.A. Principais metodologias de prospecção geoquímica de hidrocarbonetos em superfície. In Prospecção Geoquímica de Depósitos Minerais Metálicos, Não-Metálicos, Óleo e Gás; Licht, O.A.B., Bandeira de Mello, C.S., Silva, C.R., Eds.; SBGq-CPRM: Rio de Janeiro, Brasil, 2007; p. 788. ISBN 9788574990576. (In Portuguese) [Google Scholar]
  42. Isotech Laboratories Inc. Procedure for Taking Cuttings Samples in IsoJars®; Isotech Laboratories Inc.: Champaign, IL, USA, 2014. [Google Scholar]
  43. Tedesco, S.A. Surface Geochemistry in Petroleum Exploration; Springer Science+Business Media Dordrecht: Dordrecht, The Netherlands, 1995; p. 229. ISBN 9781461526605. [Google Scholar]
  44. Hale, M. Genesis, behaviour and detection of gases in the crust. In Handbook of Exploration Geochemistry—Geochemical Remote Sensing of the Sub-Surface; Govett, G.J.S., Ed.; Elsevier: Amsterdam, The Netherlands, 2000; Volume 7, pp. 3–16. ISBN 9780444504395. [Google Scholar]
  45. Kolb, B.; Ettre, L.S. Static Headspace-Gas Chromatography—Theory and Practice; Wiley-Interscience: Hoboken, NJ, USA, 2006; p. 349. ISBN 9780471749448. [Google Scholar]
  46. Restek. A Technical Guide for Static Headspace Analysis Using GC. Lit. Cat. # 59895B; Restek Technical Guide; Restek: Bellefonte, PA, USA, 2000; p. 19. [Google Scholar]
  47. Tipler, A. An Introduction to Headspace Sampling in Gas Chromatography—Fundamentals and Theory; PerkinElmer Inc.: Waltham, MA, USA, 2013; p. 35. [Google Scholar]
  48. Loch, J.P.G.; van Dijk-Looyaard, A.; Zoeteman, B.C.J. Organics in groundwater. In The Future for Water Quality in Europe; Wheeler, D., Richardson, M.L., Bridges, J., Eds.; Pergamon Press: Oxford, UK, 1989; pp. 39–55. ISBN 9780080373775. [Google Scholar]
  49. Merian, E.; Zander, M. Volatile aromatics. In Handbook of Environmental Chemistry. 3 (B), Anthropogenic Compounds; Hutzinger, O., Ed.; Springer: Berlin, Germany, 1982; pp. 117–161. [Google Scholar]
  50. Gomez-Belinchon, J.I.; Grimalt, J.O. Volatile organic compounds in two polluted rivers in Barcelona (Catalonia, Spain). Water Res. 1991, 25, 577–589. [Google Scholar] [CrossRef]
  51. Alentejo, A.R.H. Planos de Gestão das Bacias Hidrográficas Integradas nas Regiões Hidrográficas 6 e 7—Região Hidrográfica 6, Volume I (Relatório), Parte 2 (Caracterização e Diagnóstico); Ministério da Agricultura, Mar, Ambiente e Ordenamento do Território: Lisbon, Portugal, 2011; p. 336. (In Portuguese) [Google Scholar]
  52. Collins, A.G. Geochemistry of OilField Waters; Elsevier: Amsterdam, The Netherlands, 1975; p. 496. ISBN 9780080868554. [Google Scholar]
  53. Seneshen, D.M.; Chidsey, T.C.; Morgan, C.D.; Vanden Berg, M.D. New Techniques for new Hydrocarbon Discoveries—Surface Geochemical Surveys in the Lisbon and Lightning Draw Southeast Field Areas, San Juan County, Utah; Miscellaneous Publication 2010; Utah Geological Survey: Salt Lake City, UT, USA, 2010; Volume 10, p. 68.
  54. Bandeira de Mello, C.S.; Graciano Filho, J.G.; Menezes, T.R. The importance of the inclusion of natural organic substances in geomedicine. In Book of Abstracts of the 4th International Symposium Environmental Geochemistry in Tropical Countries; Charlie, R.H., Ed.; Coastal Education and Research Foundation: Lawrence, KS, USA, 2004. [Google Scholar]
  55. Bandeira de Mello, C.S.; Francolin, J.B.L. Study of oil spills and seeps using geological profiles in a river from the Negro basin, Amazon rain forest, Brazil. In International Symposium Environment 2010: Situation and Perspectives for the European Union, Proceedings of the International Symposium 2010, Porto, Portugal, 6–10 May 2003; Neves, M.V., Neves, A.C.V., Eds.; University of Porto: Porto, Portugal, 2010. [Google Scholar]
  56. Gülensoy, N.; Alvarez, P.J.J. Diversity and correlation of specific aromatic hydrocarbon biodegradation capabilities. Biodegradation 1999, 10, 331–340. [Google Scholar] [CrossRef] [PubMed]
  57. Prince, R.C.; Suflita, J.M. Anaerobic biodegradation of natural gas condensate can be stimulated by the addition of gasoline. Biodegradation 2007, 18, 515–523. [Google Scholar] [CrossRef] [PubMed]
  58. U.S. Environmental Protection Agency (US EPA). National Primary Drinking Water Regulation. EPA 816-F-09-004; EPA’s Safe Drinking Water; US EPA: Washington, DC, USA, 2009; p. 6.
  59. Kristiansson, K.; Malmqvist, L. Evidence for non-diffusive transport of 222Rn in the ground and a new geophysical model for the transport. Geophysics 1982, 47, 1444–1452. [Google Scholar] [CrossRef]
  60. Malmqvist, L.; Kristiansson, K. Experimental evidence for an ascending microflow of geogas in the ground. Earth Planet. Sci. Lett. 1984, 70, 407–416. [Google Scholar] [CrossRef]
  61. Malmqvist, L.; Kristiansson, K. A physical mechanism for the release of free gases in the lithosphere. Geoexploration 1985, 23, 447–453. [Google Scholar] [CrossRef]
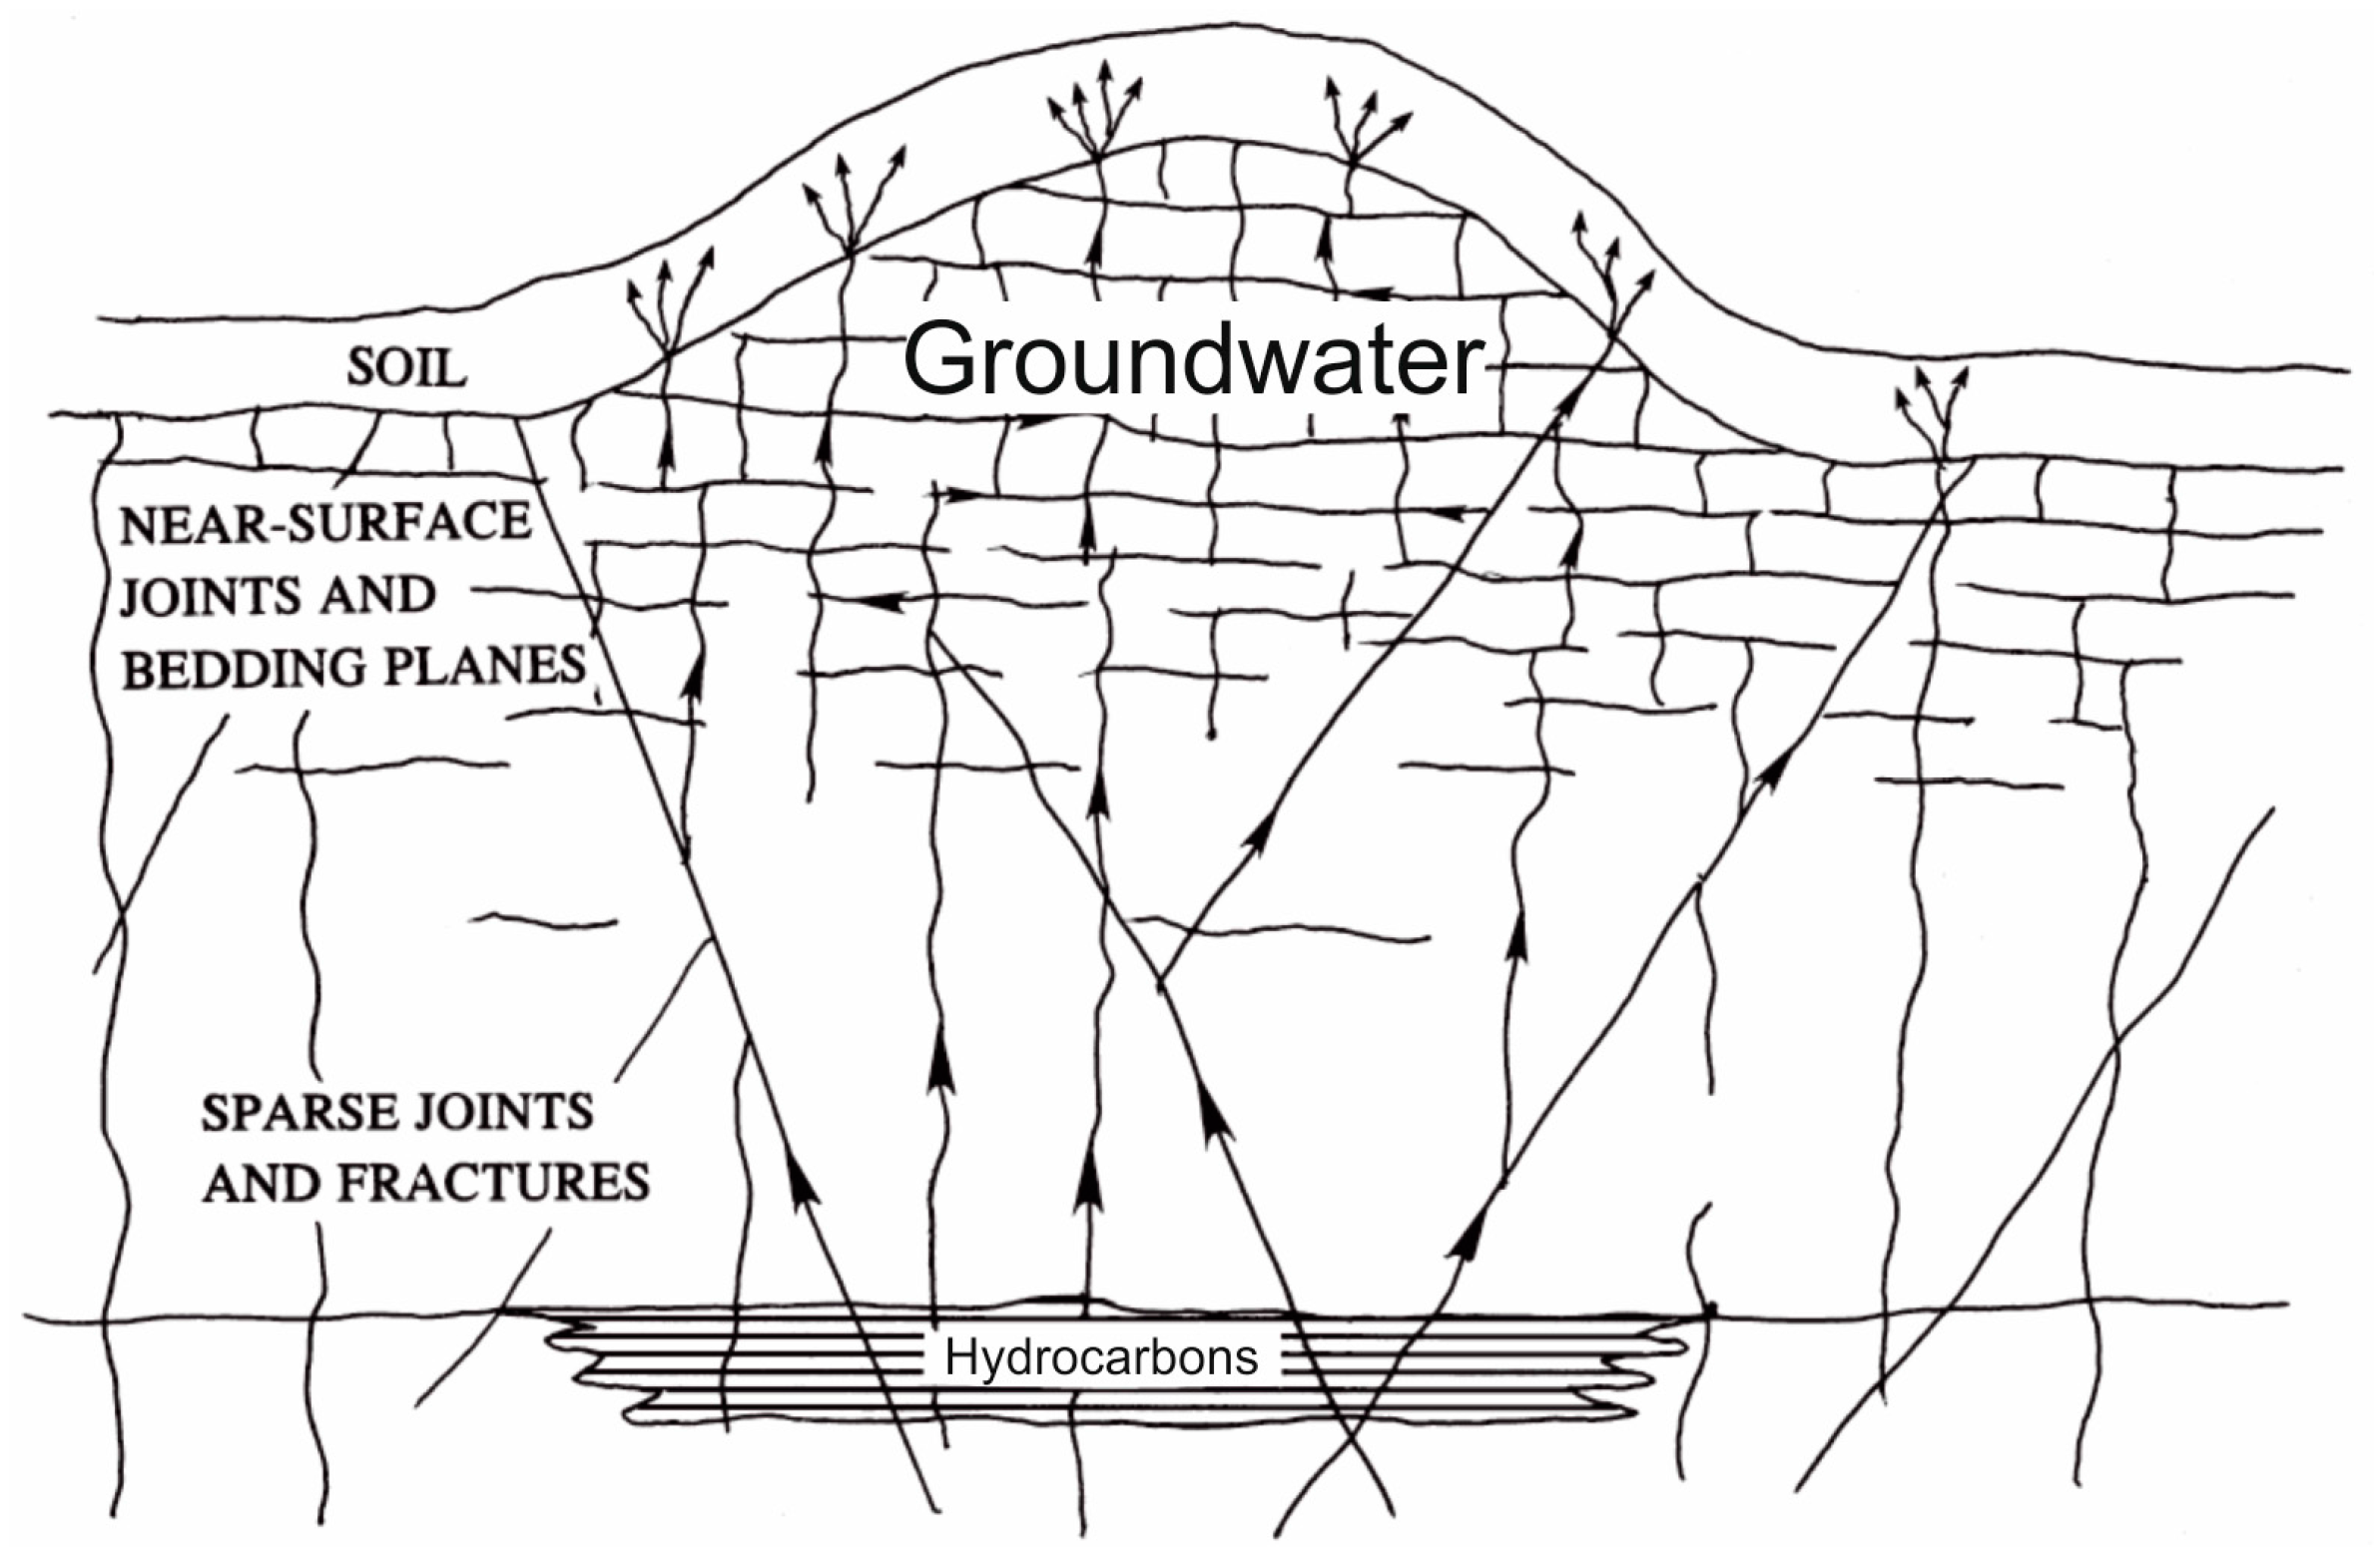
Figure 1. Possible microseepage paths up through the network of fractures, joints, and bedding planes. Adapted from [27].
Geosciences 08 00009 g001
Figure 2. Locations of water and soil samples; the closer refinery of Sines (northwest of the map-Setúbal District) and the gas stations closer to the sample locations.
Geosciences 08 00009 g002
Figure 3. General scheme of the activities relates to surface geochemical prospection of hydrocarbons. Adapted from [41].
Geosciences 08 00009 g003
Figure 4. (A) Hammer; (B) IsoJar®, by Isotech (Weatherford International, Houston, TX, USA); (C) Tubes used for soil sampling; (D) Drilling machine used for deeper sampling.
Geosciences 08 00009 g004
Figure 5. Illustrative scheme of a headspace vial Isojar®, filled with soil/water sample, distilled water, and bactericide. Water samples do not need to be filled with distilled water. Adapted from [42].
Geosciences 08 00009 g005
Figure 6. Concentrations of toluene (μg/L) per water samples. The samples W12 and W21 contain less than 1000 μg/L of toluene.
Geosciences 08 00009 g006
Figure 7. Chromatogram of: (A) W06 water sample, (B) W17 water sample, (C) W23 water sample, and (D) pure toluene vapor.
Geosciences 08 00009 g007aGeosciences 08 00009 g007b
Figure 8. Distribution and concentration of toluene (μg/L) in groundwater and in soil samples.
Geosciences 08 00009 g008
Figure 9. Chromatogram of: (A) SPZ-07 soil sample, (B) SPZ-15 soil sample, and (C) SPZ-16 soil sample.
Geosciences 08 00009 g009aGeosciences 08 00009 g009b
Table 1. World Health Organization information about toluene in drinkable water. Adapted from WHO [13].
Guideline Value700 µg/L
OccurrenceConcentration of a few micrograms per litre have been found in surface water, groundwater and drinking-water;point emissions can lead to higher concentrations in groundwater (up to 1000 µg/L);It may also penetrate plastic pipes from contaminated soil
TDI223 µg/kg body weight based on a LOAEL of 312 mg/kg body weight per day for marginal hepatotoxic effects observed in a 13-week gavage study in mice, adjusting for daily dosing and using na uncertainty factor for 1000 (100 for interspecies and intraspecies variattion and 10 for the short suration of the study and use of a LOAEL instead of a NOAEL)
Limit of Detection0.13 µg/L by GC with FID;6 ppb by GC-MS
Treatment Perfomance1 µg/L should be achievable using air stripping
Guideline Value Derivation
Allocation to Water10% of TDI
Weight60 kg adult
Consumption2 L/day
Additional CommentsThe guideline value exceeds the lowest reported odour threshold for toluene in water
Assessment Date2003
LOAEL: lowest observed adverse effect level. NOAEL: no observed adverse effect level. TDI: tolerable daily intake.