Abstract
Asturias is one of the most landslide prone areas in the north of Spain. Most landslides are linked to intense and continue rainfall events, especially between October and May. This fact points out precipitation as the main triggering factor in the study area. Thirteen rainfall episodes that caused 1064 landslides between 2008 and 2016 have been selected for its study. Landslide records come from the Principality of Asturias Landslide Database (BAPA) and meteorological data from the Spanish Meteorological Agency (AEMET). Meteorological conditions which took place during each period have been characterized by using NCEP/NCAR Reanalysis data. Four main landslide-triggering meteorological patterns have been identified for the Asturian territory: Strong Atlantic Anticyclone pattern (SAA), Atlantic Depression pattern (AD), Anticyclonic ridge pattern (AR) and Cut-off Low pattern (CL).
1. Introduction
1.1. Background
Rainfall-triggered landslides are one of the most widespread natural hazards worldwide [1,2], causing each year considerable human and material losses [3]. For this reason, strong efforts have been made to study the characteristics of the landslides and predict their occurrence [4].
Landslide databases and derived maps constitute the starting point for the forecasting of landslides at a regional scale [5]. The information gathered in these inventories is commonly obtained through fieldwork and the review of press archives and documents from different administrations [6] and often includes spatio-temporal data and information about the characteristics of the instabilities, the triggering factors, the damage caused and the related costs [7].
Regarding the temporal forecasting of rainfall-induced landslides, the statistical analysis of landslide records and climatic data series constitutes the most common empirical approach to quantify the rainfall triggering conditions. On this basis, it is possible the computation of rainfall thresholds for the occurrence of landslides [2,8,9] and soil moisture thresholds [10,11,12] which are key elements for the implementation of early warning systems [13].
However, some authors [14,15] have highlighted the convenience of considering broader scale atmospheric conditions to improve the performance and reliability of the early warning systems, given that the atmospheric circulation is closely related to key factors that control the landslide triggering, such as the rainfall intensity and the frequency and duration of the precipitation events. The characterization of meteorological synoptic triggering conditions has been addressed through several studies, including those developed in British Columbia (Canada) [16], in Serra do Mar (Brazil) [17], in Italy [18], in the European Alps [19] and in Portugal [20]. Moreover, other authors [21,22] have related the occurrence of landslides with atmospheric patterns at a global scale, such as the North Atlantic Oscillation.
In general, the characterization of the triggering meteorological conditions is carried out at a synoptic scale through the use of weather type catalogues, which include a discrete number of common meteorological situations. The most widely used methods are the Lamb weather type classification [23], the Jenkinson and Collinson system [24] or the COST733 weather synoptic types [25]. In other cases, the classification of weather types is performed through a multivariate analysis, especially Principal Component Analysis [26].
1.2. Study Area
The Principality of Asturias (NW Spain) is an autonomous community with an extension of 10,603 km2 bounded by the Cantabrian Sea to the north and the Cantabrian Range to the south, whose watershed is over 1200 m (Figure 1). The short distance between the axis of the Cantabrian Range and the coast implies large altitude gradients and generates a rugged orography in the majority of the Asturian territory.
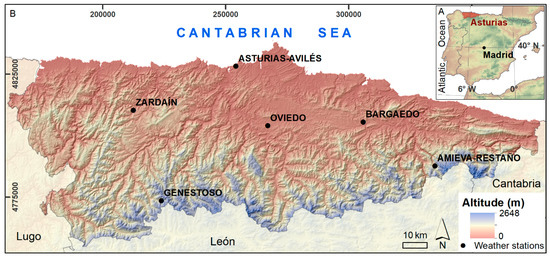
Figure 1.
Study area: (A) Location of Asturias in the north of Spain; (B) Orography of the study area and location of the six weather stations used in this work.
From a geological point of view, the bedrock in the study area consists of a strongly folded and fractured Permian and Paleozoic basement [27,28] covered in the centre and north-eastern areas by a discordant Tertiary cover [29]. The elevation of the Cantabrian Range during the Alpine Orogeny [30] and the climatic variations during the Quaternary have contributed to shape the bedrock through the operation of fluvial incision [31], karst processes [32] and glacial activity [33].
Together with fluvial and coastal processes, slope instabilities dominate the current geomorphological dynamic, being the most widespread cause of natural hazards at a regional scale. Although landslides recorded in Asturias normally show reduced size and depth (metric to decametric), they often affect highly populated areas or the dense infrastructure network, causing every year relevant economic loses and sporadic human victims [34]. The BAPA (Base de datos de Argayos del Principado de Asturias-Principality of Asturias Landslide Database) gathers 2245 individual landslides recorded during the period 1980–2016 [35], showing the high incidence of those phenomena in the study area. The comparison between landslide and climatic data series has pointed out the abundant rainfall, and the consequent high soil moisture levels sustained during long periods, as the main trigger for the study area [36]. On this basis, regional and local rainfall thresholds for the landslide occurrence have been calculated [12,37,38].
The Asturian region shows a characteristic Oceanic climate, showing two main domains according to the Köppen-Geiger classification [39]. The majority of the area presents a Temperate climate Cfb, without dry season and with a temperate summer; the SW area shows a Temperate climate Csb, with dry and temperate summer; and the highest mountainous areas present Cold climate Df [40,41]. Average annual precipitation and temperature range from 960 mm and 13.3 °C in the lowest areas and near the coast to 1688 mm and 11.4 °C in the mountainous areas, according to data from Oviedo (336 m a.s.l.) and Amieva-Restaño (730 m a.s.l.) weather stations for the 1981–2010 reference period (AEMET, 2012). Though there is not a well-defined dry season in the Asturian climate, the maximum monthly precipitation values are concentrated in the period October–May, while the minimum precipitation values are recorded between June and September (both hereinafter named as wet and dry periods). Average annual number of rainy days ranges from 123 with rainfall >1 mm in 24 h to 30 days with rainfall >10 mm in 24 h and 4 days with rainfall >30 mm in 24 h, resulting in frequent and meaningful wet periods [42,43].
1.3. Objectives
In light of the challenge of forecasting the occurrence of landslides, previous works have highlighted the relevance of analysing the most common weather patterns linked to landslides in addition to the precipitation or soil moisture conditions. Thus the main goal of the current research is to determine the most frequent synoptic meteorological patterns which generate rainfall-triggered landslide events in Asturias during the wet and dry periods.
2. Materials and Methods
The methodology followed in the present work includes (i) the setting of criteria for selecting the rainfall-landslide events within the study interval and (ii) its climatic and meteorological characterization at different scales.
2.1. Selection of a Study Interval within the BAPA Database Time Span
Data about instability events analysed in the present work comes from the BAPA landslide database, previously built and analysed by Valenzuela and other authors [35]. The BAPA, which covers a 37-year period, is the only landslide database developed in Asturias and the sole source that may provide the date of occurrence of the landslides, crucial to address the present research. These authors have assessed the level of completeness of the inventory, which shows a general increase in the number of records from 1980 to present. Furthermore, the landslide records have been previously classified in three categories according to the reliability of its temporal occurrence: (1) exact date; (2) inferred date, with an uncertainty of 2–5 days; and (3) estimated date, with and uncertainty of a week or more [35]. Based on the parameters set in previous works, the study interval has been defined considering a period within the BAPA database time characterized by (i) a high level of completeness of the data series and (ii) a significant number of instability events showing a high temporal accuracy.
2.2. Climatic Characterization of the Studied Interval
Monthly and annual precipitation data collected from six weather stations managed by the AEMET (Agencia Estatal de Meteorología-Spanish Meteorological Agency) have been used to climatically characterize the studied interval. The selected weather stations are considered representative of the study area, including two located in the highlands of the Cantabrian Range: Genestoso (UTMEtrs89 223830X/4773589Y, 1170 m a.s.l.) and Amieva-Restaño (UTMEtrs89 335072X/4787743Y, 730 m a.s.l.); one in the lowlands near the Cantabrian Coast: Asturias-Avilés (UTMEtrs89 254162X/4828281Y, 127 m a.s.l.); and the remaining three in the middle area of Asturias: Zardaín (UTMEtrs89 212409X/4810377Y, 400 m a.s.l.), Oviedo (UTMEtrs89 267072X/4804067Y, 336 m a.s.l.), and Bargaedo (UTMEtrs89 305849X/4805559Y, 280 m a.s.l.) (Figure 1).
The comparison between annual precipitation data series for the study interval 2008–2016 and for the period 1980–2016 has allowed to note (i) the presence of wet, normal or dry years as well as (ii) wet and dry sequences of years. The distribution of the recorded landslides in relation to average monthly precipitation records throughout the year has also been analysed.
2.3. Selection and Description of the Particular Episodes for its Study
Once the interval of study has been defined, the research has focused on studying representative episodes within the dry and wet periods characterized by the occurrence of a relevant number of landslides (more than 2 during the dry period and over 30 during the wet period) and remarkable precipitation records (over 30 mm during the dry period and over 200 mm during the wet period). The following parameters have been used to describe the selected episodes: (i) start and end dates, (ii) number of recorded landslides for each episode, (iii) occurrence during the wet or dry period, (iv) total number of days, (v) number of rainy days, (vi) daily precipitation considering rainy days and (vii) accumulated precipitation for the whole episode.
2.4. Definition of the Meteorological Synoptic Conditions of each Episode
A more detailed analysis has been performed to determine the meteorological synoptic conditions that took place during each episode. It has been carried out dividing those initial episodes in events, taking into account the most relevant rainfall periods and dismissing those days without precipitation.
Data used have been obtained from the National Oceanic and Atmospheric Administration of the United States (NCAR/NCEP Reanalysis 1) through the free software Grid Analysis and Display System (GrADS). Seven parameters have been considered: (i) 500 hPa temperature (°C); (ii) 850 hPa temperature (°C); (iii) sea level pressure (hPa); (iv) 300 hPa geopotential height (m); (v) 500 hPa geopotential height (m); (vi) 925 hPa specific humidity (kg H2Ov kg air−1); and (vii) 925 hPa wind direction. Composites showing the average values of these parameters during each event have been developed using data measured every 6 h.
Due to (a) the Asturian complex meteorological conditions, where the orographic effect and the proximity of the sea play a relevant role, and (b) the short duration of the analysed events, from a few days to several weeks, absolute values of each parameter were chosen for the analysis instead of the anomalies as they were considered more appropriate to describe in detail the studied events.
2.5. Establishment of the main Landslide-Triggering Meteorological Patterns
Lastly, a subjective analysis of each composite has been performed to determine de main meteorological patterns linked to landslide events, focusing on the spatial distribution of the considered parameters. In order to get easy-to-understand results, these patterns have been graphically described using maps of 300 hPa geopotential height, sea level pressure and 500 hPa and 850 hPa temperature.
3. Results
A study interval of 8 hydrological years, from October 2008 to September 2016, was defined for the present work considering the highest levels of completeness and temporal accuracy within the BAPA database records. The inventory gathers 1261 landslide records for this interval. The exact day of occurrence is known in 587 landslides, and for another 268 landslides there is a 2–5 days uncertainty. The distribution of the total monthly landslide records throughout the year shows a strong variation linked to seasonal precipitation patterns. February is the month with the highest number of records (267 landslides) and August the month with the fewest (14 landslides). Selected data set shows a high proportion of instabilities occurred during the wet period October–May (1032 landslides, 82%), while a lower amount (229 landslides, 18%) took place during the dry period June–September (Figure 2A).
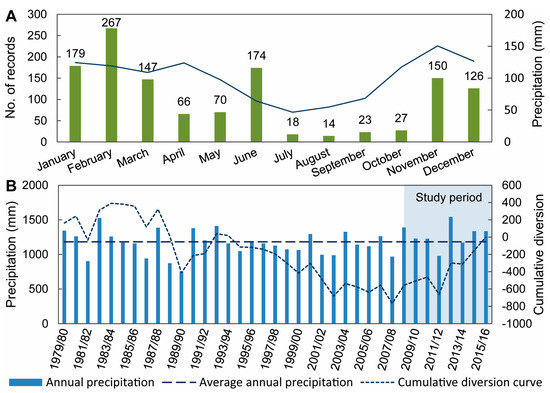
Figure 2.
Analysis of the study period: (A) Monthly distribution of the landslides from the BAPA database recorded within the studied interval (October 2008–September 2016) in comparison with mean monthly precipitation records; (B) Analysis of annual precipitation data series for the period 1980–2016 and the study period, considering hydrological years.
The study interval shows annual precipitation values higher than the average annual precipitation of 1180 mm, calculated for the period 1980–2016 considering hydrological years. From a climatic point of view, the eight hydrological years selected are part of a wet sequence, as it is shown by the positive slope of the curve of cumulative diversion from the average annual precipitation (1180 mm) (Figure 2B). Taking this value into account, the year 2012/13 was classified as wet, the year 2011/12 was classified as dry and the remaining years were classified as normal.
As a result of the current analysis, 13 episodes were defined within the studied interval: nine episodes correspond to the wet period and the remaining four to the dry period. A total of 1012 landslides were recorded during these episodes, accounting for 80% of the landslides registered during the studied interval (October 2008–September 2016). During the dry periods, the number of landslides per episode is in the range 2–3, although an extraordinary number of instabilities (220 landslides) was recorded during the isolated episode of June 2010. In contrast, the number of landslides per episode ranges from 58 to 177 records during the wet periods (Figure 3A).
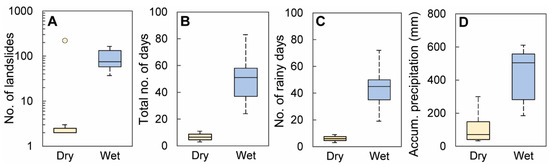
Figure 3.
Characteristics of the episodes defined for the dry and wet periods within the studied interval: (A) Number of landslides; (B) Total number of days; (C) Number of rainy days; (D) Accumulated precipitation. The dot in Figure 3A is an outlier representing the June 2010 episode.
The episodes defined within the wet periods, with durations between 24 and 83 days, are much longer than those defined within the dry period, in the range 3–11 days (Figure 3B). The difference between the number of days and the number of rainy days is very small for the dry period episodes, whereas the episodes defined during the wet period include a remarkable number of rainfall gaps between the rainy days (Figure 3C). Accumulated precipitation values are higher during the wet period although the precipitation is distributed throughout a number of days higher that in the case of the dry period episodes, with lower accumulated precipitation values and more concentrated in time (Figure 3D).
As a previous step for the meteorological analysis, the nine initial episodes of the wet period were sub-divided into 32 rainfall events, removing those days without precipitation. However, the four episodes defined during the dry period were not sub-divided due to its short duration and the lack of rainfall gaps. The analysis of these 36 events considering sea level pressure, 300 hPa geopotential height and 500 hPa and 850 hPa temperature maps allowed the definition of four main meteorological patterns: (i) Strong Atlantic Anticyclone pattern (SAA), (ii) Atlantic Depression pattern (AD), (iii) Anticyclonic ridge pattern (AR), and (iv) Cut-off Low pattern (CL). Table 1 shows the precipitation parameters calculated and the pattern assigned to each of the 36 events.

Table 1.
Summary statistics of the events defined for the meteorological analysis.
The four main patterns were described in detail considering also average and accumulated precipitation, computed for each event, and maps of 925 hPa specific humidity and 925 hPa wind direction. Figure 4 graphically describes the four general meteorological synoptic situations identified as landslide-triggers in Asturias during the study period.
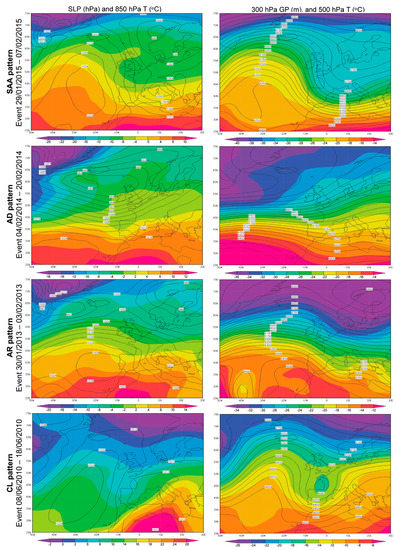
Figure 4.
Graphical description of the four meteorological patterns associated with relevant landslide events identified during the study period for Asturias.
- Strong Atlantic Anticyclone pattern (SAA)
- ○
- Identified in 14 out of 36 events, is the most common pattern.
- ○
- Typical of the wet period.
- ○
- Presence of: (i) a strong Atlantic high pressure system, extended to the north of Azores in most of times; and (ii) a low pressure system over the Mediterranean Sea or surroundings areas, leading to a northern humid and cold cyclonic flow over Asturias.
- ○
- Frontal and post-frontal rainfall with high orographic forcing and moderate precipitation due to the northern humid flow.
- ○
- Strong winds from the NW-N in all the troposphere, affecting the Iberian Peninsula.
- ○
- Characterized by polar and artic maritime air masses.
- Atlantic Depression pattern (AD)
- ○
- Identified in 10 out of 36 events.
- ○
- Typical of the wet period.
- ○
- Presence of: (i) one or several deep depressions near the Britannic Islands, moving from West to East according to strong zonal flow, (ii) leading to a weak Azores high pressure system displaced southwards.
- ○
- Frontal rainfall with moderate orographic forcing and moderate precipitation values.
- ○
- Very strong zonal winds in all the troposphere from the W-NW over the Iberian Peninsula.
- ○
- Characterized by polar maritime air masses.
- Anticyclonic ridge pattern (AR)
- ○
- Identified in 6 out of 36 events.
- ○
- Typical of the wet period.
- ○
- Presence of a strong Azores high pressure system, extended as a ridge, affecting the North of the Iberian Peninsula.
- ○
- Low stratiform orographic precipitation values associated with the tail-end of weak fronts.
- ○
- Weak winds from the W-NW-N in all the troposphere, affecting the Iberian Peninsula, and more intense zonal winds located in mid-latitudes of Europe.
- ○
- Characterized by subtropical air masses.
- Cut-off Low pattern (CL)
- ○
- Identified in 6 out of 36 events.
- ○
- The sole pattern identified in the dry period, although it has also been identified in two episodes during the wet period.
- ○
- Presence of a cut-off low extended down to the surface over or near the Iberian Peninsula.
- ○
- High convective precipitation values.
- ○
- Weak close-circulation winds in all the troposphere with predominance of N-NW components.
- ○
- Characterized by a weak polar air mass surrounded by a subtropical air mass, producing an intense thermodynamic instability over the region.
Some remarkable differences in accumulated and daily precipitation values were observed between the events included in each pattern (Table 2 and Figure 5). Cyclonic patterns SAA and AD include long-lasting events characterized by significant average accumulated precipitation values (129.9–111 mm) and low average daily precipitation values (9.2–14.4 mm). Furthermore, the events classified within the anticyclonic pattern AR are characterized by low average precipitation values (56.1 mm) accumulated in short-lasting periods, giving as a result a low average daily precipitation values (7.2 mm). In contrast, the events included in the CL pattern are characterized by high precipitation values (129.7 mm) accumulated in short periods, showing the highest average daily precipitation values (16.3 mm). Observed outliers in Figure 5 are interpreted as a result of the scarce number of data analysed.
Table 2.
Total number of landslides and average rainfall parameters considering the events included in each pattern.
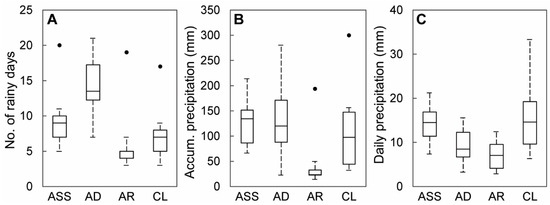
Figure 5.
Comparison between the rainfall parameters of the events included in each meteorological pattern: (A) Number of rainy days; (B) Accumulated precipitation; (C) Daily precipitation. The dots in Figure 5A,B represent values considered as outliers.
4. Discussion
Obtained results point out the cyclonic patterns SAA and AD as the main cause of rainfall-triggered landslides in Asturias during the wet period, which is consistent with the results obtained for Western Europe [44]. SAA and AD patterns were identified in 75% of the events analysed between October and May, causing a total of 681 landslides. It is usual that these cyclonic patterns over Asturias remain fairly stable for prolonged periods, as in the case of the events 5, 6, 8 and 12 (Table 1), producing almost continuous frontal precipitation during several weeks or months. This fact implies the reaching of high soil moisture levels and constitutes a typical landslide-triggering meteorological situation, previously described in Asturias [12]. In contrast, the anticyclonic pattern AR and the CL pattern were identified in 6 and 2 events during the wet period, causing 51 and 53 landslides respectively. In these cases, the lower number of landslides may be linked to the low frequency of these events. However, some of the analysed episodes show an alternation of different meteorological patterns, which makes it difficult to determine the specific influence of each condition in the occurrence of landslides. This is the case of the event 10, where the four different patterns described succeed one another in a period of 52 days (AD-CL-SAA-AR) (Table 1). Furthermore, the CL is the only rainfall-triggering pattern identified during the dry period (June–September). In general, the number of landslides recorded in these CL events is in the range 2–3 (Table 1), although it is remarkable the extreme CL episode occurred in June 2010, which gave as a result at least 220 landslides recorded in the BAPA database. Due to the scarcity of events analysed for the dry period, it is impossible to determine through statistical methods if the June 2010 episode is an outlier. However, experience achieved in the study area shows that Cut-off low patterns triggering heavy rainfall and a large number of landslides are unusual events in Asturias. In fact, the June 2010 event is the only one identified in the last 37 years.
Different works have identified the CL pattern as the main meteorological trigger of landslides during the summer, such as those developed in Portugal [20] or Italy [18]. A coincidence in the triggering conditions SAA, AD and AR between October and May has also been observed, which is to be expected considering that these synoptic patterns are the most common during the winter in Western Europe [44]. However, there are some differences in the frequency of each triggering pattern, more accentuated in Italy than in Portugal, explained by the different climatic or geographical conditions existing in each area.
Although the followed methodology has allowed the definition of the main meteorological synoptic patterns that trigger landslides for the Asturian territory during the analysed period, it is necessary to indicate some limitations that may condition the significance of the achieved results. The first limitation is the reduced number of landslide events (36) analysed in the current work, which hampers the achievement of general results. The BAPA database is only complete and accurate enough during the last eight hydrological years of the covered span, limiting the number of available case studies. It is also remarkable that these eight years are part of a wet sequence, including the wettest year recorded in Asturias (2013) as long as record exists, which may contribute to distort the results. Moreover, 32% of the landslide records occurred during those episodes show low temporal accuracy, introducing a certain level of uncertainty in the analysis.
The meteorological analysis also shows some limitations. For example, the study has only focused on 13 rainfall episodes that have triggered landslides within the study interval (October 2008–December 2016), dismissing those meteorological conditions which have not caused instability events in the same period. This fact creates the illusion that both wet and dry periods contribute in the same proportion to landslide occurrence. However, the landslide-triggering patterns are much more frequent during the wet period than during the dry period. The extraordinary infrequent event of June 2010 also contributes to distort the results.
Moreover, the synoptic patterns have been associated with the landslides recorded in each event without taking into account the influence of the meteorological conditions occurring on the days immediately preceding the event. The implementation of a Principal Component Analysis over longer periods could have made it possible to better understand the role of each meteorological factor in the landslide occurrence. However, the limited number of data available for the study hampered the implementation of a more complex statistical method. Similarly, the reduced spatial and temporal scale of the scarce analysed events discouraged the use of general weather type catalogues, such as the Lamb weather type classification or the COST733 weather synoptic types. Considering the preliminary character of the research, a subjective analysis of the composites calculated for each event was achieved, allowing an in-depth analysis of each case. The analysis of a higher number of events which has and has not triggered landslides using a Principal Component Analysis would allow a better approach. Despite the previously mentioned limitations, the current study constitutes a preliminary approach to define the most common landslide-triggering meteorological patterns in the North of Spain. Given that atmospheric situations repeat themselves cyclically through the year, an increase in the knowledge of the link between meteorology and landslides could improve the use of the weather forecast systems in terms of landslide early warning.
5. Conclusions
The preliminary analysis of the synoptic meteorological conditions that triggered landslides in Asturias during the period October 2008–September 2016 has allowed to conclude that there are four main patterns: Strong Atlantic Anticyclone pattern (SAA), Atlantic Depression pattern (AD), Anticyclonic ridge pattern (AR) and Cut-off Low pattern (CL).
Between October and May (wet period), the cyclonic patterns SAA and AD generated the vast majority of the observed rainfalls episodes which trigger landslides, characterized by moderate-intensity frontal precipitation with an orographic forcing. However, some anticyclonic and convective episodes were also observed. SAA and AD patterns are the most significant synoptic situations for the triggering of landslides in Asturias.
Between June and September (dry period), the Cut-off low is the only observed pattern, producing high-intensity convective precipitation during short periods. Although, in general, the number of landslides caused by these kind of episodes is reduced, the CL patterns may produce extraordinary and very unusual high-intensity precipitation events causing hundreds of landslides, such as the case of June 2010.
Acknowledgments
This research is funded by the Department of Employment, Industry and Tourism of the Government of Asturias, Spain, and the European Regional Development Fund FEDER, within the framework of the research grant “GEOCANTABRICA: Procesos geológicos modeladores del relieve de la Cordillera Cantábrica” (FC-15-GRUPIN14-044), and supported on the cooperation between the Department of Geology at the University of Oviedo and the AEMET. The authors also thank the three anonymous referees for their comments and to A. Crespo for her assistance.
Author Contributions
Pablo Valenzuela and Miguel Iglesias conceived the research and designed the followed methodology. Pablo Valenzuela and María José Domínguez-Cuesta developed the BAPA database, selected the studied interval and analysed the landslide dataset and the precipitation data series. Miguel Iglesias analysed the meteorological synoptic conditions of each episode and established the main meteorological patterns. Manuel Antonio Mora García contributed to the analysis of the climatic conditions of the study area and reviewed the meteorological content.
Conflicts of Interest
The authors declare no conflict of interest. The funding sponsors had no role in the design of the study; in the collection, analyses, or interpretation of data; nor in the writing of the manuscript or the decision to publish the results.
References
- McGuire, B.; Mason, I.; Kilburn, C. Natural Hazards and Environmental Change; Arnold Publishers: London, UK, 2002; pp. 1–187. [Google Scholar]
- Zêzere, J.L.; Vaz, T.; Pereira, S.; Oliveira, S.C.; Marqués, R.; García, R.A.C. Rainfall thresholds for landslide activity in Portugal: A state of the art. Environ. Earth Sci. 2015, 73, 2917–2936. [Google Scholar] [CrossRef]
- Papathoma-Köhle, M.; Zischg, A.; Fuchs, S.; Glade, T.; Keiler, M. Loss estimation for landslides in mountain areas—An integrated toolbox for vulnerability assessment and damage documentation. Environ. Model. Softw. 2015, 63, 156–169. [Google Scholar] [CrossRef]
- Damm, B.; Klose, M. The landslide database for Germany: Closing the gap at national level. Geomorphology 2015, 249, 82–93. [Google Scholar] [CrossRef]
- Guzzetti, F.; Mondini, A.C.; Cardinali, M.; Fiorucci, F.; Santangelo, M.; Chang, K.T. Landslide inventory maps: New tools for an old problem. Earth-Sci. Rev. 2012, 112, 42–66. [Google Scholar] [CrossRef]
- Malamud, B.D.; Turcotte, D.L.; Guzzetti, F.; Reichenbach, P. Landslide inventories and their statistical properties. Earth Surf. Process. Landf. 2004, 29, 687–711. [Google Scholar] [CrossRef]
- Hervás, J. Landslide inventory. In Encyclopedia of Natural Hazards; Bobrowsky, P.T., Ed.; Springer: Berlin, Germany, 2013; pp. 610–611. [Google Scholar]
- Glade, T.; Crozier, M.J.; Smith, P. Applying probability determination to refine landslide-triggering rainfall thresholds using an empirical antecedent daily rainfall model. Pure Appl. Geophys. 2000, 157, 1059–1079. [Google Scholar] [CrossRef]
- Guzzetti, F.; Peruccacci, S.; Rossi, M.; Stark, C.P. The rainfall intensity-duration control of shallow landslides and debris flows: An update. Landslides 2008, 5, 3–17. [Google Scholar] [CrossRef]
- Godt, J.W.; Baum, R.L.; Lu, N. Landsliding in partially saturated materials. Geophys. Res. Lett. 2009, 36. [Google Scholar] [CrossRef]
- Posner, A.J.; Georgakakos, K.P. Soil moisture and precipitation thresholds for real-time landslide prediction in El Salvador. Landslides 2015, 12, 1179–1196. [Google Scholar] [CrossRef]
- Valenzuela, P.; Domínguez-Cuesta, M.J.; Mora García, M.A.; Jiménez-Sánchez, M. Rainfall thresholds for the triggering of landslides considering previous soil moisture conditions (Asturias, NW Spain). Landslides 2017, 1–10. [Google Scholar] [CrossRef]
- Greco, R.; Giorgio, M.; Capparelli, G.; Versace, P. Early warning of rainfall-induced landslides based on empirical mobility function predictor. Eng. Geol. 2013, 153, 68–79. [Google Scholar] [CrossRef]
- Toreti, A.; Schneuwly-Bollschweiler, M.; Stoffel, M.; Luterbacher, J. Atmospheric Forcing of Debris Flows in the Southern Swiss Alps. J. Appl. Meteorol. Climatol. 2013, 52, 1554–1560. [Google Scholar] [CrossRef]
- Nikolopoulos, E.I.; Borga, M.; Marra, F.; Crema, S.; Marchi, L. Debris flows in the eastern Italian Alps: Seasonality and atmospheric circulation patterns. Nat. Hazards Earth Syst. Sci. 2015, 15, 647–656. [Google Scholar] [CrossRef]
- Jakob, M.; Holm, K.; Lange, O.; Schwab, J.W. Hydrometeorological thresholds for landslide initiation and forest operation shutdowns on the north coast of British Columbia. Landslides 2006, 3, 228–238. [Google Scholar] [CrossRef]
- Seluchi, M.E.; Chou, S.C. Synoptic patterns associated with landslide events in the Serra do Mar, Brazil. Theor. Appl. Climatol. 2009, 98, 67–77. [Google Scholar] [CrossRef]
- Messeri, A.; Morabito, M.; Messeri, G.; Brandani, G.; Petralli, M.; Natali, F.; Grifoni, D.; Crisci, A.; Gensini, G.; Orlandini, S. Weather-related flood and landslide damage: A risk index for Italian regions. PLoS ONE 2015, 10. [Google Scholar] [CrossRef] [PubMed]
- Wood, J.L.; Harrison, S.; Turkington, T.A.R.; Reinhardt, L. Landslides and synoptic weather trends in the European Alps. Clim. Chang. 2016, 136, 297–308. [Google Scholar] [CrossRef]
- Pereira, S.; Ramos, A.M.; Rebelo, L.; Trigo, R.M.; Zêzere, J.L. Hydro-geomorphologic events in Portugal and its association with Circulation weather types. In Proceedings of the European Geosciences Union General Assembly, Vienna, Austria, 23–28 April 2017. [Google Scholar]
- Zêzere, J.L.; Trigo, R.; Fragoso, M.; Oliveira, S.; Garcia, R.A.C. Rainfall-triggered landslides in the Lisbon region over 2006 and relationships with the North Atlantic Oscillation. Nat. Hazard. Earth Syst. Sci. 2008, 8, 483–499. [Google Scholar] [CrossRef]
- Marques, R.; Zêzere, J.L.; Trigo, R.; Gaspar, J.; Trigo, I. Rainfall patterns and critical values associated with landslides in Povoação County (São Miguel Island, Azores): Relationships with the North Atlantic Oscillation. Hydrol. Process. 2008, 22, 478–494. [Google Scholar] [CrossRef]
- Lamb, H.H. British Isles Weather Types and A Register of Daily Sequence of Circulation Patterns, 1861–1971; HMSO: London, UK, 1972; 85p.
- Jenkinson, A.F.; Collison, F.P. An initial climatology of gales over the North Sea. In Synoptic Climatology Branch Memorandum; Meteorological Office: London, UK, 1977; Volume 62, 18p. [Google Scholar]
- Philipp, A.; Bartholy, J.; Beck, C.; Erpicum, M.; Esteban, P.; Fettweis, X.; Huth, R.; James, P.; Jourdain, S.; Kreienkamp, F.; et al. COST733cat—A database of weather and circulation type classifications. Phys. Chem. Earth 2010, 35, 360–373. [Google Scholar] [CrossRef]
- Grimalt, M.; Tomàs, M.; Alomar, G.; Martin-Vide, J.; Moreno-García, M.C. Determination of the Jenkinson and Collison’s weather types for the western Mediterranean basin over the 1948–2009 period. Temporal analysis. Atmosfera 2013, 26, 75–94. [Google Scholar] [CrossRef]
- Marcos, A. Zona Asturoccidental-Leonesa. In Geología de España; Vera, J.A., Ed.; IGME: Madrid, Spain, 2004; pp. 49–68. [Google Scholar]
- Alonso, J.L.; Marcos, A.; Suárez, A. Paleogeographic inversion resulting from large out of sequence breaching thrusts: The León Fault (Cantabrian Zone, NW Iberia). A new picture of the external Variscan Thrust Belt in the Ibero-Armorican Arc. Geologica Acta 2009, 7, 451–473. [Google Scholar] [CrossRef]
- Alonso, J.L.; Pulgar, J.; García-Ramos, J.; Barba, P. W5 Tertiary basins and Alpine tectonics in the Cantabrian Mountains (NW Spain). In Tertiary Basins of Spain: The Stratigraphic Record of Crustal Kinematics; Friend, P.F., Dabrio, C.J., Eds.; Cambridge University Press: Cambridge, UK, 1996; pp. 214–227. [Google Scholar]
- Pulgar, J.A.; Alonso, J.L.; Espina, R.G.; Marín, J.A. La deformación alpina en el basamento varisco de la Zona Cantábrica. Trab. Geol. 1999, 21, 283–294. [Google Scholar]
- Jiménez-Sánchez, M.; Ballesteros, D.; Rodríguez-Rodríguez, L.; Domínguez-Cuesta, M.J. The Picos de Europa National and Regional Parks. In Landscapes and Landforms of Spain, World Geomorphological Landscapes; Gutiérrez, F., Gutiérrez, M., Eds.; Springer: Berlin, Germany, 2014; pp. 155–163. [Google Scholar]
- Ballesteros, D.; Jiménez-Sánchez, M.; Giralt, S.; García-Sansegundo, J.; Meléndez-Asensio, M. A multi-method approach for speleogenetic research on alpine karst caves. Torca La Texa shaft, Picos de Europa (Spain). Geomorphology 2015, 247, 35–54. [Google Scholar] [CrossRef]
- Rodríguez-Rodríguez, L.; Jiménez-Sánchez, M.; Domínguez-Cuesta, M.J.; Aramburu, A. Research history on glacial geomorphology and geochronology of the Cantabrian Mountains, north Iberia (43–42 N/7–2 W). Quat. Int. 2015, 364, 6–21. [Google Scholar] [CrossRef]
- Domínguez-Cuesta, M.J.; Jiménez-Sánchez, M.; Berrezueta, E. Landslides in the Central Coalfield (Cantabrian Mountains, NW Spain): Geomorphological features, conditioning factors and methodological implications in susceptibility assessment. Geomorphology 2007, 89, 358–369. [Google Scholar] [CrossRef]
- Valenzuela, P.; Domínguez-Cuesta, M.J.; Mora García, M.A.; Jiménez-Sánchez, M. A spatio-temporal landslide inventory for the NW of Spain: BAPA database. Geomorphology 2017, 293, 11–23. [Google Scholar] [CrossRef]
- Domínguez-Cuesta, M.J.; Jiménez-Sánchez, M.; Rodríguez García, A. Press archives as temporal records of landslides in the North of Spain: Relationships between rainfall and instability slope events. Geomorphology 1999, 30, 125–132. [Google Scholar] [CrossRef]
- Valenzuela, P. Landslide triggering in Asturias (NW Spain). Rainfall and soil moisture conditions modelling. Ph.D. Thesis, University of Oviedo, Spain, 2017; 180p. [Google Scholar]
- Valenzuela, P.; Zêzere, J.L.; Domínguez-Cuesta, M.J.; Mora García, M.A. Empirical rainfall thresholds for the triggering of landslides in Asturias (NW Spain). In Proceedings of the European Geosciences Union General Assembly 2017, Vienna, Austria, 23–28 April 2017. [Google Scholar]
- Peel, M.C.; Finlayson, B.L.; McMahon, T.A. Updated world map of the Köppen-Geiger climate classification. Hydrol. Earth Sys. Sci. 2007, 11, 1633–1644. [Google Scholar] [CrossRef]
- Iberian Climate Atlas. Available online: http://www.aemet.es/documentos/es/conocermas/publicaciones/Atlas-climatologico/Atlas.pdf (accessed on 6 January 2018).
- Iglesias, M. Estudio de Inversiones Térmicas y Piscinas de Aire Frío (Cold Air Pools) en el Entorno de Picos de Europa. Master’s Thesis, Universidad Complutense de Madrid, Madrid, Spain, 2014. [Google Scholar]
- González Taboada, F.; Anadón, R. Análisis de Escenarios de Cambio Climático en Asturias. Available online: https://www.asturias.es/medioambiente/publicaciones/ficheros/escenarios%20cambio%20climatico%20web%20af.pdf (accessed on 10 November 2017).
- Botey, R.; Guijarro, J.A.; Jiménez, A. Valores Normales de Precipitación Mensual 1981–2010; Ministerio de Agricultura, Alimentación y Medio Ambiente-Agencia Estatal de Meteorología: Madrid, Spain, 2013; 55p. [Google Scholar]
- Esteban, P.; Martin-Vide, J.; Mases, M. Daily atmospheric circulation catalogue for Western Europe using multivariate techniques. Int. J. Climatol. 2006, 26, 1501–1515. [Google Scholar] [CrossRef]
© 2018 by the authors. Licensee MDPI, Basel, Switzerland. This article is an open access article distributed under the terms and conditions of the Creative Commons Attribution (CC BY) license (http://creativecommons.org/licenses/by/4.0/).