1. Introduction
Glacial landscapes are vulnerable and sensitive to climate change. Glacial length change observations since the end of the 19th century show the worldwide general trend of retreat after the LIA (Little Ice Age) maximum with periods of strong retreat in the 1920s, 1940s, and after mid-1980s with stable or advancing conditions around mid-1970s. According to Oerlemans [
1], the observed retreat of glaciers during the 20th century followed a linear trend that corresponded to a temperature increase of +0.66 °C per century.
Global warming since the mid-1990s caused the accelerated glacial reduction in almost all regions globally as is documented in the global averages of mass balance, which reveal strong ice losses in the first decade after the start of the measurements in 1946, followed by a slowing down between 1956 and 1965, a moderate mass loss between 1966 and 1985, and a subsequent acceleration of ice loss until today. The mean of the 30 continuous “reference” series yields an annual mass loss of 0.58 m water equivalent (m w.e.) for the decade 1996–2005, which is more than twice the loss rate of 0.25 m w.e. between 1986 and 1995, and over four times the rate of 0.14 m w.e. for the period from 1976 to 1985 [
2]. Overall, the cumulative average ice loss over the past six decades exceeded 20 m w.e., and the average ice loss was about 0.35 m w.e. annually [
2].
However, glaciers in different regions show different dynamics and scales of retreat caused by variations in the regional climate, morphology, and glacier size. In humid regions (Patagonian Ice Plateau, Iceland, Western Cordillera of North America, the western mountains of New Zealand, Norway), “temperate” glaciers—characterized by high mass turnover, firn and ice at melting temperature, ELA and glacial termini altitude, warm temperatures, and a long melting season—are sensitive to the general warming [
3,
4]. In arid regions (East Antarctica, arctic and subarctic North America and Asia, Eastern Siberia, tropical Andes, Central Asia), “cold” glaciers—characterized by low mass turnover resulting from low temperatures, a short melting season, and polythermal or cold firn/ice well below melting temperature—resist the warming more successfully. High altitudinal gradients of temperature in arid areas lead to lower ELA uplift values than in the humid areas even in the background of equal warming. On the other hand, in arid areas glaciers are usually less thick, which means that in cases of unfavorable climatic changes the response of the glaciers can be rapid and the glacial retreat can be irreversible. This is why the glaciers of arid areas tend to form fewer moraines, and why their stabilization under global warming conditions is rare [
5].
Another important factor, which influences the time of glacial reaction to climatic change, is the glacier size (length, thickness, area). Continental ice sheets are relatively inert: the Greenland Ice Sheet is estimated to have a response time of 1500–3000 years [
6]. Alpine glaciers are better indicators of such change: small cirque glaciers can reflect annual changes in mass balance, almost without delay [
7], while larger valley glaciers have a longer response time. For example, the Franz Josef Glacier (11 km long, 35 km
2 in area) in New Zealand has a response time of 21–24 years [
8]).
The study of the glacial dynamics in high mountains is important for several reasons. First, changes in the area of glaciers alter the overall albedo of the Earth. Second, non-ice sheet glaciers are the main contributors of glacier meltwater that causes rise in sea level [
9,
10,
11,
12,
13]. Third, in arid mountainous regions, including the interior Asia, meltwater from glaciers often provides the only source of water for drinking, crop irrigation, and other uses imperative to living organisms [
14,
15,
16,
17,
18]. Fourth, glacial fluctuations can activate exogenous processes, including the dangerous ones. While glacier dynamics are better understood for humid climates, they are relatively few studies on arid areas. Such knowledge would help in explaining the impact of climate change on the cryo- and hydrosphere, particularly in mountains where meteorological stations do not exist.
The aims of the article are (i) to characterize the present glaciation of the arid part of the Altai Mountains; (ii) to reveal the glacial dynamics since the 1960s; (iii) to identify patterns of glacial degradation and their regional specific; and (iv) to estimate the glacial response to climatic fluctuations.
2. Study Area
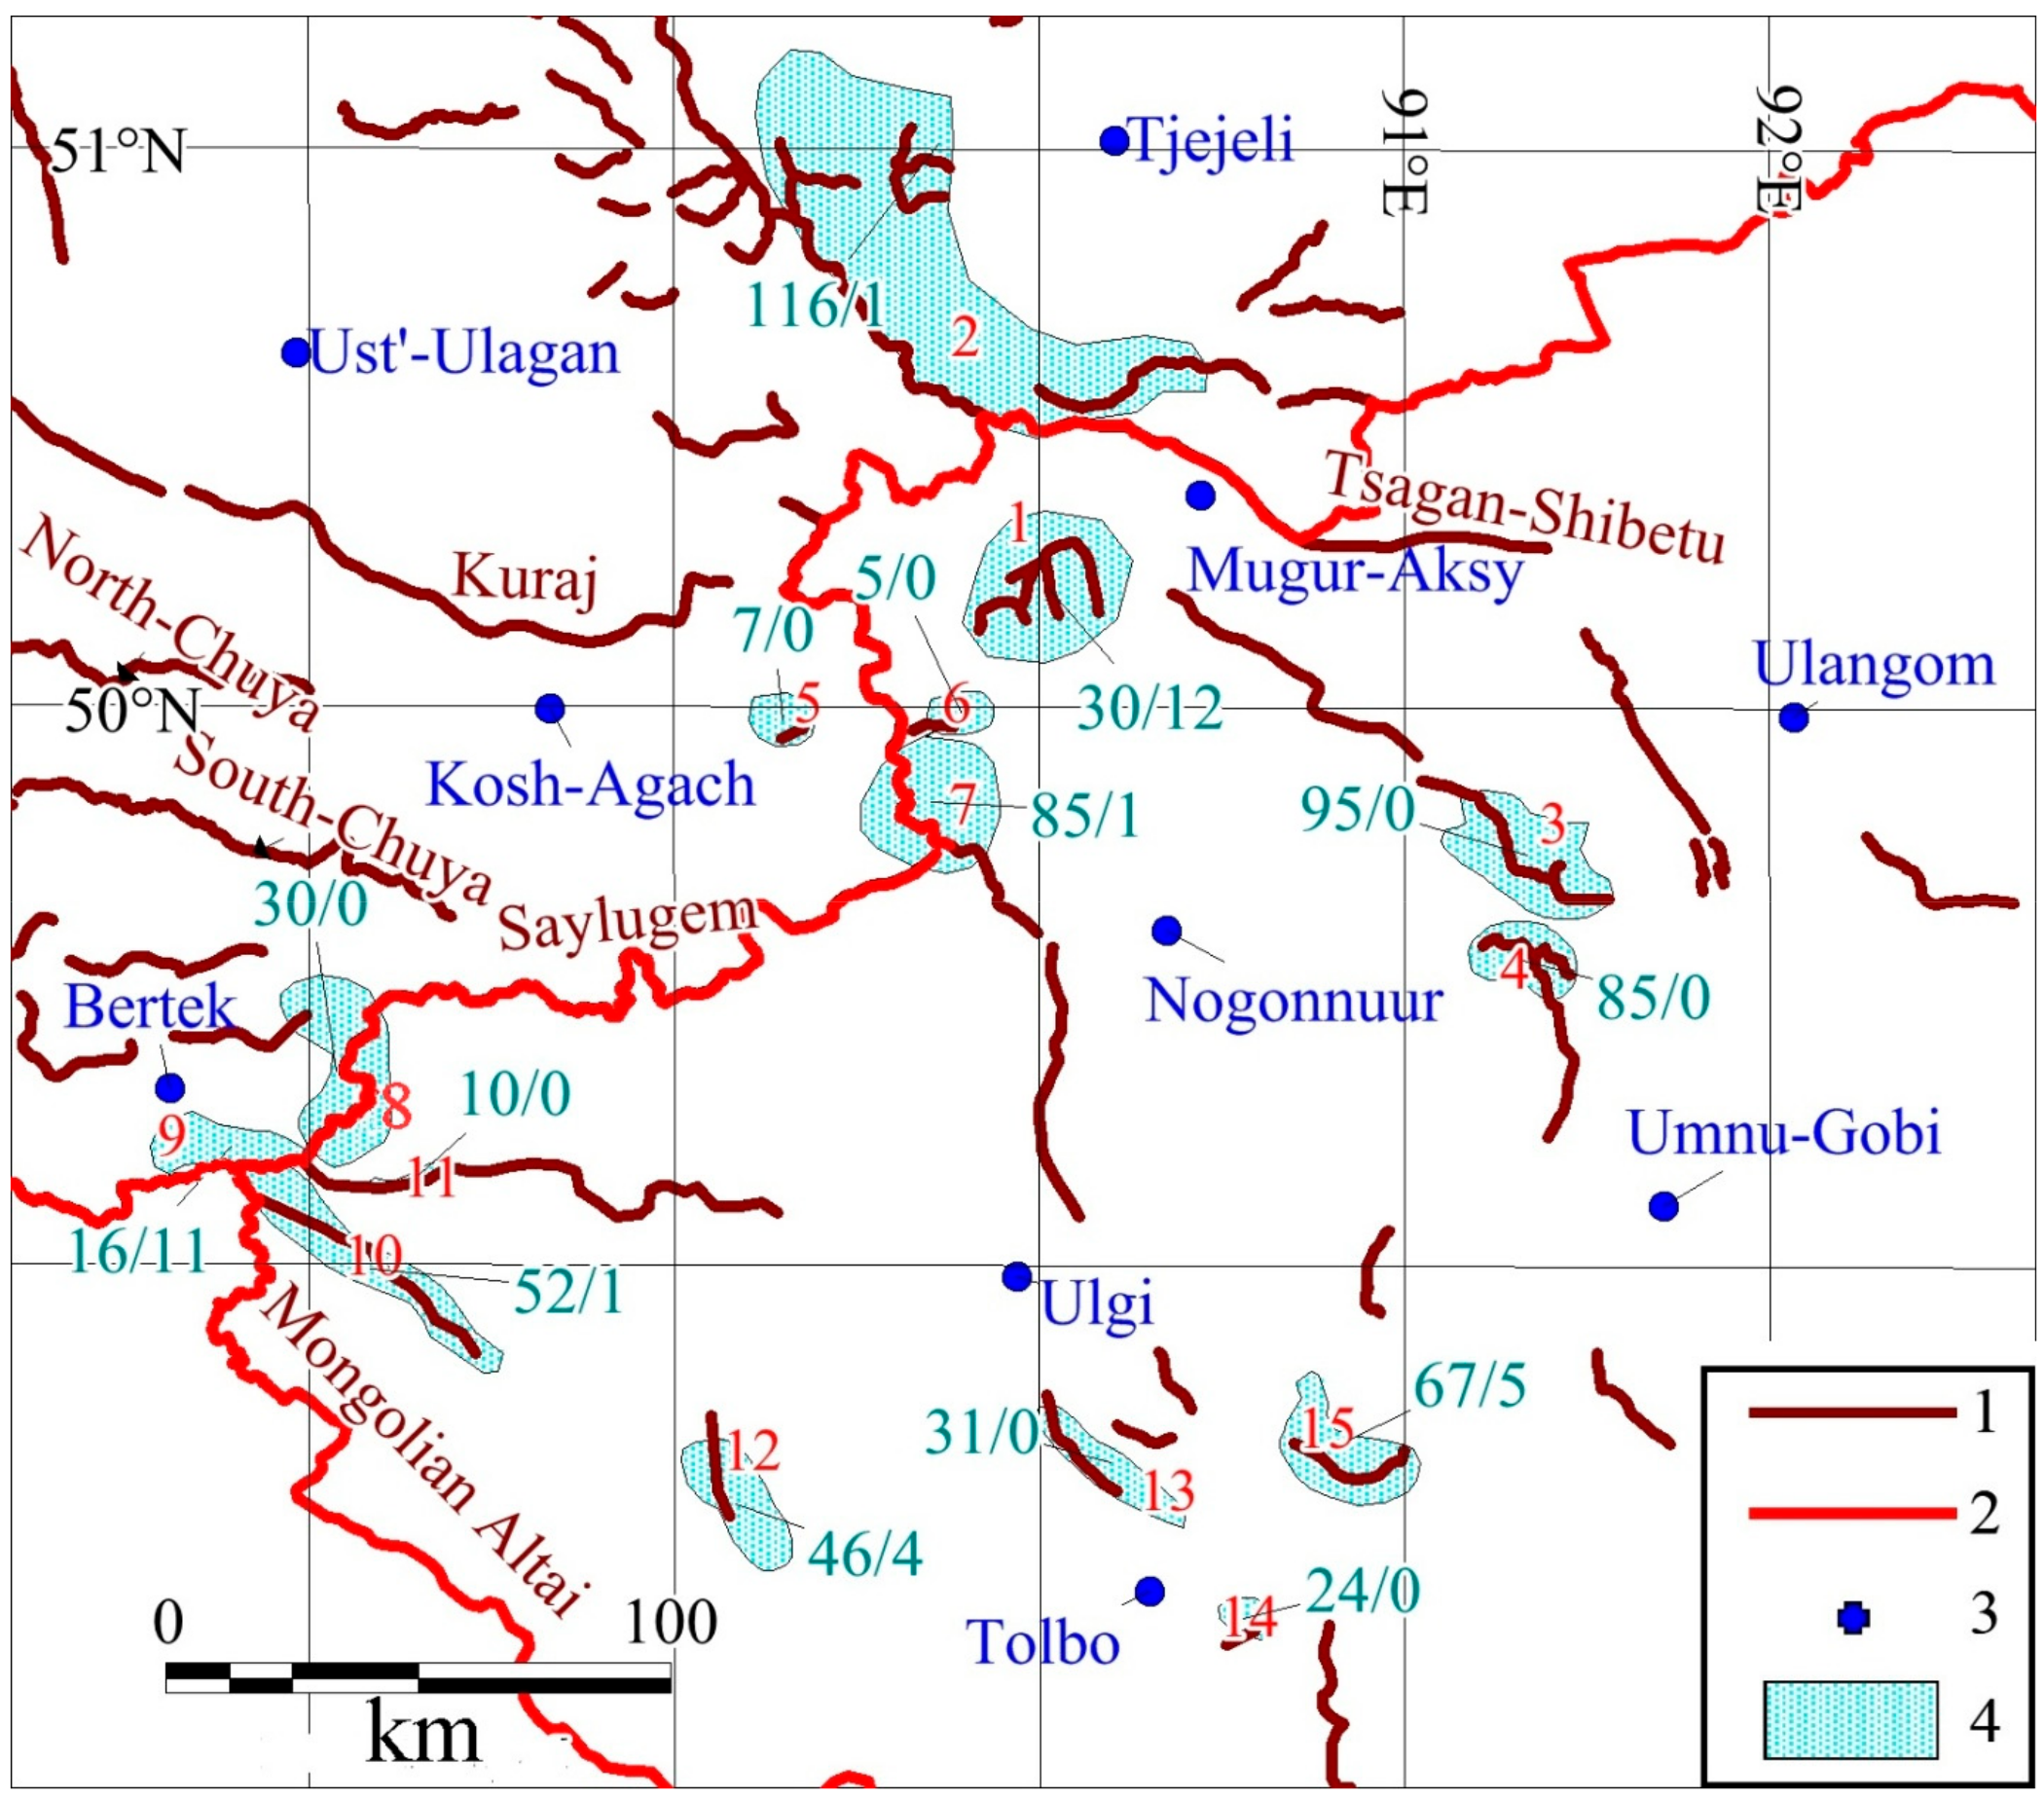
The research area covers ~90,000 km
2, including the mountains of the Southeastern Russian Altai and the Northeastern Mongolian Altai (
Figure 1). These include relatively long mountain ridges (Shapshalsky, Tsagan-Shibetu, Chikhacheva, and Saylugem) in the Russian Altai and mostly isolated mountain massifs in the Mongolian Altai. The maximal altitudes exceed 3600 m a.s.l. (the highest point is 4374 m, Kyityn Mountain, Tavan-Bogd), which is sufficient for the present glaciers to exist. In the high mountain areas, alpine relief can often be found adjacent to plateaus, sometimes exceeding 4000 m a.s.l. (Tsambagarav). According to our estimation, the total area of planation surfaces at altitudes above 2800 m in the study area is ~1500 km
2. The average relative area of planation surfaces increases from ~0.1 km
2 per 1 km of mountain ridge length in the Tsagan-Shibetu mountains in the north to ~4.5 km
2 per 1 km in the Tsambagarav mountains in the south [
19].
The individual mountain ranges are divided by intermountain basins at altitudes from 700 to 2600 m a.s.l. In the northwest, the Bertek, Dzhulukul, Chuya, and Khemchik depressions include the headwaters of the Ob’ and Yenisei rivers and are part of the Arctic Ocean drainage system. In the southeast, these intermountain basins are part of the Mongolian inner drainage system and usually are occupied by lakes (e.g., Achit-Nuur, Ureg-Nuur, Uvs-Nuur) in their centers.
The climate of the study area is still poorly studied, and this is true especially for the present conditions in glacial and pre-glacial zones, climatic trends, and the impact of climate changes on the high-mountain landscapes and glaciers. Meteorological stations are rare, and most of them are located within the intermountain depressions, usually far away from the nearest glaciers and at elevations that are 1 to 2 km lower than those of the glaciers. In addition, most of these meteorological stations have reliable data only from the 1960s on, and some have been closed in the 1990s after the dissolution of the Soviet Union.
Generally, the climate of the region is arid: the average annual precipitation is 200–400 mm in the mountains, and only 100–200 mm in the intermountain depressions, where it is 200 mm at Bertek (2250 m a.s.l.), 160 mm at Mugur-Aksy (1850 m a.s.l.), 140 mm at Ulangom (936 m a.s.l.), 120 mm at Ulgi (1715 m a.s.l.), and 111 mm at Kosh-Agach (1759 m a.s.l.). Moister conditions of up to 800 mm occur only in the northern (Shapshalsky ridge) and western (ultimate western part of the Tavan-Bogd massif) peripheries of the region [
20]. About 70% of this amount falls during the summer period, while winter precipitation is very low owing to the dominance of the Asian anticyclone from November to March. Most of the moisture in the west comes with cyclones from west and southwest, while it arrives from the northwest in the east.
Average annual temperatures are negative. (from −3.0 °C in Mugur-Aksy to −8.3 °C in Bertek). Mean summer temperatures at the meteorological stations vary between 8.2 and 17.8 °C depending on elevation. Generally, at an altitude of 2500 m a.s.l., there is an increase in mean summer temperatures from 6.5 to 9.5 °C from the northwest to the southeast [
20]. The increase in summer temperatures and the decrease in precipitation in the southeastern direction result in a rise of the ELA of 500 m [
21,
22].
According to the data from the meteorological stations, a present warming is well pronounced within the region. For example, in Kosh-Agach and Mugur-Aksy, mean summer temperatures increased 1.5–2.0 °C between 1990 and the early 2000s.
4. Materials and Methods
This article is mostly based on the results of continuous monitoring observations of the glaciers of arid Altai. Since the late 1980s, geographers of Saint Petersburg (our research group) established the monitoring of the glaciation in the regime of part-time observation stations (hydrological, glaciological (mass balance, firn line altitude, retreat from the benchmarks etc.), meteorological, geomorphologic, and dendrochronological in situ observations were made in the ablation periods).
Glaciological methods include monitoring of the positions of the glacial edges, locating the ELA, mass balance observations, and mass balance index calculations. The positions of the glacial edges are monitored on the basis of survey activities, such as geodetic surveying, GPS-trekking of the glacial edges, measurements of the changes in the glacial length (repeated measurements of the distance between the benchmarks and the glacial edges), the usage of repeated photographs, and remote sensing. The results of such monitoring provide the opportunity to estimate the rates of advance and the retreat of the glaciers.
The positions of the glacial edges were monitored for different types of glaciers, but the larger valley glaciers are the most representative glaciers with the longest observation periods. The dynamics of such glaciers is less dependent on geomorphic factors, such as slope angle or altitudinal position, due to their larger areas and thicknesses; at the same time these glaciers are more sensitive to changes in climatic characteristics, such as temperatures and precipitation. Smaller cirque, hanging or flat summit glaciers can sometimes show no visible or measurable reaction to climatic change (due to their high altitudinal position or high snow concentration on their surfaces) and are less significant as indicators of such change. At the same time, valley glaciers have longer snouts that reach lower altitudes and therefore are easier to reach. The position of their margin is usually clearer and is easily estimated. Moreover, larger valley glaciers have greater volumes and are most important in the formation of the river flow and as potential water supplies. All these factors make the valley glaciers the main objects of our monitoring.
The two main centers of multiyear observations are the Mongun-Taiga and Tavan Bogd mountain massifs. Observations of the glaciation in the Mongun-Taiga massif were started in 1965 by Seliverstov [
45], who described the glaciers and made their first scheme. Later, the observations were continued by Revyakin and Muhametov [
28,
46]. The largest valley glaciers East Mugur and Seliverstova, situated on the leeward eastern slope of the massif, have been in situ observed the longest, as such observations began in 1965. There are also 10 glaciers with different slope aspects and morphologies (3 valley, 2 corrie-valley, 3 cirque, 1 slope, and 1 hanging). The benchmarks near the snouts were set up, and continuous observations began in the late 1980s or the early 1990s.
On the northern slope of the Tavan Bogd massif, glaciers were first discovered in 1897 and described by Sapoznikov [
24], and the characteristics of the glaciers found in that study have since been corrected by several researchers [
20,
26,
27,
38,
46,
47,
48]. Since 1999, the glaciation has been continuously studied by our research group [
49,
50,
51]. The largest valley glaciers Argamgi-3 and Argamgi-2 have been in situ observed the longest, as such observations began in 1984. There are also nine glaciers (2 cirque, 1 corrie-valley, and 6 slope glaciers), of which continuous instrumental observations began from 2000 to 2001.
In 1991 and 1992, our research group organized part-time observation stations in the Turgen (complex glaciological, meteorological, and hydrological observations at the Tom-Turgen glacier) and Kharkhiraa (route observations) mountain massifs.
In the last several years, the terrestrial range of our field glaciological observations has been widened. Tsagan-Shibetu and Shapshalsky ridges have been studied since 2011 (route observations and benchmarks were set up in 2016 near the snout of the Mushtuk cirque glacier, the largest in the Shapshalsky ridge). The Chikhacheva ridge (Ikh-Turgen) has been studied since 2015 (the benchmark near the edge of the Grigor’eva glacier (valley type)). In Mongolia, the new areas of glaciological monitoring are Tavan Bogd (the Potanin glacier, since 2013), Tsengel-Khairkhan (benchmarks set up near the snouts of 1 valley, 1 corrie-valley, 1 slope, and 1 hanging glacier in 2016), and Tsambagarav (2016–2017, benchmarks at the termini of 4 valley, 3 hanging, and 2 corrie-valley glaciers). Consequently, a monitoring network covering most arid areas of Altai has been created (
Figure 1).
Remote sensing study was based on the analysis of aerial photos of 1962 and 1966 and of space imagery with a spatial resolution from 0.5 up to 30 m per pixel collected from 1968 to 2015 (
Table 1). Most of them were provided by RDC ScanEx [
52] and processed by the Space and Geoinformation Technologies Resource Center of Saint-Petersburg State University. Several high-resolution images were provided by the Digital Globe Foundation [
53].
Every scene was radiometrically normalized and geographically referenced using orbital parameters. An automatic systematic geometric correction of raster data, based on a mathematical model of the view angles of the satellite camera and its position at the moment of the scene collection (rigorous model), was applied. The UTM/WGS 84 projection (Zone 46) has been identified as the reference frame for georeferencing. The imagery has been orthorectified using 30 m ASTER GDEM v.2 digital elevation model [
54] and treated with moderate-sharpening filter for graphic quality preservation.
All aerial photographs were also geographically referenced using ground control points (GCPs) and transformed into the international coordinate system (UTM/WGS 84, Zone 46).
The processing of the space imagery and aerial photographs was carried out using photogrammetric software.
Glaciers were mapped manually; the minimum size of glaciers to be mapped was 0.01 km2. To determine the accuracy of the manual interpretation of the boundaries of the glaciers, several glaciers with an area of more than 0.1 km2 was repeatedly contoured. As a result, it was revealed that the error in determining the area of individual glaciers was less than 5%. The error in determining the area of a large sample of glaciers (more than 100) was reduced to <3% after compensating for positive and negative errors.
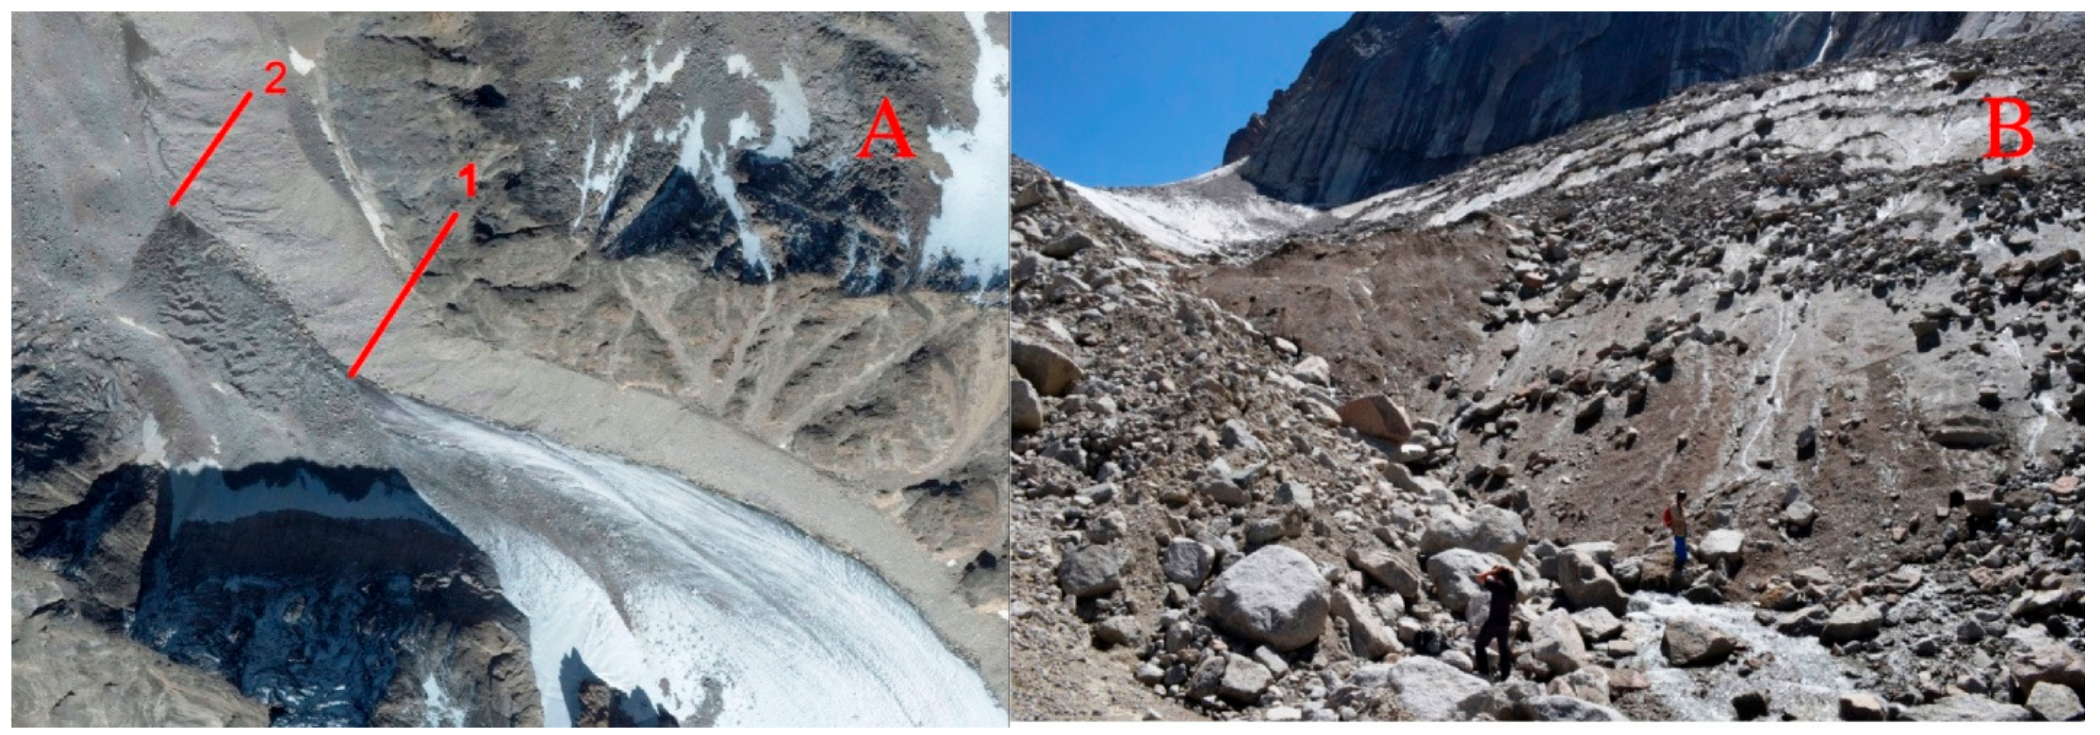
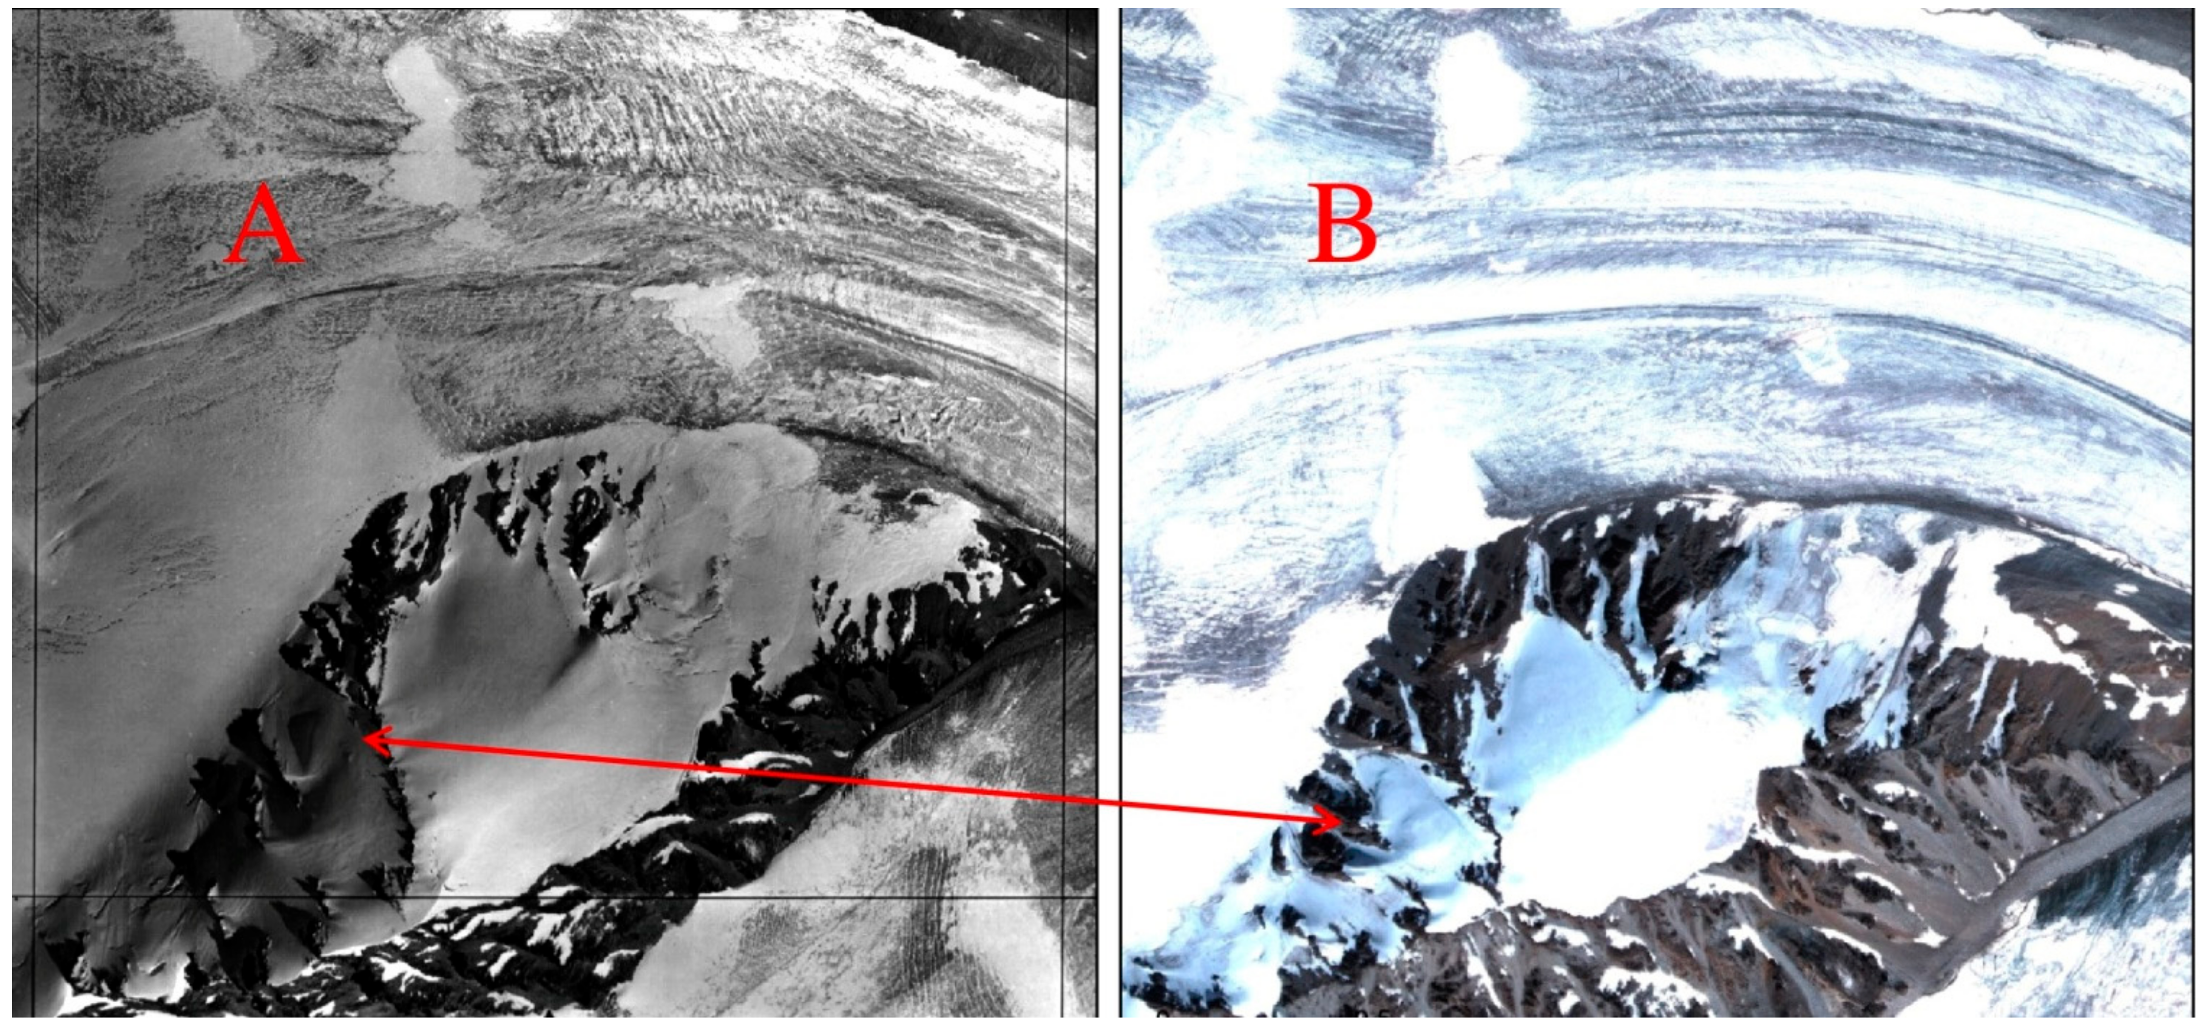
Though remote sensing gives the fullest picture of the present state of the glaciosphere, it still plays a supplementary role in our investigation, as priority is given to in situ observations. This is because there are several problems in the delineation of glaciers. It is usually hard to differentiate between the debris-covered but active glacial termini and the dead ice; sometimes this problem can be solved only by direct observations (
Figure 2).
In areas where no field observations were made, the boundary line between the glacier and the dead ice was found using indicators defined by Loibl et al. [
55]: active ice indicators are a “smooth” debris surface, linear flow structures, and constrained tributaries; dead ice indicators are a rugged debris surface, melting ponds, unconstrained tributaries, and pioneer plants. All those indicators work well with the only exception of pioneer plants, which, due to a dry climate, are absent near the glaciers and appear only on the surface of inactive rock glaciers. In our area of research, it is typical when the active glacial edge is marked by marginal flows that join together at the lowest point of the glacier.
Other typical problems include overestimating the glacial area after snowfalls or when the seasonal snow cover has yet not melted down and the shading of some parts of the glacier and the adjacent non-glacial areas. These problems are solved by using images made at the end of the ablation season and with the least amount of snow and by comparing images of the same area with different acquisition times and different sun angles.
Mapping parameterization of the glaciers was completed on the basis of topographic maps with scales of 1:100,000 and 1:50,000 for Tavan Bogd, and 1:25,000 for Mongun-Taiga; the results of direct measurements of the Mongun-Taiga, Tavan Bogd, Turgen, and Kharkhiraa massifs were also used.
The present firn line altitude in the area of research is generally equivalent to ELA (the difference is usually within 10 m). The firn line altitude was found by combining direct observations with analysis of satellite imagery. We used images with acquisition dates at the end of the ablation seasons.
On some small glaciers, the firn line was not distinguished; in those cases, the Kurowsky method [
56,
57] was used. In this method, the firn line altitude or ELA is calculated as the average altitude of the glacier:
, where
is the firn line altitude or ELA,
represents the areas of different altitudinal zones of the glacier,
is the average altitude of these zones, and
. The calculations were based on the measurements of the topographic maps (1:100,000 and 1:50,000 for Tavan Bogd; 1:25,000 for Mongun-Taiga). The Kurowsky method was also used to verify the values of ELA, found via remote sensing.
Mass balance observations were held in the Mongun-Taiga massif in the 1989/1990, 1992/1993, 1993/1994, 1994/1995, 1999–2000, 2000/2001, 2009/2010, and 2012/2013 balance years; in the Turgen massif, in 1991/1992. Drilling of the stakes was carried out on longitudinal and transverse profiles at the beginning of the ablation periods; changes in the height of the glacial surface were measured at the beginning and end of the accumulation season, and daily during the ablation season. Mass balance measurements were combined with the measurements of glacial runoff during the ablation period, which gave the opportunity to calculate the amount of meltwater delayed due to the formation of the superimposed ice, and with meteorological observations (temperature, solar radiation, precipitation, and air humidity).
Continuous multiyear mass balance observations of the glaciers in the area of research involve much time, effort, and funding due to their remoteness. A possible solution to that problem is to use empiric relationships between the meteorological and mass balance parameters and to make mass balance calculations for the periods of available meteorological ranks.
According to the results of our multiyear mass balance observations, the link between the radiation balance and the melting and between the melting and the relative humidity is very low; at the same time, the correlation coefficient between the daily melting and the average daily temperature for the glaciers of the region is between 0.73 and 0.90 [
58]. This is why we used the method of Glazyrin [
57]. In this method, the mass balance index for the firn line altitude of the glaciers is found from the ablation and accumulation values, calculated on the basis of the information about temperature and precipitation from the meteorological station, which is extrapolated to the needed altitude. Such calculations were done for four valley glaciers with the longest range of observations in the Mongun-Taiga and Tavan Bogd massifs.
Accumulation is calculated by the following formula:
where
К is the snow concentration coefficient (at the firn line altitude, it is calculated as the average multiyear ablation divided by the average multiyear precipitation);
Pfi is the annual precipitation at firn line (
, where
Gp is the vertical precipitation gradient and
is the annual precipitation at the meteorological station).
Gp values for the Mongun-Taiga massif (7 mm/100 m) were estimated by direct observations (simultaneous measurements of precipitation during the ablation season at different levels and at the nearest meteorological station Mugur-Aksy (about 30 km from the glaciers, 1830 m a.s.l.). As the summer precipitation makes about 70% of the annual amount, it is assumed that the relationship between the annual precipitation amounts at certain altitude levels and those at the base meteorological station is proportional to the ratio of the corresponding precipitation amounts for the period of parallel observations (ablation period)). For the northern slope of the Tavan Bogd massif, the Gp value (19.5 mm/100 m for the western part) was obtained as the average between the gradients of the following pairs of meteorological stations: Bol’shenarymskoe-Katon-Karagaj, Buran-Katon-Karagaj, Zajsan-Katon-Karagaj, and Samarka-Katon-Karagaj.
The average summer temperature on the firn line was calculated by the formula
, where
is the altitude of meteorological station,
is the altitude of firn line,
is the average summer temperature at the meteorological station,
is the vertical temperature gradient, and
is the temperature change at the ice–rock interface. For the Mongun-Taiga massif, the
value (0.69 °C/100 m) was estimated by direct observation (simultaneous measurements of temperature over the glacial surface, under the glacial snouts and at the upper tree line compared with the corresponding data from the nearest meteorological station Mugur-Aksy (about 30 km from the glaciers, 1830 m a.s.l.). For the Tavan Bogd massif the thermal gradient (0.559 °C/100 m for the western part) was obtained on the basis of dependence for the Altai-Sayan region [
59]:
where
is the average annual precipitation in the given altitudinal diapasone, mm.
Annual ablation (
αi) is calculated by the formula of Krenke–Hodakov, widely used in Russia, obtained on the basis of analysis of data from different regions of the world (Pamir, Altai, Polar Urals, Suntar-Hayata ridge, Scandinavia, Novaya Zemlya, Franz Josef Land, Western Spitsbergen, Antarctica (Mirnyi), the Alps, and the Zailiyskiy Alatau ridge) [
60]:
For the Mongun-Taiga massif, superimposed ice plays a sufficient role in the glacial nourishment, which is why we used a modified variant of the Krenke–Hodakov formula for the glaciers of Mongun-Taiga [
61]:
The usage of that modified variant of the Krenke–Hodakov formula is verified by the direct mass balance measurements at the Seliverstova Glacier taken in 2013, when the estimated ablation on the firn line altitiude for the whole ablation period was 390 mm w.e. Mass balance index calculations by the Krenke–Hodakov formula for the summer period yield 1011 mm w.e. This is obviously too far from the reality. Calculations by the modified version gave 437 mm w.e. ablation, which is much closer to the estimated values. Among all the glaciers of Altai, the glaciers of Mongun-Taiga have the greatest role in superimposed ice formation, which has been noted by Revyakin [
27]. Thus, these glaciers are closer to the glaciers of Northeastern Siberia, for which the modified version of formula has been initially created.
5. Results
Present glaciation. Most information about the present glaciations of the area of research was obtained by our research group and published earlier [
21,
62], which is why we give only a brief description of the present glaciation and its structure here. In the current publication, information about the glaciation of the Shapshalsky ridge and a major part of the Tsagan-Shibetu ridge, as well as information about the Mongun-Taiga, Tsengel Khairkhan, and Tsambagarav Mountains and the northern slope of Tavan-Bogd, are updated based on field observation data recorded in 2015, 2016, and 2017 (
Table 2).
Arid conditions are not favorable for glaciation, so small glaciers prevail. Several types of glacial centers can be distinguished: 1. Areas with well-developed alpine relief and large separate valley glaciers (the southeastern slope of Tavan Bogd (the western part of the Nairamdal ridge), Turgeni-Nuru, and Kharkhiraa); 2. Glacial complexes with flat summit or dome-shaped glaciers in their central parts and united accumulation zones (Mongun-Taiga, the northern slope of Tavan Bogd, Tsengel-Khairkhan, Tsambagarav, Sair, and the central and eastern parts of Nairamdal); 3. Groups of scattered, mostly cirque and hanging, glaciers (Shapshalsky, Tsagan-Shibetu, Hunguyn-Nuru, and Sailugem); 4. Glacierets close to disappearance (Mongun-Taiga-minor, Talduayr, and Sogostyn).
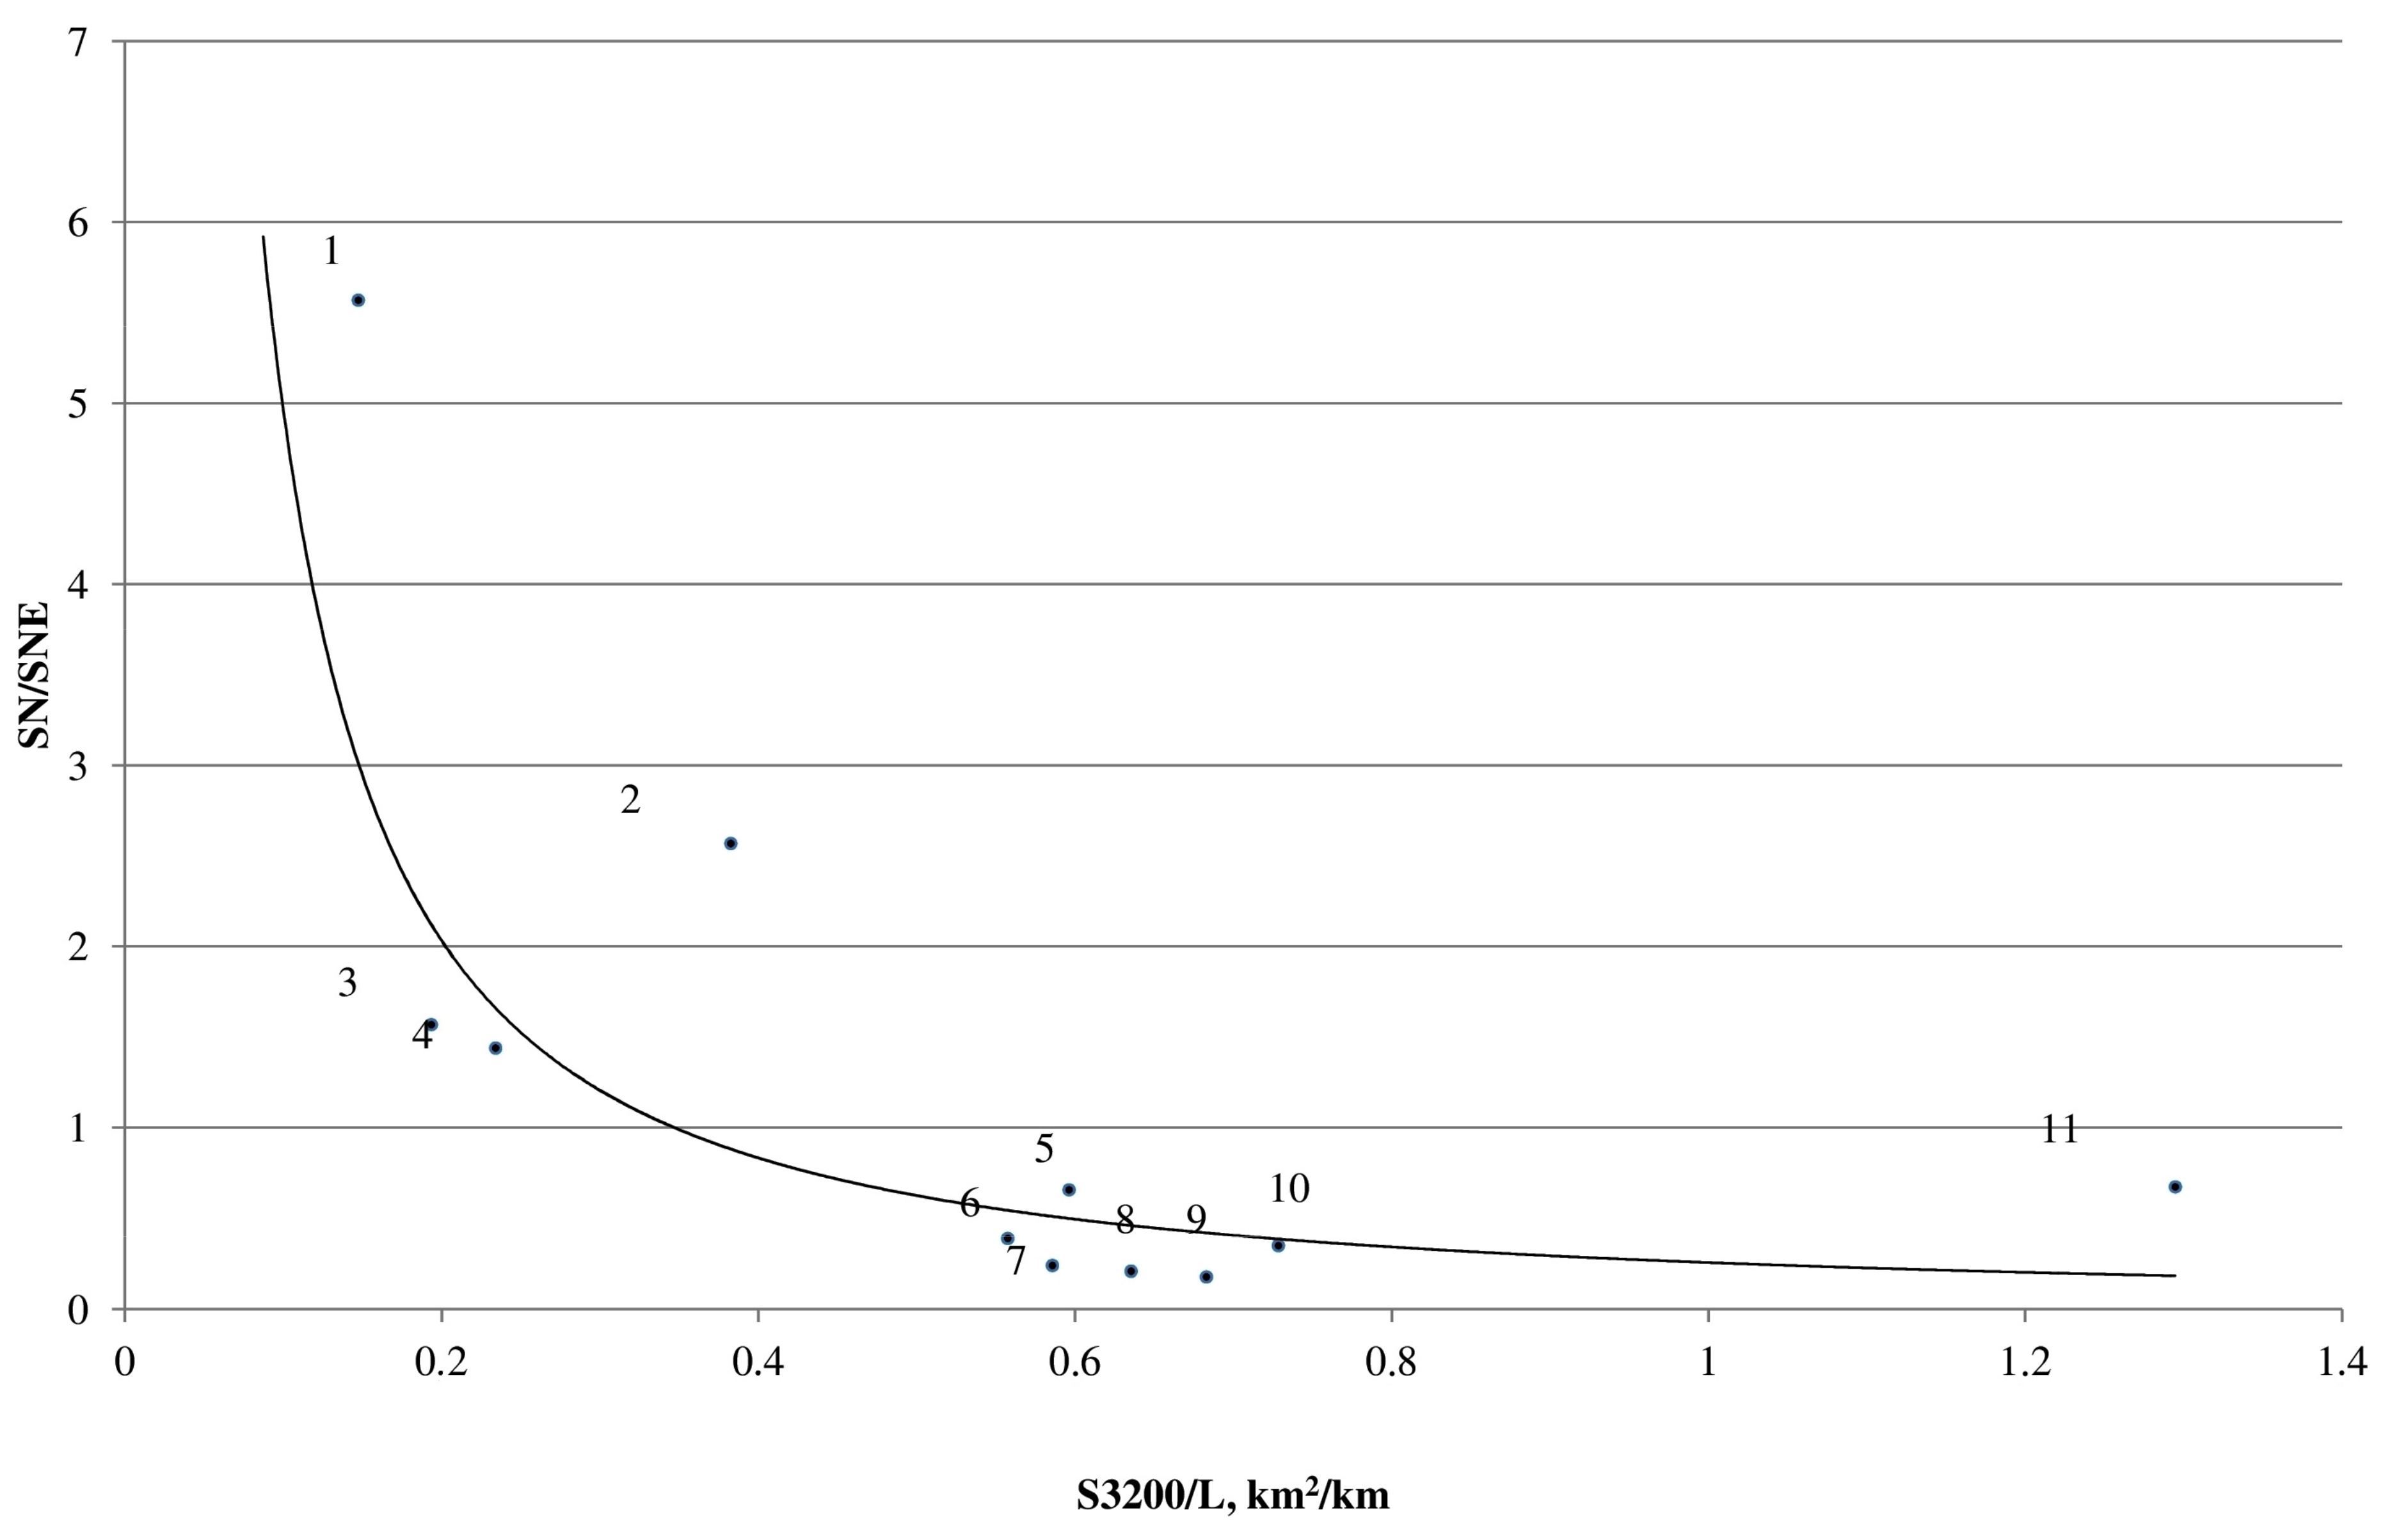
The influence of the snow drift on the glaciations is well seen in the domination of northeastern slope aspects for the glaciers of the region (
Figure 3). This dominance is well seen for the glacial centers with large areas of plateaus and planation surfaces. Such plateaus increase the area from which the snow is drifted into cirques, thus increasing the snow accumulation and as a further consequence the glaciation of the leeward slopes. In the areas with well developed alpine relief, the northern aspect is more typical for the glaciers because the snow drift across the mountain crests is relatively weak.
A high concentration of snow on the glacial surfaces is confirmed by our calculations for the glaciers of the Mongun-Taiga massif (
Table 3): average annual ablation for the firn line was calculated by the modified variant of the Krenke–Hodakov formula. The average accumulation was assumed equal to ablation, and ablation/accumulation values were then divided by precipitation values extrapolated from Mugur-Aksy meteorological station.
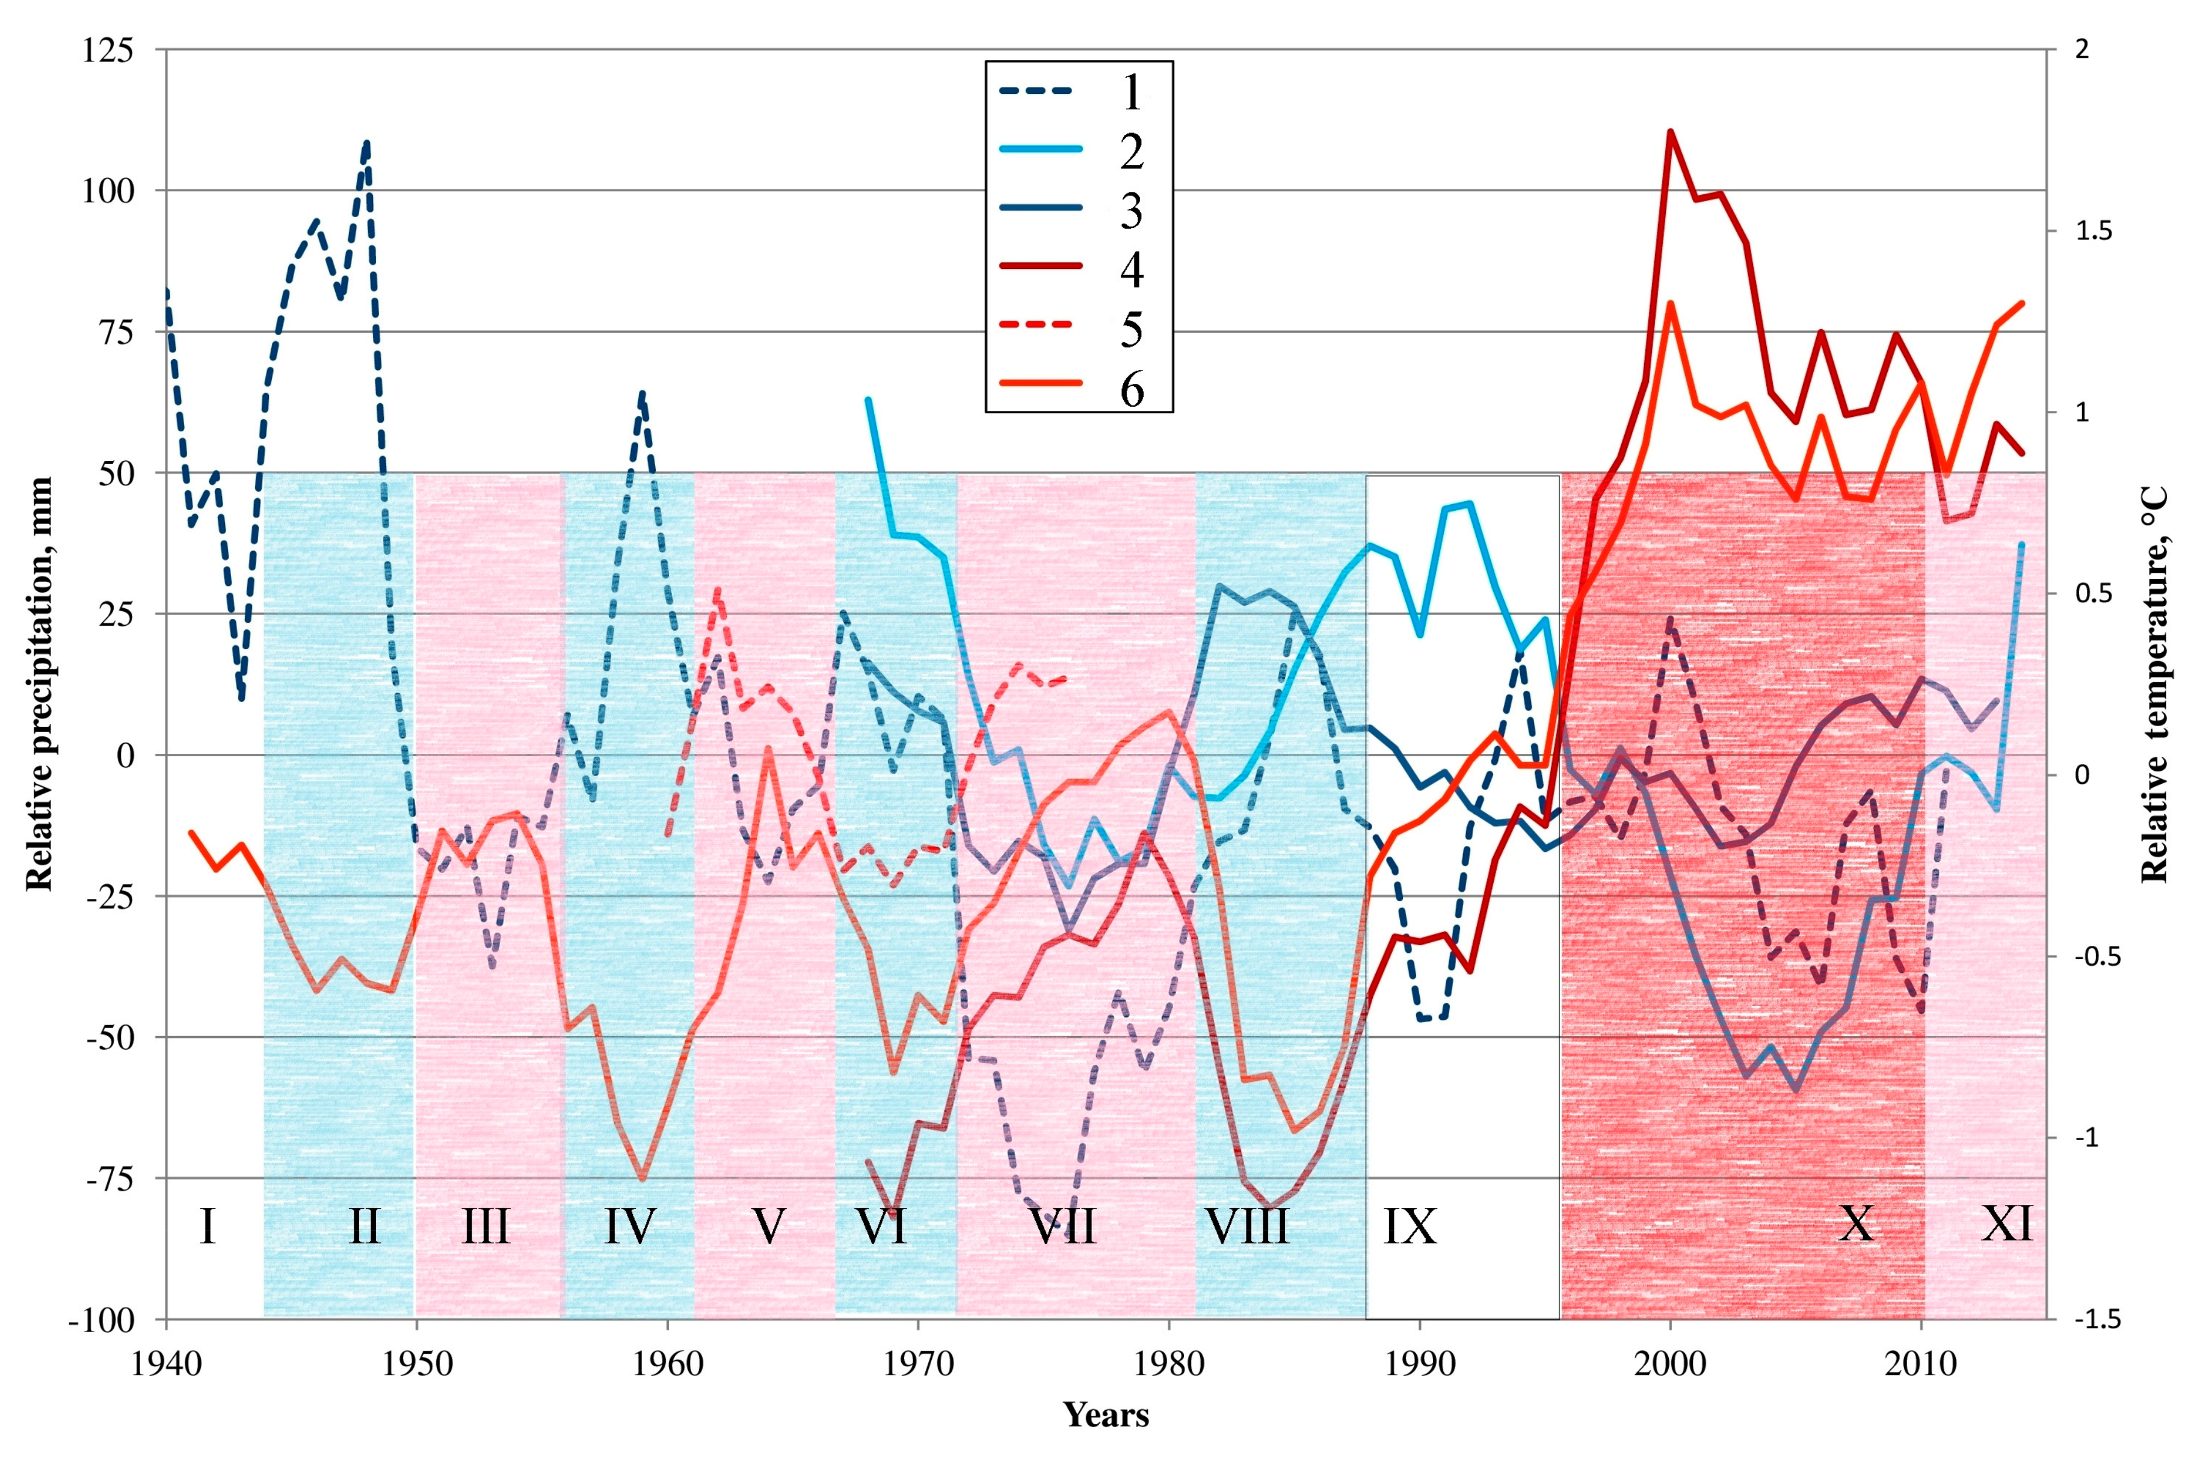
Present climate dynamics. Analysis of the data of three meteorological stations for the period since 1940 (
Figure 4) allows for distinguishing periods of different climatic influences on the glaciers. The time before 1943 was generally neutral—a relatively high level of temperatures on the background of high precipitation (Phase I). In the period 1943–1988, cool and moist intervals were alternating with warm and dry phases of similar duration. Phases II (1943–1950), IV (1956–1961), VI (1966–1971), and VIII (1981–1988) were cool and moist and favorable for the glaciers; Phases III (1950–1956), V (1961–1966), and VII (1971–1981) were dry and warm and unfavorable. The alternation of phases was then distorted: the warm but moist Phase IX was neutral, and Phase X (1995–2010) was extremely warm and dry with a strongly negative influence on the glaciations. This was a period of rapid temperature growth that lasted until 2000, which was followed by a minor decline and stabilization at a high level. Phase XI, after 2010, is generally cooler and more humid than Phase X, thus being less unfavorable for the glaciers.
Generally the matching of warm and dry intervals, as well as the matching of cool and wet periods, leads to abrupt changes in glacier nourishment and therefore to the abrupt pattern of glacial dynamics. Phase X was the main climatic event of the period of meteorological observations due to its long duration and extraordinary combination of very high and rapidly growing summer temperatures and very low precipitation. It was probably the time of transition from one stable state of climate to another, warmer one. It clearly has a well-pronounced response in glacial dynamics.
Glacial dynamics. Because of the maximum of the LIA, there was a general tendency of glacial retreat, but on that background there were periods of activation of glaciers. For most glacial centers of arid Altai, there are reliable data about glacial dynamics only from the 1950s to the 1960s, when aerial and satellite imagery (Corona) was obtained and field glaciological observations were held at the Mongun-Taiga massif [
45], Tavan Bogd [
27], and Chihacheva [
5]. Some of the glaciers in that period were stable (Grigor’eva Glacier [
5]) or even advancing (East Mugur Glacier, Mongun-Taiga) [
45].
Another period when glaciers were close to stabilization was from the end of the 1980s to the beginning of the 1990s. In 1987, the right ice flow of Potanin Glacier (Aleksandra Glacier) was active and probably advancing [
38]. At the Mongun-Taiga massif in 1992–1993, there was an increase in the length of the two largest glaciers (Seliverstova, East Mugur) due to the ice that formed on the glacial snouts.
Glacial degradation increased rapidly beginning in the mid-1990s (
Table 4).
The influence of the climatic Phase X can mostly be seen in the dynamics of the small glaciers and in the changes in the altitude of the firn line. At the Mongun-Taiga massif in 1995–2008, the firn line rose by 200–300 m, reaching an average level of 3600 m. The snow-firn fields survived only in a few glaciers. The shift of the firn line was accompanied by the degradation of perennial snow patches. In the period from the mid-1960s to 2008, the altitudinal belt of the snow patches of the Mongun-Taiga massif shifted 300–400 m upwards; the number of the perennial snow patches decreased by 4 times—their area, by 15 times [
63].
At the Mongun-Taiga massif, the 1995–2008 period was a time of especially rapid degradation in the glaciers; their area decreased by 18% (more than 1% per year). Small glaciers, compared with the larger ones, decreased to a greater degree: the hanging and the cirque-hanging glaciers lost 38% and 65% of their area, respectively, while the valley glaciers lost only 21% of their area. Eighteen small glaciers have disappeared, mostly by means of transformation into perennial snow patches and debris-covered dead ice. In Tavan Bogd (the northern slope), the glaciers lost 7.1% of their area in 2001–2009 (the valley glaciers lost about 9.8% of their area, the cirgue glaciers −35%, and the prevailing slope and hanging glaciers about 5%.
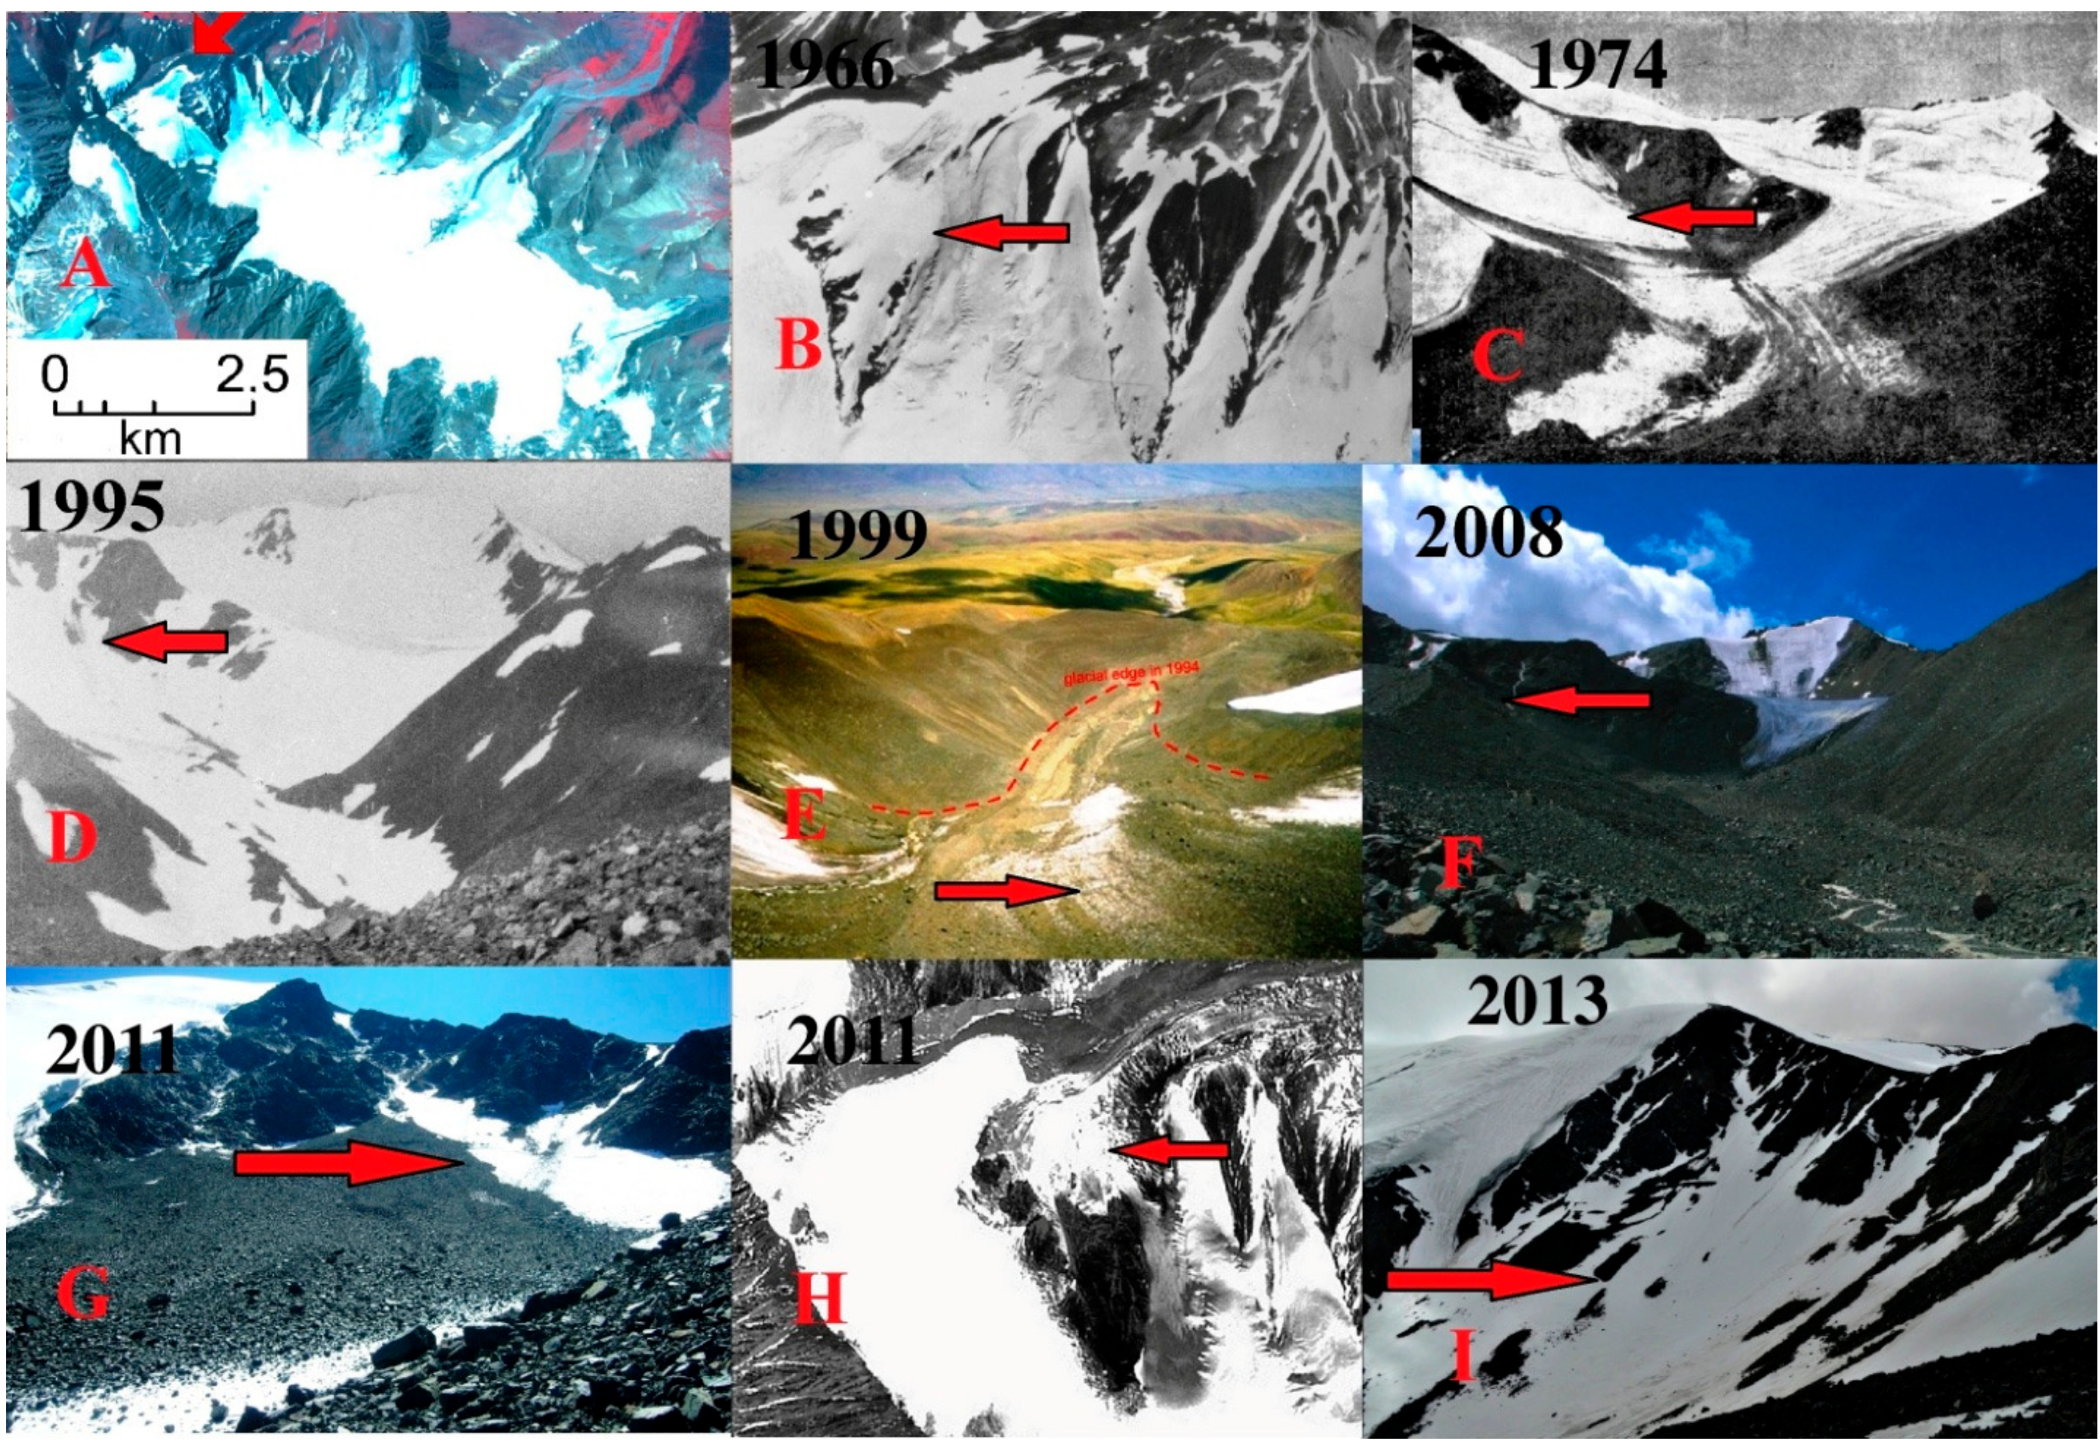
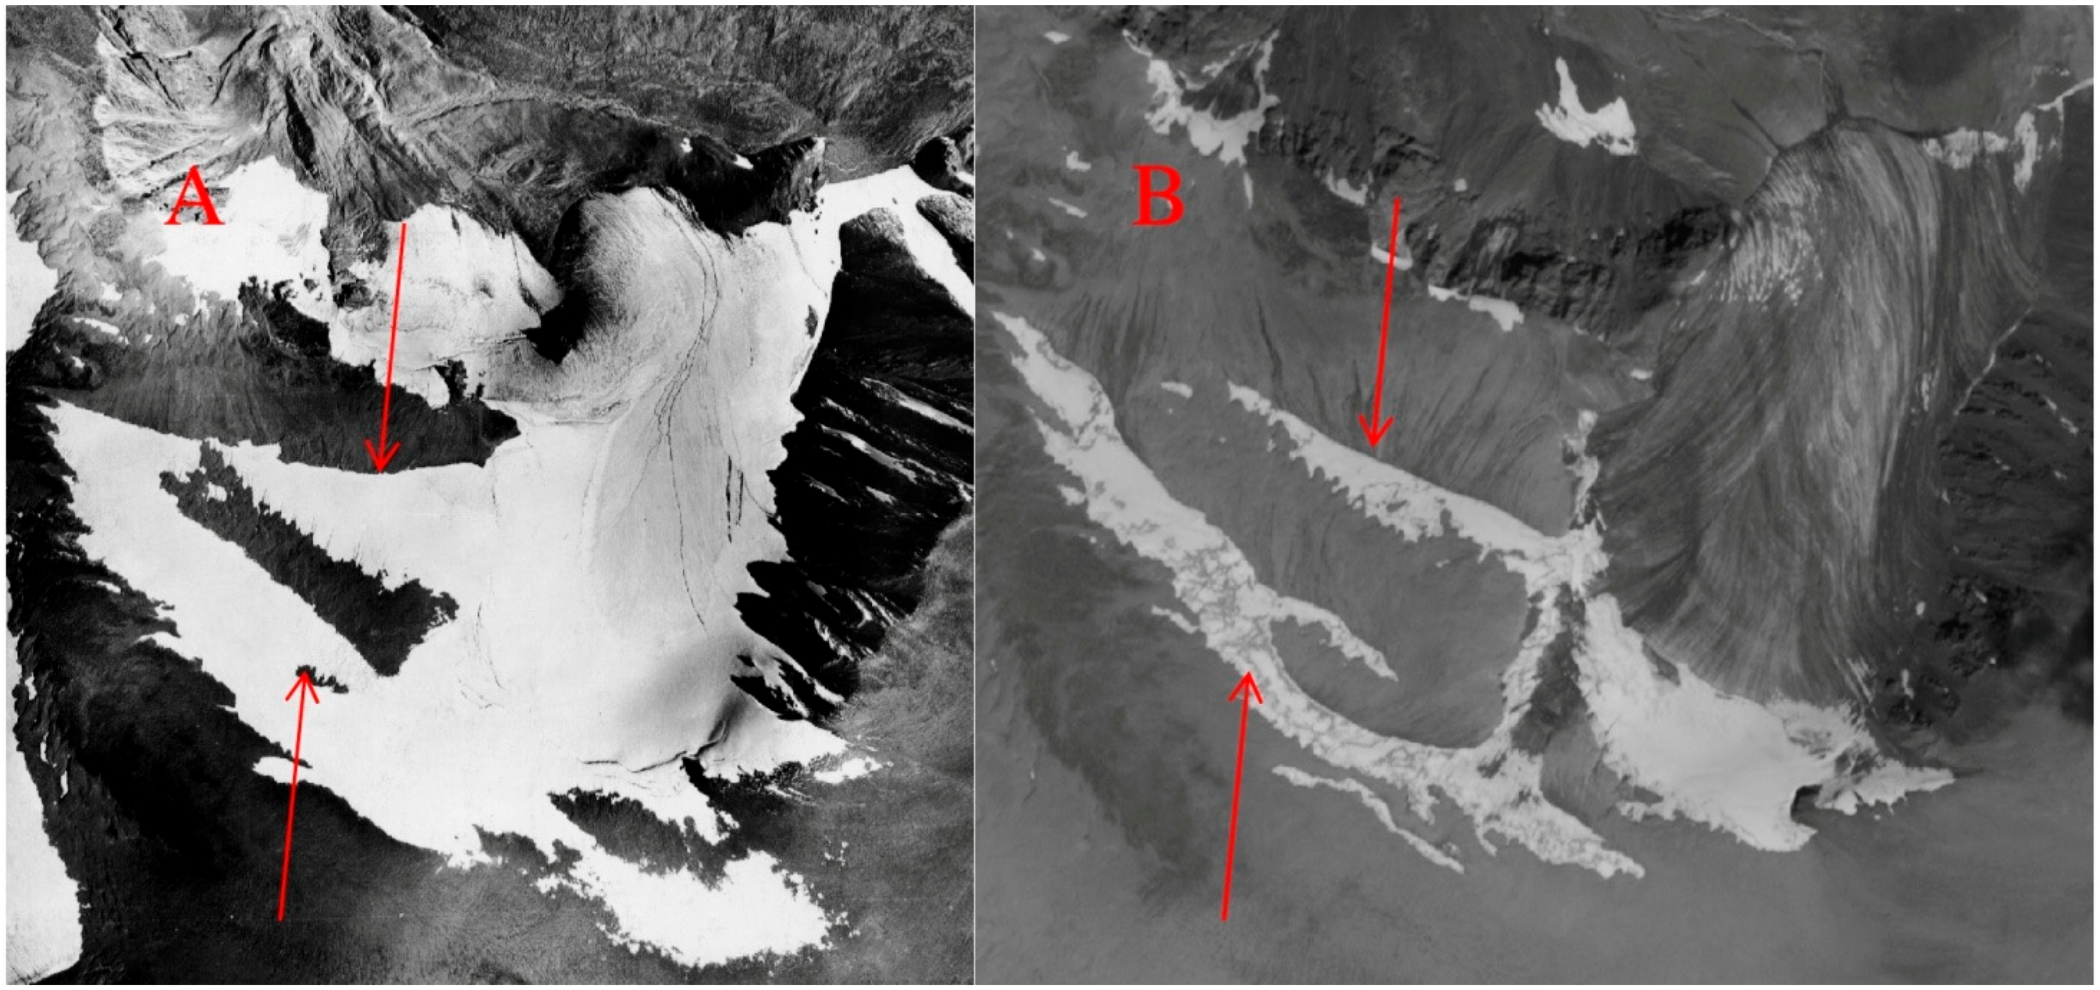
In 2009, precipitation and snow accumulation increased, and the firn line returned to its mid-1990s position. Perennial snow patches and debris-covered glaciers started to recover (
Figure 5). There was a general tendency for the retreat of the small cirque glaciers to slow down. At the same time, the flat summit glaciers and the tributaries of the valley glaciers, coming from the flat-summit and the dome-shaped glaciers continued to degrade; as a result, relative degradation of the area of different morphological types differed insignificantly. The rate of retreat of the fronts of the valley glaciers continued to increase, reaching rates of 46.6 m/year (Argamgi-2 Glacier (No. 11), Tavan Bogd, average for 2009–2015) and 44.2 m/year (Seliverstova Glacier (No. 13), the Mongun-Taiga massif, average for 2013–2016).
The patterns of glacial dynamics. The patterns of the glacial dynamics in the period of observations and measurements can be put together into 3 groups.
The processes of the first group are typical for the glacial dynamics of different regions of the world and include different variants of retreat of the glacial fronts:
The processes of the second group are mostly specific to the area of research. One of the features of the glaciation of the region is low energy of glaciation (activity index). This means that altitudinal mass balance gradient is very low (from 0.2–2.3 mm/m for the flat summit glaciers to 2.3–4.4 mm/m for the valley and cirque glaciers). In these conditions, mass balance gradients (caused by the stepped pattern of relief typical of the region and therefore different accumulations at curved and caved parts of the glacial lengthwise profile) are much higher than the altitudinal mass balance gradients (caused by the decrease in temperature and increase in precipitation as altitude increases). As a result, in many cases, areas with low accumulation are higher than areas with high accumulation. Together with the different thicknesses of ice over the lengthwise profile of the glaciers, this causes an uneven and abrupt pattern of dynamics. There are different types:
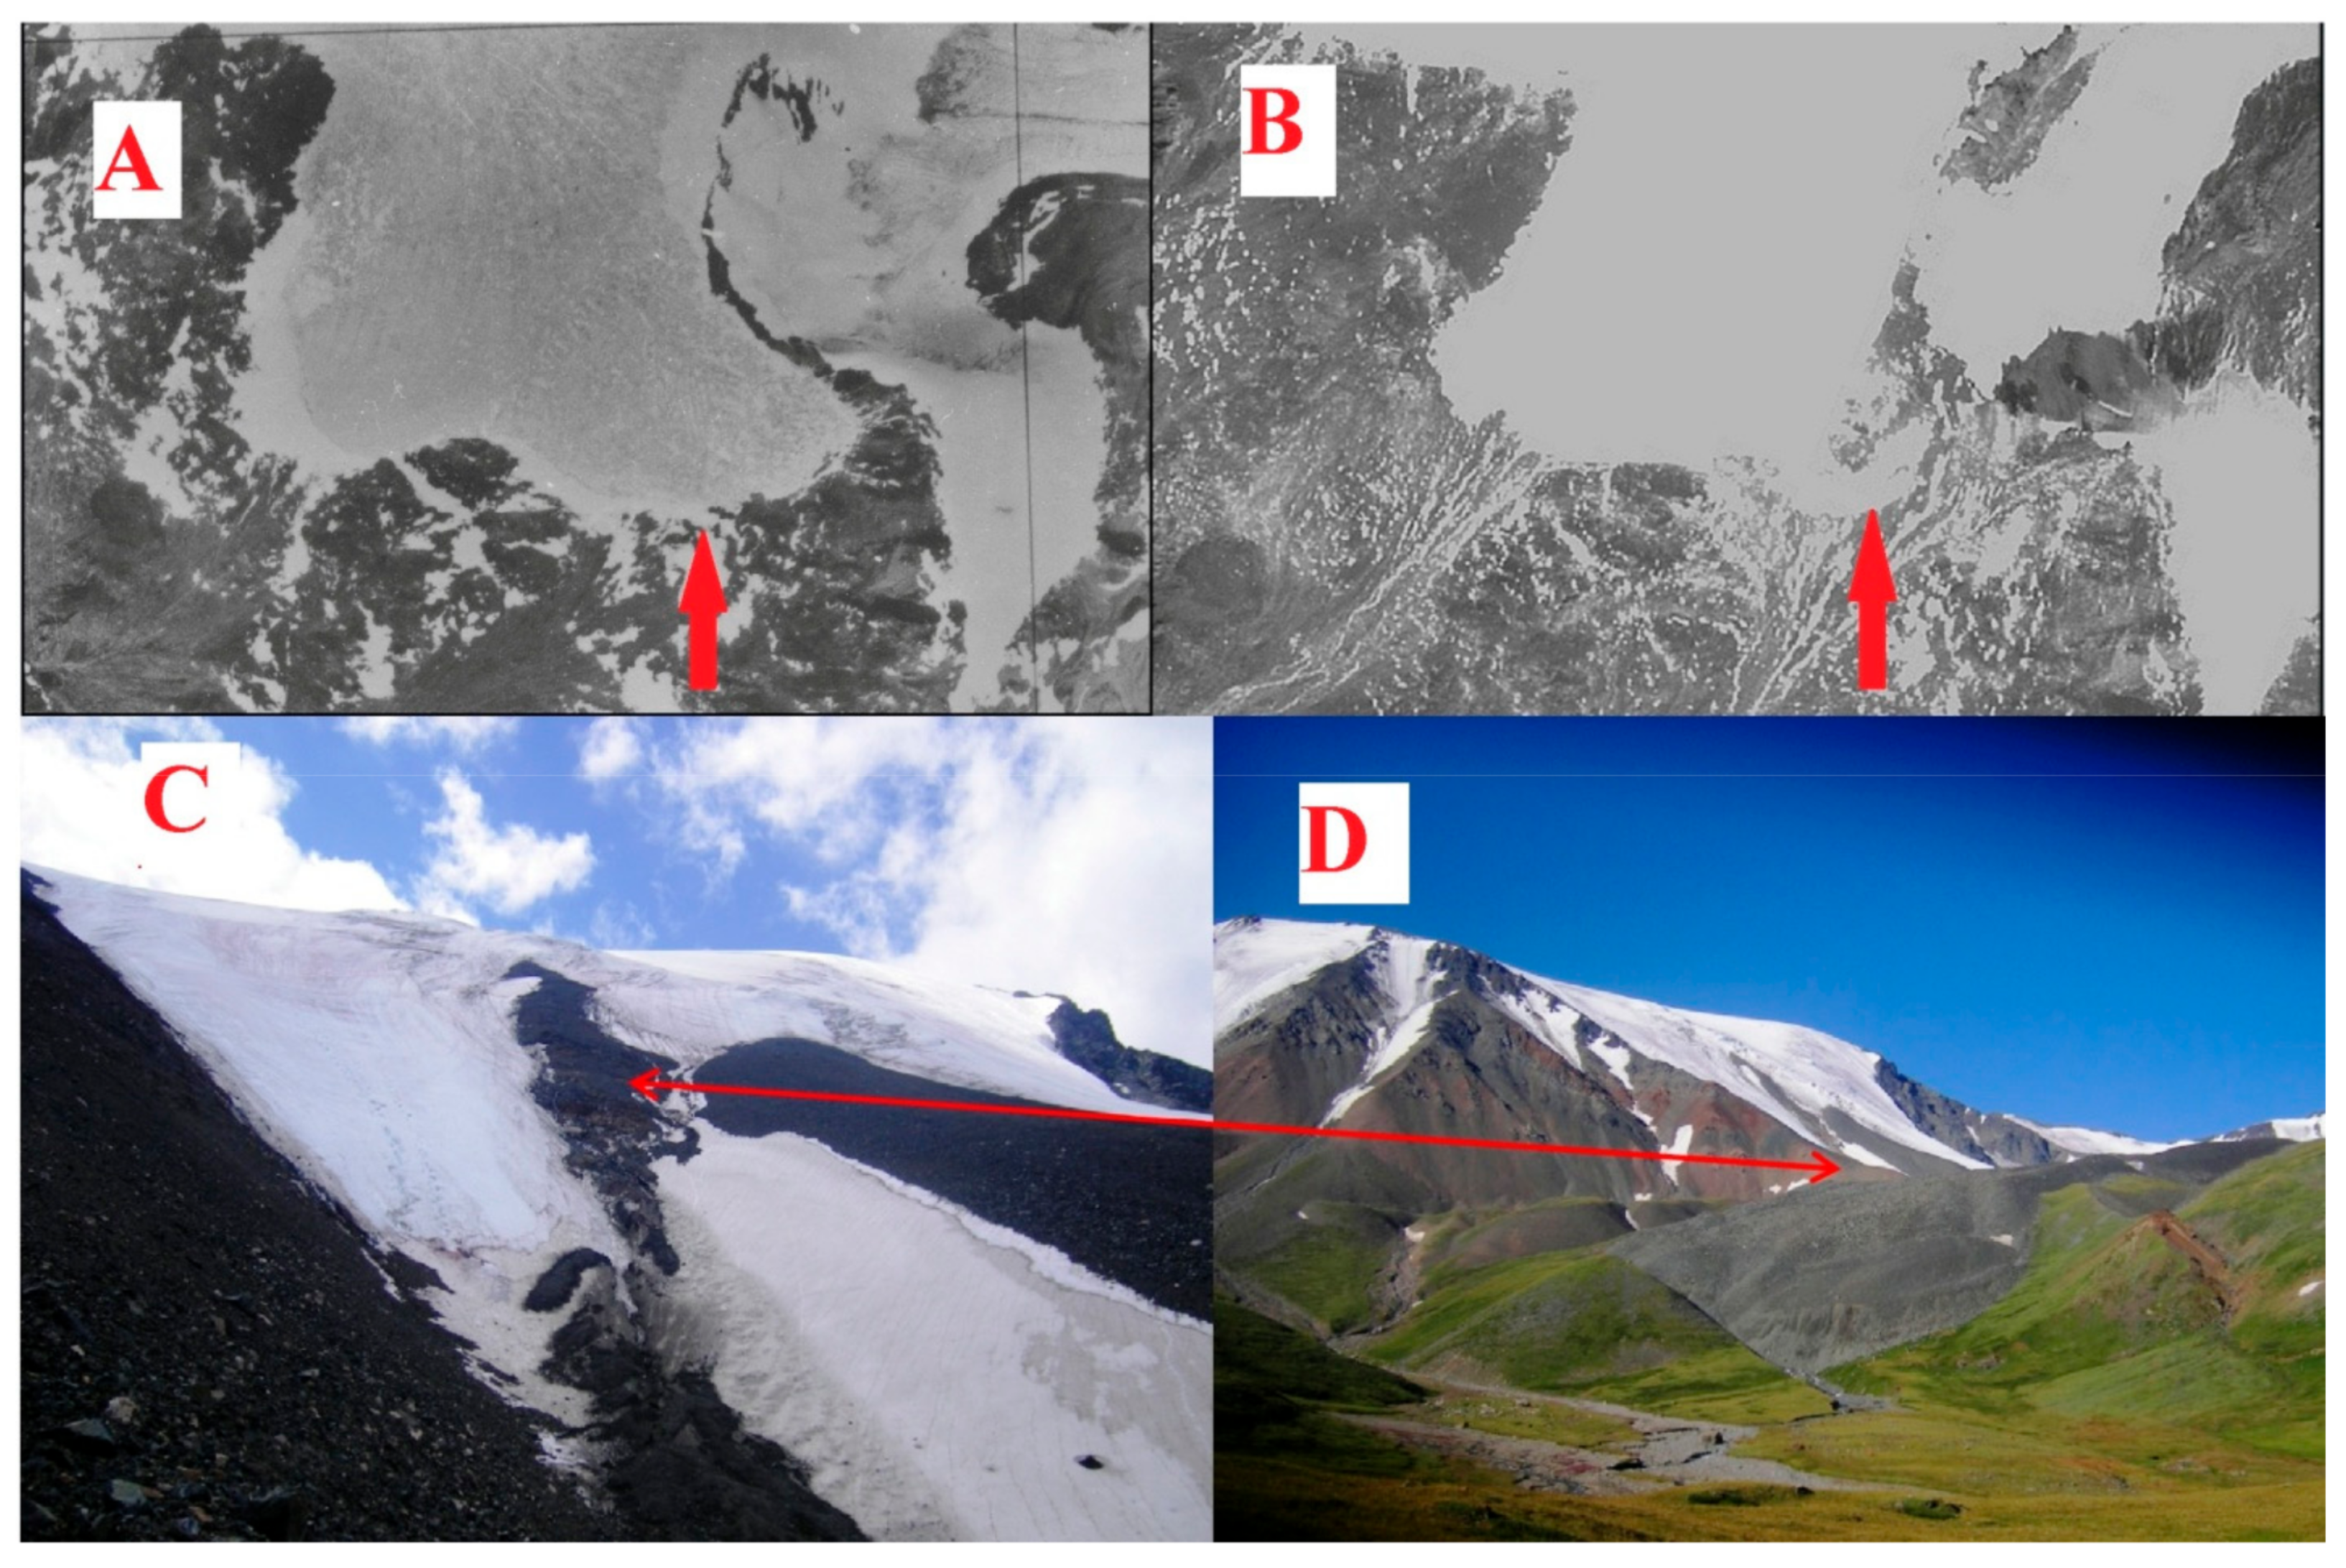
An uneven retreat of flat summit and slope glaciers. Stabilization of the retreating glacial edges occurs in places with increased snow accumulation. Simultaneously, as temperature grows, the upper dome-shaped parts of the glaciers, where snow is blown away, become thinner. Finally, the marginal parts with increased snow accumulation lose connection with the rest of the glacier and transform into snow patches (
Figure 9). In some cases, water streams cut the marginal parts of the glaciers (
Figure 9). This process is reversible: after several snowy years, large snow-patches can rejoin the glacier.
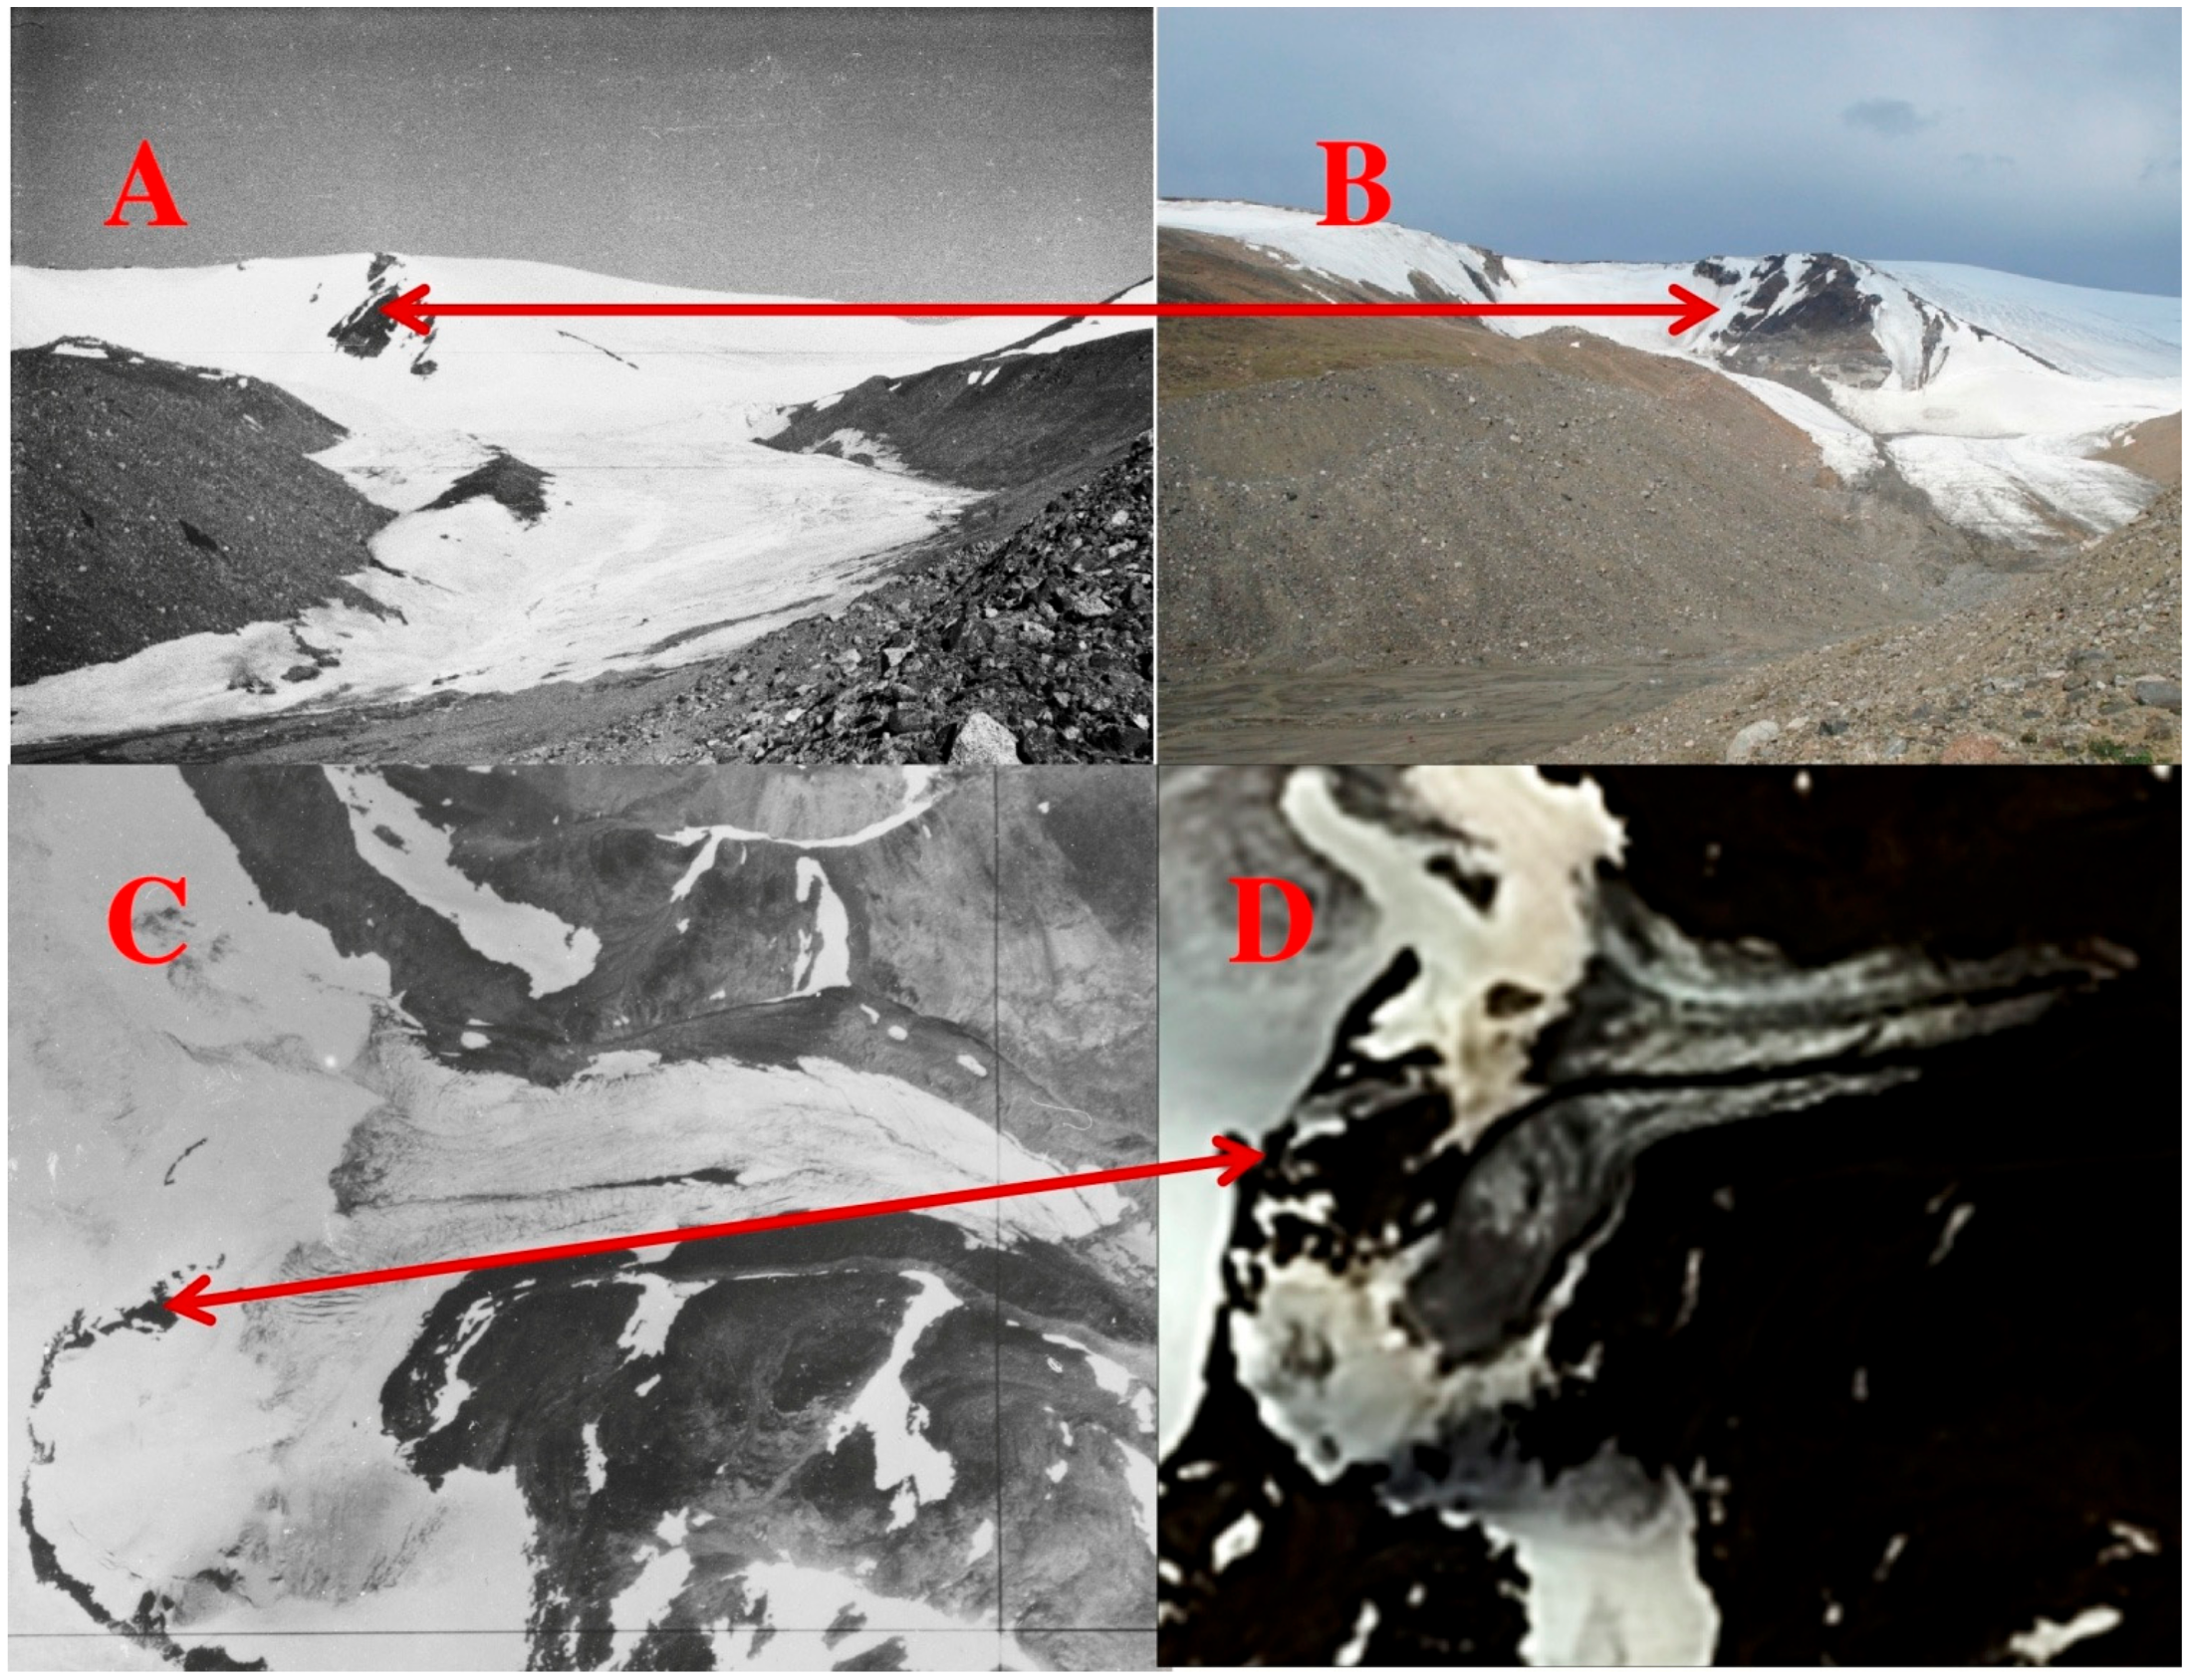
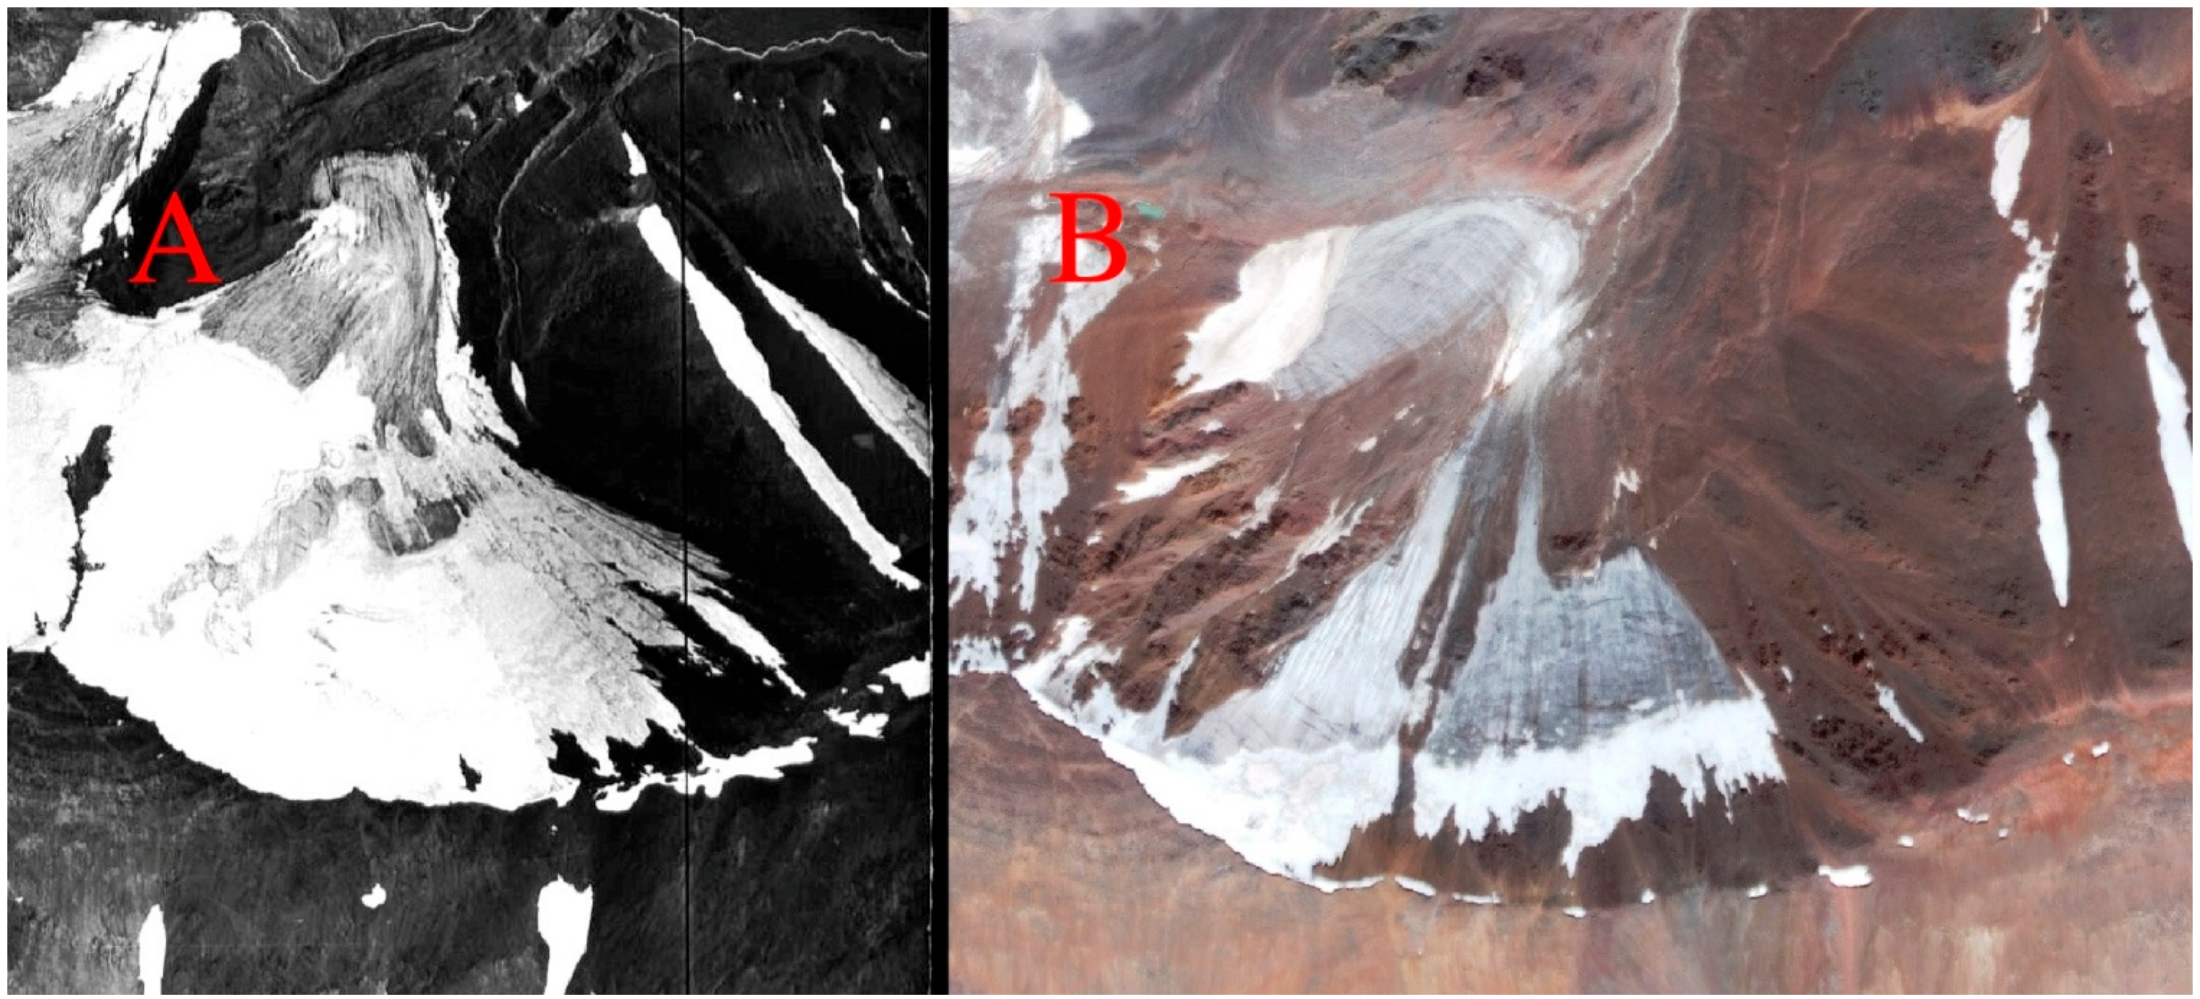
Exposure of the rocky outcrops in the feeding zone due to a decrease in the thickness of the glacier. This process was very active at Mongun-Taiga (
Figure 10) and Tavan Bogd in the period of 1995–2008. Thus, on the northern slope of Tavan-Bogd, approximately 40% of the glacier area reduction for the period of 2002–2009 took place at altitudes of more than 3310 m (within the accumulation zones).
Separation of the snow masses in the avalanche channels, snow cornices, and snowflushes from the accumulation zones of the glaciers. This process is well seen in the upper parts of the large valley glaciers, for example, at the Potanin Glacier, Tavan Bogd (
Figure 11).
Degradation of parts of the accumulation zones of the slope glaciers and transformation of these parts into snow patches (
Figure 12).
Shielding of parts of the glaciers in the accumulation zones by talus cones.
Division of a cirque glacier into a glacier located on the bottom of the cirque, devoid of a feeding zone and several hanging or corrie-hanging glaciers that do not reach the bottom of the cirque (
Figure 13). This occurs when the glacier’s thickness decreases rapidly.
Attachment of preglacial snow patches that survive through the entire ablation season to the glacial termini. This is typical for glaciers with a steep lobe with high snow accumulation in the wind shade under it. This process takes place in the snowiest years and causes lower ablation on the glacial front and some insufficient increase in glacial length. Such events took place, for example, in 2010, 2011, and 2013 at the fronts of Left Mugur and West Mugur glaciers (Mongun-Taiga).
Attachment of preglacial icings to the glacial termini. In the 1992–1993 balance year, at the Mongun-Taiga massif, the East Mugur Glacier became 18 m and the Seliverstova Glacier 17 m longer.
The third group of processes is also specific for the area of research due to its arid climate. In the periods of decreases in precipitation, the processes of debris coverage become more active, and massifs of dead ice form. Glacial ice is preserved by an insulating cover of thick debris, due to low precipitation and a decrease in melting. Debris cover is stable, and the ice core can exist for a very long period. For example, in 2016, our research group found an outcrop of ice overlaid by a peat layer with a
14C age ≥46,770 years and a calibrated age ≥50,240 years (LU-8298) buried by a thick (about 6 m) moraine layer in the Eregtijn-Gol valley (the Tsambagarav ridge). There were also numerous findings of trunks of Larix Sibirica buried inside the ice core of moraine at altitudes more than 600 m higher than the present upper tree line (there are 6 different radiocarbon dating results in the interval 39,300–57,810 years) [
21]. The formation of the buried ice plays an important role in the present dynamics of the glaciers of arid Altai; there are several main patterns of it:
The formation of thick medial moraines with glacial cores, which rise several meters above the open surface of the glacier. As the open part of the glacier melts, they lose contact with the glacier, turning into isolated massifs of buried ice. This process is seen in the Right Mugur (
Figure 14) and East Mugur (
Figure 7) valleys.
Parts of the glacial snouts located on the caved-in sections of the lengthwise profile armored by the debris material coming in from above. As the thickness of the ice decreases, the crossbars on the bulgy parts of the profile are exposed and cut off those debris-covered areas from the main body of the glacier (
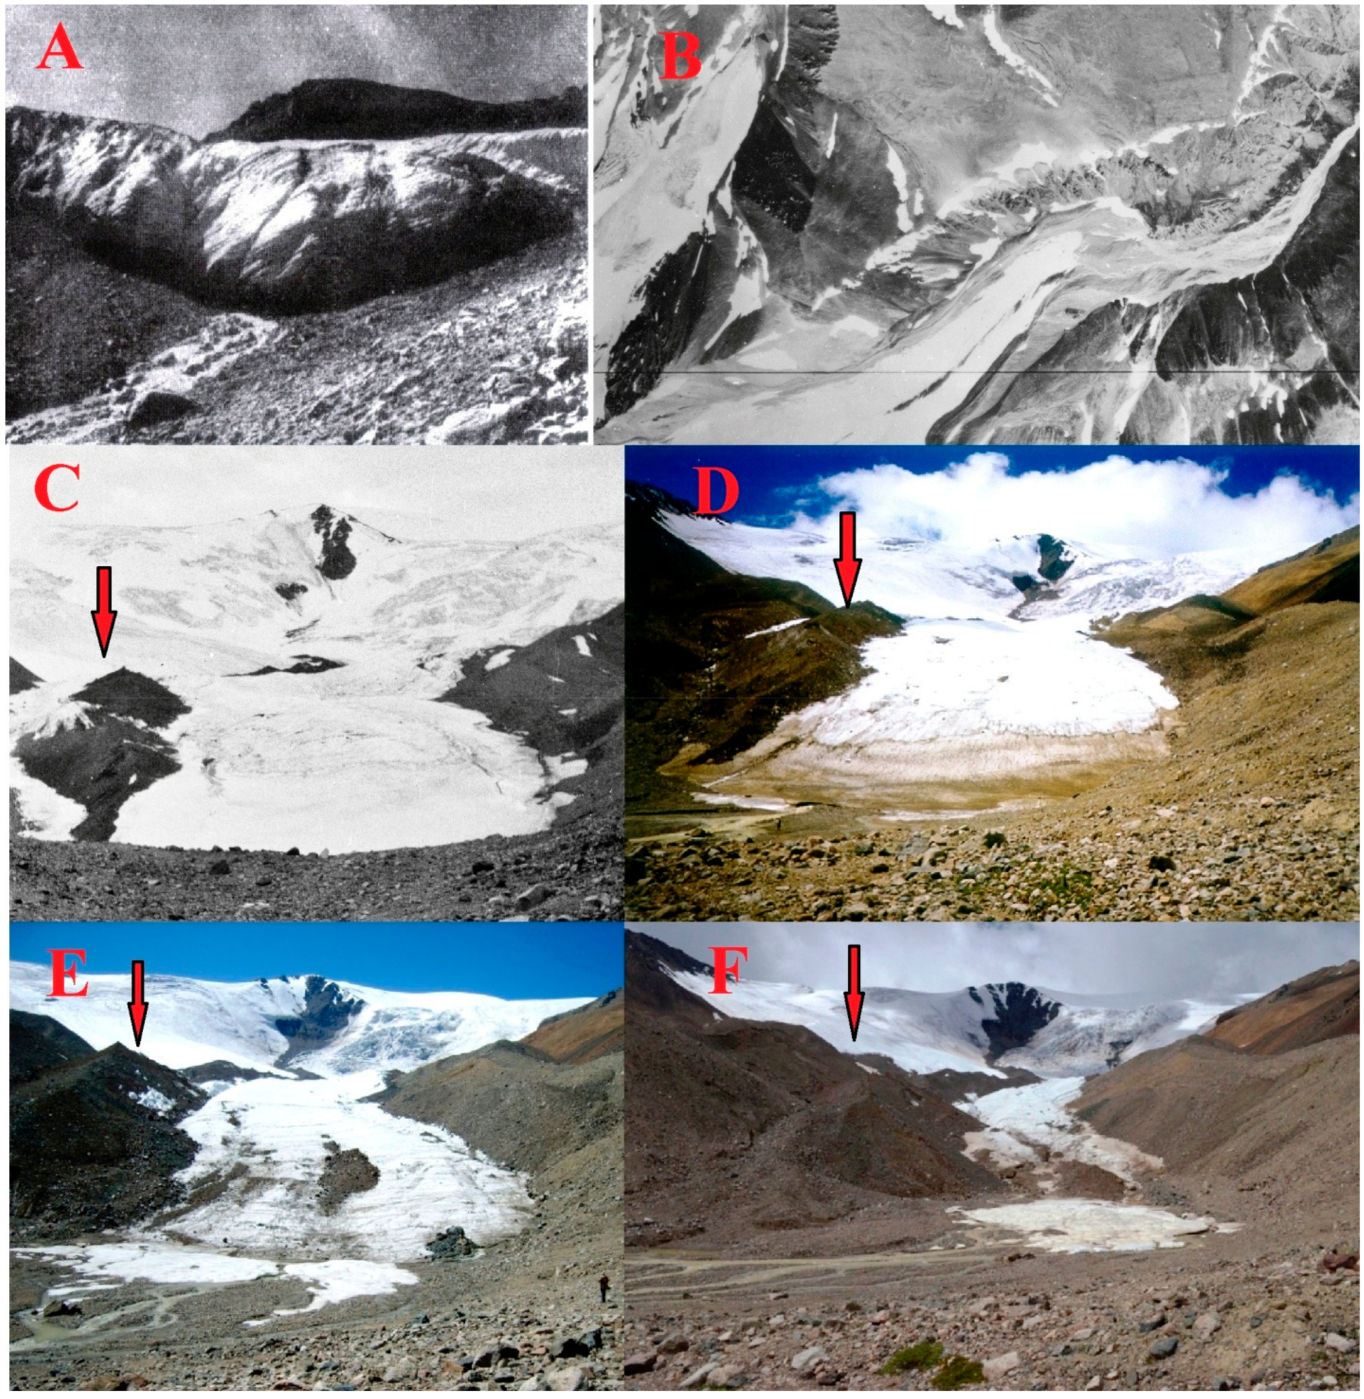
Figure 15). Such a mechanism can sometimes lead to dramatic changes in glaciation. For example, the Left Mugur Glacier in the period of 1999–2011 became 650 m shorter (
Figure 5).
In case of adjacent ice streams separated by a medial moraine, one of the streams becomes debris-covered, merge with the medial moraine with further isolation from the open part of the glacier. This pattern of glacial retreat is often combined with the previous pattern (2).
The marginal parts of the glacier become debris-covered. As the open parts of the glacier become thinner due to melting, the glacial margins melt very slowly and keep their thickness. Subsequently, the debris-covered glacial margin loses connection with the main body of the glacier. Finally, moraine ramparts with ice cores are formed. This mechanism was most typical for the end of the LIA.
Complete debris coverage of the small cirque and niche glaciers due to increased accumulation of debris on their surface on the background of reduced snowiness of slopes (
Figure 5).
Regeneration of the small debris-covered glaciers due to the increase in snow accumulation after 2009 (
Figure 5).
In many cases, the different mechanisms of the glacial dynamics shown above appear on the same glaciers, replacing each other at different stages of their evolution. Together with the abrupt pattern of mass balance changes, this results in the uneven glacial retreat during the period of observations.
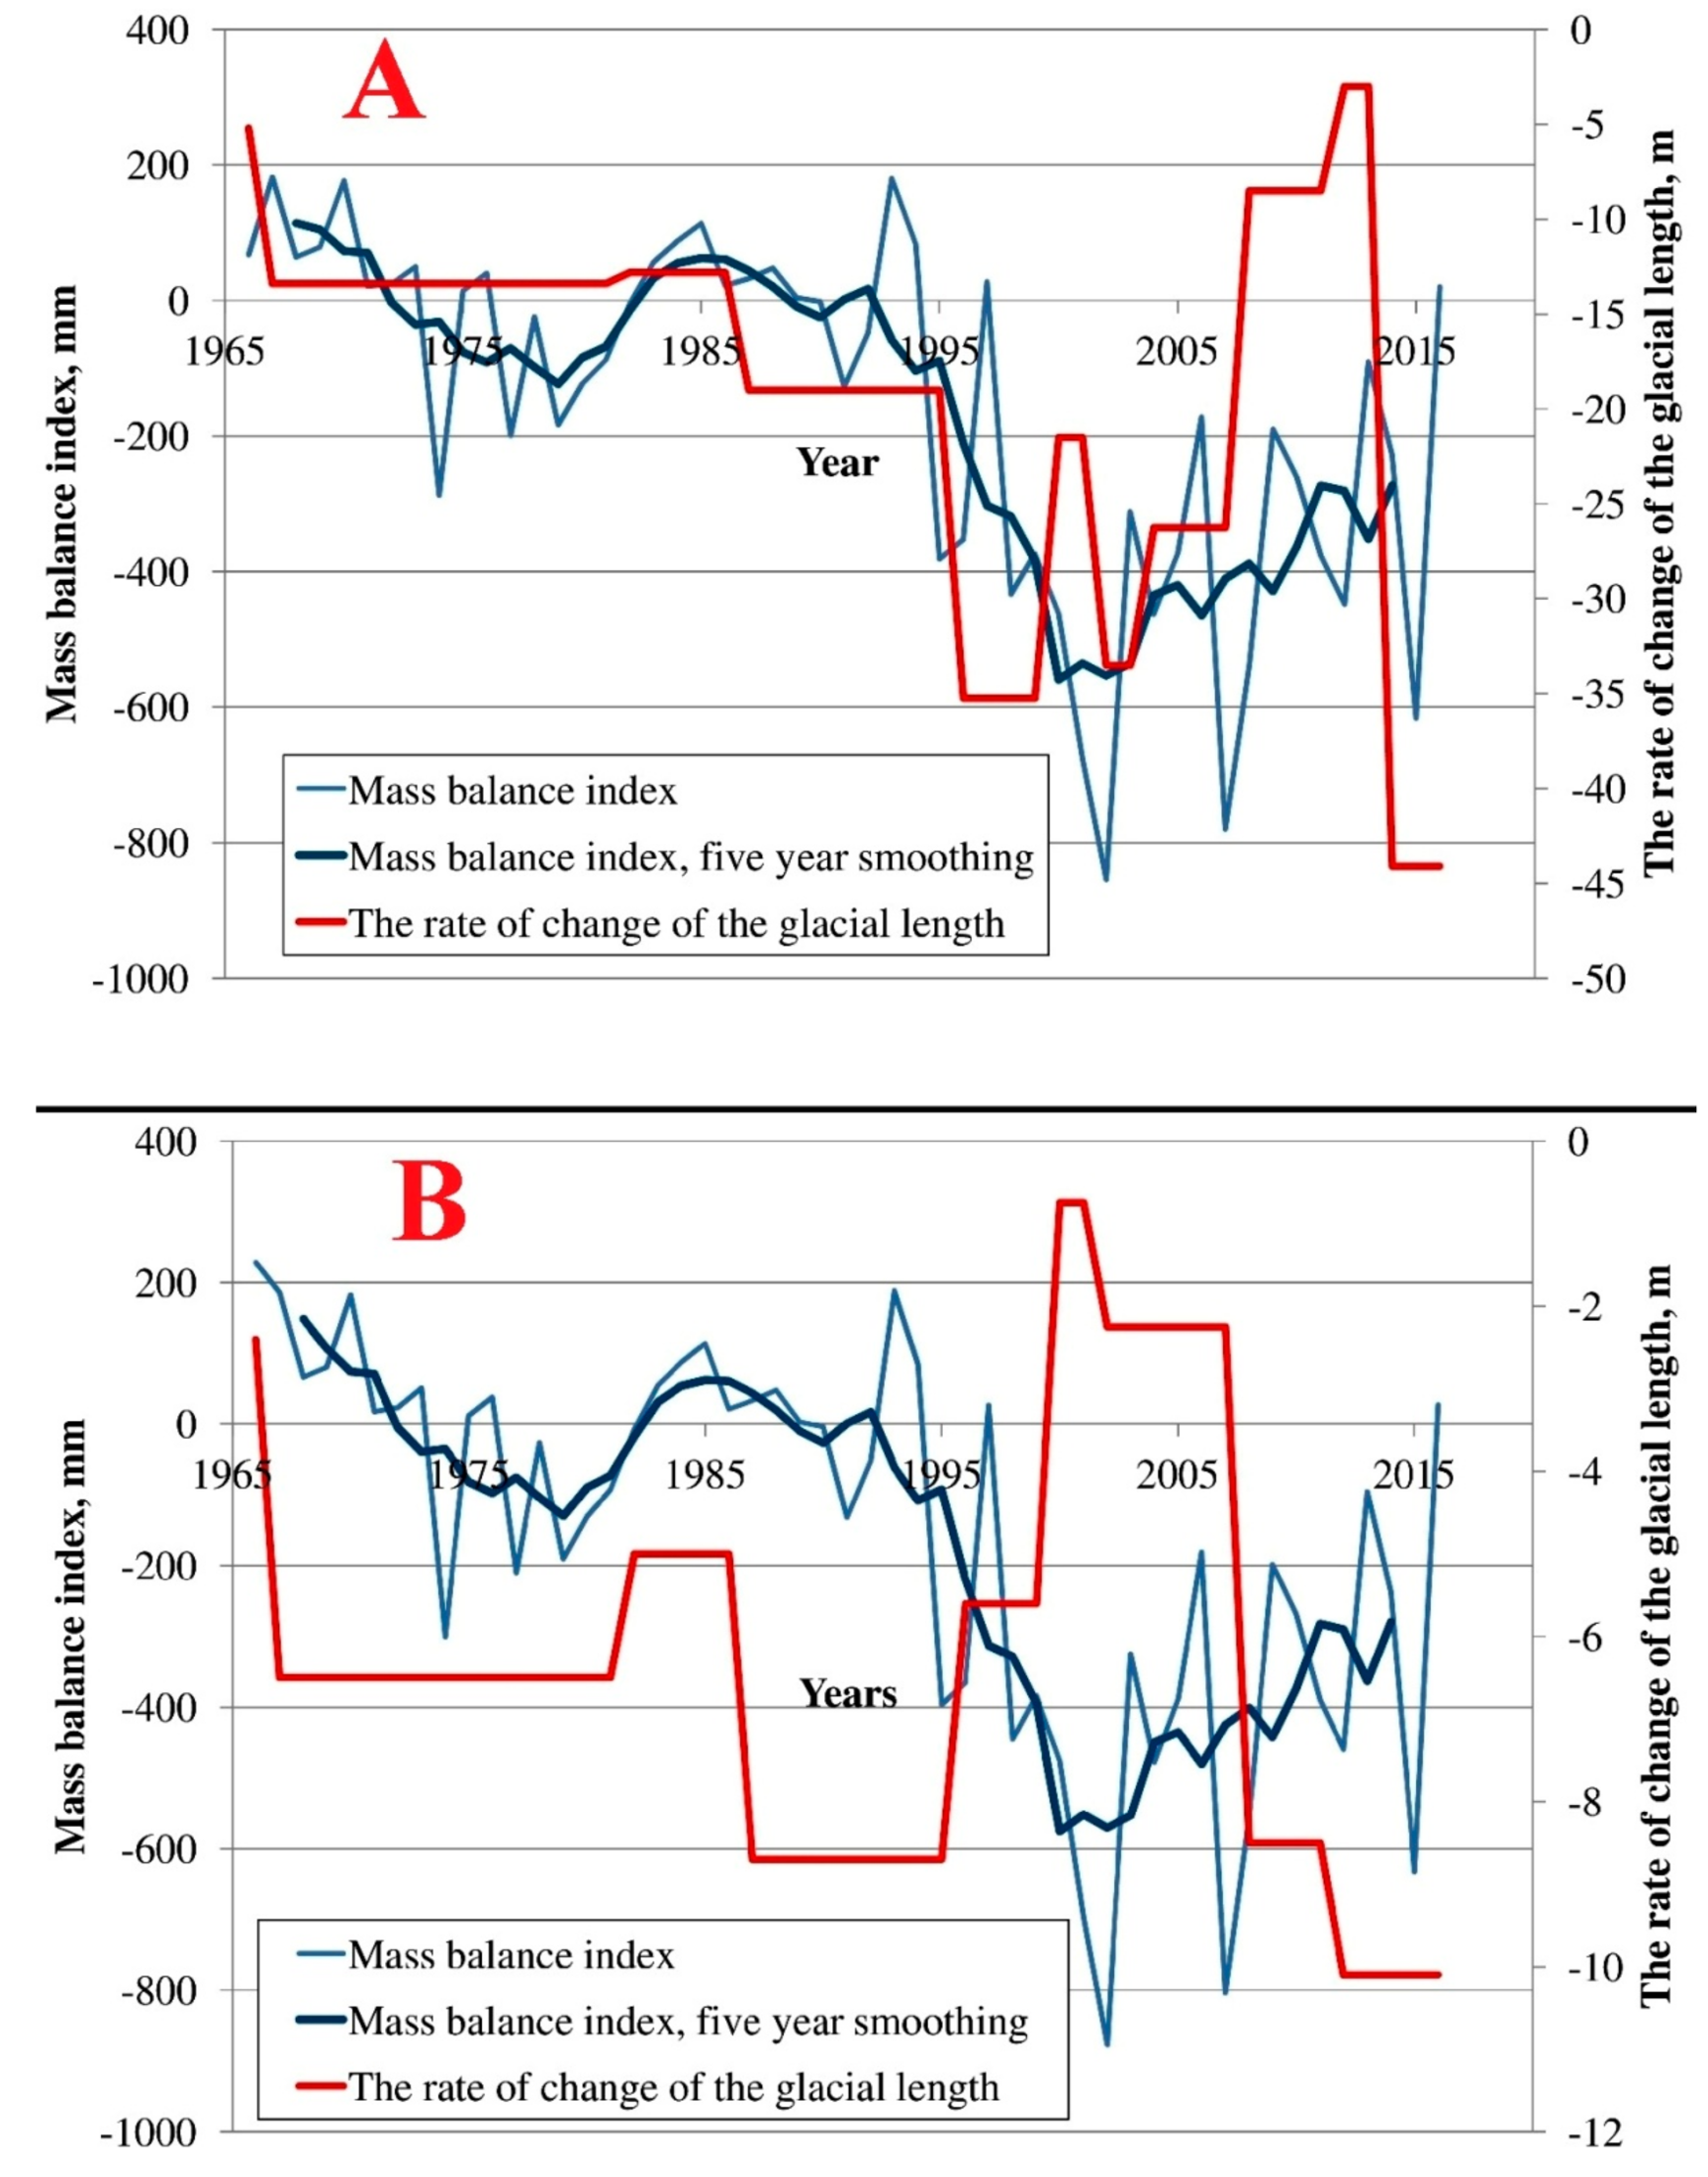
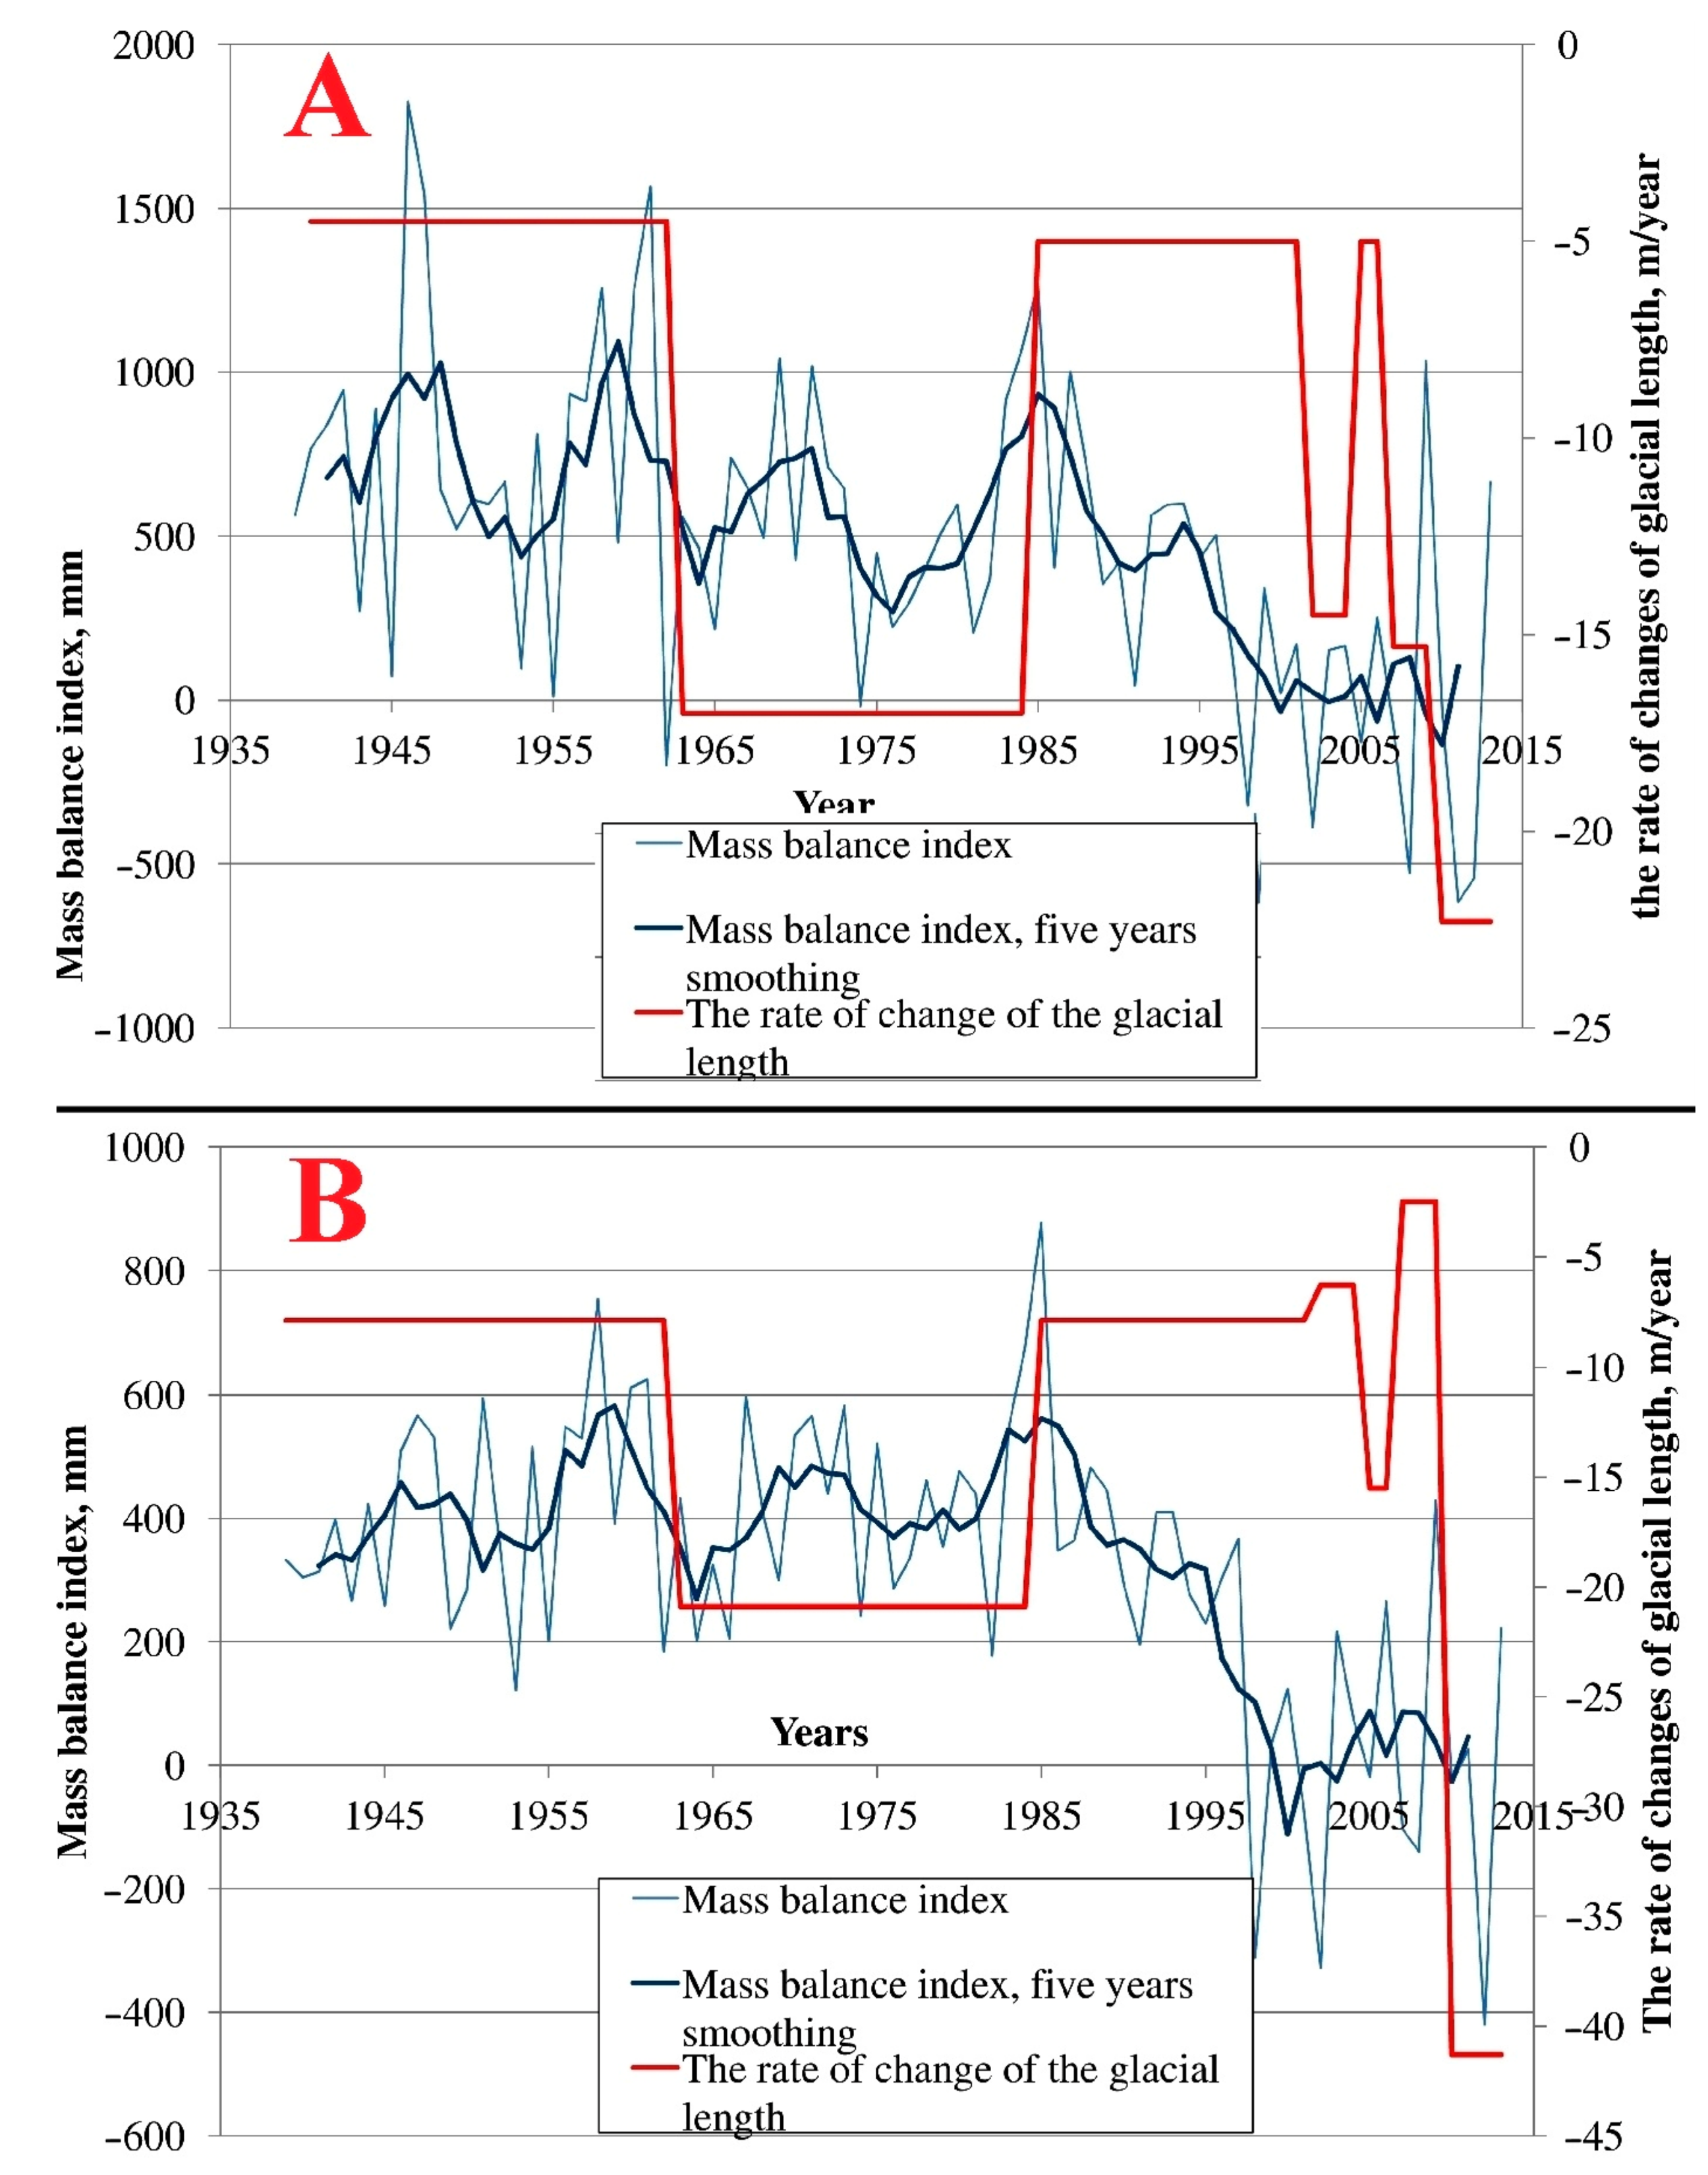
The time of response of the glaciers to the climatic signal. The time of reaction of the glaciers to the climatic fluctuations can be found via a comparison of mass balance data with the rates of retreat of the glacial snout. We do not have continuous multiyear mass balance observations, but it is possible to calculate the mass balance index values on the basis of extrapolation of meteorological stations data. At Mongun-Taiga, such calculations were performed for the two adjacent largest valley glaciers with the longest series of observations—the East Mugur Glacier (area 3.84 km
2, maximal length 3.86, average slope angle 24°) and the Seliverstova Glacier (area 2.78 km
2, maximal length 3.32 km, average slope angle 21°) (
Figure 15). For the Seliverstova Glacier, the high rates of retreat over the 1995–2004 period could be the integral result of the synchronous impact of dry and warm conditions (Phase X,
Figure 4) and the epichronous impact of the dry and warm Phase VII corresponding to the period of low values of the mass balance index in 1974–1981. The abrupt decrease in the rate of retreat of the glacier in 2008–2013 could have been the epichronous impact of Phase VIII, and the short duration of slow glacial retreat in that period could have been caused by the extremely unfavorable climatic conditions during Phase X. Even more abrupt acceleration of the glacial retreat in 2013–2016 must be the epichronous impact of the mass balance deficit in 1995–2002. The last idea seems reasonable also because this acceleration took place in the background of increases in mass balance values. Consequently, the time of epichronous response of the Seliverstova Glacier was about 20 years and tended to decrease from 23 to 18 years due to the fast shortening of the glacier.
Dynamics of the East Mugur Glacier has a similar pattern (
Figure 15B). The periods of high rates of the glacial retreat in 1987–1994 and 2008–2016 correspond to Phases VII and X, and the low rates of retreat in 2000–2007 correspond to Phase VIII. Therefore, the glacier’s probable time of response to the climatic fluctuations is 13–17 years.
A low thickness and low energy of the glaciation (activity index) leads to a low speed of ice flow. According to our observations, in East Mugur, the speed of ice flow is only 2.5–4.5 cm/day (in the ablation season) [
64], which means that, in a period of 17 years, the ice does not move more than 150–280 m. This distance from the front of the glacier matches the parts of the glacial snout that are more sensitive to the fluctuations in temperature and solar radiation than the ice near the glacial fronts, which is debris-covered. For the Seliverstova Glacier, no observations of ice flow speed have been made, but a lower average angle of the glacial surface slope indicates an even lower speed of ice flow, which is why the intervals of reaction of the glacial front here are longer than that of the East Mugur Glacier.
Fluctuations of the two largest glaciers of the northern slope of the Tavan Bogd mountain massif (Argamgi-3 Glacier, area 3.32 km
2, maximal length 3.16 km; Argamgi-2 Glacier area 4.77 km
2, maximal length 3.16 km) are similar in their pattern to those of the Mongun-Taiga massif: periods of the low rates of retreat were followed by an abrupt retreat in the last several years (
Figure 16). This very fast retreat after 2006 and 2009 must be the response to Phase X. Consequently, the time of such response is about 11–14 years. A shorter time of response compared to the glaciers of the Mongun-Taiga massif might be caused by a higher energy of glaciation and thus by a higher speed of the ice flow.
6. Discussion
Comparison of our information about different glacial centers with the results of other authors showed a sufficient difference caused by the different materials used: topographic maps, as well as aerial and satellite images [
21]. Generally, the use of high-resolution satellite imagery together with in-situ observation resulted in a higher detalization of our inventories and maps, and as a result a larger number of delineated glaciers (the minimal area of a glacier to be mapped was 0.01 km
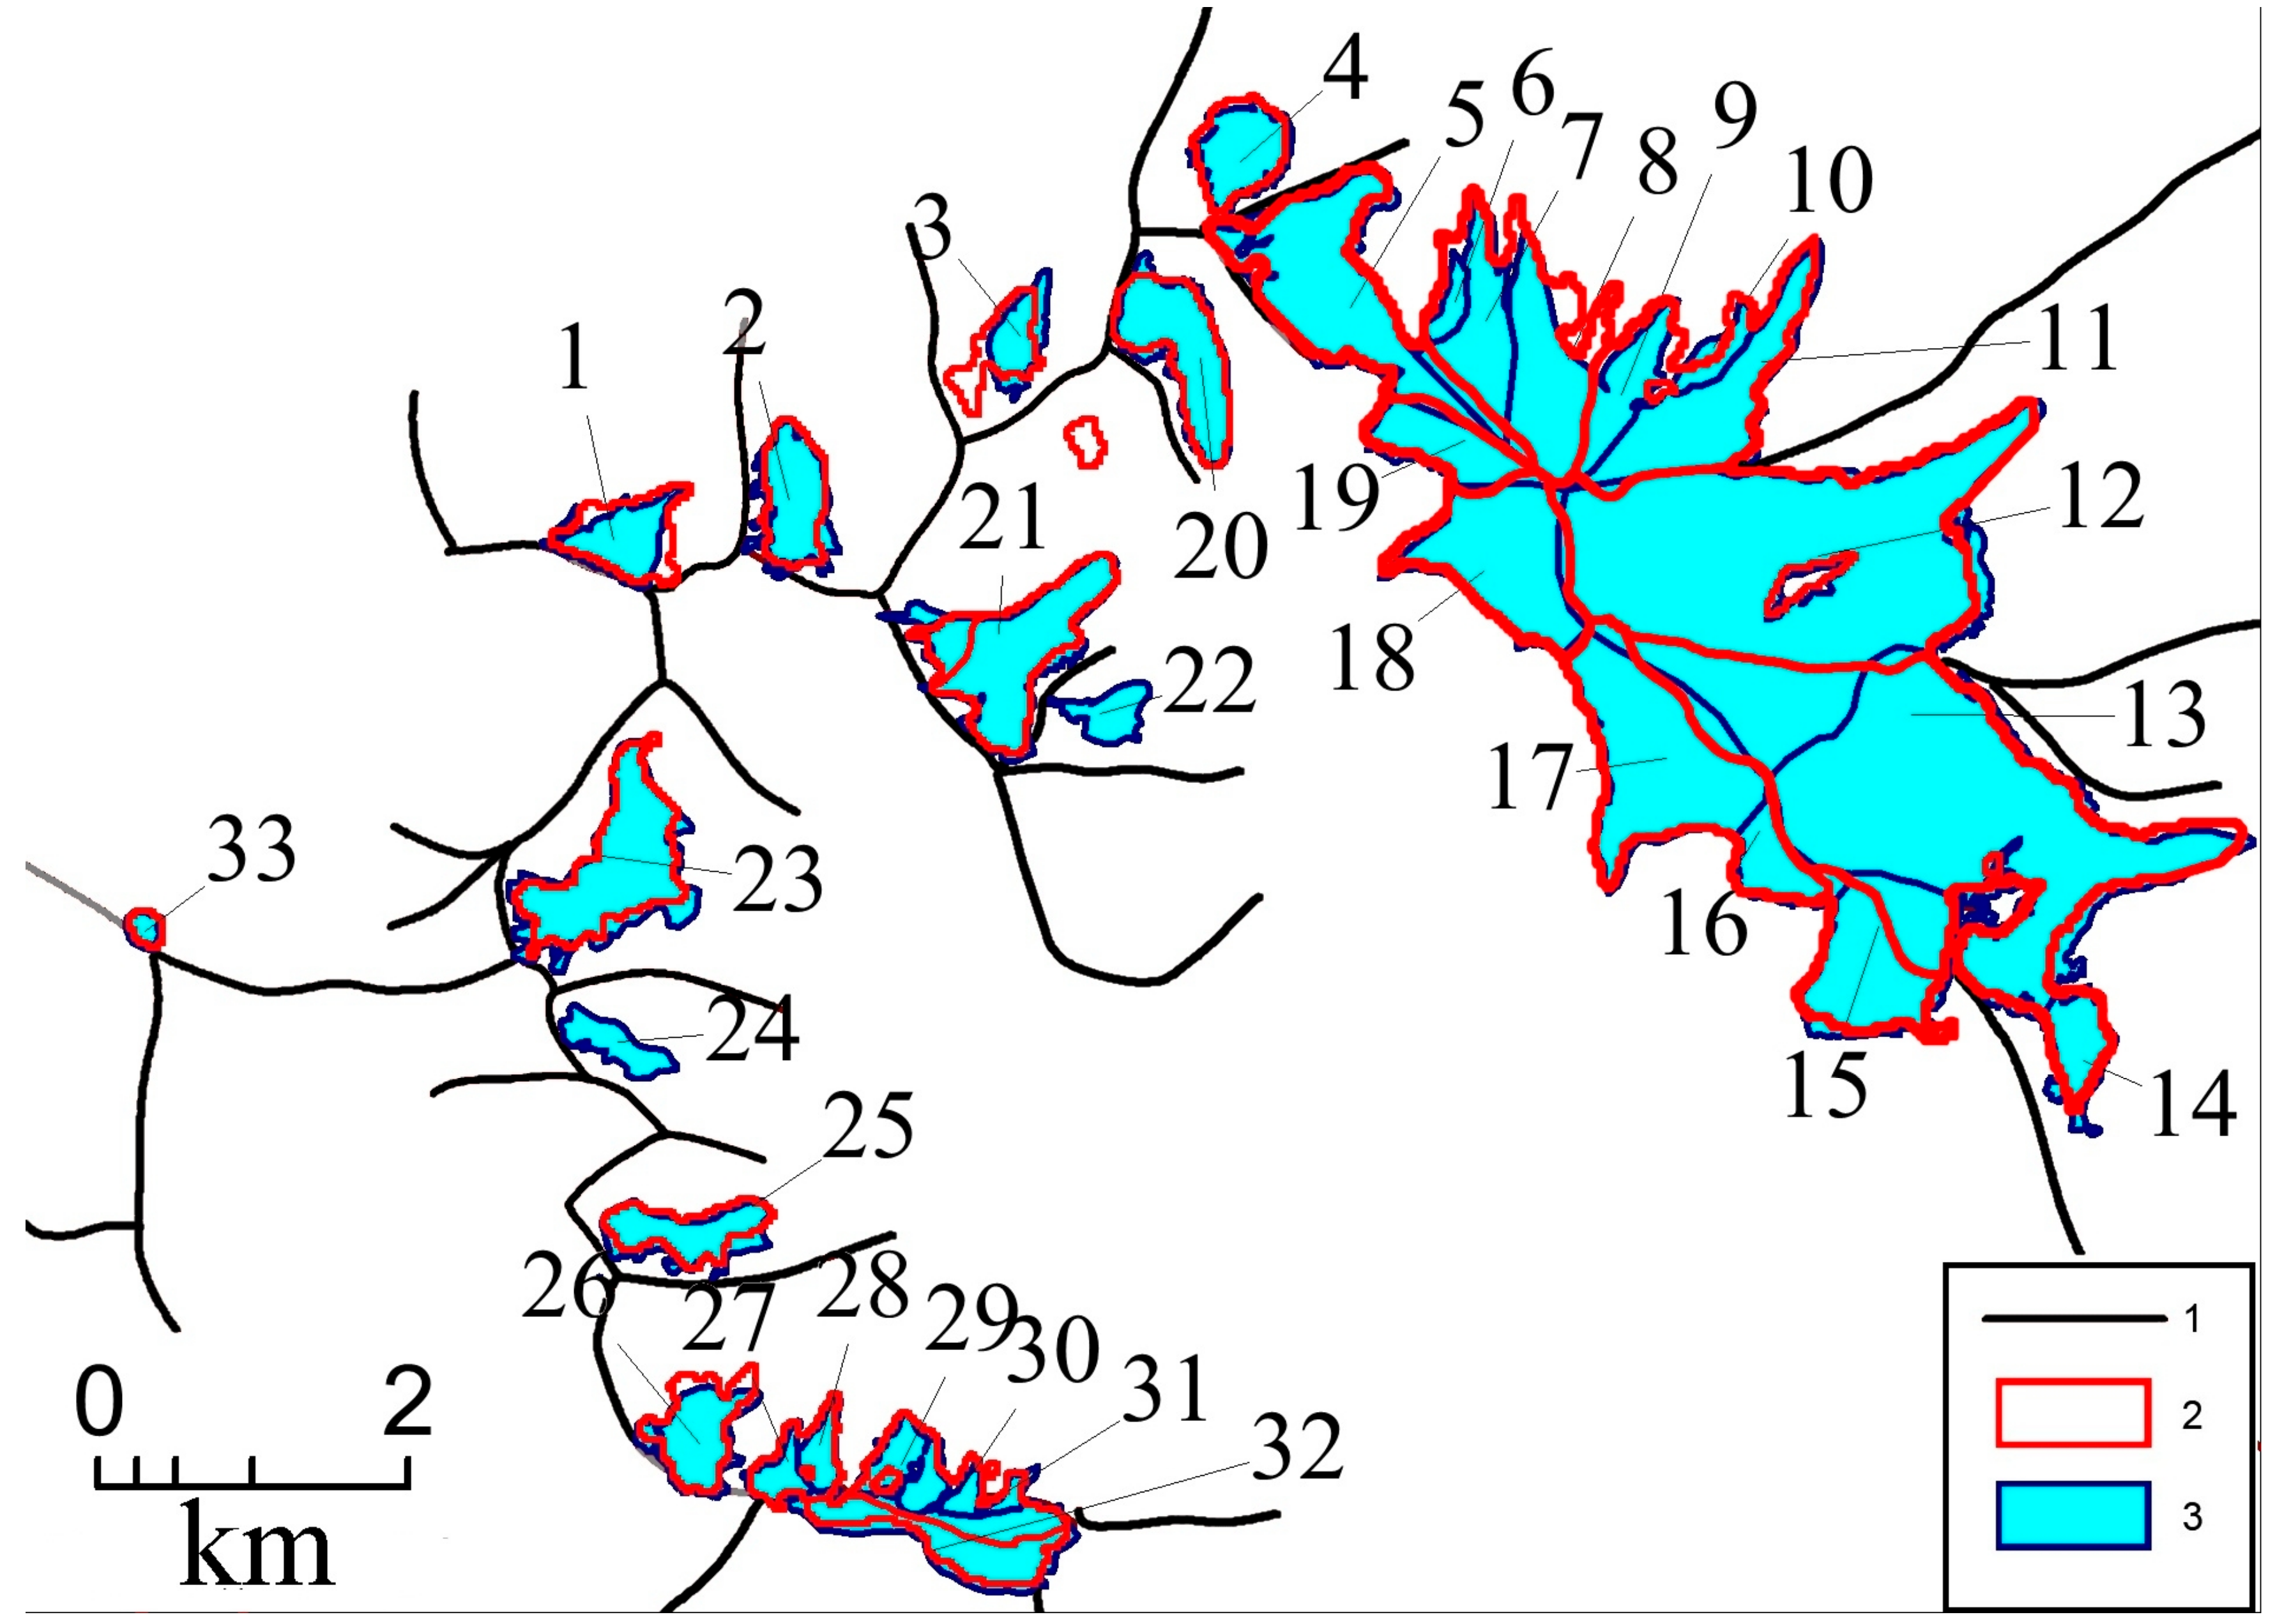
2). In the present article, we update and correct information about the glaciation of Mongun-Taiga, Saylugem, and the northern slope of Tavan Bogd and provide new information about the glaciers of the Shapshalsky and Tsagan-Shibetu ridges. Comparison of the satellite-derived information about the glaciers of the area of research included in the Randolph Glacier Inventory Version 5.0 (RGI 5.0) and the GLIMS database with our data shows offsets in glacial contours, but the difference between the total areas of the glacial centers generally do not exceed 5%. This can be seen through the example of the Mongun-Taiga massif (
Figure 17).
Larger number of the glaciers in our Mongun-Taiga glaciation database compared with the GLIMS database is mainly the result of a more detailed separation of different glacial streams and snouts (for example, Glaciers No. 9, 10, and 11, which correspond to one glacier in the GLIMS database (G090133E50291N) (
Table 6). At the same time, two small glaciers are missing in the GLIMS database (No. 22 and No. 24), one small glacier from the GLIMS database (G090075E50291N) is missing in our scheme (field observations of this area provide evidence that this glacier completely disappeared). The largest difference in the estimation of glacial areas occurred for Glaciers No. 12 (East Mugur) and No. 13 (Seliverstova). It is mostly caused by the different delineation of ice divides, which is why the difference values (0.73 and −0.72) compensate each other.
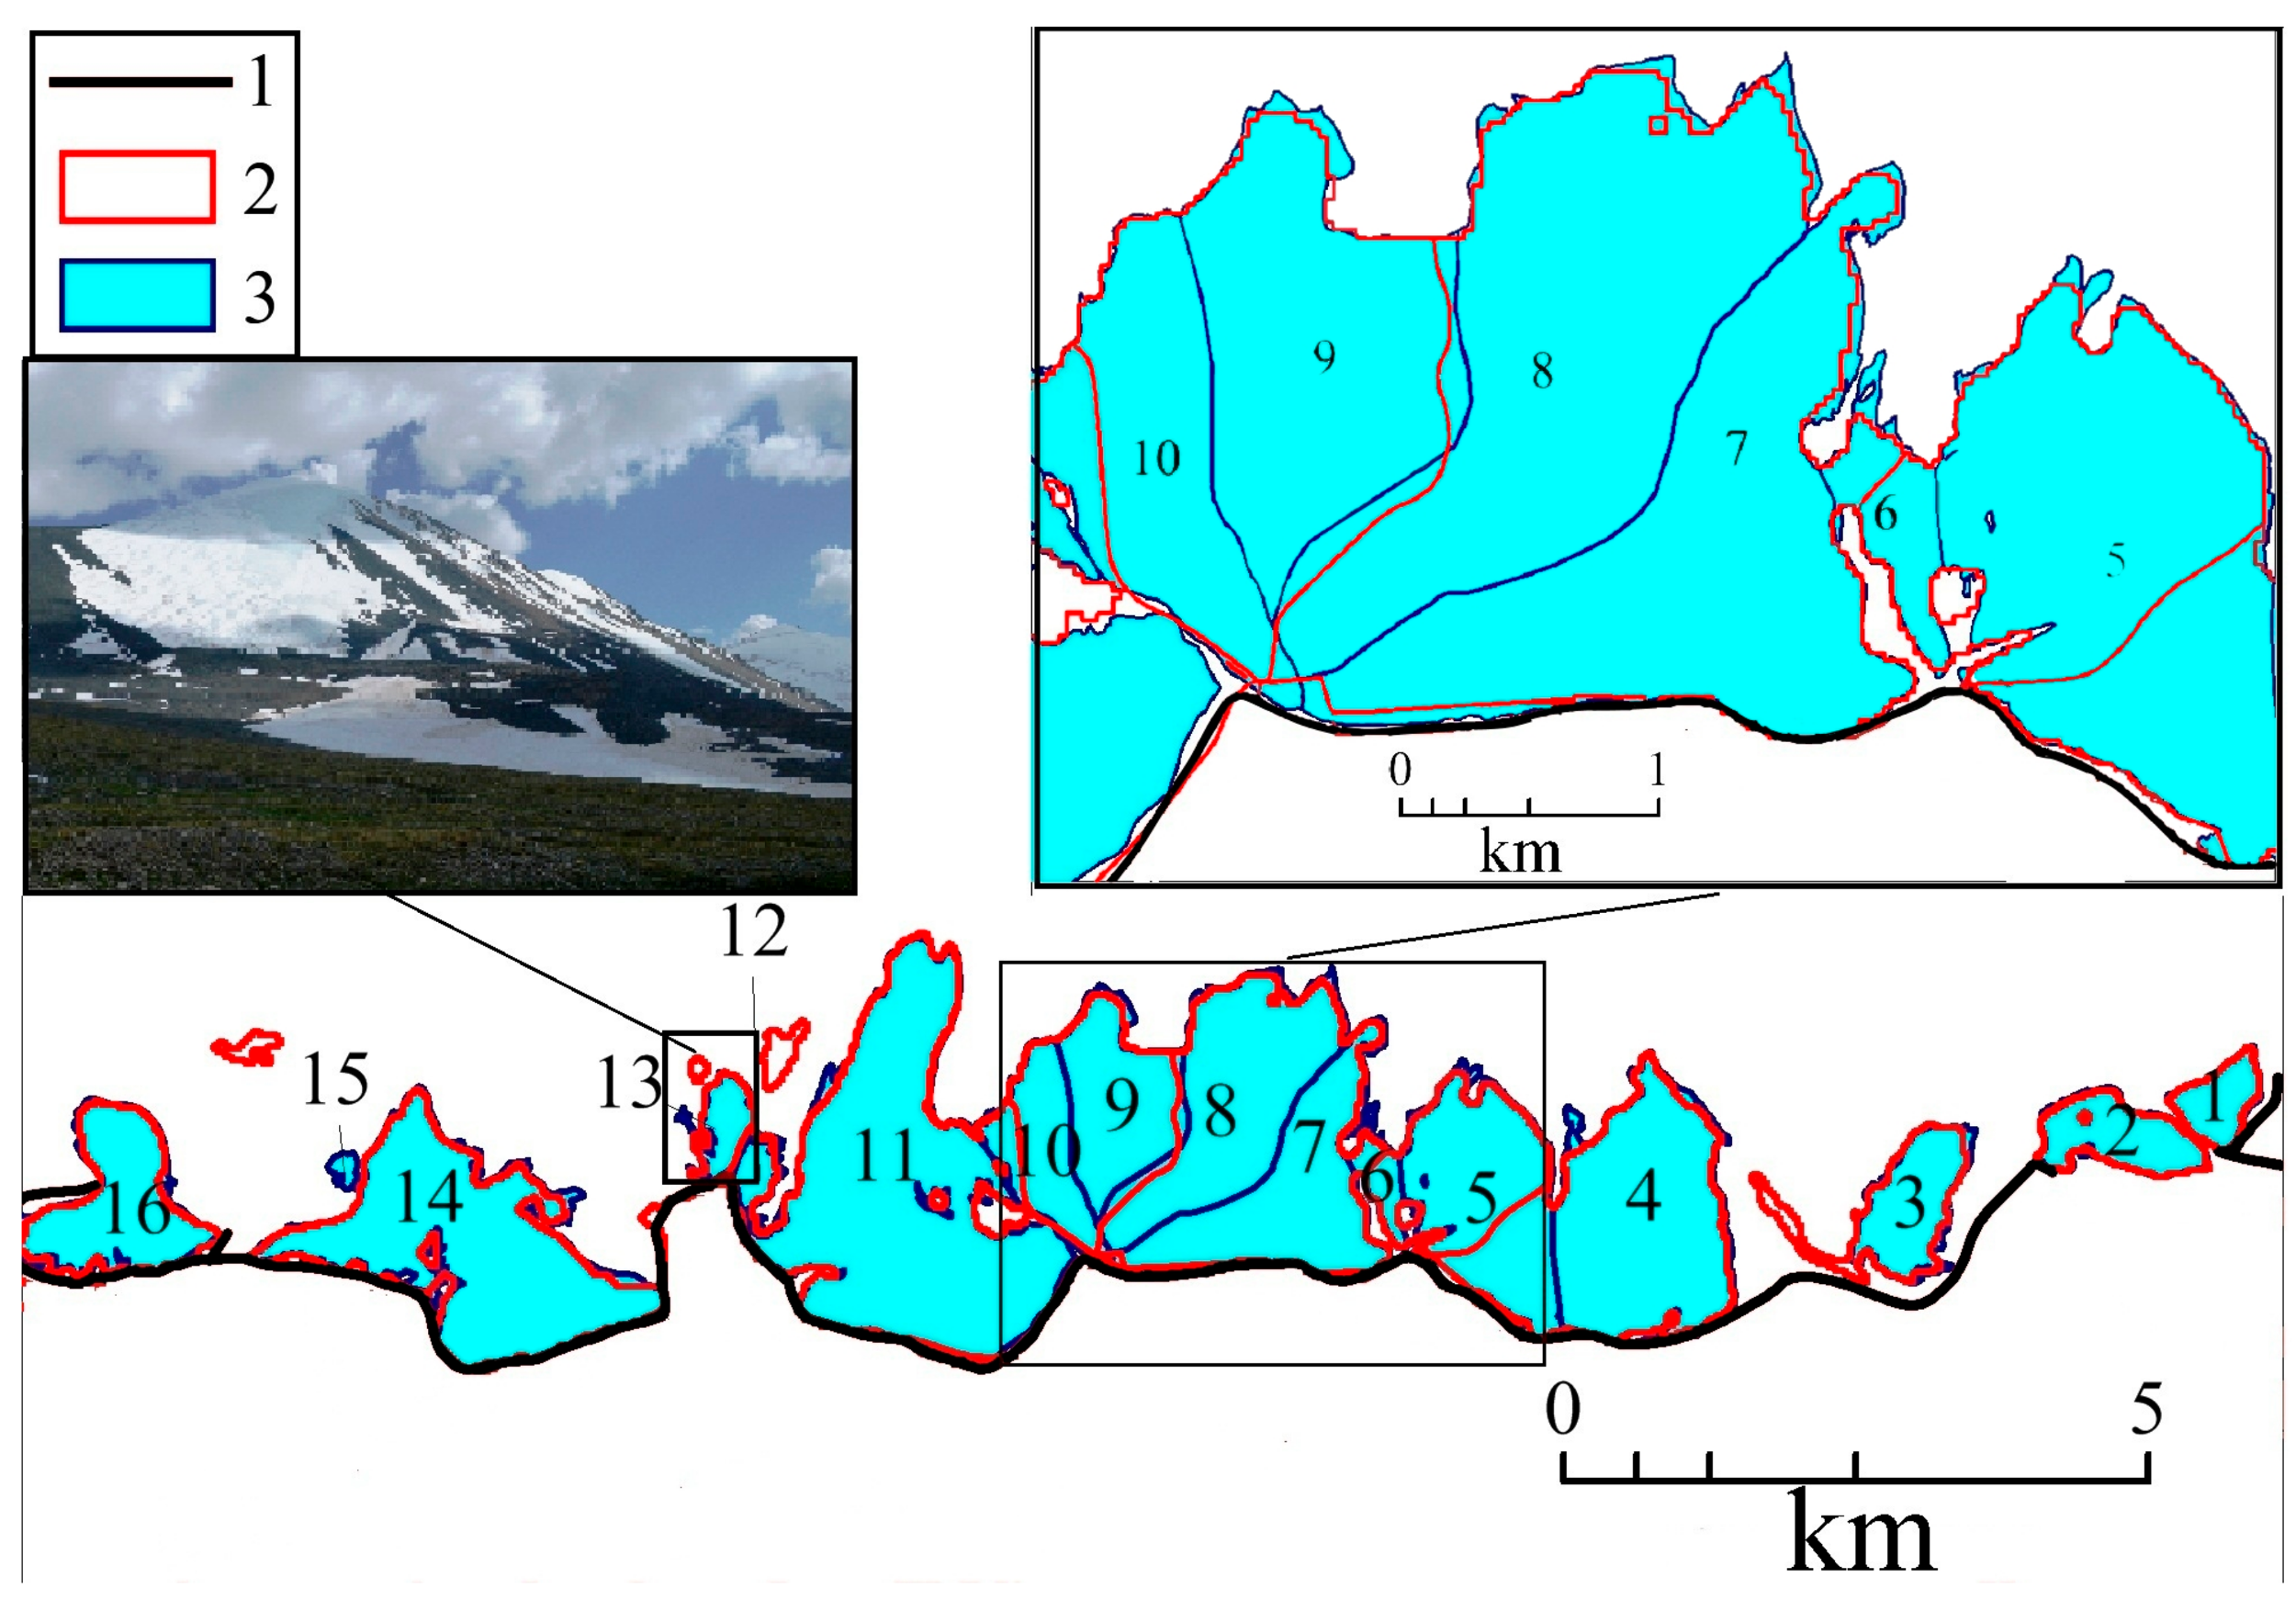
Comparison of the RGI 5.0/GLIMS results with our data for the northern slope of the Tavan Bogd massif yields similar results with even less difference of areas (0.05 km
2) (
Table 7). The differences in estimation of the glacial area are divided into three groups:
Different delineation of ice divides (
Figure 18, inset);
Underestimation of the glacial area in the GLIMS database due to debris-covered parts of the glacial snouts (Glaciers No. 5, 8, and 9), and the absence of a small, partly debris-covered glacier (No. 15).
Perennial snow patches delineated as glaciers in the GLIMS database (
Table 7 G087726E49194N, G087787E49193N, G087778E49192N,
Figure 8, photo).
Generally, the differences between the GLIMS and our schemes of glaciation are caused by the difference in materials used: we based our field observations, including the latest expeditions of 2013 and 2016 (Mongun-Taiga) and 2015 (Tavan Bogd), on an interpretation of SPOT 5 satellite imagery (2011 and 2014 for Mongun-Taiga; 2010 for Tavan Bogd) with a resolution of 2.5 to 5 m in panchromatic mode and 10 m in multispectral mode. Geoeye-1 (2010) imagery of Tavan Bogd with a spatial resolution 1.65 m in multispectral mode played a supplementary role. The RGI 5.0/GLIMS data are based on Landsat 5, 7, and 8 imagery with a 30 m spatial resolution.
There is very little information about the rates of retreat of the glaciers in the area of research. According to [
35], from 1989 to 2009, the total area of glacier ice at the Tavan Bogd massif decreased from 213 to 204 km
2, i.e., by 4.2%, over the 20 years [
35]. This is much slower than our results for the northern slope of Tavan Bogd (7.1% for the 2001–2009 period). At the same time, the estimations of the area decreases of Glaciers TB-002 (matching Glaciers No. 6–11 in our scheme) and TB-012 (Glaciers No. 4 and 5) from 1989 to 2009 yielded higher values: 6.2% and 10.9%, respectively. The higher rates of decrease of the glaciers of the northern slope of Tavan Bogd in comparison with the total decrease of glaciation of the whole massif can be caused by a shorter time response to the warming of Phase X for the smaller and thinner glaciers (due to the prevailing slope morphological type) of the northern slope.
In the Turgen massif, according to [
33], the average rates of retreat of the West Turgen Glacier were 6.7 m∙year
−1 between 1910 and 1970, 3.9 m∙year
−1between 1970 and 1992, and 6.1 m∙year
−1 between 1992 and 2010. Such rates of retreat are rather low compared with our data, but those are the average rates of long time periods; in shorter intervals, there are faster retreats and stabilizations. The Potanin and Alexandra Glaciers at Tavan Bogd saw oscillations and even slight advances in the 1930s, the 1960s, and the late 1980s; in 1987–2001, the Potanin Glacier retreated with an average rate of 43 m∙year
−1 [
38]. The satellite-based study by Krumwiede et al. [
35] indicates that between 1989 and 2009, the Potanin Glacier receded by 516 m, a mean rate of 25.8 m∙year
−1, and by 5.1% of its total length. Over the same period, the adjacent Alexandra Glacier receded by 653 m, a mean rate of 32.7 m∙year
−1, and by 7.7% of its total length. According to the results of field observations [
65], the Potanin Glacier retreated 90 m between September 2003 and September 2009, a mean retreat rate of 15 m∙year
−1. Therefore, we should agree with the suggestion that early 21st century retreat at the Potanin Glacier may be decelerating [
35]. At the same time, faster retreat might have occurred after 2009 (compared with other valley glaciers of the region (Table 5)).
Mass balance observations in the area of research were held at the Potanin Glacier in 2005, 2008, and 2009 [
44]. Glacier-wide surface mass balance was estimated at −0.97, −1.23, and −0.17 m w.e., respectively. We do not have mass balance observations for those particular years, but the results of mass balance index calculations are as follows: −0.44, −0.40, and −0.44 m w.e. for the East Mugur Glacier, −0.37, −0.54, and −0.19 m w.e. for Seliverstova Glacier, respectively. Less negative values for the glaciers of the Mongun-Taiga massif can be caused by lower ablation due to smaller ablation because of the comparatively small and more shaded glacial snouts. Mass balance values of the Seliverstova Glacier having a larger snout and are close to those of the Potanin Glacier. Generally, lower ablation for the glaciers of the Mongun-Taiga massif is confirmed by observation-based estimations of the total ablation on the firn line altitiude of the Seliverstova Glacier (0.39 mm w.e. for the ablation period of 2013).
Glacial dynamics for the last 50–70 years is better known in the adjacent areas of the Russian Altai. For the North Chuya and the South Chuya ridges, the estimation of changes in extent of 126 glaciers, with individual areas no less than 0.5 km
2 in 1952, revealed a 19.7 ± 5.8% reduction by 2004 [
39]. These results are in good accordance with some of our estimations (an 18% decrease in the glaciers of the northern slope of Tavan Bogd in 1962–2001,
Table 4).
Decrease of the glaciers of the Russian Altai after the 1960s was uneven. In the Katun’-Chuya glacial center after the last advance of the LIA, there was a general retreat with periods of oscillations in 1911–1914 and 1927–1930 [
66]. Nikitin and Narozhnyj noted that oscillations took place in 1979–1980, 1987–1988, and 1993 [
67]. On the background of a general retreat, the Right Aktru Glacier stabilized or even advanced in 1936, 1940, 1969, and 1993, the Malyi Aktru Glacierin in 1911, 1936, 1960, 1979, and 1993 [
68]. There is some accordance between those years of glacial oscillations and our data, for example in 1993, when there was some increase in the glacial length of the East Mugur and Seliverstova glaciers. Generally, in the area of our research, glaciers tended to retreat faster, and it is likely that stabilizations were rarer.
The climatic difference between the humid Central Russian Altai and the arid Altai leads to differences in glacial mass balance and dynamics; however, our comparison shows similar features of mass balance changes for the long term, reflecting the general warming trend. Direct mass balance observations began in 1961 for the Malyi Aktru Glacier and in 1976 for the Left Aktru Glacier. For the Malyi Aktru Glacier, the cumulative mass balance for the 1961–2001 period was about −3 m w.e. with an average annual mass balance of −78.5 mm w.e. [
69]. Direct comparison of the results of our mass balance calculations with those data is not possible because we made our calculations not for the whole glacier but for the present firn line altitude. Consequently, the values we obtained can be considered as average for the glaciers only for the last few years but not for the 1960s, when the glaciers were larger and the firn line was situated lower. Nevertheless, our results for the 1966–2001 period—−2.36 m w.e. and −67 mm w.e. (East Mugur Glacier), and −2.39 m w.e. and −68 mm w.e. (Seliverstova Glacier), respectively—are similar to those for the Malyi Aktru Glacier.
Comparison of the tendencies for shorter periods gave the opposite result: the period of positive mass balance with especially high mass balance values in 1975–1979 [
70] in the Malyi Aktru Glacier matches the warm and dry Phase VII in the arid part of the Altai and the low mass balance index values at the glaciers of the Mongun-Taiga and Tavan Bogd massifs. The period of low mass balance in the Malyi Aktru Glacier in 1950–1970 [
71] does not have analogues for the glaciers of the arid areas of the Altai Mountains (
Figure 16 and
Figure 17). It is likely that those disagreements reflect the differences between the precipitation values and their changes.
Some of the patterns of glacial retreat typical for the arid part of the Altai, such as the sideward retreat of glaciers in the valleys of the eastern aspects, have been noted by Tronov [
26], but generally they are more specific for the arid Altai, especially the glacial degradation in the accumulation zones.
According to [
72], an influence of a climatic event on a glacier can be subdivided on a synchronous impact, with a period and an intensity coinciding with those of the event, and an epichronous one, continuously released for as long as the corresponding change of the glacial mass balance remains inside the glacier (i.e., during the complete mass change period). This is why the time of response of the glacial front to climatic fluctuations depends on the area and length of the glacier and the speed of ice movement depending on the angle of the slope and the thermal regime of the glacier.
The time of response of the glacier to the climate fluctuations has been estimated for some glaciers of the Russian Central Altai. The time of reaction of the snout of the Malyi Aktru Glacier has been estimated differently by different researchers: 7 years [
73], 62 years [
74], and 35–40 years [
71]. In 1975–1980, the kinematic wave moved across the glacier with a speed of 20–40 m/day, causing a small glacial advance in 1980. This means that, in the case of a very high and abrupt increase in accumulation, the time of response of the glacial front can be only 1–4 years [
75].
Though the parameters of the Malyi Aktru Glacier (area 3.8 km
2, length 4.4 km) are similar to those of the valley glaciers of Mongun-Taiga and the northern slope of Tavan Bogd, it should be noted that Malyi Aktru exists in conditions with 1.5–2-fold higher precipitation, a higher energy of glaciation, a 300–400 m lower ELA position, and about a 700–800 m lower terminus position. As a result, the speed of ice flow on the surface of Malyi Aktru in summer, according to measurements taken in 1957–1964, was 6–7 cm/day, and the average annual values were 4.2–4.3 cm/day [
76]. This is almost two times faster than the speed of ice movement at the East Mugur Glacier (the Mongun-Taiga massif). Therefore, it is likely that the glaciers of the arid areas of Altai have a longer time of epichronous response to climatic events than those of the humid Central Russian Altai.
Our continuous observations beginning in 1988 (Seliverstova Glacier, Right Mugur Glacier) provide no evidence of cumulative waves caused by a sufficient positive mass balance similar to that of the Malyi Aktru Glacier. The time of glacial response of the valley glaciers of the arid Altai according to our analysis is 20–11 years. The time needed for the ice from the accumulation zone to reach the glacial front is sufficiently longer (≥71 years for the Seliverstova Glacier). In such conditions, the small waves in the ice flow are smoothed before they reach the glacial edge. Therefore, epichronous reactions to changes in glacial accumulation could take place only in cases of large amplitude and duration. This is probably the reason why the glaciers of arid Altai tend to create a lower number of moraines with the omission of small oscillation moraines—a phenomenon that has been noted by Ivanovskiy [
5].
Consequently, the fluctuations in the rate of retreat of the fronts that we observe for the valley glaciers are mostly a reaction to changes in ablation at glacial snouts, which, compared with accumulation zones, are more vulnerable to increases in temperature. This means that there is no reason to expect a deceleration of glacial retreat at least within the next 10 years, because the temperature remains very high. The expectations for the flat summit and slope glaciers are similar, as they are even slower, have less snow concentration, and react mostly to the changes in temperature. The situation might be different with cirque glaciers that are more sensitive to fluctuations in precipitation due to higher concentrations of snow and a shorter time of response to climatic fluctuations (because they are shorter and smaller).
Comparison of our results with those of studies of other regions of Eurasia shows some similarity in glacial dynamics. In the Alps, the glacial area reduction between the 1970s and 2000 was about 22%, mainly occurring after 1985. At the same time, in the arid Altai, accumulation/ablation values are generally lower, and mass balance values do not reach as extreme a level as they were at in 2003, when the average mass balance of Alpine glaciers was −2.5 m w.e. [
77].
In the Caucasus, in the 1960–1990 interval, the climatic conditions were relatively favorable for the glaciers due to cool summer seasons and increased precipitation (matching two periods of slower glacial retreat in the arid Altai in the mid-1960s and late 1980s). Most glaciers slowed down or even stopped their retreat. In the next period, especially in the anomalously warm 1998–2001, the glacial degradation accelerated, which also coincides with the interval of strongly negative mass balance of the glaciers in the arid part of Altai. After a short cooler and snowier interval in 2002–2005, the climatic conditions in the Caucasus again became unfavorable for the glaciers. At the same time, the average rates of retreat of the glacial fronts for 28 selected valley glaciers in the 1987–2010 period did not exceed 20 m∙year
−1 [
78]. The decrease in the glacial area was also relatively slow: 4.9% for the glaciation of Elbrus and 4.7 for the Greater Caucasus in general in the 1999–2012 period [
79].
In more arid mountain regions the reduction of glaciers was more sufficient, even exceeding our estimations for the arid Altai. In the period from 1970 to 2003, the glaciation of the Chersky Range lost 28% of its area, and the Suntar-Khayata Range lost 19% [
80].
In the Tien Shan mountains, over the 20th century, glacier area has been estimated to have decreased by 25–35% [
81,
82]. According to Narama et al., in the period from approximately 1970 to 2000, the glacier area decreased by 19% in the Pskem region, 12% in the Ili-Kungöy region, 12% in the At-Bashy region, and 9% in the SEFergana region [
83]. The Eastern Tian Shan glaciers of Mt. Bogda lost 21.6% from 1962 to 2006 (overall), and a subset of the investigated glaciers shows a relative area reduction of 4.6% in 1962–1990, and 10.8% in 1990–2006 [
84]. Combined mass balance data of nine monitored glaciers in the Tian Shan shows that most glaciers have accelerated their mass losing rate since the 1970s (averaged from −24.6 mm w.e. a − 1 in 1957–1970 to −444.6 mm w.e. a − 1 in 1971–2009) [
85], which is sufficiently higher than the corresponding values that we obtained for the Mongun-Taiga massif (170–177 mm w.e. a − 1).
