Review

Review on the Permian–Triassic Boundary (PTB) in Abadeh (Iran), a Traveling Boundary

1
Institute of Earth Sciences, University of Lausanne, CH-1018 Lausanne, Switzerland
2
Department of Lithospheric Research, Vienna University, 1090 Vienna, Austria
*
Authors to whom correspondence should be addressed.
These authors contributed equally to this work.
Geosciences 2026, 16(9), 381; https://doi.org/10.3390/geosciences16090381 (registering DOI)
Submission received: 13 August 2026 / Revised: 8 September 2026 / Accepted: 15 September 2026 / Published: 20 September 2026

Abstract

The Permian–Triassic transition along the South Cimmerian margin of the Neotethys in Abadeh (Iran) is built by four successive lithologies/events with apparently no gaps: (1) the stop of the skeletal carbonate factory of the Paratirolites limestone caused by the end-Permian mass extinction event (EPME); (2) replacement of carbonate deposits by the up to 0.3 m thick boundary clay, defining the base of the Elikah Formation; (3) sudden emergence of a sponge-microbial carbonate factory with buildups of ca. 1.6 m, called the microbial unit; (4) a thick succession of platy lime mudstone. Despite continued research for over 50 years, there still exists significant debate concerning the exact base of the Triassic. This is partially due to different proxies used for the identification of the Permian–Triassic boundary (PTB). Since the boundary was defined by the first appearance (FA) of the conodont Hindeodus parvus at the Global Stratotype Section and Point (GSSP), there is continued discussion concerning its earliest occurrence in Abadeh. Ongoing research shows the boundary at different stratigraphic levels: at the EPME horizon below the microbial unit, at its base, within the middle part, or at the base of the platy limestone beds directly above the microbial unit. We review the existing data, explain which level we regard as real PTB and recommend steps to achieve an agreement in the scientific community on the position of the PTB in Abadeh.

1. Introduction

The end-Permian mass extinction (EPME) was the most severe biotic crisis throughout the Phanerozoic, as summarized in Ref. [1], and has been studied widely, especially in those sections that possess continuous deposits of the Permian–Triassic boundary. Abadeh in Iran is one of the well-known places to study Permian/Triassic boundary successions, as well as their coeval deposits in South China, where the Permian–Triassic Boundary (PTB) has been defined and ratified by the International Commission on Stratigraphy (Yin et al., 2001) [2]. High-resolution and detailed stratigraphic studies (e.g., [3,4,5,6,7,8,9,10,11,12]) have been carried out in Abadeh that provide correlation with other Iranian PTB sections and the Lopingian to early Triassic type sections in South China at Meishan. This points out the importance of the Iranian sections for detailed investigation regarding the Permian–Triassic transition [13]. However, the exact position of the Permian/Triassic boundary at Abadeh is not clear, as several different stratigraphic levels have been found and used in the publications mentioned above, and there is no agreement; see Chapter 2.2. The present work provides an overview of the chronology and different positions of the Permian/Triassic boundary in the Abadeh (Kuh-e-Hambast) section. Furthermore, we provide an outlook on how to reach an accepted Permian/Triassic boundary.

2. Geological Setting and Literature

2.1. Geological Setting

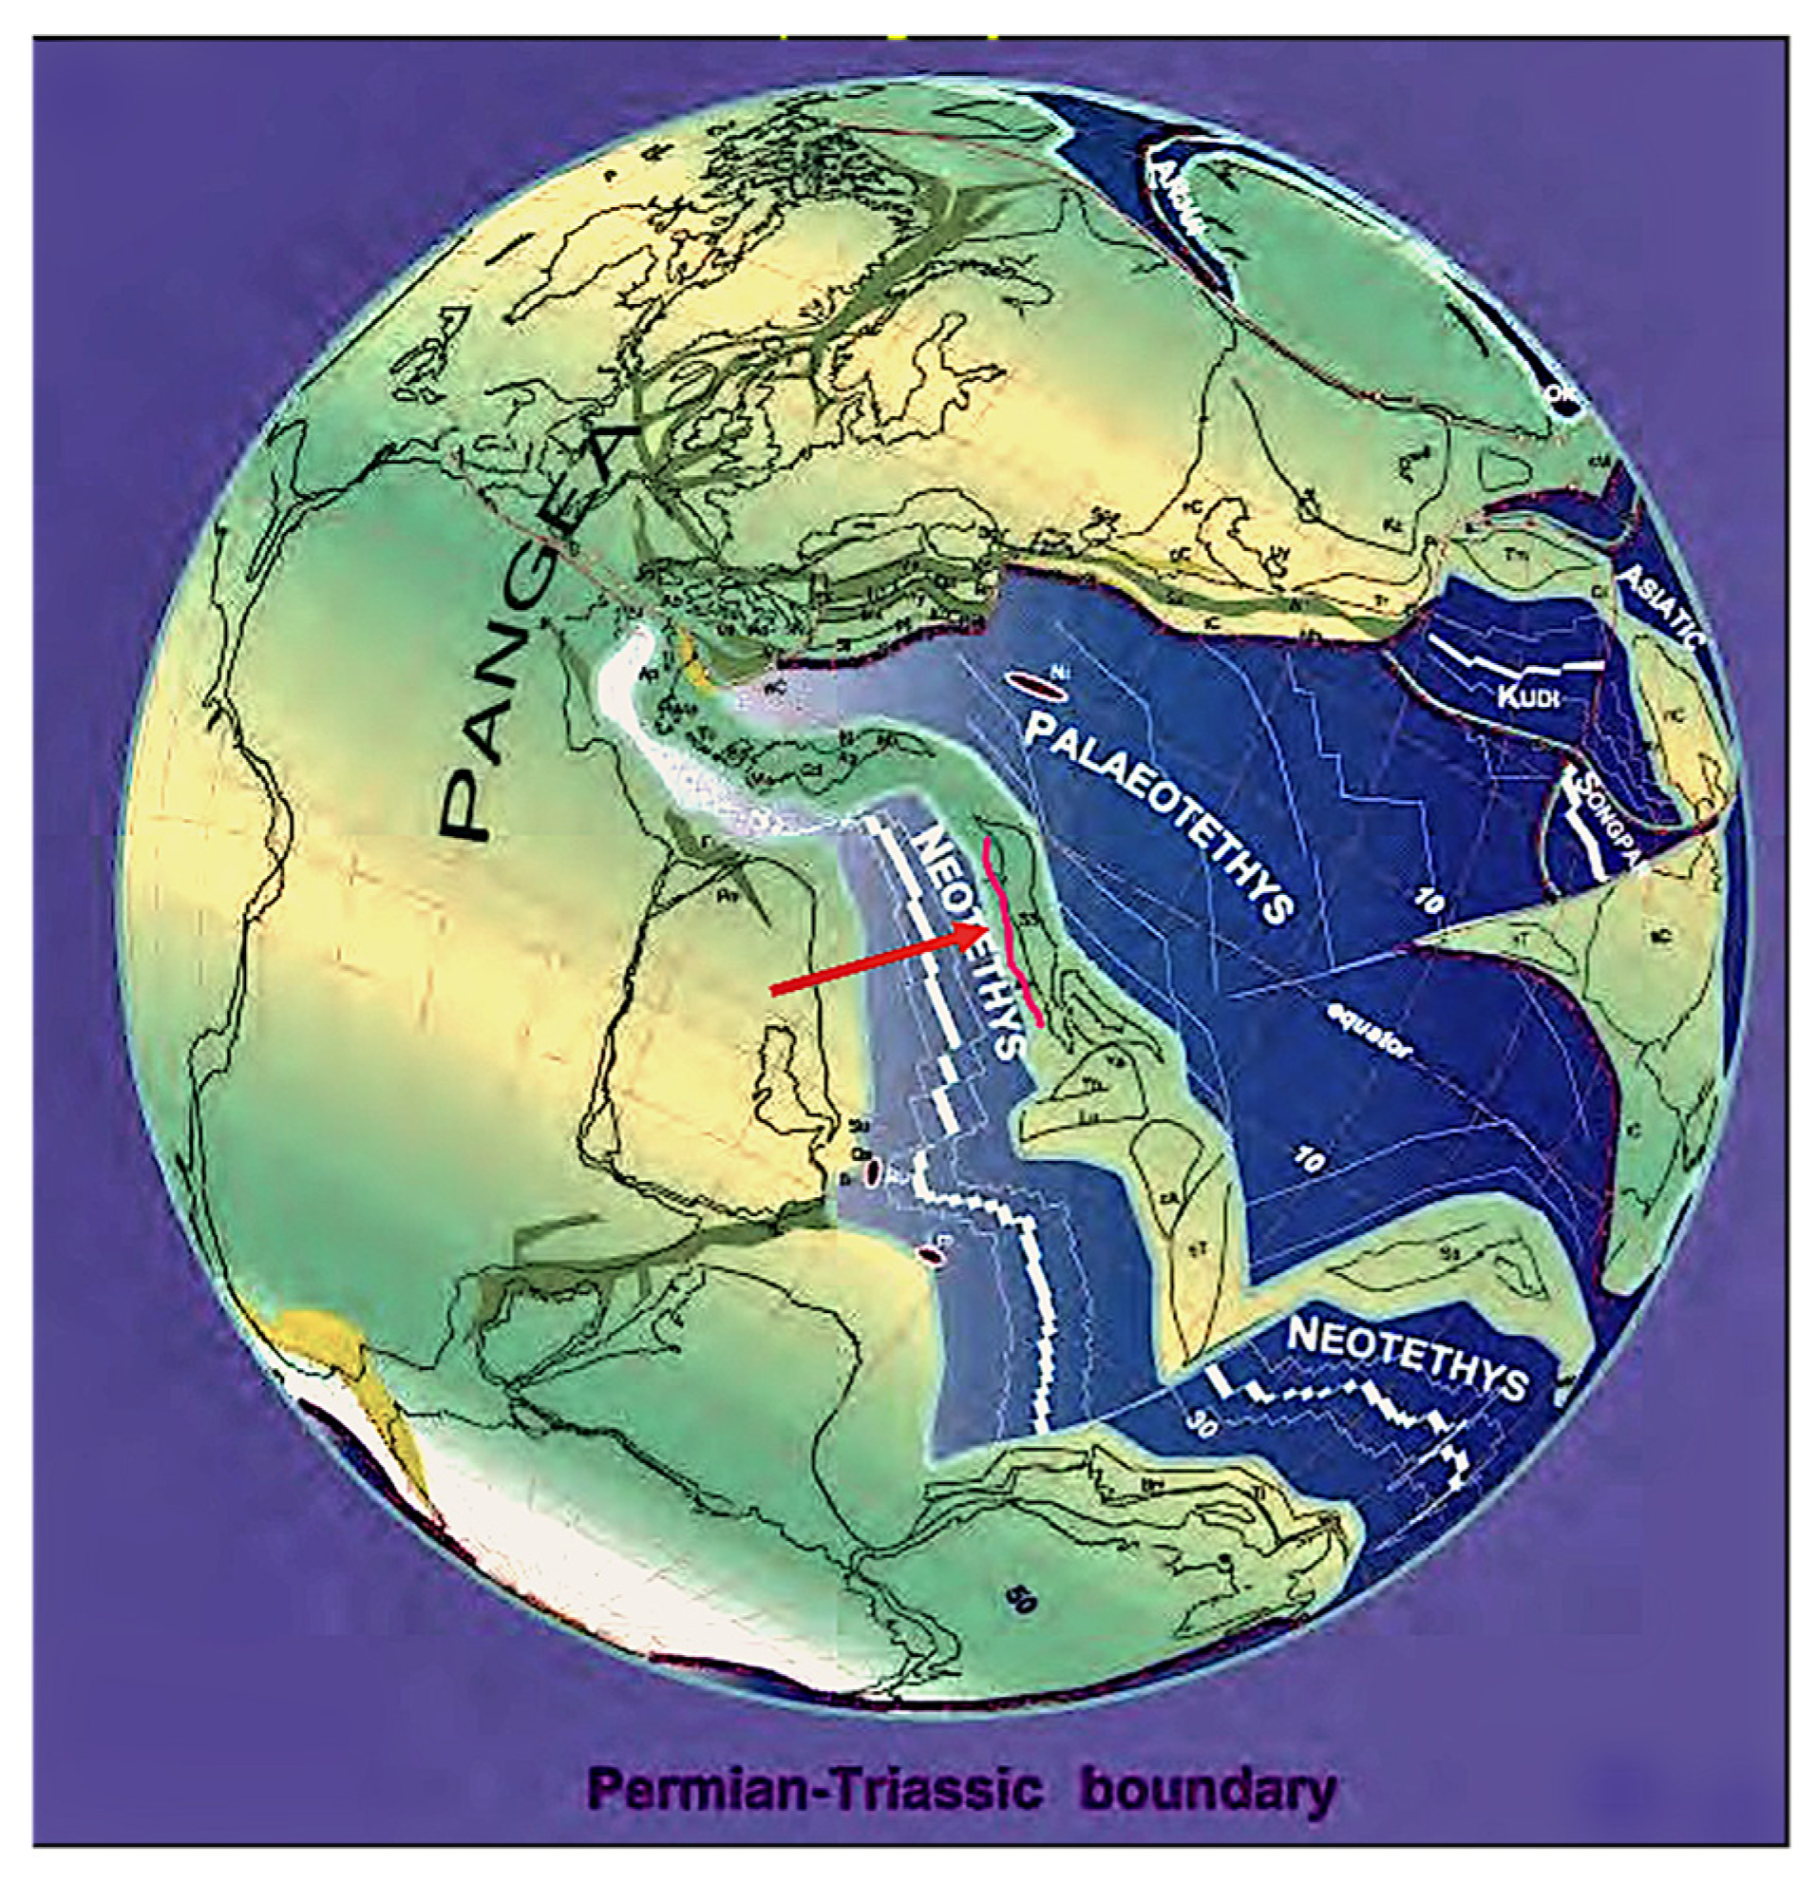
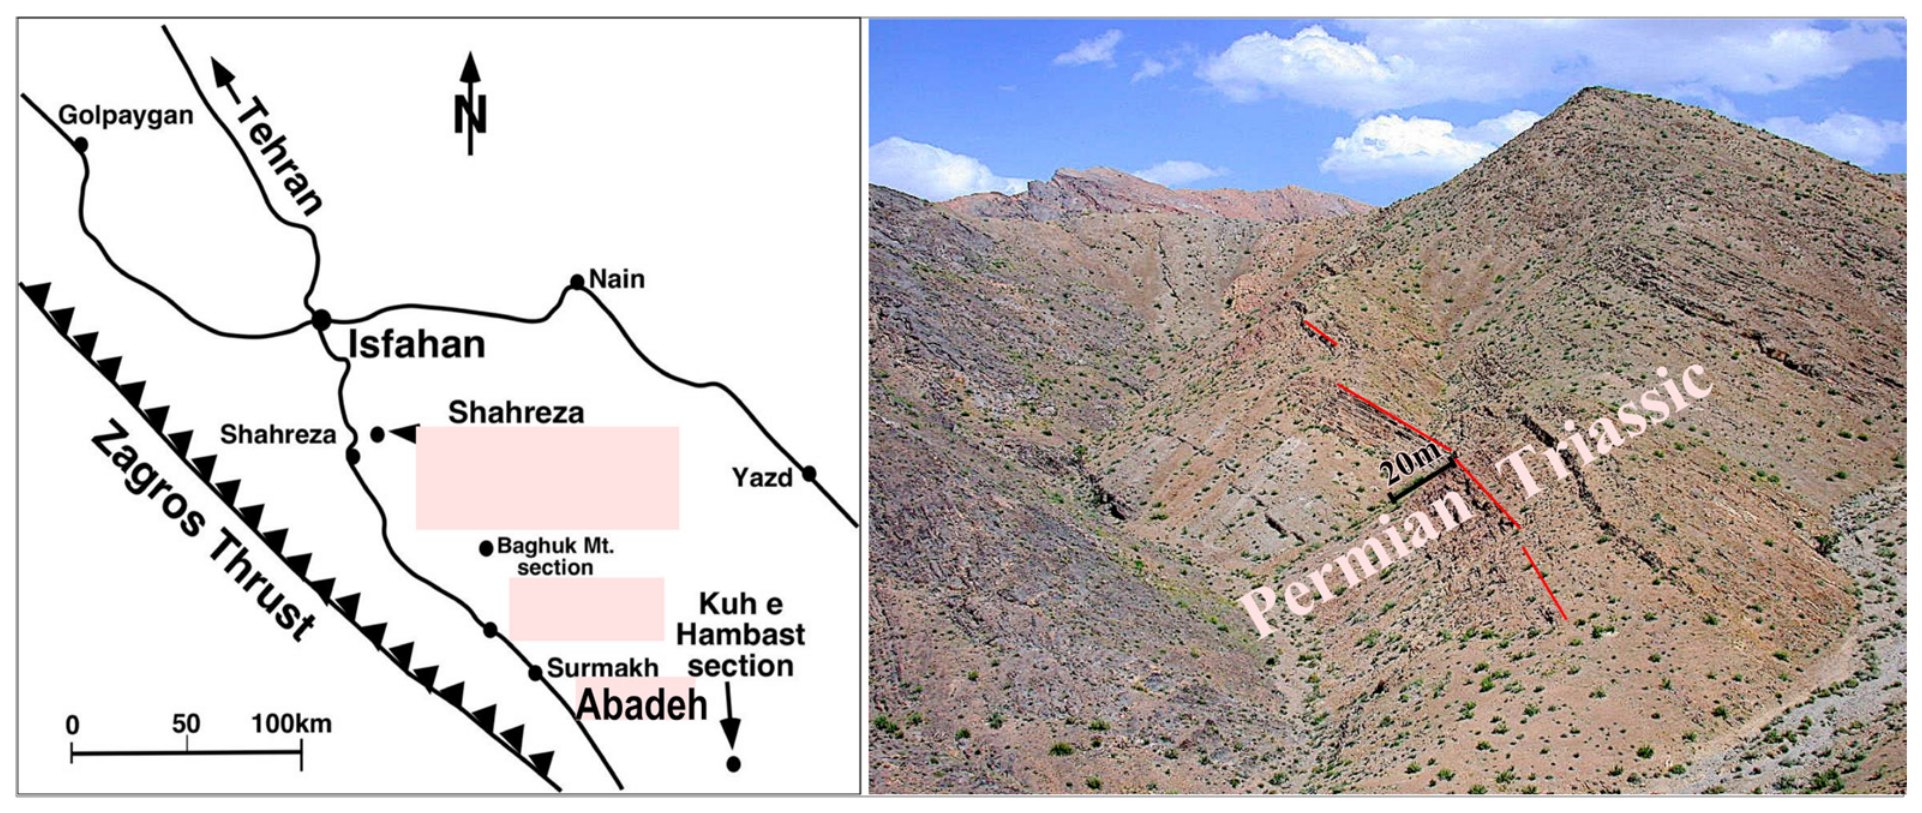
The Abadeh geological area is situated along the South Cimmerian margin of the Neotethys in central Iran (Figure 1). The precise location of the Kuh-e-Hambast sections in central southern Iran, about 150 km southeast of Isfahan (Coord.: 30°54′53.65″ N 53°13′3.94″ E, altitude 2000 m), is situated 80 km SE of Abadeh town (Figure 2).

2.2. Abadeh Literature

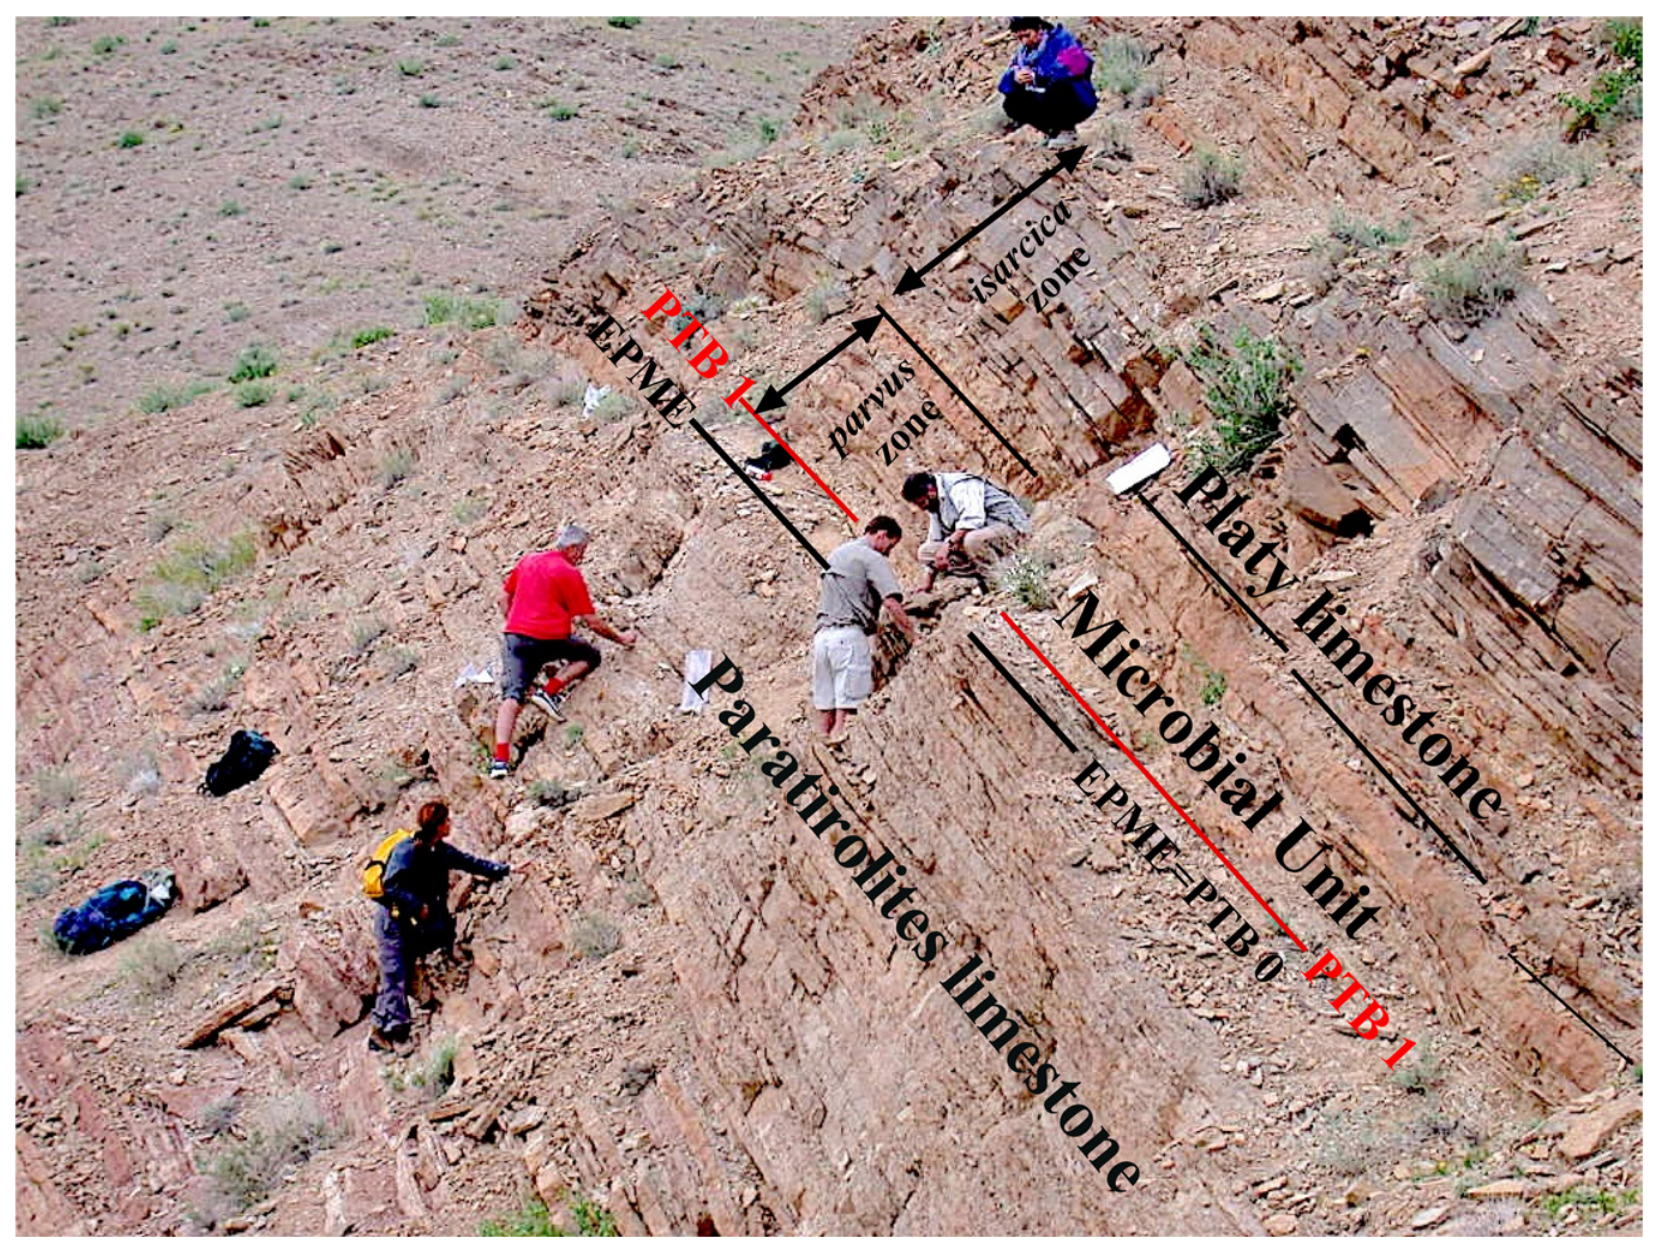
In 1969 and throughout the seventies, a Japanese research group led by Keiji Nakazawa, in cooperation with Hooshang Taraz of the local Iran Geological Survey, began extensive studies of three main Permian–Triassic marine and fossiliferous areas. In 1981, they published a bed-by-bed description of the upper Permian to early Triassic in the Abadeh region, including its fossil contents, under the joint authorship of the Iranian-Japanese Research Group, cited here by the first author: Taraz et al., 1981 [3]. As large outcrops occur in this area, Permian–Triassic sections were numbered A to H. The sections start with the Paratirolites limestone unit, which is up to 12 m thick. At its top is the end-Permian mass extinction (EPME) horizon, followed by the 10 to 30 cm thick boundary shale, the base of which defines the base of the Elikah Formation in Central Iran. This was considered at that time as the PTB (named here PTB0) being identical with the EPME. Confirming the basal Triassic age, they found a Hindeodus (H.) parvus conodont assemblage in the first limestone bed, above the base of the Elikah Formation. This bed comprises a so-called algal biolithite floor, or stromatolitic limestone beds, 130 to 180 cm thick, now called the microbial unit. In some places, however, the unit has been truncated tectonically or by erosion, as shown in Figure 11 of Ref. [3].
Above the microbial unit, according to Ref. [6], there is a 15 m thick, thin-bedded platy limestone (Figure 3), followed by successions of thin-bedded marls and limestone, some parts oolitic, up to 750 m thick.
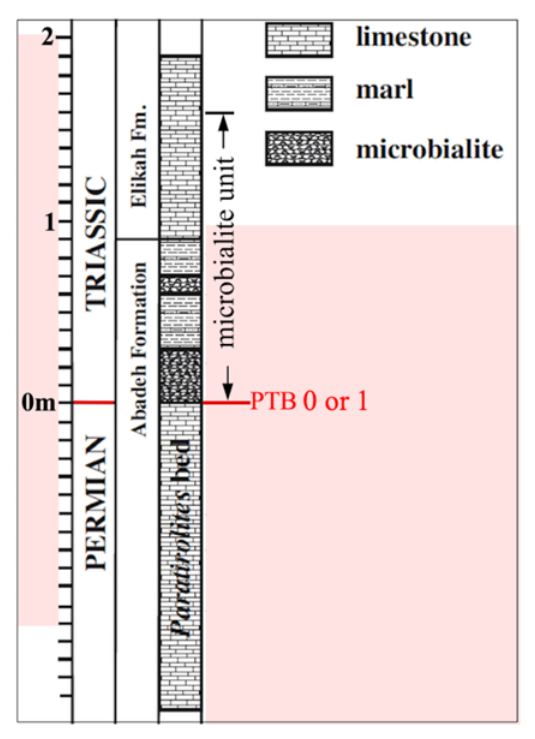
All following authors [6,7,12,15,16] confirmed and/or illustrated the finding of the conodont H. parvus a few cm above the boundary clay, as did Ref. [3]. Studying strontium isotopes from conodonts, Dudas et al., 2017 [9], published new Sr isotope values of Abadeh and other sections from Central Iran, and in both sections, the PTB was reported at the base of the microbial Unit. Interestingly, in their Figure S4B, they moved the base of the Elikah Formation above the microbialite to the base of the platy limestone unit (Figure 4). This PTB is called PTB1 here, and thus the PTB was moved from PTB0, 10–30 cm higher up above the Boundary Shale up to the base of the microbialite unit, according to the new formal definition of the PTB in Meishan/China [2].
From 2004 to 2026, two more positions of the PTB were published:
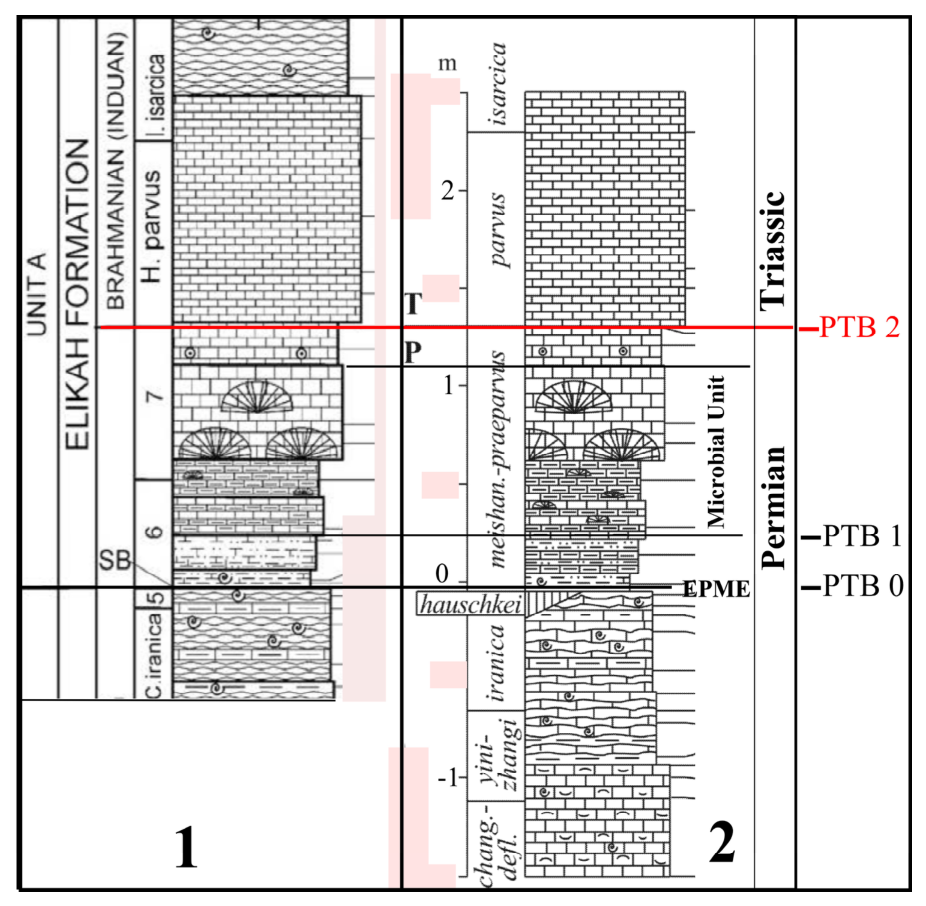
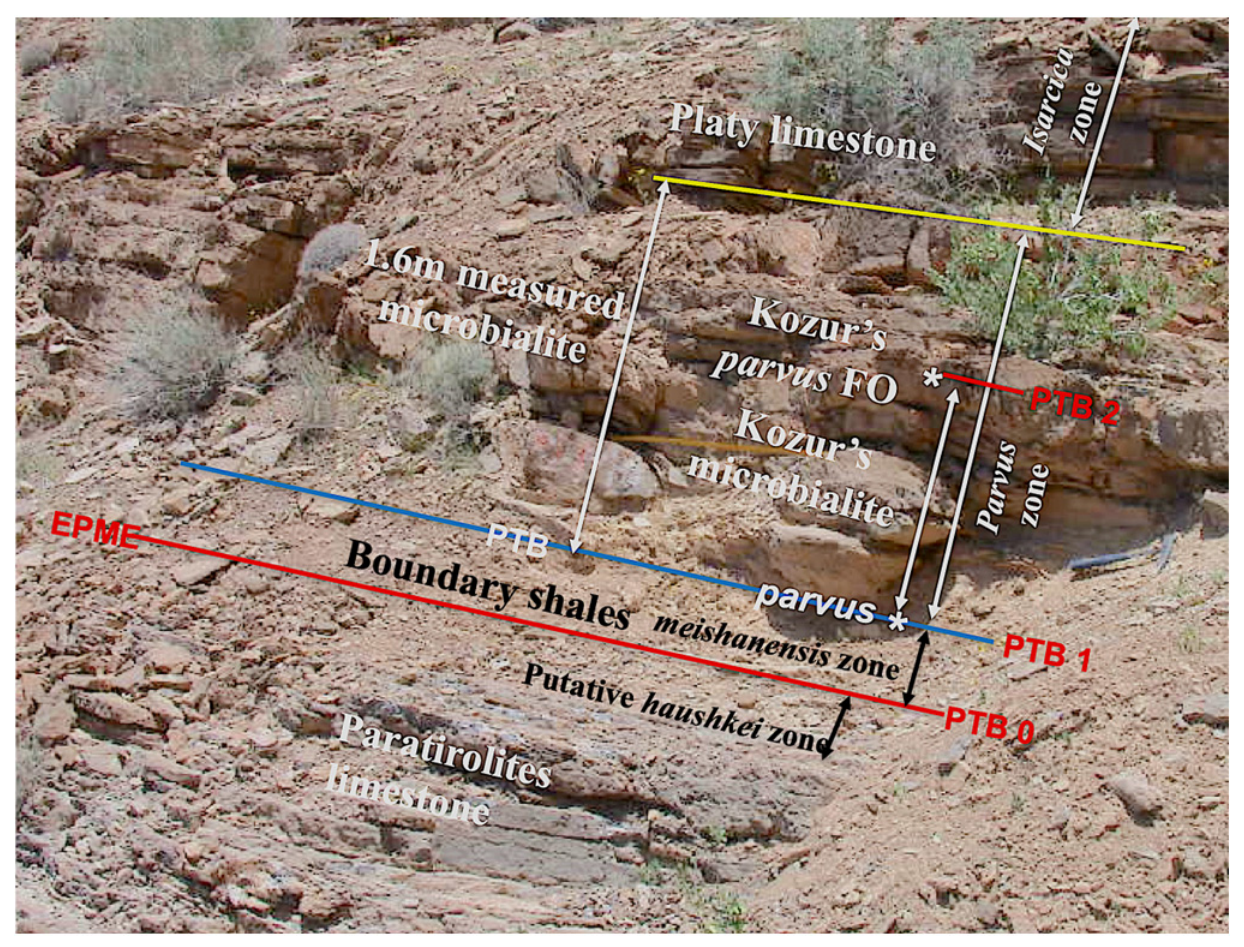
(A) Geological teams [4,5,17] found H. parvus from the lowermost bed of the platy limestone member, thus placing it significantly higher up than Ref. [3] and the other articles mentioned before. They also published different thicknesses for the lithological units than reported by Ref. [3] and the other working groups mentioned above. Instead of 12 m of the end-Permian Paratirolites limestone, they found only 6 m; see Figure 2 in Ref. [5], and instead of a 1.6 m-thick microbial unit, Kozur 2005 [5] showed in Figure 3 only 0.5 m thickness, or 0,7 m in Figure 5 [17]. As we do not know the reasons for these different thicknesses, we refrain from speculation. However, it is possible that the outcrop they selected is located several kilometers—or tens of kilometers—away from the outcrop described and illustrated by the other authors. Kozur and Korte report, as illustrated in Figue 5, oolitic limestones overlying their thin/reduced microbialite unit, with platy limestone situated above, which is not shown in the Abadeh section by other authors. The first H. parvus by refs. [5,17], extracted from the first limestone bed (their platy limestone) above their oolitic beds, resulted in the PTB being shifted upwards, called here PTB2. Between their (pre-extinction) C. hauschkei zone and their H. parvus zone, they identified the latest Permian C. meishanensis-H. praeparvus zone to date, both the boundary shale and their truncated microbialite unit (Figure 5). An outcrop photo allowed us to illustrate the Permian–Triassic transition and the two positions of the first occurrence of H. parvus (Figure 6) in the articles [5,17].
(B) Re-investigating Iranian PTB sections, Shen & Mei 2010 [8] published a conodont zonation of the Guadalupian to end-Lopingian succession, mainly following the results by Refs. [4,5,17]. They wrote that they did not find conodonts in the boundary shale nor in the microbialites and thus extended their pre-extinction C. hauschkei zone up to the H. parvus zone, which they identified above the microbial Unit (PTB2). It must be noted that their study concentrated on the Clarkina lineage, which they investigated using the “sample-population” method.
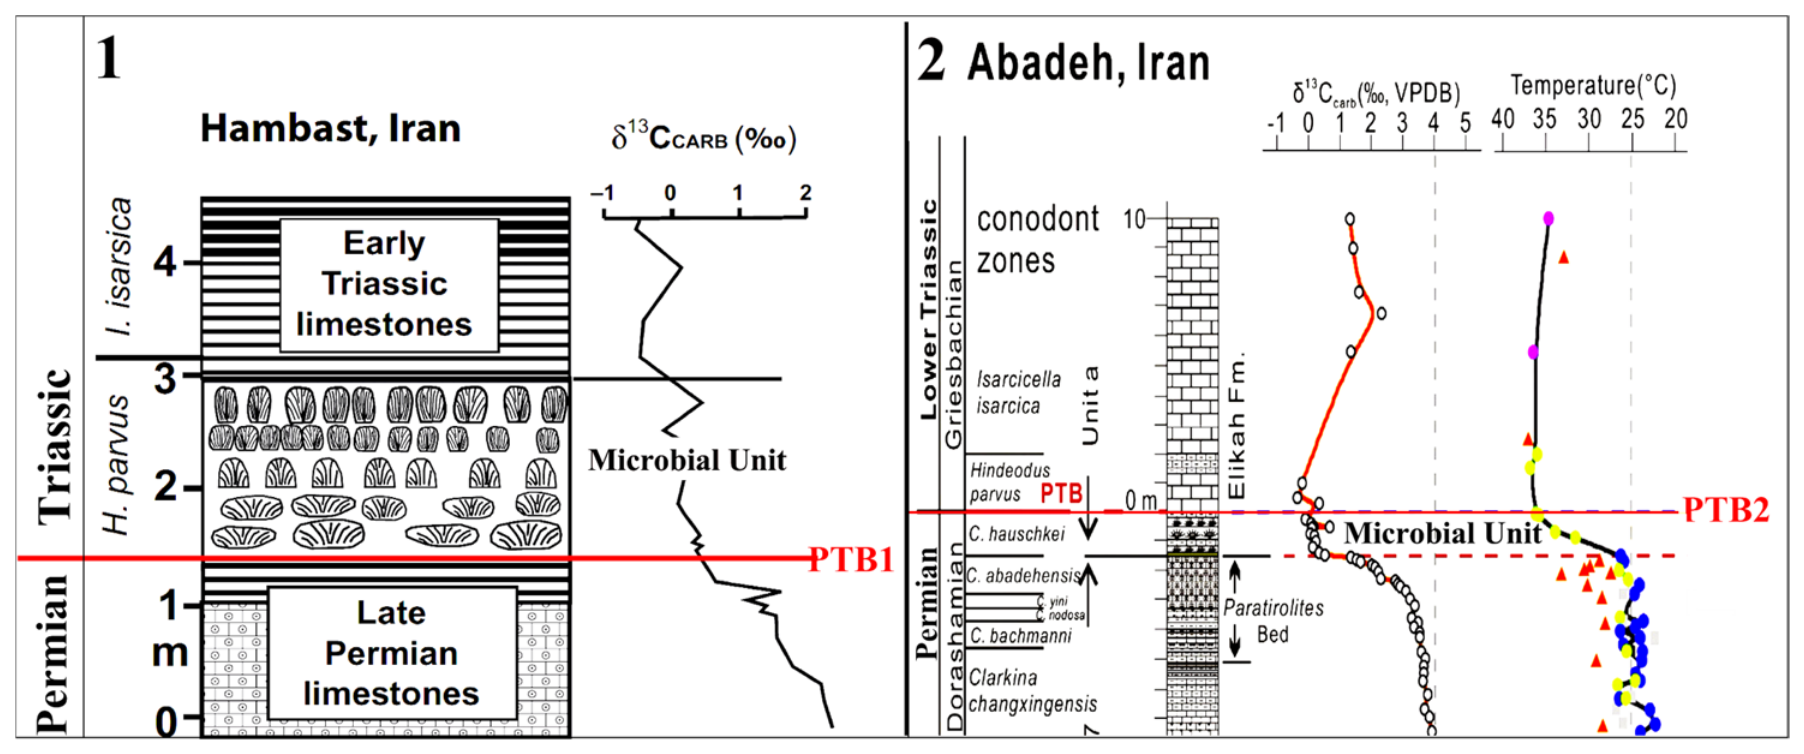
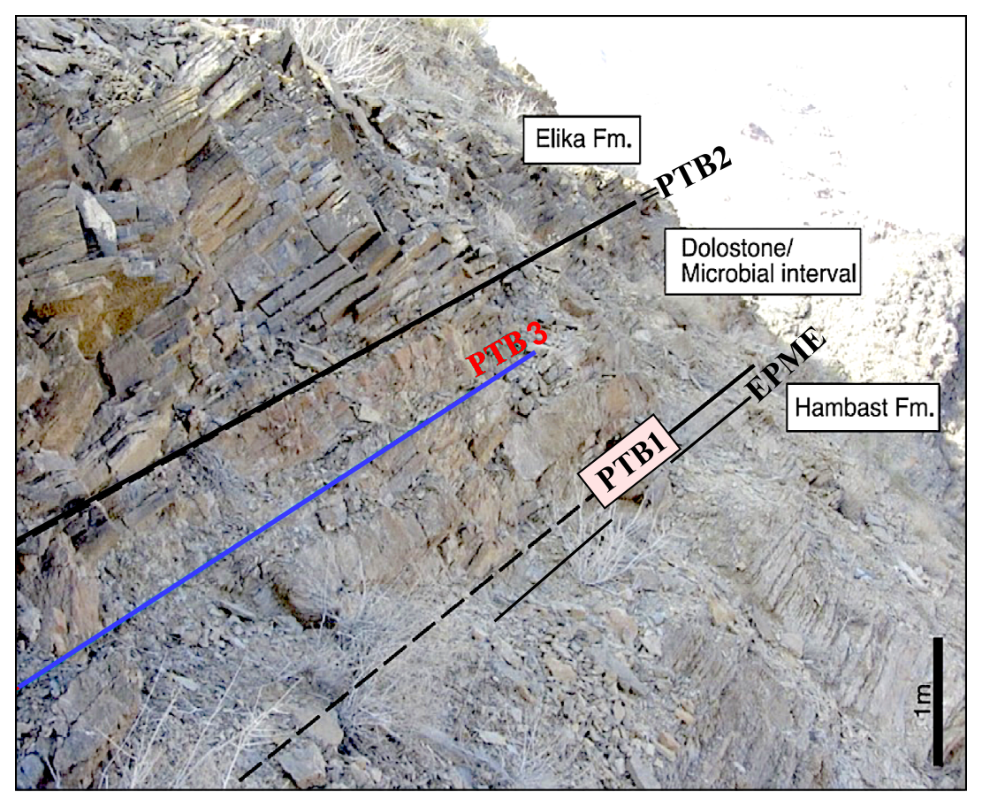
(C) The geological team [11] working on oxygen isotopes from the same conodont samples as for strontium isotopes [9] at the Permian–Triassic transition from Abadeh published data showing a dramatic shift in the oxygen isotope ratios in the basal Triassic microbialite of Abadeh, corresponding to a 10 °C increase in seawater temperature (Figure 7). They followed the biostratigraphy of Ref. [8] by extending the C. hauschkei zone beyond the extinction event until the base of their parvus zone above the microbial unit at the base of the platy limestone (PTB2) and used Ref. [10] as support for the positioning of the boundary in their article. However, in Ref. [10], the Abadeh section PTB was illustrated immediately above the Boundary Clay, with the microbialite unit already Triassic in age (see their Figure 9C of Ref. [10]). Subsequently, Chen et al., 2020 [11] established for the Abadeh section a high-precision temporal framework with their so-called first-occurrence chronological datum of H. parvus at 251.902 Ma, and the mass extinction level (EPME, base of “Boundary Clay”) at 251.941 Ma. Accordingly, their C. hauschkei zone duration, comprising the microbial unit, was 39,000 years.
This study was commented on by Refs. [18,19], showing that Ref. [11] did not discuss previously published PTB levels identified in the section, but only noted their first appearance datum (FAD) of H. parvus above the microbial unit. Furthermore, Horacek et al., 2021 [18,19] gave a first detailed review on the different positions of the Abadeh PTB and its boundary interval at that time and a correlation with other PTB sections.
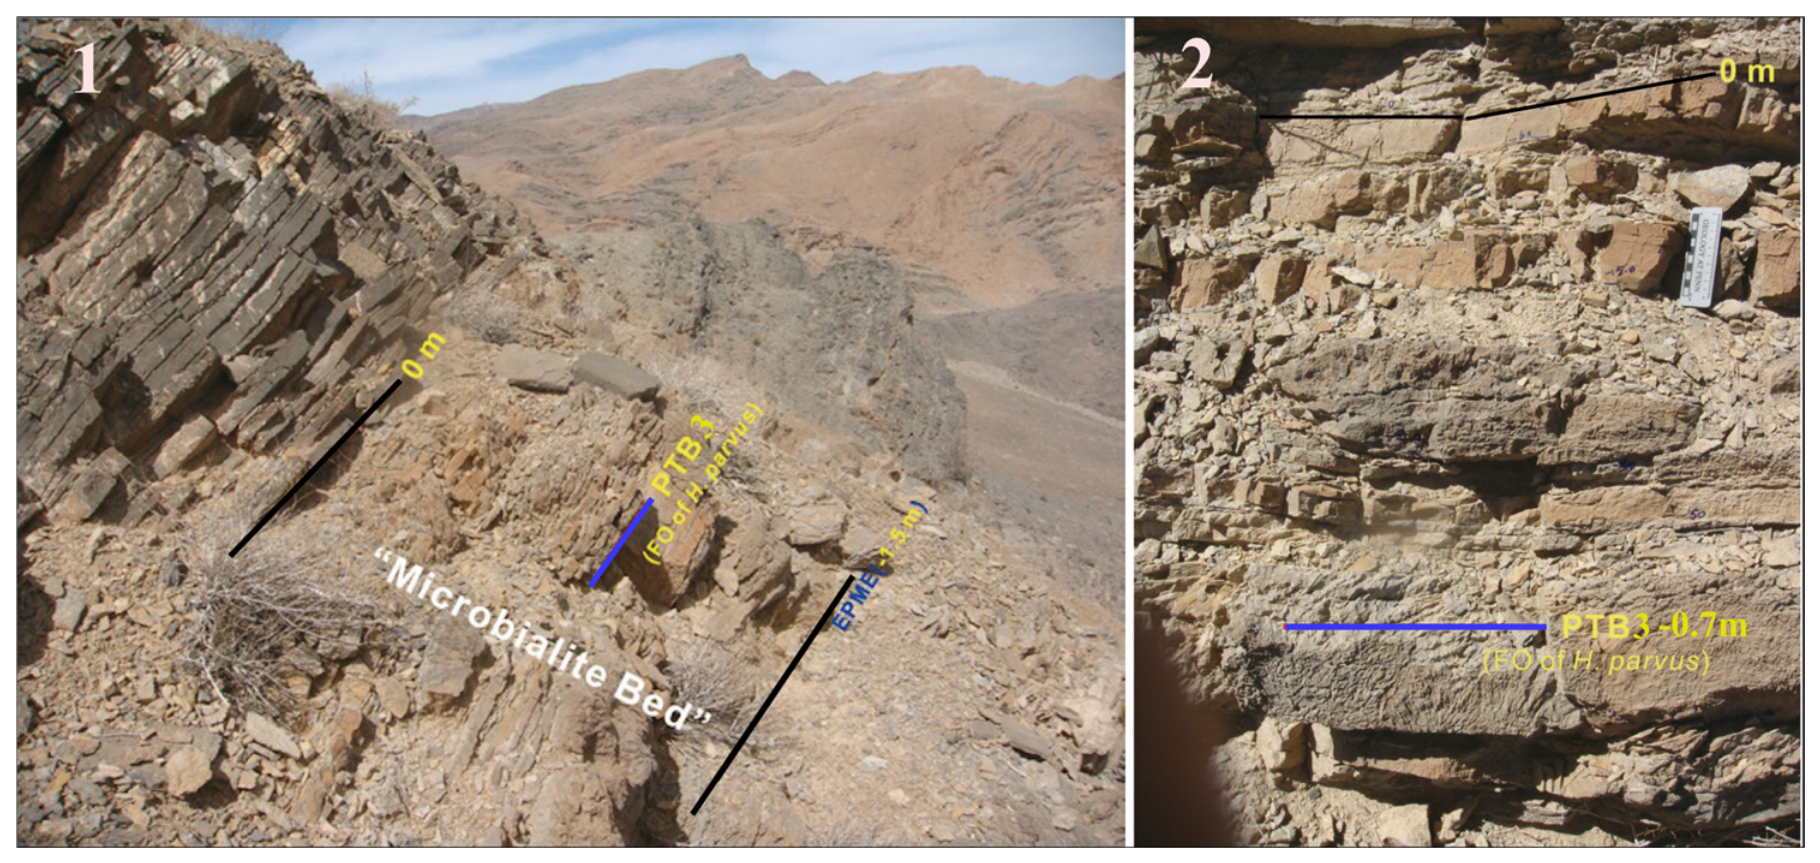
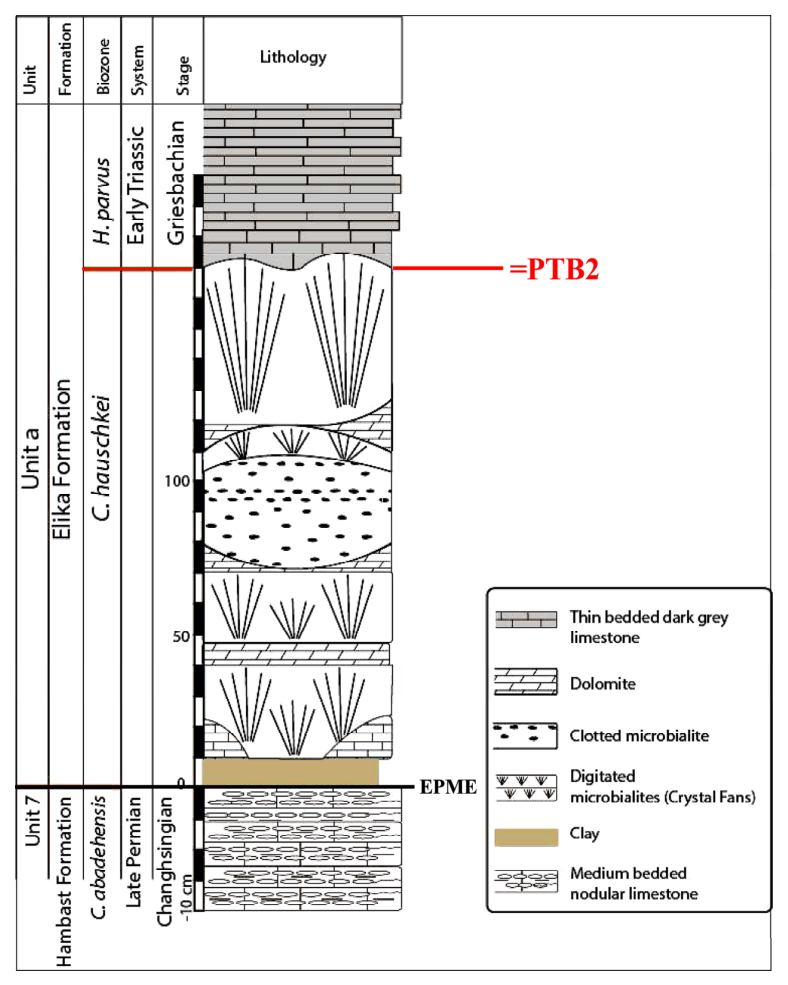
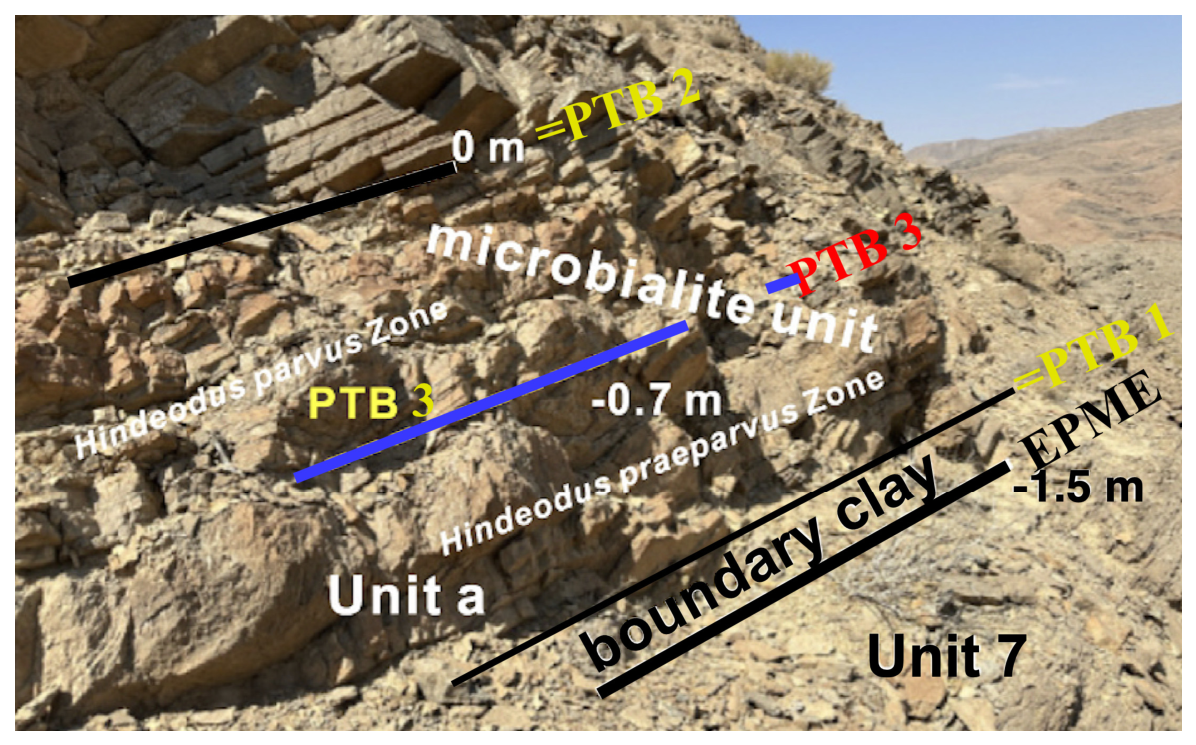
(D) In their reply, Chen et al., 2021 [20], restudied their conodont samples and adjusted the FAD of H. parvus to 0.9 m above the EPME horizon. Consequently, they moved the PTB to a new position (PTB3) inside the microbialite unit (Figure 8).
(E) Iranian authors in 2024 [21], following Ref. [11] and disregarding [20], selected the high Permian–Triassic Boundary (PTB2), located just above the 1.6 m-thick microbial unit, which was the focus of their study. As a result, the microbial unit was again assigned to the Permian (Figure 9), and the C. hauschkei zone was again extended upward to the base of the H. parvus zone.
(F) In 2025, a new Chinese team [14], with some of the Refs. [11,20] co-authors, published on the Lopingian biotic crisis and global correlation in the Abadeh area, Central Iran. They confirmed the data of Ref. [20] by finding the first occurrence (FO) of H. parvus in the Abadeh section, defining the PTB position neither at the base nor at 1.6 m above the base of the microbialite unit, but inside, at the same position = PTB3 claimed by Ref. [18]. They moved the C. hauschkei zone below the EPME horizon, followed by the lattermost H. praeparvus zone, allegedly end-Permian in age (Figure 10), inside the lower microbialite unit.
(G) The currently latest work on Abadeh [22], entitled “the redox boundary during the Permian–Triassic mass extinction in Central Iran at the Abadeh Kuh e Hambast section”, adopts the new PTB3 position proposed by Refs. [14,20], located 0.9 m above the base of the microbial unit (Figure 11).

3. Discussion

A main dispute concerns the first appearance datum (FAD), lowest occurrence (LO), or base (B) of the conodont H. parvus. The appearance of a (new) species is not a synchronous event globally; that means that globally FAD or LO is a diachronous event. Even though, current stratigraphic concepts treat these events as synchronous within the limits of achievable stratigraphic resolution. At one specific locality, however, the finding of a conodont by different working groups should result in very similar results, as identical material from the same section is investigated. If this is not the case, potential reasons can be:
  • Sampling density, size of samples, selection of suitable facies. Sampling is crucial in the present cases. Wide-spaced sampling might miss the earliest occurrence of a species, and small samples might also fail to capture an earliest occurrence if conodont numbers are (very) low. Similarly, the selection of unsuitable/unfavorable facies might lead to the earliest occurrence(s) of a species being overlooked. As the boundary clay and the microbial interval both are (very) scarce in conodonts, an inappropriate sampling strategy can be one reason for differing results. This was admitted by Ref. [8], stating that they did not have productive samples from the boundary clay and microbial unit.
  • Treatment of the samples. We have fewer concerns in this matter, as we assume all working groups involved have sound expertise in conodont extraction and thus apply appropriate and professional sample treatment.
  • Interpretation of the samples is another very relevant point, and we assume it is among the critical points leading to differing results. In conodont determination, even though each species is exactly described, there remains some space for interpretation. E.g., the authors of Ref. [20] claim that the conodont used for the identification of the base of the Triassic in Ref. [7] is “not a true H. parvus”, even though they do not exactly explain why they think so. Instead, they claim it is an intermediate between H. praeparvus and H. parvus, but due to the narrow and elongated cusp of this specimen, this claim is not well justified, as H. praeparvus is described as having a broader and shorter cusp [23]. Thus, the determination of specimens needs to be checked and controlled; therefore, good photographic documentation is required. In earlier works, photographs were less common; therefore, if a determination is questioned, the original specimens need to be restudied.
Furthermore, some earlier works were published before all relevant species were described and published; e.g., Hindeodus praeparvus was only described in 1996 by Ref. [23]; thus, all earlier works need to be checked and critically reviewed to see whether the determination of H. parvus is still in agreement.
Another issue is the application of special methods. E.g., the authors of [Refs. 8,11,14,20] apply the “sample-population” method, studying populations of specimens and regarding determinations of individual specimens as unreliable [20]. Such an attempt certainly has a strong impact on the respective determinations and thus the produced biostratigraphy.
4.
A sound and thorough literature review is also among the crucial and critical points leading to differing boundary levels. Even though most of the findings and results are documented against the boundary, e.g., whether events happened or started still in the Permian or only in the Triassic (e.g., temperature changes, strontium variations, etc.), the discussion of the exact boundary is often very basic. Many of the studies mentioned do not give an extensive review and discussion of the exact position of the boundary in the literature but just select one that seems to fit the perspectives of the authors with respect to the positioning of the boundary. As this point is very relevant with respect to the timing and duration of events around the boundary and its comparison with other sections, we think that more emphasis needs to be given to this issue.
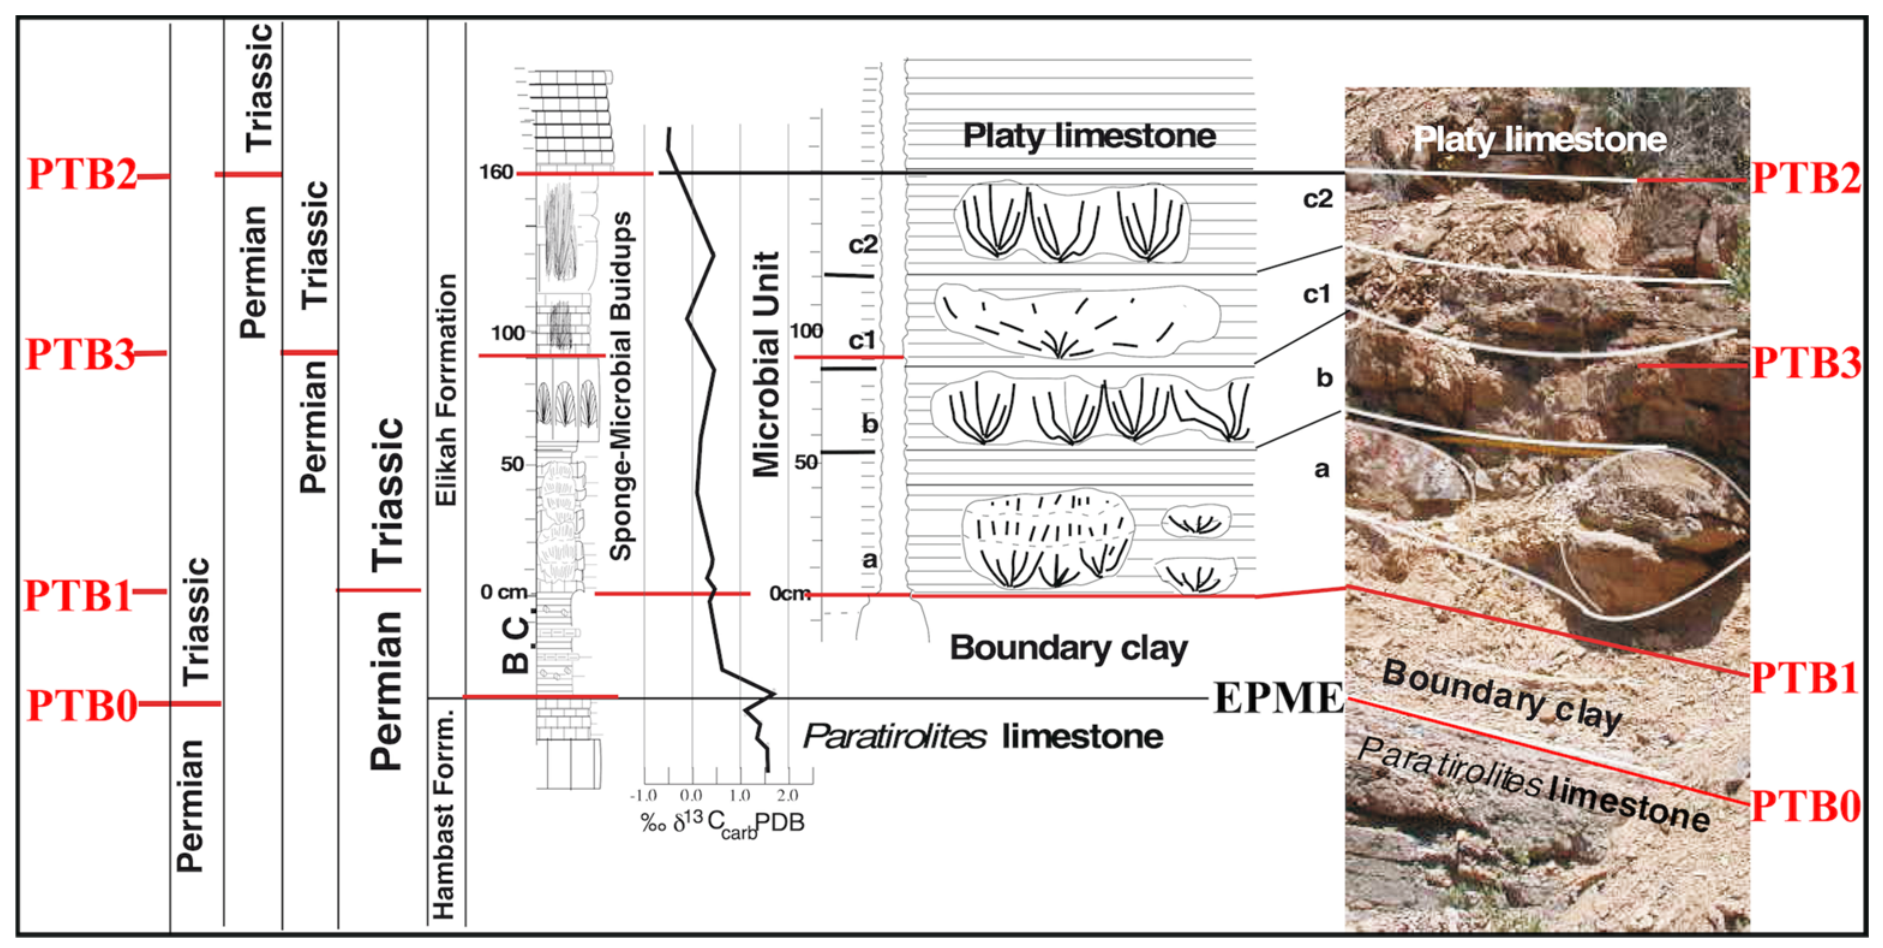
We classify the four positions of the PTB at the Abadeh section (see Figure 12) as follows:
PTB0: This position was identified before a formal definition of the Permian–Triassic boundary by the International Commission of Stratigraphy (ICS), and different proxies were used. Therefore, it was revised and formally ratified by accepting the conodont Hindeodus parvus as the primary marker for the base of the Triassic. As this marker is present in the Abadeh section, it should be used to identify the boundary. PTB0 is thus a historic boundary.
PTB1 was defined by Hindeodus parvus, thus fitting the definition of the ICS. The photograph of the defining specimen was presented in a publication [7], and the claim (by Ref. [20]) that this specimen is not a Hindeodus parvus we regard, according to the definitions of Hindeodus praeparvus and parvus, as unconvincing and thus incorrect (see above). We consider this position even more justified, as ref. [20] provides no explanation for why they come to their interpretation, but just write a plain, unexplained statement. Furthermore, the publication Yuan et al., 2025 [14], which we deem the follow-up of Ref. [20], as many authors appear on both publications and that ref. Ref. [14] confirms the PTB position of Ref. [18], also does not explain why the Hindeodus specimen shown in Ref. [7] should not be a parvus, but merely cites Ref. [20].
PTB2 was identified by finding Hindeodus parvus at the base of the platy limestone unit and confirmed by several research groups. In article [20], we find some potential explanations for why the boundary was found higher up-section, as it is explained in Ref. [11] that the “sample-population” method was applied. This method requires higher numbers of conodont specimens and, according to [20], does not support the identification of boundaries by single-specimen interpretation. As the close boundary interval, especially the microbial unit, is very poor in conodonts, this can explain why several groups only found Hindeodus parvus higher up, if they did not collect large conodont samples and/or did not consider single individual conodont specimens.
PTB3 was identified by Ref. [20] re-investigating the conodont record of Ref. [11] and later on confirmed by Ref. [14]. We do not know if Ref. [14] collected additional samples or re-sampled the sample positions of Ref. [11]. It shows, however, that there is some space for interpretation in the determination of conodont specimens, as we assume that Ref. [11] have been thorough and diligent in their identifications.
Our personal view in brief: the failure to find Hindeodus parvus at level PTB1 by some research groups does not make this position invalid in any way; it only (generally) calls for large conodont samples whenever a facies is (very) poor in conodonts. Therefore, as has been stated in Refs. [18,19], we assume position PTB1 to represent the lowest/base occurrence of Hindeodus parvus at the Abadeh section, which should be used for placing the boundary and correlation with other sections. Alternatively, it needs to be mentioned and explained why another PTB position is used.
Recommendations for future work to achieve an agreement in the scientific community on the PTB at the Abadeh section are as follows: (A) as the PTB1 was proposed first by Gallet et al., 2000 [16], their specimen(s), on which this interpretation was based, should be photographed and published. (B) A more precise definition of Hindeodus parvus should be found, leaving less space for interpretation. (C) Re-sampling of the section collecting large conodont samples closely spaced in the critical interval should be done to confirm PTB1.

4. Conclusions

Four different PTBs were identified at the Abadeh section, Iran, by different research groups (see Figure 12):
The PTB0 at the top of the Paratirolites limestone was defined by Ref. [3] based on the conventional boundary definition at that time.
The PTB1 was placed at the base of the Microbial unit due to the finding of H. parvus by Refs. [3,6,7,16], which was also reported in Refs. [2,9,12,15].
The PTB2, at the base of the platy limestone just above the microbial unit, was reported by Refs. [4,5,8,11,17,21].
The PTB3, inside, at 0.9 m above the base of the microbial unit, was reported by Ref. [20], confirmed by Ref. [14], and adopted by Ref. [22].
This demonstrates that different working groups studying the Abadeh section (Iran) Permian–Triassic Boundary interval, despite using identical proxies/markers (conodonts), came to different results and have failed to solve this problem for more than 20 years. Until now, differing levels for the Permian–Triassic Boundary at Abadeh remain in the literature. We identify several potential reasons for these differing results; among them, especially relevant are sampling (spacing, amount, facies selection), determination and interpretation of results (determination of species, application of special methods), and insufficient literature review. The question concerning the exact position of the Permian–Triassic Boundary at the Abadeh section, Iran, still needs to be solved. Due to the finding of Hindeodus parvus at the base of the microbial unit (PTB1), which, in our opinion, is a true Hindeodus parvus, we regard PTB1 as the true and real position of the PTB at the Abadeh section. Boundaries PTB2 and PTB3 are delayed (higher up-section) with respect to PTB1; possible explanations might be inappropriate sampling and/or application of a method rejecting single-specimen interpretation. However, to reach a general agreement, further steps are necessary, and we recommend a more detailed definition of Hindeodus parvus.
Concerning the differing C. hauschkei zones, in our opinion, a conodont zone should only be indicated until its latest occurrence/appearance in a section. The artificial extension of (conodont) zones until the base of the next indicative zone should be avoided, as it indicates data where they do not exist.

Author Contributions

Conceptualization, formal analysis, investigation, writing—original draft preparation, writing—review and editing, A.B. and M.H.; visualization, A.B. All authors have read and agreed to the published version of the manuscript.

Funding

This research received no external funding.

Data Availability Statement

No new data were created or analyzed in this study. Data sharing is not applicable to this article.

Acknowledgments

This subject has been presented by A.B. as a virtual Zoom talk at the 5th International Congress on Earth and Geological Sciences, 23–24 July 2026, Vienna, Austria, thanks to Jack Harrison. ICEGS-2026 Program Director, who invited us.

Conflicts of Interest

The authors declare no conflicts of interest.

References

  1. Chen, Z.Q.; Algeo, T.J.; Bottjer, D.J. Global review of the Permian–Triassic mass extinction and subsequent recovery: Part I. Earth-Sci. Rev. 2014, 137, 1–5. [Google Scholar] [CrossRef] [Scilit]
  2. Yin, H.; Zhang, K.; Tong, J.; Yang, Z.; Wu, S. The Global Stratotype Section and Point (GSSP) of the Permian-Triassic Boundary. Episodes 2001, 24, 102–114. [Google Scholar] [CrossRef] [Scilit]
  3. Taraz, H.; Golshani, F.; Nakazawa, K.; Shimura, D.; Bando, Y.; Ishii, K.-I.; Maurata, M.; Okimura, Y.; Sakamura, S.; Nakamura, K.; et al. The Permian and the Lower Triassic Systems in Abadeh Region, Central Iran. Mem. Fac. Sci. Kyoto Univ. Ser. Geol. Mineral. 1981, 47, 62–133. [Google Scholar]
  4. Kozur, H.W. Pelagic uppermost Permian and the Permian-Triassic boundary in Iran. Part 1: Taxonomy. Hallesches Jahrb. Geowiss. 2004, 18, 39–68. [Google Scholar]
  5. Kozur, H.W. Pelagic uppermost Permian and the Permian-Triassic boundary conodonts of Iran. Part II: Investigated sections and evaluation of the conodont faunas. Hallesches Jahrb. Geowiss. 2005, 19, 49–86. [Google Scholar]
  6. Horacek, M.; Richoz, S.; Brandner, R.; Krystyn, L.; Spötl, C. Evidence for recurrent changes in Lower Triassic oceanic circulation of the Tethys: The δ13C record from marine sections in Iran. Palaeogeogr. Palaeoclimatol. Palaeoecol. 2007, 252, 355–369. [Google Scholar] [CrossRef] [Scilit]
  7. Richoz, S.; Krystyn, L.; Baud, A.; Brandner, R.; Horacek, M.; Mohtat-Aghai, P. Permian-Triassic boundary interval in the Middle East (Iran and N. Oman): Progressive environmental change from detailed carbonate carbon isotope marine curve and sedimentary evolution. J. Asian Earth Sci. 2010, 39, 236–253. [Google Scholar] [CrossRef] [Scilit]
  8. Shen, S.Z.; Mei, S.L. Lopingian (Late Permian) high-resolution conodont biostratigraphic in Iran with comparison to South China zonation. Geol. J. 2010, 45, 135–161. [Google Scholar] [CrossRef] [Scilit]
  9. Dudás, F.Ö.; Yuan, D.X.; Shen, S.Z.; Bowring, S.A. A conodont-based revision of the 87Sr/86Sr seawater curve across the Permian-Triassic boundary. Palaeogeogr. Palaeoclimatol. Palaeoecol. 2017, 470, 40–53. [Google Scholar] [CrossRef] [Scilit]
  10. Kershaw, S.; Crasquin, S.; Li, Y.; Collin, P.Y.; Forel, M.B.; Mu, X.; Baud, A.; Wang, Y.; Xie, S.; Maurer, F.; et al. Microbialites and global environmental change across the Permian–Triassic boundary: A synthesis. Geobiology 2012, 10, 25–47. [Google Scholar] [CrossRef] [Scilit]
  11. Chen, J.; Shen, S.-Z.; Zhang, Y.-C.; Angiolini, L.; Gorgij, M.N.; Crippa, G.; Wang, W.; Zhang, H.; Yuan, D.-X.; Li, X.-H.; et al. Abrupt warming in the latest Permian detected using high-resolution in situ oxygen isotopes of conodont apatite from Abadeh, Central Iran. Palaeogeogr. Palaeoclimatol. Palaeoecol. 2020, 560, 109973. [Google Scholar] [CrossRef] [Scilit]
  12. Baud, A.; Richoz, S.; Brandner, R.; Krystyn, L.; Heindel, K.; Mohtat, T.; Mohtat-Aghai, P.; Horacek, M. Sponge takeover from End-Permian mass extinction to early Induan time: Records in Central Iran microbial buildups. Front. Earth Sci. 2021, 9, 586210. [Google Scholar] [CrossRef] [Scilit]
  13. Stampfli, G.-M.; Borel, G.-D. A plate tectonic model for the Paleozoic and Mesozoic constrained by dynamic plate boundaries and restored synthetic oceanic isochrons. Earth Planet. Sci. Lett. 2002, 196, 17–33. [Google Scholar] [CrossRef] [Scilit]
  14. Yuan, D.-X.; Zhang, Y.-C.; Gorgij, M.N.; Zhang, H.; Angiolini, L.; Crippa, G.; Chen, J.; Shen, S.-Z. Lopingian biotic crisis and global correlation: Evidence from the Abadeh section, central Iran. Palaeogeogr. Palaeoclimatol. Palaeoecol. 2025, 677, 113211. [Google Scholar] [CrossRef] [Scilit]
  15. Yin, H.; Tong, J. Multidisciplinary high-resolution correlation of the Permian-Triassic boundary: Palaeogeography. Palaeoclimatol. Palaeoecol. 1998, 143, 199–212. [Google Scholar] [CrossRef] [Scilit]
  16. Gallet, Y.; Krystyn, L.; Besse, J.; Saidi, A.; Ricou, L.E. New constraints on the Upper Permian and Lower Triassic geomagnetic polarity timescale from the Abadeh section (central Iran). J. Geophys. Res.-Solid Earth 2000, 105, 2805–2815. [Google Scholar] [CrossRef] [Scilit]
  17. Korte, C.; Kozur, H.W.; Joachimski, M.M.; Strauss, H.; Veizer, J.; Schwark, L. Carbon, sulfur, oxygen and strontium isotope records, organic geochemistry and biostratigraphy across the Permian/Triassic boundary in Abadeh, Iran. Int. J. Earth Sci. 2004, 9, 565–581. [Google Scholar] [CrossRef] [Scilit]
  18. Horacek, M.; Krystyn, L.; Baud, A. Comment to Chen et al., 2020: Abrupt warming in the latest Permian detected using high-resolution in situ oxygen isotopes of conodont apatite from Abadeh, Central Iran: Importance of correct stratigraphic correlation, reporting of existing data and their scientific interpretation. Permophiles 2021, 70, 33–36. [Google Scholar]
  19. Horacek, M.; Krystyn, L.; Baud, A. Short Note about ethical publishing—And about the temperature change around the Permian-Triassic Boundary (PTB). Permophiles 2021, 71, 43–45. [Google Scholar]
  20. Chen, J.; Yuan, D.X.; Shen, S.Z. Reply to the Comment of Horacek et al. (2021) on the Permian-Triassic boundary at the Abadeh section, central Iran. Permophiles 2021, 71, 39–43. [Google Scholar]
  21. Bagherpour, B.; Soleimani, M.; Faghih, A. Morphological diversity of microbialites and the significance of sponge remains in the Permian Triassic transition interval from Hambast Range, Central Iran. Adv. Appl. Geol. 2024, 14, 350–369. [Google Scholar]
  22. Bagherpour, B.; Ardakani, O.H.; Herwartz, D.; Grasby, S.E. Habitability at the edge of the redox boundary during the Permian–Triassic mass extinction. Sci. Rep. 2026, 16, 12469. [Google Scholar] [CrossRef] [Scilit]
  23. Kozur, H.W. The conodonts Hindeodus, Isarcicella and Sweetohindeodus in the uppermost Permian and lowermost Triassic. Geol. Croat. 1996, 49, 81–115. [Google Scholar]
Figure 1. Global 250 My Paleo-Map modified after [14], in red line depicts the South Cimmerian margin of the Neotethys within the Iranian microplate. The arrow denotes the approximate position of Abadeh. Radius of the Earth: 6371 km; half circumference ~20,037 km.
Geosciences 16 00381 g001
Figure 2. (Left) side: Central Iran sketch map with Abadeh/Kuh-e-Hambast section indicated; (right) side: Field view of the Abadeh/Kuh-e-Hambast Permian–Triassic section with km-long outcrops.
Geosciences 16 00381 g002
Figure 3. Details of the Kuh-e-Hambast section (Abadeh area) with the succession of the Paratirolites limestone, up to 12 m thick, overlain by the boundary shales, the microbial unit and the platy limestone continuing upwards. Person on left side, ca. 1.8 m. EPME = end-Permian mass extinction.
Geosciences 16 00381 g003
Figure 4. PTB interval after Ref. [9] (Figure S4B modified), with the PTB shown at the base of the microbial unit, which is reported with a thickness of 0.6 m. Note that the Boundary Clay is not shown in this figure, see Ref. [9]; therefore, PTB0 is the same as PTB1. Also note that the microbialite is shown as reduced in thickness in this fig. from Ref. [9] (see the size of the “microbial unit” drawn by us as comparison) and that the base of the Elikah Formation in Ref. [9] was placed at the base of the platy limestone instead above the Paratirolites Beds.
Geosciences 16 00381 g004
Figure 5. (1) Abadeh section PTB detail modified after Refs. [4,5]; (2) Abadeh section PTB detail modified after Korte et al. (2004) [17]. Black line indicates EPME, red line indicates PTB (=PTB2) as identified by Kozur [5] and Korte et al. [17]. Both boundaries are more or less identical. For details, refer to the text. 5: hauschkei Zone, 6: praeparvus-meishanensis Zone, 7: Merillima ultima Zone. EPME = end-Permian mass extinction, H. = Hindeodus, I. = Isarcicella. For details see Refs. [4,5,17].
Geosciences 16 00381 g005
Figure 6. Abadeh PTB detailed outcrop view. This outcrop corresponds to the ones examined by the majority of authors who have worked on PTB in this area. Into this photo we have projected the first occurance (FO) of H. parvus according to Kozur 2004, 2005 [4,5] = PTB 2 defined in Refs. [4,5], which is located, due to the reported thickness of the microbialite by refs. [4,5] in this photo within the microbialites. We wish to clarify that this outcrop does not correspond to the one reported by Kozur [4,5] and Korte [17], as their “first occurance (FO) of parvus is, as described, clearly at the base of platy limestone and not within the microbialites. PTB 0 Boundary as reported by Ref. [3]. PTB 1 as reported by Refs. [6,7,15]. For details, refer to the text. EPME = end-Permian mass extinction, FO = first occurrence.
Geosciences 16 00381 g006
Figure 7. (1) Abadeh PTB interval in modified Figure 9C of Ref. [10], with the boundary below the microbial unit, to which [11] wrongly refers; (2) Abadeh PTB interval after Ref. [11], modified Figure 2B, with the boundary above the microbial unit. Dashed line: position of the end-Permian mass extinction. H. = Hindeodus, I. = Isarcicella, C. = Clarkina, Fm. = Formation. Red curve shows carbon isotope evolution, black curve (with symbols in different colours) shows oxygen isotope evolution translated into temperature across the PTB-interval, see Ref. [11].
Geosciences 16 00381 g007
Figure 8. (1) and (2) photographs by Ref. [18], Figures 1 and 2 modified, showing the “old” PTB2 of Ref. [11] at 0 m, and “new” [20], PTB3 in the middle of the Abadeh “Microbialite Bed” (=microbial unit). EPME = end-Permian mass extinction, FO = first occurrence.
Geosciences 16 00381 g008
Figure 9. Modified high-resolution stratigraphic section of the Permian–Triassic microbialites interval in the Hambast section after Figure 3 in Ref. [21]. EPME and PTB2 are indicated. EPME = end-Permian mass extinction, C. = Clarkina, H. = Hindeodus.
Geosciences 16 00381 g009
Figure 10. PTB interval at Abadeh after Figure 2B of Ref. [14], modified and completed, with EPME (representing PTB0) on top of “Unit 7” (Paratirolites Limestone) at the base of the boundary clay, PTB2 of Ref. [11] on top of the microbial unit, and PTB3 ([14,20] within the microbialite unit. EPME = end-Permian mass extinction.
Geosciences 16 00381 g010
Figure 11. Abadeh PTB-interval after Figure 2a of Ref. [22], modified and completed, with EPME, PTB1, PTB2 and PTB3. EPME = end-Permian mass extinction, Fm. = Formation.
Geosciences 16 00381 g011
Figure 12. Stratigraphic sketch showing the four proposed Permian–Triassic Boundary positions in the Hambast section, Abadeh, Iran, with PTB1 to PTB3 according to the lowest position where Hindeodus parvus was identified. For details, refer to the text. EPME = end-Permian mass extinction, Form. = Formation, B.C. = boundary clay. For details concerning the microbial unit see ref. [12]. The Abadeh carbon isotope curve is after Figure 5 in ref. [7].
Geosciences 16 00381 g012
Disclaimer/Publisher’s Note: The statements, opinions and data contained in all publications are solely those of the individual author(s) and contributor(s) and not of MDPI and/or the editor(s). MDPI and/or the editor(s) disclaim responsibility for any injury to people or property resulting from any ideas, methods, instructions or products referred to in the content.