Review

Electrical Responses of Rock Masses: Conductive Network Evolution, Damage Characterization and Instability Precursors


1
School of Resources and Civil Engineering, Northeastern University, Shenyang 110819, China
2
School of Engineering, University of Tasmania, Hobart, TAS 7005, Australia
*
Author to whom correspondence should be addressed.
Geosciences 2026, 16(9), 377; https://doi.org/10.3390/geosciences16090377
Submission received: 12 August 2026 / Revised: 10 September 2026 / Accepted: 15 September 2026 / Published: 17 September 2026
(This article belongs to the Section Geomechanics)

Abstract

Variations in the electrical signals of rock masses can reflect the development of internal fractures, pore fluid migration, and damage evolution, showing broad potential for the monitoring and early warning of engineering rock mass disasters. In recent years, with the continuous development of electrical resistivity tomography, time-lapse electrical monitoring, digital rock technology, and multiscale numerical simulation, research on rock mass electrical properties has gradually expanded from traditional resistivity measurements to fracture evolution characterization, damage identification, and instability precursor prediction. However, the electrical responses of rock masses are governed by multiple interacting factors, and different physical processes may produce similar or even opposing electrical anomalies. Existing studies have largely addressed conduction theories, monitoring methods, and engineering applications as separate aspects, while a systematic understanding of the mechanisms governing rock-mass electrical responses under different conditions, as well as their intrinsic relationships with conductive network evolution, remains lacking. This review is mainly based on 153 representative publications indexed in the Web of Science Core Collection from 1998 to 2026 and systematically summarizes research progress on the electrical responses of rock masses over nearly three decades. With the conductive network as the central theme, this review comprehensively analyzes multiphase conduction theories, electrical monitoring techniques, conductive network evolution mechanisms, and engineering applications. Rock mass electrical responses originate from the charge transport process within the internal multiphase conductive network. The propagation of fractures, variation of pore structures, fluid migration, and multi-physics coupling continuously change the number, connectivity, and spatial distribution of conductive paths, thereby resulting in dynamic variations of electrical parameters such as resistivity. As rock masses evolve from stable damage to critical instability, the conductive network gradually shifts from local adjustment to rapid reconstruction and critical connectivity, accompanied by abrupt changes in resistivity, enhanced electrical anisotropy, and temporal anomalies. Even during quiet periods of acoustic emission, resistivity can continuously reflect crack propagation and conductive network reconstruction, providing complementary information for the identification of instability precursors. The main contribution of this review is to link the multiphase conduction mechanisms, electrical monitoring methods, resistivity variation characteristics, and damage-to-instability processes of rock masses and to systematically summarize the intrinsic relationships among charge transport, conductive network reconstruction, macroscopic electrical responses, and rock damage and instability. On this basis, an integrated analytical framework from conduction mechanisms to damage characterization and instability precursor identification is established, providing new insights into establishing quantitative relationships among conductive network structure, charge transport processes, and electrical responses, as well as developing electrical theories and intelligent monitoring and early-warning methods for rock masses under multiscale and multi-physics coupling conditions.

1. Introduction

Rock mass is a complex multiphase medium composed of a solid skeleton, pore–fracture structures, and pore fluids. Its mechanical behavior and electrical responses are simultaneously affected by factors such as pore structure, fracture connectivity, fluid state, temperature, and stress [1,2,3]. During the long-term service of engineering rock masses, pre-existing defects continuously evolve, while microcracks progressively initiate, propagate, and coalesce. These processes cause changes in pore structure, fluid redistribution, and reconstruction of conductive paths, ultimately leading to progressive damage, strength degradation, and overall instability [4,5]. The damage evolution of rock masses is a process involving continuous adjustment and reconstruction of the internal conductive network, while the electrical response is the macroscopic manifestation of this process. Therefore, revealing the intrinsic relationship between conductive network evolution and electrical responses is fundamental to rock-mass damage identification, instability prediction, and engineering hazard early warning.
At present, rock-mass damage monitoring commonly employs techniques such as stress–strain measurement, acoustic emission (AE), microseismic monitoring, and optical observation to analyze the progressive failure process of rock masses from the perspectives of macroscopic deformation, microcrack propagation, and energy release [6]. However, different monitoring methods usually reflect only certain aspects of damage evolution. For example, AE is sensitive to high-energy transient fracture events, but when rock masses undergo creep deformation or low-energy crack propagation, or are in a high-water-content state, the monitoring signals may exhibit a quiet period, making it difficult to continuously identify latent damage prior to instability [7]. In contrast, electrical responses can reflect conductive network evolution caused by changes in pore structure, fracture connectivity, and fluid migration. Accordingly, research on electrical responses has become an important research direction for rock-mass damage identification and hazard early warning.
However, the electrical responses of rock masses are not controlled by a single factor but result from the combined effects of pore–fracture structure, fluid occurrence state, and external environmental conditions. Among these factors, dynamic changes in water saturation directly alter the distribution and connectivity of pore fluids, and their quantitative characterization is important for understanding charge transport and electrical responses in porous media [8]. Meanwhile, factors such as crack propagation, stress, and temperature continuously alter the pore–fracture structure and conductive network, such that different physical processes may produce similar electrical changes, whereas the electrical response to the same influencing factor may exhibit different or even opposite response characteristics under different conditions and at different evolutionary stages [9,10,11]. For example, the propagation of dry cracks and the compaction of pores and fractures under stress may both hinder charge transport, resulting in an increase in resistivity. In contrast, the progressive connection of water-bearing fractures or an increase in water saturation enhances the connectivity of pore fluids, thereby decreasing resistivity [12,13]. Within a relatively low temperature range, the enhanced ionic mobility induced by heating also decreases the resistivity of rock masses [14]. When loading progresses into dilatancy and near-instability, or when a further increase in temperature causes water loss and the development of thermal cracks, the conductive network and its controlling mechanisms change accordingly, resulting in different resistivity evolution characteristics [15,16]. Therefore, it is difficult to accurately identify the internal structural evolution and damage state of rock masses based solely on the direction or magnitude of resistivity changes. This is also a key challenge in the quantitative interpretation of electrical responses and damage identification in complex rock masses.
To further clarify the relationships between different physical processes and the electrical responses of rock masses, existing studies have mainly identified and constrained different influencing factors from the perspectives of conduction mechanisms, spatiotemporal electrical monitoring, numerical simulation, and multisource information integration. The classical Archie model establishes a quantitative relationship among rock resistivity, porosity, and pore-water resistivity. Its extended models further consider the effects of different conductive phases and their connectivity, providing a physical and quantitative basis for analyzing the contributions of different conductive components to the electrical responses of rock masses [17,18]. Electrical resistivity tomography (ERT) obtains the spatial distribution of resistivity within rock masses through numerical inversion and can be used to identify the distribution characteristics of fractures, water-bearing zones, and conductive paths [19,20]. Time-lapse electrical resistivity tomography (time-lapse ERT) further characterizes the dynamic evolution of conductive networks during fracture development and fluid migration by conducting repeated measurements with a fixed observation system and analyzing temporal changes in the resistivity field [21,22].
Digital rock and numerical simulations reconstruct pore–fracture structures and the distribution of conductive phases and vary parameters such as fracture geometry and water saturation to analyze the effects of different structural and physical parameters on electric-field distribution and effective resistivity [23]. In addition, integrating resistivity with monitoring information from AE, X-ray computed tomography (CT), and digital image correlation (DIC) enables complementary analysis and cross-validation from the perspectives of conductive network changes, crack activity, and deformation localization, thereby improving the physical interpretation of complex electrical anomalies and the capability for damage identification [24,25].
With the continuous development of electrical resistivity tomography, time-lapse electrical monitoring, digital rock, multiscale numerical simulation, and artificial intelligence [26], research on the electrical properties of rock masses has gradually expanded from the early focus on static relationships between resistivity and physical properties such as porosity and water saturation to fracture evolution characterization, damage identification, conductive network evolution mechanisms under multi-physics coupling conditions, quantitative characterization of electrical responses, and instability precursor identification.
Publications indexed in the Web of Science Core Collection formed the primary dataset for statistical analysis of research progress, with the search period covering 1998–2026. The literature search mainly focused on topics related to the electrical properties and monitoring of rocks and rock masses, including electrical resistivity, electrical conductivity, electrical resistivity tomography, digital rock, fracture evolution, damage, and instability precursors. The retrieved literature was sequentially screened based on titles, abstracts, and full texts. Studies directly related to conduction mechanisms of rock masses, electrical monitoring techniques, resistivity evolution, damage characterization, and instability precursor identification were retained, while duplicate publications and studies weakly related to the electrical responses of rocks and rock masses were excluded. After screening, a total of 153 publications were included in the statistical analysis of research progress and the review. In addition, six classical studies published before 1998 were cited to trace the development of fundamental rock conduction theories. Because their publication years are relatively scattered, they were not included in the stage-based statistics presented in Table 1. As shown in Table 1, related studies have increased rapidly since 2018, and the research focus has gradually expanded from oil and gas reservoir evaluation and resistivity logging to engineering rock-mass damage monitoring, hazard early warning, and intelligent identification. Research on rock-mass electrical properties is shifting from conventional physical property testing toward dynamic monitoring of conductive networks and catastrophic failure prediction.
Existing studies on the electrical responses of rock masses have mainly focused separately on conduction theory, monitoring methods, and engineering applications, while a systematic understanding of the intrinsic relationships among conductive network evolution, electrical responses, and rock-mass damage and instability is still lacking. A theoretical framework under cross-scale and multi-physics coupling conditions has also not yet been established. These limitations increase the uncertainty in identifying the physical origins of complex electrical anomalies and also restrict the further application of electrical monitoring to quantitative damage evaluation and instability prediction. Accordingly, with the conductive network as the central theme, this review systematically summarizes research progress in the fundamental theories of multiphase conduction in rock masses, electrical monitoring techniques, conductive network evolution mechanisms under multi-physics coupling conditions, and electrical responses throughout the rock-mass damage process and instability precursor identification. It further examines the intrinsic relationships among charge transport, conductive network reconstruction, macroscopic electrical responses, rock-mass damage evolution, and instability. On this basis, the above studies are integrated into a common framework covering formation mechanisms, observation methods, evolution characteristics, and engineering applications, which can provide a reference for damage identification, hazard early warning, and intelligent monitoring of complex rock masses.

2. Theoretical Foundations of Conductive Network Formation in Rock Masses

2.1. Formation of Conductive Networks and Electrical Response Parameters

The electrical response of rock masses is not controlled by a single conductive component but results from the combined effects of multiple conductive components and charge transport processes. In natural rock masses, the mineral skeleton, pore–fracture structures, pore fluids, and mineral interfaces form a complex multiphase conductive system. The spatial distribution, connectivity, and interactions of these components affect current flow paths and consequently the macroscopic electrical response. Therefore, understanding how conductive networks form, evolve, and reconstruct is necessary to explain the electrical behavior of rock masses and develop the corresponding theory.
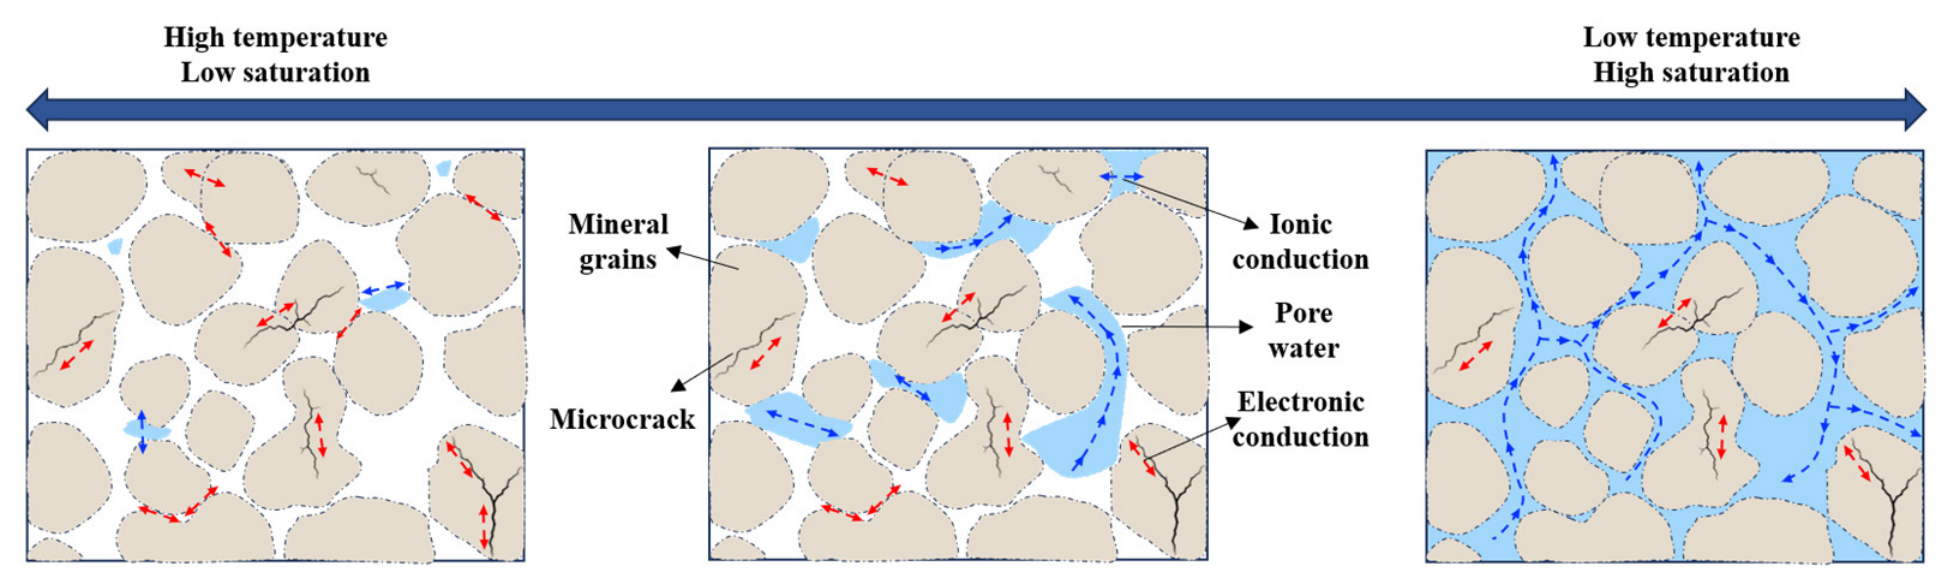
From the perspective of charge transport mechanisms, electrical conduction in rock masses mainly occurs through two fundamental forms, ionic conduction and electronic conduction, as shown in Figure 1. Ionic conduction mainly depends on ion migration in pore and fracture fluids and dominates under water-bearing conditions at room temperature. Electronic conduction mainly occurs through the solid skeleton composed of conductive minerals such as graphite and pyrite and is related to mineral composition and connectivity [27,28]. As water saturation decreases or the content of conductive minerals increases, the contribution of pore-fluid conduction gradually decreases, while mineral-skeleton conduction, grain-contact conduction, and mineral-interface conduction become increasingly important [29,30]. For complex rock masses, the two conduction mechanisms do not act independently but jointly form the conductive network and affect the overall electrical response by changing charge transport efficiency.
From the perspective of macroscopic characterization, the electrical responses of rock masses reflect changes in their internal conductive network structures. Resistivity and its normalized parameters are mainly used to characterize the connectivity and conductive capacity of conductive paths and are widely used in rock-mass damage monitoring and catastrophic failure early warning. Impedance and complex resistivity characterize mineral-interface polarization, charge accumulation, and microstructural characteristics of multiphase media through frequency responses and can more sensitively reflect complex conduction mechanisms [31]. Self-potential is sensitive to local electric-field anomalies induced by seepage, temperature changes, and crack propagation and can be used to reflect the dynamic adjustment of conductive networks under fluid migration and multi-physics coupling [32,33,34]. Although these electrical parameters differ in their testing principles and applicable conditions, they all characterize the conductive network and charge transport processes within rock masses.
The conductive network formed by different conductive components is the key to understanding the electrical conduction mechanisms of rock masses. The measured electrical parameters can be regarded as macroscopic manifestations of the spatial structure of the conductive network and the internal charge transport processes. The formation, connectivity changes, and dynamic evolution of the conductive network jointly determine the electrical response characteristics of rock masses and provide a relatively unified theoretical framework for the subsequent establishment of resistivity models, development of electrical monitoring techniques, and analysis of rock-mass damage evolution mechanisms.

2.2. Pore-Fluid Conduction Theory and the Classical Archie Model

Pore fluids provide the main path for charge transport in natural rock masses. Their contribution to conduction depends largely on the connectivity of the fluid-filled pore space. When the pores contain an electrolyte solution, current flows mainly along connected fluid channels. Pore shape, connectivity, and the tortuosity of these channels affect the bulk resistivity of the rock mass [35]. How pore structure controls the electrical response has therefore long been a basic question in rock conduction theory. It also provides the theoretical basis for understanding the formation and evolution of conductive networks.
The classical Archie model originated from this line of research. Archie tested clean, fully saturated sandstones and obtained an empirical relationship between rock resistivity, porosity, and pore-water resistivity, as expressed in Equation (1). He also introduced the formation factor to describe the effect of pore structure on electrical conduction [17]. More importantly, the model links pore geometry with current paths and macroscopic resistivity. Changes in pore structure alter the connectivity and tortuosity of fluid paths. This changes current flow and is reflected by differences in rock resistivity. Subsequent studies on digital rock, electrical imaging, and multiphase conduction models have largely been developed on this theoretical basis.
F = R o R w = 1 φ m
where F is the formation factor; Ro and Rw are the resistivities of saturated rock and pore water, respectively; φ is the porosity, and m is the cementation exponent.
Winsauer et al. explained the physical meaning of the formation factor from the perspective of pore geometry and pointed out that rock conductivity is controlled not only by porosity but also by the effective conductive cross-sectional area and the tortuosity of pore paths [36]. The effective conductive cross-sectional area determines the effective connectivity of the conductive network, while pore-path tortuosity reflects the complexity of current transport paths. Together, they affect the transport efficiency of the conductive network, as expressed in Equation (2). Compared with the classical Archie model, which mainly focuses on the amount of pore space, the pore-geometric conduction theory further considers the effects of pore connectivity and conductive-path structure on the electrical responses of rock masses. Accordingly, the formation factor is no longer merely an empirical parameter related to porosity but can also be used to characterize the connectivity and path characteristics of pore conductive paths.
F = R R = L / L A / A = T ψ
where T is the tortuosity of the pore channels, and ψ is the ratio of the effective conductive cross-sectional area to the total cross-sectional area.
For partially saturated rocks, Archie further introduced the resistivity index (I) to describe the effect of water saturation on rock resistivity, as expressed in Equation (3).
I = R t R o = S w n
where I denotes the resistivity index; Rt is the rock resistivity at a water saturation of Sw; Sw denotes the water saturation; and n is the saturation exponent.
Considering the combined effects of porosity and water saturation on electrical conduction, the overall electrical conductivity of the rock can be further expressed by Equation (4):
σ = σ w φ m S w n
where σ denotes the overall electrical conductivity of the rock, and σw denotes the electrical conductivity of the pore water.
The classical Archie model establishes a quantitative relationship between pore-fluid conduction and the macroscopic resistivity of rocks, while the pore-geometric conduction theory further reveals the effects of conductive network connectivity and charge transport paths on the electrical responses of rock masses. The two theories characterize the main mechanisms controlling rock conductivity from the perspectives of porosity and pore-structure characteristics, respectively, and provide a theoretical basis for understanding the mechanisms of electrical response changes in rock masses during crack propagation and pore compaction.

2.3. Extensions of the Archie Model Toward Multiphase Conductive Networks

The classical Archie model is based on the assumptions of clean sandstone, fully saturated pores, and a nonconductive solid skeleton, with pore fluid regarded as the only conductive phase. Therefore, the overall electrical response of rock masses is mainly controlled by pore-fluid conduction. However, natural rock masses generally have complex mineral compositions and pore structures, and multiple conductive components may coexist. Conductive minerals, mineral interfaces, and adsorbed water can also take part in charge transport in addition to pore fluids. Rock conduction may therefore involve several conductive phases rather than only a single pore-fluid pathway [37,38,39]. In addition, the macroscopic electrical responses of rock masses depend not only on the composition of conductive phases, but also on the connectivity among different conductive paths. Percolation theory can be used to describe the critical process in which conductive paths evolve from local connectivity to overall percolation. When the conductive paths in pores or fractures have not yet reached the percolation threshold, current is mainly transported within locally connected regions. As fractures develop and the connectivity of conductive paths increases, a continuous conductive network spanning the medium can form once the percolation threshold is reached, thereby causing changes in the electrical responses [40,41]. Therefore, the classical Archie model is difficult to use for a complete description of the electrical response of complex rock masses under such conditions. In essence, subsequent extensions of the model have progressively improved the physical description of multiphase conductive networks.
Waxman and Smits [42] developed the Waxman–Smits model to account for the pronounced interfacial conduction observed in shaly sandstone. They incorporated cation-exchange conduction by clay minerals into conventional conduction theory. The model includes the contributions of both pore fluids and clay surfaces and explains the relatively low resistivity of shaly sandstone. Clavier et al. [43] later proposed the Dual Water Model, as expressed in Equation (5). It separates pore water into bound water at clay surfaces and free water in the pore space. An equivalent water conductivity is then used to represent the contributions of these two types of water to the overall conductivity. Unlike the Archie model, which considers only pore-fluid conduction, both models incorporate clay surfaces and bound water into the analysis, allowing multiple conductive paths in shaly rocks to be described within a single model.
C t = S wT n C we F 0
where Ct is the total formation conductivity, SwT is the total water saturation, F0 is the formation factor of the clean formation medium, and Cwe is the equivalent water conductivity.
As the research scope expanded to complex rock masses containing conductive minerals such as graphite and pyrite, considering only pore-fluid conduction and mineral-interface conduction became insufficient to describe the overall electrical conduction characteristics. Glover et al. [18] proposed a dual-conductive-phase model, as expressed in Equations (6) and (7), in which both the solid skeleton and pore fluid are treated as conductive phases, and different parameters are used to describe the connectivity of the two conductive phases. This model no longer assumes that the solid skeleton is insulating but incorporates the conductive capacity and connectivity of both the solid and fluid phases into the same expression. Thus, rock conduction theory has gradually developed from single-phase conduction toward a multiphase conductive network theory, which better reflects the conduction characteristics of complex rock masses.
σr = σs(1 − φ)p + σwφm
p = log 1 φ m log 1 φ
where σr is the bulk electrical conductivity of the rock, σs is the electrical conductivity of the solid framework, σw is the pore-fluid electrical conductivity, and the exponents m and p characterize the conductive connectivity of the pore-fluid phase and the solid-framework phase, respectively.
From the classical Archie model to interfacial conduction models and then to the dual-conductive-phase model, modern conduction theory has gradually expanded from single pore-fluid conduction to the combined effects of multiple conductive phases. With the continuous inclusion of additional conductive components and the progressive improvement of conductive network and charge transport mechanisms, a theoretical basis has been established for subsequent studies on conductive network evolution under multi-physics coupling conditions, dynamic resistivity responses, and electrical monitoring of rock-mass damage.

3. Electrical Monitoring Techniques and Multiscale Characterization of Conductive Network Evolution

The electrical responses of rock masses are closely related to structural changes in the internal conductive network and charge transport processes. Therefore, accurate monitoring and quantitative characterization of conductive networks at different spatial scales are essential for understanding the electrical response characteristics of rock masses and conducting hazard monitoring and early warning. With the development of rock electrical theory, sensor technology, and numerical inversion methods, electrical monitoring techniques have gradually evolved from early single-point and single-parameter measurements [44,45] to multiscale monitoring methods such as two-dimensional, three-dimensional, and time-lapse resistivity imaging, achieving a transition from local parameter measurement to spatial structure imaging and from static-state identification to dynamic-process tracking [46,47]. In recent years, with continuous advances in multi-electrode acquisition systems, high-precision inversion algorithms, and automated continuous monitoring techniques, ERT has been applied to groundwater migration monitoring, fracture-network detection, slope stability evaluation, and hazard identification in underground engineering [48,49], enabling more intuitive characterization of the spatial distribution and evolution of conductive networks in rock masses under complex conditions.
Based on this, this section focuses on the multiscale characterization of conductive network evolution, reviews the development of ERT and time-lapse monitoring techniques, discusses the geoelectrical response characteristics of rock masses at different scales and their formation mechanisms, and analyzes the relationships among electrical monitoring results at different spatial scales, providing a technical basis for subsequent studies on the electrical responses and damage evolution of rock masses.

3.1. Electrical Resistivity Tomography for Conductive Network Imaging and Dynamic Monitoring

ERT is one of the most widely used techniques for electrical monitoring of rock masses. This method uses multi-electrode arrays to measure potential differences under different current-injection and measurement configurations and combines these data with numerical inversion to obtain the spatial distribution of resistivity within the medium, thereby identifying the structural characteristics of the conductive network [19]. Compared with conventional single-point resistivity testing, ERT extends parameter measurements at discrete locations to two-dimensional or three-dimensional imaging of electrical structures. The spatial distribution of resistivity anomalies can be used to identify the development of fractures, water-bearing zones, and conductive paths, providing an effective technical method for spatial characterization of conductive networks within complex rock masses [50].
From the perspective of physical mechanisms, ERT reflects the spatial distribution of conductive networks within rock masses and their variations. Processes such as fracture propagation, pore-fluid migration, and the development of weak structures may alter the spatial distribution and connectivity of conductive phases, thereby producing corresponding resistivity anomalies [51,52]. Combined with geological conditions and other monitoring information, ERT can be used to identify structures such as water-bearing fractures, dry fractures, and weak fractured zones, and three-dimensional imaging can characterize the spatial distribution and connectivity of electrical anomalies, providing a basis for analyzing the internal structure of rock masses and fluid migration processes. It should be noted that ERT imaging results are affected by inversion non-uniqueness, spatial resolution, and regularization methods. Smoothness constraints may cause the spatial extent of anomalies to spread and may make originally isolated conductive anomalies appear connected in the inversion results. Therefore, continuous low-resistivity anomalies do not necessarily correspond to truly connected fractures or conductive paths [49,53].
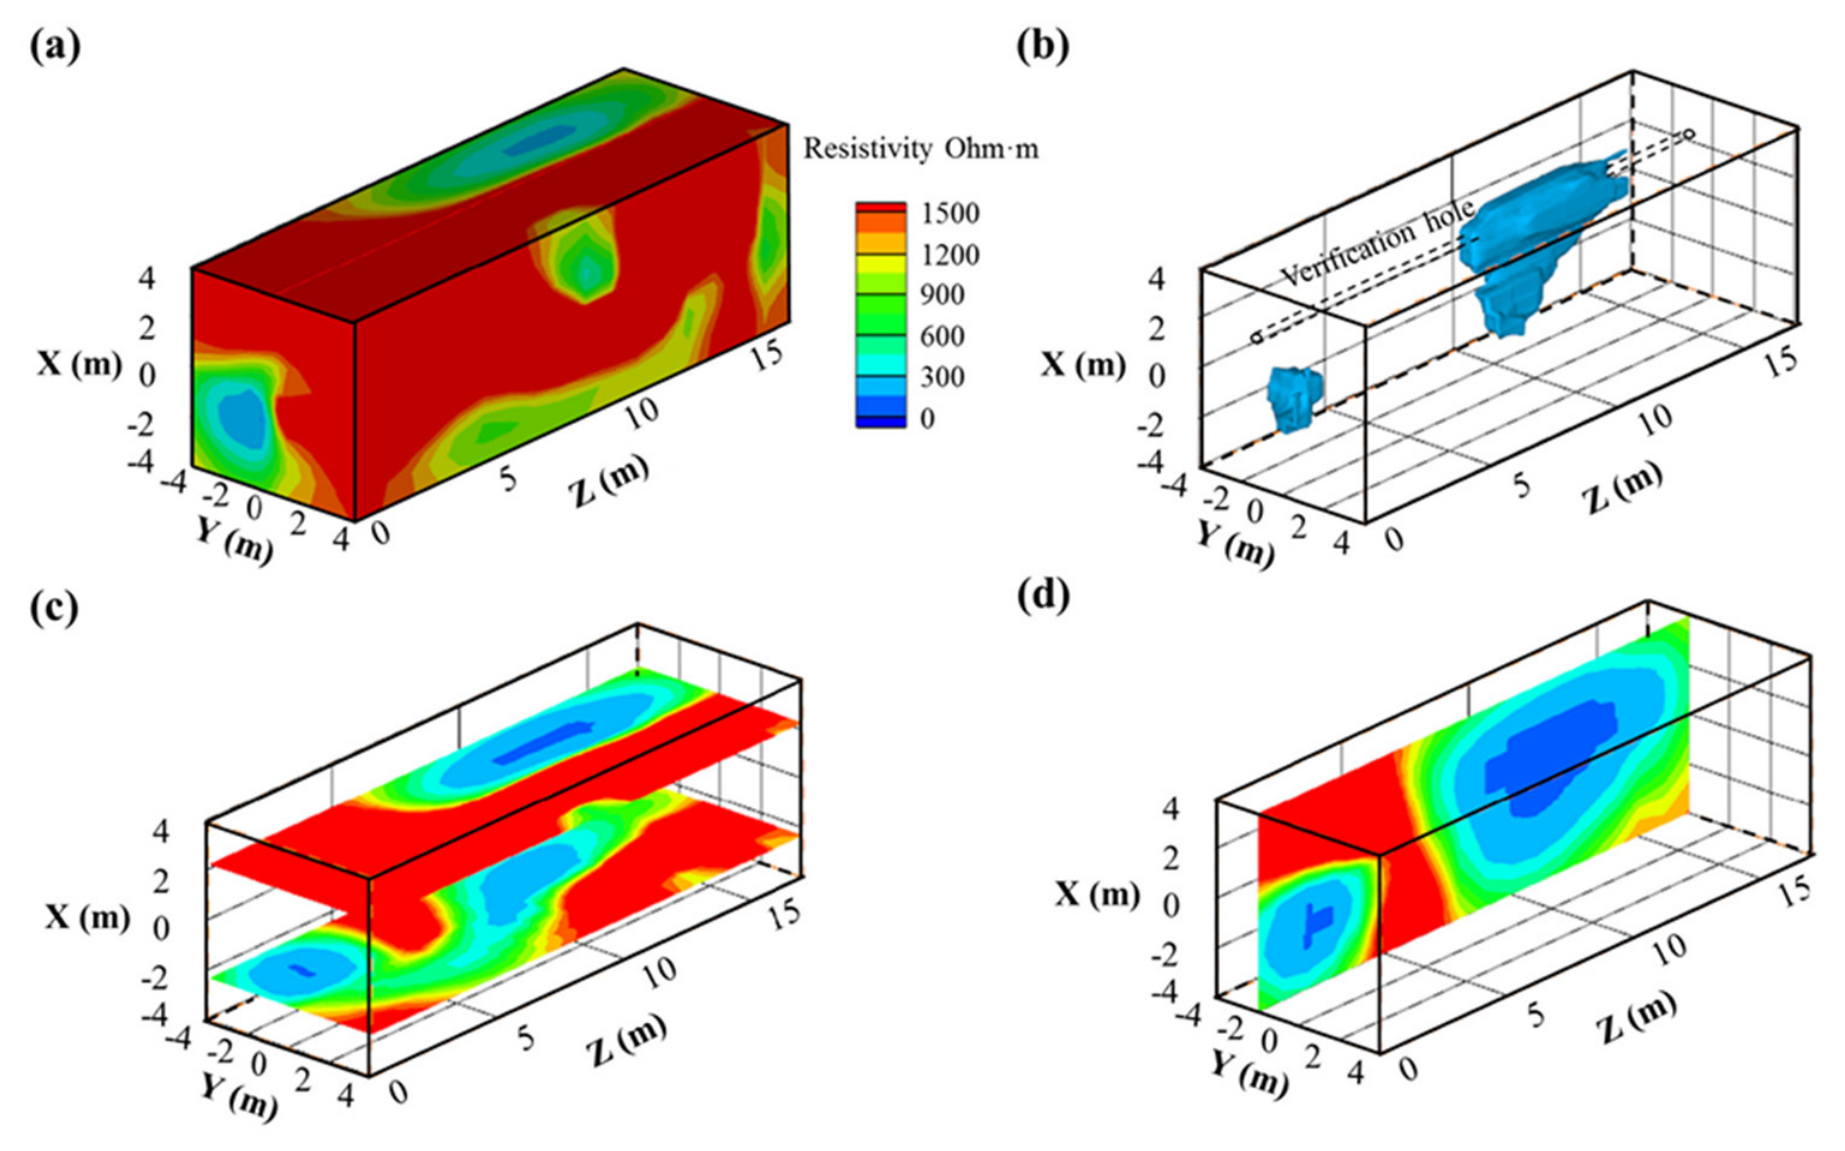
In recent years, the application of ERT in complex geological environments has continued to expand. Studies have shown that ERT can be used to identify the water-bearing state of fractures, preferential groundwater flow paths, and the spatial distribution of weak structures, while its imaging methods have gradually expanded from two-dimensional profiles to three-dimensional, cross-hole, and multiscale joint inversion. Labrecque et al. [54] analyzed the different electrical responses of dry and water-bearing fractures. Jomard et al. [55] and Ha et al. [56] used ERT to detect landslide structures and preferential groundwater flow paths, respectively. Robinson et al. [20], Zhang [57], and Pang et al. [58] conducted three-dimensional ERT and tunnel face–borehole joint inversion studies. As shown in Figure 2, the low-resistivity anomalies obtained from joint inversion exhibit relatively continuous spatial distributions in the three-dimensional model and slices in different directions and generally correspond to the locations of water-bearing anomalies revealed by verification boreholes. This indicates that the method can determine the location, extent, and connectivity of anomalous bodies from different observation directions. Compared with single-profile imaging, three-dimensional joint inversion improves the ability to identify the spatial distribution of preferential conductive paths and water-bearing anomalies. Combined with repeated observations, ERT can also be used to track resistivity changes caused by fracture development and fluid migration, providing a technical method for advance geological prediction, detection of water-bearing anomalies, and continuous electrical monitoring of complex rock masses.
Compared with conventional static ERT, time-lapse ERT uses a fixed monitoring system to conduct repeated measurements over time and analyzes temporal changes in the resistivity field to continuously monitor the dynamic evolution of conductive networks [21,22,59]. With the development of permanent electrodes, automated data acquisition, and rapid inversion techniques, the application of time-lapse ERT has gradually expanded from early monitoring of groundwater and tracer migration [60,61,62] to engineering applications such as monitoring the water-bearing state of railway subgrades [63], identifying freeze–thaw processes [64,65], and detecting dam leakage and internal erosion [66]. Electrical monitoring has therefore extended from static structure detection to the tracking of dynamic processes. Three-dimensional ERT mainly describes the spatial distribution of complex electrical structures. Time-lapse ERT, in contrast, records changes in the resistivity field over time through repeated measurements. Their combination can provide information on both the spatial distribution and evolution of conductive networks, providing a technical basis for analyzing electrical changes during rock-mass damage development and hazard evolution.

3.2. Multiscale Electrical Responses Governed by Conductive Network Evolution

The electrical responses of rock masses exhibit clear scale effects, and the monitoring targets, observation methods, and response characteristics differ considerably across spatial scales. However, whether at the laboratory scale in rock tests, the engineering scale in resistivity monitoring, or the regional scale in long-term geoelectrical observations, electrical anomalies are closely related to the evolution of conductive networks and charge transport processes within rock masses. Therefore, clarifying the common physical basis and corresponding relationships of electrical responses at different scales can strengthen the links among laboratory tests, engineering monitoring, and regional geoelectrical observations and provide a basis for cross-validation of monitoring results at different scales.
From the perspective of response mechanisms, the laboratory scale mainly focuses on changes in local conductive paths caused by crack initiation and propagation and pore-fluid migration [67,68]; the engineering scale focuses on spatial adjustments of conductive networks caused by fracture development, groundwater migration, and surrounding-rock damage [69,70,71]; and the regional scale reflects the relationships among tectonic stress accumulation, fluid activity, fault-zone evolution, and large-scale geoelectrical anomalies [72,73,74]. Although the spatial ranges, evolution periods, and observation methods of electrical responses differ across scales, the associated geological and mechanical processes ultimately alter the distribution of conductive media, the connectivity of conductive paths, and current transport paths. Therefore, electrical anomalies at different scales can be linked through the physical process of conductive network evolution.
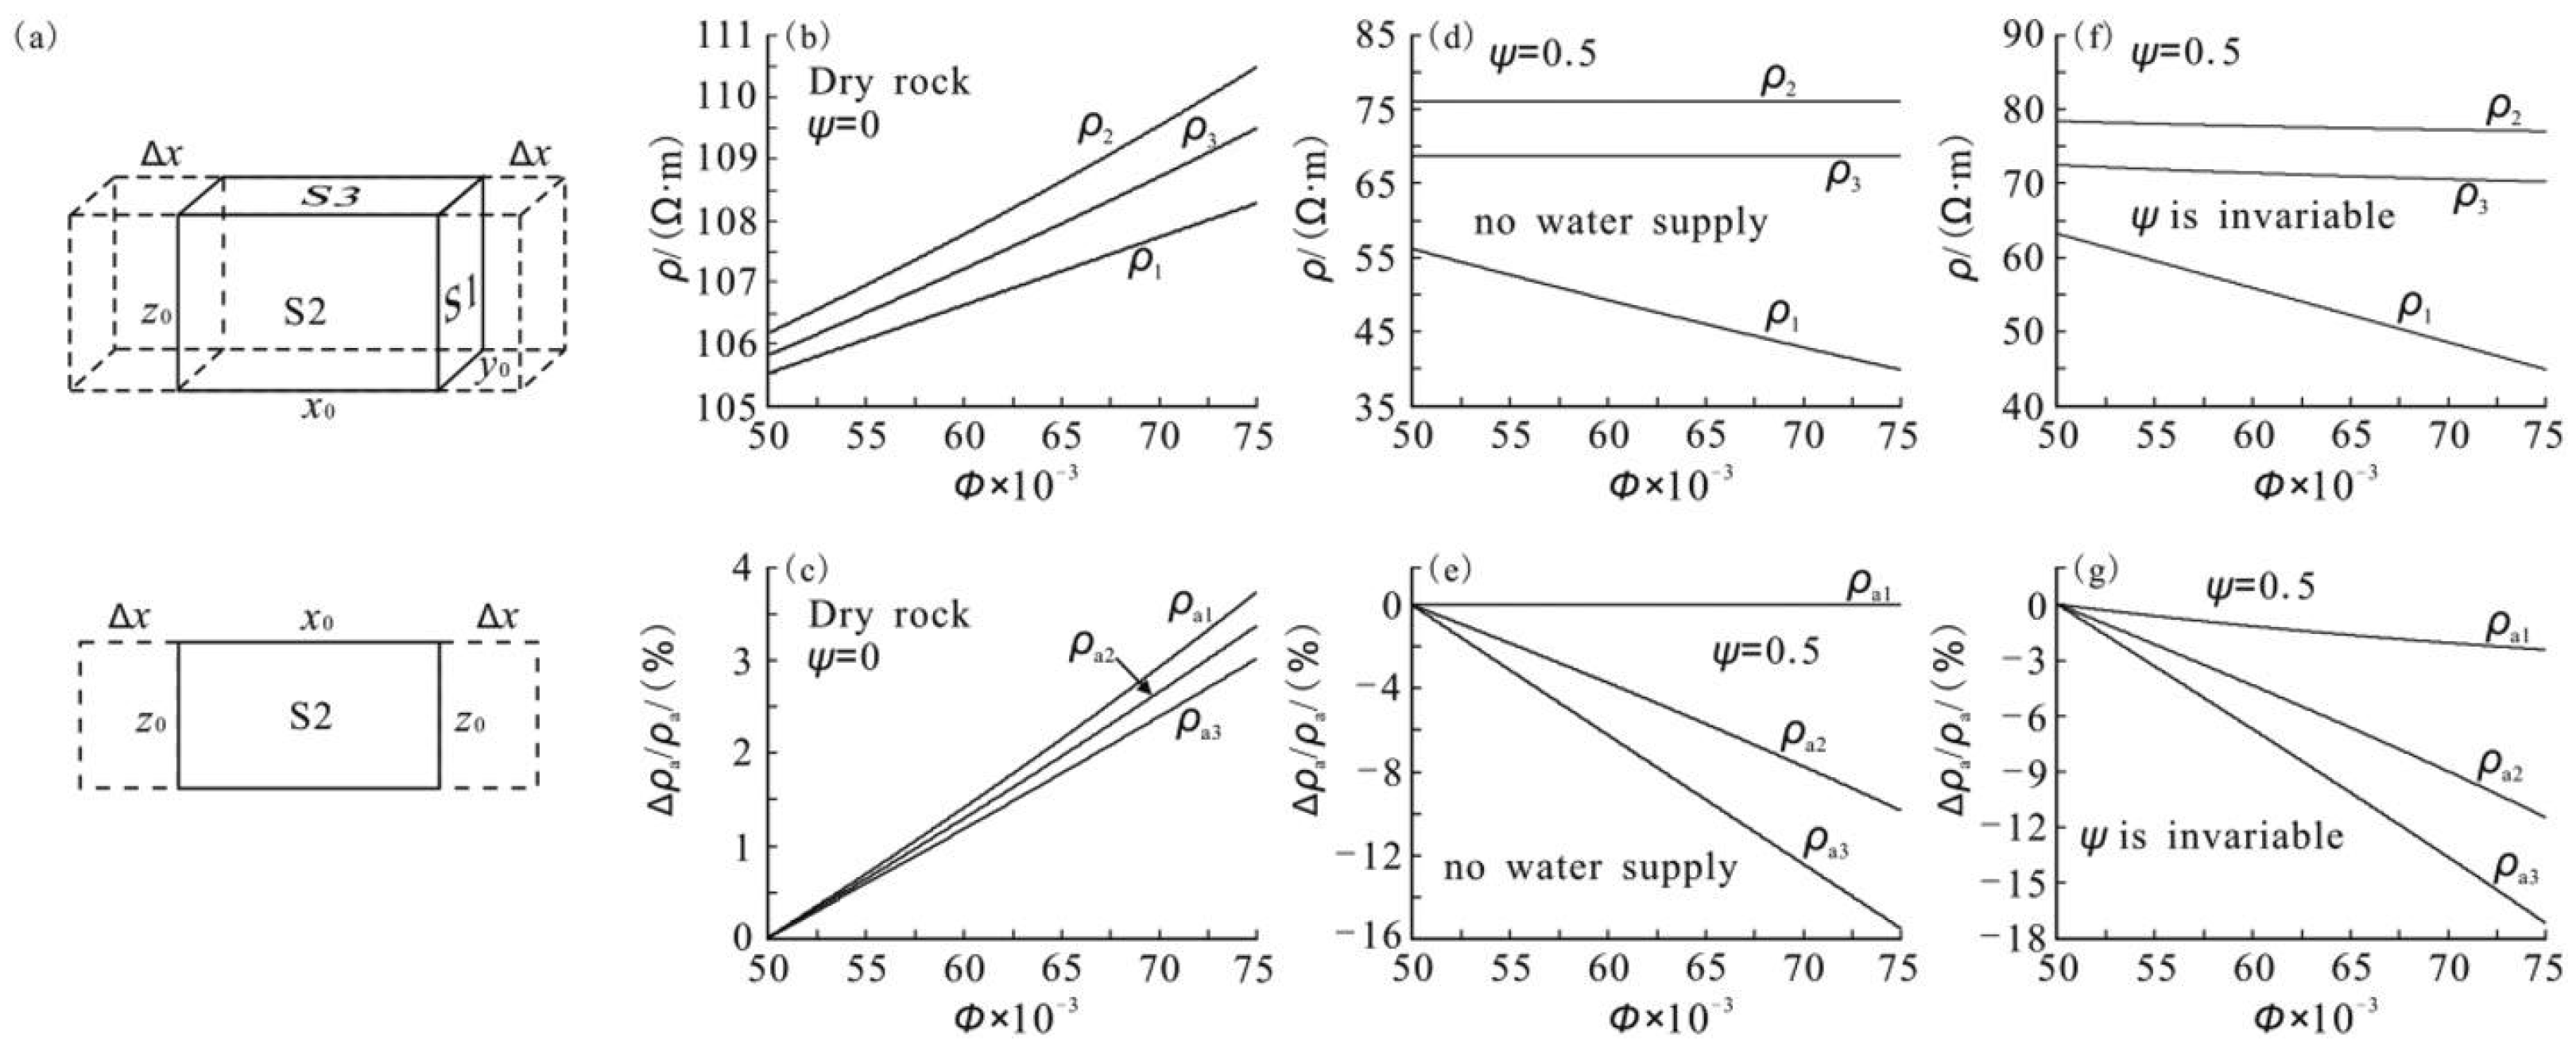
Regional geoelectrical observations have shown that resistivity anomalies may occur in stages before some strong earthquakes, and these variations may be related to tectonic stress accumulation, changes in pore-fluid pressure, and changes in fracture connectivity [75,76]. The observed anomalies do not show the same direction or magnitude in different regions. Their variations depend on regional lithology, tectonic setting, stress state, and other factors [12,77]. Among these factors, fracture orientation and water-bearing conditions play important roles. As shown in Figure 3, when cracks propagate along the minimum-resistivity electrical axis (ρ1), the three principal resistivities and the apparent resistivities in different observation directions exhibit different trends as the crack ratio (ϕ) increases, indicating that crack propagation induces directional electrical responses. Under dry conditions, newly formed cracks block some of the original current paths, resulting in an overall increase in rock resistivity. Under partially saturated conditions, fluid within the cracks redistributes and gradually becomes connected, forming new preferential conductive paths and causing the resistivity in some directions to decrease. Differences in the variation amplitudes of apparent resistivity among different observation directions reflect the electrical anisotropy induced by directional crack propagation and changes in fluid distribution. Laboratory tests also show that water-bearing conditions, pore structure, and crack propagation direction all affect the resistivity variation characteristics and electrical anisotropy of rock masses [78]. Therefore, although electrical responses exhibit different forms at different scales, they can all be explained in terms of stress-induced fracture-structure adjustment, fluid redistribution, and continuous reconstruction of conductive networks.
Overall, the electrical responses of rock masses at different scales are not independent of each other but represent different manifestations of conductive network evolution at different spatial scales and under different geological environments. Laboratory-scale studies reveal the mesoscopic physical mechanisms underlying electrical responses; engineering monitoring reflects the spatial distribution of electrical structures in rock masses and their temporal changes; and regional geoelectrical observations record the overall electrical anomalies during the long-term evolution of large geological bodies. Future studies should combine laboratory tests, engineering monitoring, regional observations, and multiscale numerical simulations to establish a cross-scale theory of conductive network evolution and clarify the intrinsic relationships among different observations, providing a theoretical basis for damage monitoring of complex rock masses, analysis of regional tectonic activity, and geological hazard early warning.

4. Conductive Network Evolution Mechanisms and Quantitative Characterization of Rock Resistivity Under Multi-Physics Coupling

The evolution of rock-mass resistivity and other electrical parameters reflects the response of internal conductive networks and charge transport processes to changes in the external environment. These variations are not determined by a single physical parameter, such as porosity or water saturation, but are jointly influenced by fracture development, pore-fluid occurrence state, stress, temperature, and multi-physics coupling [9,10]. Different factors can alter microscopic processes such as pore–fracture structures, fluid connectivity, conductive-phase distribution, and interfacial polarization, continuously reconstructing the conductive network within rock masses and thereby affecting the dynamic evolution of resistivity. Therefore, revealing the evolution mechanisms of conductive networks under multiple influencing factors and their quantitative relationships with macroscopic electrical responses is a key issue for establishing a theoretical framework of rock-mass electrical behavior and developing electrical monitoring techniques.
Based on this, this section focuses on conductive network evolution as its central theme. It first reviews the evolution and formation mechanisms of rock resistivity under crack propagation, changes in water saturation, stress loading, temperature effects, and multi-physics coupling conditions and then discusses charge transport mechanisms, conductive network reconstruction, and related numerical simulation and quantitative characterization methods under different conditions. The section then examines the main factors that control the electrical responses of rock masses in complex environments. This provides a theoretical basis for rock-mass damage monitoring, identification of catastrophic failure precursors, and the development of resistivity prediction models.

4.1. Fracture-Induced Conductive Network Reconstruction

Among the structural factors affecting the electrical response of rock masses, fracture evolution continuously changes the distribution and connectivity of conductive paths. A fracture itself does not directly determine the conductive capacity of the rock. Instead, it affects charge transport through changes in pore geometry, fluid occurrence, and the spatial connectivity of conductive paths. An isolated dry fracture that contains no conductive fluid cuts off the original pore conduction paths. This interrupts the local conductive network and produces a local high-resistivity anomaly. The blocking effect increases as fractures propagate and connect with one another. The situation is different when conductive fluid fills the fractures. Once the fractures form a connected network with surrounding pores and microcracks, they can become preferential conductive paths, facilitate ion migration, and reduce the overall resistivity of the rock mass [79]. A decrease in the effective conductive cross-sectional area or an increase in current-path tortuosity also reduces charge transport efficiency and consequently increases rock resistivity [80,81,82].
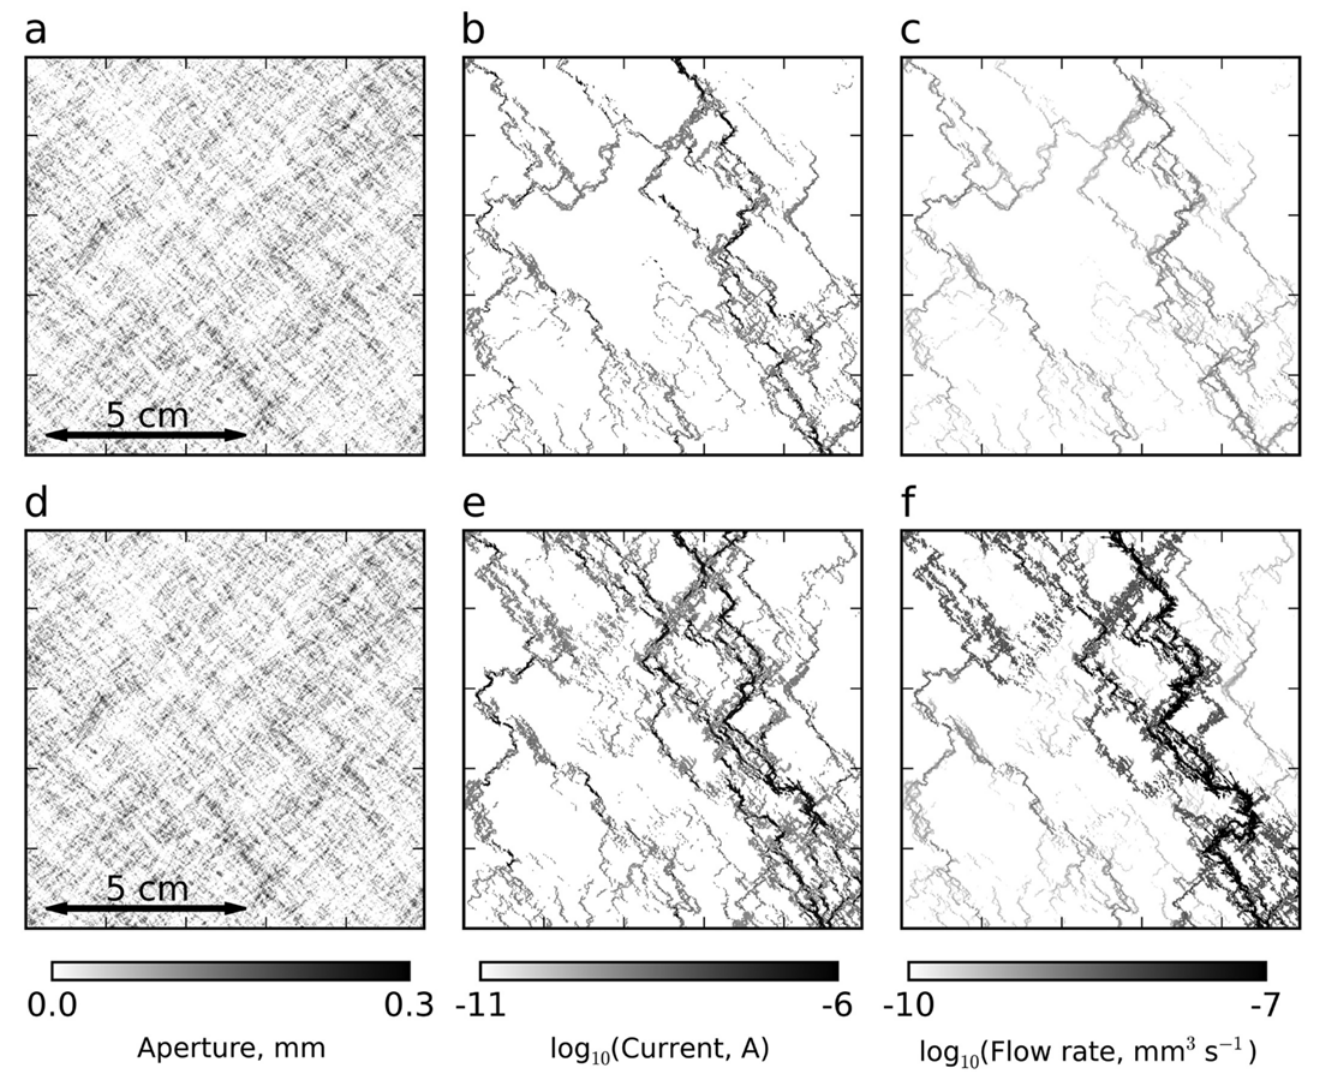
The electrical effect of fracture growth cannot be described by the increase in porosity alone. Pore–throat connections, fracture interconnection, and the connectivity of conductive paths also change during this process and affect the electrical properties of the rock mass. Studies indicate that near the connectivity threshold, even a small change in fracture aperture may be sufficient to connect previously separated fluid paths. Rock permeability and ion transport efficiency then increase, accompanied by a rapid decrease in resistivity [40]. Figure 4 shows this process for a rough water-filled fracture. As the fracture changes from a critical percolation state to a stable connected state, separate local flow paths gradually join together. Water flow and electric current become concentrated in the better-connected channels, and a preferential transport path eventually develops through the fracture. With further fracture development, conductive paths may connect or break at different stages. Such changes can produce stepwise variations in resistivity and increase electrical anisotropy. Changes in fracture geometry therefore modify the distribution and connectivity of conductive paths, which in turn changes the macroscopic electrical response of the rock mass.
Experiments and numerical modeling have provided further information on how fractures affect the electrical behavior of rock masses. Zhao et al. [83] used digital rock reconstruction to build a three-dimensional dual-porosity model containing both matrix pores and fractures. Their results indicate that the electrical effect of a fracture changes with water saturation. When the model is fully saturated, the presence of a single fracture produces only a limited change in the overall resistivity. The response becomes different under unsaturated conditions because both fractures and matrix pores take part in fluid distribution and current transport. This causes a marked change in the relationship between resistivity and water saturation. Ammar [84] found that increasing the number of fractures or the porosity generally decreases the effective resistivity of the medium. Fracture inclination also matters. Its orientation relative to the current-flow direction changes the charge transport path and can produce clear electrical anisotropy. Uneven distributions of fracture aperture, density, and spatial orientation further increase the spatial heterogeneity of the conductive medium and also affect interfacial polarization. Fracture evolution therefore causes changes in resistivity and may also alter frequency-domain parameters such as impedance, phase, and dielectric constant. These parameters provide additional information for the multiparameter electrical characterization of rock-mass damage [85,86,87].
Porosity changes alone cannot account for the observed variations in rock-mass resistivity. Previous studies indicate that fracture evolution continuously reconstructs the conductive network and is the main cause of resistivity variation. The electrical response also varies with fracture connectivity, fracture geometry, and the water-filling condition. Together, these factors control both the magnitude and the pattern of the electrical changes, including resistivity variation, electrical anisotropy, and polarization effects. Conductive network reconstruction thus provides the key physical link between fracture evolution and the electrical response of the rock mass.

4.2. Water Saturation-Controlled Resistivity Evolution

Water saturation has a strong influence on the electrical response of rock masses because it changes the occurrence and connectivity of pore fluids as well as their capacity for ion transport. These changes affect the overall conductivity of the rock mass. In rock masses where pore-fluid conduction dominates, charge transport relies mainly on the diffusion and migration of ions in pore water. The macroscopic resistivity therefore depends directly on pore-water content, ion concentration, and the connectivity of the water phase. With increasing water saturation, originally isolated pore water gradually becomes connected, forming continuous preferential conductive networks, which enhances the overall conductive capacity of rock masses and continuously reduces resistivity. In contrast, under unsaturated conditions, pore water is mainly present in discrete regions, and continuous conductive paths have not yet formed. Residual pore water, adsorbed water films on mineral surfaces, and electrochemical effects at pore interfaces jointly participate in the conduction process, resulting in nonlinear variations in rock-mass resistivity [88,89,90].
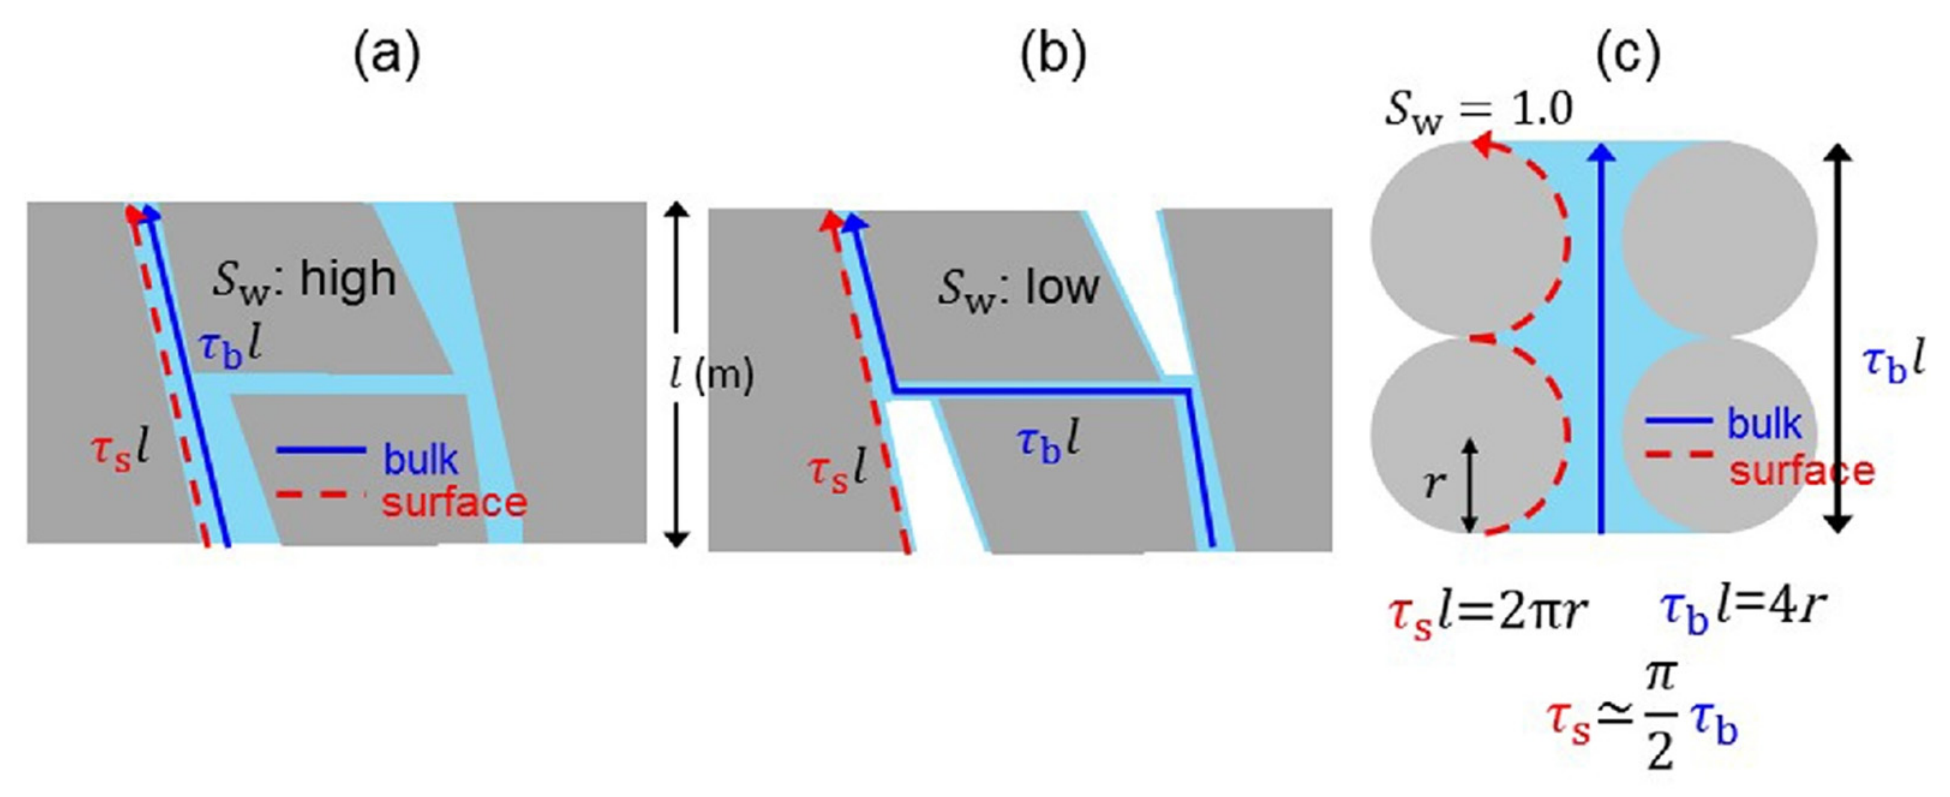
From the perspective of conduction mechanisms, the effect of water saturation on rock resistivity depends not only on pore-water content but also on lithology, pore structure, and mineral composition. Umezawa et al. [13] quantified the tortuosity of bulk pore-water conductive paths, τb, and the tortuosity of mineral-surface conductive paths, τs, and analyzed the variations in different conduction mechanisms with water saturation Sw in partially saturated sandstone. As shown in Figure 5, with decreasing water saturation, the connectivity of the bulk pore-water conductive network gradually decreases, and the tortuosity of conductive paths continuously increases. Meanwhile, adsorbed water films on mineral surfaces can remain continuously conductive within a certain saturation range, resulting in a continuous increase in the relative contribution of the surface conductive network. For shaly sandstone and clay-bearing fractured media, counterion migration in the electrical double layer on mineral surfaces and conduction through adsorbed water films are more pronounced. In this case, electric current can be transported through both pore fluids and mineral surfaces, and rock resistivity is jointly affected by bulk conduction and surface conduction.
The classical Archie model is applicable to clean sandstone dominated by pore-fluid conduction. For rock masses with high clay content, large specific surface area, or low pore-water salinity, the contribution of additional mineral-surface conduction increases, and the relationship between resistivity and saturation usually deviates from the predictions of the Archie model and exhibits pronounced nonlinear characteristics [91,92]. Induced polarization further complicates this relationship. For example, at low saturation levels in granite and sandstone, mineral-interface polarization dominates, and rock resistivity may increase with increasing saturation. As saturation further increases, a continuous pore-water conductive network gradually forms, pore-fluid ionic conduction becomes dominant again, and resistivity then gradually decreases with increasing saturation [11].
The influence of water saturation on rock-mass resistivity is mainly related to the distribution and connectivity of pore water. As the water-bearing state gradually changes from unsaturated to saturated, the conduction mechanism of rock masses evolves from local ionic conduction and mineral-surface conduction to continuous pore-fluid conduction. The combined effects of lithology, mineral composition, and pore structure result in complex nonlinear variations in rock-mass resistivity. Therefore, the fundamental physical mechanism by which water saturation affects the electrical responses of rock masses lies in the evolution of pore-fluid connectivity and the combined effects of multiple conduction mechanisms, which also provides the theoretical basis for establishing a quantitative relationship between resistivity and water-bearing state.

4.3. Stress-Induced Resistivity Evolution

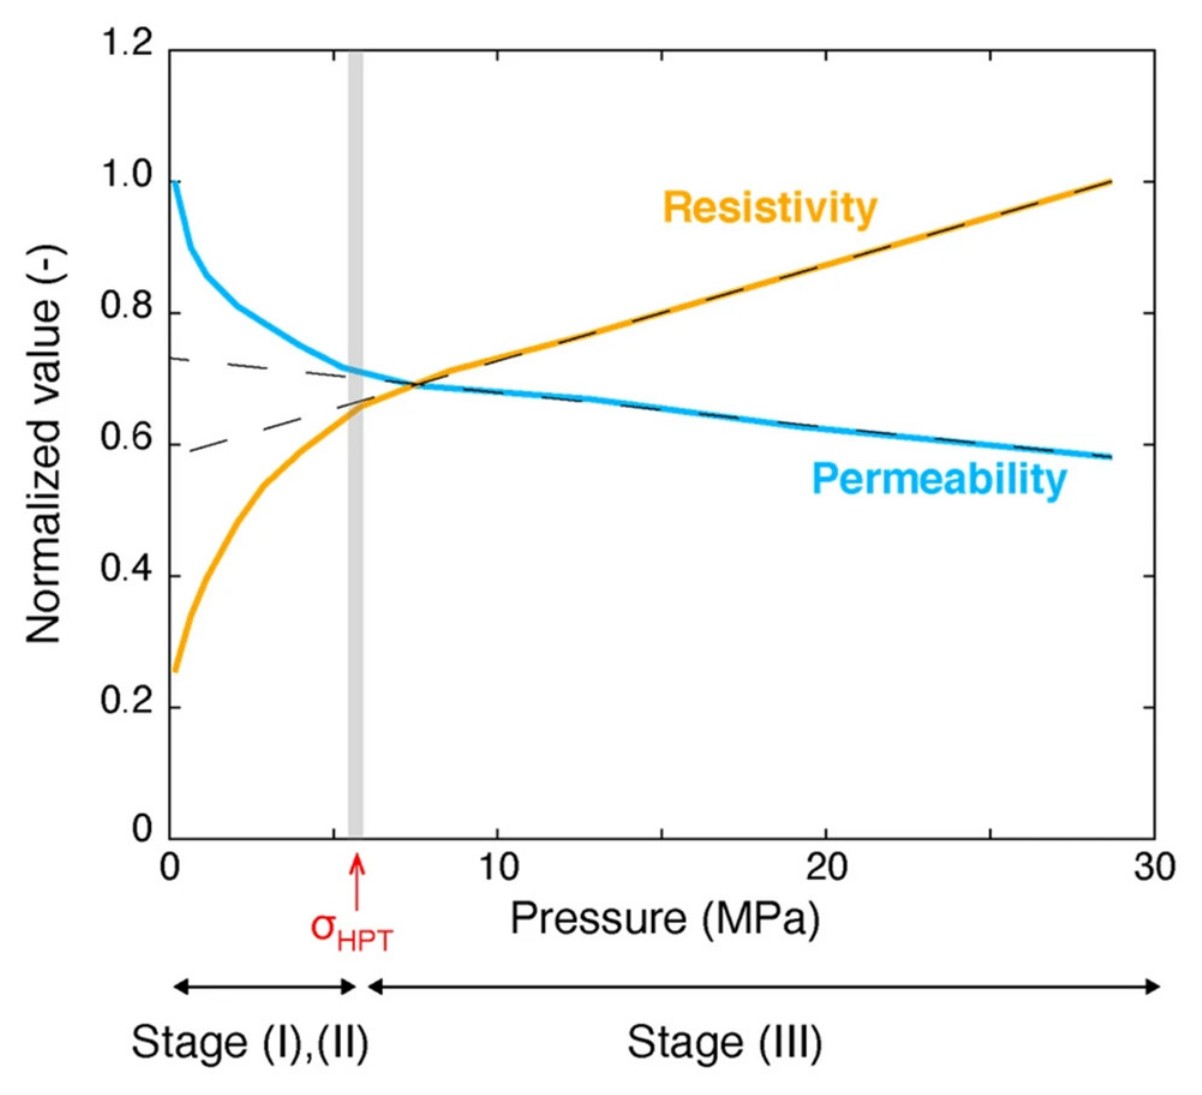
Stress is an external factor affecting the mesoscopic structure and electrical responses of rock masses and can alter charge transport processes by adjusting the pore–fracture structure and the connectivity of conductive networks. During stress loading, pore compaction, microcrack closure and propagation, and changes in pore-fluid distribution continuously adjust the spatial structure of conductive paths, resulting in dynamic variations in resistivity. With increasing normal stress and confining pressure, primary pores and microcracks gradually close, while fracture hydraulic aperture and permeability decrease simultaneously. This reduces the effective conductive cross-sectional area of pore fluids and increases the tortuosity of charge migration paths, causing the overall resistivity of rock masses to generally increase continuously [93,94,95]. As shown in Figure 6, below the hydraulic percolation threshold (HPT), the fracture flow paths remain globally connected, and the logarithmic values of permeability and resistivity vary nonlinearly with effective normal stress. As the stress further increases, the dominant flow paths gradually become disconnected. Once the HPT is exceeded, the fractures enter a disconnected flow regime, in which the logarithmic values of both permeability and resistivity show an approximately linear relationship with effective normal stress [94]. When the rock mass enters the deviatoric stress loading stage or approaches the critical state of macroscopic failure, newly formed cracks continuously initiate, propagate, and gradually coalesce, resulting in reconstruction of the original conductive network and anomalous resistivity responses such as rapid decreases, stepwise changes, or intense fluctuations [96,97]. Therefore, the dynamic reconstruction of conductive networks under stress is the intrinsic physical mechanism governing changes in rock-mass resistivity.
From the perspective of conduction mechanisms, the influence of stress on the electrical responses of rock masses depends not only on the opening and closure of fractures, but also on lithology, pore structure, fluid properties, and mineral composition. Different rock masses exhibit different electrical responses to stress, mainly because of differences in their conduction mechanisms and mesoscopic structural evolution. In rocks where pore-fluid ionic conduction dominates, fracture compaction reduces fluid connectivity and makes the paths for charge migration more tortuous. As a result, resistivity increases. The situation is different in rocks containing abundant conductive minerals. Charge transport then involves both ionic conduction through pore fluids and electronic conduction through the mineral skeleton. This makes the electrical response to stress more complex, with clear differences among rock types [98,99].
Experimental observations give further insight into the microscale processes responsible for resistivity changes in rocks under stress. Dey [100] found that thin, sheet-like microcracks in Berea and Muddy J sandstones were particularly sensitive to stress and closed preferentially during low-pressure compaction. Low-frequency electrical conductivity, permeability, and solute diffusivity decreased simultaneously. In low-permeability sandstone, the compaction and closure of rough cracks, intergranular fractures, and fracture-type pores alter conductive paths and also change parameters in the Archie model, including the formation factor (F) and cementation exponent [101,102]. These changes affect the evolution of macroscopic resistivity and produce clear nonlinear and stage-dependent characteristics in the electrical response.
Rock-mass resistivity evolution under stress exhibits clear stage-dependent characteristics. At the initial loading stage, resistivity variations mainly reflect pore–fracture compaction, obstruction of conductive paths, and reduced charge migration capacity. During pre-peak dilatancy and near instability, rapid fracture propagation, reconnection of fluid paths, and localized shear failure jointly reconstruct the conductive network, resulting in abrupt changes or intense fluctuations in resistivity. Therefore, resistivity variations at different loading stages can reflect the evolution of the pore–fracture structure from compaction and propagation to local coalescence, providing an electrical basis for rock-mass damage analysis and instability precursor identification.

4.4. Thermally Induced Resistivity Evolution

Temperature is one of the main environmental factors affecting the electrical responses of rock masses. It continuously alters the conductive network structure and charge transport processes mainly through changes in the occurrence state of pore fluids, ion mobility, and rock microstructure. With increasing temperature, pore-fluid properties, thermal deformation of minerals, and pore–fracture structures continuously evolve, causing rock-mass resistivity to exhibit stage-dependent variation characteristics [14]. For water-bearing rock masses, within a relatively low temperature range, increasing temperature enhances the diffusion rate and migration capacity of ions in pore water, and rock-mass resistivity therefore generally decreases gradually with increasing temperature. However, when the temperature exceeds a certain critical threshold, free and adsorbed water in the pores gradually evaporate and are lost, while thermal expansion mismatch among mineral grains induces abundant intragranular and intergranular microcracks. The original conductive network is continuously reconstructed, causing rock-mass resistivity to shift from a decreasing to an increasing trend or to exhibit complex non-monotonic behavior [103,104].
The influence of temperature on rock-mass resistivity is mainly reflected in changes in pore-fluid conduction and thermal-damage-related conduction mechanisms. At relatively low temperatures, enhanced ion migration is the dominant factor affecting the electrical response. As thermal damage continues to accumulate, microcrack initiation, propagation, and interconnection gradually become the dominant factors controlling conductive network evolution. Meanwhile, pore-structure reconstruction induced by thermal treatment also alters interfacial polarization, ionic polarization, and charge accumulation behavior, causing the electrical responses of rock masses to exhibit pronounced stage-dependent and nonlinear characteristics. In addition, under subzero-temperature and freeze–thaw conditions, the pore water–ice phase transition and unfrozen water content jointly affect the evolution of conductive networks [105,106]. As liquid water gradually freezes, continuous ionic conductive paths are progressively interrupted, and conduction depends mainly on residual unfrozen water films. As a result, resistivity increases rapidly with decreasing temperature, and this response can reflect the ice–water phase transition process and the spatial distribution of pore water [107,108,109].
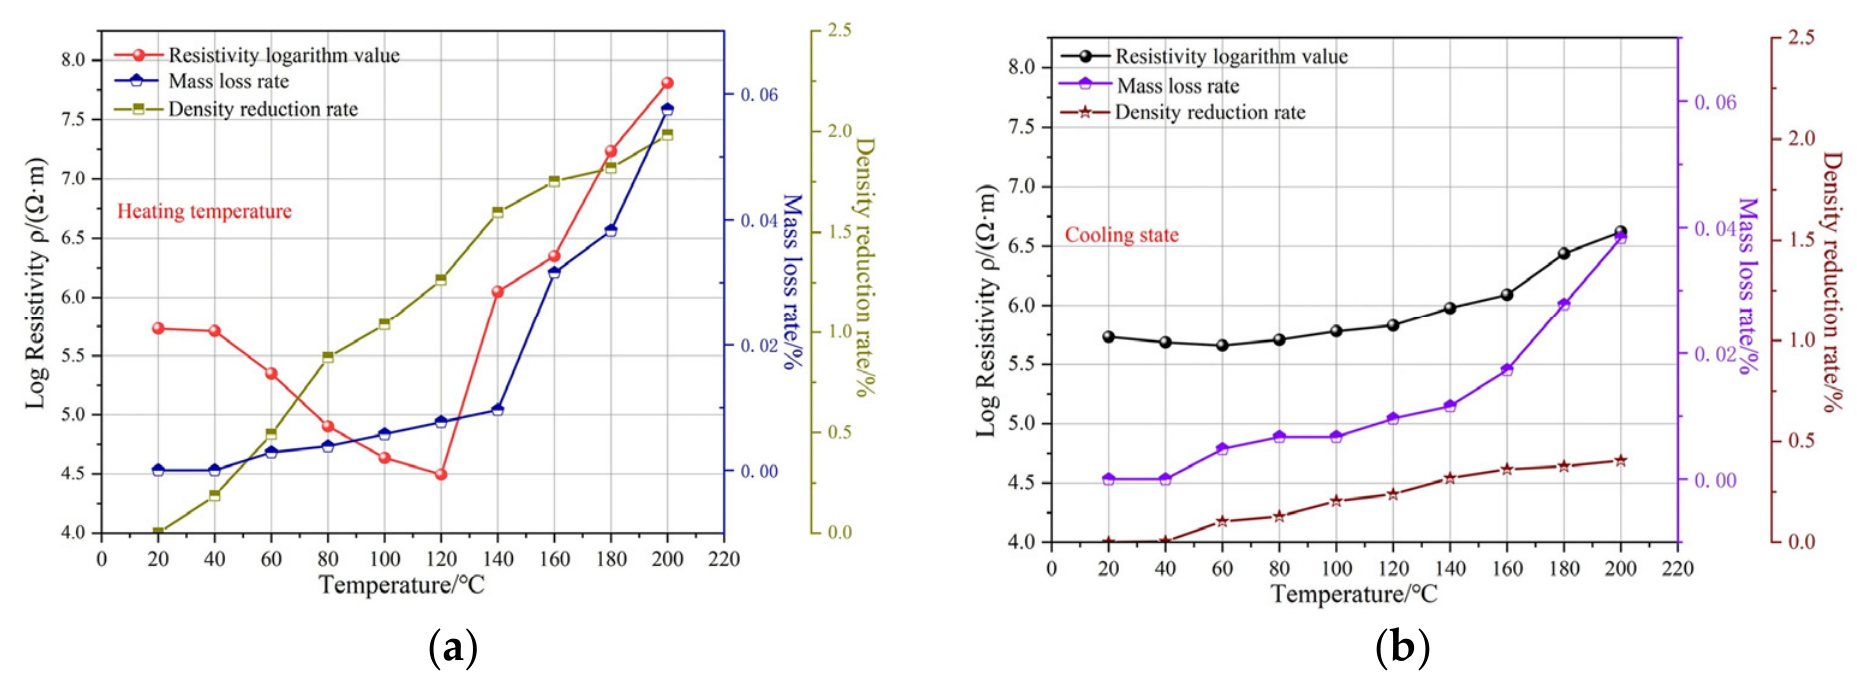
Extensive experimental studies have further revealed the effects of temperature on the evolution of rock-mass resistivity. Lü and Sun [110] found that the initial resistivity of sandstone after thermal treatment at 25–350 °C generally increased with increasing temperature, with a pronounced increase above 300 °C, whereas the change in peak strength was relatively small. Jia et al. [111] conducted uniaxial compression tests on granite thermally treated at different temperatures. The results showed that resistivity can quantitatively characterize the development of thermal damage and that the second rapid decrease in resistivity prior to failure can serve as a precursor to macroscopic rock instability. Shu et al. [112] found that pore water enhances the sensitivity of granite resistivity to temperature changes. Zhang et al. [15] compared the resistivity, mass loss rate, and density reduction rate of limestone during real-time heating and after natural cooling, as shown in Figure 7. They found that during real-time heating, the mass loss rate changed only slightly below 120 °C, while resistivity decreased mainly because of the enhanced activity of conductive ions in pore water. Above 120 °C, the mass loss rate and density reduction rate increased significantly, and the combined effects of water loss and thermal crack propagation caused a sharp increase in resistivity. After natural cooling, resistivity generally increased with increasing treatment temperature and exhibited a variation trend consistent with that of the density reduction rate, with its evolution mainly controlled by the development of thermal cracks. The influence of temperature on rock-mass resistivity is essentially the result of the combined effects of pore-water state, thermal damage degree, and conductive network evolution.

4.5. Numerical Modeling of Conductive Network Evolution and Quantitative Characterization of Coupled Resistivity Responses

The electrical responses of rock masses are jointly influenced by multiple physical factors, including pore–fracture structure, water-bearing state, temperature field, and stress field. Numerical simulation can link mesoscopic structural changes with macroscopic mechanical and electrical responses and can be used to analyze conductive network evolution and resistivity formation processes. It has therefore become an important method for investigating the electrical behavior of rock masses under multi-physics coupling conditions [113,114].
According to the scale of structural characterization, numerical models of rock-mass resistivity can be divided into macroscopic fracture models and mesoscopic structural models. Macroscopic fracture models explicitly construct fracture networks and preferential conductive paths and mainly analyze the effects of macroscopic structural parameters, such as fracture density, aperture, spatial orientation, and water saturation, on the effective resistivity of rock masses. Zheng et al. [115] used a full-scale granite core, 10 cm in length and 7.5 cm in diameter, as the computational domain to conduct finite-element simulations of the resistivity of full-diameter fractured cores. Based on the electrical characteristics of granite, the matrix resistivity and initial mud-filtrate resistivity were set to 1000 Ω·m and 0.1 Ω·m, respectively. The electrical conditions were set according to the core-electrode method, and the effects of fracture geometry on core resistivity were analyzed by varying the fracture inclination angle, width, and length.
Kirkby and Heinson [41] constructed a three-dimensional discrete-fracture resistor network based on the statistical characteristics of natural fracture networks. A computational domain of 1.5 cm × 1.5 cm × 1.5 cm was adopted to balance computational efficiency and core-scale representativeness, and the element size was set to 0.25 mm to characterize fracture-surface mismatch. Parameters such as fracture length, density, and surface roughness were mainly determined from statistical results of natural fracture networks and existing rock-fracture measurements. The fracture density parameter α was set to 0.3, 3, and 30, the rock-matrix permeability was set to 1 × 10⁻¹⁸ m2, and the resistivity ratio between rock and fluid was set to 104. Potential differences and pressure differences were applied separately to analyze the combined effects of fracture aperture, density, and connectivity on the resistivity and permeability of fractured rock masses. The results show that when the fracture network approaches the percolation threshold, resistivity and permeability become more sensitive to changes in connectivity and exhibit pronounced anisotropy.
In contrast, digital rock models focus more on pore–throat structures, conductive-phase distribution, and charge migration processes and can simulate the formation and evolution of conductive networks from the micrometer to nanometer scale [116,117,118,119]. Wu et al. [120] investigated actual laminated shaly sandstone from the W13-2 Oil Field in the Pearl River Mouth Basin. Casting thin sections were used to extract the shale distribution and pore structure, while micro-CT, X-ray diffraction (XRD), and scanning electron microscopy (SEM) were used to characterize the spatial distribution of shale, mineral composition, and microstructure and to construct conduction models for the laminated shaly sandstone and clean sandstone areas. The model parameters were determined based on actual reservoir data. At 74 °C and a salinity of 33,000 mg/L, the resistivity of the formation water was 0.088 Ω·m, while the shale resistivity ranged from 1.17 to 1.46 Ω·m. In the electric-field simulation, a constant voltage was applied to both sides of the model, with the direction of electric potential parallel to the shale laminae. The simulated results were generally consistent with the variation trend of the actual logging resistivity, based on which a water saturation prediction model applicable to heterogeneous laminated media was established.
Three-dimensional digital rock models can reconstruct pores, fractures, and mineral components within rocks and calculate pore-scale electric fields and charge transport, thereby revealing resistivity evolution under the combined effects of porosity, clay content, temperature, formation-water salinity, conductive minerals, and other factors [121,122,123]. For deep reservoir models, temperature, pressure, and fluid parameters are usually set or calibrated according to actual reservoir conditions and laboratory tests. Shang et al. [123] investigated deep low-permeability tight sandstone from the East China Sea Shelf Basin and constructed multicomponent digital rocks of 500 × 500 × 500 voxels using CT images with a resolution of 3 μm. The pore structure under pressure was calibrated based on porosity and permeability tests conducted on 41 rock samples at 5 MPa and 43 MPa, while temperature effects were introduced by considering the variations in the electrical conductivity of formation water and clay minerals with temperature, thereby making the simulated conditions closer to those of actual deep reservoirs. On this basis, the Archie parameters obtained from simulations under high-temperature and high-pressure conditions were applied to calculate water saturation from actual well-logging data. The average relative error compared with sealed core analysis results was 6.8%, indicating that the model can effectively reflect the electrical characteristics of deep reservoirs under in situ temperature and pressure conditions.
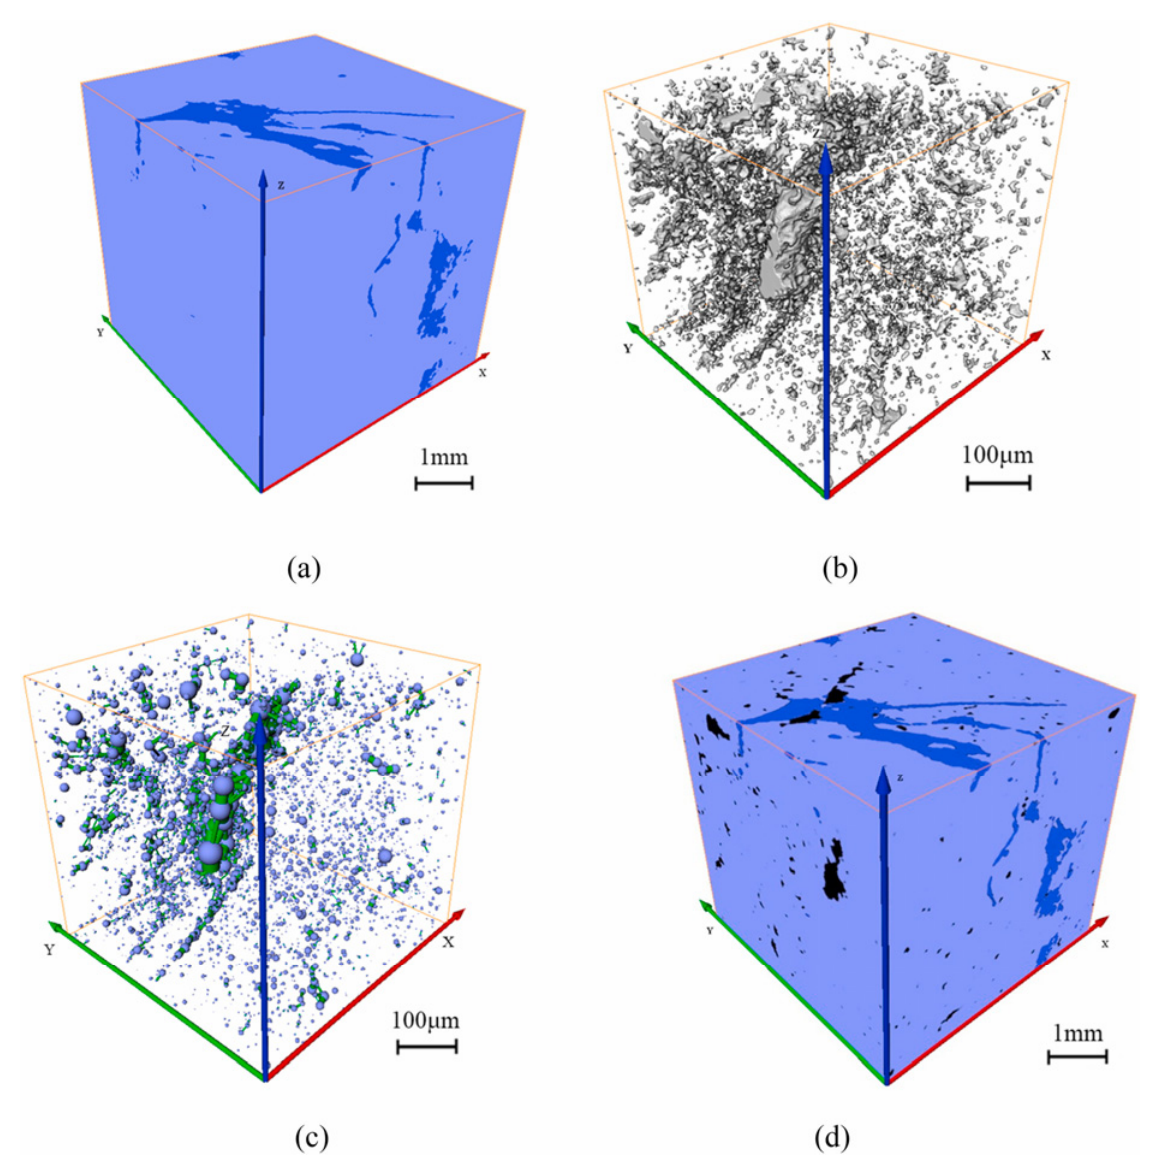
Wang et al. [23] established multicomponent digital rock models of fractured carbonate rocks based on multiscale rock characterization using CT, two-dimensional map imaging by scanning electron microscopy (Maps), and quantitative evaluation of minerals by scanning electron microscopy (QEMSCAN), as shown in Figure 8. Because cores containing obvious fractures are difficult to preserve intact during coring and sample preparation, the authors artificially introduced fractures into the reconstructed matrix digital rocks and used fractional Brownian motion to construct rough fracture surfaces. Parameters such as fracture aperture, length, and inclination angle were determined based on the actual fracture characteristics of the Tahe Oilfield and the scale of the digital rocks, with fracture lengths ranging from 600 μm to 6 mm. The finite-element method was used to analyze the effects of fracture geometry on resistivity and electrical anisotropy, and the feasibility of the electrical calculation method was verified using a series-parallel theoretical model. On this basis, a water saturation model for fractured carbonate rocks was established.
Rock-resistivity simulation has moved beyond empirical models toward multiscale physical models that incorporate realistic pore geometry, multiple conductive phases, and fracture networks. These models make it possible to examine conductive network evolution and charge transport inside rock masses. The factors affecting the electrical responses of rock masses vary across different scales. At the micro- and mesoscopic scales, electrical responses are mainly controlled by pores, mineral interfaces, and microcracks. As the scale increases, the effects of fracture density, aperture, orientation, and connectivity become more pronounced and may induce significant electrical anisotropy. Therefore, electrical parameters and evolution characteristics obtained from small-scale models cannot be directly extrapolated to engineering-scale rock masses, and the parameter relationships across different scales and the applicable ranges of the models remain insufficiently understood. In addition, most current simulations still calculate static electric fields using a fixed pore–fracture structure, in which fracture dimensions are specified in advance. Such models cannot readily describe how the conductive network is dynamically reconstructed as damage develops under coupled stress, temperature, and seepage conditions. A further step is to combine full-process mechanical tests with digital rock reconstruction and dynamic damage simulation. In this way, mechanical–electrical coupling can be simulated from the intact state of a rock mass through failure and instability. The resulting dynamic electrical response may then be used to develop prediction methods for identifying instability precursors and to improve the accuracy and reliability of rock-mass damage monitoring and hazard early warning.

5. Electrical Responses, Damage Quantification, and Instability Precursors During Progressive Rock Failure

Rock-mass failure under loading develops progressively from the initiation and growth of mesoscopic defects to the coalescence of macroscopic fractures. As damage develops, the connectivity of conductive paths and the distribution of conductive phases continue to change. Resistivity, impedance, self-potential, and other electrical parameters change accordingly. The electrical response can thus reflect the macroscopic deformation of the rock mass under external loading and also provide information on internal crack growth and the evolution of conductive paths. These electrical changes can be used for damage characterization and instability prediction.
Earlier studies mainly described the electrical response of rock masses, whereas recent work has increasingly focused on quantitative damage evaluation, conductive network characterization, and instability precursor analysis. Resistivity, impedance, and self-potential are commonly monitored together with information obtained from AE, ultrasonic testing, CT, DIC, and numerical simulation. The combined information describes progressive rock damage from different aspects, including dynamic crack propagation, energy release, and changes in rock-mass integrity. This combination offers a new approach to improving the accuracy of damage identification and the reliability of hazard early warning.
This section examines the electrical response of rock masses during damage and the methods used for its quantitative characterization. Recent studies are discussed with emphasis on the use of electrical parameters in damage-variable construction, integration of multisource monitoring, and identification of instability precursors. The discussion also addresses how conductive network evolution and anomalous electrical responses are related to crack propagation and the development of catastrophic failure.

5.1. Electrical Responses and Quantitative Characterization of Progressive Rock Damage

Changes in rock microstructure during loading, from pore compaction and microcrack initiation to crack propagation and macroscopic fracture coalescence, continually modify conductive-network connectivity and charge transport paths. Resistivity, impedance, and other electrical parameters change with this structural evolution, which provides the physical basis for quantitatively relating electrical signals to the damage state of rock masses. In terms of damage characterization, the conductive network evolves continuously from compaction and blockage to reconstruction and eventual interconnection as rock damage develops [124]. During early loading, pore compaction and microcrack closure restrict conductive paths, and the resistivity response mainly reflects structural compaction. Further crack initiation and propagation reconstruct the local conductive network, accompanied by a decrease or marked fluctuations in resistivity. Once cracks rapidly coalesce into a dominant fracture surface, the conductive network changes abruptly and sharp changes usually appear in the corresponding electrical parameters [125,126,127]. The evolution of resistivity thus follows the transition from the elastic stage through damage accumulation to macroscopic instability and can serve as a basis for constructing damage variables.
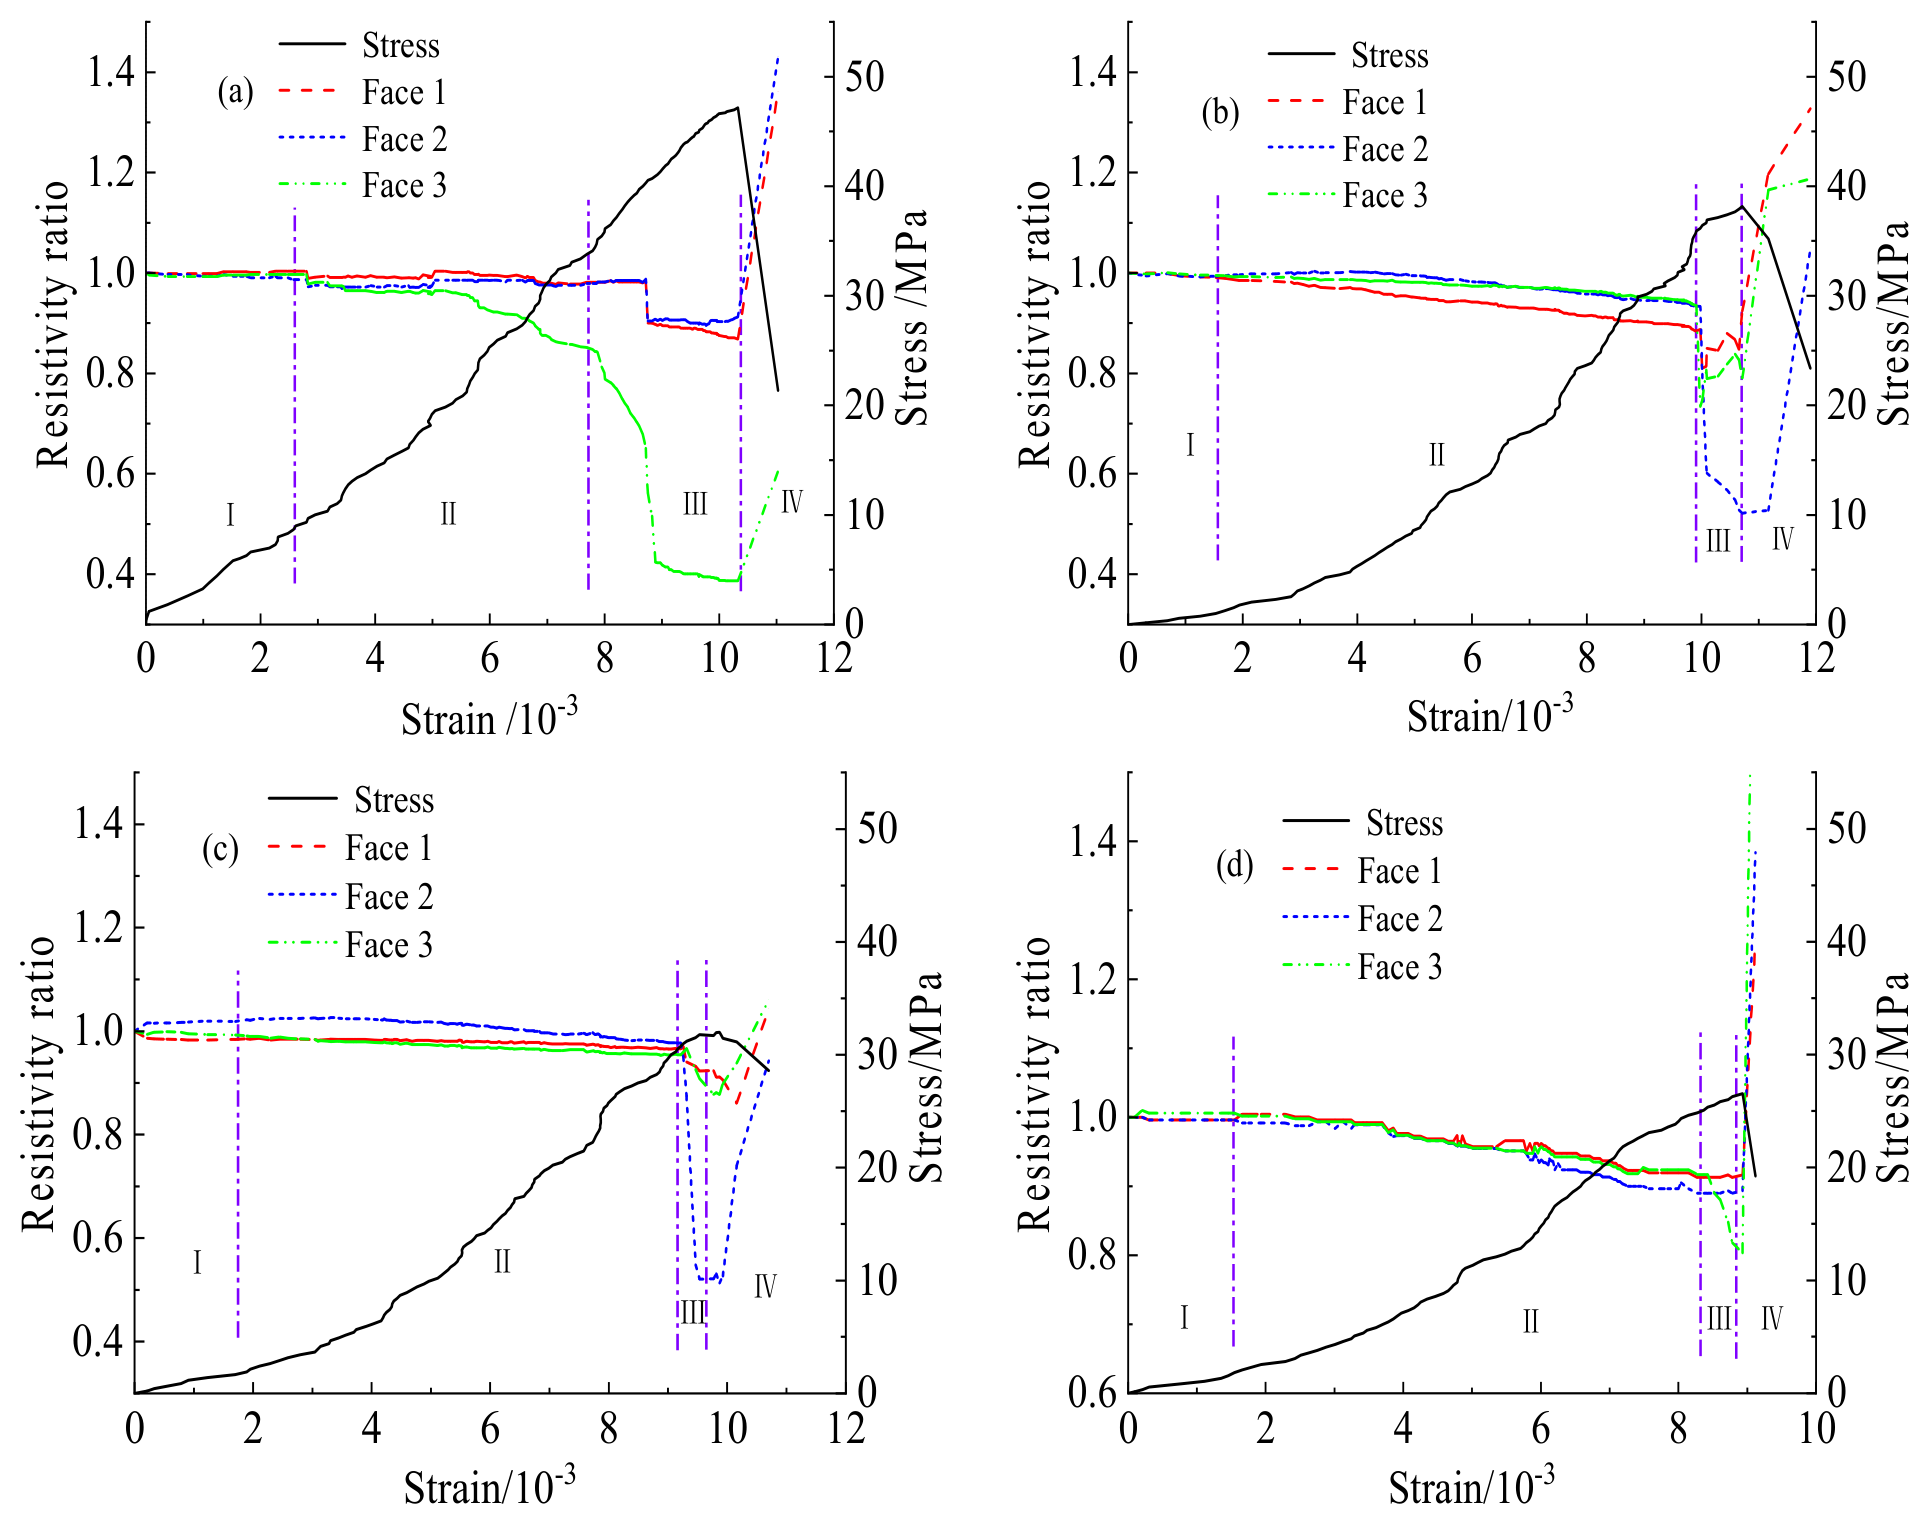
Recent work has increasingly used electrical parameters to quantify rock-mass damage. Jia et al. [128] reported clear differences in the resistivity changes measured on different surfaces, both between damage stages and among measurement directions. As shown in Figure 9, the resistivity on each measurement surface undergoes four typical evolution stages: stable, decreasing, abrupt decrease, and abrupt increase. These stages correspond to the continuous evolution of the conductive network from local adjustment to rapid reconstruction and finally to instability-related interconnection and can effectively characterize different stages of rock-mass damage development. Meanwhile, the magnitudes of resistivity variation differ significantly among the measurement surfaces, reflecting the spatial heterogeneity of conductive network reconstruction and the directional characteristics of crack propagation. These differences can be used to characterize the anisotropy of damage evolution and provide a reference for predicting the locations of potential coalescing cracks. Chen and Lin [129] proposed a piecewise state equation relating stress, strain, and resistivity, which describes the inelastic mechanical response during crack propagation quantitatively. Using alternating-current (AC) impedance spectroscopy together with an equivalent circuit model, Yin and Xu [130] showed that interfacial resistance can characterize the accumulation and evolution of microcracks in sandstone. A quantitative relationship between resistivity and the damage variable was then established by Wang et al. [131] based on continuum damage theory. Under complex conditions such as cyclic loading, fatigue damage, and heterogeneous rock masses, previous studies have also established damage variables based on resistivity or coupled resistivity–AE parameters to quantitatively evaluate the entire process of cumulative rock-mass damage [132,133,134,135,136].
Figure 9. Stress–strain–resistivity curves for saturated sandstone under uniaxial compression: (a) rock sample #1; (b) rock sample #2; (c) rock sample #3; and (d) rock sample #4. The purple dash-dotted vertical lines indicate the boundaries between the four resistivity-evolution stages, and Roman numerals I–IV denote the stable, decreasing, abrupt decrease, and abrupt increase stages, respectively [128].
Geosciences 16 00377 g009
It should be noted that the electrical responses of rock masses under stress are jointly influenced by multiple factors, including lithology, initial defects, loading path, water-bearing state, and measurement direction, and the applicability of damage variables still varies under different experimental conditions [137,138]. Therefore, integrated multisource monitoring can further improve the accuracy of rock-mass damage monitoring and instability prediction under stress.

5.2. Rock-Mass Damage Evaluation Based on Integrated Multisource Monitoring

Rock-mass damage evolution involves processes such as crack initiation and propagation, energy release, conductive network reconstruction, and degradation of medium integrity, and a single monitoring parameter is usually insufficient to accurately evaluate the degree of rock-mass damage. Therefore, electrical monitoring has been combined with AE, ultrasonic testing, CT, DIC, and nuclear magnetic resonance (NMR) to achieve comprehensive characterization of the entire rock-mass damage process through the complementarity and cross-validation of different physical information [139,140,141]. This has become an important development direction in current rock-mass damage monitoring.
Different monitoring methods correspond to different response mechanisms during rock-mass damage evolution. Resistivity mainly reflects the connectivity of pore–fracture conductive networks and charge transport capacity; AE records crack initiation, propagation, and energy release [142,143]; ultrasonic testing characterizes changes in medium integrity and elastic structure [144]; and CT and DIC techniques reveal the three-dimensional distribution of internal cracks [145,146] and the evolution of localized surface deformation [147,148], respectively. These different types of monitoring information complement each other and can be used to establish corresponding relationships among conductive network evolution, crack propagation, and macroscopic deformation, thereby enabling more accurate identification of the progressive damage process of rock masses.
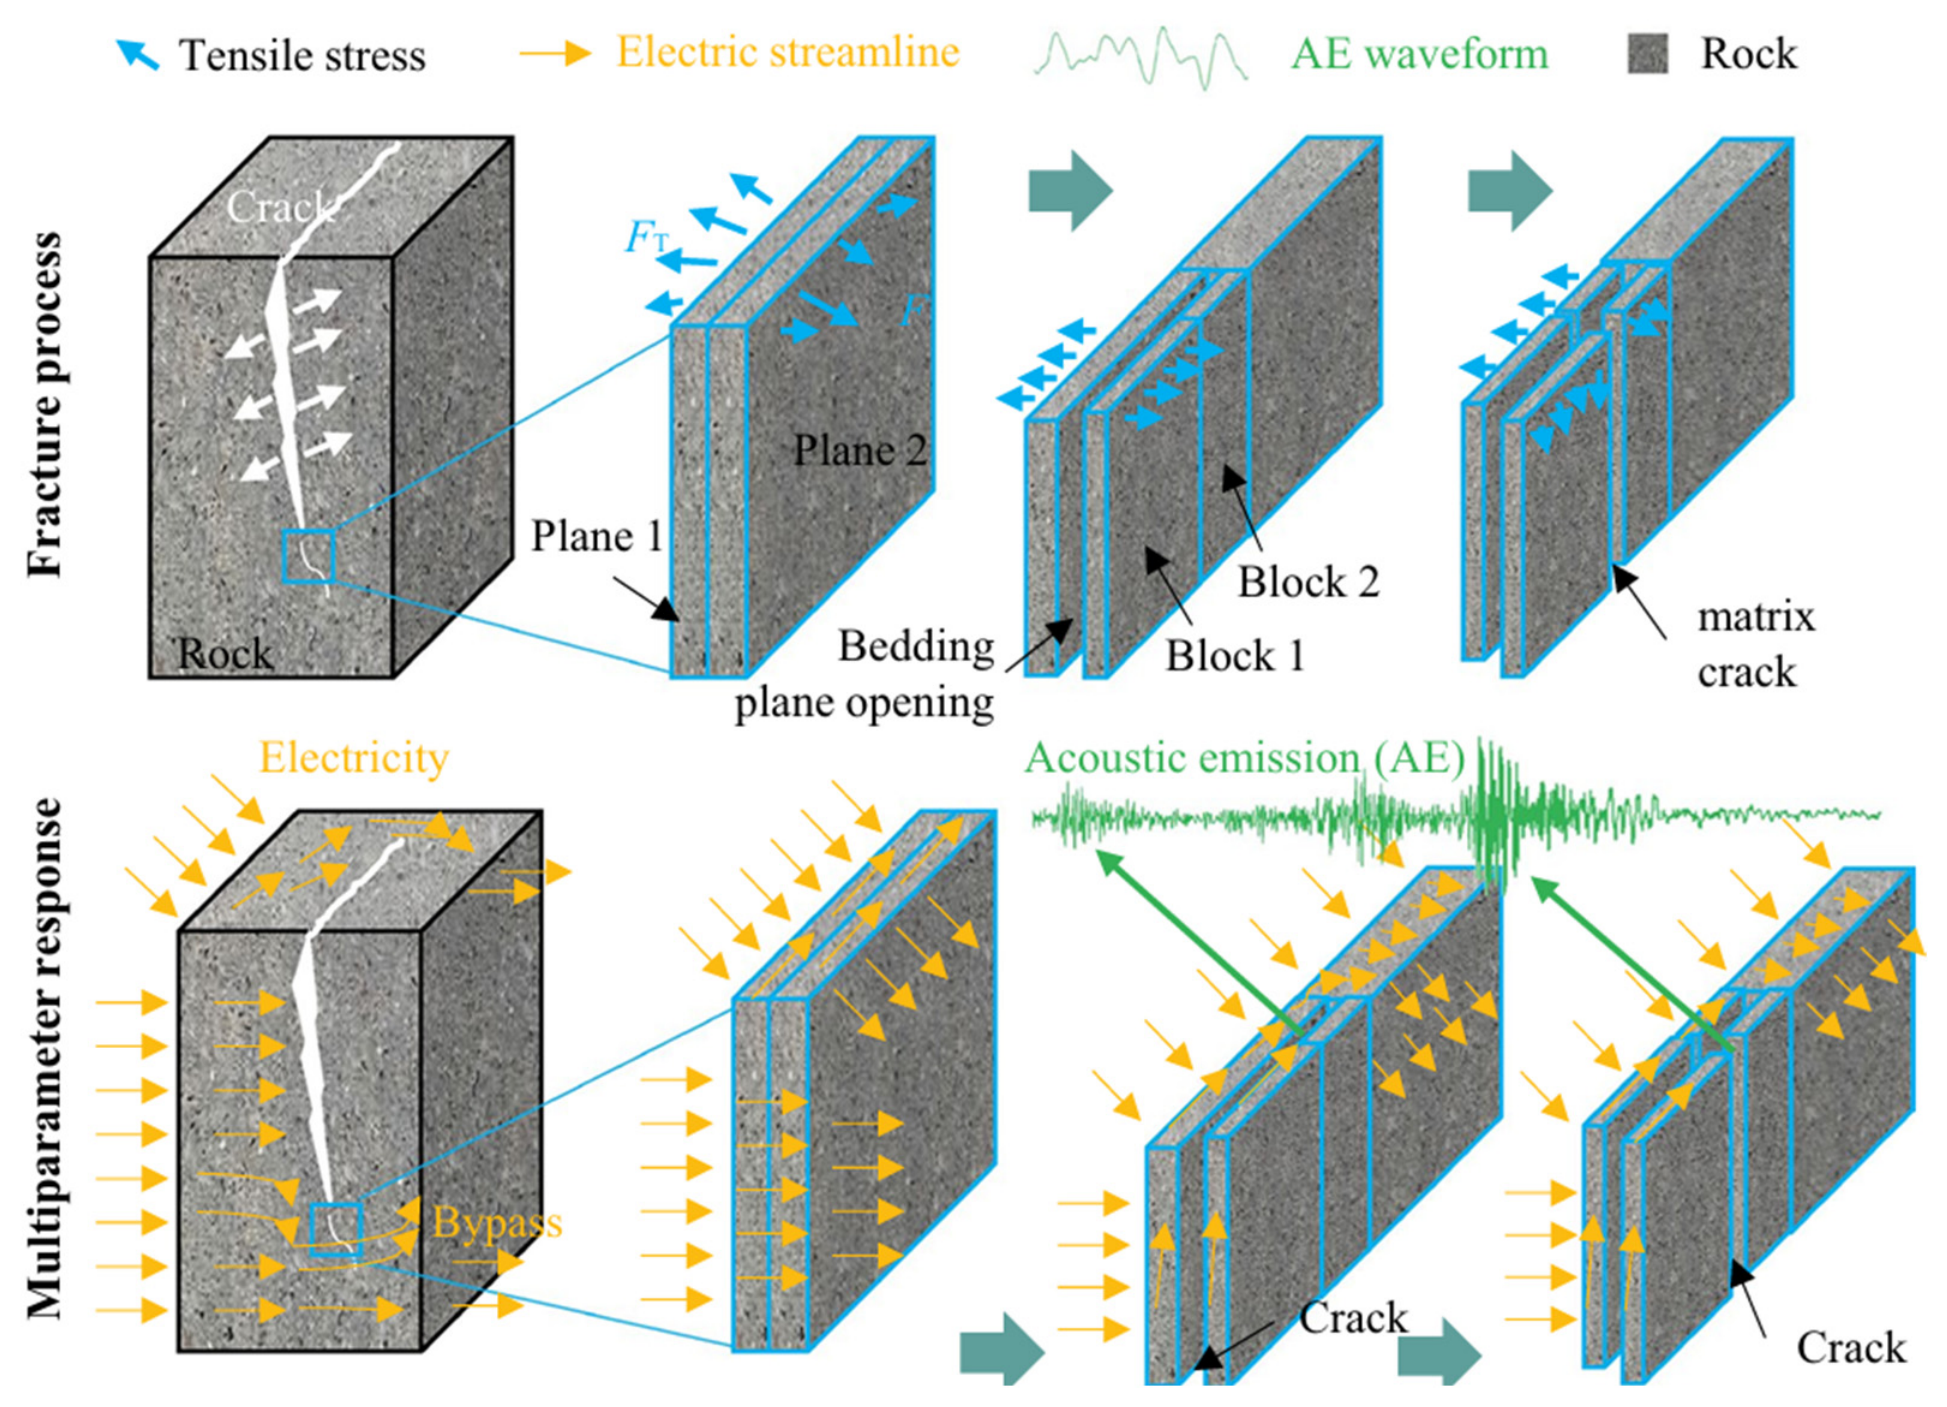
Recent studies have demonstrated the advantages of multisource monitoring techniques in rock-mass damage evaluation. Jia et al. [128] and Katayama et al. [149] used combined resistivity and ultrasonic monitoring to simultaneously evaluate conductive network reconstruction and the evolution of medium integrity. Sun et al. [150] integrated resistivity, ultrasonic testing, and nuclear magnetic resonance to comprehensively characterize pore structure, skeleton integrity, and fracture connectivity during thermal damage of hot dry rock. Song et al. [151] combined resistivity monitoring, AE testing, finite-element numerical simulation, and mesoscopic fracture-surface analysis to investigate the electrical and acoustic response characteristics during rock damage and fracture, as shown in Figure 10. The results showed that bedding-plane opening and matrix crack propagation altered the internal conductive paths, resulting in redistribution of current density and changes in the electric potential field and resistivity. Meanwhile, AE energy release exhibited good correspondence with changes in fracture energy. They considered that resistivity reflects changes in the conductive network, whereas AE reflects the energy release process, and that combined electrical–acoustic analysis can help accurately identify crack propagation and damage development. In addition, Yin and Xu [152] combined AC impedance spectroscopy, an equivalent circuit model, and CT scanning to analyze the corresponding relationships between the evolution of electrical parameters and crack initiation, propagation, and coalescence. Zhang et al. [24] integrated resistivity, AE, and CT information to establish a coupled resistivity–AE damage variable for quantitatively describing rock-mass damage evolution under different water-bearing conditions.
Overall, multisource monitoring techniques can not only improve the reliability of rock-mass damage identification but also help establish the relationships among conductive network changes, crack propagation, energy release, and macroscopic deformation. Future studies should further integrate electrical monitoring, mechanical testing, mesoscopic imaging, and intelligent data analysis to develop rock-mass damage evaluation models based on multisource information fusion, providing a theoretical basis for the monitoring and early warning of engineering rock-mass hazards.

5.3. Electrical Precursor Identification and Early Warning of Rock Instability

The transition of rock masses from stable damage evolution to macroscopic instability usually involves rapid crack propagation and damage localization. As rock masses approach instability, rapid reorganization of the pore–fracture structure and conductive paths causes abrupt changes in charge transport paths, resulting in pronounced anomalies in resistivity, impedance, self-potential, and other electrical parameters. Therefore, the essence of electrical precursors to rock-mass instability is not the anomalous variation of a single electrical parameter but the macroscopic electrical response associated with the transition of the conductive network from continuous evolution to critical reconstruction. Accurate identification of this critical evolution process is a prerequisite for predicting rock-mass instability using electrical information.
As rock masses approach instability, crack propagation accelerates and local damage accumulates rapidly. At the same time, the conductive network develops from local reconstruction toward overall interconnection. The corresponding electrical response then shows abrupt changes, stronger fluctuations, spatial heterogeneity [153], and statistical criticality [154]. Different types of electrical precursors, including abrupt decreases in resistivity, enhanced electrical anisotropy, intensified temporal fluctuations, and anomalous statistical parameters, correspond to different physical processes, such as enhanced conductive network connectivity, directional crack propagation, damage localization, and the formation of a critical state, respectively.
Related studies have shown that electrical anomalies can provide a basis for identifying the instability stage of rock masses. Sun et al. [16] found that an abrupt change in resistivity occurred before the peak strength and could be used to determine the transition of rock masses from stable damage to unstable failure. Jia et al. [25] combined resistivity monitoring, AE, and DIC to monitor saturated red sandstone under shear. The results showed that the abrupt decrease in resistivity during the unstable crack propagation stage reflected rapid changes in the conductive network during local crack coalescence and could serve as a precursor to shear instability. As shown in Figure 11, with increasing shear rate, the AE signals decrease significantly and enter a quiet period during shearing, whereas resistivity continues to decrease, indicating that resistivity can effectively characterize damage evolution within the rock during the AE quiet period. In addition, resistivity exhibits higher sensitivity and earlier warning capability during the unstable crack propagation stage. Song et al. [155] proposed using the standard deviation of resistivity to quantitatively characterize electrical fluctuations. Its peak value showed a clear correspondence with the abrupt increase in AE energy and could be used as an early-warning indicator of dynamic hazards. Shan et al. [156] further showed that the statistical characteristics of electrical signals change abruptly near instability and can be used to identify the transition of rock masses into a critical state. At the engineering scale, methods such as time-lapse resistivity monitoring, normalized resistivity change rate, and resistivity imaging have been applied to hazard risk analysis in slopes, mines, and underground engineering, further promoting the application of electrical monitoring from the laboratory scale to the engineering scale [157,158,159].
Electrical precursors near rock-mass instability essentially reflect the transition of the conductive network from continuous evolution to critical reconstruction under accelerated crack propagation and damage localization. In recent years, electrical monitoring has gradually developed from conventional anomaly identification into a rock-mass damage monitoring and early-warning method integrating multiparameter and multiscale information, showing good application prospects in rock-mass damage evaluation and engineering hazard early warning. However, electrical precursor characteristics are affected by factors such as lithology, water-bearing state, and measurement method, and unified criteria for different indicators have not yet been established. Future studies should further integrate conductive network evolution theory, multisource information fusion, and intelligent prediction methods to establish an electrical precursor identification theory with a unified physical basis and broad applicability, providing more reliable theoretical support for risk prediction of complex geotechnical engineering hazards.

6. Discussion

Overall, existing studies show that although the evolution of rock-mass resistivity varies under different conditions, its common physical basis lies in the adjustment and reconstruction of internal conductive networks. Differences in conductive phase composition, fracture connectivity, and fluid occurrence conditions may cause similar structural changes to produce different or even opposite resistivity responses. This is because fracture propagation, pore compaction, fluid migration, changes in water saturation, and temperature effects are not independent of each other but jointly influence the electrical responses of rock masses by altering conductive paths and charge transport processes. Therefore, rather than focusing only on whether resistivity increases or decreases, greater attention should be paid to abrupt resistivity changes, electrical anisotropy, and temporal anomalies that occur as conductive networks evolve from local adjustment to overall connectivity and critical reconstruction.
Taking conductive network evolution as the main thread can link multiphase conduction mechanisms, electrical monitoring, resistivity evolution, and the damage-to-instability process of rock masses, providing a unified physical framework for interpreting electrical anomalies under different experimental conditions and observation scales. In existing studies, the quantitative relationships between electrical anomalies and conductive network evolution under different environmental and loading conditions remain insufficiently clear, and the applicability of these relationships also varies with lithology, water saturation, and observation scale. In particular, under the combined effects of multiple factors, similar resistivity anomalies may correspond to different internal structural changes, resulting in uncertainty in damage assessment based on a single electrical parameter.

7. Conclusions and Perspectives

Research on the electrical responses of rock masses has gradually developed from early static physical-property analysis focused on resistivity logging and oil and gas reservoir evaluation into an important research direction for damage identification, hazard monitoring, and instability early warning in complex rock masses. Advances in ERT, time-lapse electrical monitoring, digital rock, multiscale numerical simulation, and artificial intelligence have broadened the scope of electrical studies of rock masses. Research now goes beyond the description of macroscopic electrical responses to examine micro- and mesoscopic physical mechanisms, while single-parameter analysis is increasingly combined with information from multiple sources. Static resistivity measurements are also being extended to dynamic monitoring of conductive networks. These developments offer a new way to continuously identify damage evolution in complex rock masses.
This review brings together nearly three decades of research on the electrical behavior of rock masses, covering multiphase conduction theories, electrical monitoring techniques, conductive network evolution, and engineering applications. The electrical response of a rock mass originates essentially from charge transport within a multiphase conductive network. Crack propagation, pore compaction, fluid migration, temperature changes, and stress adjustment modify the paths of current flow, and these changes are reflected in the macroscopic electrical parameters of the rock mass. Conductive network evolution can therefore provide a unified physical framework linking multiphase conduction, electrical monitoring, resistivity evolution, and hazard early warning. It also allows results from laboratory studies, engineering monitoring, and regional geoelectrical observations to be examined across different scales and offers a new perspective for developing a cross-scale theory of the electrical behavior of rock masses.
Several problems remain unresolved despite recent progress in electrical studies of rock masses. The mechanisms governing the dynamic evolution of multiphase conductive networks under coupled stress, seepage, and temperature are not yet well understood, particularly the interactions between different conductive phases. A quantitative link between conductive network evolution and electrical response has also not been established, which limits the use of electrical parameters to evaluate rock-mass damage and instability probability. Another difficulty is the lack of a cross-scale theory that can connect results from laboratory tests, engineering monitoring, and regional geoelectrical observations. Further work is also needed to integrate electrical monitoring more closely with AE, microseismic monitoring, fiber-optic sensing, and DIC and to develop artificial-intelligence-driven methods for electrical feature recognition and intelligent early warning.
Future research on the electrical properties of rock masses should place greater emphasis on the mechanisms of conductive network evolution, quantitative characterization of electrical responses, and identification of instability precursors. Digital rock models and numerical simulations of electrical behavior can be further developed to elucidate the interactions among pore–fracture structures, fluid distribution, and multiphase conductive networks under coupled multi-physics conditions and to clarify the scale-dependent evolution of rock-mass resistivity and the corresponding parameter relationships across different scales. Quantitative relationships between electrical responses and fracture propagation, localized damage, and internal structural evolution should also be established to enable dynamic characterization of rock-mass damage processes.
In parallel, greater integration of electrical monitoring with multisource monitoring techniques is needed to improve the reliability of damage and instability assessment. By combining criticality theory with artificial intelligence and data-driven methods, future studies may identify electrical precursor features with clear physical significance and establish more robust instability criteria and early-warning models for engineering applications. Ultimately, an integrated research framework encompassing fundamental theories, conductive network mechanisms, monitoring technologies, quantitative characterization, and engineering applications should be progressively developed. Such a framework would help move rock-mass electrical monitoring from empirical interpretation of resistivity anomalies toward mechanism-based characterization of damage evolution and instability, thereby providing a stronger theoretical basis and more reliable technical support for deep resource development, underground engineering safety, and the prediction and early warning of major geological hazards.

Author Contributions

Conceptualization, P.J.; methodology, P.J. and M.Z.; software, P.J., M.Z. and H.L.; validation, P.J., M.Z. and H.L.; formal analysis, P.J. and M.Z.; investigation, P.J. and M.Z.; resources, P.J. and H.L.; data curation, P.J. and M.Z.; writing—original draft preparation, P.J. and M.Z.; writing—review and editing, P.J., M.Z. and H.L.; supervision, P.J.; project administration, P.J.; funding acquisition, P.J. All authors have read and agreed to the published version of the manuscript.

Funding

This work was supported by the National Natural Science Foundation of China (52174071) and the Fundamental Research Funds for the Central Universities (N25DCG007).

Data Availability Statement

Data are available on request from the authors.

Conflicts of Interest

The authors declare no conflicts of interest.

References

  1. Bobet, A.; Einstein, H.H. Fracture coalescence in rock-type materials under uniaxial and biaxial compression. Int. J. Rock Mech. Min. Sci. 1998, 35, 863–888. [Google Scholar] [CrossRef] [Scilit]
  2. Cai, M.; Kaiser, P.K.; Tasaka, Y.; Maejima, T. Generalized crack initiation and crack damage stress thresholds of brittle rock masses near underground excavations. Int. J. Rock Mech. Min. Sci. 2004, 41, 833–847. [Google Scholar] [CrossRef] [Scilit]
  3. Zhao, F.; Shi, Z.; Yu, S.; Zheng, H. A review of fracture mechanic behaviors of rocks containing various defects. Undergr. Space 2023, 12, 102–115. [Google Scholar] [CrossRef] [Scilit]
  4. He, M.; Wang, Q. Rock dynamics in deep mining. Int. J. Min. Sci. Technol. 2023, 33, 1065–1082. [Google Scholar] [CrossRef] [Scilit]
  5. Ma, D.; Duan, H.; Zhang, J.; Bai, H. A state-of-the-art review on rock seepage mechanism of water inrush disaster in coal mines. Int. J. Coal Sci. Technol. 2022, 9, 50. [Google Scholar] [CrossRef] [Scilit]
  6. Zhao, Z.; Yang, J.; Kang, Y.; Xiao, Y. Microcrack monitoring and fracture evolution of coal and rock using integrated acoustic emission and digital image correlation techniques. Sci. Rep. 2024, 14, 8063. [Google Scholar] [CrossRef] [Scilit]
  7. Jia, P.; Wang, Q.; Qian, Y.; Wang, Y. Variation characteristics of electric resistance in the quiet periods of acoustic emission of sandstone with different saturation. J. Cent. South Univ. 2023, 30, 1993–2003. [Google Scholar] [CrossRef] [Scilit]
  8. Li, R.; Prozzi, J.A.; Hong, F. Quantification of post-rainfall moisture content in pavement unbound layers using long-term pavement performance data. Transp. Res. Rec. 2026, 2680, 660–672. [Google Scholar] [CrossRef] [Scilit]
  9. Ren, J.; Song, L.; Wang, Q.; Li, H.; Fan, J.; Yue, J.; Shen, H. Development of multi-field rock resistivity test system for THMC. Solid Earth 2023, 14, 261–270. [Google Scholar] [CrossRef] [Scilit]
  10. Wang, Z.; Wang, J.; Wei, S.; Hu, J.; Li, Y. Analysis of influencing factors and its coupling degree of resistivity of rocks. J. Phys. Conf. Ser. 2024, 2827, 012002. [Google Scholar] [CrossRef] [Scilit]
  11. Bai, G.; Sun, Q.; Geng, J.; Wang, S.; Jing, X. Resistivity of granite and sandstone varies with frequency and water saturation. Geomech. Geophys. Geo-Energy Geo-Resour. 2022, 8, 198. [Google Scholar] [CrossRef] [Scilit]
  12. Xie, T.; Xue, Y.; Ye, Q.; Lu, J. Anisotropic change in apparent resistivity before earthquakes of MS ≥ 7.0 in China mainland. Geomat. Nat. Hazards Risk 2022, 13, 1207–1228. [Google Scholar] [CrossRef] [Scilit]
  13. Umezawa, R.; Nishiyama, N.; Katsura, M.; Nakashima, S. Electrical conductance of a sandstone partially saturated with varying concentrations of NaCl solutions. Geophys. J. Int. 2017, 209, 1287–1295. [Google Scholar] [CrossRef] [Scilit]
  14. Han, T.; He, H.; Fu, L.-Y. New insights into how temperature affects the electrical conductivity of clay-free porous rocks. Geophys. J. Int. 2024, 238, 313–320. [Google Scholar] [CrossRef] [Scilit]
  15. Zhang, W.; Sun, J.; Lu, H.; Pan, Z. Experimental study on the variation of wave velocity and resistivity of limestone under heating temperature and cooling condition within 200 °C. Environ. Earth Sci. 2025, 84, 491. [Google Scholar] [CrossRef] [Scilit]
  16. Sun, Q.; Zhu, S.; Xue, L. Electrical resistivity variation in uniaxial rock compression. Arab. J. Geosci. 2015, 8, 1869–1880. [Google Scholar] [CrossRef] [Scilit]
  17. Archie, G.E. The electrical resistivity log as an aid in determining some reservoir characteristics. Trans. AIME 1942, 146, 54–62. [Google Scholar] [CrossRef] [Scilit]
  18. Glover, P.W.J.; Hole, M.J.; Pous, J. A modified Archie’s law for two conducting phases. Earth Planet. Sci. Lett. 2000, 180, 369–383. [Google Scholar] [CrossRef] [Scilit]
  19. Ducut, J.D.; Alipio, M.; Go, P.J.; Concepcion, R., II; Vicerra, R.R.; Bandala, A.; Dadios, E. A review of electrical resistivity tomography applications in underground imaging and object detection. Displays 2022, 73, 102208. [Google Scholar] [CrossRef] [Scilit]
  20. Robinson, J.; Slater, L.; Johnson, T.; Shapiro, A.; Tiedeman, C.; Ntarlagiannis, D.; Johnson, C.; Day-Lewis, F.; Lacombe, P.; Imbrigiotta, T.; et al. Imaging pathways in fractured rock using three-dimensional electrical resistivity tomography. Groundwater 2016, 54, 186–201. [Google Scholar] [CrossRef] [Scilit]
  21. Kuras, O.; Pritchard, J.D.; Meldrum, P.I.; Chambers, J.E.; Wilkinson, P.B.; Ogilvy, R.D.; Wealthall, G.P. Monitoring hydraulic processes with automated time-lapse electrical resistivity tomography (ALERT). Comptes Rendus Geosci. 2009, 341, 868–885. [Google Scholar] [CrossRef] [Scilit]
  22. Singha, K.; Day-Lewis, F.D.; Johnson, T.; Slater, L.D. Advances in interpretation of subsurface processes with time-lapse electrical imaging. Hydrol. Process. 2015, 29, 1549–1576. [Google Scholar] [CrossRef] [Scilit]
  23. Wang, S.; Tan, M.; Wang, X.; Zhang, L. Microscopic response mechanism of electrical properties and saturation model establishment in fractured carbonate rocks. J. Pet. Sci. Eng. 2022, 208, 109429. [Google Scholar] [CrossRef] [Scilit]
  24. Zhang, S.; Bai, W.; Xu, D.-P.; Zheng, H.; Jiang, Q.; Li, Z.-W. Damage evolution in sandstone under uniaxial cyclic loading and varying water contents: Theoretical and experimental investigation. J. Cent. South Univ. 2025, 32, 3095–3110. [Google Scholar] [CrossRef] [Scilit]
  25. Jia, P.; Zhang, D.; Liu, C.; Sun, B.; Zeng, Z. Precursory electrical resistivity signatures of shear failure in saturated sandstone under varying shear rates. Sci. Rep. 2026, 16, 2900. [Google Scholar] [CrossRef] [Scilit]
  26. Zhan, W.; Chen, Y.; Liu, Q.; Li, J.; Sacchi, M.D.; Zhuang, M.; Liu, Q.H. Simultaneous prediction of petrophysical properties and formation layered thickness from acoustic logging data using a modular cascading residual neural network (MCARNN) with physical constraints. J. Appl. Geophys. 2024, 224, 105362. [Google Scholar] [CrossRef] [Scilit]
  27. Ryazantsev, P.; Deines, Y. Electrical resistivity tomography for characterization of carbon-rich rocks (shungites). J. Appl. Geophys. 2022, 203, 104667. [Google Scholar] [CrossRef] [Scilit]
  28. Han, T.; Clennell, M.B.; Pervukhina, M. Modelling the low-frequency electrical properties of pyrite-bearing reservoir sandstones. Mar. Pet. Geol. 2015, 68, 341–351. [Google Scholar] [CrossRef] [Scilit]
  29. Merritt, A.J.; Chambers, J.E.; Wilkinson, P.B.; West, L.J.; Murphy, W.; Gunn, D.; Uhlemann, S. Measurement and modelling of moisture–electrical resistivity relationship of fine-grained unsaturated soils and electrical anisotropy. J. Appl. Geophys. 2016, 124, 155–165. [Google Scholar] [CrossRef] [Scilit]
  30. Pan, B.; Ruhan, A.; Guo, Y.; Zhang, L.; Wei, B.; Zhou, W. Study on the relationship between complex resistivity and water saturation in fractured rock at low frequency. Chin. J. Geophys. 2021, 64, 3774–3787. [Google Scholar] [CrossRef]
  31. Dong, H.; Zhu, X.; Jiang, X.; Chen, L.; Gao, Q.-F. Structural characteristics of soil-rock mixtures based on electrochemical impedance spectroscopy. CATENA 2021, 207, 105579. [Google Scholar] [CrossRef] [Scilit]
  32. Yang, C.; Liu, S.; Yang, H. Self-potential response characteristics of red sandstone samples under uniaxial compression. J. Geophys. Eng. 2019, 16, 742–752. [Google Scholar] [CrossRef] [Scilit]
  33. Yang, C.; Liu, S.; Liu, J.; Yang, H.; Xie, J. Characteristics of self-potential of coal samples under uniaxial compression. J. Appl. Geophys. 2019, 168, 1–11. [Google Scholar] [CrossRef] [Scilit]
  34. Ou, Y.; Zhang, P.; Fu, M.; Hu, X.; Wu, R.; Liu, C.; Sun, B.; Xu, S.; Li, S.; Tan, L. Geoelectric field response characteristics analysis of floor roadway surrounding rock fracture caused due to coal seam mining. Sci. Rep. 2021, 11, 22361. [Google Scholar] [CrossRef] [Scilit]
  35. Sun, Z.; Mehmani, A.; Torres-Verdín, C. Pore-scale investigation of the electrical resistivity of saturated porous media: Flow patterns and porosity efficiency. J. Geophys. Res. Solid Earth 2021, 126, e2021JB022608. [Google Scholar] [CrossRef] [Scilit]
  36. Winsauer, W.O.; Shearin, H.M., Jr.; Masson, P.H.; Williams, M. Resistivity of brine-saturated sands in relation to pore geometry. AAPG Bull. 1952, 36, 253–277. [Google Scholar] [CrossRef] [Scilit]
  37. Sun, Z.; Torres-Verdín, C. The role of pore-shape and pore-space heterogeneity in non-Archie behavior of resistivity index curves. J. Geophys. Res. Solid Earth 2022, 127, e2022JB024792. [Google Scholar] [CrossRef] [Scilit]
  38. Sitaresmi, R.; Rosidelly; Mega, L.; Fathaddin, M.T. Laboratory study: The effect of clay mineral in sandstone on resistivity of rock. IOP Conf. Ser. Earth Environ. Sci. 2021, 819, 012025. [Google Scholar] [CrossRef] [Scilit]
  39. Meng, H.; Ye, Y.; Liu, T.; Liu, S.; Yang, C.; Wang, L. Theoretical study on rock-electric characteristics of complex shaly sandstones and its application to reservoir saturation evaluation. Nat. Resour. Res. 2023, 32, 795–811. [Google Scholar] [CrossRef] [Scilit]
  40. Kirkby, A.; Heinson, G.; Krieger, L. Relating permeability and electrical resistivity in fractures using random resistor network models. J. Geophys. Res. Solid Earth 2016, 121, 1546–1564. [Google Scholar] [CrossRef] [Scilit]
  41. Kirkby, A.; Heinson, G. Three-dimensional resistor network modeling of the resistivity and permeability of fractured rocks. J. Geophys. Res. Solid Earth 2017, 122, 2653–2669. [Google Scholar] [CrossRef] [Scilit]
  42. Waxman, M.H.; Smits, L.J.M. Electrical conductivities in oil-bearing shaly sands. Soc. Pet. Eng. J. 1968, 8, 107–122. [Google Scholar] [CrossRef] [Scilit]
  43. Clavier, C.; Coates, G.; Dumanoir, J. Theoretical and experimental bases for the dual-water model for interpretation of shaly sands. Soc. Pet. Eng. J. 1984, 24, 153–168. [Google Scholar] [CrossRef] [Scilit]
  44. McCarter, W.J.; Desmazes, P. Soil characterization using electrical measurements. Géotechnique 1997, 47, 179–183. [Google Scholar] [CrossRef] [Scilit]
  45. Kahraman, S.; Alber, M. Predicting the physico-mechanical properties of rocks from electrical impedance spectroscopy measurements. Int. J. Rock Mech. Min. Sci. 2006, 43, 543–553. [Google Scholar] [CrossRef] [Scilit]
  46. Maurya, V.P.; Gupta, S.M.; Mishra, A.; Chandra, S.; Tiwari, V.M. Three-dimensional electric-field vector resistivity imaging for deep subsurface fractures network in heterogeneous crystalline rocks. Geophys. J. Int. 2024, 236, 305–321. [Google Scholar] [CrossRef] [Scilit]
  47. Loke, M.H.; Chambers, J.E.; Rucker, D.F.; Kuras, O.; Wilkinson, P.B. Recent developments in the direct-current geoelectrical imaging method. J. Appl. Geophys. 2013, 95, 135–156. [Google Scholar] [CrossRef] [Scilit]
  48. Whiteley, J.S.; Chambers, J.E.; Uhlemann, S.; Wilkinson, P.B.; Kendall, J.M. Geophysical monitoring of moisture-induced landslides: A review. Rev. Geophys. 2019, 57, 106–145. [Google Scholar] [CrossRef] [Scilit]
  49. Dimech, A.; Cheng, L.Z.; Chouteau, M.; Chambers, J.; Uhlemann, S.; Wilkinson, P.; Meldrum, P.; Mary, B.; Fabien-Ouellet, G.; Isabelle, A. A review on applications of time-lapse electrical resistivity tomography over the last 30 years: Perspectives for mining waste monitoring. Surv. Geophys. 2022, 43, 1699–1759. [Google Scholar] [CrossRef] [Scilit]
  50. Afshar, A.; Abedi, M.; Norouzi, G.-H.; Riahi, M.-A. Geophysical investigation of underground water content zones using electrical resistivity tomography and ground penetrating radar: A case study in Hesarak-Karaj, Iran. Eng. Geol. 2015, 196, 183–193. [Google Scholar] [CrossRef] [Scilit]
  51. Perrone, A.; Lapenna, V.; Piscitelli, S. Electrical resistivity tomography technique for landslide investigation: A review. Earth-Sci. Rev. 2014, 135, 65–82. [Google Scholar] [CrossRef] [Scilit]
  52. Zeng, H.; Zhang, Q.; Du, C.; Liu, J.; Li, Y. Quantitative relationship between electrical resistivity and water content in unsaturated loess: Theoretical model and ERT imaging verification. Geosciences 2025, 15, 302. [Google Scholar] [CrossRef] [Scilit]
  53. Wu, H.; Fu, P.; Yang, X.; Morris, J.P.; Johnson, T.C.; Settgast, R.R.; Ryerson, F.J. Accurate imaging of hydraulic fractures using templated electrical resistivity tomography. Geothermics 2019, 81, 74–87. [Google Scholar] [CrossRef] [Scilit]
  54. LaBrecque, D.J.; Sharpe, R.; Wood, T.; Heath, G. Small-scale electrical resistivity tomography of wet fractured rocks. Groundwater 2004, 42, 111–118. [Google Scholar] [CrossRef] [Scilit]
  55. Jomard, H.; Lebourg, T.; Guglielmi, Y.; Tric, E. Electrical imaging of sliding geometry and fluids associated with a deep seated landslide (La Clapière, France). Earth Surf. Process. Landf. 2010, 35, 588–599. [Google Scholar] [CrossRef] [Scilit]
  56. Ha, H.S.; Kim, D.S.; Park, I.J. Application of electrical resistivity techniques to detect weak and fracture zones during underground construction. Environ. Earth Sci. 2010, 60, 723–731. [Google Scholar] [CrossRef] [Scilit]
  57. Zhang, X. Numerical simulation study on the detection of weak structural plane of rock slope by using 3D electrical resistivity tomography. Engineering 2016, 8, 438–444. [Google Scholar] [CrossRef][Green Version]
  58. Pang, Y.; Liu, Z.; Nie, L.; Zhang, Y.; Shao, J.; Bai, P.; Dong, Z. 3D multi-scale resistivity inversion method applied in the tunnel face to borehole observations for tunnel-ahead prospecting. J. Appl. Geophys. 2022, 196, 104510. [Google Scholar] [CrossRef] [Scilit]
  59. Lapenna, V.; Perrone, A. Time-lapse electrical resistivity tomography (TL-ERT) for landslide monitoring: Recent advances and future directions. Appl. Sci. 2022, 12, 1425. [Google Scholar] [CrossRef] [Scilit]
  60. Cassiani, G.; Bruno, V.; Villa, A.; Fusi, N.; Binley, A.M. A saline trace test monitored via time-lapse surface electrical resistivity tomography. J. Appl. Geophys. 2006, 59, 244–259. [Google Scholar] [CrossRef] [Scilit]
  61. Müller, K.; Vanderborght, J.; Englert, A.; Kemna, A.; Huisman, J.A.; Rings, J.; Vereecken, H. Imaging and characterization of solute transport during two tracer tests in a shallow aquifer using electrical resistivity tomography and multilevel groundwater samplers. Water Resour. Res. 2010, 46, W03502. [Google Scholar] [CrossRef] [Scilit]
  62. Perri, M.T.; Cassiani, G.; Gervasio, I.; Deiana, R.; Binley, A. A saline tracer test monitored via both surface and cross-borehole electrical resistivity tomography: Comparison of time-lapse results. J. Appl. Geophys. 2012, 79, 6–16. [Google Scholar] [CrossRef] [Scilit]
  63. Chambers, J.E.; Gunn, D.A.; Wilkinson, P.B.; Meldrum, P.I.; Haslam, E.; Holyoake, S.; Kirkham, M.; Kuras, O.; Merritt, A.; Wragg, J. 4D electrical resistivity tomography monitoring of soil moisture dynamics in an operational railway embankment. Near Surf. Geophys. 2014, 12, 61–72. [Google Scholar] [CrossRef] [Scilit]
  64. Farzamian, M.; Blanchy, G.; McLachlan, P.; Vieira, G.; Esteves, M.; De Pablo, M.A.; Triantafilis, J.; Lippmann, E.; Hauck, C. Advancing permafrost monitoring with autonomous electrical resistivity tomography (A-ERT): Low-cost instrumentation and open-source data processing tool. Geophys. Res. Lett. 2024, 51, e2023GL105770. [Google Scholar] [CrossRef] [Scilit]
  65. Farzamian, M.; Herring, T.; Vieira, G.; de Pablo, M.A.; Tabar, B.Y.; Hauck, C. Employing automated electrical resistivity tomography for detecting short- and long-term changes in permafrost and active-layer dynamics in the Maritime Antarctic. Cryosphere 2024, 18, 4197–4213. [Google Scholar] [CrossRef] [Scilit]
  66. Shin, S.; Park, S.; Kim, J.-H. Time-lapse electrical resistivity tomography characterization for piping detection in earthen dam model of a sandbox. J. Appl. Geophys. 2019, 170, 103834. [Google Scholar] [CrossRef] [Scilit]
  67. Glover, P.W.J.; Gómez, J.B.; Meredith, P.G. Fracturing in saturated rocks undergoing triaxial deformation using complex electrical conductivity measurements: Experimental study. Earth Planet. Sci. Lett. 2000, 183, 201–213. [Google Scholar] [CrossRef] [Scilit]
  68. Jouniaux, L.; Zamora, M.; Reuschlé, T. Electrical conductivity evolution of non-saturated carbonate rocks during deformation up to failure. Geophys. J. Int. 2006, 167, 1017–1026. [Google Scholar] [CrossRef] [Scilit][Green Version]
  69. Mifkovic, M.; Swidinsky, A.; Mooney, M. Imaging ahead of a tunnel boring machine with DC resistivity: A laboratory and numerical study. Tunn. Undergr. Space Technol. 2021, 108, 103703. [Google Scholar] [CrossRef] [Scilit]
  70. Johnson, T.C.; Knox, H.A.; Strickland, C.; Johnson, C.; Lowrey, J.; Sprinkle, D.P.; Linneman, D.; Vermeul, V.; Robey, E.; Chojnicki, K.; et al. 3D time-lapse electrical resistivity imaging of rock damage patterns and gas flow paths resulting from two underground chemical explosions. Pure Appl. Geophys. 2023, 180, 1439–1455. [Google Scholar] [CrossRef] [Scilit]
  71. Nie, L.; Jia, S.; Li, Z.-Q.; Guo, Q.; Wang, T.; Du, Y.; Li, S.; Jing, P. A high resolution detection approach combining probe drilling and horizontal cross-hole resistivity tomography to interpret water conducting channels ahead of the tunnel: A case study in Yunnan, China. Eng. Geol. 2024, 331, 107449. [Google Scholar] [CrossRef] [Scilit]
  72. Bedrosian, P.A.; Unsworth, M.J.; Egbert, G. Magnetotelluric imaging of the creeping segment of the San Andreas Fault near Hollister. Geophys. Res. Lett. 2002, 29, 1506. [Google Scholar] [CrossRef] [Scilit]
  73. Unsworth, M.; Bedrosian, P.A. Electrical resistivity structure at the SAFOD site from magnetotelluric exploration. Geophys. Res. Lett. 2004, 31, L12S05. [Google Scholar] [CrossRef] [Scilit]
  74. Rawat, G.; Arora, B.R.; Gupta, P.K. Electrical resistivity cross-section across the Garhwal Himalaya: Proxy to fluid-seismicity linkage. Tectonophysics 2014, 637, 68–79. [Google Scholar] [CrossRef] [Scilit]
  75. Du, X. Two types of changes in apparent resistivity in earthquake prediction. Sci. China Earth Sci. 2011, 54, 145–156. [Google Scholar] [CrossRef] [Scilit]
  76. Lu, J.; Xie, T.; Li, M.; Wang, Y.; Ren, Y.; Gao, S.; Wang, L.; Zhao, J. Monitoring shallow resistivity changes prior to the 12 May 2008 M 8.0 Wenchuan earthquake on the Longmen Shan tectonic zone, China. Tectonophysics 2016, 675, 244–257. [Google Scholar] [CrossRef] [Scilit]
  77. Xie, T.; Han, Y.; Ye, Q.; Xue, Y. Changes and mechanisms of apparent resistivity before earthquakes of MS 6.0–6.9 on the Chinese mainland. Front. Earth Sci. 2023, 11, 1187660. [Google Scholar] [CrossRef] [Scilit]
  78. North, L.; Best, A.I.; Sothcott, J.; MacGregor, L. Laboratory determination of the full electrical resistivity tensor of heterogeneous carbonate rocks at elevated pressures. Geophys. Prospect. 2013, 61, 458–470. [Google Scholar] [CrossRef] [Scilit]
  79. Zhang, Z.; Gao, C.; Gao, Y.; Niu, C.; Ma, S. Theoretical simulation of the resistivity and fractured-cavernous structures of carbonate reservoirs. Processes 2024, 12, 43. [Google Scholar] [CrossRef] [Scilit]
  80. Abousrafa, E.M.; Somerville, J.M.; Hamilton, S.A.; Olden, P.W.H.; Smart, B.D.G.; Ford, J. Pore geometrical model for the resistivity of brine saturated rocks. J. Pet. Sci. Eng. 2009, 65, 113–122. [Google Scholar] [CrossRef] [Scilit]
  81. Müller-Huber, E.; Schön, J.; Börner, F. The effect of a variable pore radius on formation resistivity factor. J. Appl. Geophys. 2015, 116, 173–179. [Google Scholar] [CrossRef] [Scilit]
  82. Li, W.; Zou, C.; Wang, H.; Peng, C. A model for calculating the formation resistivity factor in low and middle porosity sandstone formations considering the effect of pore geometry. J. Pet. Sci. Eng. 2017, 152, 193–203. [Google Scholar] [CrossRef] [Scilit]
  83. Zhao, J.; Sun, J.; Liu, X.; Chen, H.; Cui, L. Numerical simulation of the electrical properties of fractured rock based on digital rock technology. J. Geophys. Eng. 2013, 10, 055009. [Google Scholar] [CrossRef] [Scilit]
  84. Ammar, A.I. Development of numerical model for simulating resistivity and hydroelectric properties of fractured rock aquifers. J. Appl. Geophys. 2021, 189, 104319. [Google Scholar] [CrossRef] [Scilit]
  85. Li, K.; Pan, B.; Horne, R. Evaluating fractures in rocks from geothermal reservoirs using resistivity at different frequencies. Energy 2015, 93, 1230–1238. [Google Scholar] [CrossRef] [Scilit]
  86. Pan, B.; Ruhan, A.; Guo, Y.; Zhang, L.; Wei, B.; Zhou, W. An experimental study on the complex resistivity of fractured rock under different saturation conditions. Acta Geophys. 2022, 70, 1061–1081. [Google Scholar] [CrossRef] [Scilit]
  87. He, F.; Tong, X.; Xiang, K.; Yan, L.; Shi, Y.; Hu, Z.; Wang, X.; Zhang, C. Study on fracture complexity of shale hydraulic fracturing based on complex resistivity. J. Appl. Geophys. 2025, 241, 105854. [Google Scholar] [CrossRef] [Scilit]
  88. Friedman, S.P. Soil properties influencing apparent electrical conductivity: A review. Comput. Electron. Agric. 2005, 46, 45–70. [Google Scholar] [CrossRef] [Scilit]
  89. He, X.; Zheng, X.; Pu, Z.; Qin, W.; Duan, D.; Xie, P.; Zhang, Q. Experimental study of the influence of saturation on the resistivity response of sandstone. Front. Earth Sci. 2024, 12, 1301184. [Google Scholar] [CrossRef] [Scilit]
  90. Suzuki, T.; Yoshimura, R.; Yamazaki, K.; Minami, T.; Sawayama, K.; Oshiman, N. Dependence of resistivity of natural rock samples on humidity. J. Appl. Geophys. 2024, 220, 105271. [Google Scholar] [CrossRef] [Scilit]
  91. Revil, A.; Cathles, L.M.; Losh, S.; Nunn, J.A. Electrical conductivity in shaly sands with geophysical applications. J. Geophys. Res. 1998, 103, 23925–23936. [Google Scholar] [CrossRef] [Scilit]
  92. Klein, K.A.; Santamarina, J.C. Electrical conductivity in soils: Underlying phenomena. J. Environ. Eng. Geophys. 2003, 8, 263–273. [Google Scholar] [CrossRef] [Scilit]
  93. Pimienta, L.; Sarout, J.; Esteban, L.; David, C.; Clennell, M.B. Pressure-dependent elastic and transport properties of porous and permeable rocks: Microstructural control. J. Geophys. Res. Solid Earth 2017, 122, 8952–8968. [Google Scholar] [CrossRef] [Scilit]
  94. Sawayama, K.; Ishibashi, T.; Jiang, F.; Tsuji, T.; Fujimitsu, Y. Relating hydraulic-electrical-elastic properties of natural rock fractures at elevated stress and associated transient changes of fracture flow. Rock Mech. Rock Eng. 2021, 54, 2145–2164. [Google Scholar] [CrossRef] [Scilit]
  95. Sawayama, K.; Ishibashi, T.; Jiang, F.; Tsuji, T. Relationship between permeability and resistivity of sheared rock fractures: The role of tortuosity and flow path percolation. Geophys. Res. Lett. 2023, 50, e2023GL104418. [Google Scholar] [CrossRef] [Scilit]
  96. Xu, Z.; Cheng, J.; Zhao, H. Coupled stress-apparent resistivity model for rock deformation and failure based on experimental analysis. Geomech. Energy Environ. 2026, 45, 100792. [Google Scholar] [CrossRef] [Scilit]
  97. Saltas, V.; Fitilis, I.; Vallianatos, F. A combined complex electrical impedance and acoustic emission study in limestone samples under uniaxial loading. Tectonophysics 2014, 637, 198–206. [Google Scholar] [CrossRef] [Scilit]
  98. Xia, H.; Jiang, S. Geostress effect on resistivity and its relevant correction method. Petroleum 2023, 9, 412–418. [Google Scholar] [CrossRef] [Scilit]
  99. Zhang, H.; Xue, B.; Liu, X.; Wei, J.; Ding, R.; Zhao, Y.; Liang, L.; Jia, Z. Study on the relationship between lithological differences and electromagnetic changes during mine water inrush. Lithosphere 2025, 2025, lithosphere_2024_184. [Google Scholar] [CrossRef] [Scilit]
  100. Dey, T.N. Permeability and electrical conductivity changes due to hydrostatic stress cycling of Berea and Muddy J sandstone. J. Geophys. Res. 1986, 91, 763–766. [Google Scholar] [CrossRef] [Scilit]
  101. Chen, M.; Li, M.; Bernabé, Y.; Zhao, J.Z.; Zhang, L.H.; Zhang, Z.Y.; Tang, Y.B.; Xiao, W.L. Effective pressure law for the intrinsic formation factor in low permeability sandstones. J. Geophys. Res. Solid Earth 2017, 122, 8709–8723. [Google Scholar] [CrossRef] [Scilit]
  102. Kolah-kaj, P.; Kord, S.; Soleymanzadeh, A. The effect of pressure on electrical rock typing, formation resistivity factor, and cementation factor. J. Pet. Sci. Eng. 2021, 204, 108757. [Google Scholar] [CrossRef] [Scilit]
  103. Zhang, W.Q.; Sun, Q.; Hao, S.Q.; Yang, L.N. Experimental study of the effect of thermal damage on resistivity and mechanical properties of sandstone. Acta Geodyn. Geomater. 2016, 13, 185–192. [Google Scholar] [CrossRef] [Scilit]
  104. Shao, Z.; Wang, D.; Wang, Y.; Zhong, X.; Tang, X.; Xi, D. Electrical resistivity of coal-bearing rocks under high temperature and the detection of coal fires using electrical resistance tomography. Geophys. J. Int. 2016, 204, 1316–1331. [Google Scholar] [CrossRef] [Scilit]
  105. Ming, F.; Li, D.Q.; Chen, L. Electrical resistivity of freezing clay: Experimental study and theoretical model. J. Geophys. Res. Earth Surf. 2020, 125, e2019JF005267. [Google Scholar] [CrossRef] [Scilit]
  106. Yang, X.; Jiang, A.; Guo, X. Effects of water content and temperature on creep properties of frozen red sandstone: An experimental study. Bull. Eng. Geol. Environ. 2022, 81, 51. [Google Scholar] [CrossRef] [Scilit]
  107. Oldenborger, G.A.; LeBlanc, A.-M. Monitoring changes in unfrozen water content with electrical resistivity surveys in cold continuous permafrost. Geophys. J. Int. 2018, 215, 965–977. [Google Scholar] [CrossRef] [Scilit]
  108. Chen, B.; Sun, Q.; Nan, J.; Li, P.; Lyu, C.; Xin, Y.; Ma, P. Study of the low-temperature responses of the resistivity and P-wave velocity of the loess–red clay composite. Bull. Eng. Geol. Environ. 2025, 84, 153. [Google Scholar] [CrossRef] [Scilit]
  109. Limbrock, J.K.; Weigand, M.; Kemna, A. Temperature dependence of the low-frequency electrical properties of partially frozen rocks. J. Geophys. Res. Solid Earth 2025, 130, e2024JB030870. [Google Scholar] [CrossRef] [Scilit]
  110. Lü, C.; Sun, Q. Electrical resistivity evolution and brittle failure of sandstone after exposure to different temperatures. Rock Mech. Rock Eng. 2018, 51, 639–645. [Google Scholar] [CrossRef] [Scilit]
  111. Jia, P.; Qian, Y.; Wang, Q.; Mao, S.; Lu, J. Mechanical and electrical responses of natural-cooled high-temperature granite of different grain sizes. Geomech. Geophys. Geo-Energy Geo-Resour. 2023, 9, 158. [Google Scholar] [CrossRef] [Scilit]
  112. Shu, B.; Huang, R.; Tan, J.; Li, D. Experimental study on impedance dispersion characteristics and electrical resistivity of high temperature granite. Geothermics 2024, 120, 103025. [Google Scholar] [CrossRef] [Scilit]
  113. Cai, J.; Wei, W.; Hu, X.; Wood, D.A. Electrical conductivity models in saturated porous media: A review. Earth-Sci. Rev. 2017, 171, 419–433. [Google Scholar] [CrossRef] [Scilit]
  114. Hou, Y.; Liu, D.; Zhao, T.; Zhou, J.; Tian, L.; Kou, X.; Zhu, B.; Nie, X. Numerical simulation of electrical properties of carbonate reservoirs using digital rocks. Processes 2023, 11, 2214. [Google Scholar] [CrossRef] [Scilit]
  115. Zheng, H.; Zhang, Z.; Guo, J.; Fang, S.; Wang, C. Numerical simulation study on the influence of cracks in a full-size core on the resistivity measurement response. Energies 2024, 17, 1386. [Google Scholar] [CrossRef] [Scilit]
  116. Liang, Z.; Ioannidis, M.A.; Chatzis, I. Permeability and electrical conductivity of porous media from 3D stochastic replicas of the microstructure. Chem. Eng. Sci. 2000, 55, 5247–5262. [Google Scholar] [CrossRef] [Scilit]
  117. Øren, P.-E.; Bakke, S. Process based reconstruction of sandstones and prediction of transport properties. Transp. Porous Media 2002, 46, 311–343. [Google Scholar] [CrossRef] [Scilit]
  118. Yan, W.; Sun, J.; Zhang, J.; Yuan, W.; Zhang, L.; Cui, L.; Dong, H. Studies of electrical properties of low-resistivity sandstones based on digital rock technology. J. Geophys. Eng. 2018, 15, 153–163. [Google Scholar] [CrossRef] [Scilit]
  119. Liu, X.; Yan, J.; Zhang, X.; Zhang, L.; Ni, H.; Zhou, W.; Wei, B.; Li, C.; Fu, L.-Y. Numerical upscaling of multi-mineral digital rocks: Electrical conductivities of tight sandstones. J. Pet. Sci. Eng. 2021, 201, 108530. [Google Scholar] [CrossRef] [Scilit]
  120. Wu, F.; Cong, L.; Ma, W.; Liu, J.; Dai, J.; Nie, X.; Shi, X.; Luo, Y.; Chen, C. Finite element method-based resistivity simulation and water saturation calculation of irregular laminated shaly sandstone. Geomech. Geophys. Geo-Energy Geo-Resour. 2023, 9, 2. [Google Scholar] [CrossRef] [Scilit]
  121. Bird, M.B.; Butler, S.L.; Hawkes, C.D.; Kotzer, T. Numerical modeling of fluid and electrical currents through geometries based on synchrotron X-ray tomographic images of reservoir rocks using Avizo and COMSOL. Comput. Geosci. 2014, 73, 6–16. [Google Scholar] [CrossRef] [Scilit]
  122. Khachkova, T.; Lisitsa, V.; Reshetova, G.; Tcheverda, V. GPU-based algorithm for evaluating the electrical resistivity of digital rocks. Comput. Math. Appl. 2021, 82, 200–211. [Google Scholar] [CrossRef] [Scilit]
  123. Shang, S.; Gao, Q.; Cui, Y.; Wang, P.; Zhang, Z.; Yuan, Y.; Yan, W.; Chi, P. Simulation of rock electrical properties in deep reservoirs based on digital rock technology. Processes 2023, 11, 1758. [Google Scholar] [CrossRef] [Scilit]
  124. Qu, C.; Xue, Y.; Su, M.; Qiu, D.; Ma, X.; Liu, Q.; Li, G. Quantitative modeling of rock electrical resistivity under uniaxial loading and unloading. Acta Geophys. 2024, 72, 195–212. [Google Scholar] [CrossRef] [Scilit]
  125. Wu, G.; Wang, K.; Zhao, M.; Nie, Z.; Huang, Z. Analysis of damage evolution of sandstone under uniaxial loading and unloading conditions based on resistivity characteristics. Adv. Civ. Eng. 2019, 2019, 9286819. [Google Scholar] [CrossRef] [Scilit]
  126. Li, X.; Zhang, Q. Study on damage evolution and resistivity variation regularities of coal mass under multi-stage loading. Appl. Sci. 2019, 9, 4124. [Google Scholar] [CrossRef] [Scilit]
  127. Wang, K.; Li, X.; Huang, Z.; Zhao, M. Experimental study on acoustic emission and resistivity response of sandstone under constant amplitude cyclic loading. Adv. Mater. Sci. Eng. 2021, 2021, 6637200. [Google Scholar] [CrossRef] [Scilit]
  128. Jia, P.; Li, L.; Liu, D.; Wang, X.; Wang, D. Insight into rock crack propagation from resistivity and ultrasonic wave variation. Theor. Appl. Fract. Mech. 2020, 109, 102758. [Google Scholar] [CrossRef] [Scilit]
  129. Chen, G.; Lin, Y. Stress-strain-electrical resistance effects and associated state equations for uniaxial rock compression. Int. J. Rock Mech. Min. Sci. 2004, 41, 223–236. [Google Scholar] [CrossRef] [Scilit]
  130. Yin, D.; Xu, Q. Comparison of sandstone damage measurements based on non-destructive testing. Materials 2020, 13, 5154. [Google Scholar] [CrossRef] [Scilit]
  131. Wang, Y.; Liu, Y.; Ma, H. Changing regularity of rock damage variable and resistivity under loading condition. Saf. Sci. 2012, 50, 718–722. [Google Scholar] [CrossRef] [Scilit]
  132. Tan, T.; Wang, E.; Wang, X.; Ma, L.; Yao, W. Resistivity and damage of coal under cyclic loading and unloading. Eng. Geol. 2023, 323, 107234. [Google Scholar] [CrossRef] [Scilit]
  133. Zhao, M.; Chen, S.; Wang, K.; Liu, G. Analysis of electrical resistivity characteristics and damage evolution of soil-rock mixture under triaxial shear. Materials 2023, 16, 3698. [Google Scholar] [CrossRef] [Scilit]
  134. Zhang, S.; Xu, D.-P.; Qiu, S.-L.; Feng, G.-L.; Jiang, Q. A fatigue damage model for sandstone based on acoustic emission and resistivity parameters. Constr. Build. Mater. 2024, 438, 137286. [Google Scholar] [CrossRef] [Scilit]
  135. Sun, K.; Li, Z.; Li, L.; Hu, R.; Pan, W.; Su, W. Study on cumulative plastic deformation and resistivity-based damage evolution of frozen soil-rock mixtures under cyclic loading. Soil Dyn. Earthq. Eng. 2025, 194, 109374. [Google Scholar] [CrossRef] [Scilit]
  136. Zhang, S.; Xu, D.-P.; Qiu, S.-L.; Feng, G.-L.; Jiang, Q. Experimental and theoretical study on cyclic fatigue damage evolution of sandstone based on acoustic emission monitoring and resistivity measuring. Measurement 2025, 245, 116633. [Google Scholar] [CrossRef] [Scilit]
  137. Tanimoto, K.; Akamatsu, Y.; Katayama, I. Electrical resistivity, seismic velocity, and porosity of crustal rocks from the Oman Ophiolite under brine-saturated ocean floor conditions. Lithos 2024, 470–471, 107500. [Google Scholar] [CrossRef] [Scilit]
  138. Hou, D.-Q.; Xu, D.-P.; Zhang, S.; Xia, Y.; Jiang, Q. Study on crack development and damage characteristics of single-cracked red sandstone under uniaxial cyclic loading and unloading based on multi-field monitoring. Environ. Earth Sci. 2025, 84, 549. [Google Scholar] [CrossRef] [Scilit]
  139. Ran, H.; Guo, Y.; Feng, G.; Qi, T.; Du, X. Creep properties and resistivity-ultrasonic-AE responses of cemented gangue backfill column under high-stress area. Int. J. Min. Sci. Technol. 2021, 31, 401–412. [Google Scholar] [CrossRef] [Scilit]
  140. Jia, P.; Wang, Y.; Wang, Q.; Lu, J. Experimental study on resistivity and acoustic emission characteristics of red sandstone under cyclic loading. Chin. J. Rock Mech. Eng. 2024, 43, 3333–3341. (In Chinese) [Google Scholar] [CrossRef]
  141. Sui, J.; Li, L.; Mu, W.; Lu, J.; Liu, L.; Gu, C. Study on acoustic emission-resistivity response of hydraulic fracturing in rock-like samples. Rock Mech. Rock Eng. 2025, 58, 5937–5959. [Google Scholar] [CrossRef] [Scilit]
  142. Li, H.; Shen, R.; Qiao, Y.; He, M. Acoustic emission signal characteristics and its critical slowing down phenomenon during the loading process of water-bearing sandstone. J. Appl. Geophys. 2021, 194, 104458. [Google Scholar] [CrossRef] [Scilit]
  143. Jiang, X.-Y.; Wu, D.; Zhao, Z.-X.; Yang, Y.; Tian, J.-W.; Wang, F.-L. Experimental and numerical study on the damage evolution and acoustic emission multi-parameter responses of single flaw sandstone under uniaxial compression. Theor. Appl. Fract. Mech. 2024, 133, 104535. [Google Scholar] [CrossRef] [Scilit]
  144. Jia, P.; Zhu, P.-C.; Li, B.; Mao, S.-Z. Experimental study on wave characteristics and acoustic emission characteristics of thermal damaged marble. J. Northeast. Univ. Nat. Sci. 2023, 44, 279–288. (In Chinese) [Google Scholar] [CrossRef]
  145. Wu, K.; Meng, Q.; Li, R.; Wang, C.; Shen, T. In-situ CT scan-based analysis of damage evolution of coral reef limestone under cyclic loads. J. Build. Eng. 2024, 96, 110596. [Google Scholar] [CrossRef] [Scilit]
  146. Gao, Y.; Zhang, Y.; Su, B.; Tan, D.; Yang, B.; Gao, M. Mesoscopic fracture mechanism of sandstone subject to microwave irradiation: Insights from CT scanning and electrical resistivity testing. Rock Mech. Rock Eng. 2025, 58, 5981–6006. [Google Scholar] [CrossRef] [Scilit]
  147. Chen, Y.; Xu, J.; Peng, S.; Zhang, Q.; Chen, C. Strain localisation and seepage characteristics of rock under triaxial compression by 3D digital image correlation. Int. J. Rock Mech. Min. Sci. 2022, 152, 105064. [Google Scholar] [CrossRef] [Scilit]
  148. Bianchi, P.; Selvadurai, P.A.; Dal Zilio, L.; Salazar Vásquez, A.; Madonna, C.; Gerya, T.; Wiemer, S. Pre-failure strain localization in siliclastic rocks: A comparative study of laboratory and numerical approaches. Rock Mech. Rock Eng. 2024, 57, 5371–5395. [Google Scholar] [CrossRef] [Scilit]
  149. Katayama, I.; Aoi, Y.; Tanimoto, K.; Akamatsu, Y.; Sawayama, K. Simultaneous electrical resistivity and elastic wave velocity measurements during triaxial deformation of granite under brine-saturated conditions. Earth Planets Space 2023, 75, 56. [Google Scholar] [CrossRef] [Scilit]
  150. Sun, Y.; Zhai, C.; Yu, X.; Xu, J.; Cong, Y.; Zheng, Y.; Tang, W.; Li, Y. Pore structure and damage evaluation of hot dry rocks in enhanced geothermal system by combining electrical resistivity, ultrasonic waves and nuclear magnetic resonance. Nat. Resour. Res. 2023, 32, 1559–1578. [Google Scholar] [CrossRef] [Scilit]
  151. Song, M.; Hu, Q.; Liu, H.; Li, Q.; Zhang, Y.; Hu, Z.; Liu, J.; Deng, Y.; Zheng, X.; Wang, M. Characterization and correlation of rock fracture-induced electrical resistance and acoustic emission. Rock Mech. Rock Eng. 2023, 56, 6437–6457. [Google Scholar] [CrossRef] [Scilit]
  152. Yin, D.; Xu, Q. Investigating the damage evolution of sandstone using electrical impedance spectroscopy. Int. J. Rock Mech. Min. Sci. 2021, 144, 104817. [Google Scholar] [CrossRef] [Scilit]
  153. Wang, X.; Zhu, G.; Cheng, D.; Miao, B.; Chen, F.; Tian, H. Spatiotemporal evolution characteristics of apparent resistivity and its response correlation with acoustic emission of coal under multi-step loading. Sustainability 2022, 14, 10061. [Google Scholar] [CrossRef] [Scilit]
  154. Zheng, Y.; Liu, C.; Lu, K.; Zhang, H.; Jian, B.; Zhang, W. Study on the fracture behavior and critical slowing down characteristics of saturated sandstone based on acoustic emission and resistivity. Sci. Rep. 2025, 15, 12113. [Google Scholar] [CrossRef] [Scilit]
  155. Song, M.-Y.; Hu, Q.-T.; Li, Q.-G.; Wu, Y.-Q.; Xu, Y.-C.; Zhang, Y.-B.; Hu, L.-P.; Deng, Y.-Z.; Liu, J.-C.; Zheng, X.-W. Effects of damage on resistivity response and volatility of water-bearing coal. Fuel 2022, 324, 124553. [Google Scholar] [CrossRef] [Scilit]
  156. Shan, T.; Li, Z.; Zhang, X.; Wang, X.; Jia, H.; Wang, E.; Zhang, Q.; Niu, Y.; Wang, D. Superstatistical approach of electric potential and acoustic emission for investigating damage evolution and precursor of water-bearing sandstone under uniaxial compression. Int. J. Rock Mech. Min. Sci. 2025, 189, 106063. [Google Scholar] [CrossRef] [Scilit]
  157. Kang, S.; Zhao, Z. Detection and evolution of disaster sources in high slopes of open-pit mines based on time-lapse high-density electricity method. Front. Earth Sci. 2023, 11, 1194446. [Google Scholar] [CrossRef] [Scilit]
  158. Fu, Z.; Zhang, Y.; Ji, H.; Zhang, C.; Chen, D.; Qin, Y. Characteristics of resistivity variation in deep granite and in-situ detection applications. Sci. Rep. 2024, 14, 6120. [Google Scholar] [CrossRef] [Scilit]
  159. Wang, P.; Yi, X.; Wang, S. Research on water inrush early warning of coal seam floor based on Naive Bayes classification. Sci. Rep. 2025, 15, 44999. [Google Scholar] [CrossRef] [Scilit]
Figure 1. Schematic illustration of electrical conduction mechanisms in rocks.
Geosciences 16 00377 g001
Figure 2. Three-dimensional resistivity inversion results for tunnel-ahead detection: (a) three-dimensional view of the resistivity model; (b) extracted image of the target body in the inversion result; (c) X = ±2.3 m slice image; and (d) Y = 2.0 m slice image [58].
Geosciences 16 00377 g002
Figure 3. Anisotropic resistivity responses induced by crack propagation along the minimum-resistivity electrical axis (ρ1): (a) schematic model of crack propagation along the ρ1 axis; (b,c) dry rock; (d,e) partially saturated rock without water supply; and (f,g) partially saturated rock with continuous water supply to maintain constant saturation. Panels (b,d,f) present the evolution of the principal resistivities (ρ1, ρ2, and ρ3), whereas panels (c,e,g) show the corresponding apparent resistivities measured along three observation orientations (ρa1, ρa2, and ρa3). The horizontal axis in panels (bg) represents the dimensionless crack ratio (ϕ, ×10−3) [12].
Geosciences 16 00377 g003
Figure 4. Aperture distribution, electrical-current paths, and fluid flow in a rough fluid-filled fracture under different degrees of opening: (ac) at the percolation threshold; and (df) above the percolation threshold [40].
Geosciences 16 00377 g004
Figure 5. Schematic illustration of conductive network evolution associated with bulk pore-water and mineral-surface conduction under different water saturation conditions: (a) high water saturation; (b) low water saturation; and (c) geometrical relationship between the tortuosities of the bulk pore-water and mineral-surface conductive paths at full saturation. Sw denotes water saturation, whereas τb and τs represent the tortuosities of the bulk pore-water and mineral-surface conductive paths, respectively [13].
Geosciences 16 00377 g005
Figure 6. Stage-dependent evolution of fracture permeability and electrical resistivity with increasing pressure [94].
Geosciences 16 00377 g006
Figure 7. Relationships among resistivity, mass loss rate, and density reduction rate during real-time heating and after natural cooling: (a) real-time heating; (b) natural cooling [15].
Geosciences 16 00377 g007
Figure 8. Reconstruction of a multicomponent carbonate digital rock: (a) representative volume element of the mineral skeleton; (b) three-dimensional pore space; (c) pore-network extraction and connectivity analysis; and (d) equivalent multicomponent digital rock. In panel (c), the azury regions represent pores, and the green elements represent connecting throats [23].
Geosciences 16 00377 g008
Figure 10. AE and resistivity variation mechanism during rock fracture [151].
Geosciences 16 00377 g010
Figure 11. Curves of shear stress, resistivity, and acoustic emission ringing count rate vs. time during sandstone shear failure at different shear rates: (a) 0.1 mm/min; (b) 0.2 mm/min; (c) 0.5 mm/min; (d) 1.0 mm/min. Point A on the stress–time curve corresponds to approximately 60% of the peak stress. The blue arrows indicate the time of the first significant drop in resistivity during the unstable crack propagation stage, whereas the red arrows indicate the time when a significant number of AE signals are generated [25].
Geosciences 16 00377 g011
Table 1. Temporal distribution, core themes, and major contributing countries in research on electrical responses to rock damage, 1998–2026.
PeriodPublications (n)Research ThemesLeading Countries
1998–20027Fracture coalescence; crack initiation; Archie’s law; electrical properties; pressure effects on resistivityUnited States; China; United Kingdom; France
2003–20079Soil electrical conductivity; resistivity-saturation relationships; fractured-rock characterization; ERTUnited States; China; Canada; Italy
2008–20128Landslide monitoring; tracer tests; time-lapse ERT monitoring; preseismic resistivity changesChina; United States; Italy; South Korea
2013–201727Digital rock; resistivity models; fracture networks; numerical simulation; CO2 sequestration; frozen groundChina; United States; Australia; Norway; Germany
2018–202243Cyclic loading and unloading; damage evolution; integrated acoustic-electrical monitoring; high-temperature rocks; water-content effects; ERT applicationsChina; United States; Australia; Iran
2023–202659Deep learning and digital rock; multi-physics coupling; critical slowing-down theory; fracture prediction; THMC-coupled testing systems; 3D resistivity imagingChina; United States; Australia; Japan; Portugal
Disclaimer/Publisher’s Note: The statements, opinions and data contained in all publications are solely those of the individual author(s) and contributor(s) and not of MDPI and/or the editor(s). MDPI and/or the editor(s) disclaim responsibility for any injury to people or property resulting from any ideas, methods, instructions or products referred to in the content.