Article

Geomechanical Characteristics of Cretaceous Ultra-Deep Sandstone Reservoirs in the Southern Keshen Area, Kuqa Depression: Implications for Exploration and Development


1
Exploration and Development Research Institute of Tarim Oilfield Company of China National Petroleum Corporation, Korla 841000, China
2
Research and Development Center for Exploration and Development Technology of Ultra Deep Complex Oil and Gas Reservoirs of China National Petroleum Corporation, Korla 841000, China
3
Engineering Research Center for Exploration and Development of Ultra Deep Complex Oil and Gas Reservoirs of Weiwuer Autonomous Region, Korla 841000, China
4
Key Laboratory of Ultra Deep Oil and Gas, Korla 841000, China
5
School of Geosciences, Yangtze University, Wuhan 430100, China
6
School of Resources and Geosciences, China University of Mining and Technology, Xuzhou 221116, China
*
Author to whom correspondence should be addressed.
Geosciences 2026, 16(9), 376; https://doi.org/10.3390/geosciences16090376
Submission received: 4 August 2026 / Revised: 10 September 2026 / Accepted: 12 September 2026 / Published: 16 September 2026
(This article belongs to the Special Issue Fault Characteristics, Fault Zone Architecture and Fluid Behavior)

Abstract

Significant progress has been made in exploring ultra-deep tight sandstone gas in the Tarim Basin, but sweet spot prediction remains challenging in the Keshen block of the Kuqa Depression. Based on integrated geological, experimental, and seismic data, this study characterizes the geomechanical properties and in situ stress field of the Cretaceous Bashijiqike Formation and identifies the main controls on reservoir quality. 3D geomechanical modeling and finite element simulations reveal that fracture development, stress–fracture angle, structural style, and the absence of stress concentration jointly govern reservoir favorability. Stress concentration can coexist with fracture development due to differential sandstone–mudstone deformation, leading to fracture deactivation. Favorable reservoirs occur in structural positions with extensive natural fractures, moderate principal stress–fracture angles, and low stress concentration. Coupling between in situ stress and natural fractures is the key to sweet spot prediction. The proposed geomechanical workflow improves precise identification of engineering and geological sweet spots, enhancing exploration and development efficiency in ultra-deep tight gas reservoirs.

1. Introduction

In recent years, industrial breakthroughs have been achieved in the exploration and development of deep tight reservoirs in China. Characterized by large-scale hydrocarbon resources, wide distribution, intense diagenesis, strong reservoir heterogeneity and relatively low single-well productivity, tight reservoirs serve as a critical strategic successor to conventional oil and gas resources in the future [1,2,3]. As a vital hydrocarbon-rich unit in the petroliferous basins of western China, the Kuqa Depression of the Tarim Basin boasts favorable natural gas endowment and broad exploration and development potential [4]. Subject to superimposed reworking by multiple phases of tectonic movement, the Kuqa Depression features complex geological conditions, providing a unique geological setting for the development of deep tight reservoirs. Statistics of reservoir physical properties indicate that 80% of the reservoirs in the area fall into the tight reservoir category [5], and tight sandstone gas has become a key focus of current exploration and development in the Kuqa Depression [6].
The Kelasu Tectonic Belt is subdivided into three secondary structural zones: the Kela, North Keshen, and South Keshen zones. Based on trap development, it is further divided from west to east into the Awate, Bozi, Dabei, Keshen, and Kela blocks, with corresponding changes in subsalt deformation styles. The Keshen block is delineated primarily by the geometry and connectivity of its fault systems and the types of structural traps developed, which serve as the key criteria distinguishing it from adjacent sectors. The Keshen Gas Field is a large-scale natural gas field with trillion-cubic-meter reserves located in the Kelasu Tectonic Belt of the Kuqa Depression, Tarim Basin, with tight sandstones of the Lower Cretaceous Bashijiqike Formation as the main producing interval [7,8]. Multiple hundred-billion-cubic-meter gas reservoirs, including Keshen 2 and Keshen 8, have been discovered successively in the field, marking a breakthrough in ultra-deep natural gas exploration at depths of nearly 8000 m in China [9,10]. Under the combined effects of Tianshan tectonism and extreme burial depth, reservoirs have undergone intense compaction-induced porosity reduction, resulting in an ultra-tight rock matrix. Even with grain-cutting microfractures developed, multiple challenges remain: the complex tectonic setting drives intense evolution of the stress field; the alternation of stress concentration and release deactivates partial fractures, making it difficult to accurately identify fracture effectiveness; the strong reservoir heterogeneity leads to dramatic disparities in gas well productivity; and high-quality reservoir sweet spots are hard to locate efficiently [11,12,13,14]. Despite the great exploration difficulty, breaking through the technical bottleneck of this block plays a critical supporting role in increasing reserves and production of tight gas in the Kuqa Depression and even the Tarim Basin, with remarkable strategic value and development potential.
The exploration history of the Keshen area has always advanced in parallel with deepening geological understanding and iterative technological innovation. Early exploration was dominated by structural exploration, focusing on the identification and confirmation of structural traps, and the basic structural framework of the study area was initially established [15]. With the continuous improvement of exploration maturity, the exploration direction gradually shifted to deep traps controlled by salt-related structures, achieving a major exploration breakthrough known as “finding Kelasu beneath Kelasu” [16,17]. At the current stage, the exploration philosophy has further evolved into precision exploration centered on fault-fracture systems. Closely following the key geological law of “fault-fracture controlled reservoir”, it precisely targets favorable enrichment zones with developed faults and fractures in tight sandstone reservoirs [12,18]. However, the above exploration approaches all have limitations in applicability, making it difficult to accurately predict reservoir sweet spots and restricting the exploration efficiency of the block.
To address the above challenges and improve the exploration and development performance of tight gas reservoirs in the Bashijiqike Formation of the Keshen Gas Field, Kelasu Tectonic Belt, this study recognizes that regional tectonics, rather than local lithology, is the primary control on reservoir quality; the reservoir consists of thick, laterally extensive and relatively homogeneous sandstone packages, while tectonic effects are characterized by structural style variations and the associated stress concentration patterns, and local lithological effects are represented mainly by rock mechanical parameters such as Young’s modulus and Poisson’s ratio. Accordingly, this paper systematically conducts geomechanical analyses including present-day in situ stress field prediction and fracture effectiveness evaluation and performs finite element simulations for different structural styles (pop-up, imbricate thrust, triangle zone, and fault-bend fold) to quantitatively assess their stress responses. Based on the concept of geology-engineering integration and relying on rock mechanics and in situ stress characteristic parameters, this study quantitatively optimizes the trajectory of directional wells, precisely selects reservoir sweet spots with adaptable stress conditions and well-developed fractures, and simultaneously identifies favorable intervals with stimulation potential. It aims to construct a coupling system of geological characteristics, stress state and engineering stimulation, provide scientific support for the precise identification of sweet spots, improvement of stimulation effects, and optimization of exploration and development efficiency in ultra-deep tight sandstone gas reservoirs, and help the block achieve breakthroughs in hydrocarbon productivity.

2. Geological Setting

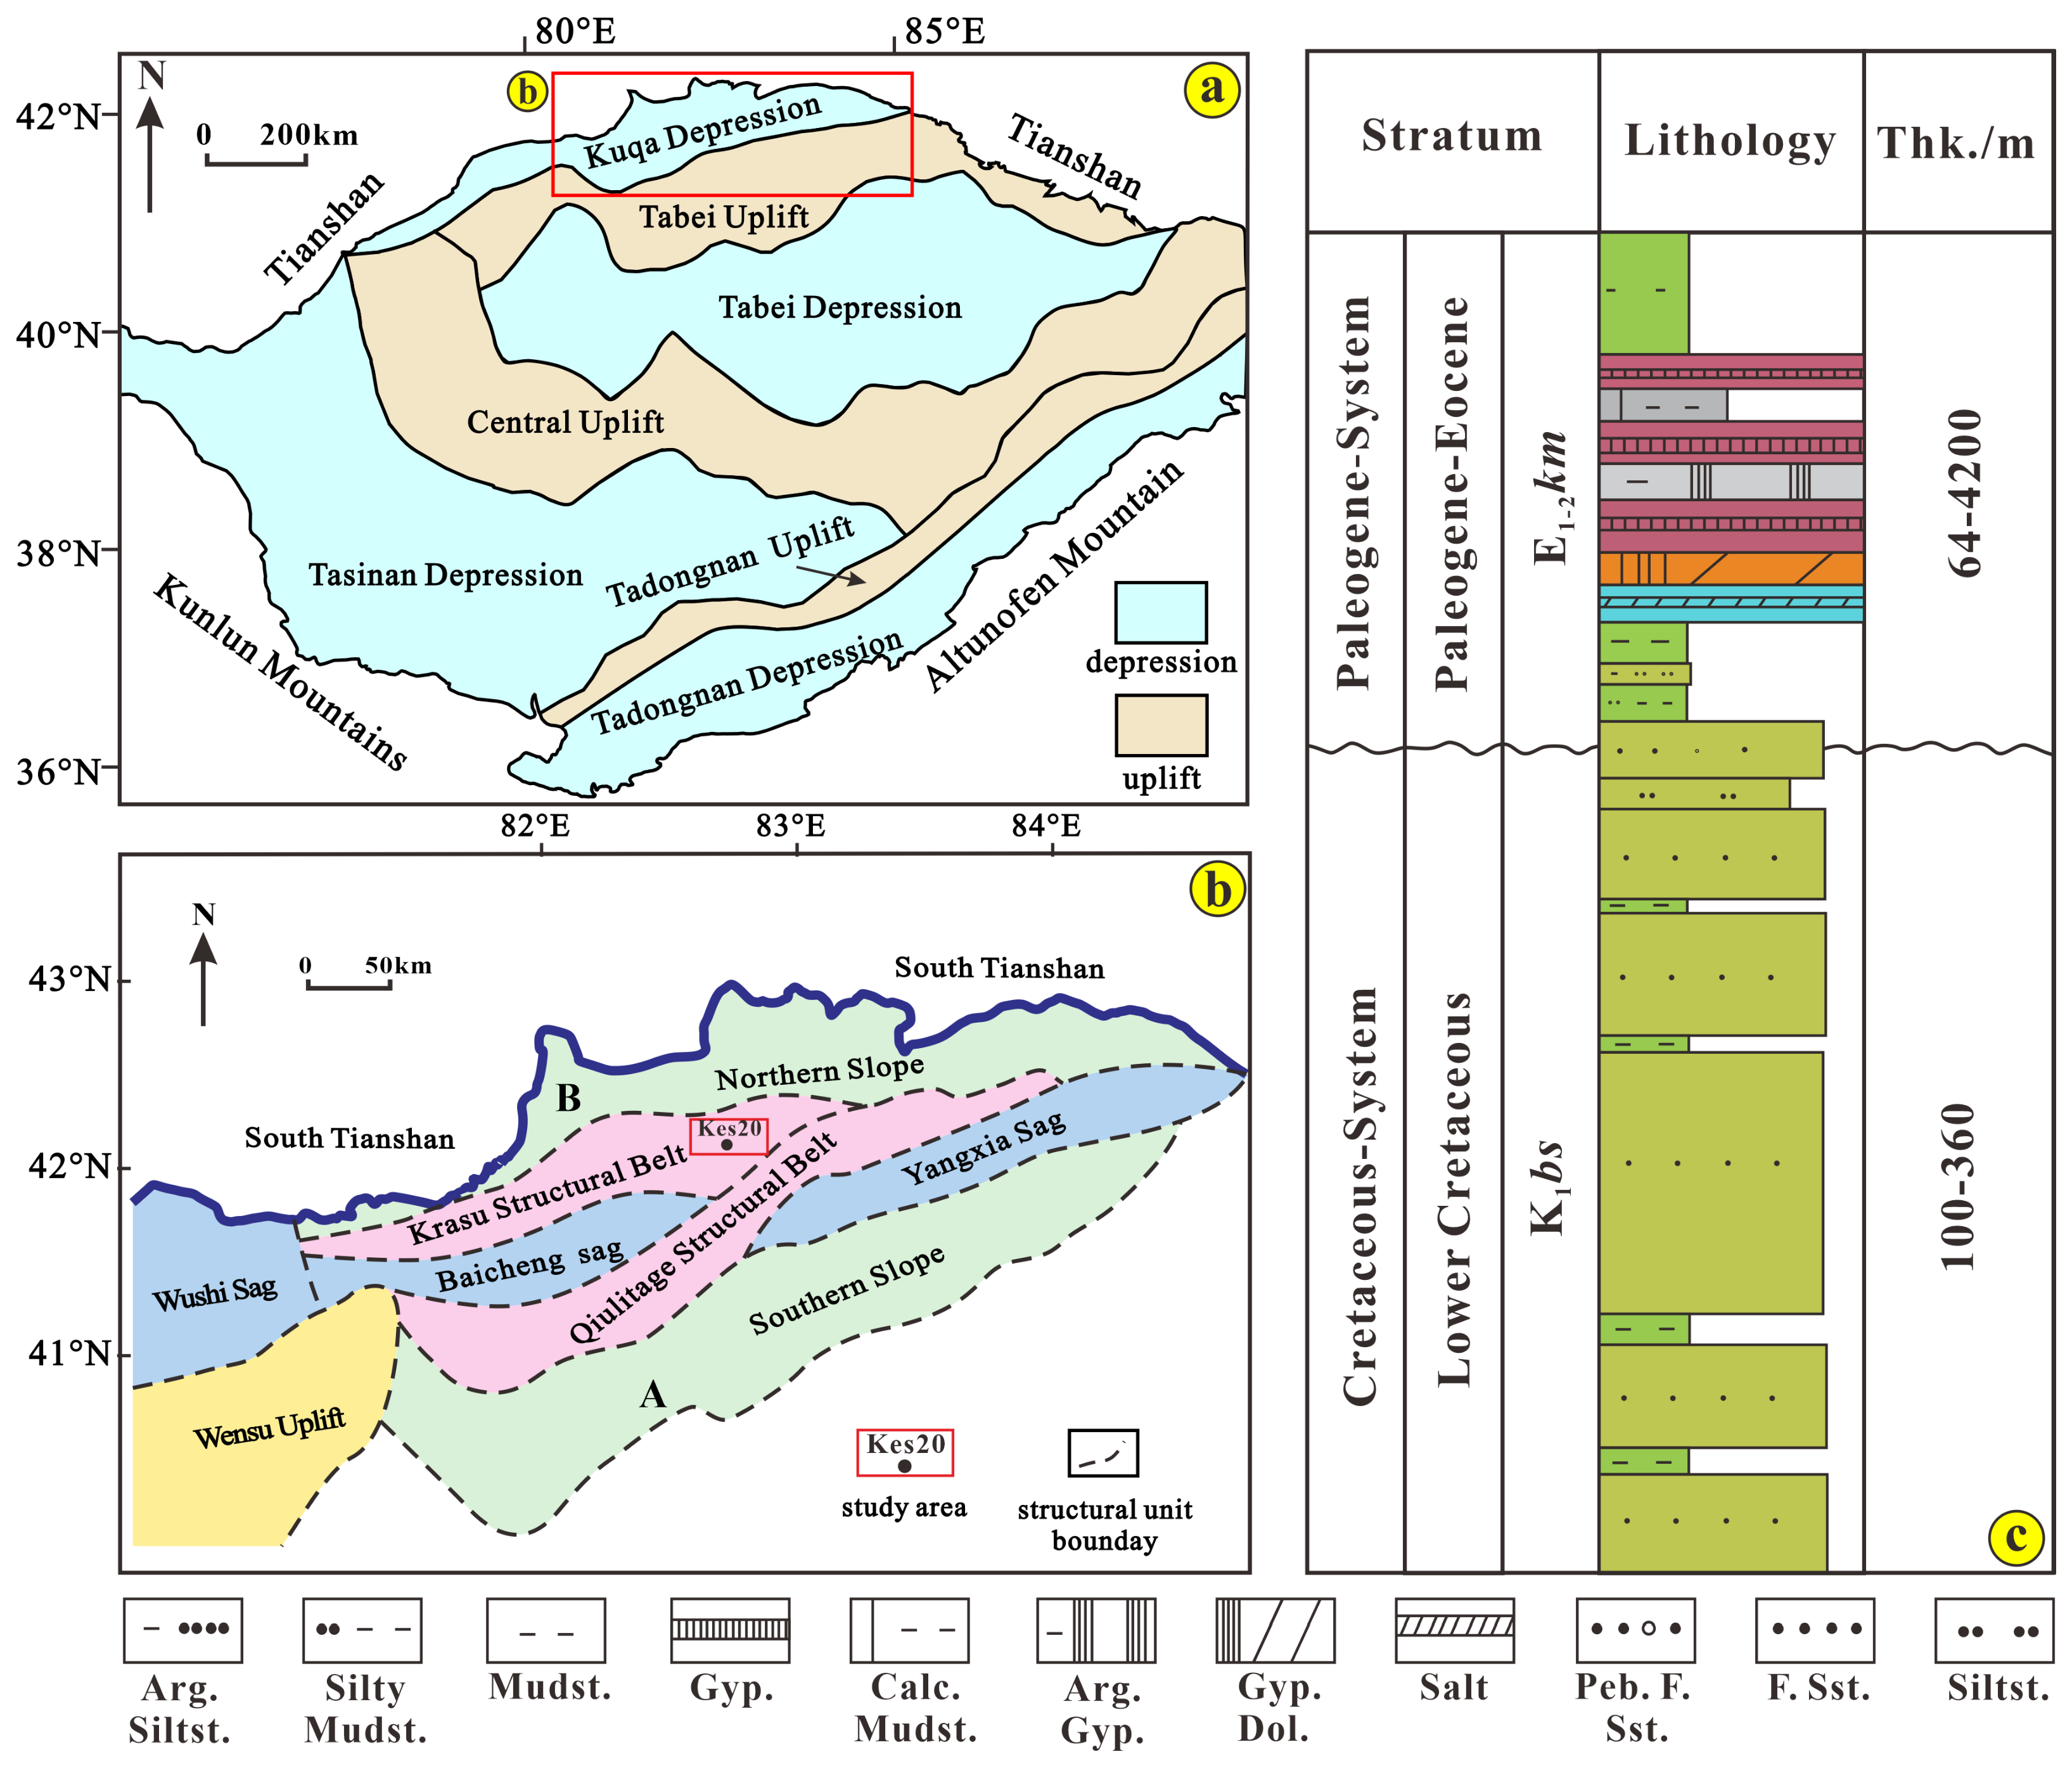
The Kelasu Tectonic Belt is an important structural unit located in the central Kuqa Depression, northern Tarim Basin (Figure 1a). It occupies a key position in the foreland belt of the Tarim Basin, features a unique hydrocarbon accumulation mechanism, and serves as the primary zone for natural gas enrichment [7,18]. It is bounded by the Northern Tectonic Belt to the north, the Baicheng Depression to the south, the Qiulitage Tectonic Belt to the east, and the Wushi Sag to the west [19].
Controlled by faults, the Kelasu Tectonic Belt has developed differentiated structural styles, forming a distinctive geological pattern of north–south zonation and west–east segmentation [20,21,22]. From west to east, it is divided into the Tuziaowate segment, Bozi segment, Dabei-Tubei segment and Kela segment; from north to south, it can be subdivided into the Kelasu anticline, Keshen zone, South Keshen zone and Baicheng zone. Among them, the South Keshen area lies to the south of the Kelasu Tectonic Belt, belonging to the transition zone between the North Keshen Fault and the Baicheng Depression [23,24], and constitutes an important part of the complex structural system of the Kuqa Depression (Figure 1b).
According to drilling data, the following strata are developed in the South Keshen area from top to bottom: the Neogene Kuqa Formation (N2k), Kangcun Formation (N1k) and Jidike Formation (N1j); the Paleogene Suweiyi Formation (E2−3s) and Kumugeliemu Group (E1−2km); and the Cretaceous Bashijiqike Formation (K1bs), Baxigai Formation (K1bx), Shushanhe Formation (K1sh) and Yageliemu Formation (K1y). The Cretaceous Bashijiqike Formation and Baxigai Formation are the main target intervals (Figure 1c). However, drilling practice reveals that the matching relationship between fractures and in situ stress in the South Keshen area is complex, and the main controlling factors of gas well productivity have not yet been clarified. Therefore, it is of great significance to carry out a geomechanical re-understanding of the drilled wells in this area [25].

3. Methods

Analysis of drilled well data from the Cretaceous Bashijiqike Formation in the South Keshen area shows that reservoir rocks in this region are tight with generally low porosity and permeability, and there are diverse structural styles with significant differences in in situ stress field distribution at different structural positions. Only when regional or local stress is effectively released can the original microfractures in the formation be activated, expanded and interconnected to form a large-scale complex fracture network with high conductivity, which provides channels for efficient migration, accumulation and production of natural gas. However, in the pre-drilling stage, reservoir prediction is carried out only based on macroscopic geological information such as fault distribution and sand body distribution, and it is difficult to accurately characterize the spatial distribution, occurrence, aperture and seepage capacity of natural fractures through conventional seismic attributes and well logging curves, resulting in strong uncertainty in reservoir quality evaluation. Similarly, before hydraulic fracturing, relying solely on single approaches such as borehole static logging and lithology interpretation cannot systematically depict the in situ stress field variations, fracture activation characteristics and fluid migration paths within the reservoir, making it difficult to fully understand the actual connectivity and productivity potential of the reservoir. To solve the above problems, based on the concept of geology-engineering integration, this study carries out 3D geomechanical modeling jointly driven by seismic and drilling data, providing robust support for well location optimization and efficient exploration and development in the South Keshen area.

3.1. Reservoir Geomechanical Evaluation Methodology

Reservoir geomechanical evaluation is completed through multi-step progressive calculation, with the core workflow as follows: based on well logging data of reservoir parameters, corresponding calculation methods are adopted to obtain rock mechanical parameters, including basic parameters such as Young’s modulus, Poisson’s ratio and uniaxial compressive strength; combined with the vertical stress calculation formula, the vertical formation stress is solved simultaneously; the quantitative calculation of formation pore pressure is completed by means of the Eaton method formula; the horizontal formation stress is further derived based on the combined spring model; finally, the stress concentration coefficient of the formation is accurately solved through the stress concentration coefficient calculation formula [26,27]. The calculation formulas are shown in Equations (1)–(5), and the whole process forms a complete calculation system from basic parameters to core stress parameters, providing comprehensive data support for the evaluation of reservoir geomechanical characteristics.
S v = ρ 0 g H 0 + H 0 H ρ g d h
where S v is the vertical principal stress, MPa; ρ 0 is the average formation density of the depth interval without logging density values, g/cm3; ρ is the formation density, g/cm3; H 0 is the starting depth of density logging, m; and H is the depth of the calculation point, m.
P p = S v S v P n Δ t n / Δ t s C
where S v is the vertical principal stress, MPa; P n is the normal formation pore pressure, MPa; Δ t s is the actual acoustic transit time of the formation at the predicted depth, μs/m; Δtn represents the normal compaction trend acoustic transit time (or normal sonic slowness) at the given depth, μs/m; C is the regional exponent; and P p is the formation pore pressure, MPa.
S h = μ 1 μ S v α P p + E ξ h 1 μ 2 + μ E ξ H 1 μ 2 + α P p
S H = μ 1 μ S v α P p + E ξ H 1 μ 2 + μ E ξ h 1 μ 2 + α P p
where S h is the minimum horizontal principal stress, MPa; SH is the maximum horizontal principal stress, MPa; S v is the vertical principal stress, MPa; μ is Poisson’s ratio; and α is Biot’s coefficient. For the current model, an isotropic Biot coefficient is adopted. This simplification is necessitated by the limited availability of anisotropic parameters in the ultra-deep, high-pressure/high-temperature environment, and the model predictions have been validated against measured in situ stress data. E is Young’s modulus, MPa; ξ H and ξ h are the strains in the maximum and minimum principal stress directions, respectively; and Pp is the formation pore pressure, MPa.
Q e = S H P P U C S
where Q e is the stress concentration coefficient, dimensionless; S H is the maximum horizontal principal stress, MPa; P P is the formation pore pressure, MPa; and U C S is the uniaxial compressive strength of rock, MPa.

3.2. 3D Geological Modeling

The 3D geological model was constructed following the “well-seismic integration” approach, constrained by drilling data and integrated with seismic interpretation results. The drilling data include well coordinates, well trajectories, stratigraphic divisions, and well logging curves, while the seismic data cover horizon interpretations and fault distributions. After outlier removal and data standardization, the geological model was established through grid discretization using the Petrelsoftware platform (Version 2022; Schlumberger, Houston, TX, USA).
The model covers an area of approximately 1169 km2, with a lateral extent of about 45 km by 25 km. The grid is discretized with a planar resolution of 200 m × 200 m and is vertically divided into 110 layers, yielding an average grid thickness of approximately 4.5 m. The total number of grid cells is approximately 11.5 million.

4. Results

4.1. 3D Rock Mechanical Parameter Modeling

Young’s modulus and Poisson’s ratio are sensitive parameters reflecting the degree of formation fracturing and reservoir stimulation [28] and also serve as the basis for subsequent 3D in situ stress field analysis.
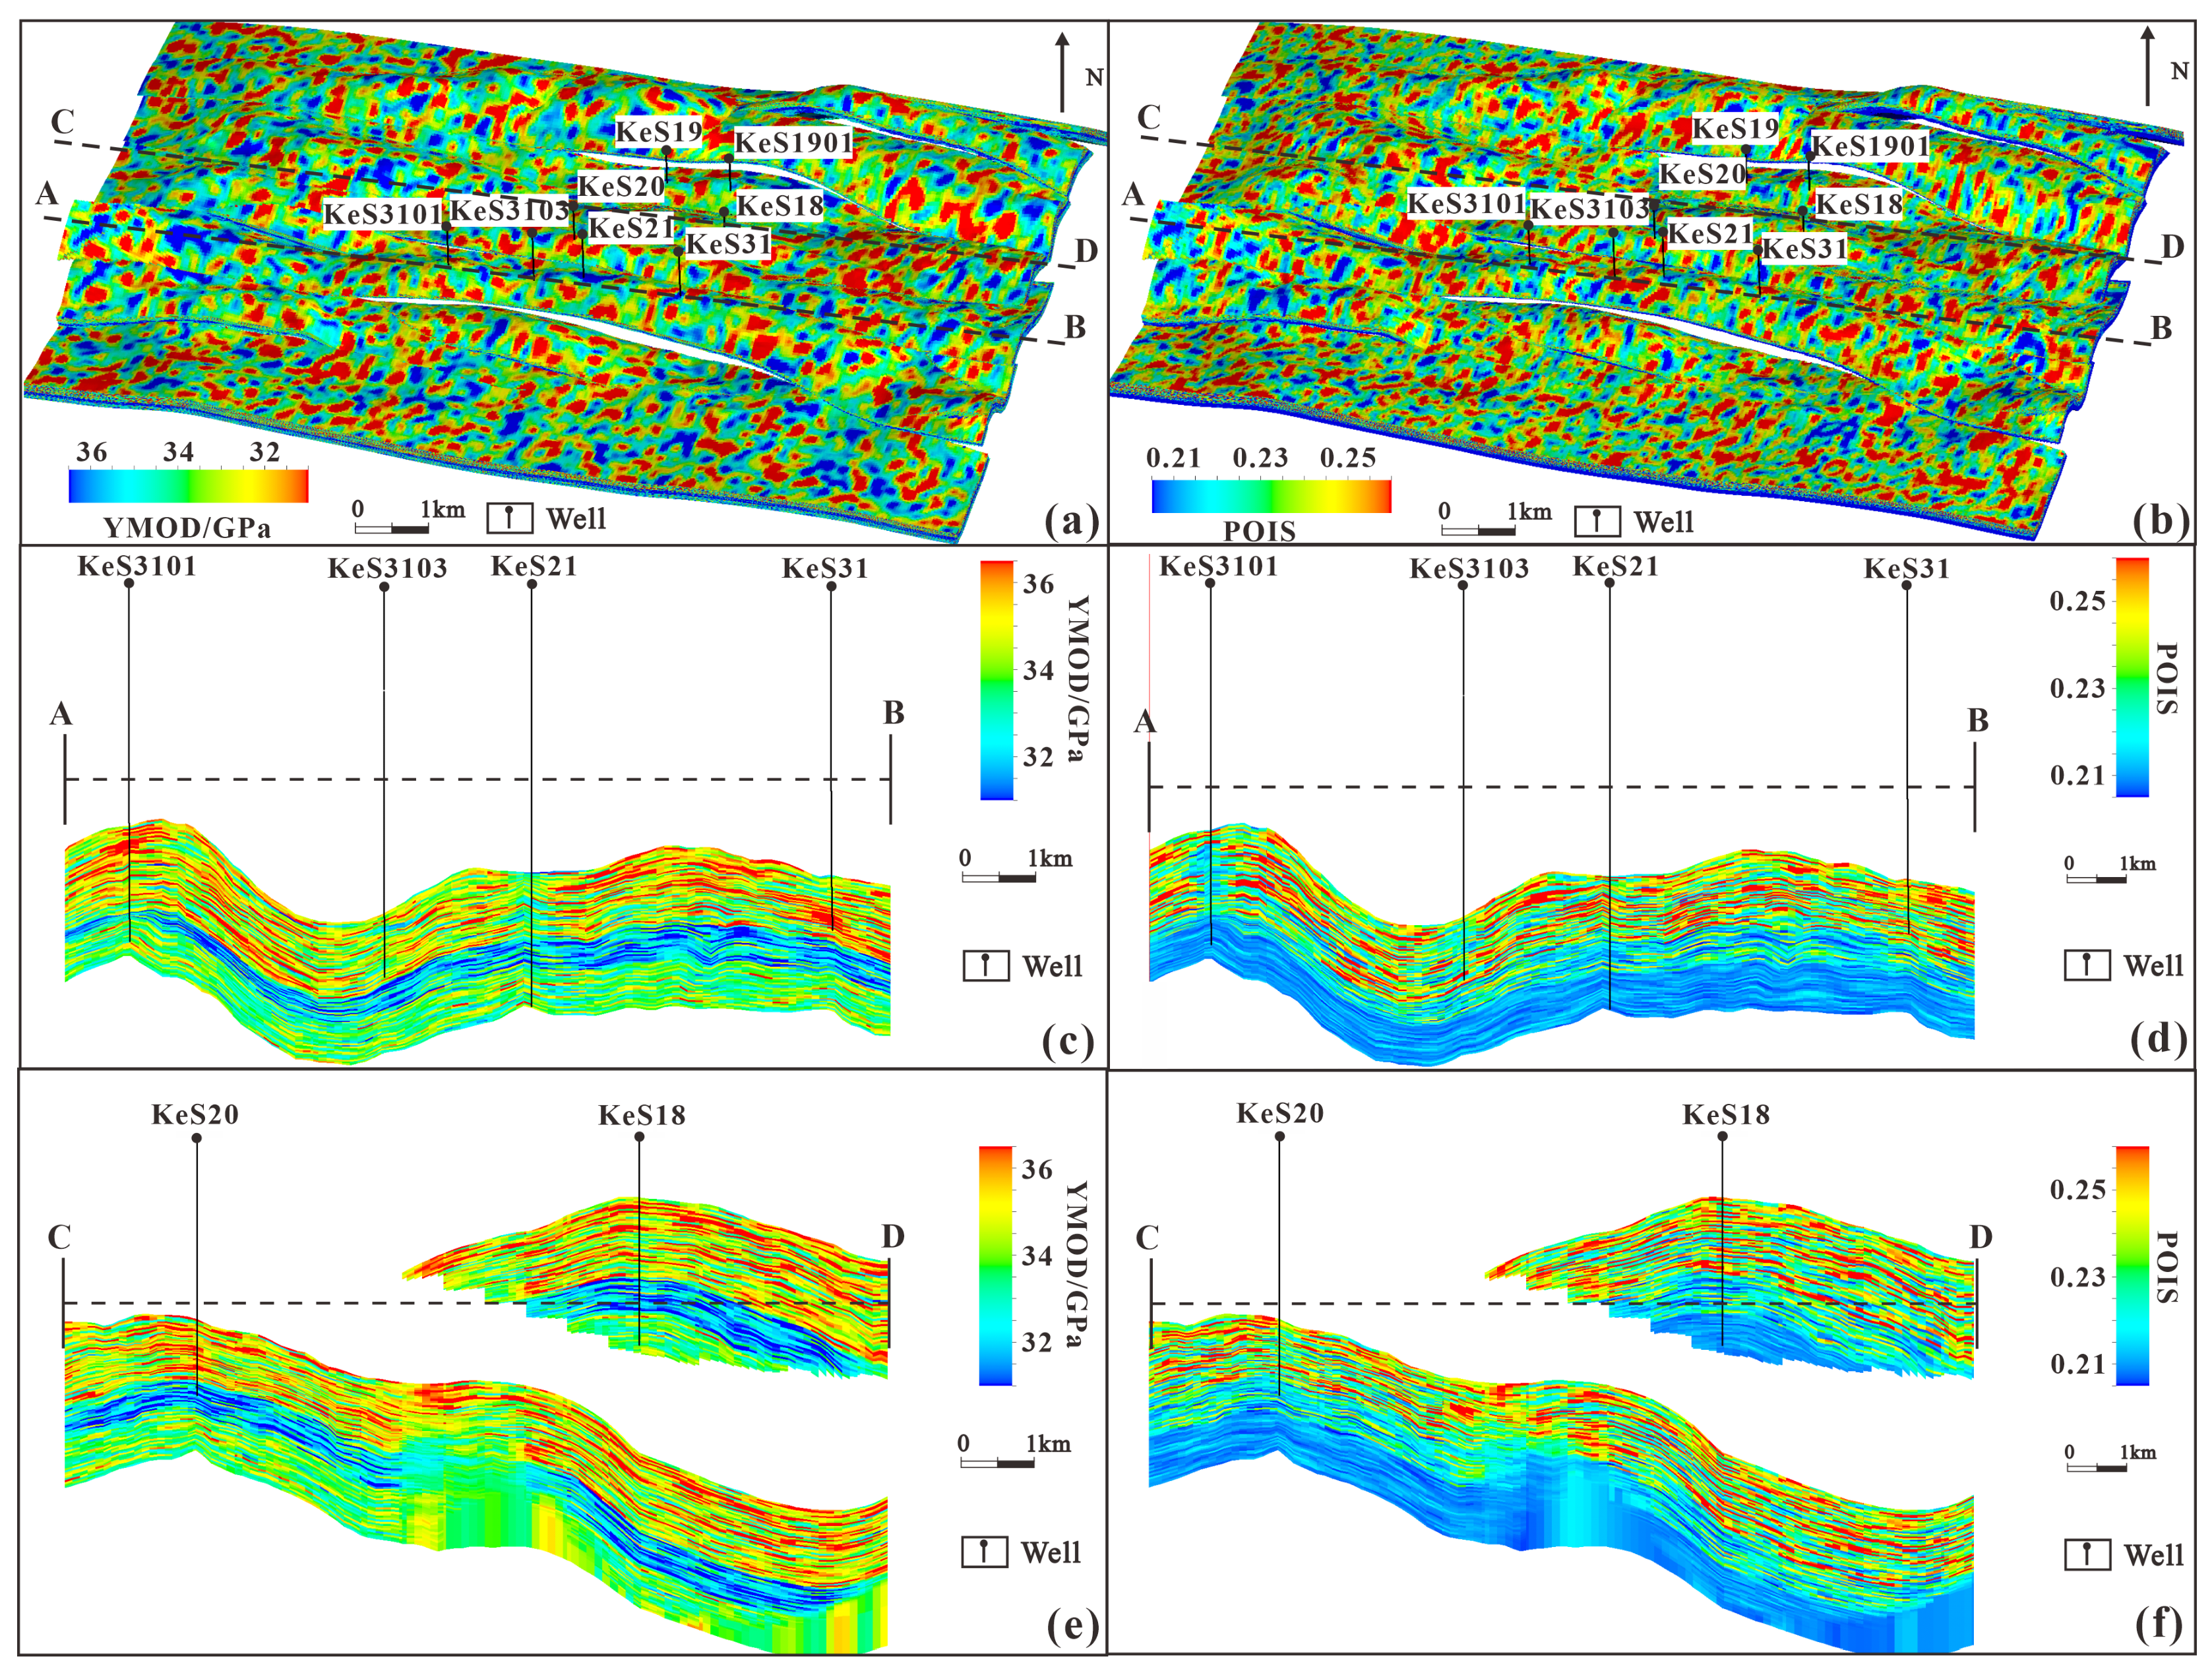
The main lithology of the target Cretaceous Bashijiqike Formation in the study area is sandstone. Controlled by the mechanical constitutive properties of sandstone, the Young’s modulus of this interval is generally at a high level with obvious brittleness characteristics. Based on the calculation results of drilled well data and the sedimentary facies distribution characteristics of the study area, the attribute volumes of Young’s modulus and Poisson’s ratio are obtained. Compared with the northern tectonic belt, the South Keshen area has a relatively complete geological structure, deeper burial, fewer developed faults, and is sealed by gypsum-salt caprocks. Therefore, although it is far from the stress source, the stress can be well accumulated. Against the background of such strong present-day stress, the overall compaction of rocks makes the rock mechanical parameters of different lithologies closer [29], resulting in no obvious zonation of rock mechanical parameters among different sedimentary facies. As shown in Figure 2, the values of Young’s modulus and Poisson’s ratio of the Bashijiqike Formation in the study area are relatively close with a narrow value range.

4.2. 3D In Situ Stress Field Modeling

The establishment of a 3D in situ stress model based on finite element theory mainly includes the following steps: construction of a 3D geological model; rock mechanical modeling; assignment of parameters such as formation pressure and boundary conditions, as well as 3D in situ stress simulation and calibration. The in situ stress grid is mainly constructed using finite element discretization, weak form and iterative solution methods. In the Petrel Visage platform, an elastoplastic constitutive model (Mohr–Coulomb yield criterion) was adopted to capture the differentiated mechanical responses of sandstone and mudstone interbeds under intense compressive stress. Separate strength parameters, including cohesion, internal friction angle, and dilation angle, were assigned to sandstone and mudstone based on laboratory triaxial test results and well-log-derived rock mechanical profiles. By assigning these constitutive relations to the grid cells of the geological model, setting lithology parameters, formation pressure and boundary stress conditions, results such as 3D stress tensor, displacement field, plastic zone distribution and fracture aperture are obtained through numerical solution, and the calculated attributes such as stress and displacement are mapped back to the original geological model grid to realize geology-engineering integration and result visualization. By combining the 3D in situ stress model with the single-well stress profiles calculated from well logging, model verification and optimization are carried out by adjusting boundary conditions and, finally, the simulation and prediction of the 3D in situ stress field in the study area are completed.
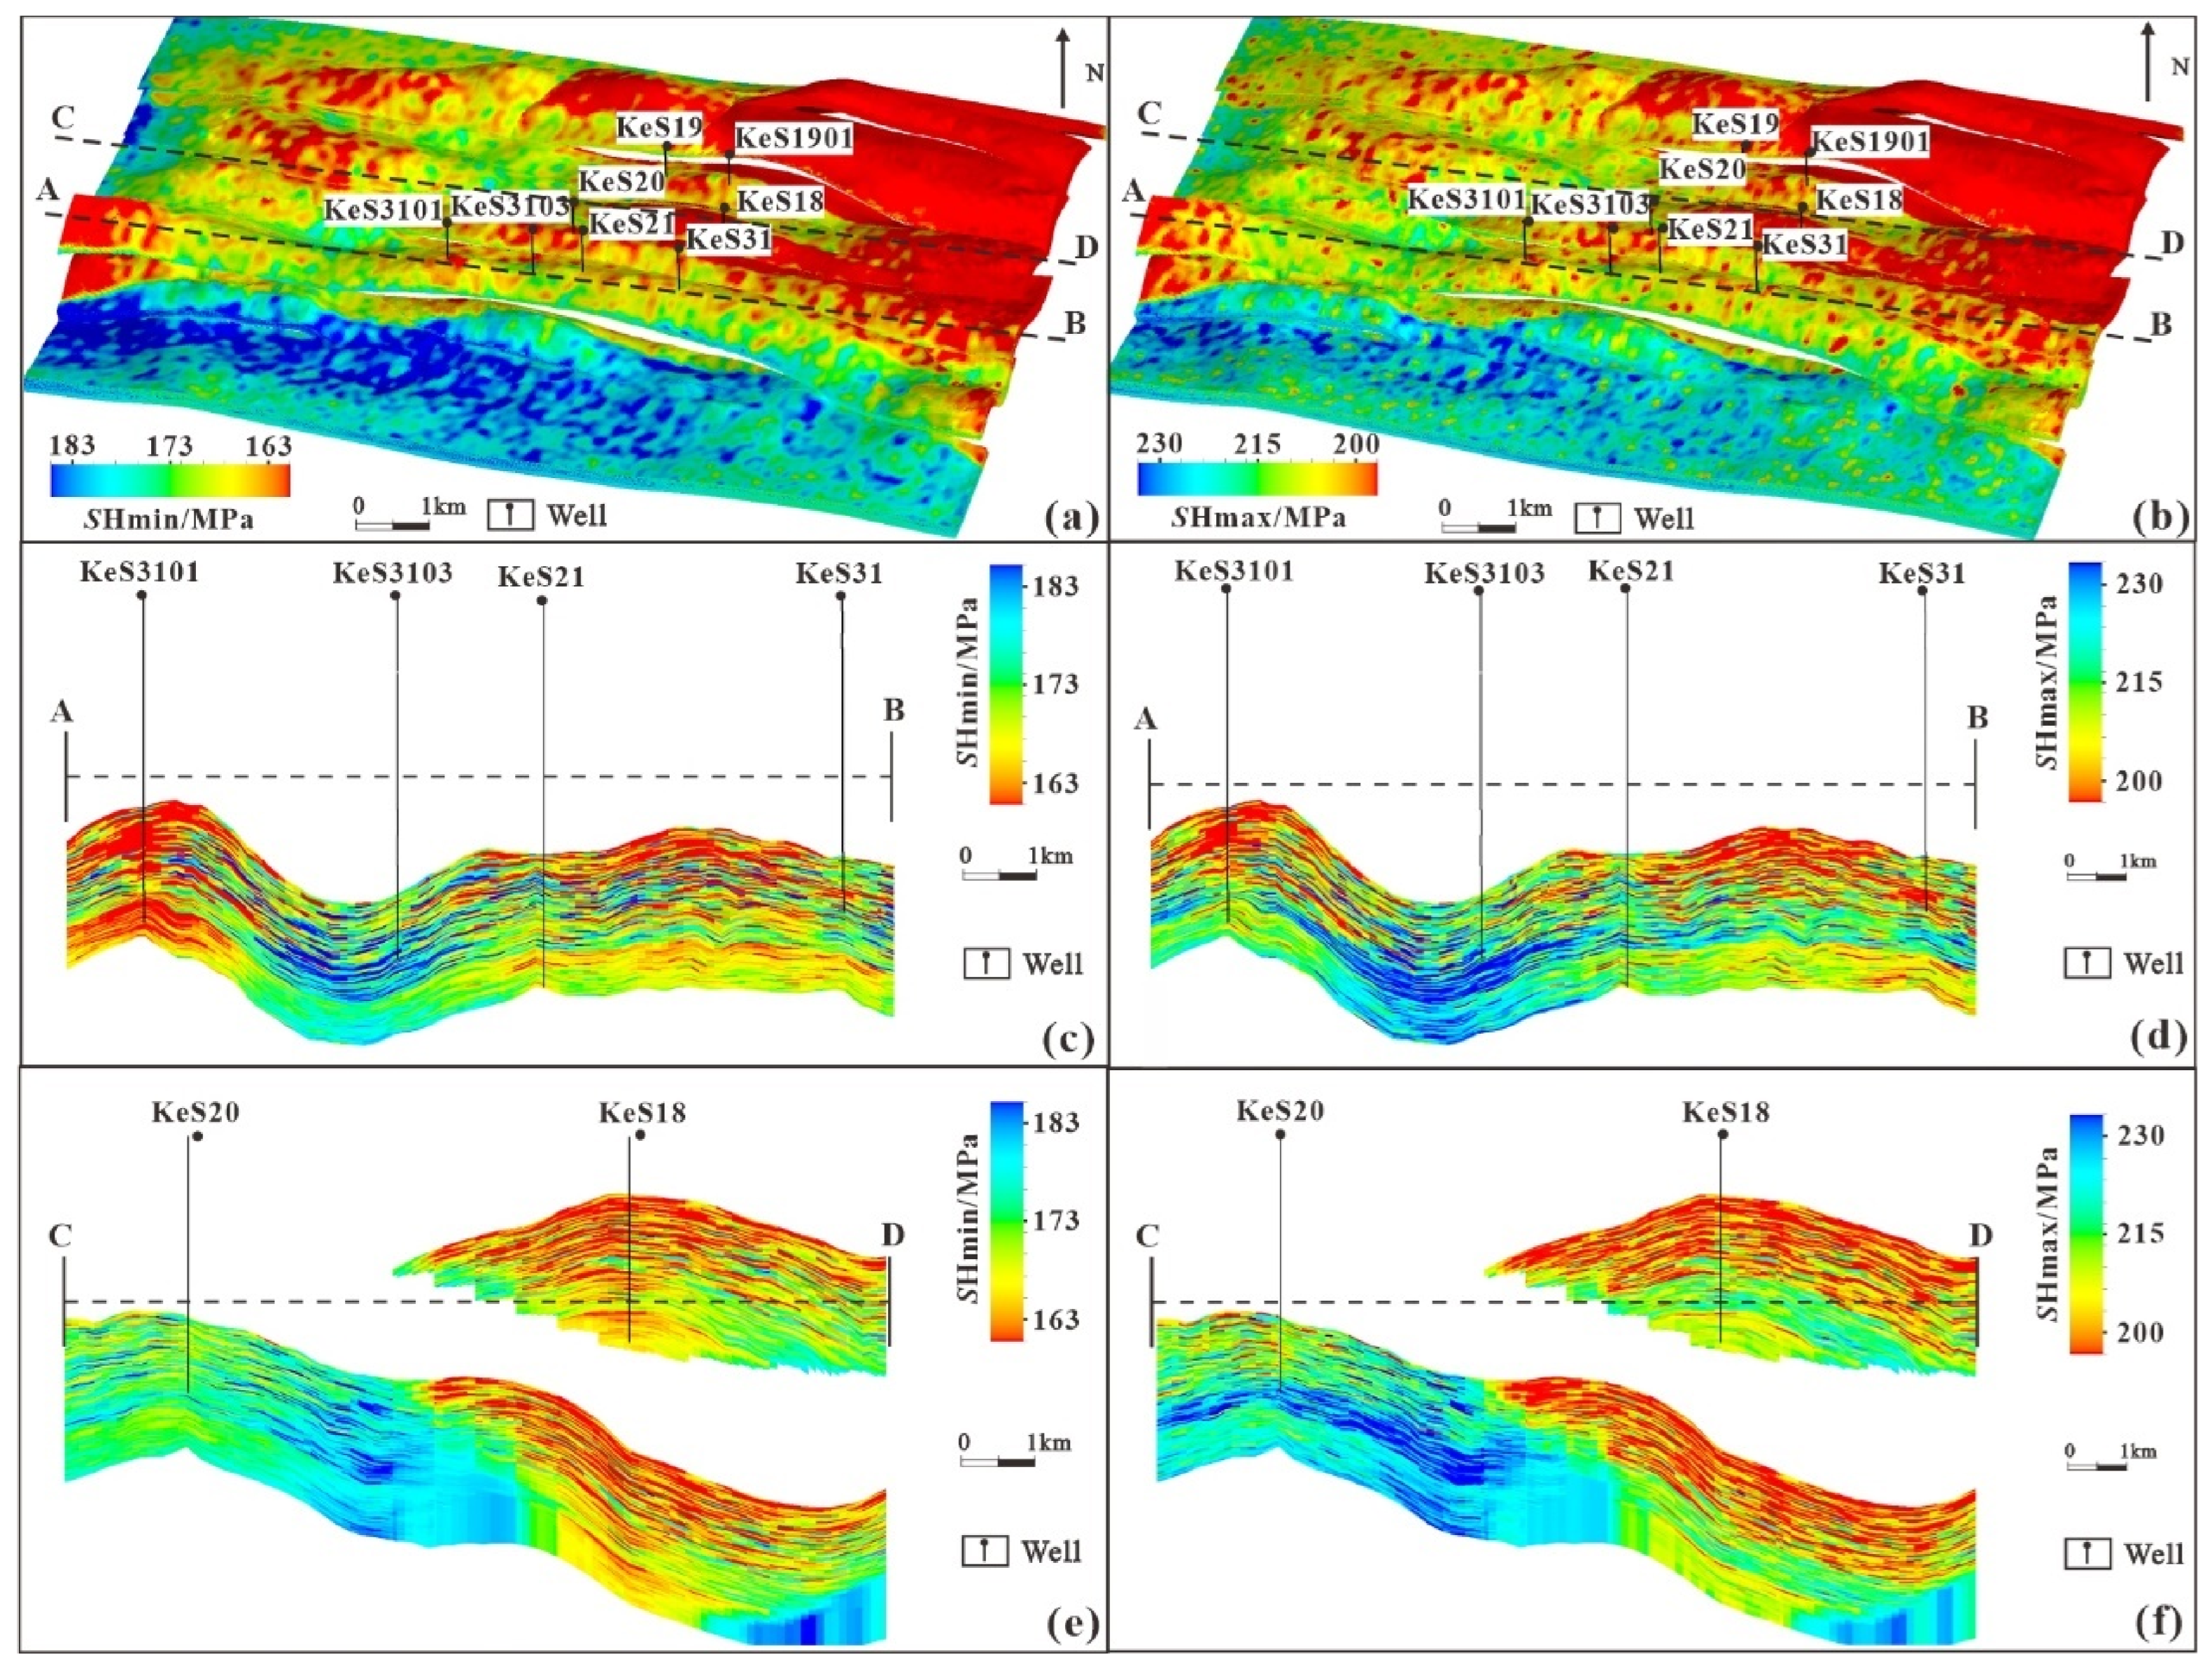
Figure 3 shows the prediction results of the maximum and minimum horizontal principal stresses in the study area. The planar distribution trends of the two are basically consistent, macroscopically showing a pattern of low in the north and high in the south and low in the east and high in the west; controlled by the combination of tectonic evolution, lithology differences and fault development, stress transmission is affected, resulting in local stress deviation from the macroscopic distribution trend [30,31]. This distribution characteristic is consistent with the regional tectonic background and reservoir geological conditions of the study area, reflecting the evolution law of the stress field superimposed by macroscopic structures and local geological factors. As can be seen from the three south-to-north cross-well sections in Figure 3, anticlinal reservoirs are controlled by internal stress differentiation. The core (high part) of the anticline is the uplift center, where rock strata are dominated by tensile deformation, forming a tensile stress environment that easily induces the development of microfractures and acts as stress release channels, with more developed tensile fractures (as shown in Figure 4), resulting in relatively low stress values, while the limb (low part) is located at the inclined position, directly receiving the transmission of horizontal compressive stress, with deformation dominated by compression-shear. Stress cannot be effectively released through fractures and continues to accumulate, and the inclination angle of the strata further amplifies the effect of compressive stress. Affected by this, the maximum and minimum horizontal principal stresses show a dual increasing trend: vertically from top to bottom and planarly from the anticline hinge/core to the limbs.
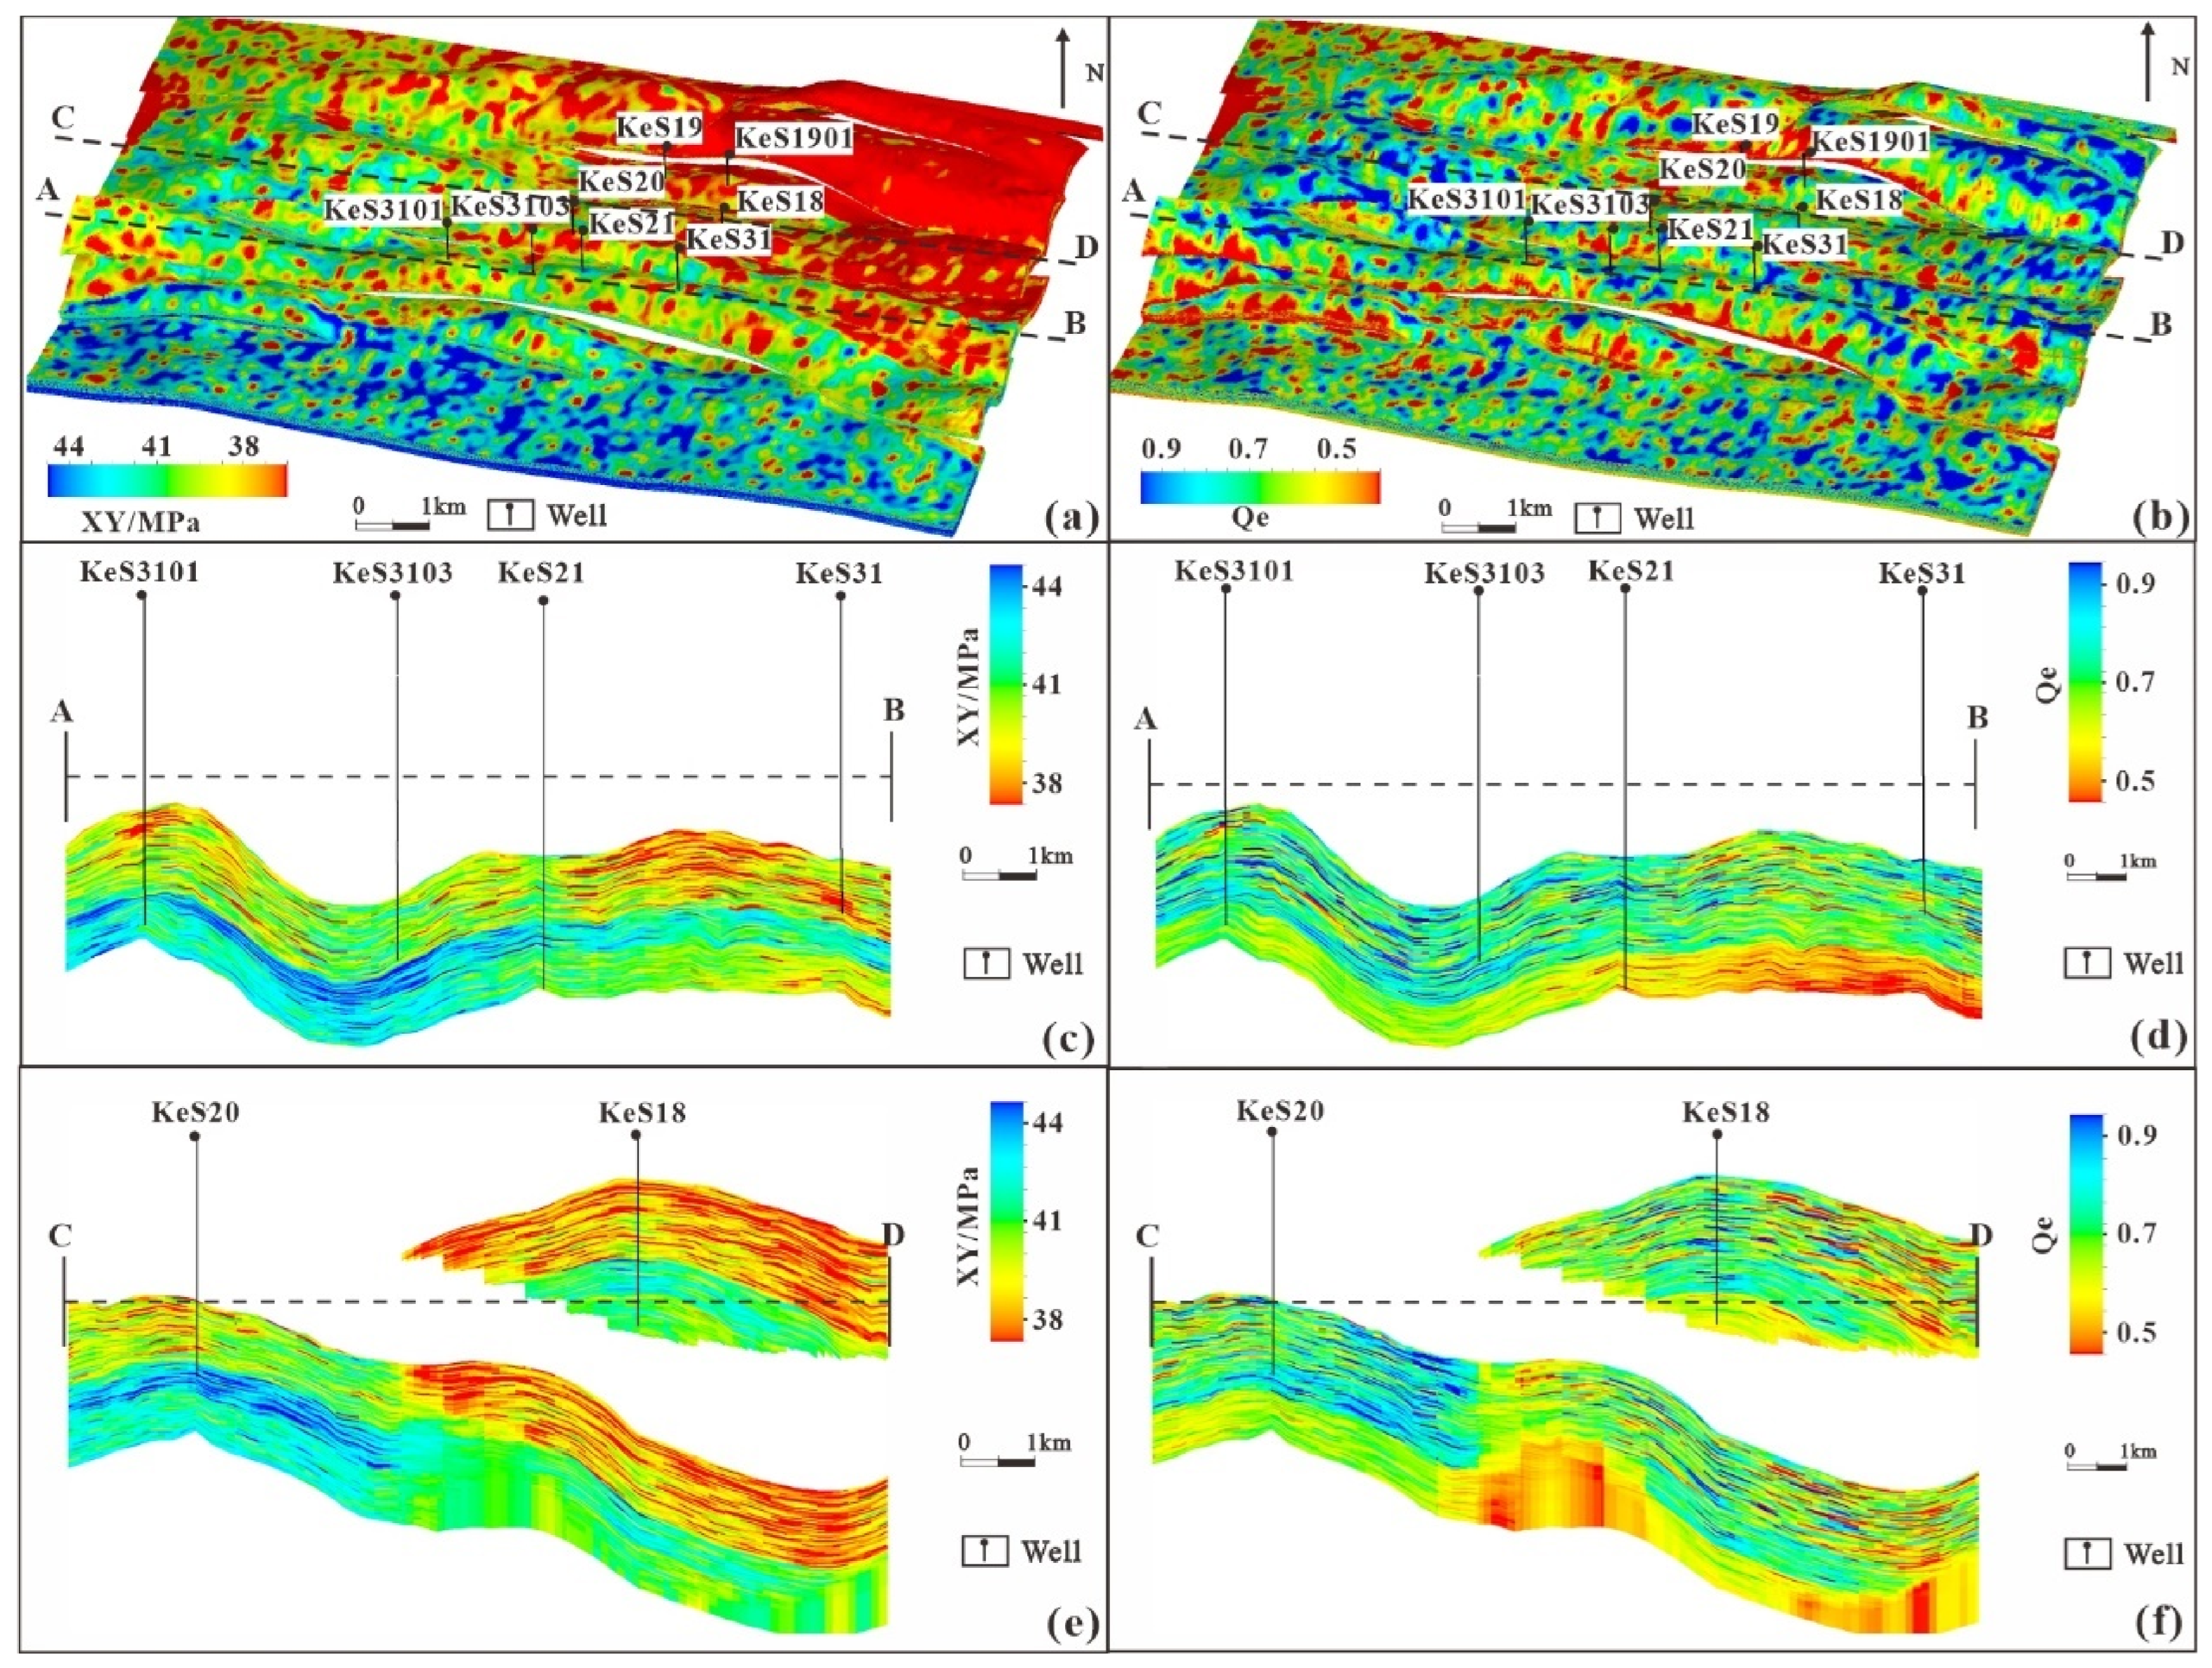
Figure 4 reveals that the stress concentration intensity of the Bashijiqike Formation in the study area has no overall zonation, but the low stress concentration areas in the study area are mostly distributed in areas surrounding faults, which is mainly related to the stress release effect caused by fault activities. The existence of faults enables local stress to be adjusted and released, thereby reducing the degree of stress concentration. The horizontal stress difference generally shows a spatial distribution pattern of low in the north and high in the south and low in the east and high in the west. Although the overall horizontal stress difference in the southern part of the study area is relatively high, it also shows low values at positions with low rock modulus, reflecting that rock mechanical parameters have a significant controlling effect on in situ stress distribution. This spatial variation in stress and stress difference directly influences the effectiveness of hydraulic stimulation; in the anticlinal core, stress release along faults and fractures results in both relatively low minimum horizontal stress and a small horizontal stress difference, which promotes the opening of natural fractures and allows hydraulic fractures to initiate and propagate in multiple directions, forming complex fracture networks; in contrast, flank areas near faults are characterized by localized stress concentration and larger horizontal stress differences, where natural fractures are less developed and hydraulic fractures tend to propagate as planar, unidirectional fractures, limiting the stimulated reservoir volume. Therefore, the anticlinal core is more favorable for hydraulic stimulation than the flanks. Low stress concentration not only facilitates the opening of natural fractures but also maintains the seepage capacity of fractures, while low horizontal stress difference can make the formation stress field distribution more uniform, thereby promoting hydraulic fractures to break free from unidirectional constraints, achieve multi-directional initiation and propagation [32], and finally form complex network fractures rather than unidirectional straight fractures, significantly increasing the stimulated reservoir volume.
To verify the accuracy of the method, five blind wells were selected according to the following criteria: (1) they are spatially distributed across different structural positions (anticline core, limb, and fault-adjacent zones); (2) their logging data quality is high and complete; (3) they were excluded from the modeling process. The predicted SHmax and Shmin at the target interval were compared with the values derived from well logging. The verification results show that the predicted horizontal stress values of the five blind wells are highly consistent with the measured values, confirming that this modeling method can accurately characterize the distribution law of the stress field in the target interval. The specific data of prediction errors and coincidence rates of the five blind wells are shown in Table 1; the average coincidence rate between the predicted values and the measured well logging data reaches as high as 91.93%, which verifies the accuracy of the prediction model and provides reliable support for reservoir evaluation and stimulation.

4.3. 3D Discrete Fracture Network Modeling

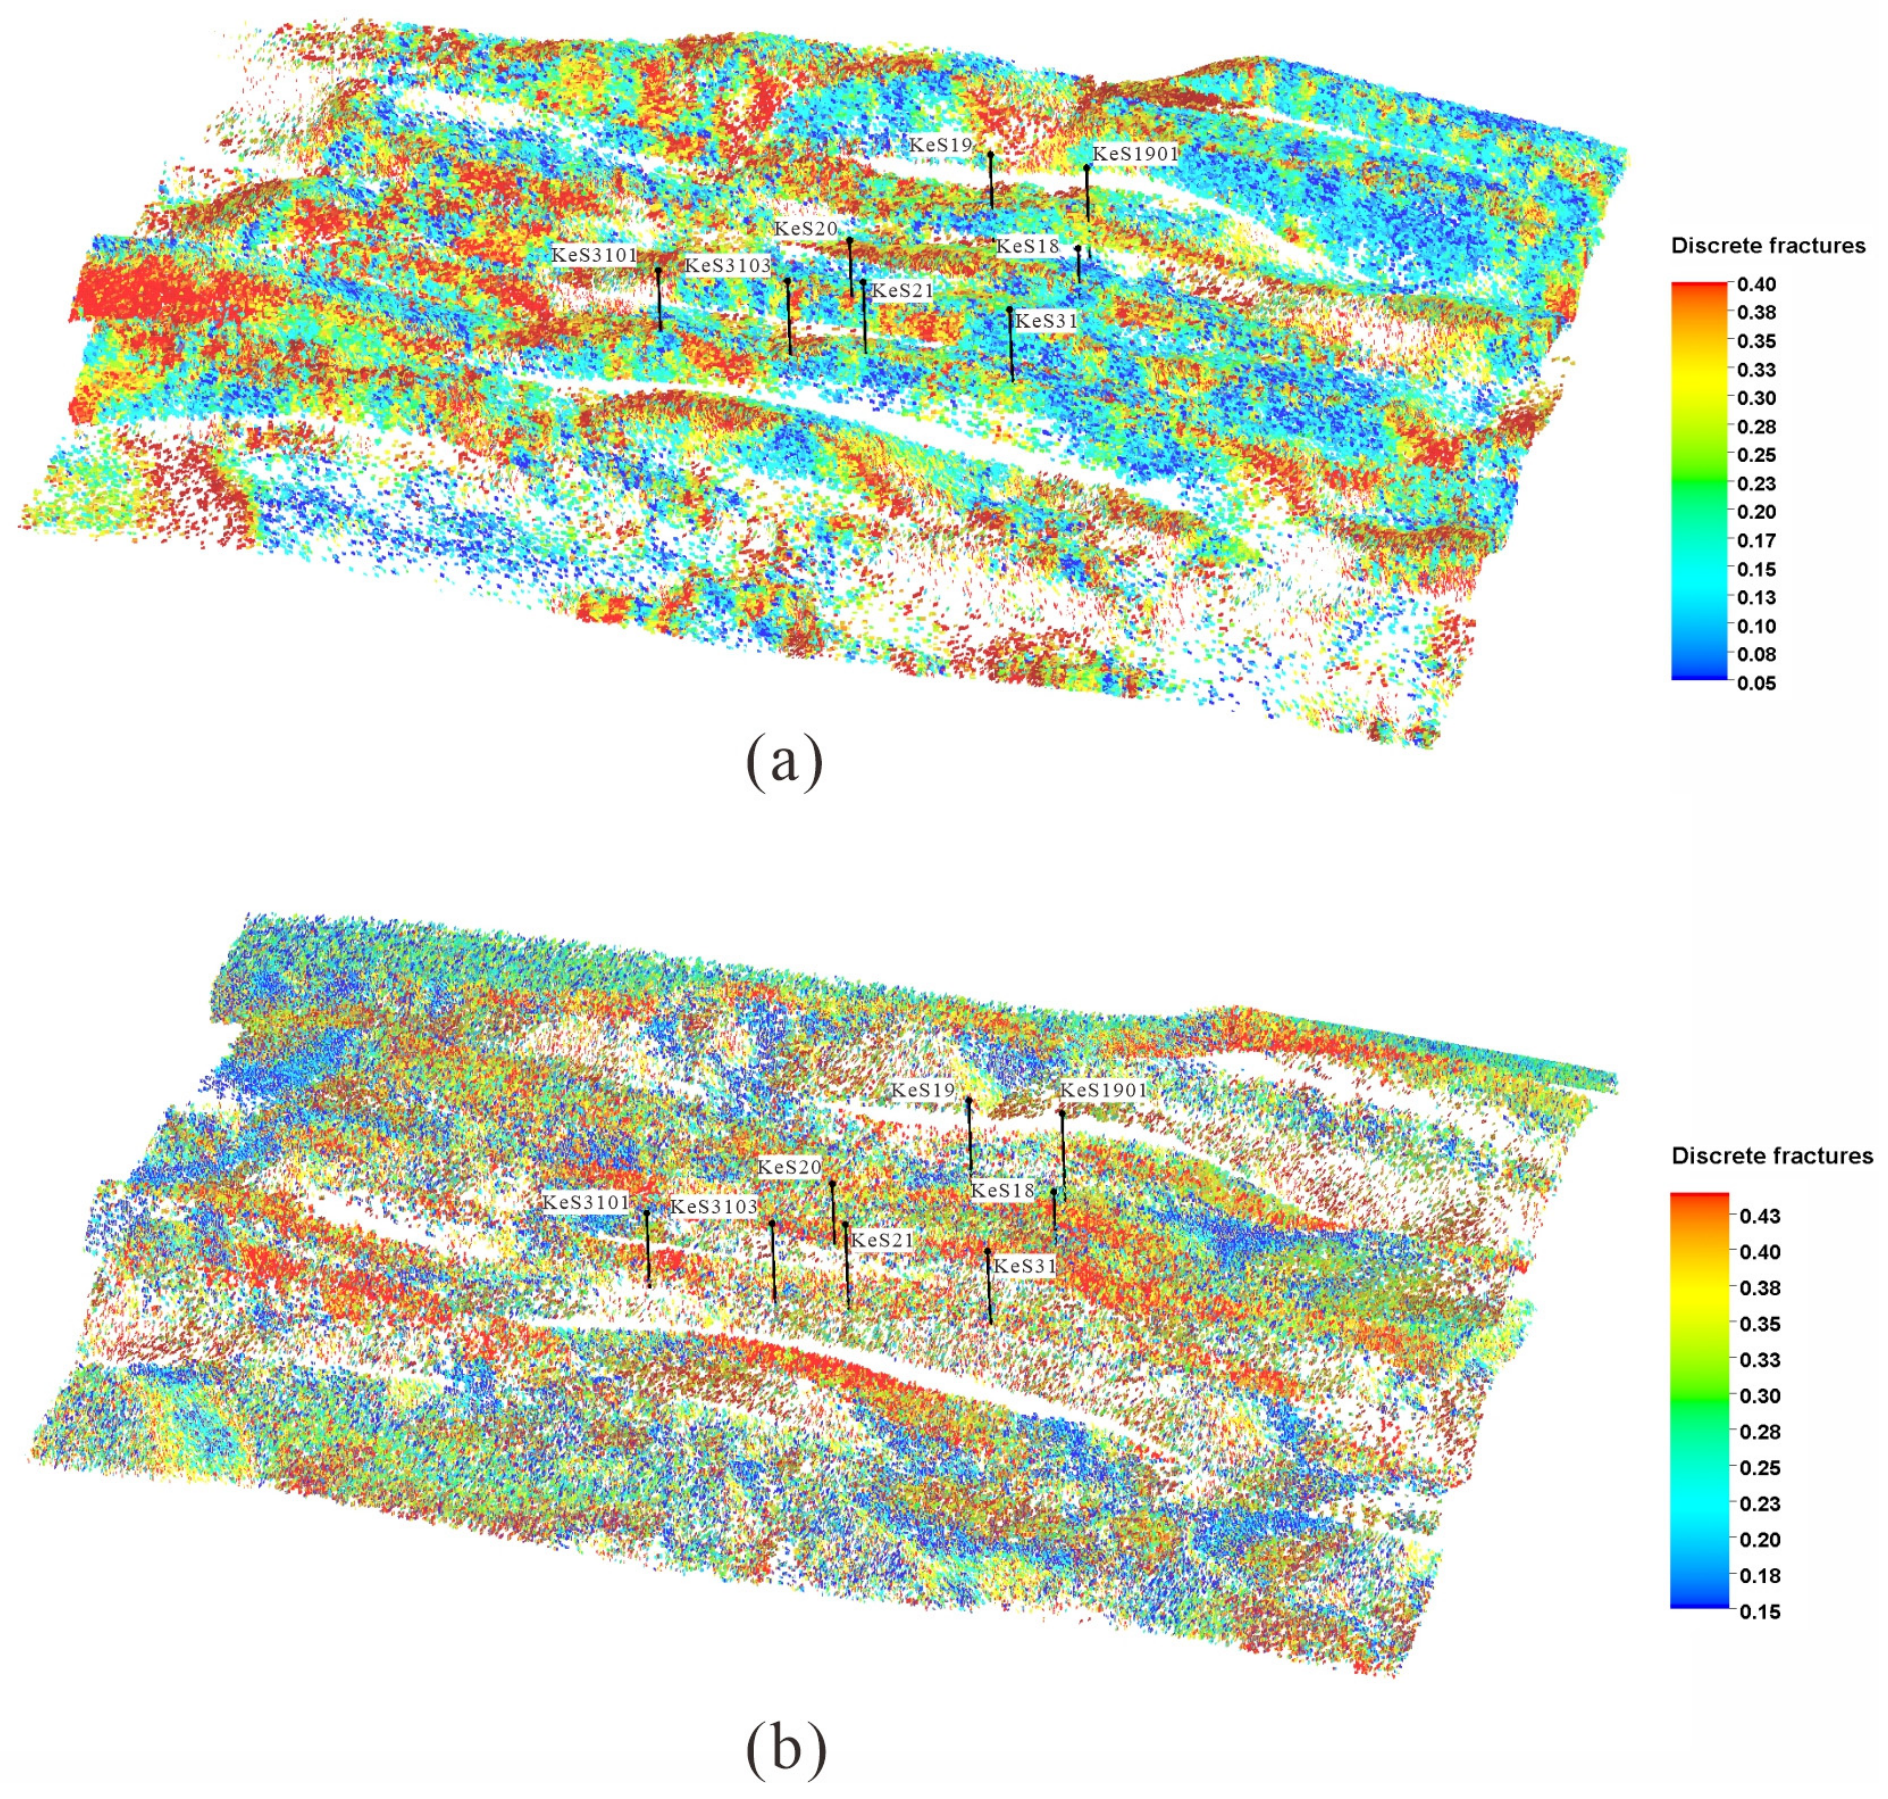
On the premise of clarifying the in situ stress distribution characteristics of the South Keshen block, the prediction of fracture development characteristics is further carried out based on the fracture development trend surface model (Figure 5). Tectonism has obvious control over the activity of different types of fractures [33]. Both tensile fractures and shear fractures can effectively improve the pore structure and permeability of tight sandstone reservoirs, but there are significant differences in their contributions to reservoir stimulation and fluid migration. Shear fractures have a stronger ability to cut through interbeds and connect reservoir spaces and typically maintain high fracture conductivity under the combined support of rough walls, mineral debris, and asperity contacts [34]. Under continuous tectonic compaction, these features help resist fracture closure and preserve residual aperture, thereby retaining effective permeability even at great depth. Moreover, tight sandstone reservoirs with well-developed shear fractures generally exhibit a slower permeability decline during production than those dominated by tensile fractures. Overall, shear fractures are more conducive to hydrocarbon occurrence, migration and efficient production and are the key controlling factor for hydrocarbon enrichment in tight sandstones. Therefore, in the next step of oil and gas exploration deployment in the South Keshen area, priority should be given to identifying and tracking favorable zones with densely developed shear fractures, which can serve as an important basis for exploration evaluation and well location optimization.

5. Discussion

5.1. Deformation Characteristics and Dynamic Genesis of the Kelasu Tectonic Belt

As the core component of the South Tianshan foreland thrust belt, the tectonic deformation of the Kuqa Depression is controlled by the far-field compression effect triggered by the Cenozoic collision between the Indian Plate and the Eurasian Plate. Secondary structural units such as the Northern Monoclinal Belt, Kelasu Tectonic Belt, Qiulitage Tectonic Belt and Yaken Structural Belt are developed sequentially from north to south within the depression, and there are significant differences in the deformation initiation time, evolution intensity and dynamic characteristics of each structural belt (Table 2) [35,36,37]. Under the rapid and continuous uplift of the Tianshan block, a north-to-south compression effect is generated, and the intensity of tectonic deformation gradually decreases from the basin margin to the basin interior [38]. In terms of deformation intensity and dynamic characteristics, combined with quantitative analysis of tectonic deformation amplitude, fault development density and stratum folding intensity, the near north–south compressive stress intensity borne by the Kelasu Tectonic Belt is second only to that of the Northern Monoclinal Belt. This is mainly because the Kelasu Tectonic Belt is close to the compressive stress source of the South Tianshan orogenic belt, separated only by the Northern Tectonic Belt, with a low degree of stress attenuation; therefore, compared with the southern tectonic belt far from the stress source, its tectonic deformation is characterized by earlier initiation, faster rate, greater intensity and more significant overall deformation.
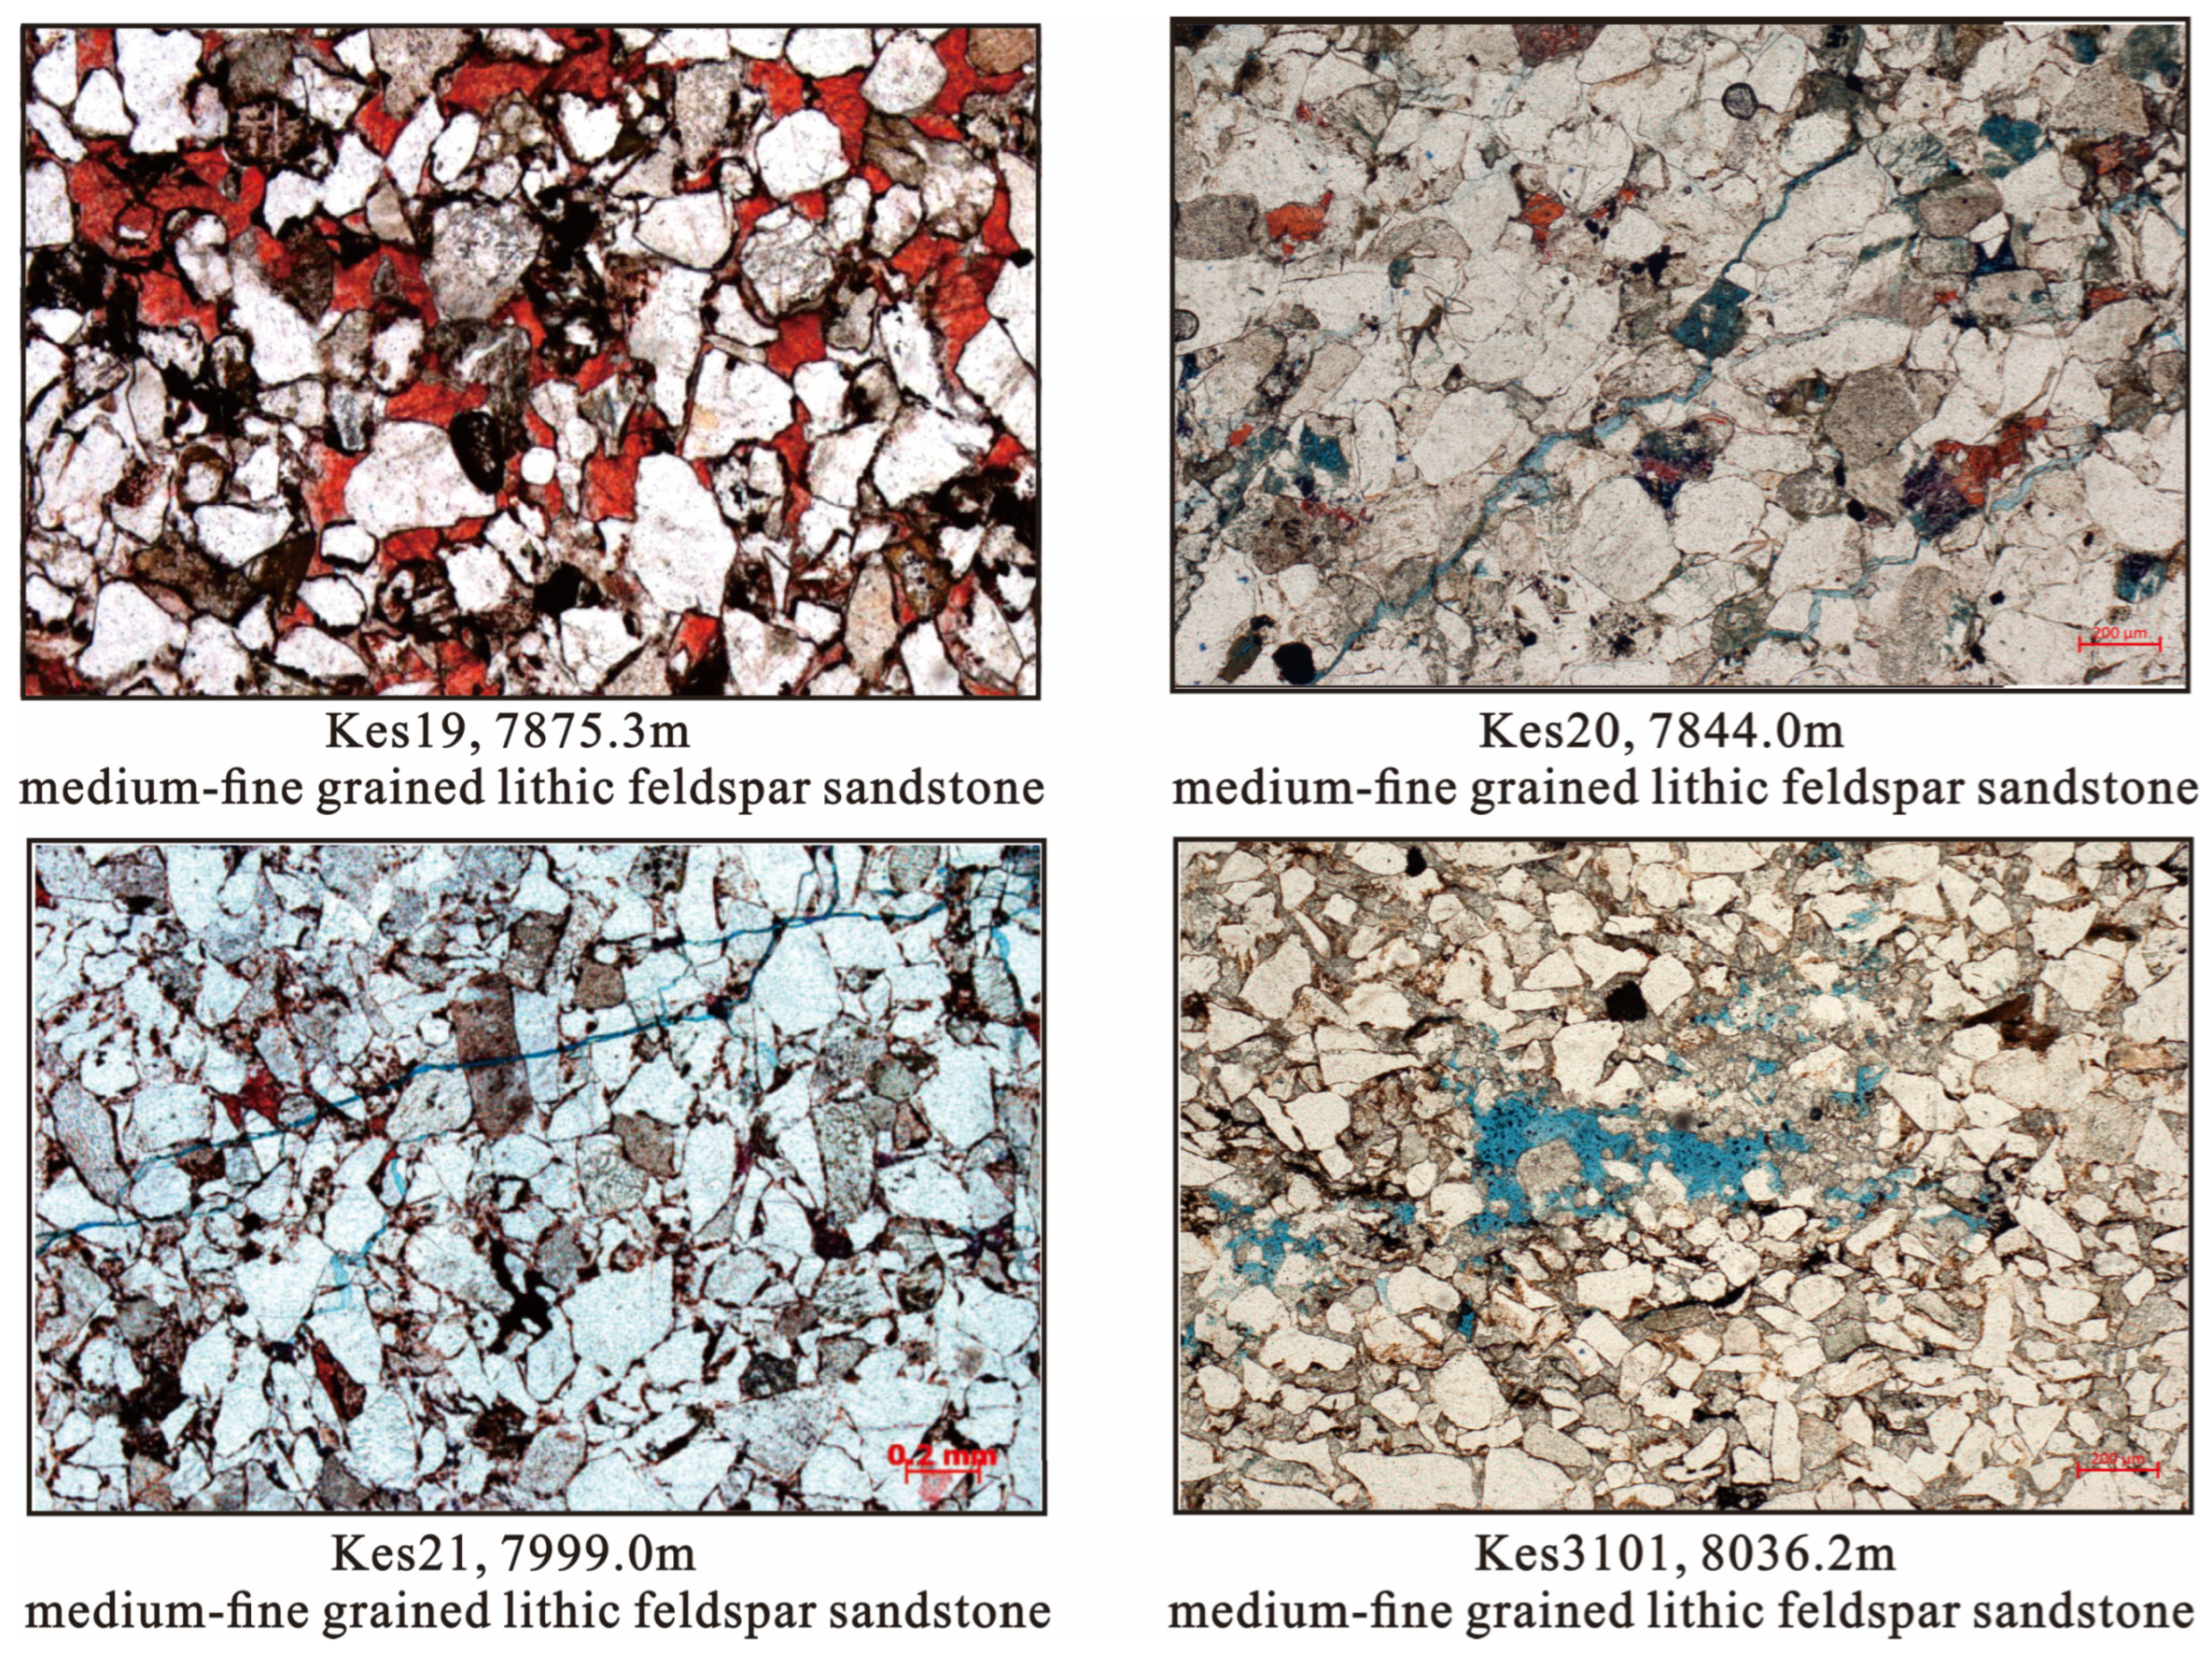
Under the continuous superposition of far-field compressive stress from the South Tianshan orogenic belt, reservoir sandstones in the Keshen area have undergone intense tectonic compaction, and the dominant ultra-strong porosity reduction effect is the core controlling factor of reservoir densification. The intensity of this process is much higher than that of normal diagenetic compaction, which not only significantly destroys primary intergranular pores, but also strongly inhibits the development of secondary pores. Quantitative studies on diagenesis of the Keshen Gas Field in the Kuqa Depression confirm that, under the influence of great burial depth and strong compaction of the Bashijiqike Formation reservoirs [39,40], the matrix physical properties of the reservoirs are poor, and mineral grains are dominated by line contact and concavo-convex contact (Figure 6). The average core porosity of the reservoir is 4.1%, the average matrix permeability is 0.05 mD, and dissolution pores and fractures are relatively developed [41,42]. The Bashijiqike Formation reservoirs in the Keshen area are typical fractured tight sandstone reservoirs, and fractures play a key role in improving the seepage capacity of such reservoirs.
Rock mechanical parameters of the target intervals in Dibei, Keshen and Zhongqiu from north to south in the Kuqa Depression were counted (Table 3). The average Young’s modulus of the Dibei block is about 30.5 GPa and the average uniaxial compressive strength is about 99.6 MPa, showing the strength characteristics of tight sandstone; the Young’s modulus of the Bashijiqike Formation in the Keshen block is about 34.4 GPa and the uniaxial compressive strength is about 110.1 MPa; the Young’s modulus of the Bashijiqike Formation in the Zhongqiu block is about 20.8 GPa and the uniaxial compressive strength is about 63.9 MPa.
With depth and stratum factors decoupled, the variation characteristics of rock mechanical properties from north to south in the northern Kuqa Depression are very obvious. The ratio of Young’s modulus to depth decreases from north to south: the ratio of Young’s modulus to depth is 5.04–5.45 MPa/m in the Dibei block, 4.03–4.80 MPa/m in the Keshen block, and 3.12–3.40 MPa/m in the Zhongqiu block; the ratio of uniaxial compressive strength to depth is 15.8–18.2 kPa/m in the Dibei block, 12.7–14.8 kPa/m in the Keshen block, and 8.97–11.2 kPa/m in the Zhongqiu block. Under the influence of the South Tianshan tectonic movement, compression weakens, deformation rate slows down, and stress decreases with plastic relaxation from north to south in the Kuqa Depression, and the stress accumulated inside the geological bodies of the Northern Tectonic Belt, Kelasu Tectonic Belt and Qiulitage Tectonic Belt decreases gradually.

5.2. Differential Structural Styles and Geomechanical Characteristics of the Kelasu Tectonic Belt

Four types of structural styles are mainly developed in Kelasu: pop-up structural traps, imbricate thrust traps, structural triangle zones and fault-bend fold traps. Pop-up structural traps are formed by thrust faults napping overlying strata, mainly manifested as anticlines or back-thrust blocks; imbricate thrust traps are belt-shaped structures composed of multiple groups of faults with similar dips, with fault planes arranged in an imbricate pattern; structural triangle zones are anticlines or high zones near the structural axis; fault-bend fold traps are fold traps formed by bending deformation caused by fault activities. They are further divided into 16 subcategories according to differences in structural parameters.
The Kelasu Tectonic Belt has developed abundant structural styles under multi-stage strong compression, and the main geomechanical controlling factors for different structural styles remain unclear. To accurately reveal the development law of favorable reservoirs under different structural styles in the study area and clarify the main controlling factors of reservoir quality, this paper adopts a research method combining geomechanics and finite element numerical simulation and systematically carries out quantitative classification of reservoir quality and analysis of main controlling factors based on technical means such as single-well geological modeling and rock mechanics experiments. Stress simulation is conducted for different structural types under the same tectonic setting. The results show that there are significant differences in favorable reservoir areas among pop-up structures, imbricate thrust structures, structural triangle zones and fault-bend folds.
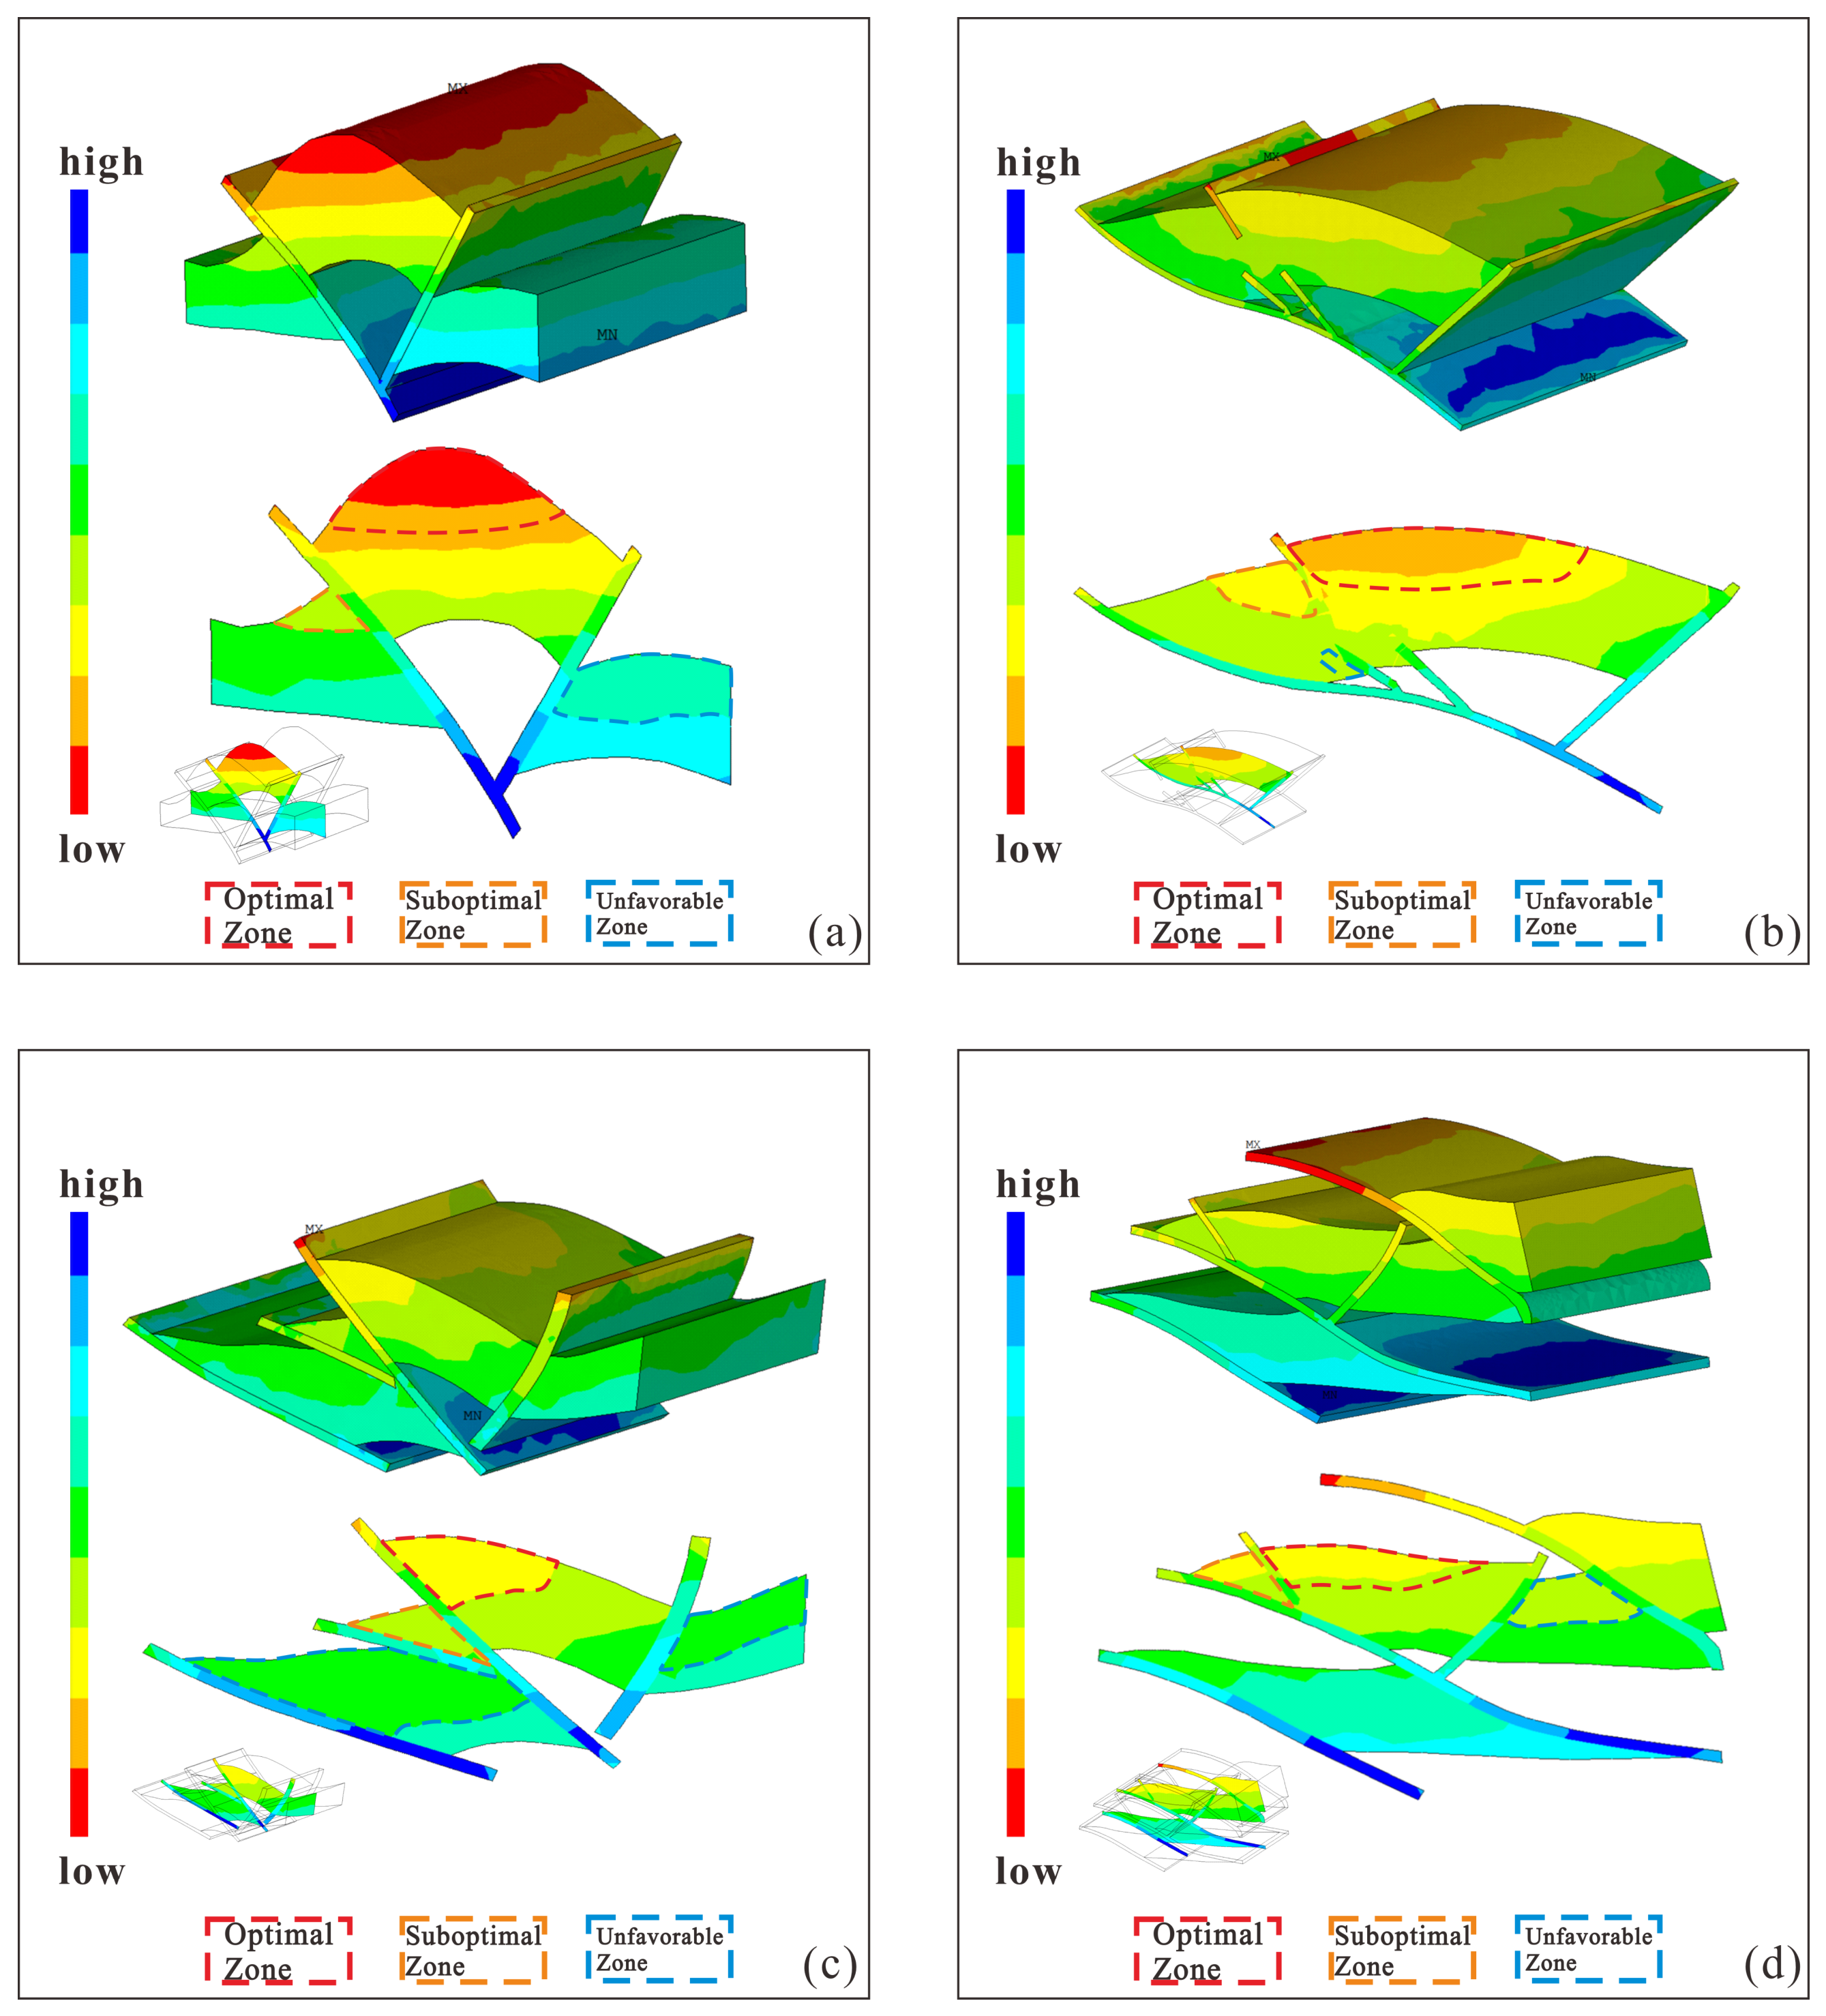
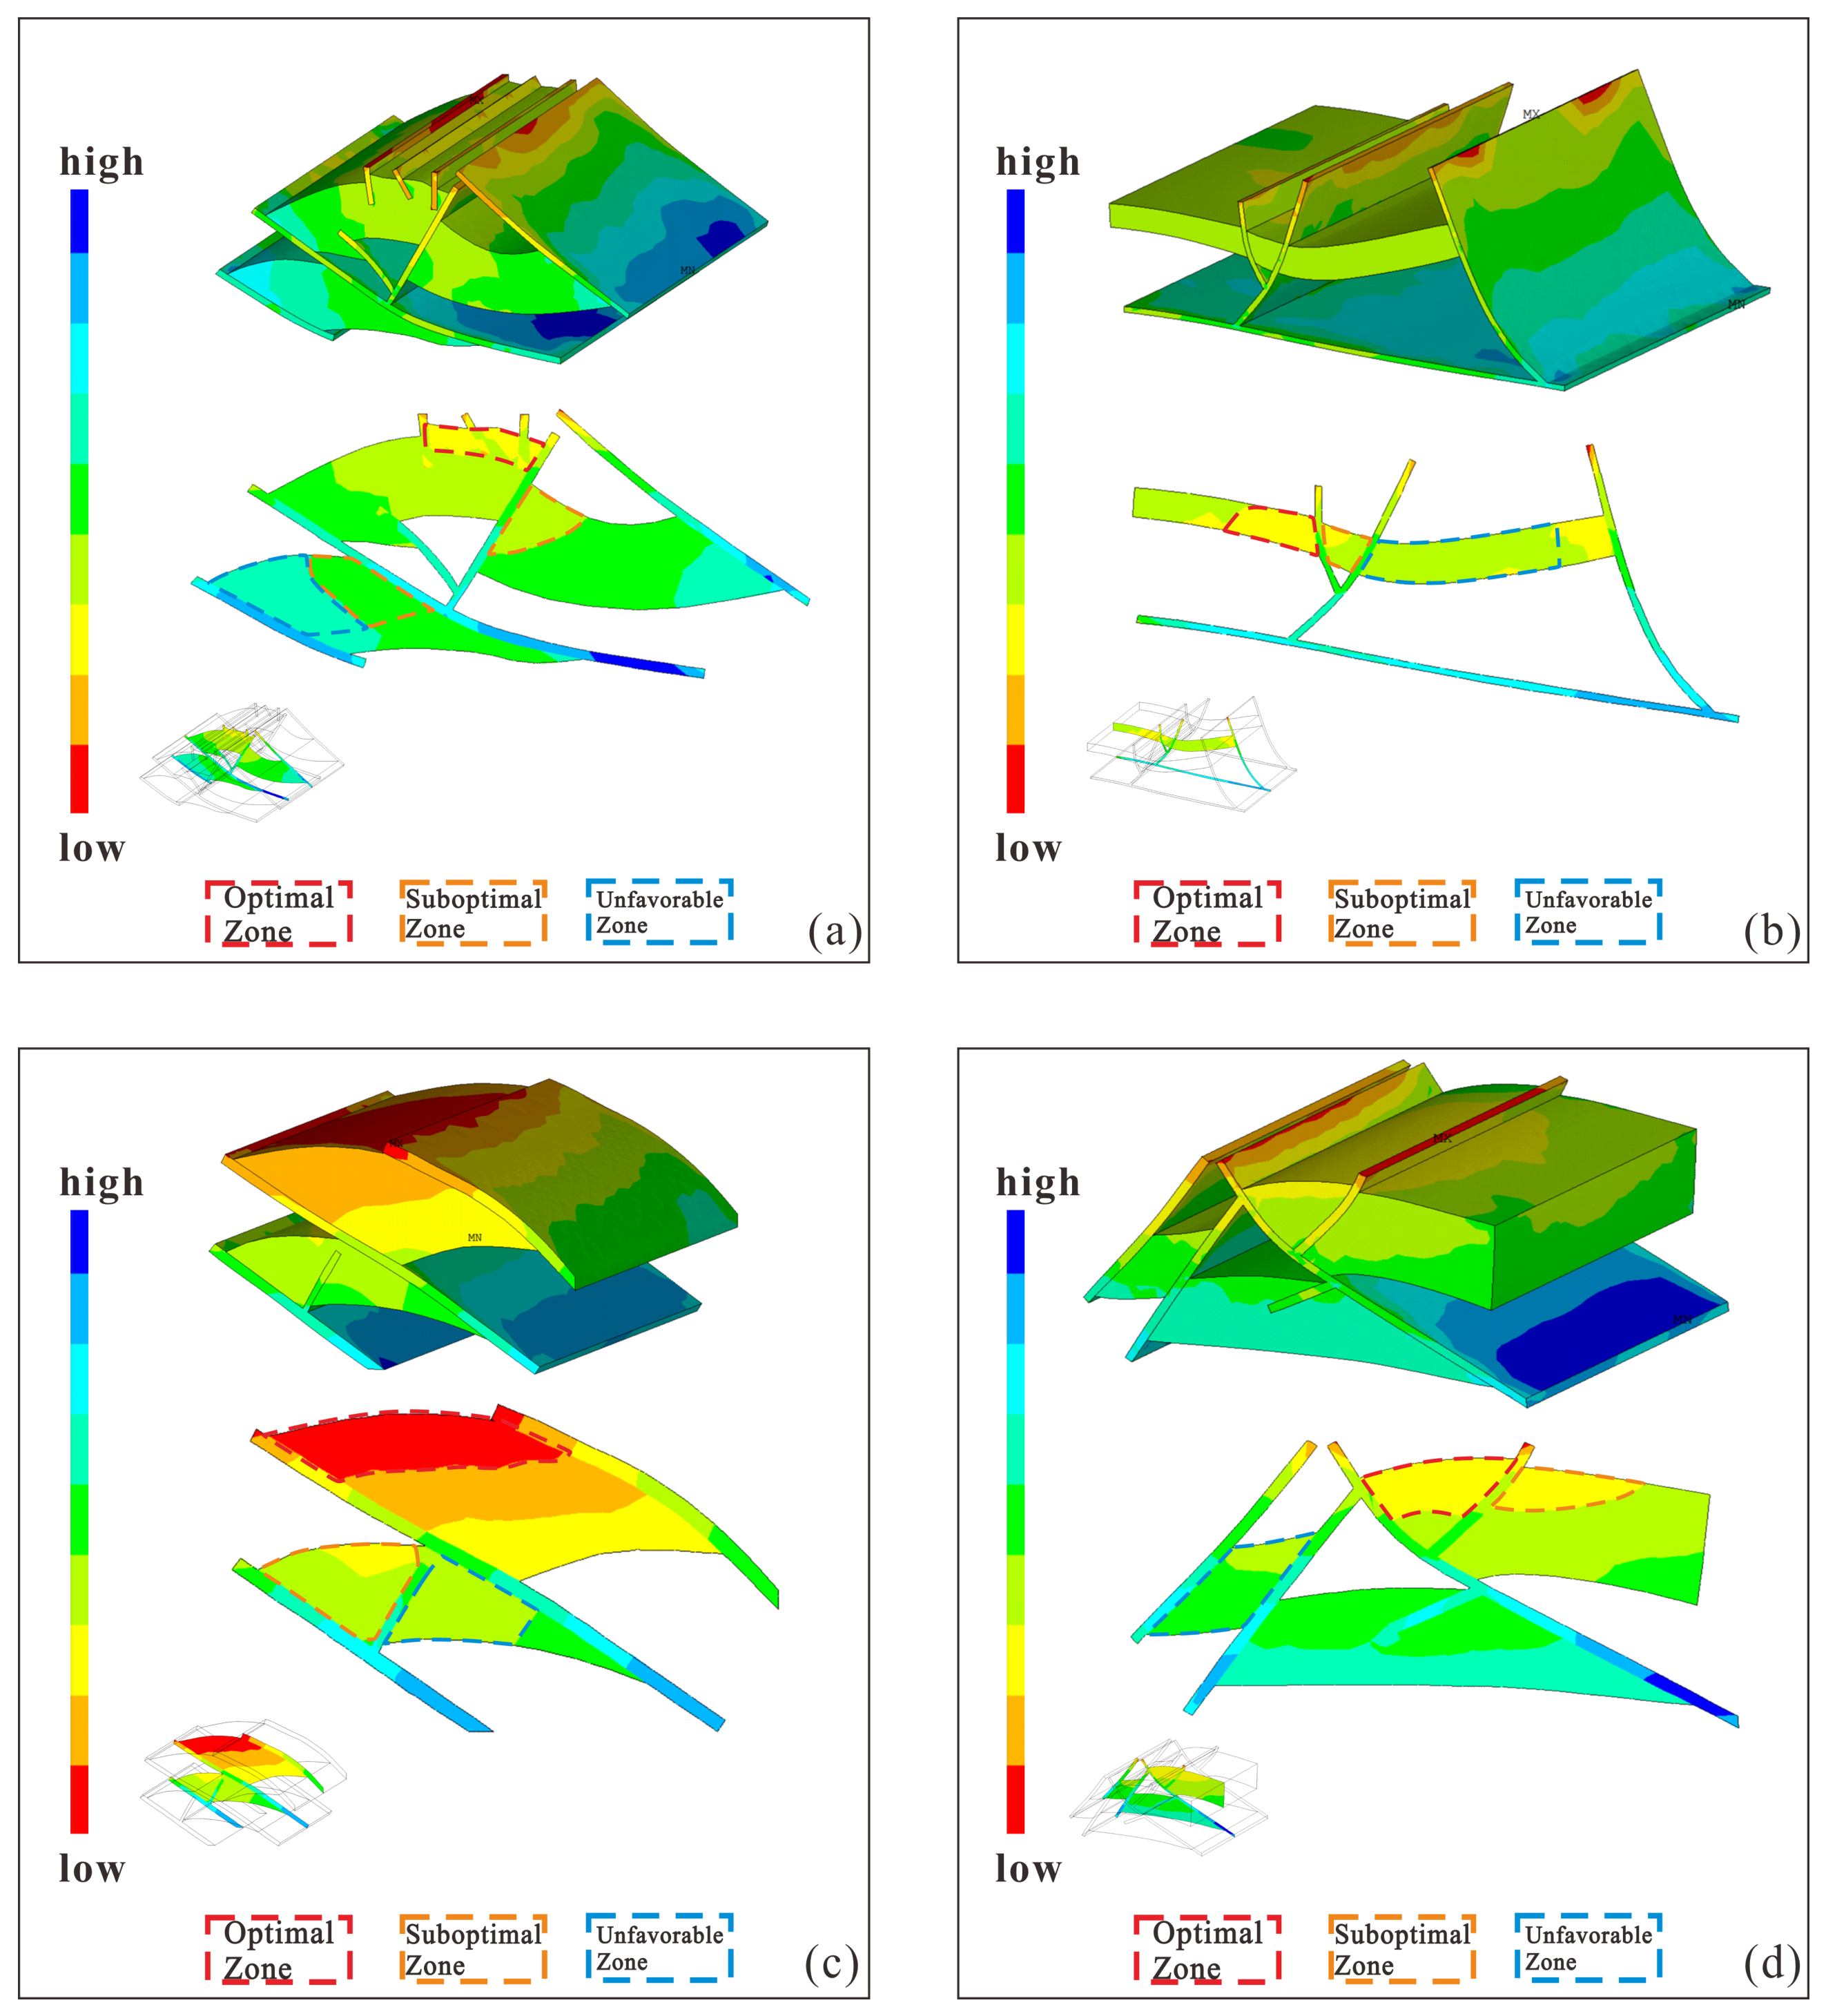
For pop-up structural traps, the compressive stress is transformed into uplift extensional stress. As the uplift center, the central core disperses and consumes compressive stress, while the surrounding faults become stress concentration areas, finally forming a stress distribution pattern of “low in the center and high in the periphery” (Figure 7). The high part in the center is a geomechanically favorable zone. The core genesis of pop-up structural traps lies in the combined action of thrust faults and back-thrust faults. The stress distribution presents a remarkable feature of “low stress at high positions and high stress at the footwall of back-thrust faults”, and reservoir zonation is closely related to the spatial combination of faults. Specifically, coaxial pop-ups (Figure 7a) show the largest continuous low-stress core; adjusted coaxial (Figure 7b) have a reduced core with marginal stress gradients; non-coaxial (Figure 7c) display banded or patchy low-stress zones; and adjusted non-coaxial (Figure 7d) show complex stress with scattered low-stress remnants. In all stress simulation figures, colors represent relative stress magnitudes (blue = high; red = low).
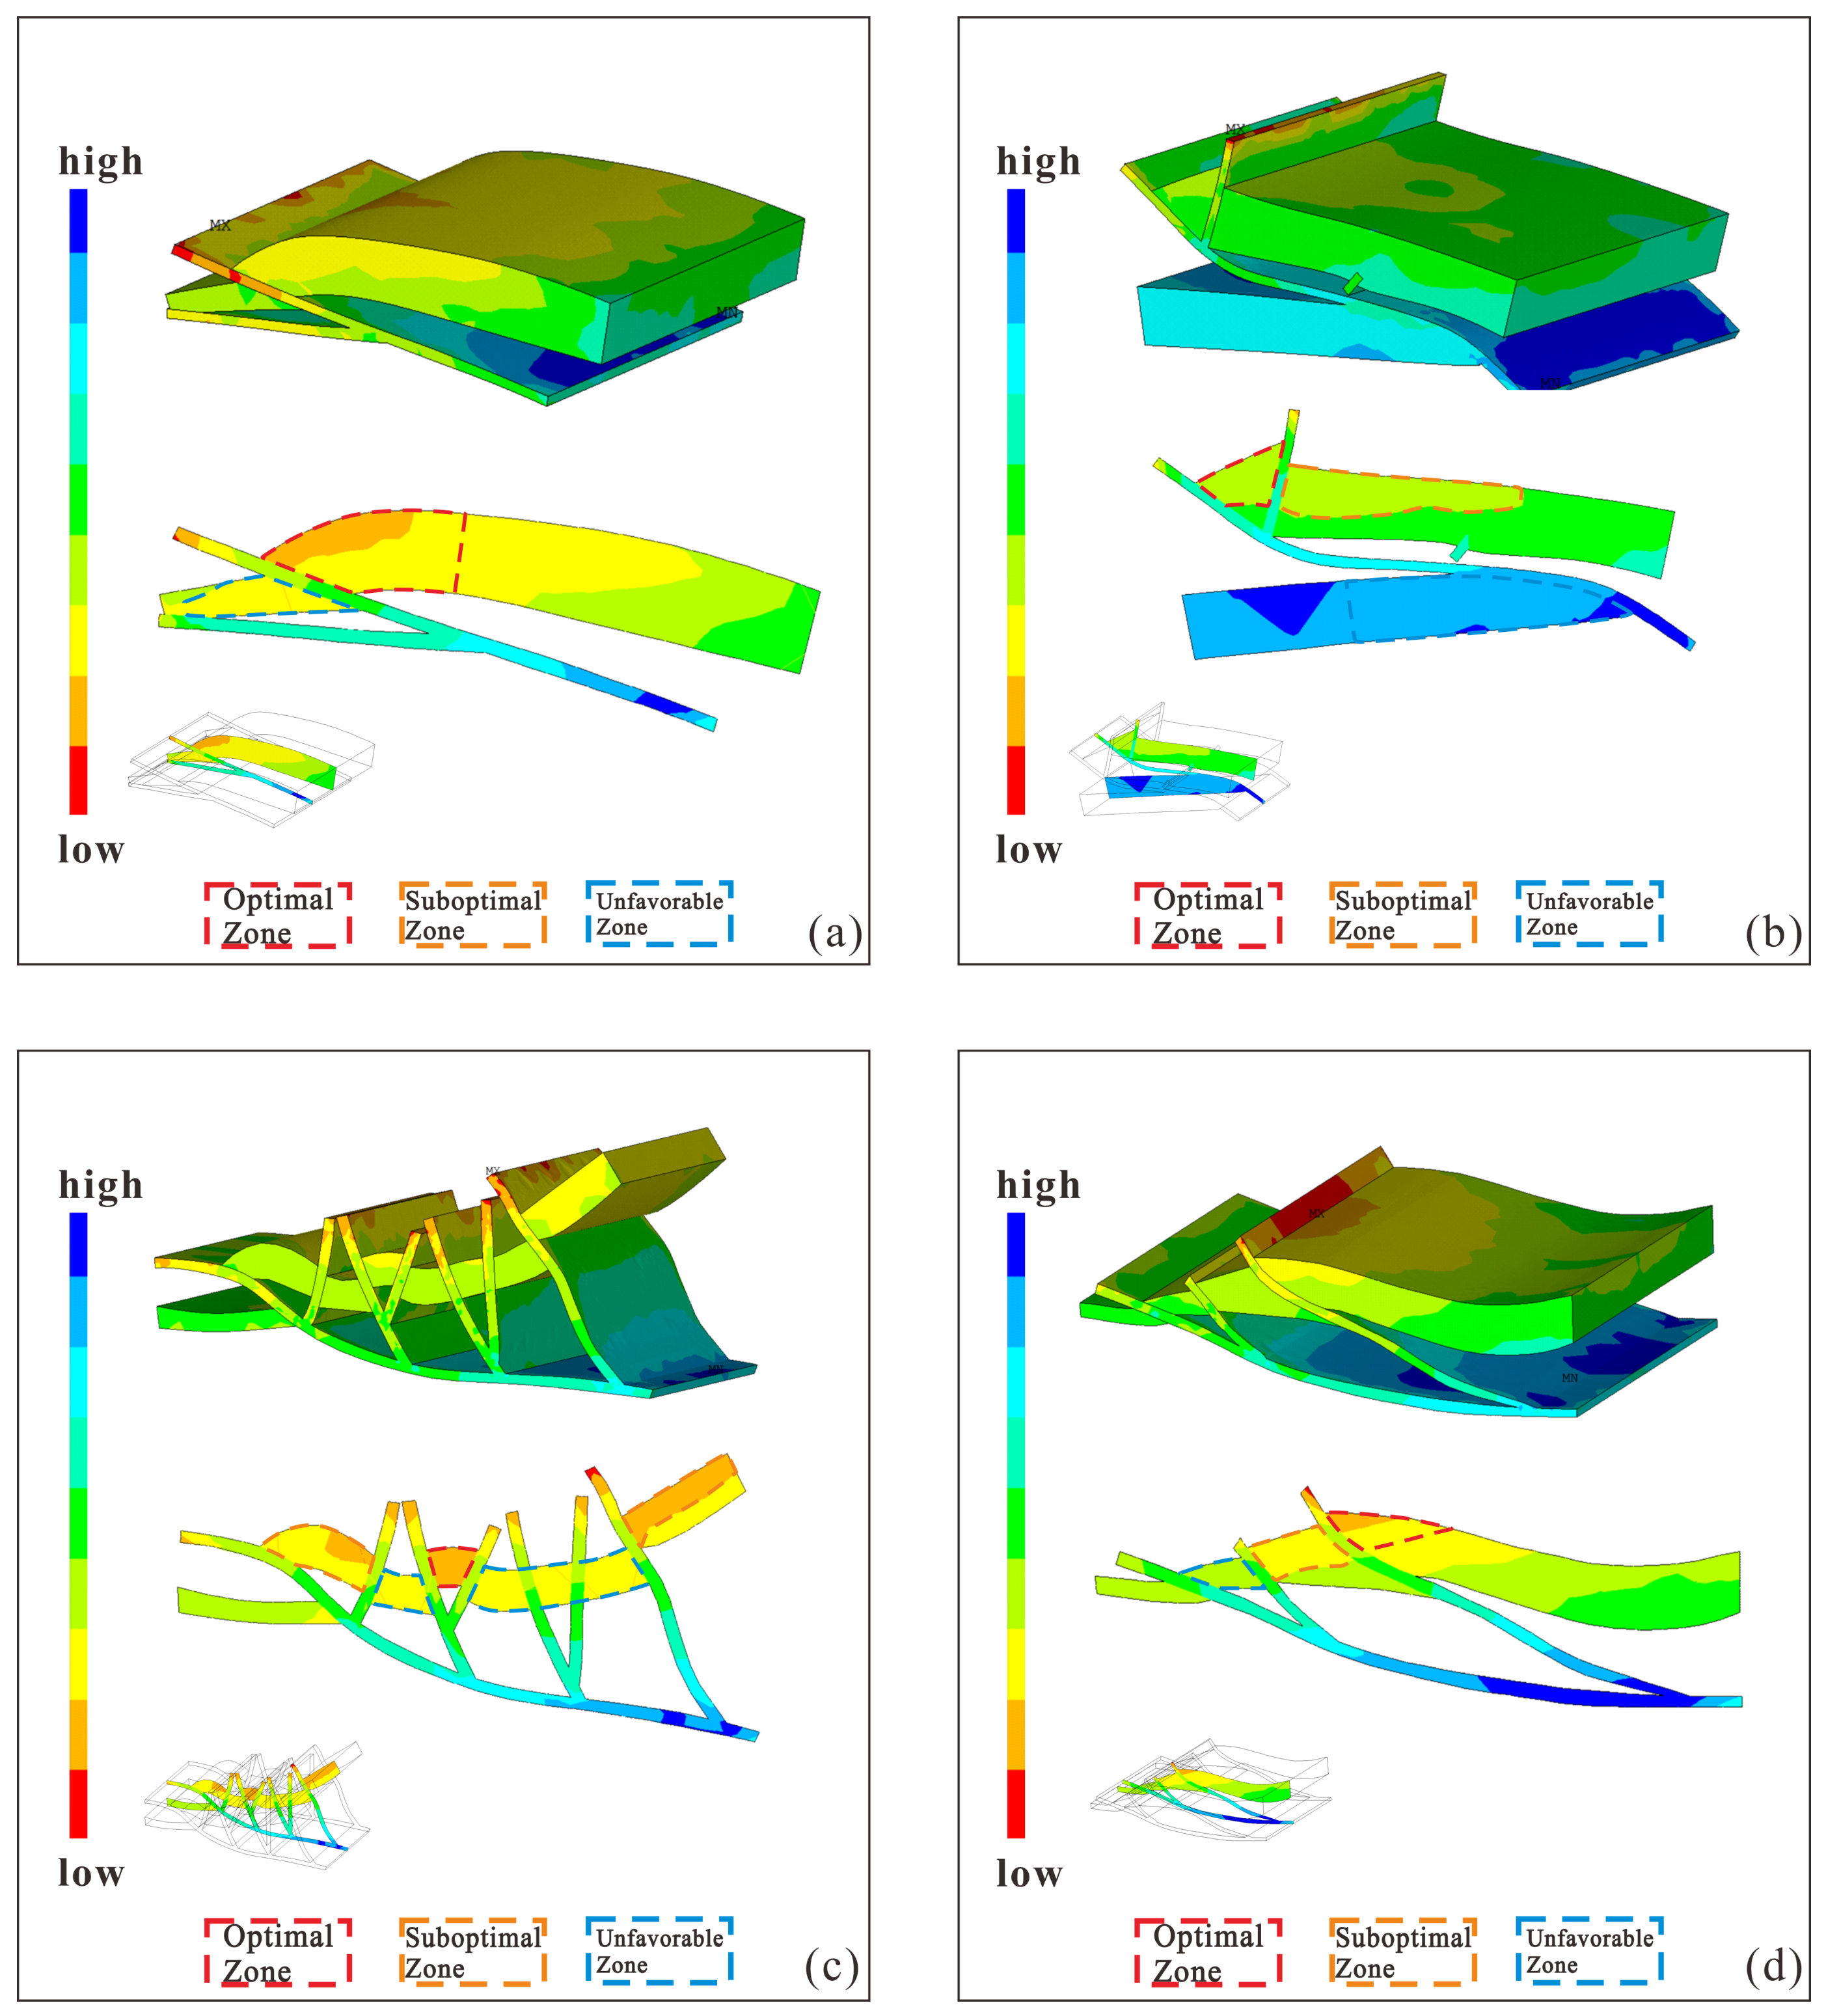
The footwall of the imbricate thrust structure serves as the “load-bearing support end” of the imbricate thrust belt. Under weak superimposition, the footwall bears all the stress from the nappe of the hanging wall. Affected by stratum stacking and rigid basement constraints, the stress cannot be dispersed and continues to accumulate, finally forming a distribution characteristic of “stress increasing from the hanging wall to the footwall” (Figure 8). Imbricate thrust traps are formed by multiple rows of thrust faults arranged in an imbricate pattern. The stress distribution is strongly correlated with the position of rows and belts, generally showing a law of “low stress in the front row and high stress in the rear row”, with local zonation changes affected by secondary faults or back-thrust faults. Among the subtypes, ramp-flat (Figure 8b) and layered-stacking (Figure 8d) imbricates show extensive hanging-wall stress release; pop-up modified (Figure 8c) exhibit the strongest fault-tip stress concentration; and imbricate fault-bend anticlines (Figure 8a) display high stress at fault roots with relatively low stress in anticlinal cores.
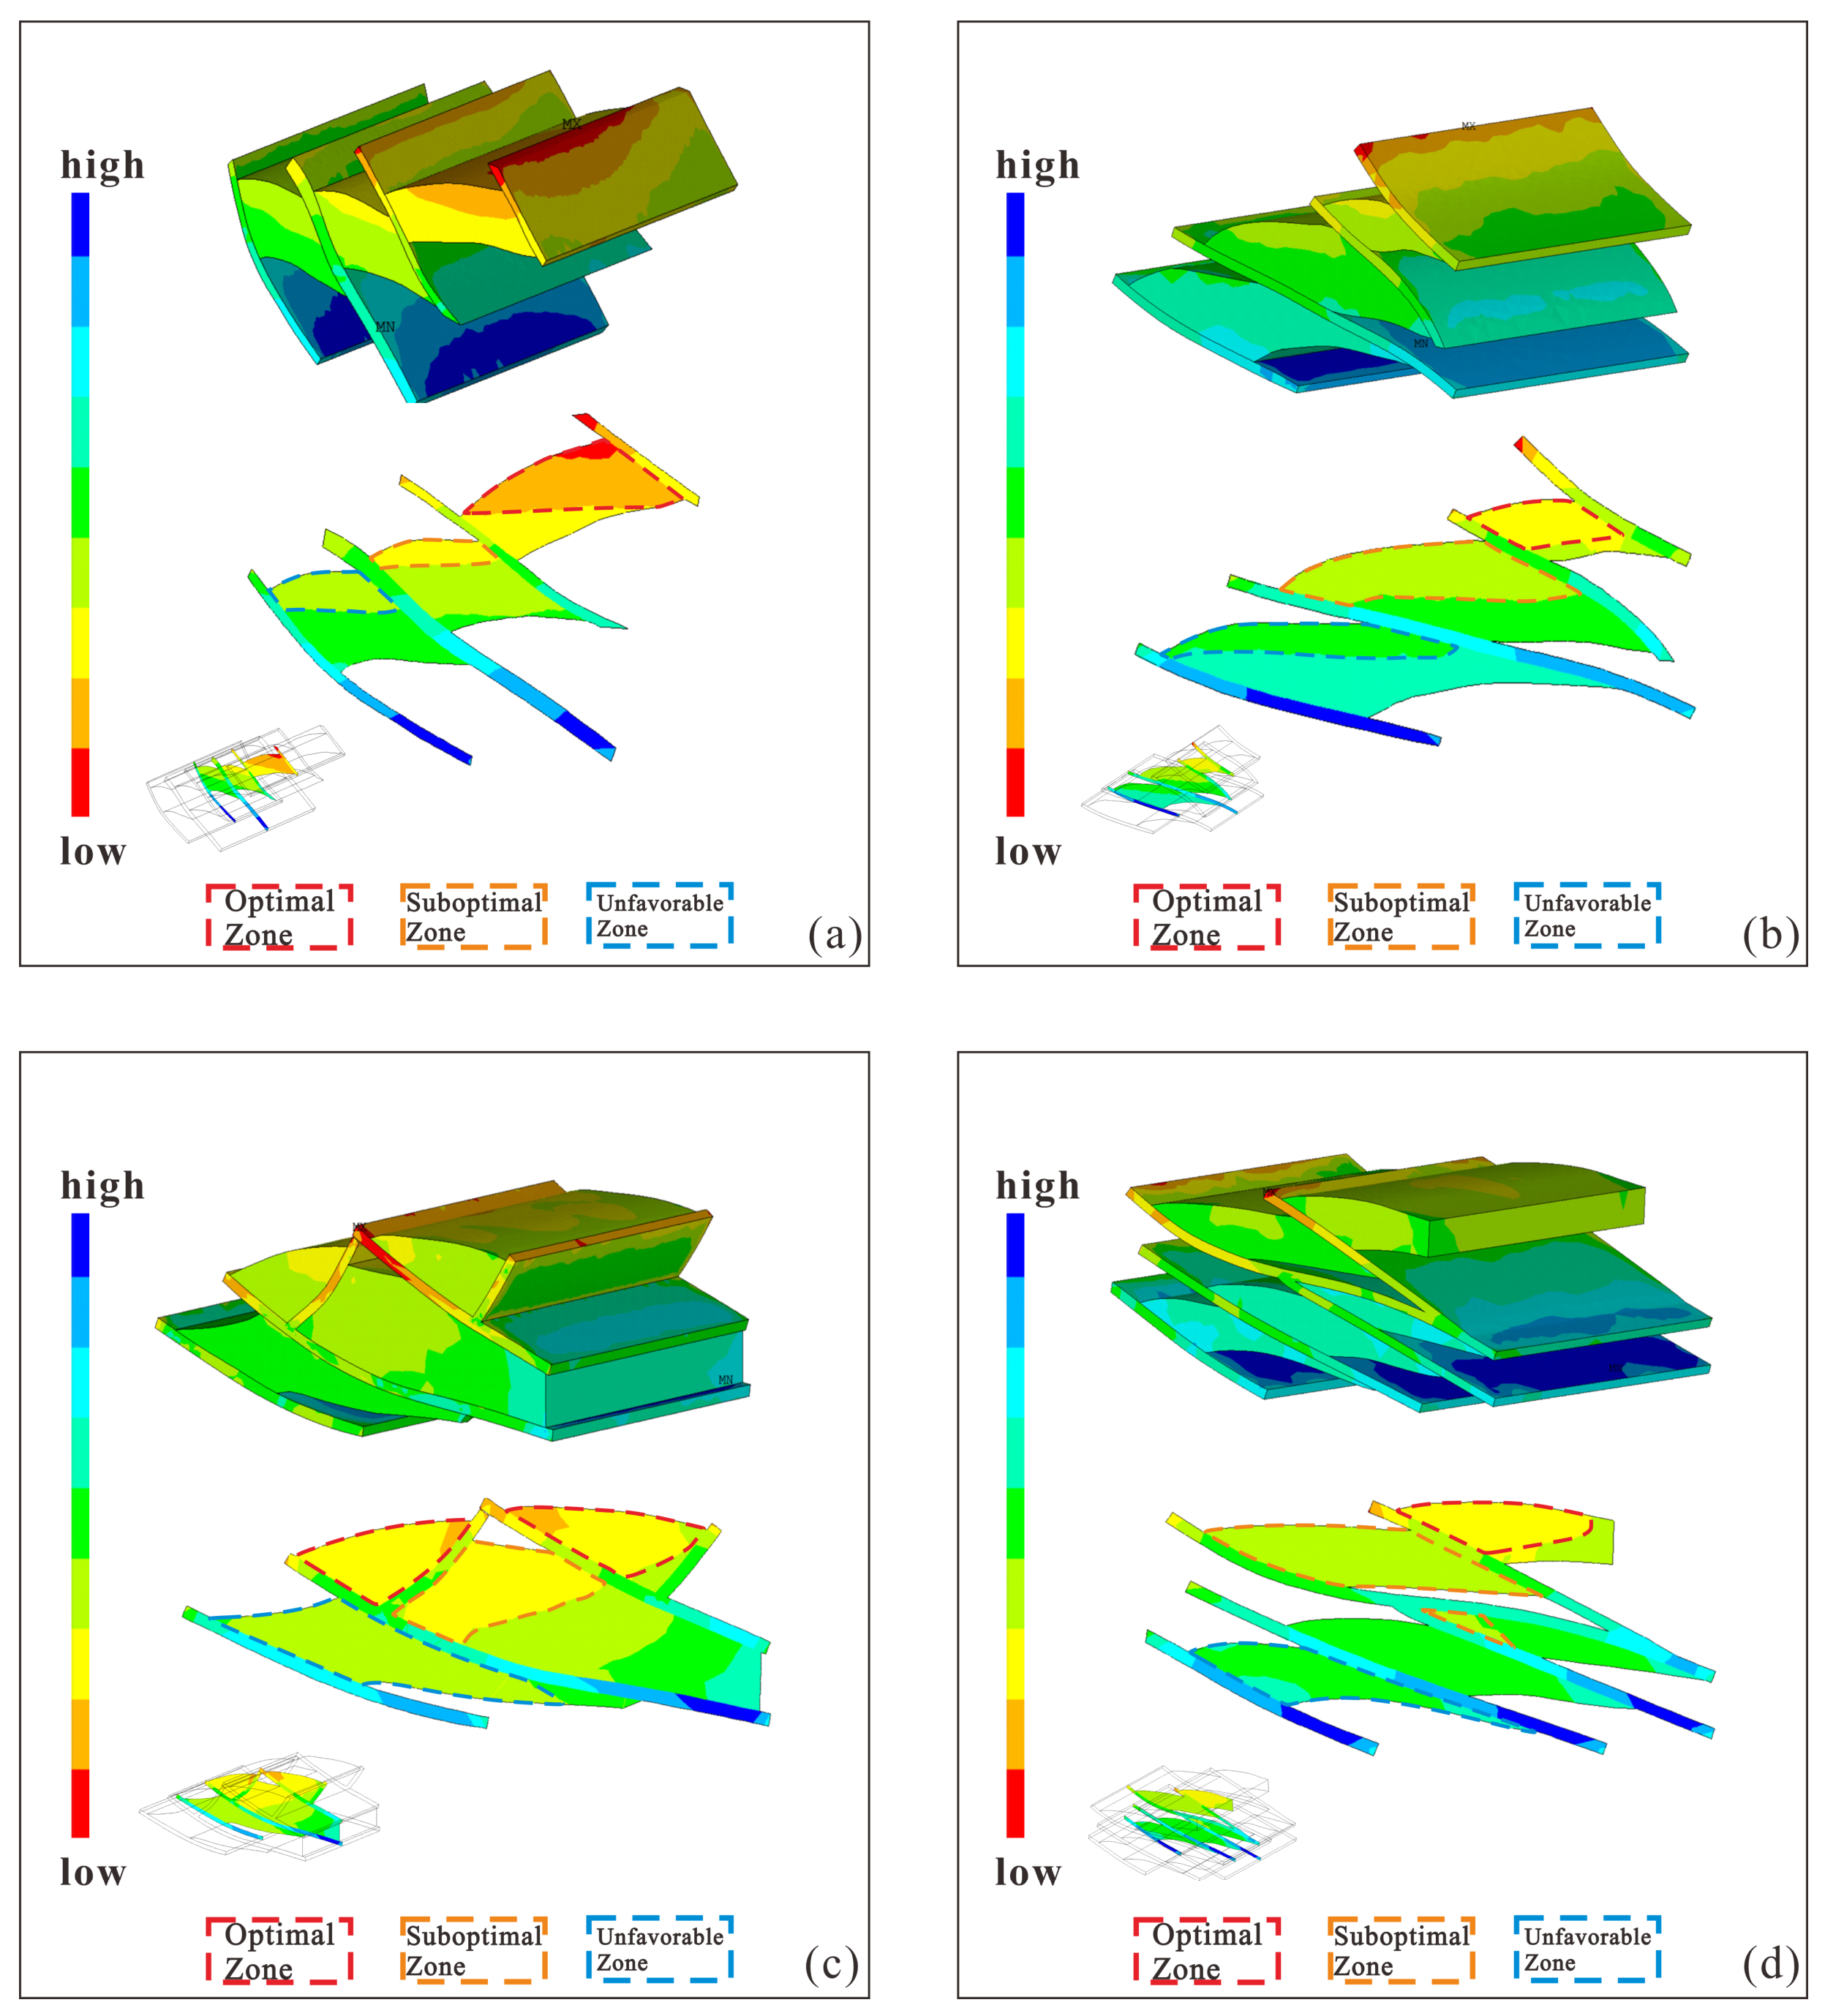
Controlled by two sets of thrust faults, structural triangle zone traps form a special wedge-shaped geological structure. Horizontal stress is imported into the interior of the wedge along the dip direction of the thrust faults. As the core area of “passive compression and contraction”, the wedge forms local abnormal high values under stress convergence, which is an unfavorable factor for reservoirs (Figure 9). Structural triangle zone traps are triangular structures bounded by main thrust faults, back-thrust faults and stratigraphic interfaces. The stress distribution is closely related to the shape of the triangle zone (normal triangle/inverted triangle) and the scale of fault development. Inverted triangle structural areas are mostly optimal low-stress zones, while normal triangle structural areas are mostly high-stress zones. Based on 3D seismic attributes, inverted triangle zones are characterized by upward-widening wedge geometries with anticlinal reflection configurations, low seismic discontinuity, and low curvature values, consistent with the modeled low-stress environment; whereas normal triangle zones exhibit downward-widening geometries with higher discontinuity and curvature, corresponding to high stress concentration. Specifically, synclinal triangle zones (Figure 9a) show an overall high stress level with minor low-stress patches; monoclinal (Figure 9b) exhibit a unidirectional stress gradient; anticlinal (Figure 9c) form broad low-stress cores; and modified anticlinal (Figure 9d) have reduced cores due to secondary fault cutting.
For fault-bend fold traps under the influence of weak tectonic compressive stress, the overall reservoir is in the stress–strain accumulation stage, with rock hardening and expansion, and no large-scale macroscopic fracture occurs, so the overall rock porosity is high; however, local stress accumulation may occur, reducing reservoir seepage capacity. Therefore, small-scale fractures and areas with low modulus and low stress are favorable zones (Figure 10). Fault-bend fold traps are formed when thrust faults slide along the weak interfaces of strata, causing the hanging wall strata to bend and fold. The optimal reservoir areas are mostly located on the hanging wall of the main thrust fault or in the anticline area sandwiched by thrust and back-thrust faults, while the unfavorable high-stress areas are concentrated on the footwall of the main thrust fault or in the syncline area compositely sandwiched by multiple faults. Among the subtypes, fault-bend anticlines (Figure 10a) form extensive low-stress cores; fault-bend monoclines (Figure 10b) retain only small crestal low-stress remnants; strike-slip modified (Figure 10c) show high-stress bands cutting the original core; and imbricate fault-bend anticlines (Figure 10d) display fragmented stress distribution.

5.3. Quantitative Reservoir Quality Evaluation Based on Tectonic Compressive Stress

To further clarify the influence of tectonic stress on reservoir quality, the action law of tectonic stress on different types of structural styles was quantitatively identified based on the original in situ stress field by decoupling depth (vertical stress).
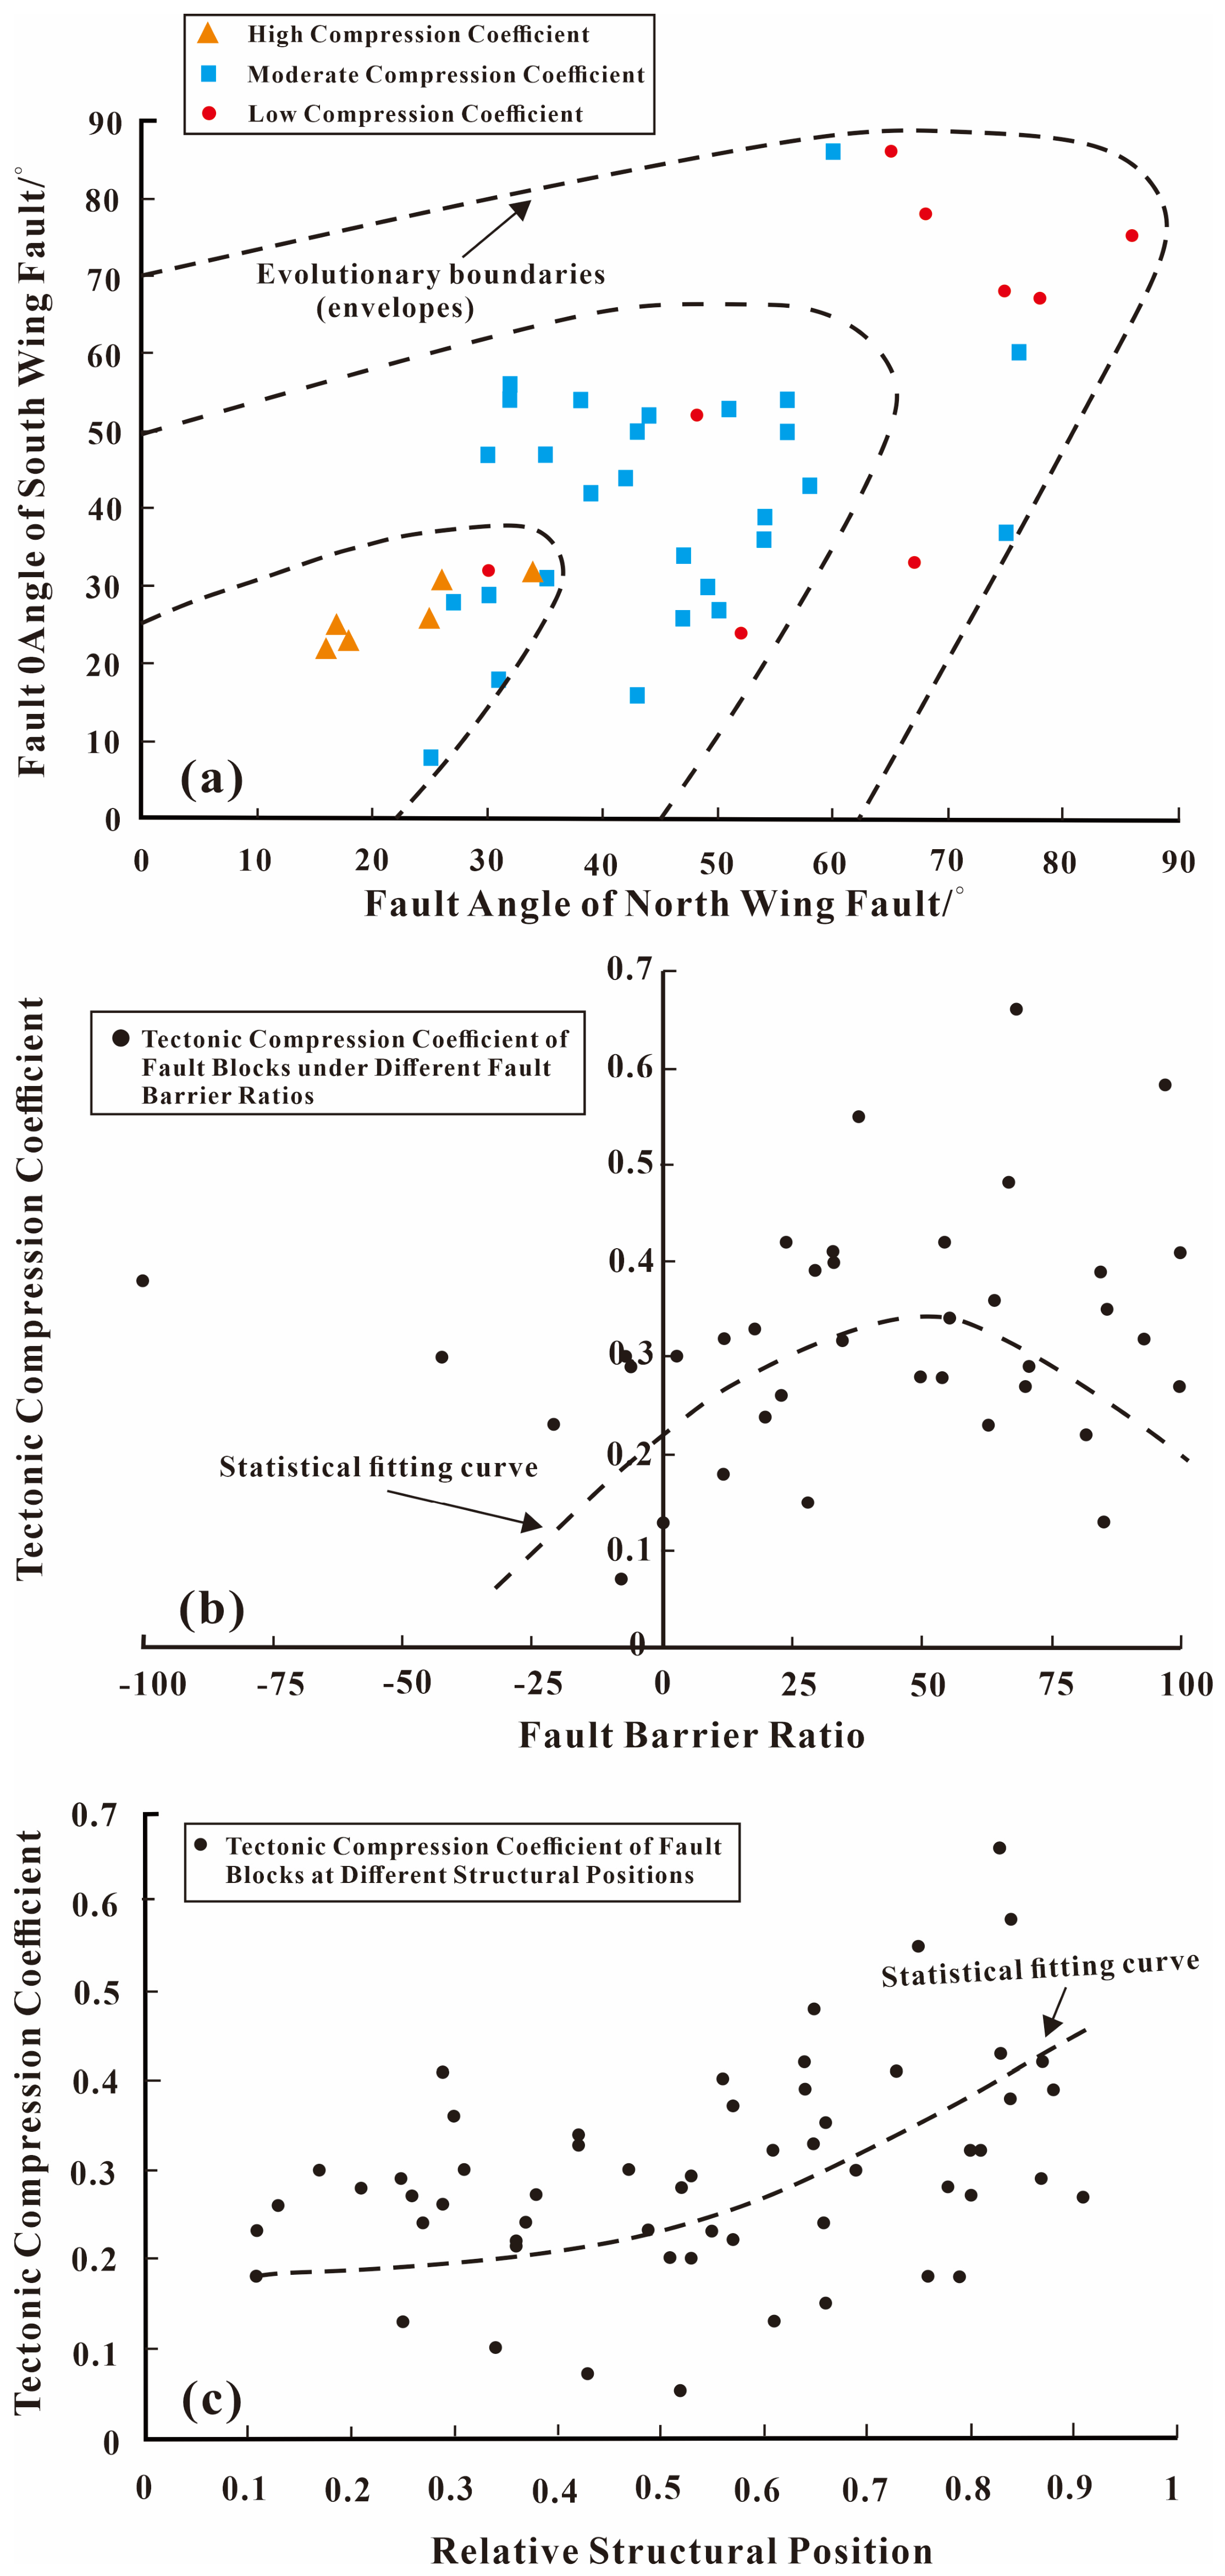
The angle between fault and tectonic stress, fault sealing ratio and fault-controlled position of different structural styles were quantitatively extracted, and the tectonic compression coefficients of different fault blocks were determined based on the minimum horizontal principal stress (Table 4). On this basis, a quantitative evaluation chart of geomechanical characteristics for different structural styles was further established (Figure 11). Although a formal sensitivity analysis was not performed, each parameter reflects a distinct aspect of structural deformation (e.g., fault sealing capacity versus fold geometry), and their simultaneous use reduces redundancy in classifying reservoir favorability.
Based on the finite element simulation data of reservoirs, a systematic analysis was conducted on 4 major categories and 16 subcategories of structural trap reservoirs in the study area, including pop-up structural traps, imbricate thrust traps, structural triangle zones and fault-bend fold traps. The results indicate that the reservoir quality in the study area presents a significant spatial zonation pattern, with obvious differences in reservoir favorability across different structural positions. The hanging wall of the front-row main thrust fault serves as the core Class I favorable zone for all types of reservoirs. This position acts as the optimal reservoir area in most subcategory reservoirs, featuring strong structural stability and well-developed reservoir spaces. Class II favorable zones are mostly concentrated on the footwall of the front-row main thrust fault. For some reservoirs of imbricate thrust and structural triangle zone types, their Class II favorable zones also cover transitional positions such as the footwall of back-thrust faults and the hanging wall of secondary thrust faults. The reservoir quality here falls between that of Class I favorable zones and unfavorable zones, bearing certain exploration potential. The distribution of unfavorable zones also shares common characteristics. The footwall of rear-row thrust faults is the main unfavorable area for various types of reservoirs. Positions including the footwall of back-thrust faults, syncline structures, low-position triangle zones and the footwall of detachment faults generally have poor reservoir quality and inferior reservoir conditions. Meanwhile, with the tectonic stress coefficient considered, fault blocks with weaker tectonic compression are prioritized. In summary, for the exploration and development of structural trap reservoirs in the study area, priority can be focused on Class I favorable zones such as the hanging wall of the front-row main thrust fault, and Class II favorable zones such as the footwall of the front-row main thrust fault can be regarded as potential exploration directions. Meanwhile, unfavorable zones such as the footwall of rear-row thrust faults, the footwall of back-thrust faults and low-position triangle zones should be avoided.

5.4. Main Controlling Factors of Reservoirs in the South Keshen Area

Based on the above analysis, the following findings are obtained:
Tensile zones and areas with low minimum horizontal principal stress provide basic conditions for fracture opening. In tensile structural areas or areas with low minimum horizontal principal stress, the closure pressure is relatively low, which is a critical prerequisite for effective fracture opening. Meanwhile, a low-stress environment can reduce the compressive damage of stress to reservoir rocks, prevent rock pores from being compacted, indirectly maintain the connectivity of primary pores and secondary fractures in the reservoir, and provide pathways for fluid seepage.
Favorable included angles and network fracture development patterns improve the effectiveness of reservoir stimulation. When the fracture strike forms a favorable included angle with the principal stress direction, a favorable fracture propagation mode can be established, avoiding fractures from being easily closed and hard to extend when parallel to the principal stress or being compacted and closed when perpendicular to it. Meanwhile, the development of network fractures facilitates the formation of an interconnected fracture network, which can not only effectively improve the overall permeability of the reservoir but also guide the directional propagation of fractures during artificial stimulation and expand the stimulated reservoir volume. It solves the problems of poor connectivity and limited seepage range of single fractures and significantly improves the reservoir development effect. In addition, the development of network fractures can also compensate for the defect that single fractures are prone to blockage and enhance the seepage stability of the reservoir.
Structures with small interlimb angles promote stress transmission and fracture development. The influence of structural morphology on reservoir fracture development in the South Keshen area is mainly reflected in the size of the structural interlimb angle. In areas with small structural interlimb angles, tectonic stress can be transmitted efficiently with relatively uniform distribution, and stress dissipation or local stress mutation is unlikely to occur. This uniform stress transmission environment can induce continuous and uniform deformation of rocks, thereby promoting the development of a large number of primary fractures and providing favorable conditions for the formation of secondary fractures. In contrast, in areas with large interlimb angles, stress tends to concentrate or dissipate at the limb tips, resulting in uneven fracture development, poor connectivity, and even compressive closure of fractures, which is unfavorable for reservoir stimulation.
Strong stress concentration will cause developed fractures to fail or close prematurely under compressive stress or shear stress. Stress concentration areas have a significant inhibitory effect on the opening and propagation of fractures, while areas with underdeveloped stress concentration in the South Keshen area serve as an important guarantee for high-quality reservoirs. Stress concentration easily leads to intense compression of local rocks, causing formed fractures to close and deform and even leading to healing of rock fracture surfaces and blocking of seepage channels. Meanwhile, stress concentration will also alter the regional stress field distribution and disrupt the continuity of fracture propagation, resulting in disordered fracture development and poor connectivity. In areas without obvious stress concentration, the stress distribution is gentle and uniform, which can not only prevent fractures from being closed by compression but also provide a favorable stress environment for the continuous development and stable opening of fractures, ensure the integrity and connectivity of the fracture network, and provide reliable support for fluid seepage in the reservoir.

6. Conclusions

The deep tight sandstone gas reservoirs in the South Keshen area were formed under the background of the Tianshan tectonic compression movement. Compared with conventional mid-shallow reservoirs, they have more complex geological characteristics and greater difficulty in reservoir quality evaluation and face significant challenges in geological cognition, reservoir analysis and evaluation, and optimization of stimulation methods, which directly affects the effect of oil and gas exploration and development.
The formation and distribution of favorable reservoirs are controlled by the coupling of multiple factors. Combined with geomechanical research and exploration practice, the core action mechanisms can be summarized as follows:
Compared with the exploration and development of mid-shallow and common sandstone strata, the tight sandstone reservoirs under the background of strong stress and high compaction in the South Keshen area face greater challenges in understanding geological characteristics, reservoir analysis and evaluation, and optimization of stimulation methods, which affects the effect of oil and gas exploration and development.
Through geomechanical research on the deep Cretaceous Bashijiqike Formation in the South Keshen area, it is found that the tight sandstone strata of the Bashijiqike Formation have high in situ stress and rock mechanical parameters. After removing the influences of depth and stratum, the Young’s modulus and uniaxial compressive strength of the South Keshen area are only lower than those of the Northern Tectonic Belt with obvious hardening phenomenon and significantly higher than those of the southern Zhongqiu block.
For the tight reservoirs of the Bashijiqike Formation, the permeability of fracture-developed sections is generally high, and fracture-pore reservoirs are the main seepage channels for oil and gas. Medium-high angle fractures are prone to forming fracture network structures after stimulation, which can significantly improve the overall seepage capacity of the reservoir and are the main controlling factor for increasing production of tight sandstone gas.
Under the background of strong compression tectonics, there are differences in the stress deformation and fracture stages of sandstone and mudstone in the Bashijiqike Formation reservoirs of South Keshen, leading to the special phenomenon of coexistence of fractures and stress concentration. Under the action of stress concentration, local high pressure or high shear will cause natural fractures to close and slip, which reduces the permeability of fractures and then makes them lose the function of seepage channels.
The relationship between the in situ stress direction and fracture strike affects the difficulty of fracture stimulation. When stress and fractures are in a parallel state, fractures tend to form parallel open fractures. Such fractures have insufficient shear stress, and shear fracture and bifurcation are difficult to occur at their tips. Meanwhile, existing fractures form stress shadows around them, which inhibits the initiation of subsequent fractures at adjacent positions, making it difficult to form complex fracture networks. Limited fracture connectivity results in low well productivity.
In summary, the formation and distribution of favorable reservoirs in the South Keshen area are the result of the synergistic action of multiple links: tectonic background controls in situ stress and rock mechanical characteristics, fracture development determines the seepage foundation, the matching relationship between in situ stress and fractures regulates the stimulation effect, and geology-engineering integration ensures effective production. This understanding not only provides theoretical support for the efficient exploration and development of tight sandstone gas reservoirs in the South Keshen area but also provides a reference for the evaluation of favorable reservoirs of similar deep tight oil and gas reservoirs.

Author Contributions

Conceptualization, K.X. and H.Z.; Methodology, W.J.; Software, W.J., Y.H., P.Z. and Z.Z.; Validation, J.Z. and H.Z.; Formal Analysis, W.J. and Y.H.; Investigation, Y.H. and Y.Q.; Resources, H.Z. and Y.Q.; Data Curation, W.N. and Q.C.; Writing—Original Draft Preparation, K.X., Y.H., W.J., P.Z., W.N. and J.Z.; Writing—Review and Editing, H.Z.; Visualization, Q.C., Z.Z., W.N. and Y.Q.; Supervision, H.Z.; Funding Acquisition, K.X. All authors have read and agreed to the published version of the manuscript.

Funding

This research was funded by the National Science and Technology Major Project for New Oil and Gas Exploration and Development “Accumulation Mechanism and Resource Potential Evaluation of Large Hydrocarbon Provinces in the Tarim Basin” (2025ZD1400502) and the Scientific Research Project of Tarim Oilfield Company Research Center “Exploration Geomechanics Technology Research and Application” (YF202505). And the APC was funded by Tarim Oilfield Company.

Data Availability Statement

The original contributions presented in this study are included in the article. Further inquiries can be directed to the corresponding author.

Conflicts of Interest

Author Ke Xu, Yixiong Hu, Hui Zhang, Penglin Zheng, Jiajun Zhang, Zhongwei Zhang, Qiuyu Chen and Yuanhang Qi are affiliated with PetroChina Tarim Oilfield Company. The remaining authors declare that the research was conducted in the absence of any commercial or financial relationships that could be construed as a potential conflict of interest.

References

  1. Zou, C.; Zhu, R.; Liu, K.; Su, L.; Bai, B.; Zhang, X.; Yuan, X.; Wang, J. Tight gas sandstone reservoirs in China: Characteristics and recognition criteria. J. Pet. Sci. Eng. 2012, 88, 82–91. [Google Scholar] [CrossRef] [Scilit]
  2. He, D.; Jia, C.; Zhao, W.; Xu, F.; Luo, X.; Liu, W.; Tang, Y.; Gao, S.; Zheng, X.; Li, D.; et al. Research progress and key issues of ultra-deep oil and gas exploration in China. Pet. Explor. Dev. 2023, 50, 1333–1344. [Google Scholar] [CrossRef] [Scilit]
  3. Xu, K.; Zhang, H.; Ning, W.; Liang, J.; Qiang, J.; Wang, X.; Zheng, P.; Qian, Z.; Zhang, Y.; Yuan, F. Geomechanical parameter-driven evaluation of ultra-deep reservoirs: An integrated methodology and its application to the Kuqa Depression, Tarim Basin. Energy Geosci. 2025, 6, 100433. [Google Scholar] [CrossRef] [Scilit]
  4. Wang, Q.; Yang, H.; Yang, W. New progress and future exploration targets in petroleum geological research of ultra-deep clastic rocks in Kuqa Depression, Tarim Basin, NW China. Pet. Explor. Dev. 2025, 52, 79–94. [Google Scholar] [CrossRef] [Scilit]
  5. Song, W.; Xu, Z.; Xu, H.; Wang, L.; Wang, Y. Integrated lithofacies, diagenesis, and fracture control on reservoir quality in ultra-deep tight sandstones: A case from the Bashijiqike Formation, Kuqa Depression. Energies 2025, 18, 5067. [Google Scholar] [CrossRef] [Scilit]
  6. Yang, P.; Song, Y.; Liu, K.; Wang, S.; Wei, X.; Liu, J. Hydrocarbon charge history of deeply buried clastic reservoirs in the Bozi area of the Kuqa Depression, western China: Implications for deep and ultra-deep petroleum exploration. Front. Earth Sci. 2024, 12, 1475316. [Google Scholar] [CrossRef] [Scilit]
  7. Liu, Z.; Song, X.; Fu, X.; Luo, X.; Wang, H. Energy production potential of ultra-deep reservoirs in Keshen Gas Field, Tarim Basin: From the perspective of prediction of effective reservoir rocks. Energies 2025, 18, 2913. [Google Scholar] [CrossRef] [Scilit]
  8. Xu, X.; Zeng, L.; Dong, S.; Diwu, P.; Li, H.; Liu, J.; Han, G.; Xu, H.; Ji, C. Fracture effectiveness and its influence on gas productivity in ultra-deep tight sandstone reservoirs of the Keshen Gas Field, Tarim Basin. Acta Geol. Sin.-Engl. Ed. 2024, 98, 1557–1573. [Google Scholar] [CrossRef] [Scilit]
  9. Peng, J.; Yang, Z.; Liu, J.; Feng, J.; Ren, D.; Gao, Y.; Zhang, Z.; Huang, R. Effectiveness evaluation on network fracturing in ultra-deep and extremely thick reservoirs in Kuqa Piedmont—A case study of Well KS2-A. ACS Omega 2025, 10, 8182–8189. [Google Scholar] [CrossRef] [Scilit]
  10. Zhou, L.; Zheng, X.; Lou, H.; Tang, M.; Wang, J.; Hu, F.; Sun, X.; Qiu, H. Characteristics of stress zonation in the Bashijiqike Formation and control factors on reservoir development (Kelasu Structural Belt, Kuqa Depression, North-Western China). Geosciences 2026, 16, 329. [Google Scholar] [CrossRef] [Scilit]
  11. Mei, Y.; Zhang, J.; Neng, Y.; Wang, W.; Xu, K.; Xiang, H.; Wu, Y.; Liu, P. Tectonic control on ultra-deep sub-salt trap architecture: Insights from multi-detachment modeling and physical simulations in the Kuqa Foreland Thrust Belt. Geosciences 2026, 16, 197. [Google Scholar] [CrossRef] [Scilit]
  12. Ju, W.; Zhong, Y.; Liang, Y.; Gong, L.; Yin, S.; Huang, P. Factors influencing fault-propagation folding in the Kuqa Depression: Insights from geomechanical models. J. Struct. Geol. 2023, 168, 104826. [Google Scholar] [CrossRef] [Scilit]
  13. Wang, Z.; Lv, X.; Wang, S.; Li, Y.; Li, R. Fracture systems and petrophysical properties of tight sandstone undergoing regional folding: A case study of the Cretaceous reservoirs in the Kuqa foreland thrust belt, Tarim Basin. Mar. Pet. Geol. 2019, 112, 104055. [Google Scholar] [CrossRef] [Scilit]
  14. Xu, X.T.; Zeng, L.B.; Dong, S.Q.; Li, H.M.; Liu, J.Z.; Ji, C.Q. The characteristics and controlling factors of high-quality reservoirs of ultra-deep tight sandstone: A case study of the Dabei Gas Field, Tarim Basin, China. Pet. Sci. 2025, 22, 3473–3496. [Google Scholar] [CrossRef] [Scilit]
  15. Zeng, L.; Wang, H.; Gong, L.; Liu, B. Impacts of the tectonic stress field on natural gas migration and accumulation: A case study of the Kuqa Depression in the Tarim Basin, China. Mar. Pet. Geol. 2010, 27, 1616–1627. [Google Scholar] [CrossRef] [Scilit]
  16. Liu, G.; Zeng, L.; Zhu, R.; Gong, L.; Ostadhassan, M.; Mao, Z. Effective fractures and their contribution to the reservoirs in deep tight sandstones in the Kuqa Depression, Tarim Basin, China. Mar. Pet. Geol. 2021, 124, 104729. [Google Scholar] [CrossRef] [Scilit]
  17. Yang, H.; Wang, C.; Yang, X.; Zhang, Z.; Guo, X.; Sun, C.; Lyu, X.; Liu, J. Technological progress and scientific significance of the drilling of the ten-thousand-meter ultra-deep well TK1, Tarim Basin, NW China. Pet. Explor. Dev. 2025, 52, 1329–1339. [Google Scholar] [CrossRef] [Scilit]
  18. Li, S.; Wang, X.; Suppe, J. Compressional salt tectonics and synkinematic strata of the western Kuqa foreland basin, southern Tian Shan, China. Basin Res. 2012, 24, 475–497. [Google Scholar] [CrossRef] [Scilit]
  19. Xu, K.; Yang, H.; Zhang, H. Fracture effectiveness evaluation in ultra-deep reservoirs based on geomechanical method, Kuqa Depression, Tarim Basin, NW China. J. Pet. Sci. Eng. 2022, 215, 110604. [Google Scholar] [CrossRef] [Scilit]
  20. Wang, R.; Gang, W.; Huang, Z.; Guo, X.; Pan, Y.; Zhao, L.; Mo, T. The sources of diagenetic fluids and diagenetic evolution model in deep-to-ultra-deep tight sandstone reservoirs: A case study from Bashijiqike Formation, Kelasu Belt, Kuqa Depression, Tarim Basin, NW China. Geol. J. 2026, 61, 2746–2769. [Google Scholar] [CrossRef] [Scilit]
  21. Gao, Z.; Yin, H.; Wu, C.; Chen, W.; Zhao, J.; He, W.; Wang, W. Growth of thrust-faults in fold-and-thrust belts: An example from the Kelasu structural belt of the Kuqa Depression, Tarim Basin, NW China. J. Asian Earth Sci. 2026, 295, 106870. [Google Scholar] [CrossRef] [Scilit]
  22. Neng, Y.; Xie, H.; Yin, H.; Li, Y.; Wang, W. Effect of basement structure and salt tectonics on deformation styles along strike: An example from the Kuqa fold–thrust belt, West China. Tectonophysics 2018, 730, 114–131. [Google Scholar] [CrossRef] [Scilit]
  23. Tang, L.J.; Jia, C.Z.; Jin, Z.J.; Chen, S.P.; Pi, X.J.; Xie, H.W. Salt tectonic evolution and hydrocarbon accumulation of Kuqa foreland fold belt, Tarim Basin, NW China. J. Pet. Sci. Eng. 2004, 41, 97–108. [Google Scholar] [CrossRef] [Scilit]
  24. Dai, L.; Ren, X.; Zhang, C.; Qu, Y.; Song, B.; Wang, X.; Tian, W. Multi-scale characterization and modeling of natural fractures in ultra-deep tight sandstone reservoirs: A case study of Bozi-1 gas reservoir in Kuqa Depression. Processes 2025, 13, 4080. [Google Scholar] [CrossRef] [Scilit]
  25. Liu, Z.; Zhang, Y.; Zhang, Y.; Zhao, L.; Peng, P.; Liu, H.; Chang, B.; Huang, W.; Zhou, P. Influencing factor analysis on the fractured tight sandstone gas reservoir characteristics: A case study of Bozi 3 gas reservoir in the Tarim Basin. Front. Earth Sci. 2022, 10, 881934. [Google Scholar] [CrossRef] [Scilit]
  26. Byerlee, J.; Mjachkin, V.; Summers, R.; Voevoda, O. Structures developed in fault gouge during stable sliding and stick-slip. Tectonophysics 1978, 44, 161–171. [Google Scholar] [CrossRef] [Scilit]
  27. Khair, H.A.; Cooke, D.; Hand, M. The effect of present day in situ stresses and paleo-stresses on locating sweet spots in unconventional reservoirs, a case study from Moomba-Big Lake fields, Cooper Basin, South Australia. J. Pet. Explor. Prod. Technol. 2013, 3, 207–221. [Google Scholar] [CrossRef] [Scilit]
  28. Zoback, M.D.; Barton, C.A.; Brudy, M.; Castillo, D.A.; Finkbeiner, T.; Grollimund, B.R.; Moos, D.B.; Peska, P.; Ward, C.D.; Wiprut, D.J. Determination of stress orientation and magnitude in deep wells. Int. J. Rock Mech. Min. Sci. 2003, 40, 1049–1076. [Google Scholar] [CrossRef] [Scilit]
  29. Chang, C.; Zoback, M.D.; Khaksar, A. Empirical relations between rock strength and physical properties in sedimentary rocks. J. Pet. Sci. Eng. 2006, 51, 223–237. [Google Scholar] [CrossRef] [Scilit]
  30. Xu, K.; Zhang, H.; Dong, R.; Ju, W.; Xie, Y.; Cui, D.; Fang, L.; Yuan, F.; Lai, S.; Liang, J.; et al. In situ stress distribution in Cretaceous ultra-deep gas field from 1D mechanical earth model and 3D heterogeneous geomechanical model, Kuqa Depression, Tarim Basin, NW China. Front. Earth Sci. 2022, 10, 937393. [Google Scholar] [CrossRef] [Scilit]
  31. Lai, J.; Li, D.; Bai, T.; Zhao, F.; Ai, Y.; Liu, H.; Cai, D.; Wang, G.; Chen, K.; Xie, Y. Reservoir quality evaluation and prediction in ultra-deep tight sandstones in the Kuqa Depression, China. J. Struct. Geol. 2023, 170, 104850. [Google Scholar] [CrossRef] [Scilit]
  32. Weng, X.; Kresse, O.; Cohen, C.; Wu, R.; Gu, H. Modeling of hydraulic-fracture-network propagation in a naturally fractured formation. SPE Prod. Oper. 2011, 26, 368–380. [Google Scholar] [CrossRef] [Scilit]
  33. Wang, Z.; Xu, K.; Zhang, H.; Wang, H.; Yin, G.; Wang, Z.; Zhao, W. Fracture effectiveness evaluation of ultra-deep tight sandstone reservoirs: A case study of the Keshen Gas Field, Tarim Basin, West China. Front. Earth Sci. 2022, 10, 883479. [Google Scholar] [CrossRef] [Scilit]
  34. Zhang, S.; Ji, Y.; Zhu, H.; Wang, Q.; He, Z.; Hofmann, H.; Jing, X. Stress dependence of rock fracture permeability: A comprehensive review of laboratory data and implications for hydraulic stimulation. Int. J. Coal Sci. Technol. 2026, 13, 61. [Google Scholar] [CrossRef] [Scilit]
  35. Obradors-Prats, J.; Rouainia, M.; Aplin, A.C.; Crook, A.J.L. Hydro-mechanical modelling of stress, pore pressure and porosity evolution in fold-and-thrust belt systems. J. Geophys. Res. Solid Earth 2017, 122, 9383–9403. [Google Scholar] [CrossRef] [Scilit]
  36. Wang, W.; Yin, H.; Jia, D.; Li, C. A sub-salt structural model of the Kelasu structure in the Kuqa foreland basin, northwest China. Mar. Pet. Geol. 2017, 88, 115–126. [Google Scholar] [CrossRef] [Scilit]
  37. Suppe, J. Geometry and kinematics of fault-bend folding. Am. J. Sci. 1983, 283, 684–721. [Google Scholar] [CrossRef] [Scilit]
  38. Yang, K.; Xu, L.; Qi, J.; He, P.; Du, J.; Sun, T. Structural deformation of the northern monocline belt in the Kuqa Depression and implications for the Cenozoic uplift history of the South Tianshan Mountains. Tectonophysics 2023, 857, 229840. [Google Scholar] [CrossRef] [Scilit]
  39. Wang, R.; Zhang, C.; Chen, D.; Yang, F.; Li, H.; Li, M. Microscopic seepage mechanism of gas and water in ultra-deep fractured sandstone gas reservoirs of low porosity: A case study of Keshen Gas Field in Kuqa Depression of Tarim Basin, China. Front. Earth Sci. 2022, 10, 893701. [Google Scholar] [CrossRef] [Scilit]
  40. Lai, J.; Wang, G.; Chai, Y.; Xin, Y.; Wu, Q.; Zhang, X.; Sun, Y. Deep burial diagenesis and reservoir quality evolution of high-temperature, high-pressure sandstones: Examples from Lower Cretaceous Bashijiqike Formation in Keshen area, Kuqa Depression, Tarim Basin of China. AAPG Bull. 2017, 101, 829–862. [Google Scholar] [CrossRef] [Scilit]
  41. Zhang, H.; Zhang, R.; Yang, H.; Shou, J.; Wang, J.; Liu, C.; Chen, G. Characterization and evaluation of ultra-deep fracture-pore tight sandstone reservoirs: A case study of Cretaceous Bashijiqike Formation in Kelasu tectonic zone in Kuqa foreland basin, Tarim, NW China. Pet. Explor. Dev. 2014, 41, 158–167. [Google Scholar] [CrossRef] [Scilit]
  42. Liu, C.; Zhang, R.; Zhang, H.; Wang, J.; Mo, T.; Wang, K.; Zhou, L. Genesis and reservoir significance of multi-scale natural fractures in Kuqa foreland thrust belt, Tarim Basin, NW China. Pet. Explor. Dev. 2017, 44, 463–472. [Google Scholar] [CrossRef] [Scilit]
Figure 1. Distribution map of the Kelasu tectonic belt. (a) Tectonic divisions of Tarim Basin; (b) Tectonic divisions of Kuqa Depression; (c) The lithology of Lower Cretaceous Bashijiqike Formation and Paleogene Kumugeliemu Group within Kuqa Depression.
Geosciences 16 00376 g001
Figure 2. Prediction results of Young’s modulus and Poisson’s ratio. (a)—Young’s modulus model; (c)—Young’s modulus profile from point A to point B; (e)—Young’s modulus profile from point C to point D; (b)—Poisson’s ratio; (d)—Poisson’s ratio profile from point A to point B; (f)—Poisson’s ratio profile from point C to point D.
Geosciences 16 00376 g002
Figure 3. Prediction results of maximum and minimum horizontal principal stresses. (a)—Maximum horizontal principal stress model; (c)—maximum horizontal principal profile from point A to point B; (e)—maximum horizontal principal profile from point C to point D; (b)—minimum horizontal principal stress model; (d)—minimum horizontal profile from point A to point B; (f)—minimum horizontal profile from point C to point D.
Geosciences 16 00376 g003
Figure 4. Prediction results of stress concentration and horizontal stress difference. (a)—Horizontal stress difference model; (c)—horizontal stress difference profile from point A to point B; (e)—horizontal stress difference profile from point C to point D; (b)—stress concentration model; (d)—stress concentration profile from point A to point B; (f)—stress concentration profile from point C to point D.
Geosciences 16 00376 g004
Figure 5. Prediction results of fracture activity. (a)—Tensile fracture activity model; (b)—shear fracture activity model.
Geosciences 16 00376 g005
Figure 6. Photomicrographs of thin sections in the Keshen area.
Geosciences 16 00376 g006
Figure 7. Geomechanical characteristics of the pop-up structure trap. (a)—Coaxial pop-up structure simulation; (b)—adjusted coaxial pop-up structure simulation; (c)—non-coaxial pop-up structure simulation; (d)—adjusted non-coaxial pop-up structure simulation.
Geosciences 16 00376 g007
Figure 8. Geomechanical characteristics of the imbricate thrust structure trap. (a)—Imbricate fault-anticline structure simulation; (b)—ramp-flat imbricate structure simulation; (c)—pop-up modified imbricate structure simulation; (d)—multilayer stacked imbricate structure simulation.
Geosciences 16 00376 g008
Figure 9. Geomechanical characteristics of the structural triangle zone trap. (a)—Syncline triangle zone structure simulation; (b)—monocline triangle zone structure simulation; (c)—anticline triangle zone structure simulation; (d)—modified anticline triangle zone structure simulation.
Geosciences 16 00376 g009
Figure 10. Geomechanical characteristics of the fault-bend fold trap. (a)—Fault-bend anticline structure simulation; (b)—fault-bend monocline structure simulation; (c)—strike-slip modified fault-bend anticline structure simulation; (d)—imbricate fault-bend anticline structure simulation.
Geosciences 16 00376 g010
Figure 11. Reservoir quality evaluation chart of the Kelasu tectonic belt. (The dashed lines represent statistical fitting curves (or evolutionary envelopes) illustrating the macroscopic trends between structural parameters and reservoir quality. Specifically, they delineate the development domains under different compression coefficients in (a), the non-linear parabolic relationship in (b), and the positive correlation trend in (c)). (a)—Quantitative chart of force-fault angle vs. reservoir quality; (b)—quantitative chart of fault shielding ratio vs. reservoir quality; (c)—quantitative chart of structural position vs. reservoir quality.
Geosciences 16 00376 g011
Table 1. Error percentage and average coincidence rate of horizontal stress in blind wells.
Well No.Maximum Horizontal Principal Stress (Error, %)Minimum Horizontal Principal Stress (Error, %)Average Matching Rate
A17.16%6.44%91.93%
A27.21%9.32%
A39.44%7.51%
A47.72%7.49%
A58.79%9.67%
Table 2. Tectonic deformation timing of each structural belt in the Kuqa Depression.
Belt PositionBelt NameInitial Deformation Time (Ma)
1st BeltNorthern Monocline Belt23.3
2nd BeltKelasu Structural Belt16.9
3rd BeltQiulitage Structural Belt3.6
4th BeltYaqi Anticline Belt1.87
Table 3. Rock mechanical parameters of each structural belt in the Kuqa Depression.
Well No.Depth/mElastic Modulus/GPaUniaxial Compressive Strength/MPa
Dibei66092–660232.0105.5
Dibei 55827–624830.699.5
Ditan25034–592028.595.5
Dibei 5015849–647731.597.6
Dibei 104-H14946–602229.999.7
Kes206795–680032.698.7
Kes 197920–792731.9112.3
Kes 19018047–805637.5112.3
Kes 187583–758933.1109.9
Kes 207752–775732.698.7
Kes 318009–801435.4115.2
Kes 31017915–792534.3110.6
Kes 31028113–811836.2120.3
Kes 31038116–812635.6112.8
Zhongqiu16159–616419.258.9
Zhongqiu 26357–636521.671.3
Zhongqiu2016855–686121.561.5
Table 4. Relationship between tectonic compression coefficient and quantitative structural parameters.
Structural StyleFault Block No.Tectonic Compression CoefficientFault Angle of North Wing Fault Force/°Fault Angle of South Wing Fault Force/°Fault Barrier RatioTransverse Position of Fault Block
Pop-up Structure Trap10.2854/0.50.78
20.285654/0.52
30.3/56−0.420.17
40.4116220.330.73
50.3243160.930.61
Imbricate Thrust Trap10.3244520.350.81
20.2942440.710.53
30.2639420.230.29
40.4818230.670.65
50.3331180.180.42
Fault-bend Fold Trap10.392580.8460.88
20.2/25/0.53
30.4216/0.54560.64
40.297537/0.87
50.3/750.0260.47
Structural Triangle Zone Trap10.6634320.6830.83
20.335436/0.65
30.3638540.6420.3
40.4386//0.83
50.376086/0.57
Disclaimer/Publisher’s Note: The statements, opinions and data contained in all publications are solely those of the individual author(s) and contributor(s) and not of MDPI and/or the editor(s). MDPI and/or the editor(s) disclaim responsibility for any injury to people or property resulting from any ideas, methods, instructions or products referred to in the content.