Article

Hydrocarbon Generation and Pore Evolution of Marine Shale from the Longmaxi Formation, NE Sichuan Basin, China
1
School of Geosciences and Technology, Southwest Petroleum University, Chengdu 610500, China
2
Sichuan Shale Gas Resources and Environment Innovation and Synergy Center, Chengdu 610500, China
3
Chongqing Shale Gas Exploration and Development Co., Ltd., Chongqing 401147, China
*
Author to whom correspondence should be addressed.
Geosciences 2026, 16(4), 163; https://doi.org/10.3390/geosciences16040163
Submission received: 5 March 2026 / Revised: 2 April 2026 / Accepted: 15 April 2026 / Published: 20 April 2026

Abstract

The marine shale of the Longmaxi Formation is the main layer for shale gas exploration and development in the Sichuan Basin. That said, the pore structure in the Longmaxi shale is strongly heterogeneous, and how these pores form and are preserved remains unclear—which limits our understanding of what makes a good reservoir and holds back efficient shale gas development. To investigate the coupling relationship between hydrocarbon generation and pore evolution in marine shale, medium-maturity shale from the Longmaxi Formation in NE Sichuan was collected for thermal maturation experiments. Shale samples and pyrolysis products from different evolutionary stages were obtained for a series of analyses, including gas composition and pore structure. The influence of organic hydrocarbon generation and inorganic diagenesis on the development of shale nanopores was revealed, and a pore evolution model for marine shale was established. The results show the following: (1) The hydrocarbon generation process of medium-maturity marine shale consists of three stages. The maximum methane yield is 362.58 mL/g. (2) As the thermal maturity increases, the quartz content shows a gradual increase, while the content of clay minerals, feldspar, and carbonate minerals decreases. (3) As the thermal maturity increases, pore evolution is observed in four stages: “slow decrease,” “rapid increase,” “relatively stable,” and “slow decrease.” The first stage is characterized by pore reduction dominated by intense compaction. The second stage is dominated by pore expansion driven by mineral transformation and dissolution. The third stage is the pore preservation stage, during which continuous natural gas generation occurs. The fourth stage is characterized by pore reduction, mainly driven by weak compaction. This study has enriched the theoretical understanding of the dynamic evolution of shale pores, providing a theoretical basis for the research on the formation and enrichment mechanism of shale gas and the exploration practice of shale gas reservoirs.

1. Introduction

As the geological understanding and engineering practices of shallow to medium buried marine shales in the Wufeng-Longmaxi Formation of the Sichuan Basin mature, the primary focus of shale gas research in China is shifting towards deeply buried marine shales [1,2]. In recent years, PetroChina has achieved industrial breakthroughs in areas such as Zigong, Western Chongqing, Luzhou, and Jiaoshiba in the Sichuan Basin, demonstrating the promising exploration and development potential of deep shale gas [1,3]. Nanometer-scale reservoir spaces are not only the primary reservoir for natural gas, but the connectivity of their network also directly influences the recovery rate of individual wells [4,5]. Therefore, the development degree and scale of nanopores are crucial for achieving high production in shale gas [6,7]. However, during its formation, China’s deep marine shale reservoirs underwent complex processes of sedimentary burial, diagenetic evolution, hydrocarbon generation, and structural modifications. The shale reservoirs exhibit diverse pore morphologies and strong heterogeneity in their micro-pore structures. These characteristics present significant challenges in evaluating shale reservoir properties and limit the large-scale development of shale gas [8,9,10]. The pore evolution of shale reservoirs is a complex physical–chemical process, governed by the combined effects of organic diagenesis, inorganic diagenesis, and the thermal evolution of organic matter. The differences in controlling factors across various evolutionary stages contribute to the complexity of the pore structure in marine shale [11,12,13]. Investigating the coupling relationship between hydrocarbon generation, diagenesis, and the evolution of nanopores is crucial for understanding the development of deep marine shale reservoirs and the mechanism of shale gas accumulation, and improving recovery rates in wells [14,15,16,17,18].
Currently, research methods for studying pore dynamics evolution can be classified into two categories. The first category involves direct observation, where high-resolution equipment is used to test shale samples at different maturities or diagenetic stages. After analyzing the differences in diagenetic features and pore development, the relationships between these factors are discussed [13,19]. However, this method overlooks the variations in sample composition caused by depositional environments and other geological forces. Additionally, these studies focus solely on organic pores, and the results vary significantly among different researchers [20]. The second category of research methods is artificial maturation, which involves using low-maturity shale samples for laboratory experiments. Based on geological evolution processes, hydrocarbon generation is induced by setting specific temperature and pressure sequences, and pore parameters are quantitatively analyzed at different maturation stages. This method reduces errors caused by sample variations to some extent and enables the study of pore evolution throughout the processes of hydrocarbon generation and diagenesis [21,22]. However, because artificial maturation experiments are conducted in sealed autoclaves under high-temperature and high-pressure conditions, the continuous evolution process cannot be directly observed in real time, making it difficult to clearly display the relationships between mineral composition, organic matter, and pore evolution within the same area. Additionally, it is challenging to distinguish the differences in pore evolution between organic matter and inorganic minerals [23].
The deep shale of the Longmaxi Formation in the Sichuan Basin is buried at depths ranging from 3500 to 6000 m, with a thermal maturity of 2.0% to 3.5%. The resource volume exceeds 2 billion cubic meters, indicating significant potential [3,24]. Research on the deep shale of the Longmaxi Formation has increased in recent years, with a focus on static reservoir evaluation and shale gas accumulation mechanisms [24,25]. However, studies on the pore structure and evolutionary patterns of shale reservoirs at different thermal stages have mostly been carried out using thermal maturation experiments on low-maturity shale from other formations. Research specifically on low-maturity shale from the Longmaxi Formation is rarely reported, so previous findings do not necessarily capture the actual pore evolution pattern of Longmaxi shale during thermal maturation [26,27]. To investigate the effects of organic matter maturation and diagenesis on nanopore evolution while minimizing errors from sample heterogeneity, medium-maturity marine shale from the Longmaxi Formation was selected for thermal maturation experiments under reservoir conditions. The pyrolysis products formed during the experiments were used for a series of experiments, including organic geochemistry, mineral composition, scanning electron microscope (SEM), gas adsorption (LTNA), Mercury intrusion capillary pressure (MICP), and nuclear magnetic resonance (NMR) tests. The objectives of this study are: (1) to reveal the evolution characteristics of shale hydrocarbon products and establish a hydrocarbon generation model; (2) to identify the effects of organic matter maturation and diagenesis on nanopore evolution; and (3) to develop a comprehensive model of hydrocarbon generation, diagenesis, and pore evolution in marine shale. This study will provide valuable insights and guidance for future research.

2. Geological Setting

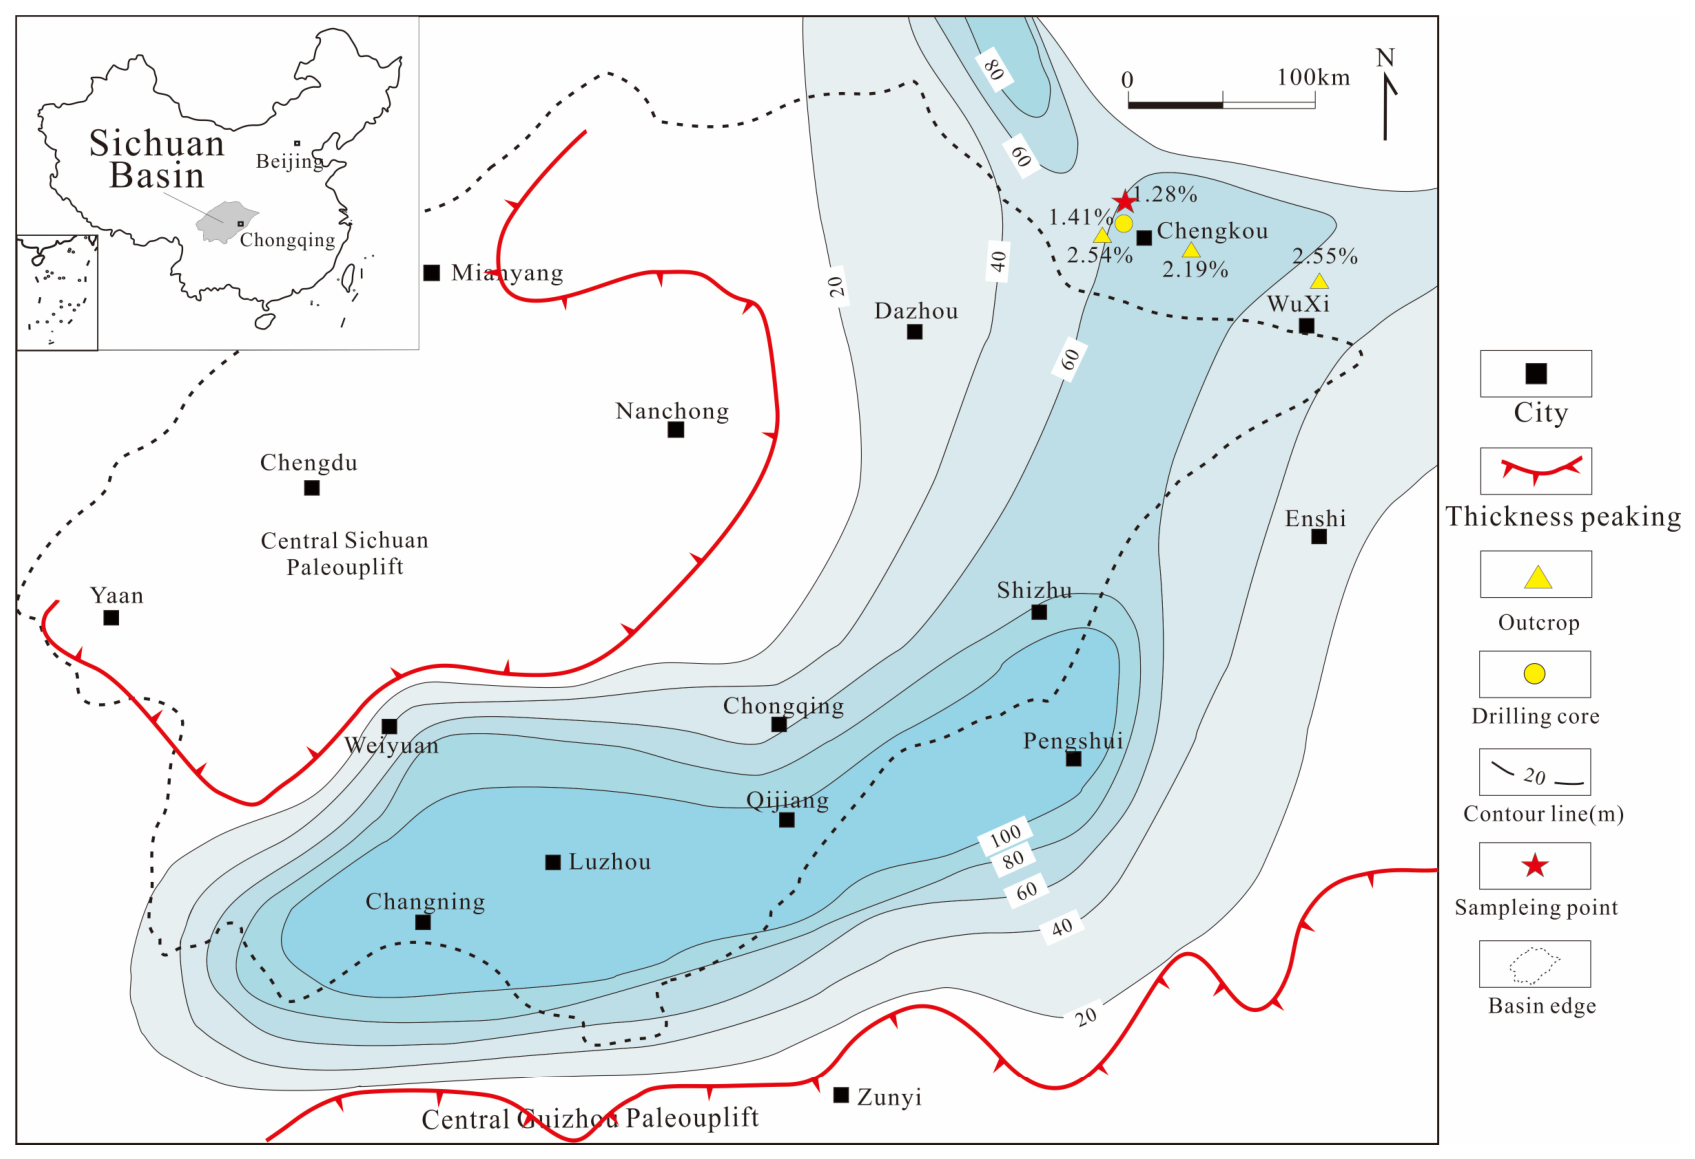
During the Late Ordovician to Early Silurian period, the Central Sichuan Paleouplift and Central Guizhou Paleouplift alternately uplifted under SE-directed compressional forces. The area between the paleouplifts formed a semi-closed stagnant marine basin (Figure 1). Two organic-rich shale depocenters were formed in the southern (Weiyuan-Changning area) and eastern parts of the Sichuan Basin [2]. Influenced by two global transgressions, the deposition of the Wufeng Formation and Longmaxi Formation underwent an evolutionary process from deep shelf to outer shelf, and then to shallow shelf environments. Changes in sea level created a sedimentary sequence characterized by progressively shallower water, coarser rock grain size, and lighter color [28]. Favorable sedimentary environments and conditions during the Katian to early Aeronian stages led to the concentration of organic-rich black shale in the Wufeng Formation of the Ordovician and the Longmaxi Formation of the Silurian. The organic-rich marine shales exhibit well-developed horizontal lamination, with abundant graptolite fossils and pyrite [25]. The distribution of organic-rich marine shale is widespread, with the thickest deposits concentrated in the southern and eastern parts of Sichuan, where the thickness ranges from 20 to 40 m. The current burial depth of these shale intervals ranges from 1500 m to 5000 m. The shale lithology is primarily composed of siliceous shale and calcareous siliceous shale, which are the main contributors to China’s current shale gas production [29].

3. Sample and Methods

3.1. Sample

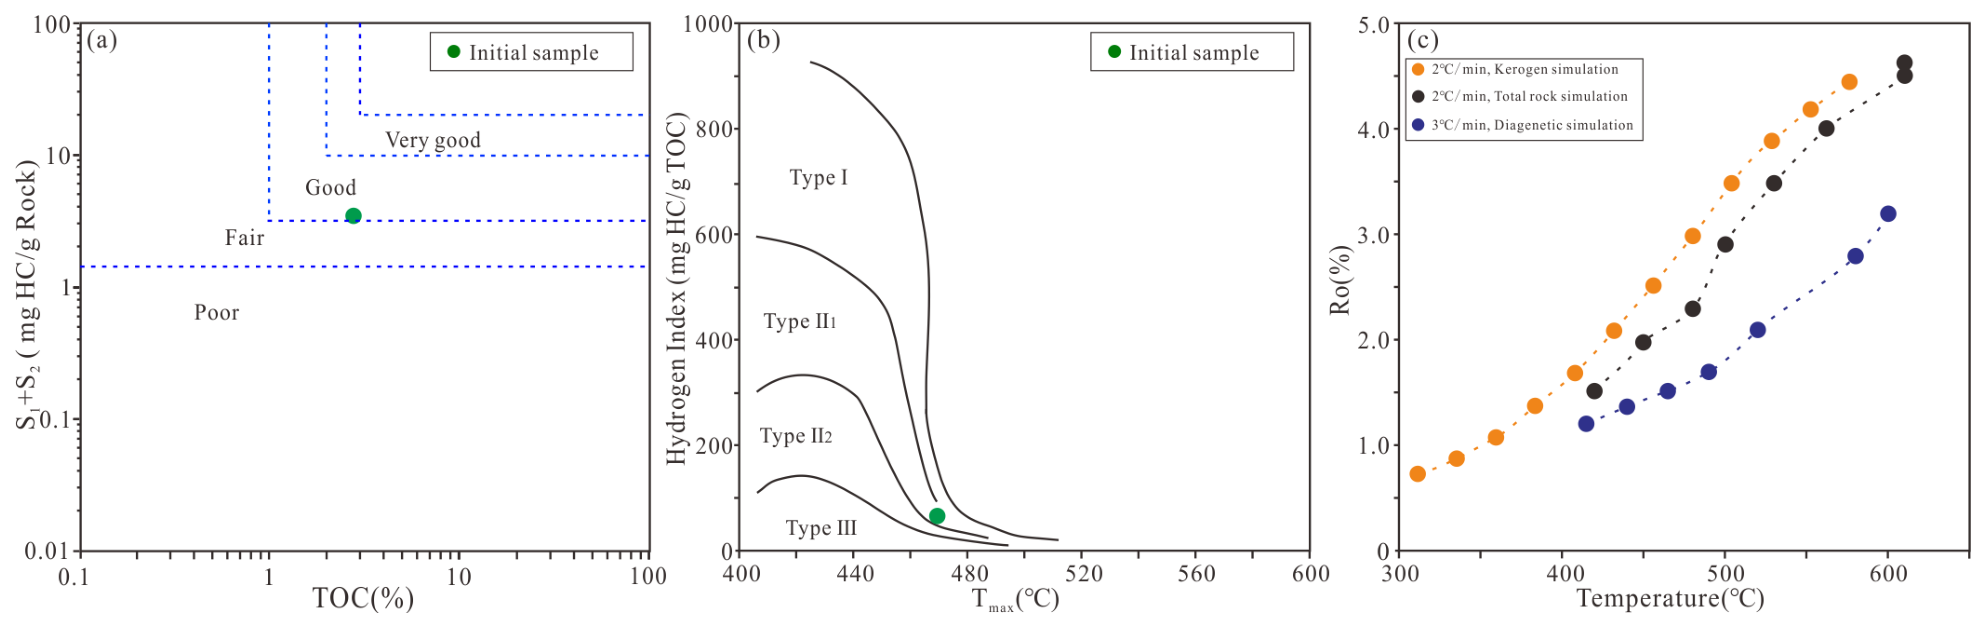
Previous studies have indicated that the thermal maturity of the marine shale in the Longmaxi Formation in the northeastern Sichuan Basin is low [30]. Therefore, the samples for this thermal maturation study were collected from the Miaoba Outcrop; this outcrop sample shares a similar depositional environment with the deep shale of the Longmaxi Formation in the Sichuan Basin, so it is thought to have had a comparable initial sediment composition. Since the outcrop sample has undergone relatively limited compaction, thermal maturation experiments can be used to track the evolution of diagenesis and pore structure during the transition from shallow to deep burial (Figure 1). The surface of the marine shale samples displayed a large number of conodont fossils. The initial TOC of the samples was 2.89%, and the HI was 64.99 mg/g. Raman spectroscopy tests were conducted on the samples using the method proposed by Liu et al. [31]. The calculated reflectance of vitrinite was 1.16%, indicating that the collected samples are of medium maturity [32]. The TOC versus (S1 + S2) crossover plot (Figure 2a) confirms that the marine shale samples exhibit good hydrocarbon potential [33], meeting the requirements for thermal maturation experiments. The HI versus Tmax crossover plot (Figure 2b) indicates that the organic matter type of the marine shale samples is Type II1 [34]. The geochemical characteristics of the samples are shown in Table 1.

3.2. Gold Tube Hydrocarbon Generation Maturation Experiment

To distinguish between kerogen cracking gas and residual bitumen cracking gas, both bulk sample (kerogen + residual liquid hydrocarbons) and kerogen were subjected to thermal maturation experiments. Through the thermal maturation experiments of the bulk sample, the hydrocarbon generation characteristics of the shale were obtained, while the kerogen thermal maturation experiments were used to determine the origin of the hydrocarbons. Additionally, due to the low porosity and permeability of shale, a closed system was chosen to best simulate the hydrocarbon generation process of source rocks. In this study, the golden tube hot press maturation device from the Guangzhou Institute of Geochemistry, Chinese Academy of Sciences, was used for the maturation experiments. Detailed procedures and apparatus can be found in previous studies [35]. After the experiments, the gas products were collected for compositional analysis, thereby obtaining the hydrocarbon generation volume and hydrocarbon component of the shale during the thermal evolution process. Two series of maturation experiments were designed in this study, with a heating rate of 2 °C/min; fluid pressure values increase with temperature/depth according to an approximate hydrostatic pressure gradient (ca. 10 MPa/km). The specific experimental parameters are shown in Table 2 and Table 3. During the hydrocarbon generation artificial maturation, there was a clear correlation between the sample maturity and temperature (Figure 2c).

3.3. Diagenetic Maturation Experiment

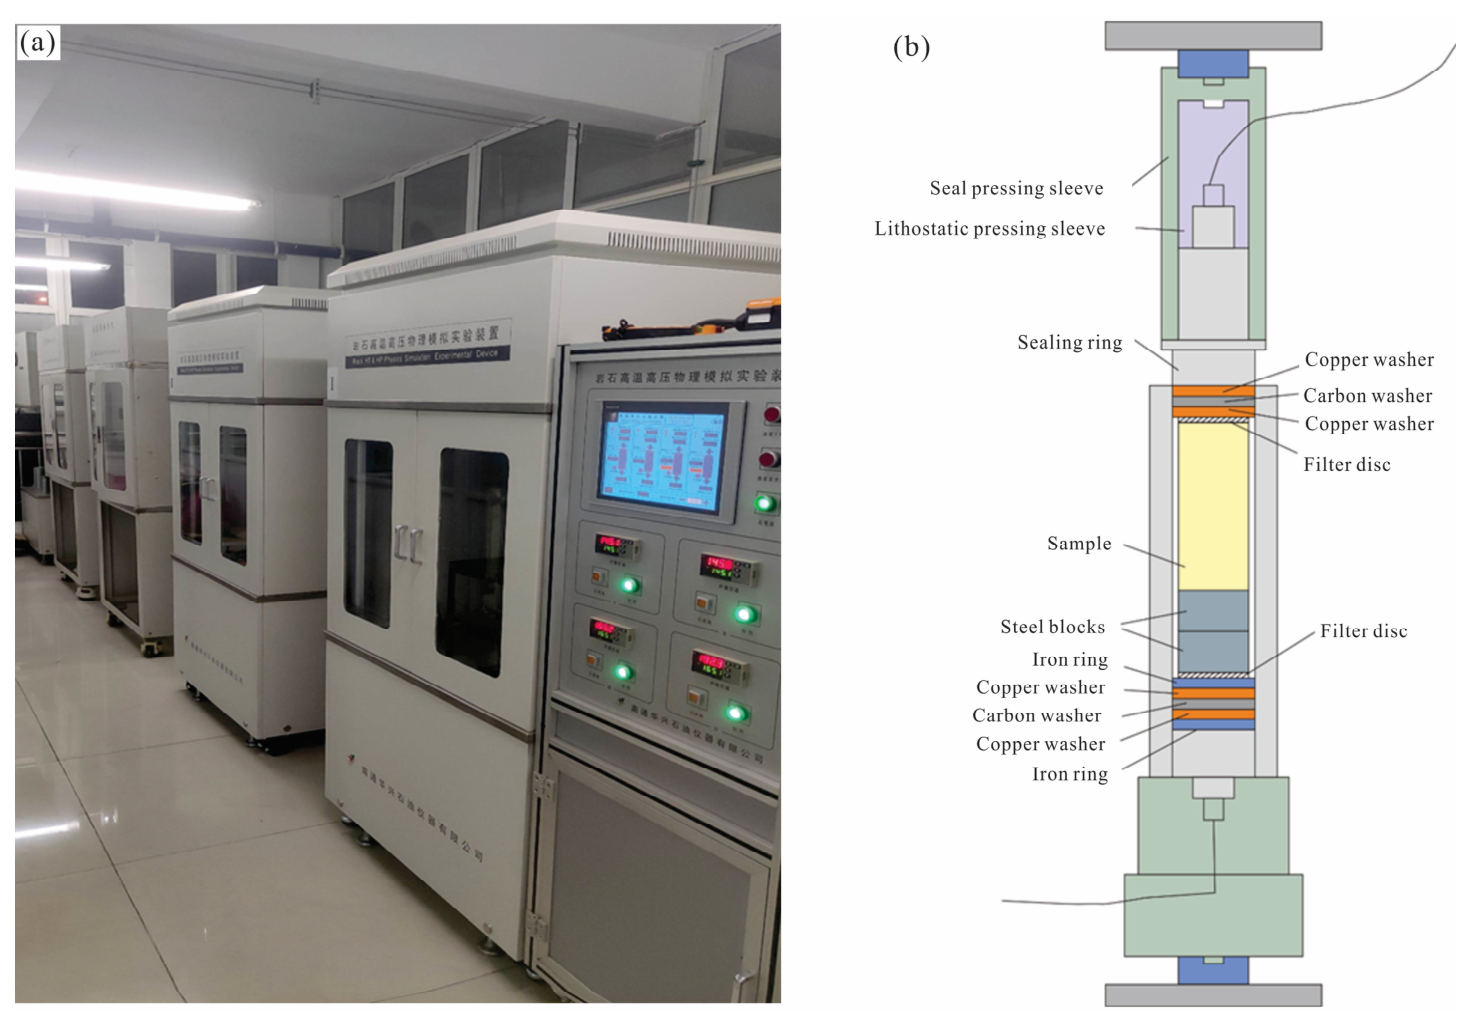
The diagenesis maturation experiments were conducted using the high-temperature and high-pressure diagenesis maturation system at Southwest Petroleum University (Figure 3a). The system can simulate temperatures up to 600 °C. The autoclave was first ultrasonically cleaned with distilled water and dichloromethane for 15 min each, and then placed in a muffle furnace at 450 °C for 5 h to remove organic matter. In each stage, a cylindrical plug (~7 cm long × 2.5 cm diameter) and 2–3 block samples (>1 cm3 each) are placed into the sample chamber. The annular space in the sample chamber is filled with 40–60 mesh powdered sample to support and fix the blocks. After loading the holder into the autoclave, deionized water is injected to simulate the fluid-saturated state of shale during early diagenesis (Figure 3b). The experimental system was a fully closed system. The temperature is gradually increased following a preset program to simulate the co-evolution of diagenesis and pore structure during shale thermal maturation under continuous burial conditions.
The initial water saturation of the marine shale samples was determined using both the saturated fluid and drying methods, yielding a range of approximately 40–60%. To accurately simulate the burial process, the original samples were used directly in the experiments without prior drying. The experimental design simulated burial depths ranging from 2000 to 5000 m, with static rock pressures between 50 and 125 MPa. The pressure was applied in a single stage. The experimental temperature ranged from 415 to 600 °C, with a heating rate of 3 °C/min and a maximum isothermal duration of 240 h. A total of seven simulated samples were obtained in this study, with the details provided in Table 4. During the thermal maturation, a strong correlation was observed between sample maturity and temperature (Figure 2c). The rate of maturity increase was notably faster in the higher temperature range, which is consistent with previous studies [36].

3.4. Supporting Experiment and Research Process

During the maturation experiments, the gaseous and liquid products were analyzed for their composition. Additionally, total organic carbon (TOC), vitrinite reflectance (Ro), rock pyrolysis, mineral composition, nuclear magnetic resonance (NMR), and gas adsorption (LTNA) tests were performed on both the initial and simulated samples. TOC content was measured using the CS-230 carbon–sulfur analyzer (LECO Laboratory Equipment Corporation, Saint Joseph, MI, USA). Rmc was calculated based on the Raman spectral peak spacing, using the formula 0.0537 × d (G-D) − 11.21 [31]. Natural gas composition was analyzed using the SCION-456-GC gas chromatograph (Tianmeiyituo Laboratory Equipment Corporation, Shanghai, China). This experiment was conducted at the Sinopec Wuxi Research Institute. A Rock-Eval analyzer (VINCI Laboratory Equipment Corporation, Paris, France) was used to measure the pyrolysis parameters of the original samples (S1: free liquid hydrocarbon content; S2: pyrolytic hydrocarbon content from residual kerogen; Tmax: the maximum pyrolysis temperature corresponding to the S2 peak). An X’Pert3 Powder X-ray diffractometer (Malvern Panalytical, Shanghai, China) was used to analyze the inorganic mineral composition of the samples. A low-temperature nano-pore analyzer (NMRC12-010V) from Suzhou Niumai Company (Suzhou, China) was used to obtain nuclear magnetic resonance T2 spectra and NMR porosity of the samples under four conditions: dry, deionized water-saturated, dodecane-saturated, and manganese ion solution-saturated [37].
The field emission scanning electron microscopy (FESEM) experiment was carried out at Southwest Petroleum University using an FEI QUANTA 650FEG instrument (Thermo Fisher Scientific, Hillsboro, OR, USA). The samples were prepared as rectangular blocks of about 10 mm × 10 mm × 5 mm, and then mechanically polished, argon-ion milled, and gold-coated before SEM observation to obtain high-resolution images. Nitrogen adsorption (LTNA) measurements were performed on an Autosorb-IQ3 fully automated surface area and pore distribution analyzer (Contech, Goddard, KS, USA). Prior to the LTNA analysis, the samples were degassed under vacuum at 110 °C for 12 h. The density functional theory (DFT) model was then applied to determine the micropore and meso/macropore surface areas, pore volumes, and pore size distributions. Mercury intrusion capillary pressure (MICP) tests were conducted using an AutoPore IV 9520 automatic mercury porosimeter (Contech, USA) at China University of Geosciences.

4. Results and Discussion

4.1. Hydrocarbon Generation Evolution

4.1.1. Hydrocarbon Gas Product

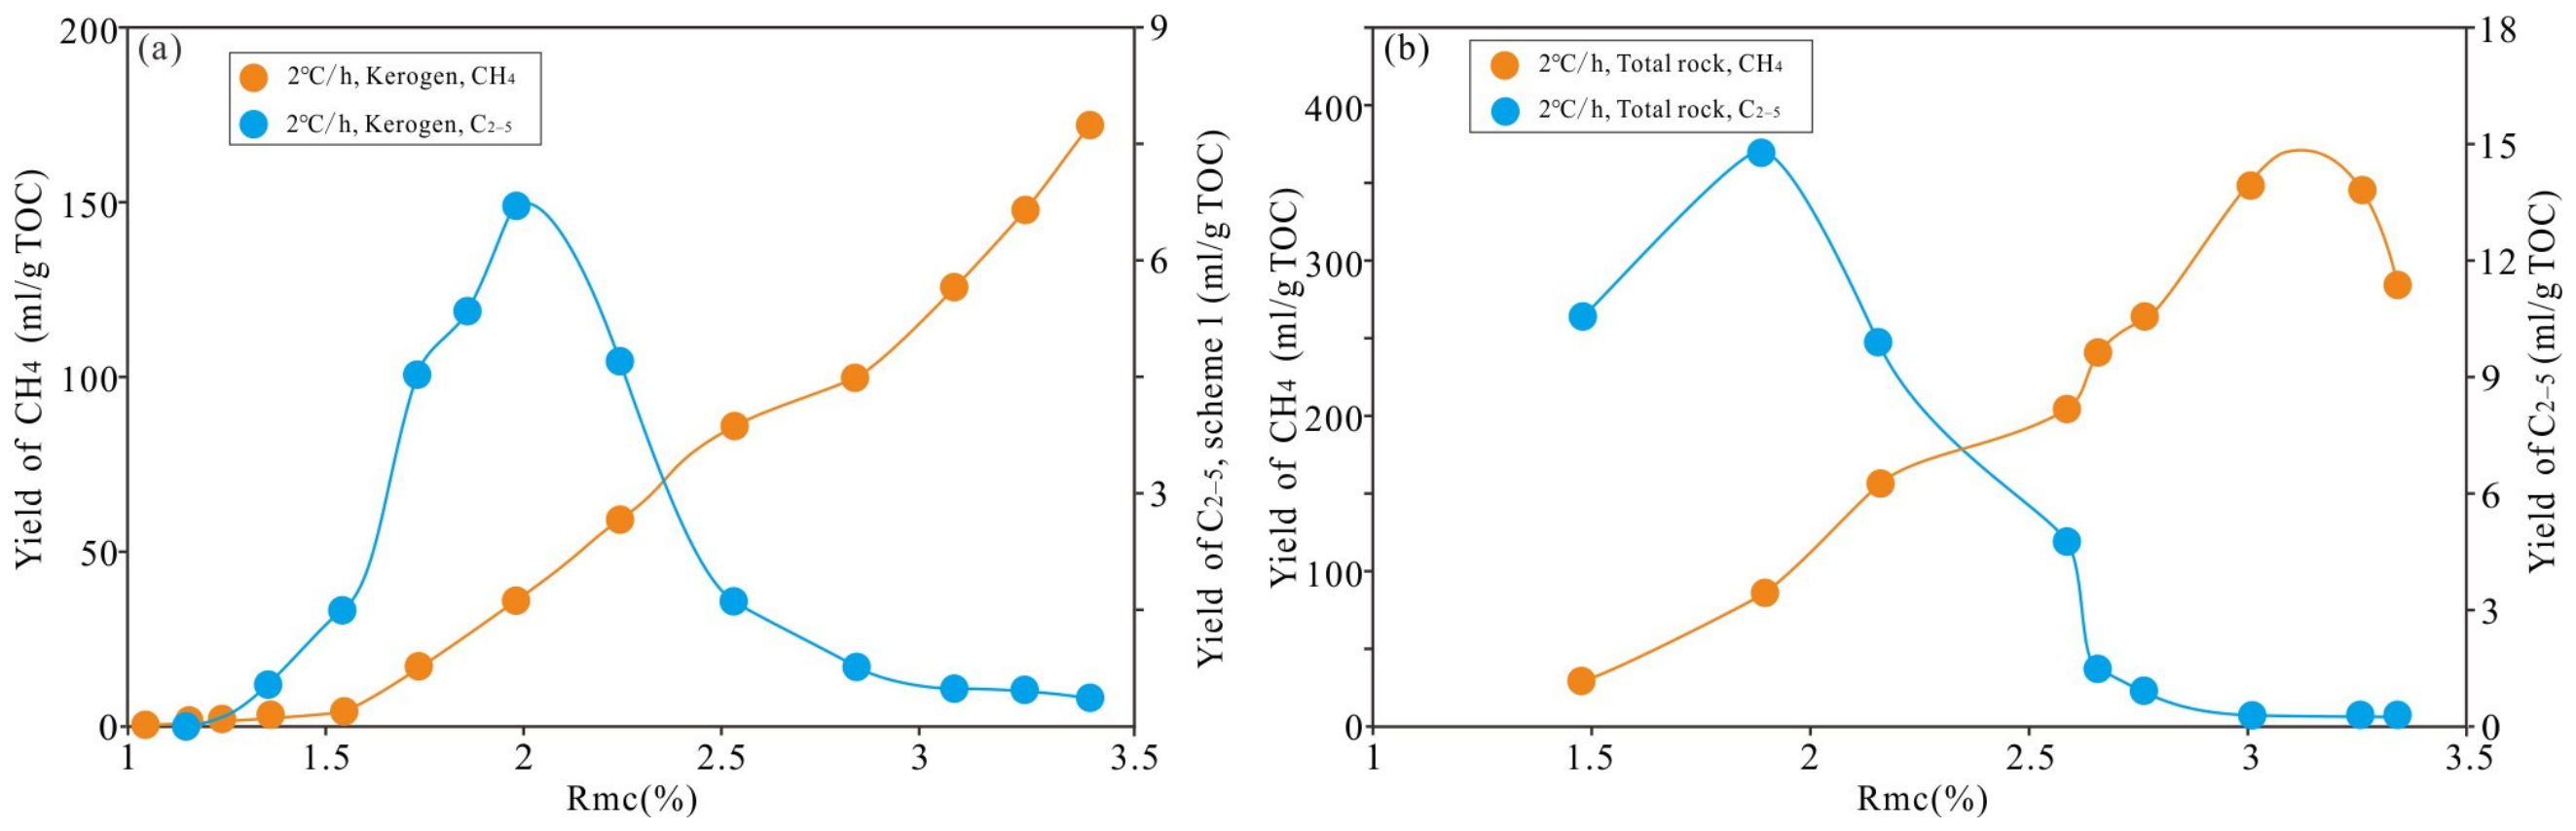
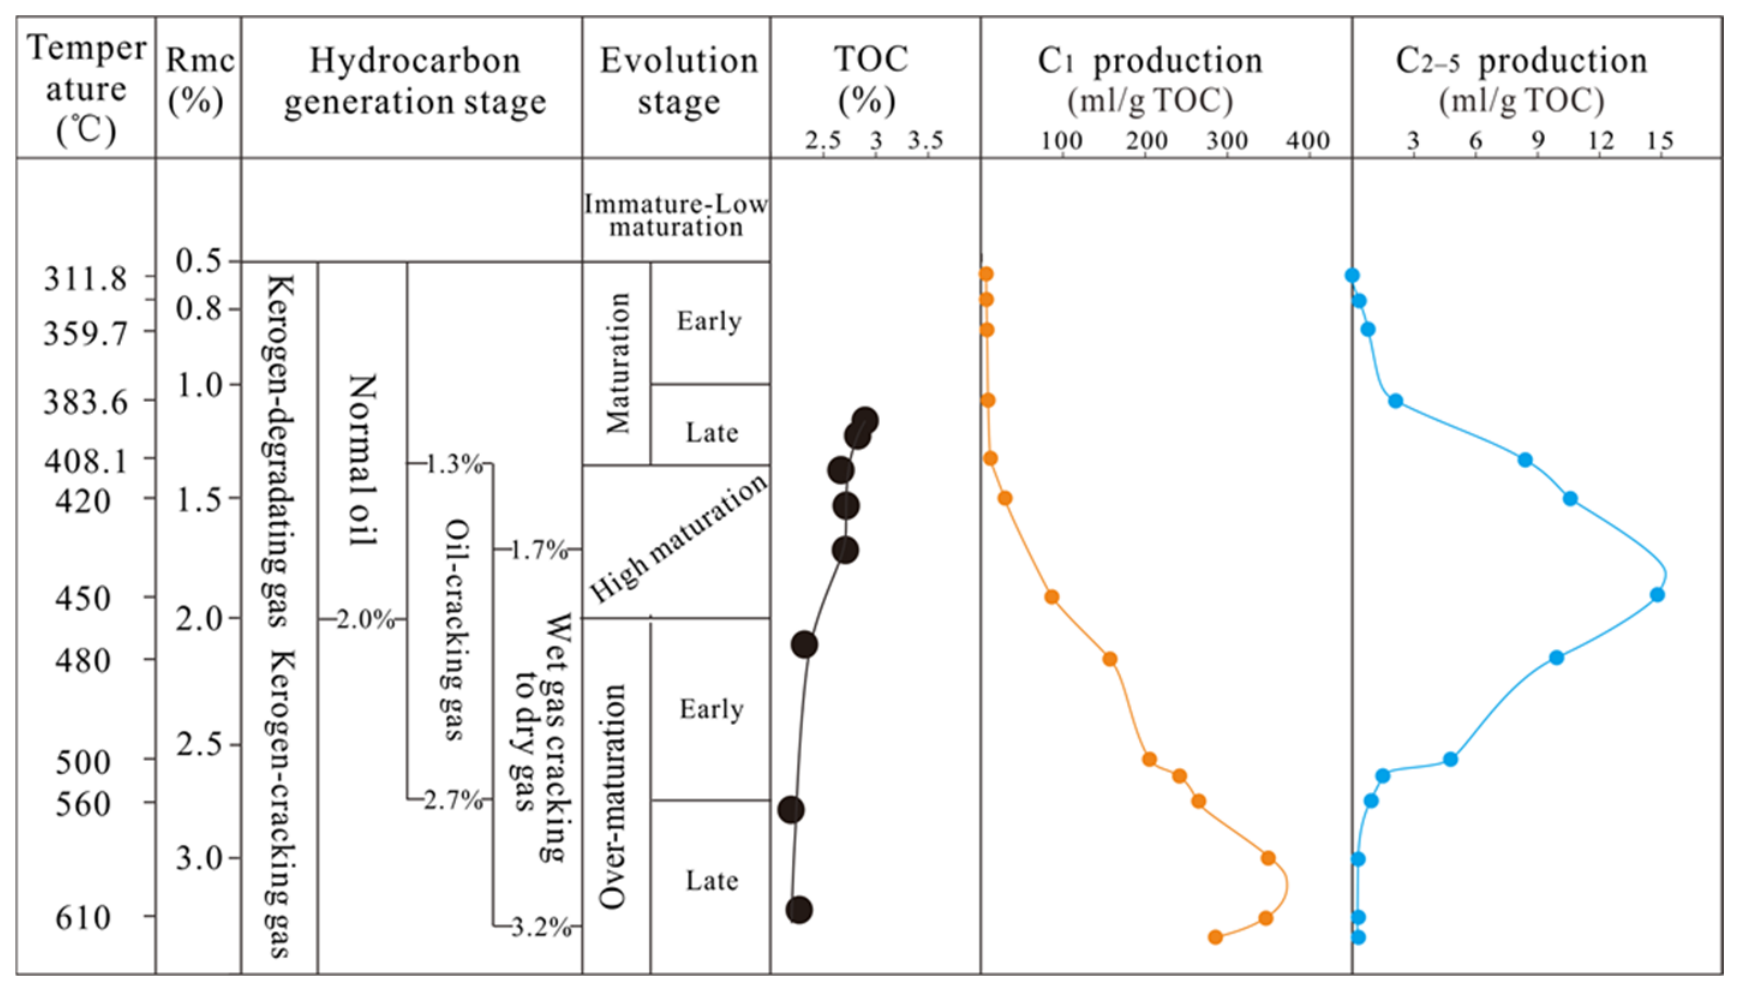
The thermal maturation results of the kerogen indicate that methane (CH4) generation continuously increases with increasing maturity. The maximum methane yield is 172.45 mL/g TOC (Figure 4a). The yield of gaseous hydrocarbons (C2–C5) varies with maturity and can be divided into four stages (Figure 4a): (1) Rmc = 1.0% to 1.3%: Kerogen undergoes cracking to produce oil, along with a small amount of gaseous hydrocarbons. (2) Rmc = 1.3% to 2.0%: Kerogen and retained oil crack to generate a large amount of wet gas. (3) Rmc = 2.0% to 2.8%: Wet gas gradually cracks, converting into methane along with small amounts of ethane and propane. (4) Rmc = 2.8% to 3.5%: The remaining gaseous hydrocarbons (C2–C5) slowly crack into methane [36,38].
The hydrocarbon generation maturation results for marine shale indicate that methane (CH4) production gradually increases when Rmc is less than 3.1%, with a maximum yield of 362.58 mL/g TOC (Figure 4b). When Rmc exceeds 3.1%, CH4 production gradually decreases. The yield of gaseous hydrocarbons (C2–C5) changes with maturity and can be divided into three stages (Figure 4b): (1) Rmc = 1.5% to 2.0%: A large amount of gaseous hydrocarbons is rapidly generated. (2) Rmc = 2.0% to 2.7%: A significant amount of gaseous hydrocarbons undergoes cracking. (3) Rmc > 2.7%: The remaining gaseous hydrocarbons, particularly ethane, gradually crack into methane.

4.1.2. TOC Evolution

The initial and simulated TOC values are presented in Table 5. As thermal evolution progresses, the TOC value shows a decreasing trend. A significant decrease in the TOC value occurs when Rmc reaches 2.1%. Sample TOC decreases significantly as Ro increases from 1.7% to 2.1%, which is likely due to extensive decomposition of residual liquid hydrocarbons into natural gas at this maturity. This interpretation is supported by the peak C2–5 yield on the gas generation curve under the same maturity condition [39].

4.1.3. Gas Generation Model

This study establishes a gas generation model for marine shale (Figure 5), based on thermal maturation results of shale samples and considering the evolution of kerogen, Due to the sample issue, the gas generation model lacked the gas generation characteristics of shale with Rmc < 1%. Due to sample limitations, the model does not cover the gas generation characteristics of shale with Rmc < 1%. To address this, the gas generation curve from the gold tube thermal simulation experiment conducted by Ma et al. on Lower Silurian black shale from western Lithuania (Rmc ranging from 0.5% to 1%) was incorporated to improve the model [40]. The evolution process of organic-rich marine shale is divided into three stages. (1) Maturation stage (0.5% < Rmc < 1.3%): Kerogen degrades to produce oil. In the early part of this stage, retained oil with a high proportion of heavy components is continually formed, along with a small amount of gaseous hydrocarbons (C1–C5). In the later part of this stage, retained oil begins to crack, producing light oil and a small amount of gaseous hydrocarbons, with a noticeable increase in gas production. (2) High-maturity stage (1.3% < Rmc < 2.0%): Kerogen and retained oil crack to produce wet gas and light oil. The production of gaseous hydrocarbons (C2–C5) peaks at Rmc = 1.8%. After reaching its peak, the production of gaseous hydrocarbons gradually decreases in this stage. (3) Early overmature stage (Rmc > 2.0%): Short-chain alkyl groups in kerogen and crackable retained oil gradually break down into methane and propane. Wet gas gradually converts into methane. Late overmature stage (Rmc > 2.7%): Crackable gaseous hydrocarbons (C2–C5) are completely converted into methane, and kerogen gradually transforms into bitumen.

4.2. Mineral Composition Evolution

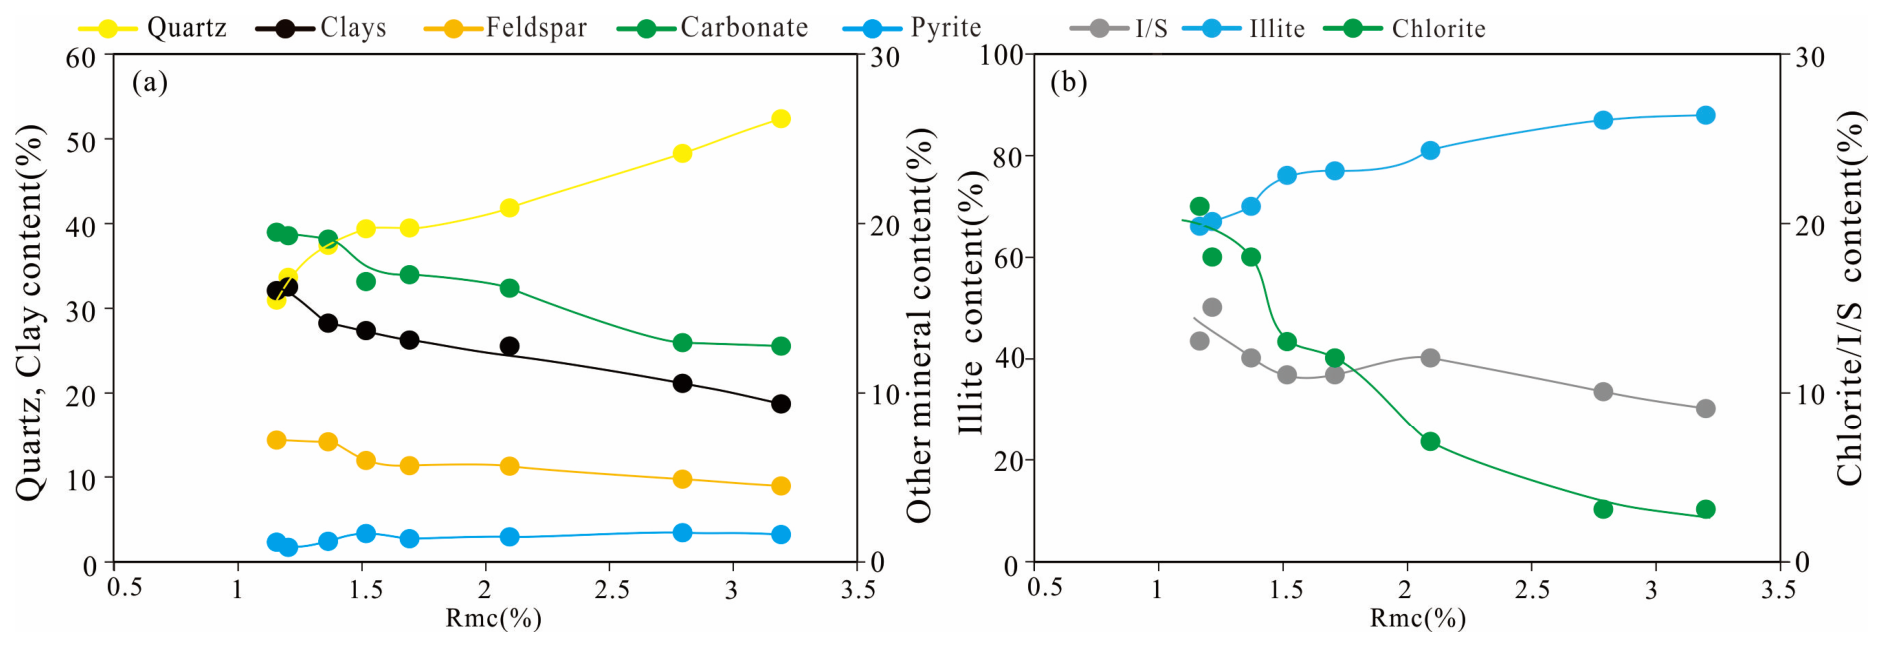
Quartz and clay minerals dominate the composition of the original sample, with carbonate minerals accounting for approximately 19.5% (Table 5). Illite is the dominant clay mineral, followed by chlorite. As thermal evolution progresses, the quartz content shows a gradual increase. The proportion of quartz increases from 31.0% to 52.4% (Figure 6a). Conversely, the abundances of clay minerals, feldspar, and carbonates decrease progressively, with clay minerals experiencing the largest drop from 32.0% to 18.4%. The content of pyrite shows a slight increase (Figure 6a). Illite exhibits a continuous upward trend, increasing from 66.0% to 88.0%. In contrast, chlorite drops markedly, falling from 21.0% to 3.0%. Meanwhile, the proportion of illite-smectite mixed layers (I/S) undergoes a modest decline (Figure 6b).
Through the interactions between minerals, changes in mineral composition during the artificial maturation can be revealed [23]. Before thermal maturation, marine shale samples contain a high proportion of carbonate minerals and chlorite, with little kaolinite. During the early diagenesis stage, in a reducing environment rich in iron and magnesium, an alkaline medium promotes the occurrence of the reaction (1). Kaolinite is converted into chlorite. Prior to thermal maturation, marine shale samples do not contain montmorillonite, and illite content is high. Other clay minerals may undergo reaction (2) in an alkaline, potassium-rich environment, transforming into illite. Alternatively, kaolinite can form illite through reaction (3) in a potassium-rich environment. In the late diagenesis stage (high maturity stage), kerogen cracking releases organic acids, which convert the diagenetic environment into an acidic one. In this stage, the content of feldspar, carbonate minerals, chlorite, and I/S decreases, while quartz and illite content increases. This result aligns well with previous studies suggesting that the proportion of primary quartz in the Longmaxi Formation shale is relatively high, and that this is associated with the transformation of clay minerals and feldspar [41,42,43]. Under conditions rich in H+, feldspar and carbonate minerals react (4), forming an ion environment rich in Ca2+, Mg2+, K+, and Na+. Meanwhile, reaction (1) continuously dissolves chlorite, further promoting reactions (2) and (3). Illite and quartz are further increased. In the overmature stage, although kerogen does not undergo decarboxylation, the chlorite content continues to decrease, indicating that the diagenetic environment remains acidic. Under these conditions, mineral components continue to interconvert, but the intensity of transformation significantly decreases.
kaolinite + Fe2+ + Mg2+ + H2O → chlorite + H+
montmorillonite (I/S) + K+ + Al3+ → Illite + Na+ + Ca2+ + Fe3+ + Mg2+ + Si4+
K-feldspar (K+) + kaolinite → Illite + SiO2(or Si Ion) + H2O
Feldspar + H+ + H2O → kaolinite + SiO2(or Si Ion) + K+(Na+)

4.3. Diagenesis and Pore Evolution

4.3.1. Diagenesis and Pore Morphology

  • Hydrocarbon generation and organic pore development
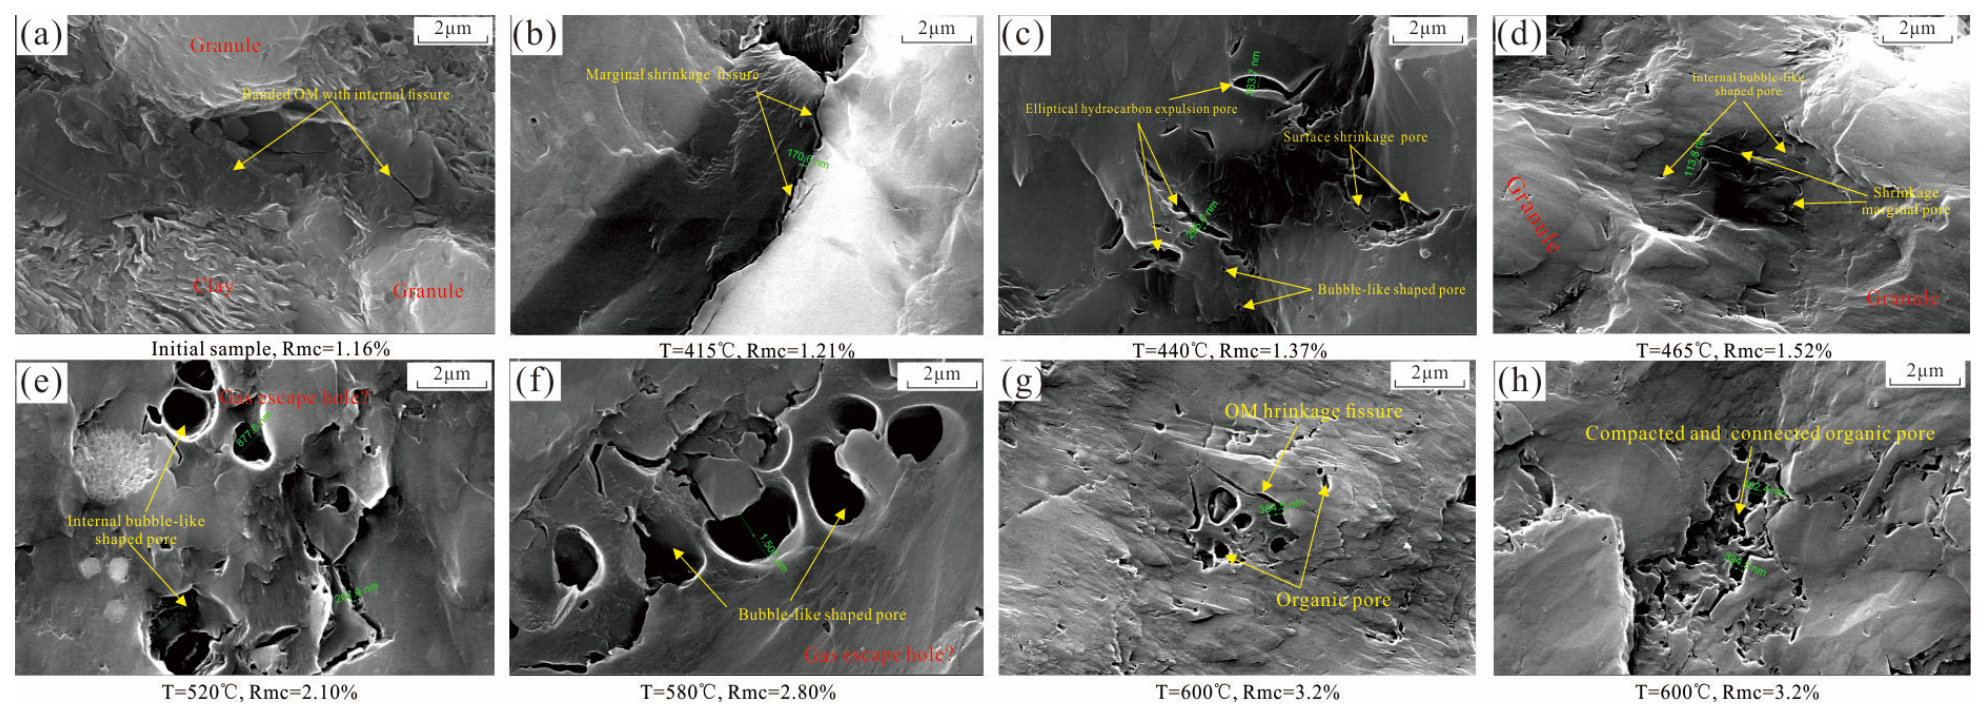
The characteristics (morphology, dimensions, and density) of organic pores in shale are governed by three factors: organic matter abundance, organic matter type, and thermal maturity level [44,45]. Before thermal maturation experiments, the organic matter in the shale samples is distributed in a banded or dispersed manner. The organic pores are primarily round to sub-round in shape and are few in number. These pores are relatively isolated from each other (Figure 7a). In the late maturation stage, the expulsion of hydrocarbons retained on kerogen surfaces generates a small quantity of organic pores, though these pores are typically small. After kerogen breaks down, its volume contracts. As a result, abundant microfractures form at the kerogen boundaries and inside the kerogen itself (Figure 7b). During the high-maturity stage (Rmc between 1.3% and 2.0%), the kerogen and retained hydrocarbons undergo cracking, generating a large amount of gaseous hydrocarbons. At this point, the previously filled inorganic pores regain their storage capacity. Within these inorganic pores, solid bitumen rich in nanometer-scale organic pores can be observed (Figure 7c). A large number of microfractures form at the edges of the solid bitumen (Figure 7d). During the overmature stage, residual retained hydrocarbons and kerogen continue to crack, forming gaseous hydrocarbons. Organic pores begin to form within the organic matter, taking on a round shape. As thermal evolution progresses, the development and pore size of organic pores significantly increase. The expansion, aggregation, and interconnection of these pores become more pronounced. The pore size can reach the micron scale (Figure 7e,f). Due to the support provided by retained hydrocarbons and wet gas, the early organic pores were preserved. Because of the fluid overpressure pore-preserving effect from natural gas during shale hydrocarbon generation, organic pores can resist compaction and remain well preserved. However, when Ro reaches 3.2%, the hydrocarbon generation capacity of the shale organic matter decreases, the fluid overpressure preservation effect weakens, and compaction then squeezes the organic pores and microcracks, making them smaller (Figure 7g,h).
2.
Inorganic diagenesis and inorganic pore development
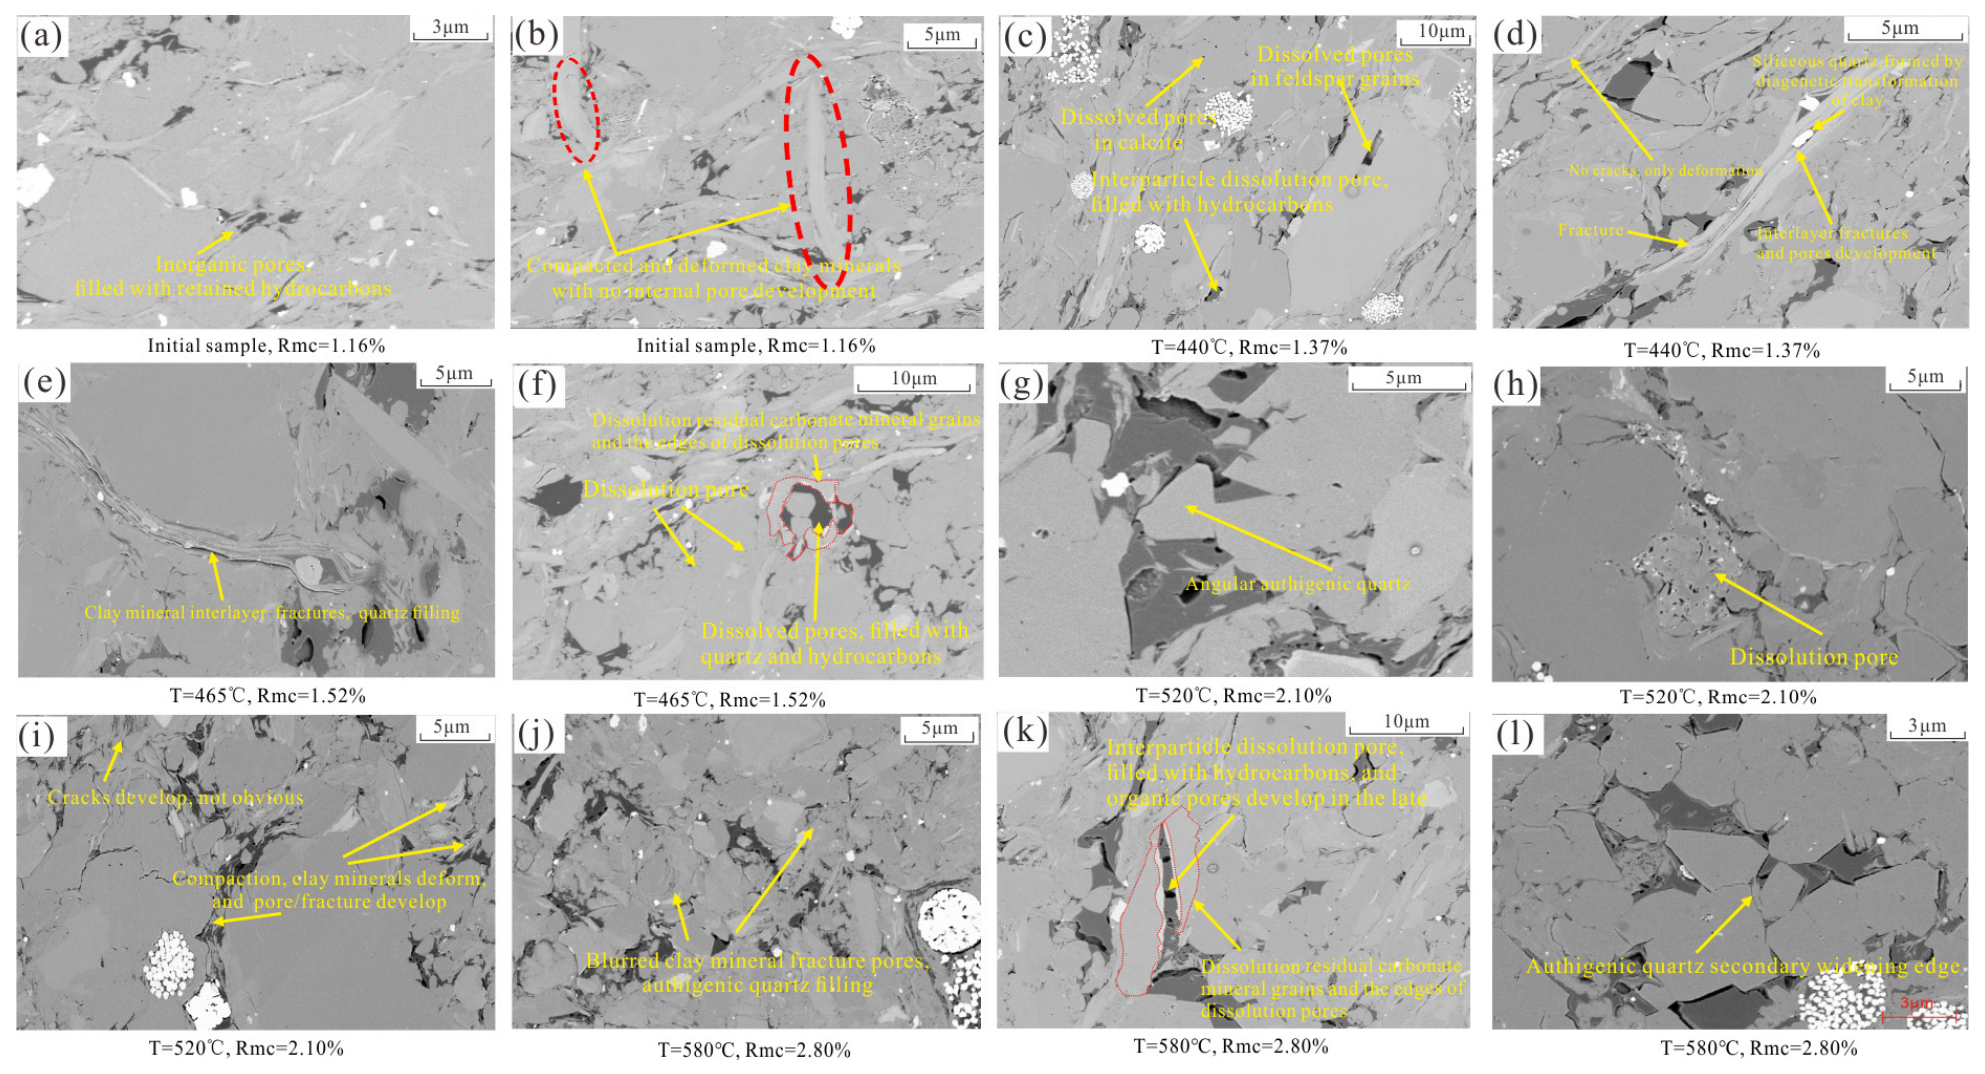
Before the maturation of organic matter, inorganic pores dominate in proportion. During the maturation stage, retained hydrocarbons fill these inorganic pores (Figure 8a). Under compaction, clay minerals are compressed, resulting in a reduction in the number of pores and microfractures between clay minerals (Figure 8b). In the high-maturity stage, organic matter generates a large amount of organic acids during hydrocarbon generation. In shale, soluble minerals such as calcite and feldspar are dissolved, leading to the formation of numerous pores and microfractures (Figure 8c). Simultaneously, in an acidic environment, chlorite undergoes alteration, and feldspar and montmorillonite (or I/S) are altered to illite. These alteration reactions create pores, microfractures, and siliceous cement between clay minerals (Figure 8d,e). The content and solubility of feldspar are lower than those of calcite, and the calcite content in shale samples exceeds that of feldspar (Figure 6a). Therefore, the intraparticle pores within calcite are the primary pore type formed through dissolution. In the late maturation to early high-maturity stages, the concentration of organic acids in the diagenetic environment is high, leading to larger pore sizes formed by dissolution. Before being filled by retained hydrocarbons, dissolution features and authigenic quartz are commonly observed within these dissolution-formed pores (Figure 8f,g,k). SEM images show that the size of these authigenic microcrystalline quartz particles ranges from 3 μm to 6 μm (Figure 8f,g,l). In the overmature stage, the acidity of the diagenetic environment decreases, leading to a reduction in the number of pores formed by dissolution (Figure 8h). During this stage, unstable clay minerals largely transform into stable illite. Under compaction, flaky illite can still form stable triangular supporting structures, creating a certain number of pores (Figure 8i,j).

4.3.2. Quantitative Characterization of Pore Development Degree

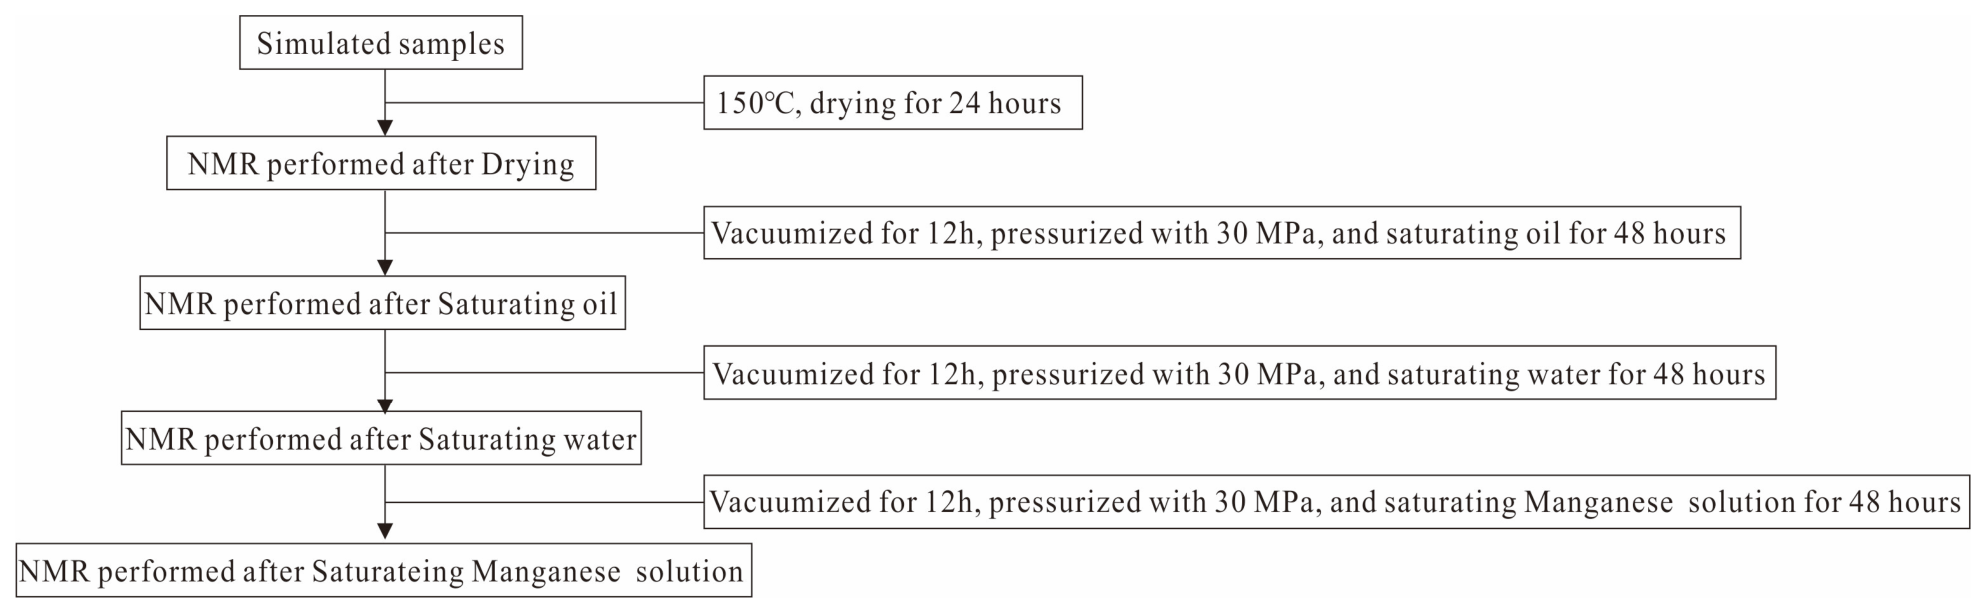
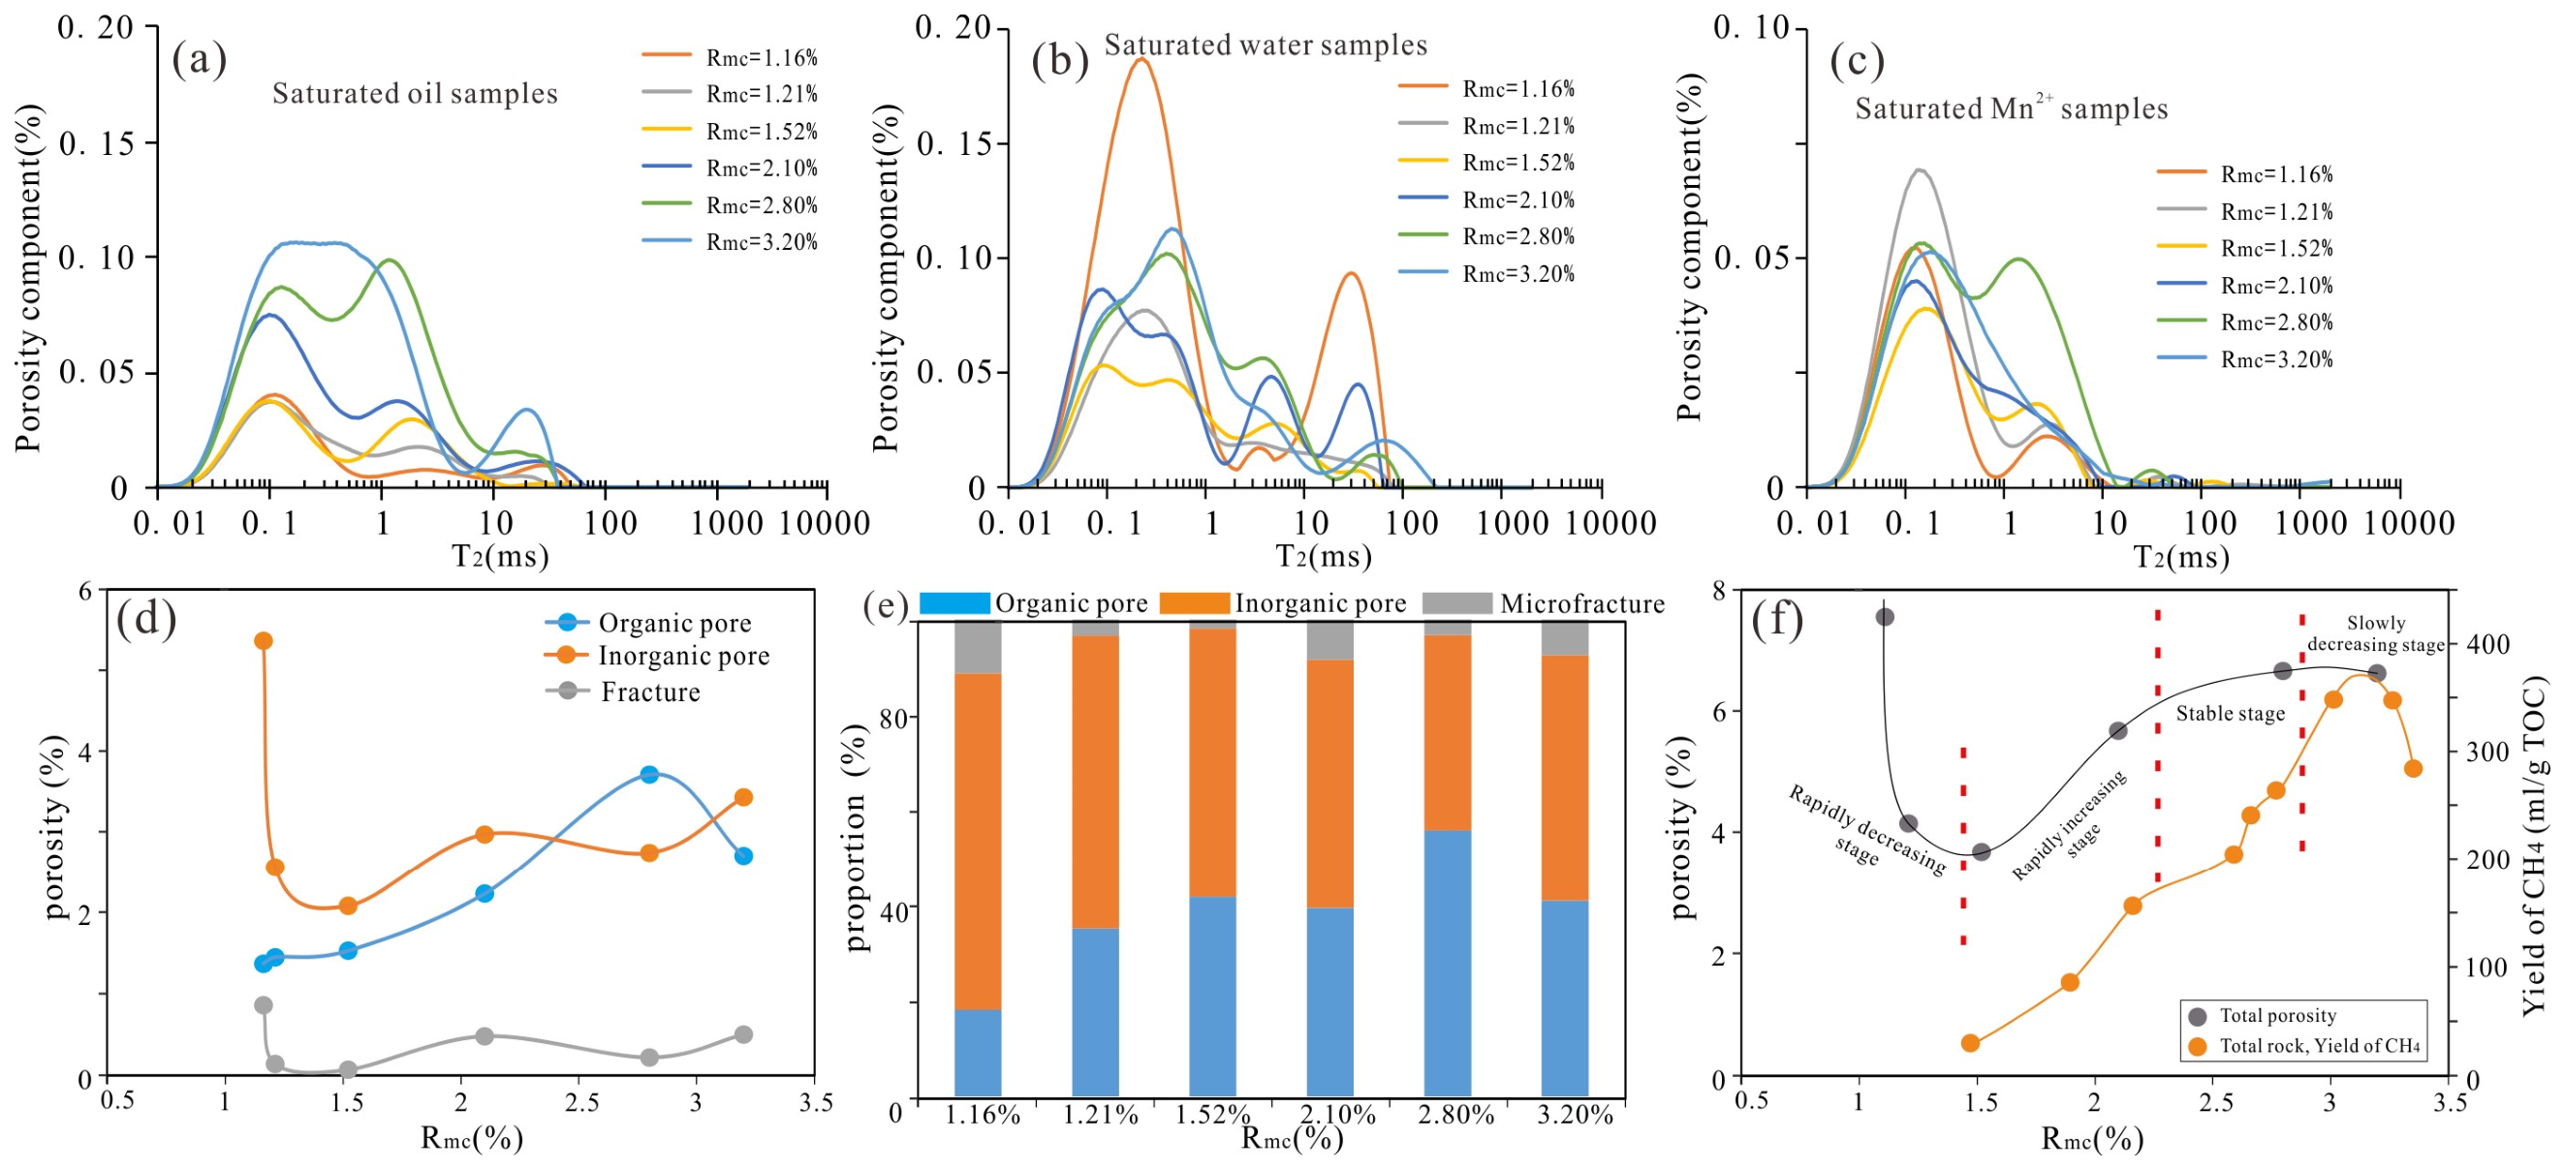
Organic and inorganic pores differ notably in their wettability. Using NMR technology, the proportions of organic and inorganic pores can be characterized by saturating with different fluids [46,47]. The specific procedure is illustrated in Figure 9. First, the T2 spectrum of shale in its dry state is obtained, which reflects signals from clay-bound water and disconnected pores (also known as the baseline signal). Since dodecane preferentially enters organic pores, but some large inorganic pores may still be filled with dodecane, the resulting T2 spectrum reflects organic pores and a small amount of inorganic pores (Figure 10a). The inorganic pores and a small amount of organic pores saturated with dodecane are then saturated with deionized water (Figure 10b), and the T2 spectrum obtained at this point represents the total porosity. Finally, the T2 spectrum of Mn2+-saturated shale is obtained (Figure 10c). Because manganese ions can shield the H+ signals from deionized water, the T2 spectrum obtained at this point only reflects the signal from dodecane, representing only the organic pores.
Previous studies generally suggest that components with relaxation times greater than 100 ms represent microfractures. This study presents a statistical analysis of the organic, inorganic, and microfracture porosities of samples before and after maturation (Table 6). The results show that before maturation, the inorganic pore and microfracture porosities are highest at 5.37% and 0.86%, respectively (Figure 10d), comprising 70.66% and 11.32% of the total porosity. The proportion of organic pores is the lowest (Figure 10e). As thermal maturity advances, the porosity of inorganic pores and microfractures declines sharply due to compaction and hydrocarbon retention. At the experiment temperature of 520 °C (Ro = 2.1%), the porosity of all pore types slightly increases (Figure 10d,e). This increase may be related to clay mineral transformations, dissolution effects, and hydrocarbon cracking of retained hydrocarbons. The porosity of organic pores shows an initial increase followed by a decrease (Figure 10d). During the high-maturity to early overmature stages, organic pore porosity gradually increases due to hydrocarbon generation from organic matter. At the experiment temperature of 580 °C (Ro = 2.8%), the number of organic pores is highest, with organic pore porosity reaching 3.71%, comprising 55.62% of the total porosity (Figure 10e). The latter stage of overmaturity witnesses a decrease in the organic matter’s ability to generate hydrocarbons. Under the influence of overburden compaction, the porosity of organic pores is correspondingly diminished to some degree (Figure 10d). Based on the shale gas generation curve and porosity variation characteristics, the evolution of total porosity can be divided into four stages: (1) a rapid decrease phase, where intergranular inorganic pores decrease rapidly under compaction; (2) a rapid increase phase, associated with rapid hydrocarbon generation from organic matter, which leads to the extensive formation and good preservation of organic pores, while the release of organic acids generates secondary dissolution pores; (3) a relatively stable phase, where the shale gas generation rate slows down, and the balance between pore preservation from fluid overpressure and compaction keeps porosity stable; and (4) a slow decrease phase, where shale hydrocarbon generation essentially ceases, and porosity gradually decreases under compaction (Figure 10f).

4.3.3. Pore Size Distribution Characterization

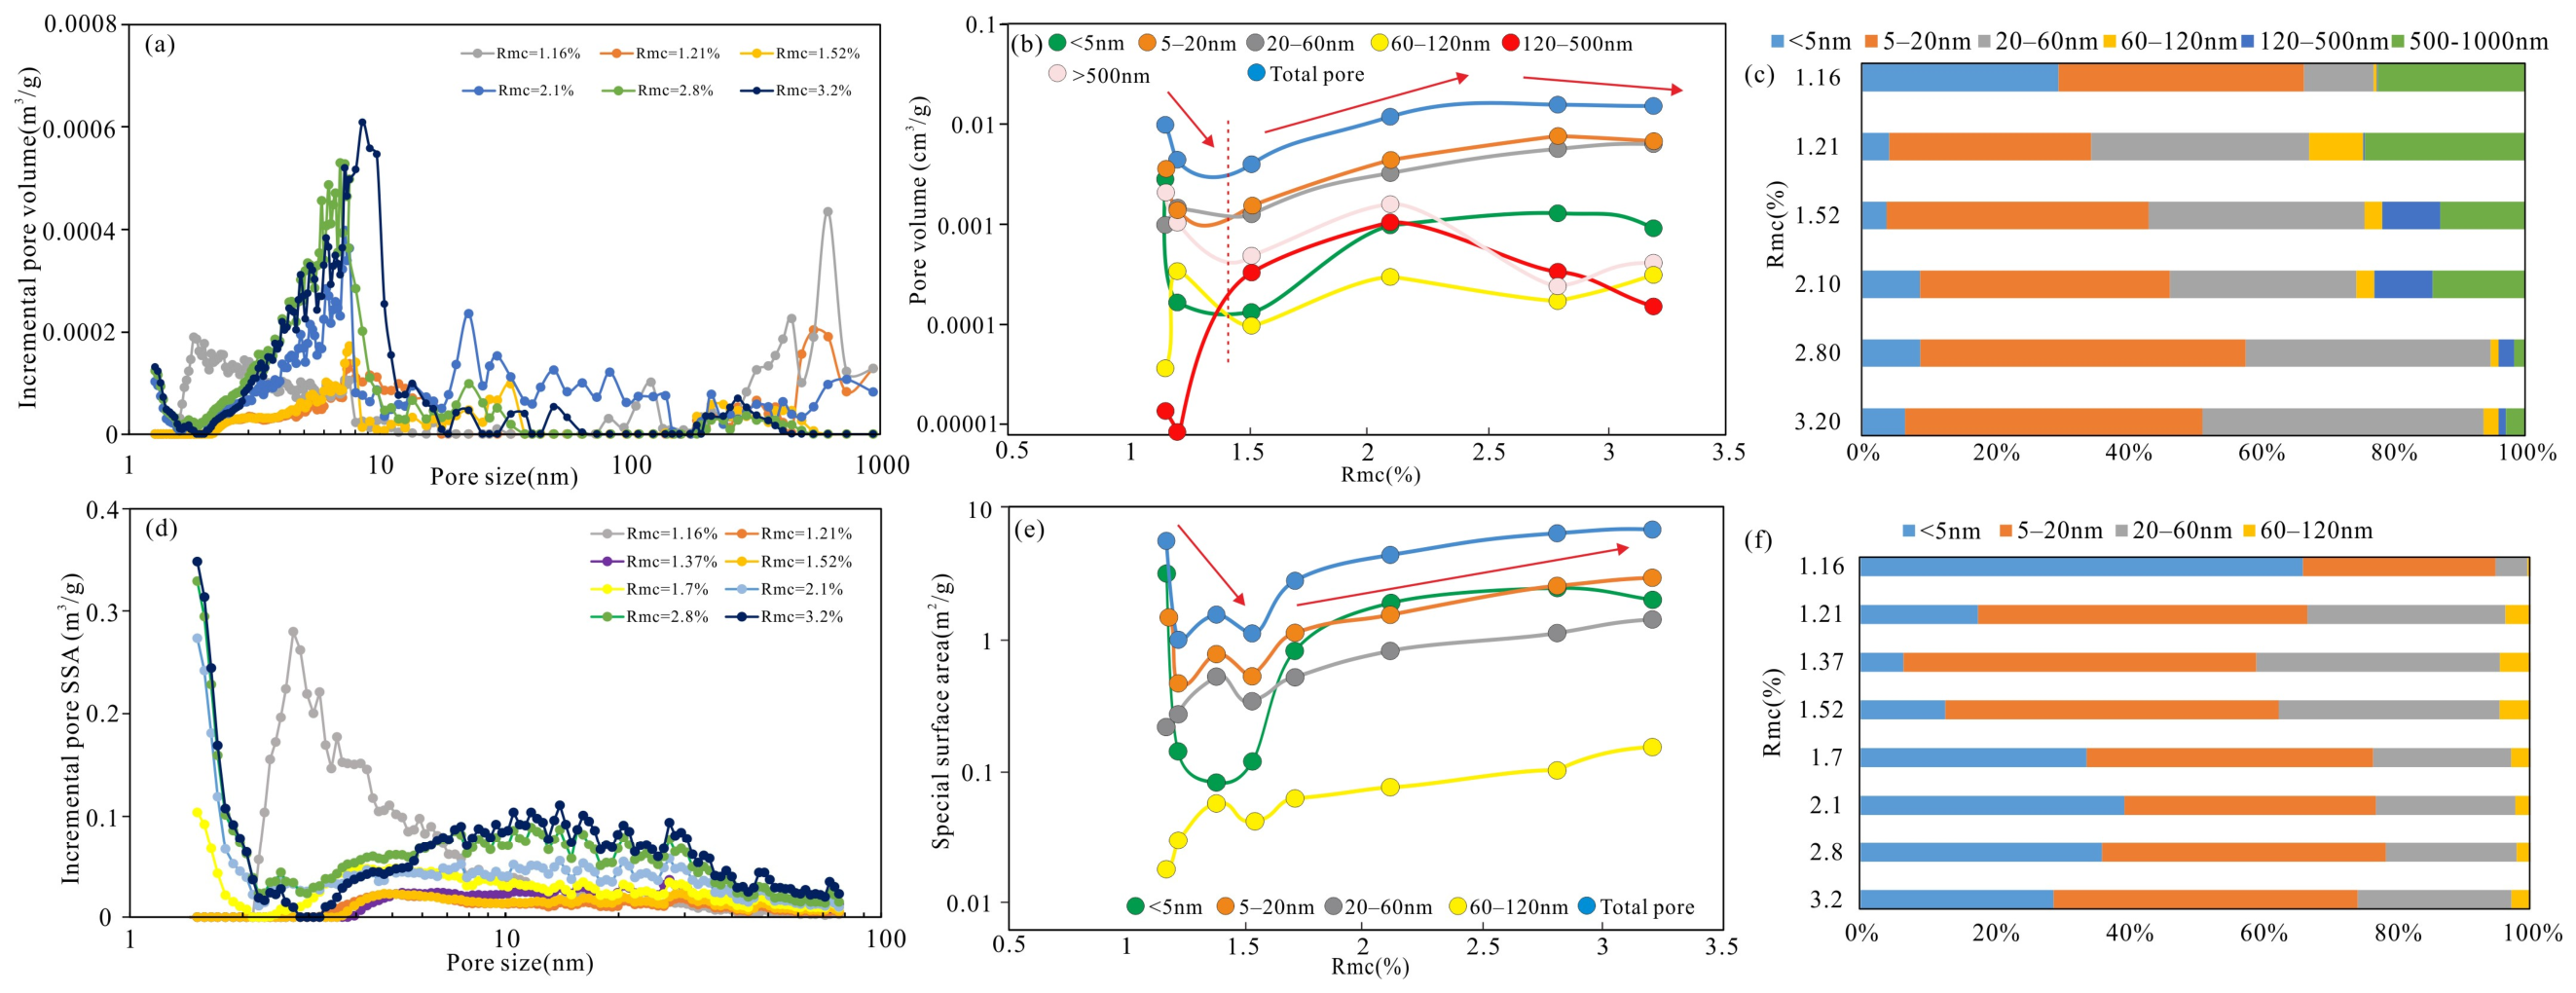
LTNA was employed to characterize pores with diameters below 50 nm, whereas MICP was applied for those exceeding 50 nm. The results show that the pore volume (PV) ranges from 0.0043 to 0.0166 cm3/g (average 0.0011 cm3/g), while the specific surface area (SSA) fell within 1.17 to 7.09 m2/g (average 3.95 m2/g). As thermal evolution progresses, both PV and SSA initially decrease and then increase. After reaching its peak during the late overmature stage, PV undergoes a gradual reduction (Figure 11a,d). To better capture the variations in PV and SSA across different pore size regimes, the pores were divided into six categories according to their diameter: <5 nm, 5–20 nm, 20–60 nm, 60–120 nm, 120–500 nm, and 500–1000 nm (Table 7). During thermal maturation, the primary contributors to PV come from pores falling within the 5–20 nm and 20–60 nm intervals (Figure 11b,c). The main contributors to SSA are pores smaller than 5 nm and those in the 5–20 nm range (Figure 11d,e).
Before thermal maturation, the pore volume (PV) of marine shale was 0.0105 cm3/g, and the specific surface area (SSA) was 2.038 m2/g. Pores smaller than 20 nm and those between 500 and 1000 nm were predominant (Figure 11). As thermal evolution progressed, PV and SSA rapidly decreased, particularly for pores smaller than 20 nm, due to compaction and the filling effect of retained hydrocarbons (Figure 11b,e). At the late stages of maturity, SSA reached its lowest value of 1.17 m2/g. Compared to the original sample, the SSA of pores smaller than 5 nm decreased significantly (Figure 11e,f). At the early high-maturity stage, the minimum pore volume of 0.0048 cm3/g was recorded, which was markedly lower than that of the pristine sample. Pore sizes were predominantly between 5 nm and 60 nm. Starting from the mid-stage of high maturity, both PV and SSA increased for all pore sizes, particularly for pores between 5 and 20 nm. This increase was partly due to the generation of organic pores from kerogen and retained hydrocarbons cracking, which also released previously filled inorganic pores. Additionally, dissolution and mineral transformation processes further contributed to pore formation (Figure 11b). In the early over-mature stage, the PV of pores smaller than 60 nm gradually increased, while that of pores larger than 60 nm decreased significantly. Kerogen and retained oil produced large amounts of wet gas, reaching the maximum potential for forming organic pores and microfractures. The transformation of clay minerals led to the formation of additional inorganic pores and microfractures, resulting in a marked increase in pores smaller than 60 nm (Figure 11b). However, during this period, SSA for all pore sizes increased gradually (Figure 11e). In the late stage of over-maturity, PV decreased after reaching its maximum value due to compaction (Figure 11b).

4.3.4. Shale Composition-Pore Structure Co-Evolution

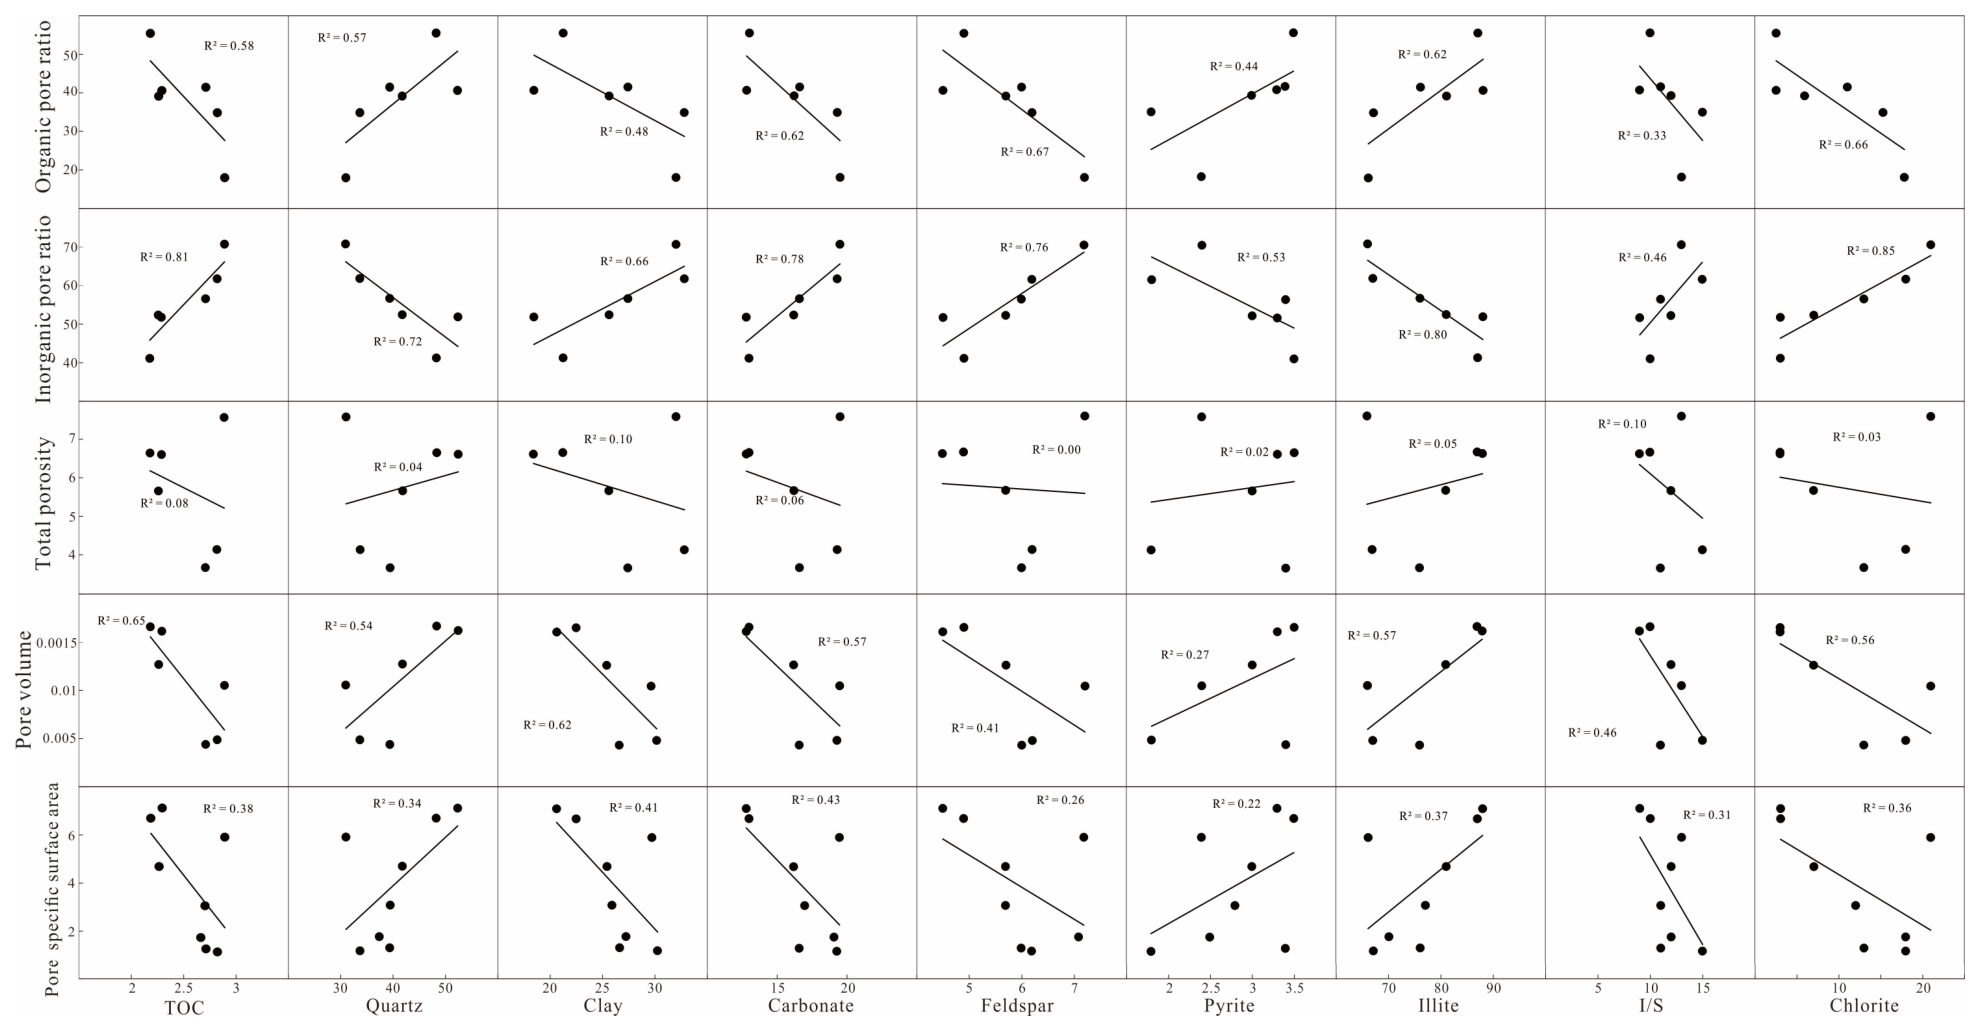
The TOC value exhibits a significant negative correlation with both the proportion of organic pores and various pore structure parameters (Figure 12). This phenomenon can be attributed to the consumption of organic matter and the generation of hydrocarbons during thermal maturation, which directly promotes the development of organic porosity. When retained hydrocarbons are cracked, they release inorganic pores that were previously filled. Organic acids enhance diagenesis, and these processes increase pore structure parameters (SSA and PV). The quartz content shows a positive correlation with the organic pore proportion and pore structure parameters (Figure 12). The framework of quartz effectively resists overlying pressure, preserving primary pores. It can be observed that abundant intergranular pores are preserved between authigenic microcrystalline quartz particles (Figure 8l). In the later stages, most of these primary pores are filled by retained hydrocarbons. During the high-maturity stage, the cracking of retained hydrocarbons generates a large number of organic pores and releases primary pores that were previously filled. Additionally, the formation of microcrystalline quartz is related to mineral transformation processes. The intensity of mineral conversion is associated with the concentration of H+ in the diagenetic environment. Illite content correlates positively with pore structure parameters, pointing to the fact that clay mineral transformation facilitates pore genesis. The contents of carbonate minerals, feldspar, and clay show a positive correlation with the proportion of inorganic pores (Figure 12), reflecting the primary carriers of inorganic pores. The pyrite content shows a weak positive correlation with pore structure parameters. This may be related to pyrite’s catalytic effect on hydrocarbon generation or its ability to resist compaction. Unstable clay minerals (chlorite and I/S) and feldspar, as raw materials for diagenesis, eventually transform into illite. This process is favorable for pore formation, and thus the content of these minerals shows a strong negative correlation with pore structure parameters.
In summary, on one hand, hydrocarbon generation from organic matter and mineral transformation processes can generate abundant secondary pores; on the other hand, the fluid overpressure effect developed during hydrocarbon generation, together with the rigid mineral framework formed by silica release during mineral transformation, jointly resists compaction and allows pores to be well preserved. At the same time, silica released during clay mineral transformation forms authigenic quartz, which can enhance shale brittleness—this is favorable for hydraulic fracturing operations. In addition, a favorable pore structure (with well-developed organic pores, large pore size, and high pore connectivity) can effectively enhance gas-water displacement capacity and alleviate water blocking after hydraulic fracturing, which is beneficial for shale gas production [48,49,50].

4.3.5. Pore Evolution Model in Marine Shale

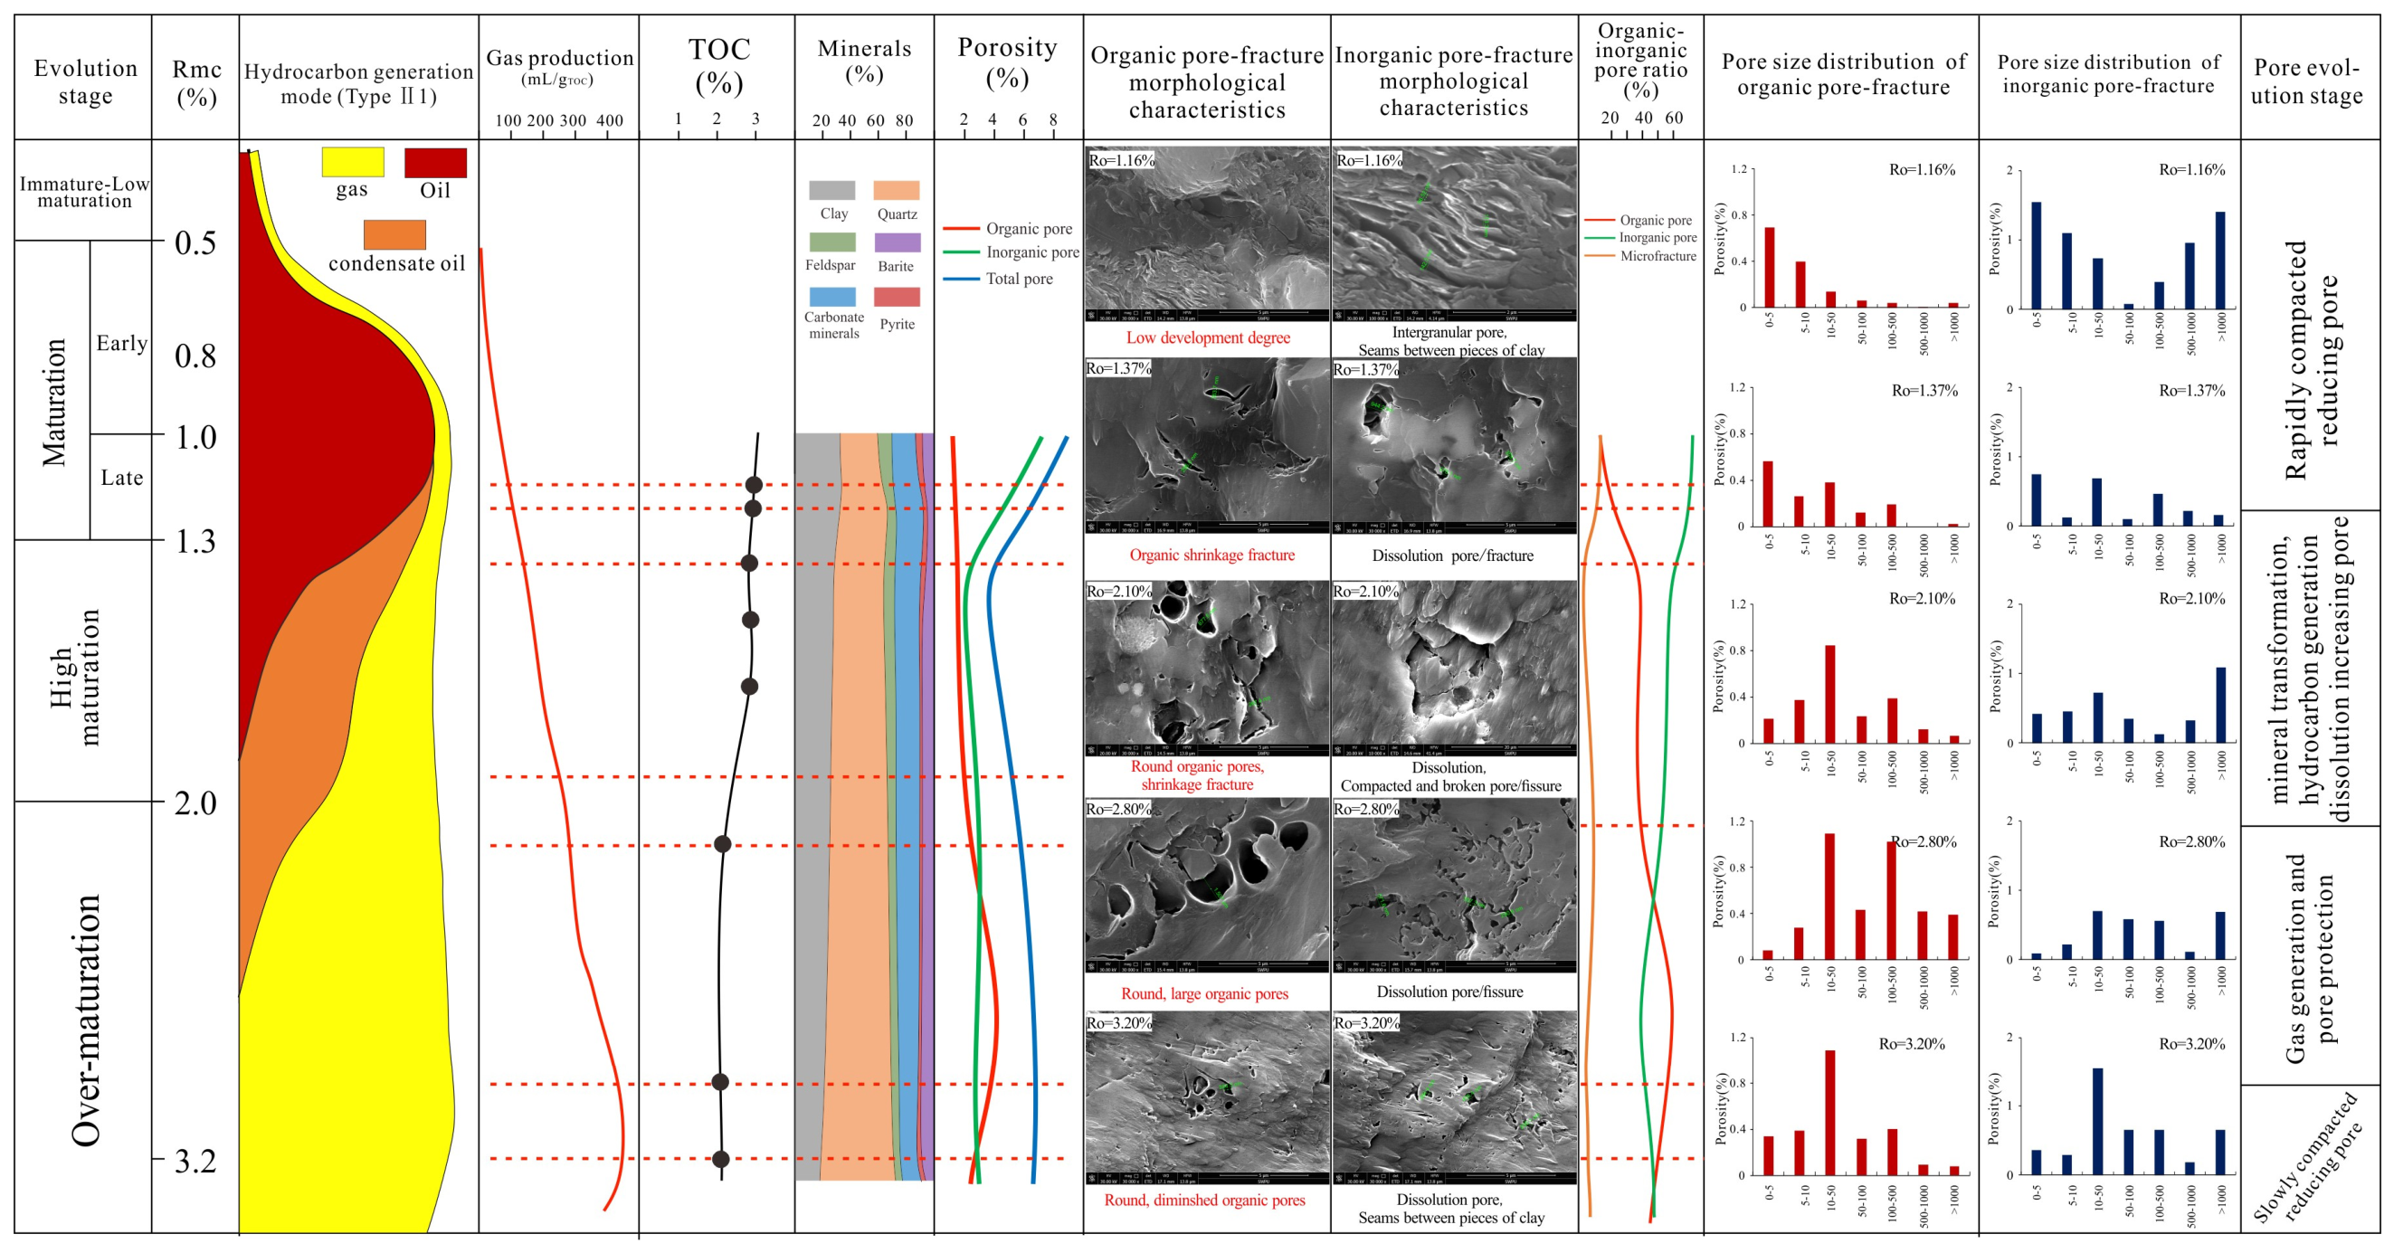
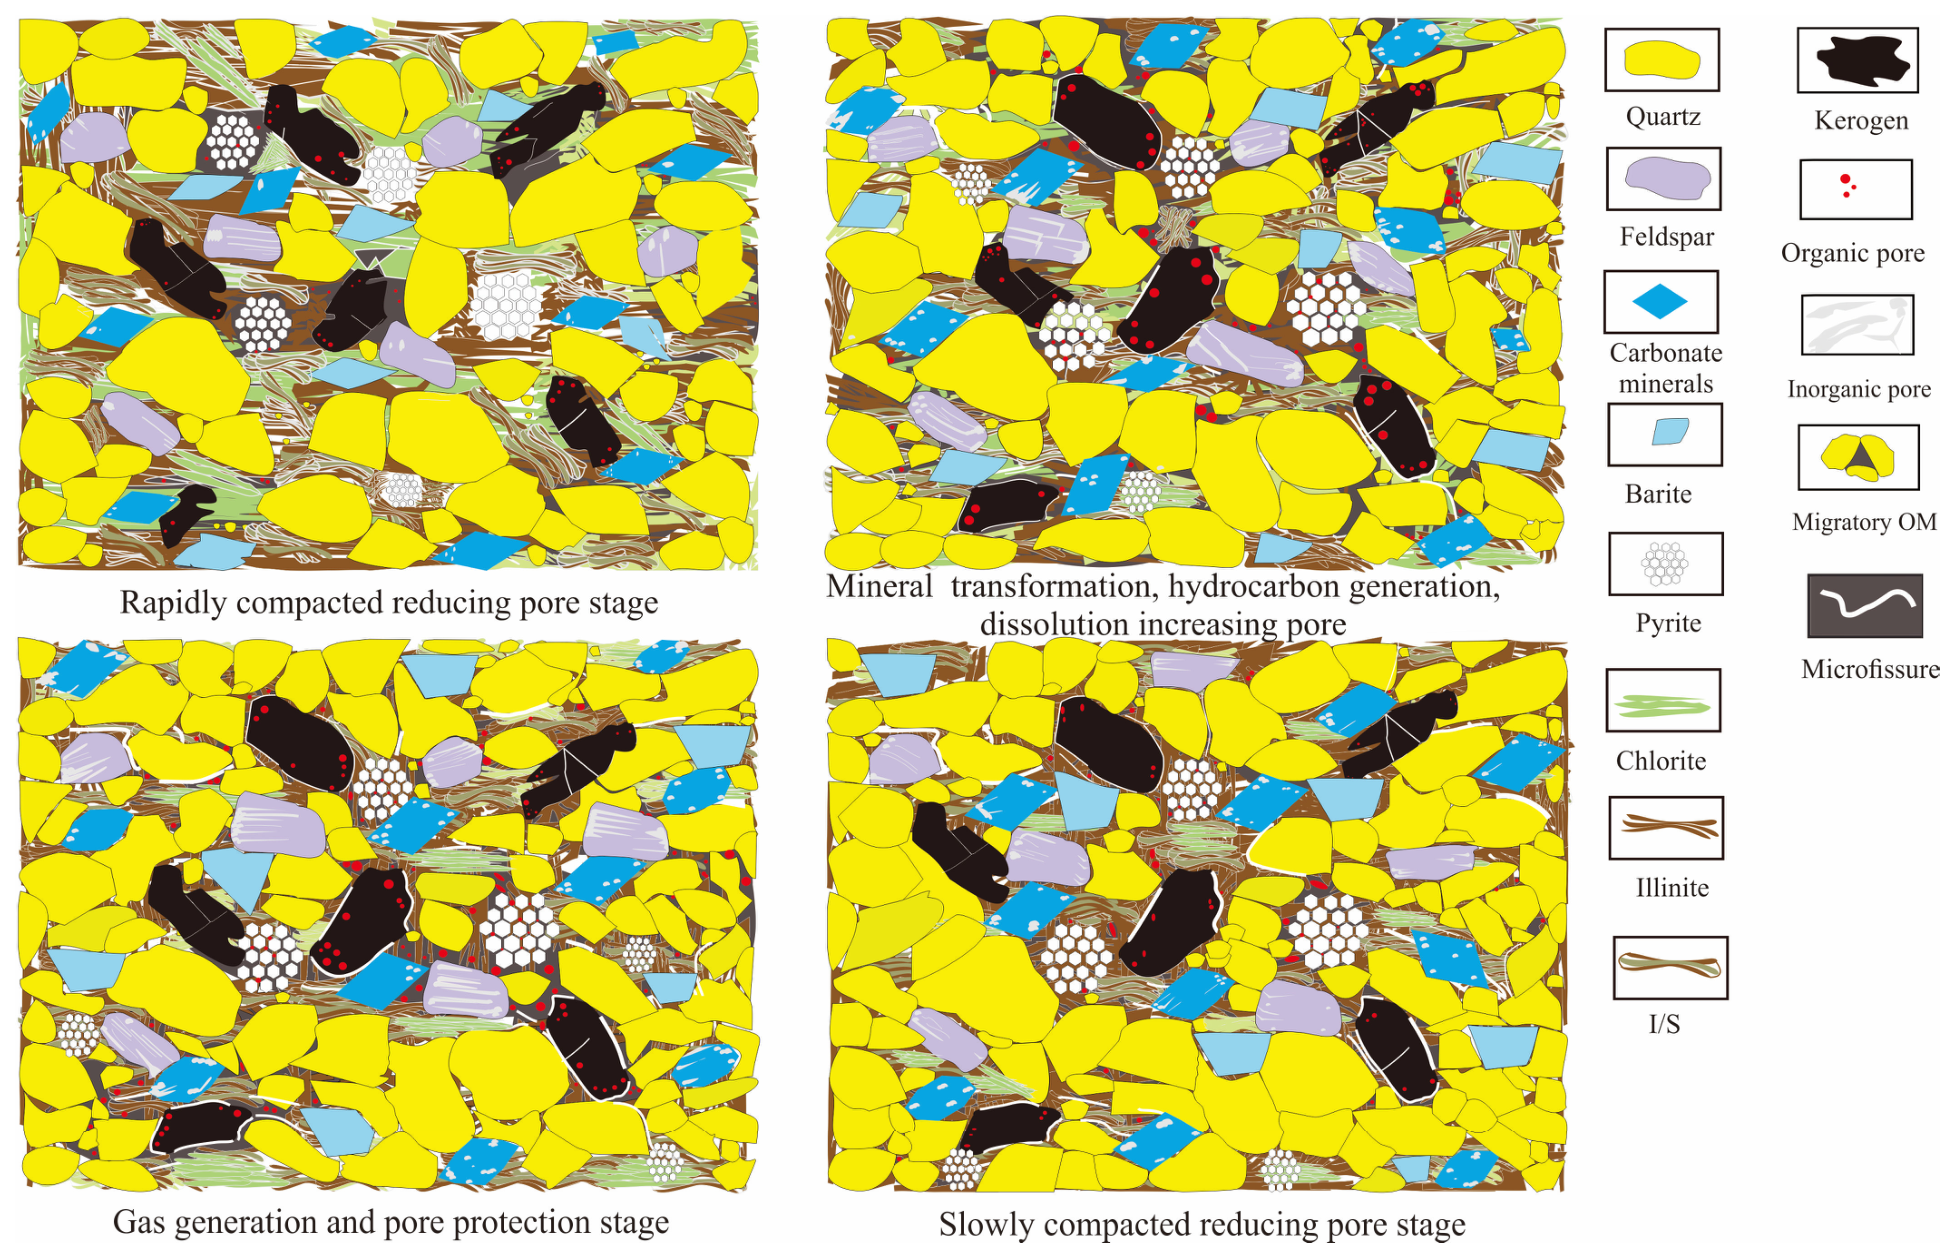
A comprehensive pore evolution model for marine shale has been developed by incorporating organic matter thermal evolution, mineral composition, diagenesis, and pore structure development (Figure 13 and Figure 14).
The first stage is characterized by pore reduction dominated by intense compaction (Rmc < 1.21%): Before organic matter reaches maturity, compaction results in tightly packed mineral and organic matter deposits. The number and size of pores rapidly decrease, with residual intergranular pores emerging as the dominant type [51]. As the organic matter matures, the volume of kerogen shrinks, leading to the development of small pores and microfractures along the surfaces and margins of the organic matter. The proportion of organic pores gradually increases. However, due to the filling effect of retained hydrocarbons and ongoing compaction, the overall pore size continues to decrease during this stage. A decreasing trend is observed in both pore volume (PV) and specific surface area (SSA) for the majority of pores, particularly for pores smaller than 20 nm.
The second stage is dominated by pore expansion driven by mineral transformation and dissolution (Rmc = 1.21–2.1%): Increasing thermal maturity leads to the gradual cracking of kerogen and retained hydrocarbons, converting them into light oil and wet gas. On one hand, blocked pores are gradually released. On the other hand, nanoscale organic pores continue to form in solid bitumen. The proportion of organic pores continues to increase. The organic acids released by kerogen also promote dissolution and the transformation of clay minerals, particularly enhancing the conversion of clay minerals into illite. The number of inorganic pores gradually increases. The share of pores falling within the 5–20 nm interval rises markedly.
The third stage is the pore preservation phase during continuous natural gas generation (Rmc = 2.1–3.0%): During this stage, the cracking of alkyl side chains in kerogen generates methane, ethane, and propane. Subsequently, any remaining hydrocarbons and wet gas become completely cracked to methane. This process leads to the formation of abundant spherical organic pores, with diameters extending to the micron scale, while the share of organic pores peaks simultaneously. Additionally, most metastable clay minerals transform into illite, and both the abundance of inorganic pores and the frequency of microfractures show a progressive rise. The continuous formation of natural gas maintains pore pressure, preserving both the number and morphology of the pores. The impact of compaction is minimal. After a rapid increase in pore size, it gradually stabilizes, with a noticeable increase in pores ranging from 5 to 60 nm.
The fourth stage is characterized by pore reduction, mainly driven by weak compaction (Rmc > 3.0%): The thermal evolution of organic matter largely reflects the methanation of kerogen. Under the influence of compaction, both the porosity and PV of marine shale slightly decrease.

5. Conclusions

(1)
The hydrocarbon generation pattern of medium-maturity marine shale is divided into three stages: the mature stage (Rmc < 1.3%), the high maturity stage (1.0% < Rmc < 2.0%), and the overmature stage (Rmc > 2.0%). The production of ethane to pentane reaches its peak when Ro = 1.8%. The maximum methane yield is 362.58 mL/g.
(2)
With advancing thermal maturation, quartz content increases from 31.0% to 52.4%, displaying a clear upward trajectory. In contrast, clay minerals, feldspar, and carbonates all decrease in content. The proportion of illite in clay minerals continuously increases, rising from 66.0% to 88.0%. The proportion of chlorite and illite-smectite mixed layers gradually decreases. Organic matter evolution is largely recorded by the profusion of organic pores on kerogen and solid bitumen surfaces, as well as by microfractures along the organic matter–matrix interface. The proportion of organic pores reaches its maximum at Rmc = 2.8%. Inorganic diagenesis features compaction, dissolution, and clay mineral transformation as its main processes. In the high maturity stage, compaction effects are weak, while dissolution and clay mineral transformation significantly increase the number of inorganic pores.
(3)
As the thermal maturity increases, pore evolution is observed in four stages: “slow decrease,” “rapid increase,” “relatively stable,” and “slow decrease.” Both pore volume (PV) and specific surface area (SSA) exhibit a trend of first decreasing and then increasing. PV reaches its peak in the late overmature stage and then decreases slowly. In the whole evolution process, PV is mainly contributed by pores of 5–20 nm and 20–60 nm. SSA is mainly contributed by pores of <5 nm and 5–20 nm.
(4)
The pore evolution of medium-maturity marine shale can be divided into four stages. The first stage is characterized by pore reduction dominated by intense compaction. The second stage is dominated by pore expansion driven by mineral transformation and dissolution. The third stage is the pore preservation stage, during which continuous natural gas generation occurs. The fourth stage is characterized by pore reduction, mainly driven by weak compaction.

Author Contributions

X.Y.: Conceptualization, Investigation, Methodology, Writing—original draft. Y.G.: Conceptualization, Investigation, Methodology, Writing—review & editing. Y.L.: Project administration, Resources, Writing—review & editing. Z.W.: Methodology, Supervision, Visualization, Writing—original draft. X.F.: Conceptualization, Data curation, Formal analysis, Writing—original draft. Y.J.: Investigation, Project administration, Supervision, Writing—review & editing. All authors have read and agreed to the published version of the manuscript.

Funding

This study was sponsored by the National Natural Science Foundation of China (Grant No. 42272171) and National Natural Science Foundation of China (Grant No. 42302166).

Data Availability Statement

The original contributions presented in the study are included in the article; further inquiries can be directed to the corresponding author.

Acknowledgments

The authors would like to thank Hairuo Qing for linguistic assistance during the preparation of this manuscript.

Conflicts of Interest

Yuegang Li was employed by Chongqing Shale Gas Exploration and Development Co., Ltd. The remaining authors declare that the research was conducted in the absence of any commercial or financial relationships that could be construed as a potential conflict of interest.

References

  1. Zou, Z.; Fu, J.; Li, H.; Liu, Y.; Zhang, C.; Xia, Z.; Fan, C. Controlling factors for shale gas enrichment and their implications for favorable exploration areas: Insights from the Wufeng–Longmaxi Formations, Southern Sichuan, China. PLoS ONE 2025, 20, e0323277. [Google Scholar] [CrossRef] [Scilit] [PubMed]
  2. Deng, B.; Liu, S.G.; Yao, G.S.; Liao, Y.; Zhang, B.J.; Zhang, H. Distribution pattern and main controlling factors of Paleozoic giant- and medium-sized gas fields of the Sichuan super gas basin in Southwest China. Nat. Gas Ind. 2024, 44, 54–76. (In Chinese) [Google Scholar]
  3. Guo, X.; Hu, Z.; Li, S.; Zheng, L.; Zhu, D.; Liu, J.; Shen, B.; Du, W.; Yu, L.; Liu, Z.; et al. Progress and prospect of natural gas exploration and research in deep and ultra-deep strata. Pet. Sci. Bull. 2023, 8, 461–474. [Google Scholar]
  4. Zou, C.; Qiu, Z.; Zhang, J.; Li, Z.; Wei, H.; Liu, B.; Zhao, J.; Yang, T.; Zhu, S.; Tao, H.; et al. Unconventional Petroleum Sedimentology: A Key to Understanding Unconventional Hydrocarbon Accumulation. Engineering 2022, 18, 62–78. [Google Scholar] [CrossRef] [Scilit]
  5. Feng, Y.; Xiao, X.-M.; Wang, E.-Z.; Gao, P.; Lu, C.-G.; Li, G. Gas storage in shale pore system: A review of the mechanism, control and assessment. Pet. Sci. 2023, 20, 2605–2636. [Google Scholar] [CrossRef] [Scilit]
  6. Hao, F.; Zou, H.; Lu, Y. Mechanisms of shale gas storage: Implications for shale gas exploration in China. AAPG Bull. 2013, 97, 1325–1346. [Google Scholar] [CrossRef] [Scilit]
  7. Guo, X.; Wang, R.; Shen, B.; Wang, G.; Wan, C.; Wang, Q. Geological characteristics, resource potential, and development direction of shale gas in China. Pet. Explor. Dev. 2025, 52, 17–32. [Google Scholar] [CrossRef] [Scilit]
  8. Tenger, B.; Qiu, N.; Yu, L.; Guo, T.; Feng, Q.; Shen, B.; Lu, L.; Zeng, W.; Li, H.; Chen, W.; et al. Differential preservation mechanisms of marine shale gas under varying burial conditions in southern China. Acta Geol. Sin. 2024, 98, 3285–3301. [Google Scholar]
  9. Shan, C.; Shi, Y.; Liang, X.; Zhang, L.; Wang, G.; Jiang, L.; Zou, C.; He, F.; Mei, J. Diagenetic characteristics and microscopic pore evolution of deep shale gas reservoirs in Longmaxi Formation, Southeastern Sichuan basin, China. Unconv. Resour. 2024, 4, 100090. [Google Scholar] [CrossRef] [Scilit]
  10. Xiang, M.; Xu, S.; Wen, Y.-R.; Gou, Q.-Y.; Liu, B.-C. Influence of tectonic preservation conditions on the nanopore structure of shale reservoir: A case study of Wufeng-Longmaxi Formation shale in western Hubei area, south China. Pet. Sci. 2024, 21, 2203–2217. [Google Scholar] [CrossRef] [Scilit]
  11. Guo, S.; Mao, W. Division of diagenesis and pore evolution of a Permian Shanxi shale in the Ordos Basin, China. J. Pet. Sci. Eng. 2019, 182, 106351. [Google Scholar] [CrossRef] [Scilit]
  12. Wang, J.; Guo, S. Study on the relationship between hydrocarbon generation and pore evolution in continental shale from the Ordos Basin, China. Pet. Sci. 2021, 18, 1305–1322. [Google Scholar] [CrossRef] [Scilit]
  13. Lu, C.; Xiao, X.; Gai, H.; Feng, Y.; Li, G.; Meng, G.; Gao, P. Nanopore structure characteristics and evolution of type III kerogen in marine-continental transitional shales from the Qinshui basin, northern China. Geoenergy Sci. Eng. 2023, 221, 211412. [Google Scholar] [CrossRef] [Scilit]
  14. Xu, L.; Yang, K.; Zhang, L.; Liu, L.; Jiang, Z.; Li, X. Organic-induced nanoscale pore structure and adsorption capacity variability during artificial thermal maturation: Pyrolysis study of the Mesoproterozoic Xiamaling marine shale from Zhangjiakou, Hebei, China. J. Pet. Sci. Eng. 2021, 202, 108502. [Google Scholar] [CrossRef] [Scilit]
  15. Wang, Y.; Cheng, H.; Hu, Q.; Liu, L.; Hao, L. Diagenesis and pore evolution for various lithofacies of the Wufeng-Longmaxi shale, southern Sichuan Basin, China. Mar. Pet. Geol. 2021, 133, 105251. [Google Scholar] [CrossRef] [Scilit]
  16. Liu, D.; Yao, Y.; Chang, Y. Measurement of adsorption phase densities with respect to different pressure: Potential application for determination of free and adsorbed methane in coalbed methane reservoir. Chem. Eng. J. 2022, 446, 137103. [Google Scholar] [CrossRef] [Scilit]
  17. Liu, D.; Zhao, Z.; Cai, Y.; Sun, F. Characterizing coal gas reservoirs: A multiparametric evaluation based on geological and geophysical methods. Gondwana Res. 2024, 133, 91–107. [Google Scholar] [CrossRef] [Scilit]
  18. Liu, D.; Qiu, F.; Liu, N.; Cai, Y.; Guo, Y.; Zhao, B.; Qiu, Y. Pore structure characterization and its significance for gas adsorption in coals: A comprehensive review. Unconv. Resour. 2022, 2, 139–157. [Google Scholar] [CrossRef] [Scilit]
  19. Wang, F.; Guo, S. Influential factors and model of shale pore evolution: A case study of a continental shale from the Ordos Basin. Mar. Pet. Geol. 2019, 102, 271–282. [Google Scholar] [CrossRef] [Scilit]
  20. Teng, J.; Deng, H.; Liu, B.; Chen, W.; Fu, M.; Xia, Y.; Yu, H. Insights of the pore system of lacustrine shales from immature to late mature with the aid of petrology, mineralogy and porosimetry: A case study of the Triassic Yanchang Formation of the Ordos Basin, North China. J. Pet. Sci. Eng. 2021, 196, 107631. [Google Scholar] [CrossRef] [Scilit]
  21. Cao, T.; Deng, M.; Cao, Q.; Huang, Y.; Yu, Y.; Cao, X. Pore formation and evolution of organic-rich shale during the entire hydrocarbon generation process: Examination of artificially and naturally matured samples. J. Nat. Gas Sci. Eng. 2021, 93, 104020. [Google Scholar] [CrossRef] [Scilit]
  22. Liu, B.; Mohammadi, M.-R.; Ma, Z.; Bai, L.; Wang, L.; Xu, Y.; Hemmati-Sarapardeh, A.; Ostadhassan, M. Pore structure characterization of solvent extracted shale containing kerogen type III during artificial maturation: Experiments and tree-based machine learning modeling. Energy 2023, 283, 128885. [Google Scholar] [CrossRef] [Scilit]
  23. Xu, L.; Yang, K.; Wei, H.; Liu, L.; Li, X.; Chen, L.; Xu, T.; Wang, X. Diagenetic evolution sequence and pore evolution model of Mesoproterozoic Xiamaling organic-rich shale in Zhangjiakou, Hebei, based on pyrolysis simulation experiments. Mar. Pet. Geol. 2021, 132, 105233. [Google Scholar] [CrossRef] [Scilit]
  24. Shi, X.; Wu, W.; Xu, L.; Yin, Y.; Yang, Y.; Liu, J.; Yang, X.; Li, Y.; Wu, Q.; Zhong, K.; et al. Thermal Maturity Constraint Effect and Development Model of Shale Pore Structure: A Case Study of Longmaxi Formation Shale in Southern Sichuan Basin, China. Minerals 2024, 14, 163. [Google Scholar] [CrossRef] [Scilit]
  25. Wu, J.; Li, H.; Yang, X.; Zhao, S.; Guo, W.; Sun, Y.; Liu, Y.; Liu, Z. Types and combinations of deep marine shale laminae and their effects on reservoir quality: A case study of the first submember of Member 1 of Longmaxi Formation in Luzhou block, south Sichuan Basin. Acta Pet. Sin. 2023, 44, 1517–1531. [Google Scholar]
  26. Wang, X.; Zhang, K.; Jiang, Z.; Lin, Y.; Song, Y.; Jia, C.; Jiang, S.; Jiang, L.; Niu, H.; Li, J.; et al. Hydrocarbon generation and pore evolution in marine organic-rich shales across maturation stages. Fuel 2025, 402, 136050. [Google Scholar] [CrossRef] [Scilit]
  27. Wang, Z.; Yang, X.; Guo, S. Evolution of Pore Spaces in Marine Organic-Rich Shale: Insights from Multi-Scale Analysis of a Permian–Pennsylvanian Sample. Minerals 2024, 14, 392. [Google Scholar] [CrossRef] [Scilit]
  28. Wang, H.; Shi, Z.; Zhou, T.; Zhao, Q.; Sun, S.; Qi, L.; Liang, P. Types and characteristics of sweet spots of marine black shale and significance for shale gas exploration: A case study of Wufeng–Longmaxi in southern Sichuan Basin. Nat. Gas Ind. 2023, 43, 1–13. (In Chinese) [Google Scholar]
  29. Jiang, P.; Wu, J.; Zhu, Y.; Zhang, D.; Wu, W.; Zhang, R.; Wu, Z.; Wang, Q.; Yang, Y.; Yang, X.; et al. Enrichment conditions and favorable areas for exploration and development of marine shale gas in Sichuan Basin. Acta Pet. Sin. 2023, 44, 91–109. [Google Scholar]
  30. Wang, Y.; Qiu, N.; Yang, Y.; Rui, X.; Zhou, Y.Y.; Fang, G.J.; Wu, H.; Shen, B.; Cheng, L.; Tenger. Thermal Maturity of Wufeng-Longmaxi Shale in Sichuan Basin. Earth Sci. 2019, 44, 953–971. [Google Scholar]
  31. Liu, D.; Xiao, X.; Tian, H.; Min, Y.; Zhou, Q.; Cheng, P.; Shen, J. Sample maturation calculated using Raman spectroscopic parameters for solid organics: Methodology and geological applications. Chin. Sci. Bull. 2013, 58, 1228–1241. [Google Scholar] [CrossRef] [Scilit]
  32. Li, J.; Ma, W.; Wang, Y.; Wang, D.; Xie, Z.; Li, Z.; Ma, C. Modeling of the whole hydrocarbon-generating process of sapropelic source rock. Pet. Explor. Dev. 2018, 45, 445–454. [Google Scholar] [CrossRef] [Scilit]
  33. El Nady, M.M.; Ramadan, F.S.; Hammad, M.M.; Lotfy, N.M. Evaluation of organic matters, hydrocarbon potential and thermal maturity of source rocks based on geochemical and statistical methods: Case study of source rocks in Ras Gharib oilfield, central Gulf of Suez, Egypt. Egypt. J. Pet. 2015, 24, 203–211. [Google Scholar] [CrossRef] [Scilit]
  34. Mukhopadhyay, P.; Wade, J.; Kruge, M. Organic facies and maturation of Jurassic/Cretaceous rocks, and possible oil-source rock correlation based on pyrolysis of asphaltenes, Scotian Basin, Canada. Org. Geochem. 1994, 22, 85–104. [Google Scholar] [CrossRef]
  35. Ma, Z.; Zheng, L.; Li, Z. The Thermocompression Simulation Experiment of Source Rock Hydrocarbon Generation and Expulsion in Formation Porosity. Acta Sedimentol. Sin. 2012, 30, 955–963. [Google Scholar]
  36. Fan, Q.; Cheng, P.; Xiao, X.; Gai, H.; Zhou, Q.; Li, T.; Gao, P. Evolutions of Oil Generation and Expulsion of Marine-Terrestrial Transitional Shales: Implications From a Pyrolysis Experiment on Water-Saturated Shale Plunger Samples. Front. Earth Sci. 2021, 9, 786667. [Google Scholar] [CrossRef] [Scilit]
  37. Wang, Z.; Jiang, Y.; Fu, Y. Characterization of Pore Structure and Heterogeneity of Shale Reservoir from Wufeng Formation-Sublayers Long-11 in Western Chongqing Based on Nuclear Magnetic Resonance. Earth Sci. 2022, 47, 490–504. (In Chinese) [Google Scholar]
  38. He, Q.; Chen, S.; Li, S.; Guo, B.; Lu, J.; Li, Y.; Li, X.; Zhao, L.; Ma, Z. Organic geochemical characteristics and hydrocarbon generation mechanism of marine-continental transitional organic-rich shale: A case study from the Shanxi formation in the eastern margin of the Ordos Basin. J. Pet. Sci. Eng. 2022, 219, 111116. [Google Scholar] [CrossRef] [Scilit]
  39. Song, D.; Wang, X.; Tuo, J.; Wu, C.; Zhang, M.; Su, L.; He, W. A comprehensive study on the impacts of rock fabric on hydrocarbon generation and pore structure evolution of shale under semi-confined condition. Mar. Pet. Geol. 2021, 124, 104830. [Google Scholar] [CrossRef] [Scilit]
  40. Ma, Z.; Shen, B.; Pan, A.; Borjigin, T.; Ning, C.; Zhang, L. Origin and carbon isotope reversal of shale gas in Wufeng-Longmaxi formations, Sichuan Basin: Implication from pyrolysis experiments. Pet. Geol. Exp. 2020, 42, 428–433. (In Chinese) [Google Scholar]
  41. Milliken, K.; Ergene, S.; Ozkan, A. Quartz types, authigenic and detrital, in the Upper cretaceous Eagle Ford Formation, South Texas, USA. Sediment. Geol. 2016, 339, 273–288. [Google Scholar] [CrossRef] [Scilit]
  42. Ye, Y.; Tang, S.; Xi, Z.; Jiang, D.; Duan, Y. Quartz types in the Wufeng-Longmaxi Formations in southern China: Implications for porosity evolution and shale brittleness. Mar. Pet. Geol. 2022, 137, 105479. [Google Scholar] [CrossRef] [Scilit]
  43. Cheng, B.; Li, S.; Xu, J.; Liao, Z. Gaseous hydrocarbons cracking in shale: Mechanism, impact and resource significance. Earth-Sci. Rev. 2025, 270, 105211. [Google Scholar] [CrossRef] [Scilit]
  44. Milliken, K.L.; Rudnicki, M.; Awwiller, D.N.; Zhang, T.W. Organic matter-hosted pore system, Marcellus Formation (Devonian), Pennsylvania. AAPG Bull. 2013, 97, 177–200. [Google Scholar] [CrossRef] [Scilit]
  45. Wei, S.; He, S.; Pan, Z.; Zhai, G.; Dong, T.; Guo, X.; Yang, R.; Han, Y.; Yang, W. Characteristics and evolution of pyrobitumen-hosted pores of the overmature Lower Cambrian Shuijingtuo Shale in the south of Huangling anticline, Yichang area, China: Evidence from FE-SEM petrography. Mar. Pet. Geol. 2020, 116, 104303. [Google Scholar] [CrossRef] [Scilit]
  46. Zhou, B. The Applications of NMR Relaxometry, NMR Cryoporometry, and FFC NMR to Nanoporous Structures and Dynamics in Shale at Low Magnetic Fields. Energy Fuels 2018, 32, 8897–8904. [Google Scholar] [CrossRef] [Scilit]
  47. Arif, M.; Zhang, Y.; Iglauer, S. Shale Wettability: Data Sets, Challenges, and Outlook. Energy Fuels 2021, 35, 2965–2980. [Google Scholar] [CrossRef] [Scilit]
  48. Tian, L.; Zhang, Q.; Li, X.; Li, C. Fracturing Effectiveness Evaluation Based on Flowback Data Using Pressure Transient Testing. Reserv. Sci. 2026, 2, 97–110. [Google Scholar] [CrossRef] [Scilit]
  49. Hu, Y.; Yang, Y. A Comparative Study on Drag Reduction Methods for Continental Shale Drilling in the Fuxing Block, Southeastern Sichuan Basin. Reserv. Sci. 2026, 2, 81–96. [Google Scholar] [CrossRef] [Scilit]
  50. Ali, J.; Ansari, U.; Ali, F.; Javed, T.; Hullio, I.A. Application of Machine Learning for Effective Screening of Enhanced Oil Recovery Methods. Reserv. Sci. 2026, 2, 65–80. [Google Scholar] [CrossRef] [Scilit]
  51. Wang, G.; Jin, Z.; Zhang, Q.; Zhu, R.; Tang, X.; Liu, K.; Dong, L. Effects of clay minerals and organic matter on pore evolution of the early mature lacustrine shale in the Ordos Basin, China. J. Asian Earth Sci. 2023, 246, 105516. [Google Scholar] [CrossRef] [Scilit]
Figure 1. Thickness of Longmaxi Formation marine shale. Location map of Miaoba outcrop (modified from [30]).
Geosciences 16 00163 g001
Figure 2. Geochemical characteristics of outcrop samples. (a) The cross-plot of TOC versus (S1 + S2) shows the hydrocarbon generation potential of the samples. (b) The cross-plot of HI versus Tmax shows the kerogen types of the samples. (c) The relationship between maturity and temperature of the simulate sample.
Geosciences 16 00163 g002
Figure 3. High-temperature and high-pressure diagenetic maturation system of Southwest Petroleum University. Experimental instruments and their control panels (a) and Schematic diagram of the reaction vessel structure (b).
Geosciences 16 00163 g003
Figure 4. Yields of gaseous hydrocarbon (CH4 and C2–5) of different kerogen (a) and total rock (b).
Geosciences 16 00163 g004
Figure 5. Evolution model of hydrocarbon generation and yields of gaseous hydrocarbon of marine facies shales in Longmaxi Formation.
Geosciences 16 00163 g005
Figure 6. Bulk rock (a) and clay mineral (b) compositions of maturation samples versus maturity.
Geosciences 16 00163 g006
Figure 7. Development characteristics of organic pores in simulated samples. Initial sample, Rmc = 1.16% (a), artificial maturation temperature T = 415 °C, Rmc = 1.21% (b) artificial maturation temperature T = 440 °C, Rmc = 1.37% (c), artificial maturation temperature T = 465 °C, Rmc = 1.52% (d), artificial maturation temperature T = 520 °C, Rmc = 2.10% (e), artificial maturation temperature T = 580 °C, Rmc = 2.80% (f), and artificial maturation temperature T = 600 °C, Rmc = 3.20% (g,h).
Geosciences 16 00163 g007
Figure 8. Development characteristics of inorganic pores in simulated samples. Initial sample, Rmc = 1.16% (a,b), artificial maturation temperature T = 440 °C, Rmc = 1.37% (c,d), artificial maturation temperature T = 465 °C, Rmc = 1.52% (e,f), artificial maturation temperature T = 520 °C, Rmc = 2.10% (gi), and artificial maturation temperature T = 580 °C, Rmc = 2.80% (jl).
Geosciences 16 00163 g008
Figure 9. Nuclear magnetic resonance experimental procedures.
Geosciences 16 00163 g009
Figure 10. NMR T2 spectra of saturated oil (a), water (b), and Mn2+ (c) fluid solutions. Evolution characteristics of porosity (d) and proportion (e) of different types of pores. (f) Evolution of total porosity.
Geosciences 16 00163 g010
Figure 11. Variation characteristics of total pore size PV distribution (a), different pore size PV distribution (b) and proportion (c), total pore size SSA distribution (d), and different pore size SSA distribution (e) and proportion (f), of simulated samples.
Geosciences 16 00163 g011
Figure 12. Matrix crossplot between mineral composition, TOC and pore structure parameters and porosity.
Geosciences 16 00163 g012
Figure 13. Comprehensive model diagram of organic matter hydrocarbon generation, diagenesis and pore evolution (The red dashed line in the figure represents the location of the sample points).
Geosciences 16 00163 g013
Figure 14. Reservoir evolution models of marine shale in different pore evolution stages.
Geosciences 16 00163 g014
Table 1. Geochemical characteristics of outcrop samples.
Sample TypeS1
(mg/g)
S2
(mg/g)
Tmax
(°C)
HI
(mg/g TOC)
OI
(mg/g TOC)
TOC
(%)
Rmc
(%)
Initial sample0.362.7147264.997.672.891.16
Table 2. Artificial maturation scheme of kerogen hydrocarbon generation.
Simulated burial depth (m)80010001500200025003000350040004500500055006000
Fluid pressure (MPa)81015202530354045505560
Temperature (°C)311.8335.6359.7383.6408.1432456.2480.3504528.6552.5576.2
Rmc (%)1.141.231.351.531.721.962.222.512.823.063.243.40
Table 3. Artificial maturation scheme of the total rock hydrocarbon generation.
Simulated burial depth (m)150020002500300035003500400050006000
Fluid pressure (MPa)152025303535405060
Temperature (°C)420450480.2500.2530.1560610610610
Rmc (%)1.471.892.152.582.652.763.003.253.34
Table 4. Artificial maturation scheme of diagenetic maturation experiment.
SampleSimulated Burial Depth (m)Static Rock Pressure (Mpa)Heating Rate (°C/min)Temperature (°C)Holding Time (h)Rmc (%)
Initial sample/////1.16
Sample 12000503415721.21
Sample 23000753440841.37
Sample 3350087.53465841.52
Sample 43800953490961.7
Sample 542001053520842.1
Sample 6480012035801682.8
Sample 7500012536002403.2
Table 5. Artificial maturation scheme of the rock hydrocarbon generation.
Sample No.Rmc
(%)
TOC
(%)
Mineral Composition (%)Clay Mineral Composition (%)
QuartzFeldsparCarbonatePyriteClayIlliteChloriteI/S
01.162.89317.219.52.432662113
11.212.8233.76.219.31.832.8671815
21.372.6637.47.119.12.528.3701812
31.522.7139.4616.63.427.4761311
41.72.739.55.7172.826.3771211
52.12.2941.85.716.2325.681712
72.82.1848.34.9133.521.287310
83.22.2652.44.512.83.318.48839
Table 6. The porosity data statistics of NMR calculation.
Rmc (%)1.161.211.522.12.83.2
Organic pore (%)1.371.451.532.233.712.7
Inorganic pore (%)5.372.562.082.972.743.43
Microfracture (%)0.860.140.070.480.220.5
Total reservoir space (%)7.64.153.685.686.676.63
Table 7. The characteristics of pore structure parameters of simulated samples.
Rmc
(%)
Pore Volume (cm3/g)Specific Surface Area (m2/g)
<5 nm5–20 nm20–60 nm60–120 nm120–500 nm>500 nmTotal<5 nm5–20 nm20–60 nm60–120 nmTotal
1.160.003100.003980.001010.000050.000010.002330.010483.8901.6920.2810.0275.89
1.210.000190.001550.001600.000290.000000.001170.004810.2050.5750.3460.0441.17
1.37 0.1130.9270.6390.0811.76
1.520.000160.001710.001410.000120.000380.000550.004330.1640.6450.4270.0601.30
1.7 1.0351.3110.6320.0883.07
2.10.001100.004770.003560.000340.001110.001770.012651.8431.7590.9740.1054.68
2.80.001440.008140.006130.000200.000390.000280.016582.4052.8261.3020.1386.67
3.20.001030.007230.006850.000360.000180.000470.016122.0413.2161.6260.2027.09
Disclaimer/Publisher’s Note: The statements, opinions and data contained in all publications are solely those of the individual author(s) and contributor(s) and not of MDPI and/or the editor(s). MDPI and/or the editor(s) disclaim responsibility for any injury to people or property resulting from any ideas, methods, instructions or products referred to in the content.