Article

Isotopic and Geochemical Features of High-Hafnium Zircons of the Vasin-Mylk LCT Pegmatite, Kola Peninsula: Compositional Zoning and Crystallization Conditions


by
Ekaterina V. Kovalenko (Levashova)
1,*,
Nikolai M. Kudryashov
2,
Sergey G. Skublov
1,3,
Vladislav G. Kurichev
3 and
Xian-Hua Li
4
1
Institute of Precambrian Geology and Geochronology of the Russian Academy of Sciences, 2 Makarova Embankment, 199034 Saint Petersburg, Russia
2
Geological Institute of the Kola Science Center, Russian Academy of Sciences, 14 Fersmana Street, 184209 Apatity, Russia
3
Geological Exploration Faculty, St. Petersburg Mining University, 2, 21-St Line, 199106 Saint Petersburg, Russia
4
State Key Laboratory of Lithospheric Evolution of the Institute of Geology, Geophysics of the Chinese Academy of Sciences, 19 Beitucheng West Road, Beijing 100029, China
*
Author to whom correspondence should be addressed.
Geosciences 2026, 16(2), 77; https://doi.org/10.3390/geosciences16020077
Submission received: 16 December 2025 / Revised: 7 February 2026 / Accepted: 9 February 2026 / Published: 10 February 2026

Abstract

A comprehensive investigation was conducted on high-hafnium zircons from the LCT (Li-Cs-Ta) pegmatites of the Vasin-Mylk rare-metal deposit within the Fennoscandian Shield. In situ analysis of trace element composition and oxygen isotope ratios were performed using secondary ion mass spectrometry (SIMS), complemented by internal structural examination via scanning electron microscopy (SEM). The research focuses on deciphering compositional zoning within zircon crystals and characterizing their geochemical signatures to constrain crystallization conditions. The study revealed anomalously high concentrations of Hf (up to 381,000 ppm) and Li (up to 152 ppm), paired with extremely low abundances of U (~10 ppm) and total rare earth elements (~35 ppm). Marked geochemical contrasts were identified between the central and rim domains of the zircons. Central zones display well-fractionated rare earth element (REE) patterns featuring positive Ce and negative Eu anomalies, while the high-Hf rims exhibit weakly differentiated spectra with variable Ce anomalies. The identified W-type tetrad effect suggests crystallization from a melt strongly influenced by coexisting fluids. The obtained δ18O values are consistent with a mantle source and suggest crystallization within a system closed to external fluids. The zircons from the Vasin-Mylk deposit crystallized during the transitional period between the late magmatic and early hydrothermal stages of a highly differentiated pegmatite system. These results contribute to a better understanding of ore genesis in LCT pegmatite systems.

1. Introduction

Highly differentiated rare-metal granites and pegmatites, particularly those of the LCT type, represent a significant focus in contemporary geology. The study of these systems is critically important for both fundamental petrology and economic geology, given the strategic significance of trace elements for high-technology and green-energy applications. LCT pegmatites serve as a primary source of Li, Cs, and Ta. Current genetic models most often attribute their formation to either extreme melt [1,2,3] or crustal anatectic via the partial melting of metamorphic protoliths [4]. Consequently, determining their precise formation conditions holds dual significance: it advances fundamental knowledge of granitoid magma evolution while providing a practical basis for developing effective exploration criteria for new rare-metal deposits.
The Vasin-Mylk rare-metal deposit is located within the Archean Kolmozero-Voron’ya greenstone belt of the Fennoscandian Shield, representing a classic example of LCT pegmatites. While key lithium-bearing pegmatites in the northeastern Fennoscandian Shield, such as the Kolmozero and Polmostundra deposits, are well established in the literature [5,6], the Vasin-Mylk deposit has received comparatively less research attention [7,8]. The deposit is composed of spodumene–quartz–albite and lepidolite–pollucite–spodumene–albite pegmatites. The pegmatite bodies display a distinct zonal structure and host a characteristic rare-metal mineral assemblage that includes spodumene, lepidolite, pollucite, and minerals of the columbite group.
Zircon plays a pivotal role in the mineral associations of highly differentiated systems. As a key accessory mineral and geochronometer, the U-Pb dating of zircon enables solutions to diverse geological problems [9]. In addition to its geochronological role, zircon can incorporate various trace elements. While many elements occur in minor amounts (typically <1000 ppm), others—notably Hf, U, Th, Y, and REE—may be enriched to significantly higher concentrations. In zircons from highly evolved rocks, HfO2 content can attain 30–40 wt.% or more, reaching thresholds where high-Hf zircon approaches the composition of hafnon (HfSiO4) [10,11,12]. Such a hafnon was discovered in the zircon rim of the Vasin-Mylk pegmatites [13]. The crystallization of high-Hf zircons indicates an advanced stage of melt evolution, often associated with the influence of volatile-enriched fluids. To understand the formation stages of ore-bearing pegmatites, it is essential to investigate their internal structure, chemical composition, and isotopic-geochemical characteristics. This approach provides insights into both the evolution of magmatic systems and the effects of post-magmatic processes.
This study presents a detailed isotopic-geochemical investigation of high-Hf zircons from the pegmatites of the Vasin-Mylk deposit. The research aims to characterize the distribution of rare and rare earth elements across different zones within zircon crystals, determine their geochemical signatures and oxygen isotope composition, and estimate zircon crystallization temperatures. The resulting data allow for the reconstruction of zircon formation conditions, thereby advancing the understanding of ore-forming processes in LCT pegmatites.

2. Geological Setting

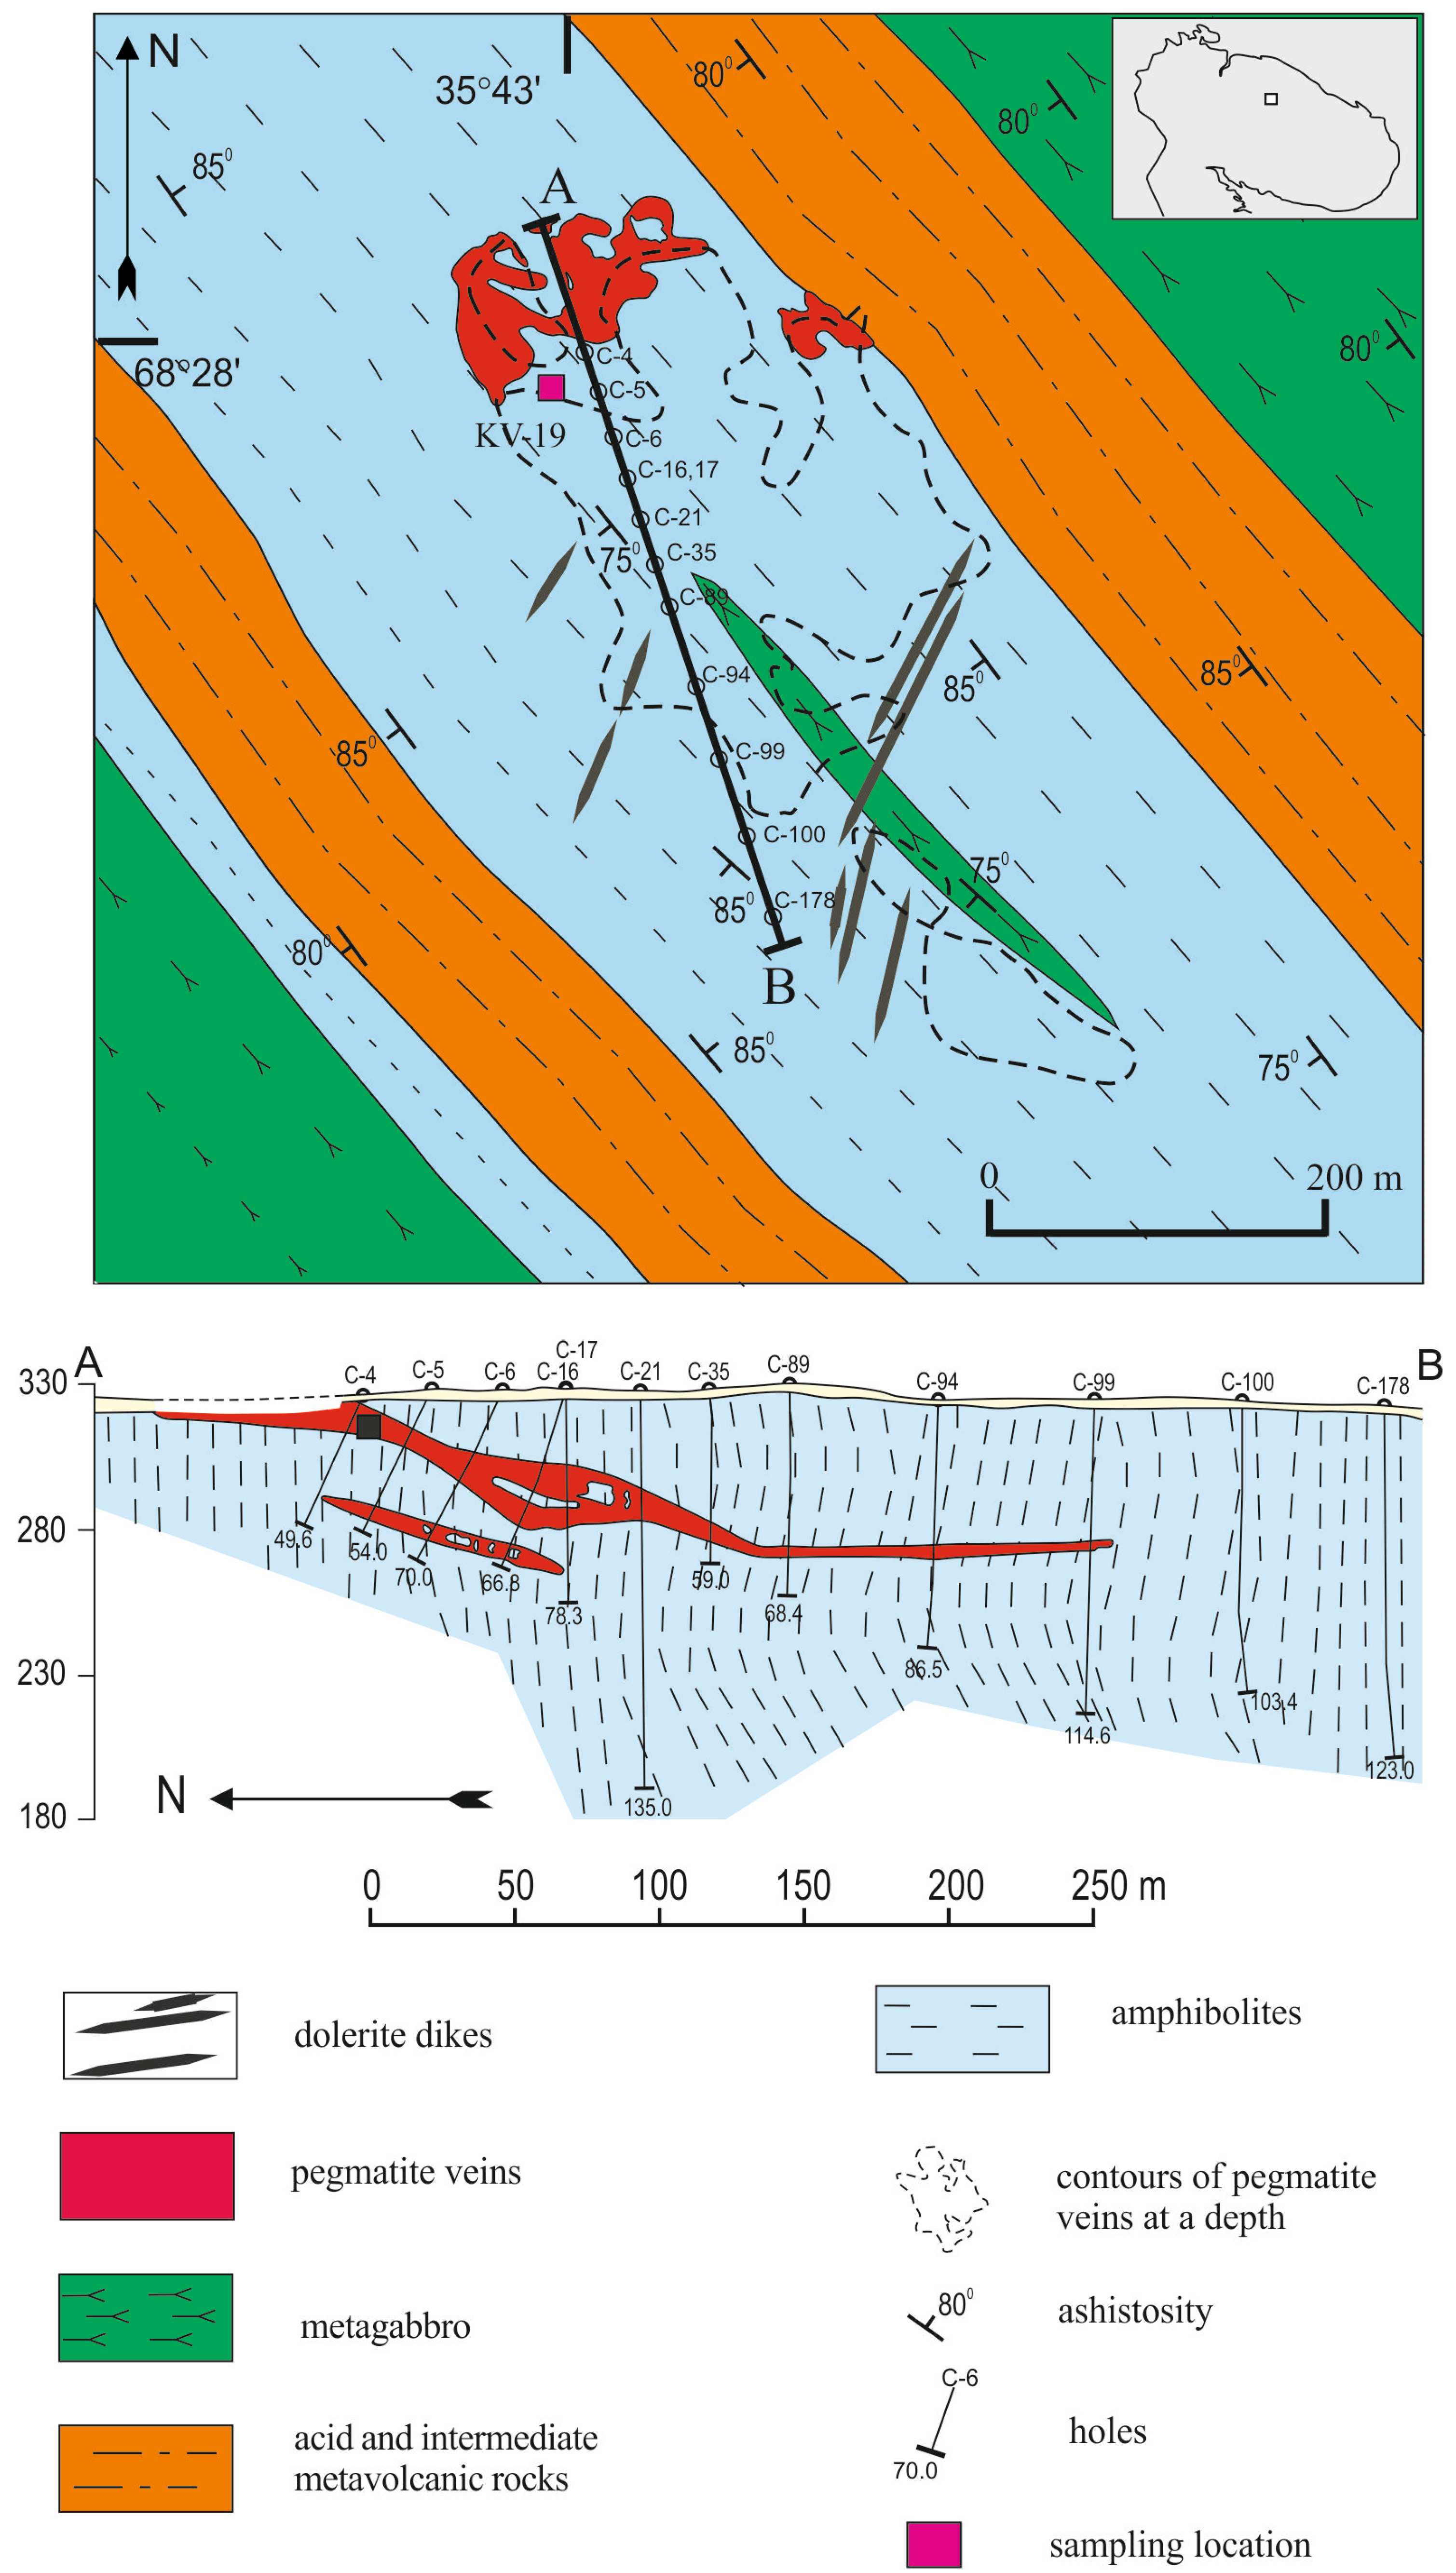
The Vasin-Mylk rare-metal deposit represents a recognized occurrence of LCT-type pegmatites. It is situated within the Archean Kolmozero-Voron’ya greenstone belt in the northeastern Fennoscandian Shield (Figure 1). This belt forms a major linear Archean tectonic suture that was later reworked during the Paleoproterozoic, delineating the boundaries between the Murmansk, Kola-Norwegian, and Keivy crustal blocks. The belt is predominantly composed of Mesoarchean (2.9–2.8 Ga [8]) metavolcano-sedimentary rocks, including komatiite–tholeiite and the basalt–andesite–dacite series. These rocks are intruded by differentiated gabbro–granodiorite–granite plutons (2.7–2.6 Ga) and by younger (2.7–2.5 Ga) tourmaline–muscovite and microcline granites [8]. The prolonged formation history of the Kolmozero-Voron’ya belt culminated with the emplacement of granite massifs and associated granite pegmatites. Two major rare-metal (Li, Cs, Ta, Nb, and Be) pegmatite fields are distinguished within the belt. The northwestern sector hosts deposits including Vasin-Mylk, Okhmylk, Oleninskoe, Polmostundra, and Shongui, which intrude the volcanogenic-sedimentary sequences of the belt. In the southeastern sector, the Kolmozero deposit comprises a series of albite–spodumene veins that cut through the gabbro-anorthosites of the Patchamvarek massif.
The age of the Vasin-Mylk pegmatites is 2454 ± 8 Ma, determined by U-Pb isotope dilution thermal ionization mass spectrometry of the microlite [7], which places their formation during the Early Paleoproterozoic rifting event. The pegmatites are hosted by banded amphibolites. These host rocks exhibit a compositional banding, with light-colored bands consisting primarily of feldspar and dark bands dominated by amphibole. The principal mineral assemblage includes hornblende (55–95%), plagioclase (An30–40) (20–45%), and quartz (10–15%). Secondary minerals comprise biotite (0–7%), epidote (0–5%), garnet, and ore minerals. Accessory minerals are titanite, allanite, apatite, calcite, and zircon.
The Vasin-Mylk deposit is composed of spodumene–quartz–albite and lepidolite–pollucite–spodumene–albite pegmatites. These occur as subparallel, gently southeast-dipping (dip angle 10–30°), sheet-like veins, approximately 5 m thick and up to 220 m long [7]. The pegmatite veins have been traced by drilling to depths of up to 350 m, and they exhibit a distinct internal zonation. The vein margins feature a thin zone (a few cm to 0.5 m) of fine- to medium-grained plagioclase–quartz pegmatite containing schorl, Mn-rich apatite, and muscovite. Inward, this zone is succeeded by a variably thick interval of blocky microcline, which grades into a more extensive central zone dominated by albite–quartz–spodumene. Locally, the central zone consists of albite–quartz pegmatite with pollucite and lepidolite, reaching thicknesses of 5–6 m thick, where pollucite acts as the main rock-forming mineral. Thus, the ore minerals in the Vasin-Mylk pegmatites include Li-bearing phases (spodumene, pollucite, and lepidolite), Nb-Ta minerals (columbite–tantalite), and beryl—the latter also being of potential economic interest. Accessory minerals comprise muscovite, apatite, zircon, simpsonite, holtite, and titanite.

3. Materials and Methods

Samples of zircon were selected from material taken from a pit located near borehole C-4 (Figure 1). The sampled material consisted of the least altered boulders of coarse- and medium-grained albitized pegmatites (KV-19), found within areas of fine-grained albite–lepidolite–quartz greisen. Zircon is predominantly associated with platy and less commonly sugary albite, as well as with light blue clevelandite.
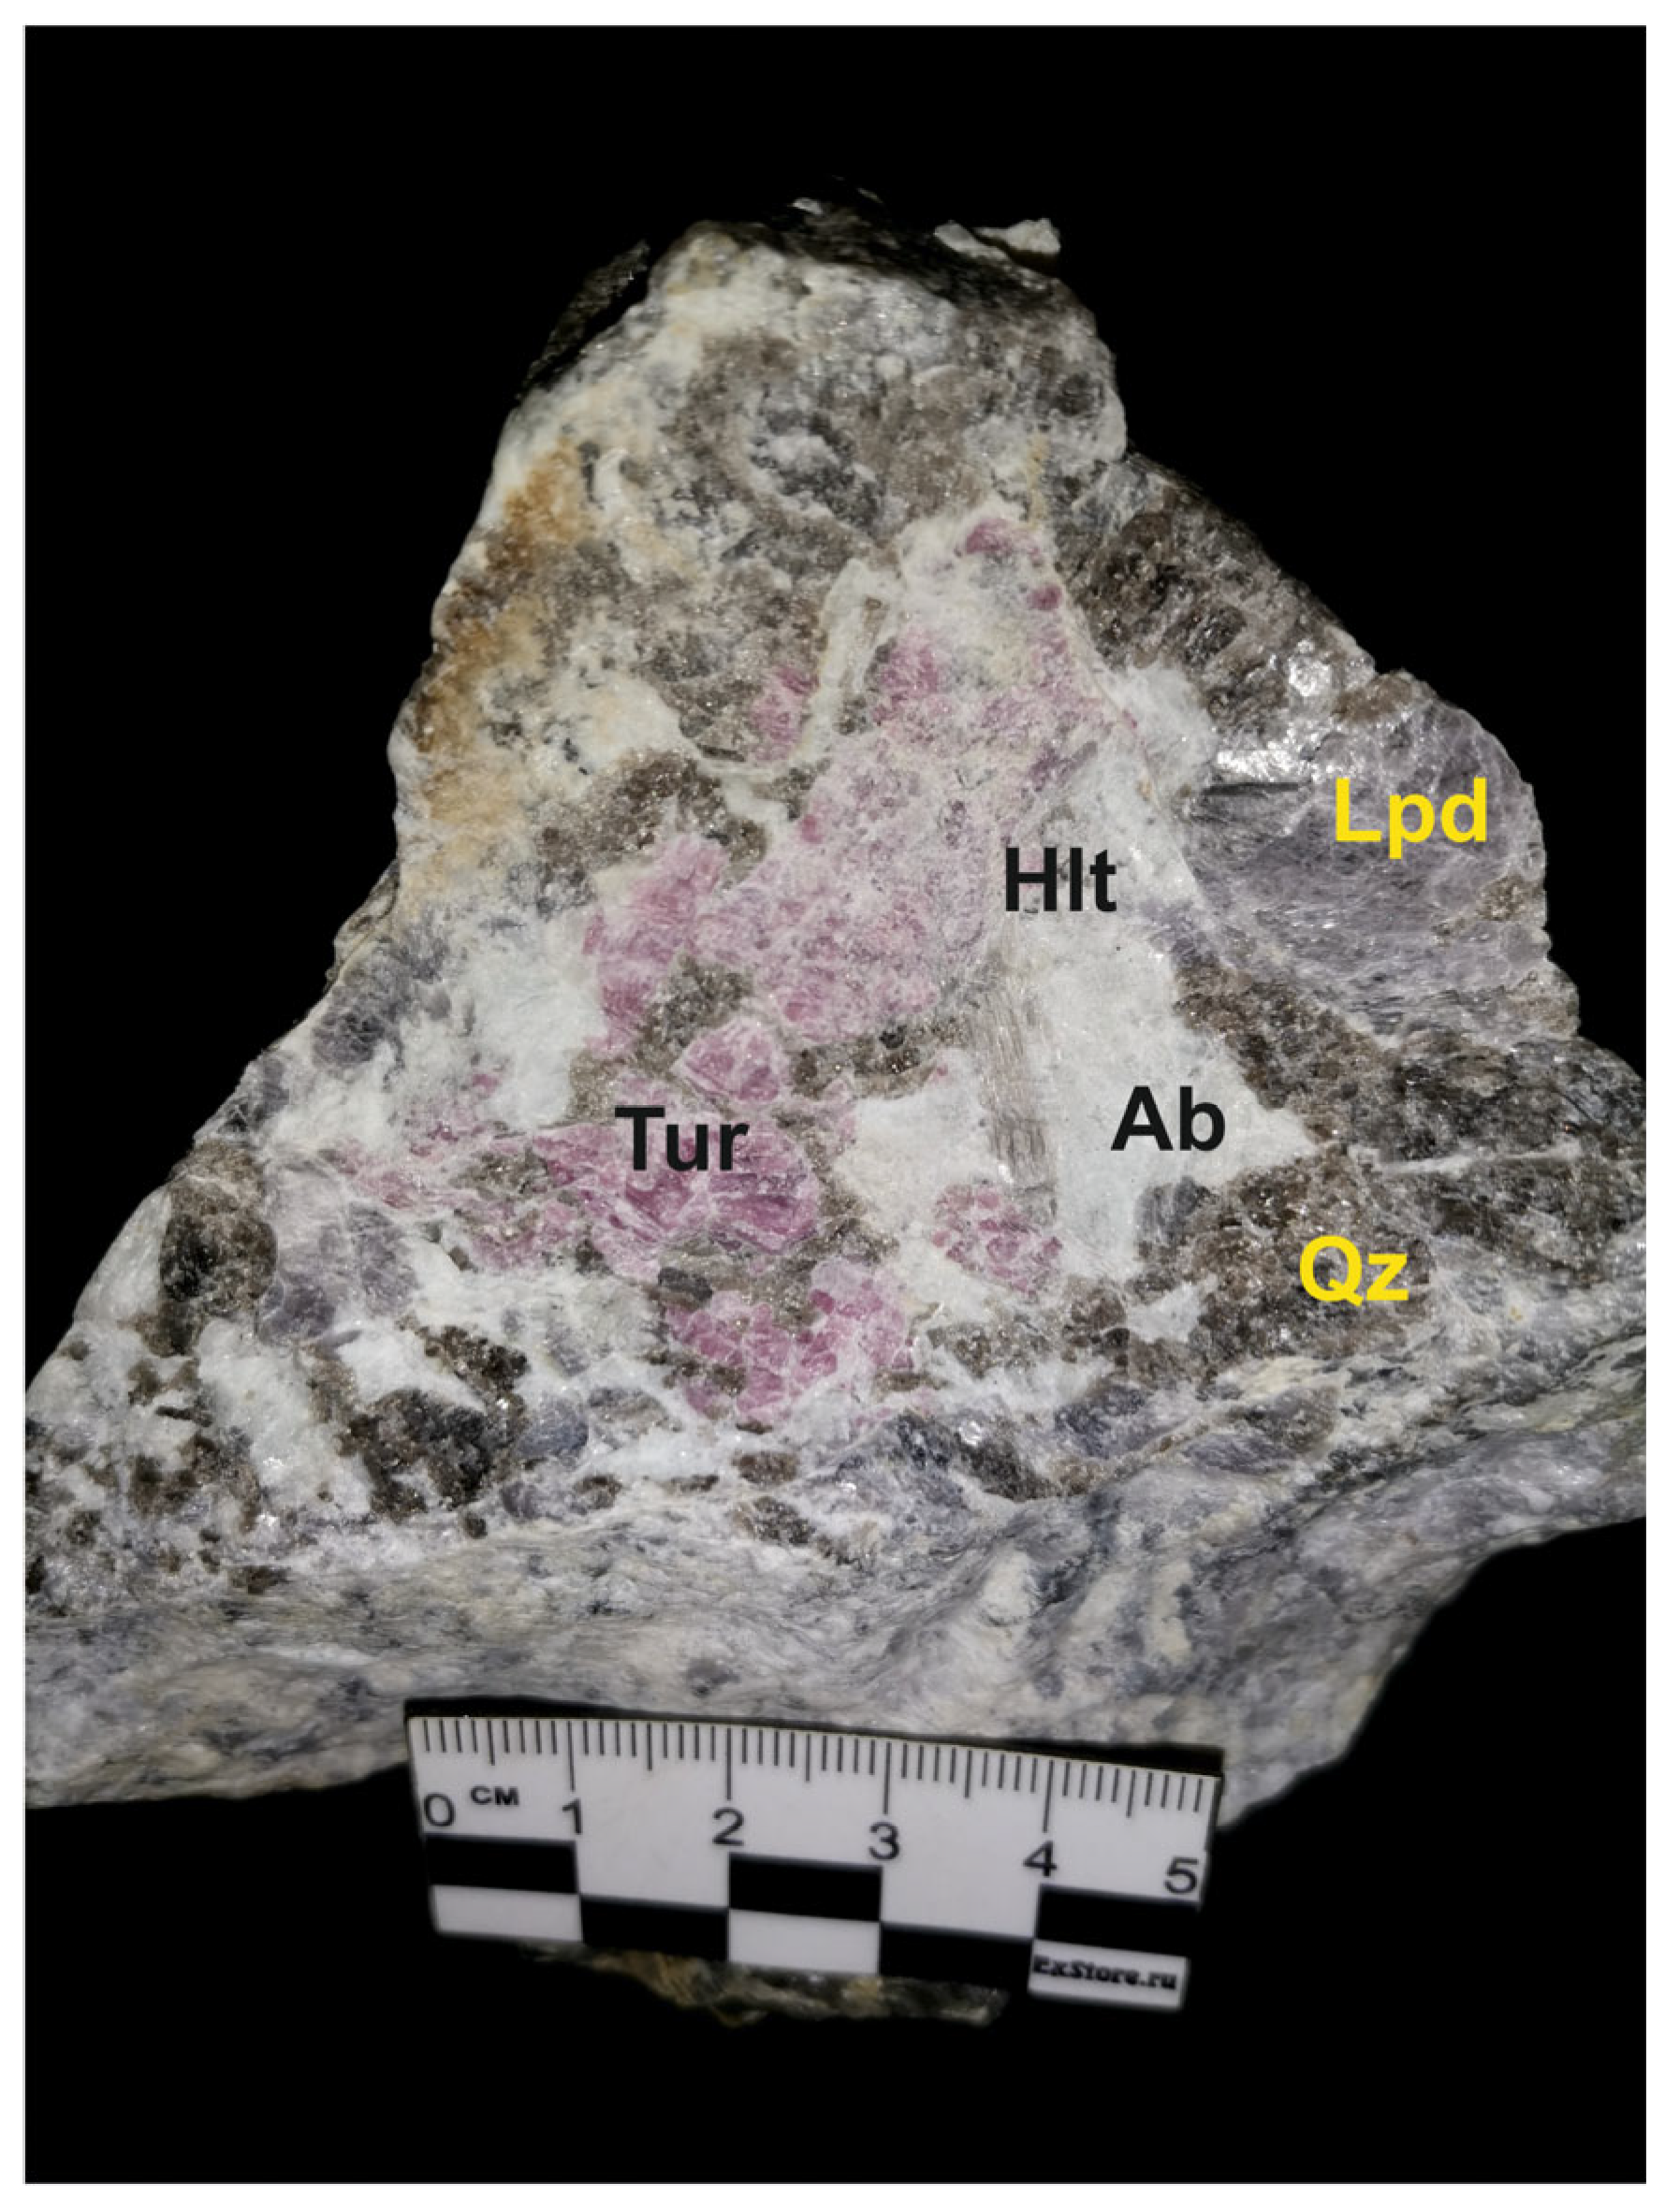
The pegmatites of the Vasin-Mylk deposit host a diverse mineral assemblage (Figure 2). Albite is the most abundant mineral, accompanied by dark gray quartz forming irregular sections 3–5 cm across. Microcline occurs in both pinkish and white varieties. Tourmaline is present in black (schorl) and pink (rubellite) colors. Two generations of muscovite are observed: (1) coarse-grained, light green crystals and (2) fine-grained, dark green crystals. Pollucite forms fine-grained, dense, white segregations; these accumulations are irregularly shaped and can reach several tens of centimeters in diameter. Pale violet lepidolite occurs as scaly aggregates up to 2–3 cm in size. Spodumene forms small, elongated crystals ranging from white to greenish and less commonly exhibits a pinkish tint (kunzite). Minerals of the tantalite–columbite group appear as small, slightly brownish black, platy crystals. White to gray montebrasite forms clusters of irregular segregations among tabular albite and quartz, as well as along the contact between lepidolite and pollucite. Beryl is relatively rare, occurring as irregular segregations up to 2 cm in size; it very rarely forms short prismatic crystals within quartz and albite. Manganapatite occurs as small (<0.5 cm) bluish irregular segregations. Among the rare accessory minerals are holtite and simpsonite.
Two zircon generations occur in the Vasin-Mylk pegmatites, distinguished by composition, primarily in U content: early high-U zircons and later low-U, high-Hf zircons. The studied crystals represent the second generation of low-U, high-Hf zircons. They appear as semi-transparent, dark brown idiomorphic to subidiomorphic crystals measuring 400–600 µm, with a dipyramidal-prismatic habit.
Zircons were separated from the rock samples (total weight ~20 kg) using conventional methods involving magnetic separation and heavy liquid techniques. The extracted grains were then mounted in epoxy resin.
Analyses were conducted using a JEOL JSM-6510LA scanning electron microscope (JEOL, Tokyo, Japan) equipped with an integrated JED-2200 energy-dispersive X-ray spectrometer (JEOL Ltd., Akishima, Japan) at the IPGG RAS laboratory. This system was used to examine zircon samples for their morphology, internal structure (BSE imaging), bulk major element composition, and the chemistry of mineral micro-inclusions. Standard operating conditions were applied: an accelerating voltage of 20 kV, a beam current of 1.5 nA, a working distance of 10 mm, and a probe diameter of approximately 3 µm. Elemental quantification was performed using ZAF matrix corrections within the JEOL analysis software. Standard samples included synthetic zircon (ZrLα, SiKα) and hafnon (HfMα), as well as pure metals and chemical compounds. Cathodoluminescence (CL) imaging was carried out using a CamScan MX2500S scanning electron microscope (CamScan Electron Optics, Ltd., Oxfordshire, UK) with a CLI/QUA 2 CL detector at the Centre of Isotopic Research of the A.P. Karpinsky Institute of Geology (Russian Geological Research Institute, St. Petersburg, Russia).
The concentrations of rare earth elements and other trace elements in zircon were determined using secondary ion mass spectrometry (SIMS) with a Cameca IMS-4f ion microprobe (Cameca, Gennevilliers, France) at the Yaroslavl Branch of the Valiev Institute of Physics and Technology of the Russian Academy of Sciences (IPT RAS, Yaroslavl Branch). The analytical methodology followed established procedures [15,16]. A total of 29 analytical points were acquired on the investigated zircons. The measurements consisted of three cycles performed under the following conditions: a primary 16O2 ion beam with a diameter of 20 µm, a beam current of 5–7 nA, and an accelerating voltage of 15 keV. Detection limits ranged from 5 to 10 ppb, with an analytical precision of 10–15% for concentrations >1 ppm and 10–20% for concentrations between 0.1 and 1 ppm. The resultant REE patterns were normalized to CI chondrite values [17]. Crystallization temperatures for zircon were estimated from Ti concentrations using the Ti-in-zircon geothermometer [18]. The application of this thermometer requires titanium saturation in the melt [18]. The presence of accessory titanite in the paragenesis confirms this condition. Although zircon–titanite assemblages are not common in pegmatites, such occurrences have been documented [19,20] and are, in fact, characteristic of pegmatites in the Keivy province [21].
Oxygen isotope ratios (δ18O) in zircon were measured using a Cameca IMS-1280 ion microprobe (SIMS) (Nobel Drive, Madison, WI, USA) at the Institute of Geology and Geophysics of the Chinese Academy of Sciences, Beijing, following published methodologies [22,23,24]. Prior to analysis, the sample mount was repolished to remove pits from previous trace element analyses, ensuring that new δ18O measurement spots could be precisely correlated with the existing compositional data. Each analytical session was calibrated using the zircon reference materials TEMORA-2 and 91500, with 9 and 4 measurements, respectively, to correct for instrumental mass bias. The analytical conditions involved a 10 keV Cs+ primary beam at an intensity of approximately 2 nA, producing an analytical crater 20 µm in diameter. All δ18O values were calibrated relative to the VSMOW international standard (18O/16O = 0.0020052).

4. Results

4.1. Zircons Characterization

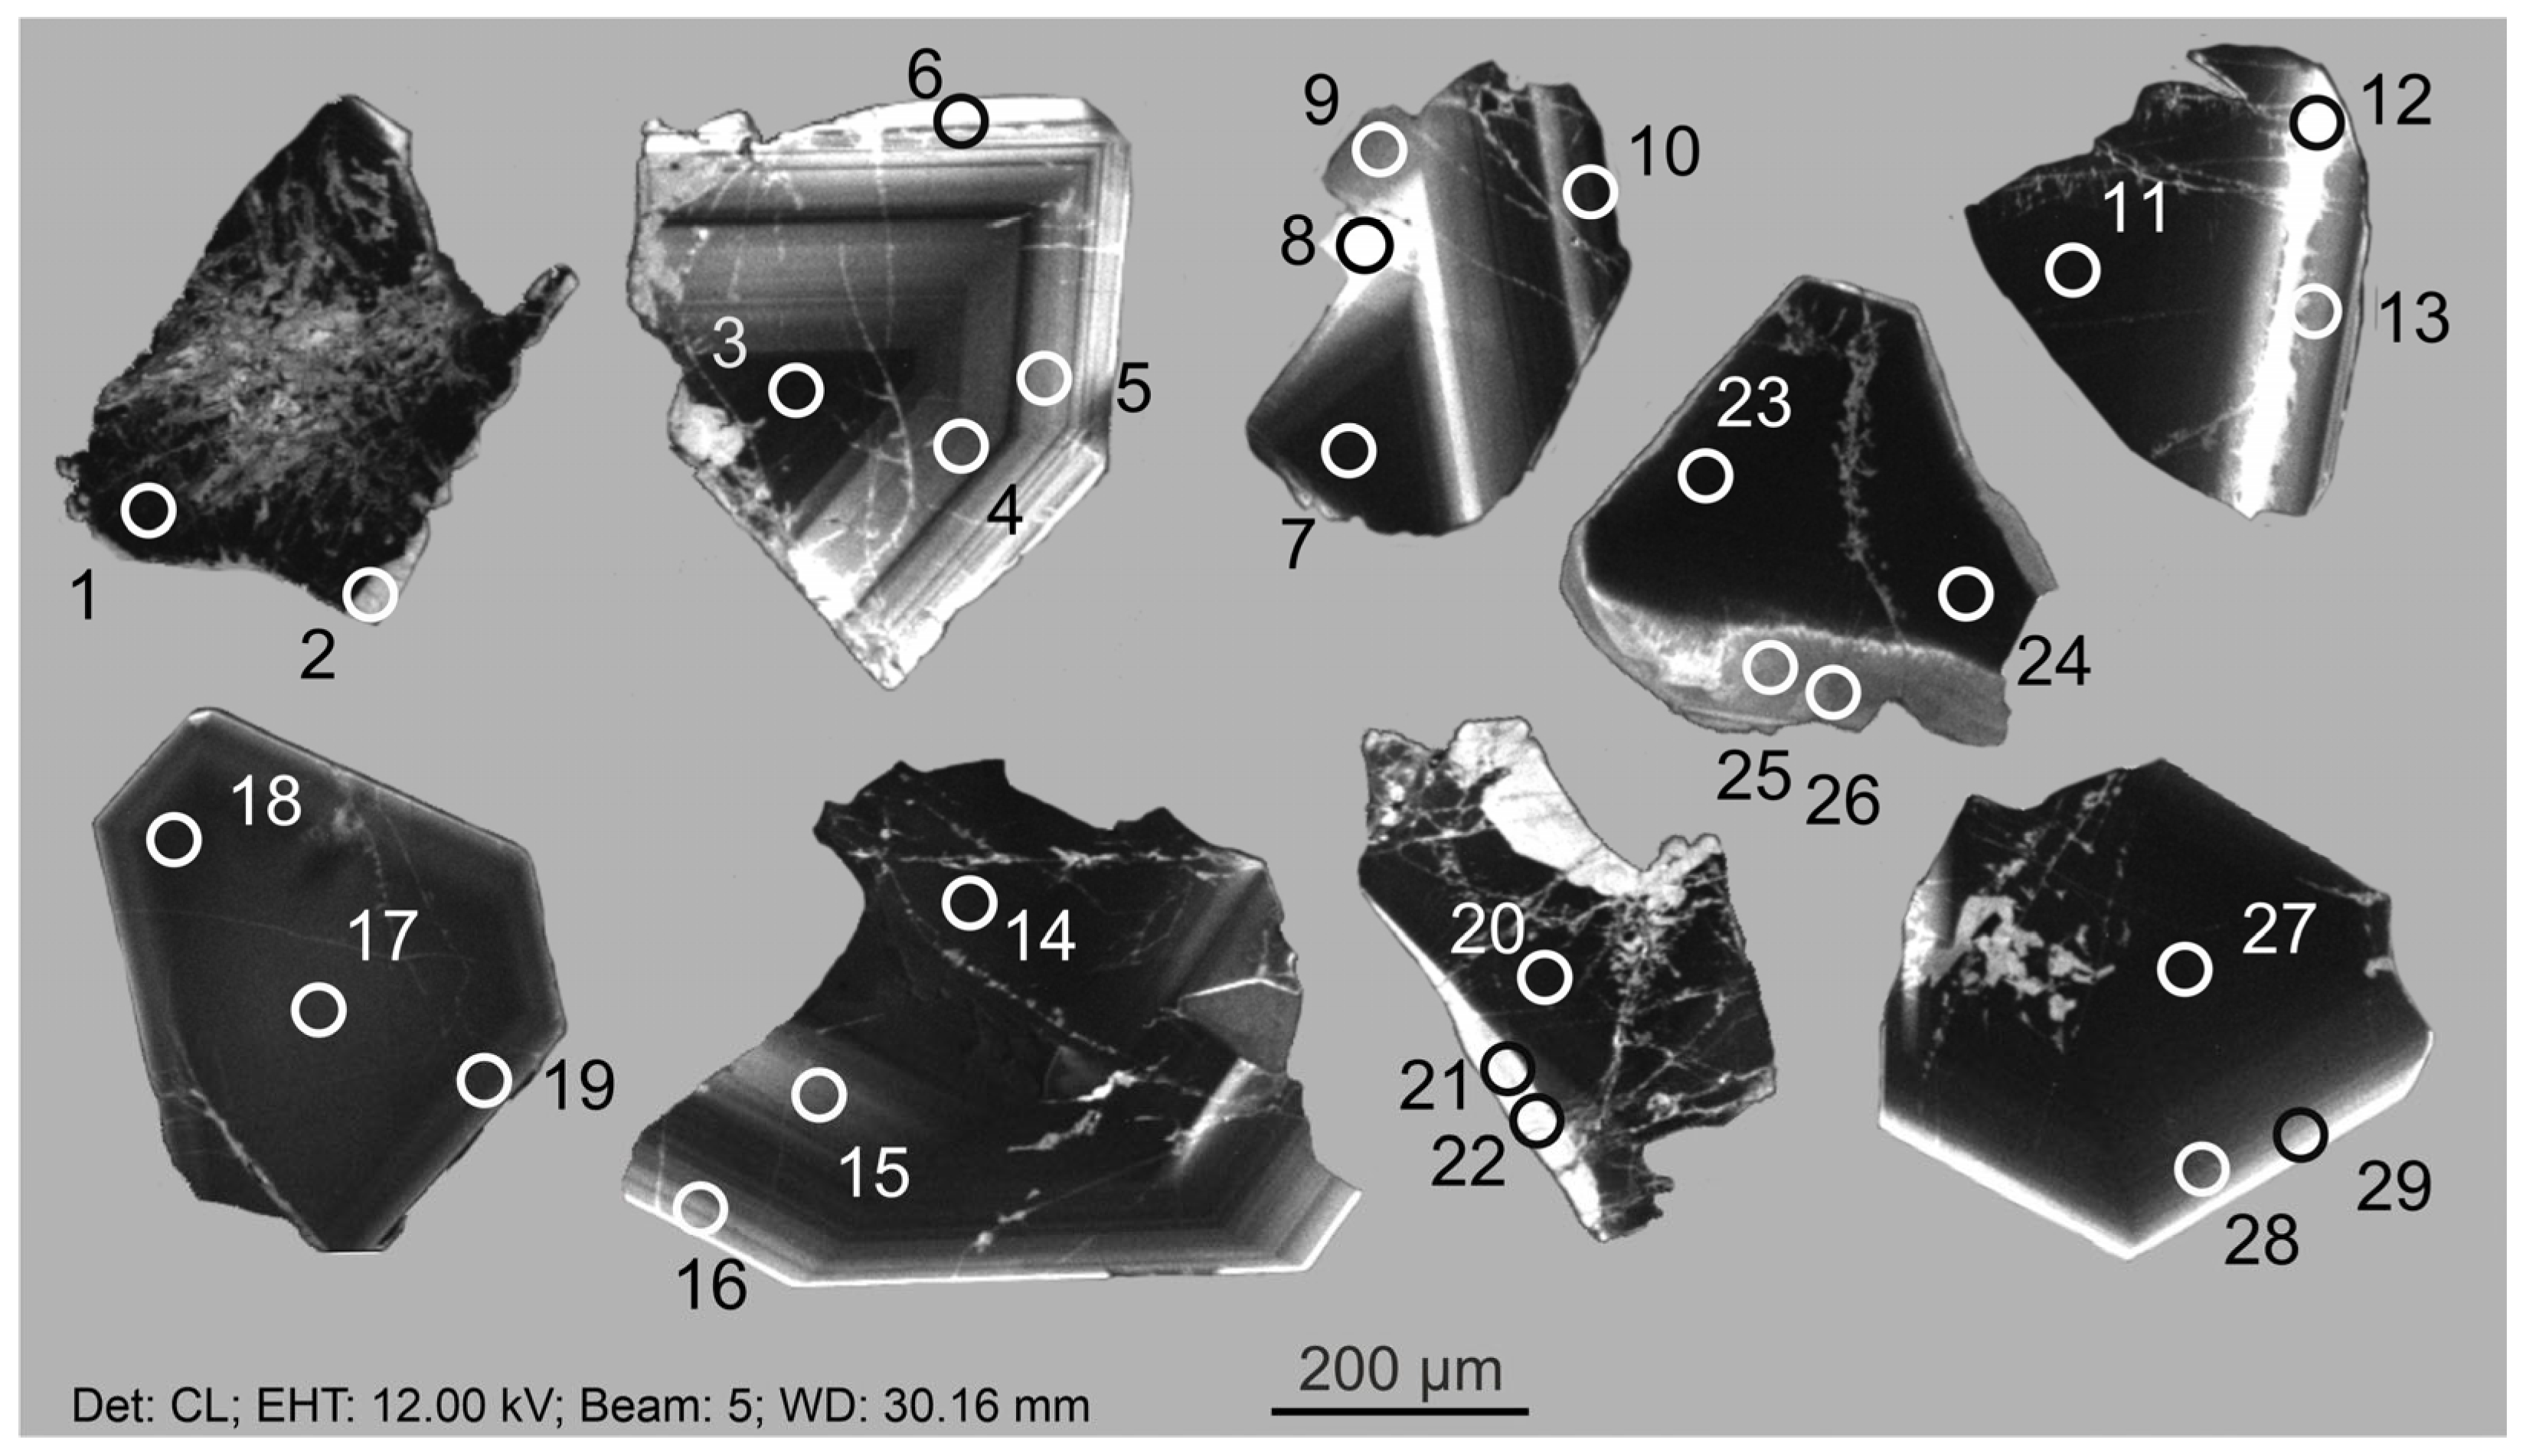
Zircons from the Vasin-Mylk pegmatite deposit are characterized by yellow-orange or light brown, semi-transparent or translucent crystals with a predominantly dipyramidal morphology and well-developed fracturing. The crystals exhibit internal heterogeneity, featuring a complex structure (as revealed by SEM using CL and BSE detectors) that includes oscillatory zoning, dark central zones, and thin (5 to 20 μm thick) light marginal zones visible in CL images (Figure 3). The zircons also contain micro-inclusions, with microlite being widely present. These variations in internal structure are reflected in corresponding differences in the zircon’s geochemical characteristics.
Figure 3. Cathodoluminescence image of zircons from the Vasin-Mylk pegmatites. Analytical spots are marked (crater diameter is about 20 µm); numbers correspond to data points in Table 1.
Geosciences 16 00077 g003
Table 1. Trace element concentrations (ppm) of zircons (KV-19) from the Vasin-Mylk pegmatites.
Element
/Spot
123456789
CL-Dark RimCL-Bright RimsCL-Dark Central ZoneCL-Bright RimCL-Bright RimCL-Bright RimCL-Dark Central Zone CL-Bright RimCL-Bright Rim
La1.341.470.060.050.030.040.040.040.04
Ce1.780.670.200.180.210.150.270.260.28
Pr0.320.160.020.010.010.010.03bdl0.02
Nd1.980.520.020.040.02bdl0.080.030.02
Sm1.811.581.510.730.840.651.181.350.88
Eu0.150.110.100.030.040.020.050.070.04
Gd1.490.640.140.060.010.040.100.020.13
Dy6.923.407.572.810.821.440.720.313.40
Er 9.534.6728.510.13.004.680.710.578.00
Yb10.620.191.133.98.426.4311.67.2919.4
Lu2.671.698.283.221.281.300.740.772.15
Li15212860.021.23.515.2735.18.6112.4
P562449276149101130112105128
Ca145316317.711.49.8810.516.013.14.81
Ti1.290.470.160.080.070.040.100.120.09
Sr15.013.43.654.044.575.394.003.985.90
Y12963.124699.330.845.414.39.3861.9
Nb107090947522312667.630230.025.5
Ba9.228.381.911.761.790.982.402.212.91
Hf211,465226,727205,049226,704257,850279,767279,130320,793295,467
Th1679103654412638.033.131611.922.9
U10.811.59.568.9110.010.512.513.817.8
Th/U15590.256.914.13.793.1425.20.861.29
1 Eu/Eu*0.280.320.660.421.970.340.451.290.40
2 Ce/Ce*0.660.341.461.633.261.761.91n.d.2.64
ΣREE38.535.013751.114.714.815.510.734.4
ΣLREE5.412.810.290.280.260.200.420.330.35
ΣHREE31.230.513650.013.513.913.98.9633.1
LuN/LaN19.211.11354642429311162188528
LuN/GdN14.521.4494429185628460.3338136
SmN/LaN2.171.7341.124.446.825.942.854.536.1
T(Ti), °C589529474442435416455461447
δ18O, ‰5.735.456.366.185.645.395.175.315.73
±, ‰0.190.240.180.160.200.250.240.380.26
3 TE10.370.50n.d.0.65n.d.n.d.n.d.n.d.n.d.
Element/Spot1011121314151617
CL-Dark RimCL-Dark Central zoneCL-Bright RimCL-Bright RimCL-Dark Central zoneCL-Bright RimCL-Bright RimCL-Dark Central Zone
La0.130.000.030.050.010.030.020.04
Ce0.320.430.210.300.280.230.230.24
Pr0.030.000.010.010.010.010.020.01
Nd0.120.040.020.010.060.020.080.02
Sm0.641.230.670.680.600.650.650.69
Eu0.030.060.020.050.030.020.030.03
Gd0.500.180.040.010.160.090.050.07
Dy11.81.110.570.553.161.710.470.90
Er17.01.470.611.9810.14.670.780.87
Yb16.915.0bdlbdl31.620.28.651.72
Lu1.870.760.310.674.471.990.460.35
Li43.340.324.45.9441.413.0814.318.8
P10613466.585.822899.774.779.8
Ca55.417.012.04.7217.511.613.68.89
Ti0.110.080.030.020.090.040.060.04
Sr3.82bdl0.522.642.872.353.905.84
Y185bdlbdl2.5556.832.68.8620.0
Nb42.26071099.39947124107157
Ba2.221.882.002.132.971.950.502.29
Hf380,908227,500308,877332,644198,616230,513252,939289,125
Th219408884.32349114107144
U32.913.612.715.77.4811.813.012.3
Th/U6.6729.96.930.2846.69.668.2011.7
1 Eu/Eu*0.160.360.351.650.250.280.610.39
2 Ce/Ce*1.3427.92.863.016.373.713.042.73
ΣREE49.320.22.494.3050.429.711.44.93
ΣLREE0.600.470.270.370.370.280.340.30
ΣHREE48.018.51.533.2149.428.710.43.91
LuN/LaN1362149106144336167920891.6
LuN/GdN30.434.865.750122317681.740.8
SmN/LaN7.7058237.924.174.537.048.830.3
T(Ti), °C455444396392450416428409
δ18O, ‰4.755.455.375.595.886.135.695.38
±, ‰0.150.230.290.300.240.260.200.27
3 TE10.20n.d.n.d.n.d.n.d.n.d.n.d.n.d.
Element/Spot181920212223242526
CL-Dark Central ZoneCL-Bright RimCL-Dark Central ZoneCL-Bright RimCL-Bright RimCL-Dark Central ZoneCL-Dark Central ZoneCL-Bright RimCL-Bright Rim
La0.020.020.030.030.130.050.030.050.05
Ce0.200.270.280.100.270.260.190.130.16
Pr0.010.010.020.000.040.010.010.010.02
Nd0.020.02bdlbdl0.060.020.020.020.03
Sm0.930.281.040.090.831.140.980.570.40
Eu0.060.020.06bdl0.040.040.070.02bdl
Gd 0.140.060.270.030.100.250.170.010.03
Dy1.390.815.411.001.113.793.020.390.30
Er 1.290.9117.93.703.8912.09.192.970.68
Yb11.417.397.251.511.856.642.318.89.18
Lu0.370.347.702.392.025.284.301.980.50
Li34.121.811015.017.745.645.31.245.39
P97.674.427660.154.642933139.08.16
Ca10.36.4636.73.2518.631.524.611.619.7
Ti0.040.030.210.060.150.110.110.060.28
Sr 6.036.612.584.473.833.233.894.754.90
Y18.620.089.813.015.868.458.313.412.2
Nb25014110481081311529130957.37.54
Ba0.581.171.050.851.020.991.742.261.57
Hf286,437306,399178,580269,169283,961196,009200,160297,894368,484
Th31317358486.51145404960.8817.2
U10.78.246.525.059.326.426.269.6210.9
Th/U29.321.089.517.112.384.179.30.091.57
1 Eu/Eu*0.520.520.38n.d.0.400.230.500.66n.d.
2 Ce/Ce*4.565.013.072.680.972.682.981.501.12
ΣREE15.820.013058.820.379.560.324.911.3
ΣLREE0.230.310.320.130.490.350.250.200.26
ΣHREE14.619.412858.618.978.059.024.210.7
LuN/LaN20421029048821551088121536297.2
LuN/GdN22.346.02345951671682051215118
SmN/LaN84.528.565.05.2810.738.945.817.213.0
T(Ti), °C412398489429471456458433503
δ18O, ‰5.665.105.555.205.495.925.415.825.38
±, ‰0.240.260.220.150.200.180.210.300.27
3 TE1n.d.n.d.n.d.n.d.0.71n.d.n.d.0.541.56
Element/Spot272829
CL-Dark Central ZoneCL-Bright RimCL-Bright Rim
La0.020.060.02
Ce0.180.230.19
Pr0.010.020.01
Nd0.020.030.02
Sm0.910.290.48
Eu0.050.000.01
Gd 0.190.070.04
Dy1.940.840.49
Er 3.260.890.58
Yb15.418.09.45
Lu1.201.681.14
Li62.326.810.3
P182.296.596.4
Ca22.811.65.85
Ti0.080.070.06
Sr 4.073.824.99
Y30.417.013.1
Nb59723988.1
Ba1.680.982.08
Hf243,935271,372292,438
Th47419479.2
U7.978.279.03
Th/U59.423.58.77
1 Eu/Eu*0.380.090.28
2 Ce/Ce*2.971.612.99
ΣREE23.222.112.4
ΣLREE0.220.350.24
ΣHREE22.021.511.7
LuN/LaN624251605
LuN/GdN50186231
SmN/LaN78.27.2842.2
T(Ti), °C444435431
δ18O, ‰5.615.615.67
±, ‰0.200.180.38
3 TE1n.d.n.d.n.d.
n.d.—not determined; bdl—below the detection limit; 1 Eu/Eu* = EuN/√(SmN × GdN), where N indicates normalization relative to CI chondrite composition [17]; 2 Ce/Ce* = CeN/√(LaN × PrN); and 3 TE1 = √(1/2 × (CeN/Cet − 1)2 + (PrN/Prt − 1)2), where Cet = LaN2/3 × NdN1/3 and Prt = LaN1/3 × NdN2/4 [25].

4.2. Trace Element Composition of Zircons

A defining geochemical feature of the studied zircons is their anomalous enrichment in Hf, with concentrations reaching 381,000 ppm (average ~266,000 ppm), coupled with elevated Li (up to 152 ppm, average 35 ppm). In contrast, they display unusually low abundances of other trace elements typically found in zircon (Table 1), including pegmatite varieties [26]. For example, the average U content (11 ppm) and the total REE (35 ppm) contents are extremely low. The REE is almost entirely dominated by heavy REEs (HREE: average 33 ppm), with light REEs (LREE) constituting only a minor fraction (average 0.58 ppm). Ti concentrations are also very low (average 0.14 ppm). Application of the Ti-in-zircon geothermometer yields crystallization temperatures of approximately 390–590 °C (Table 1).
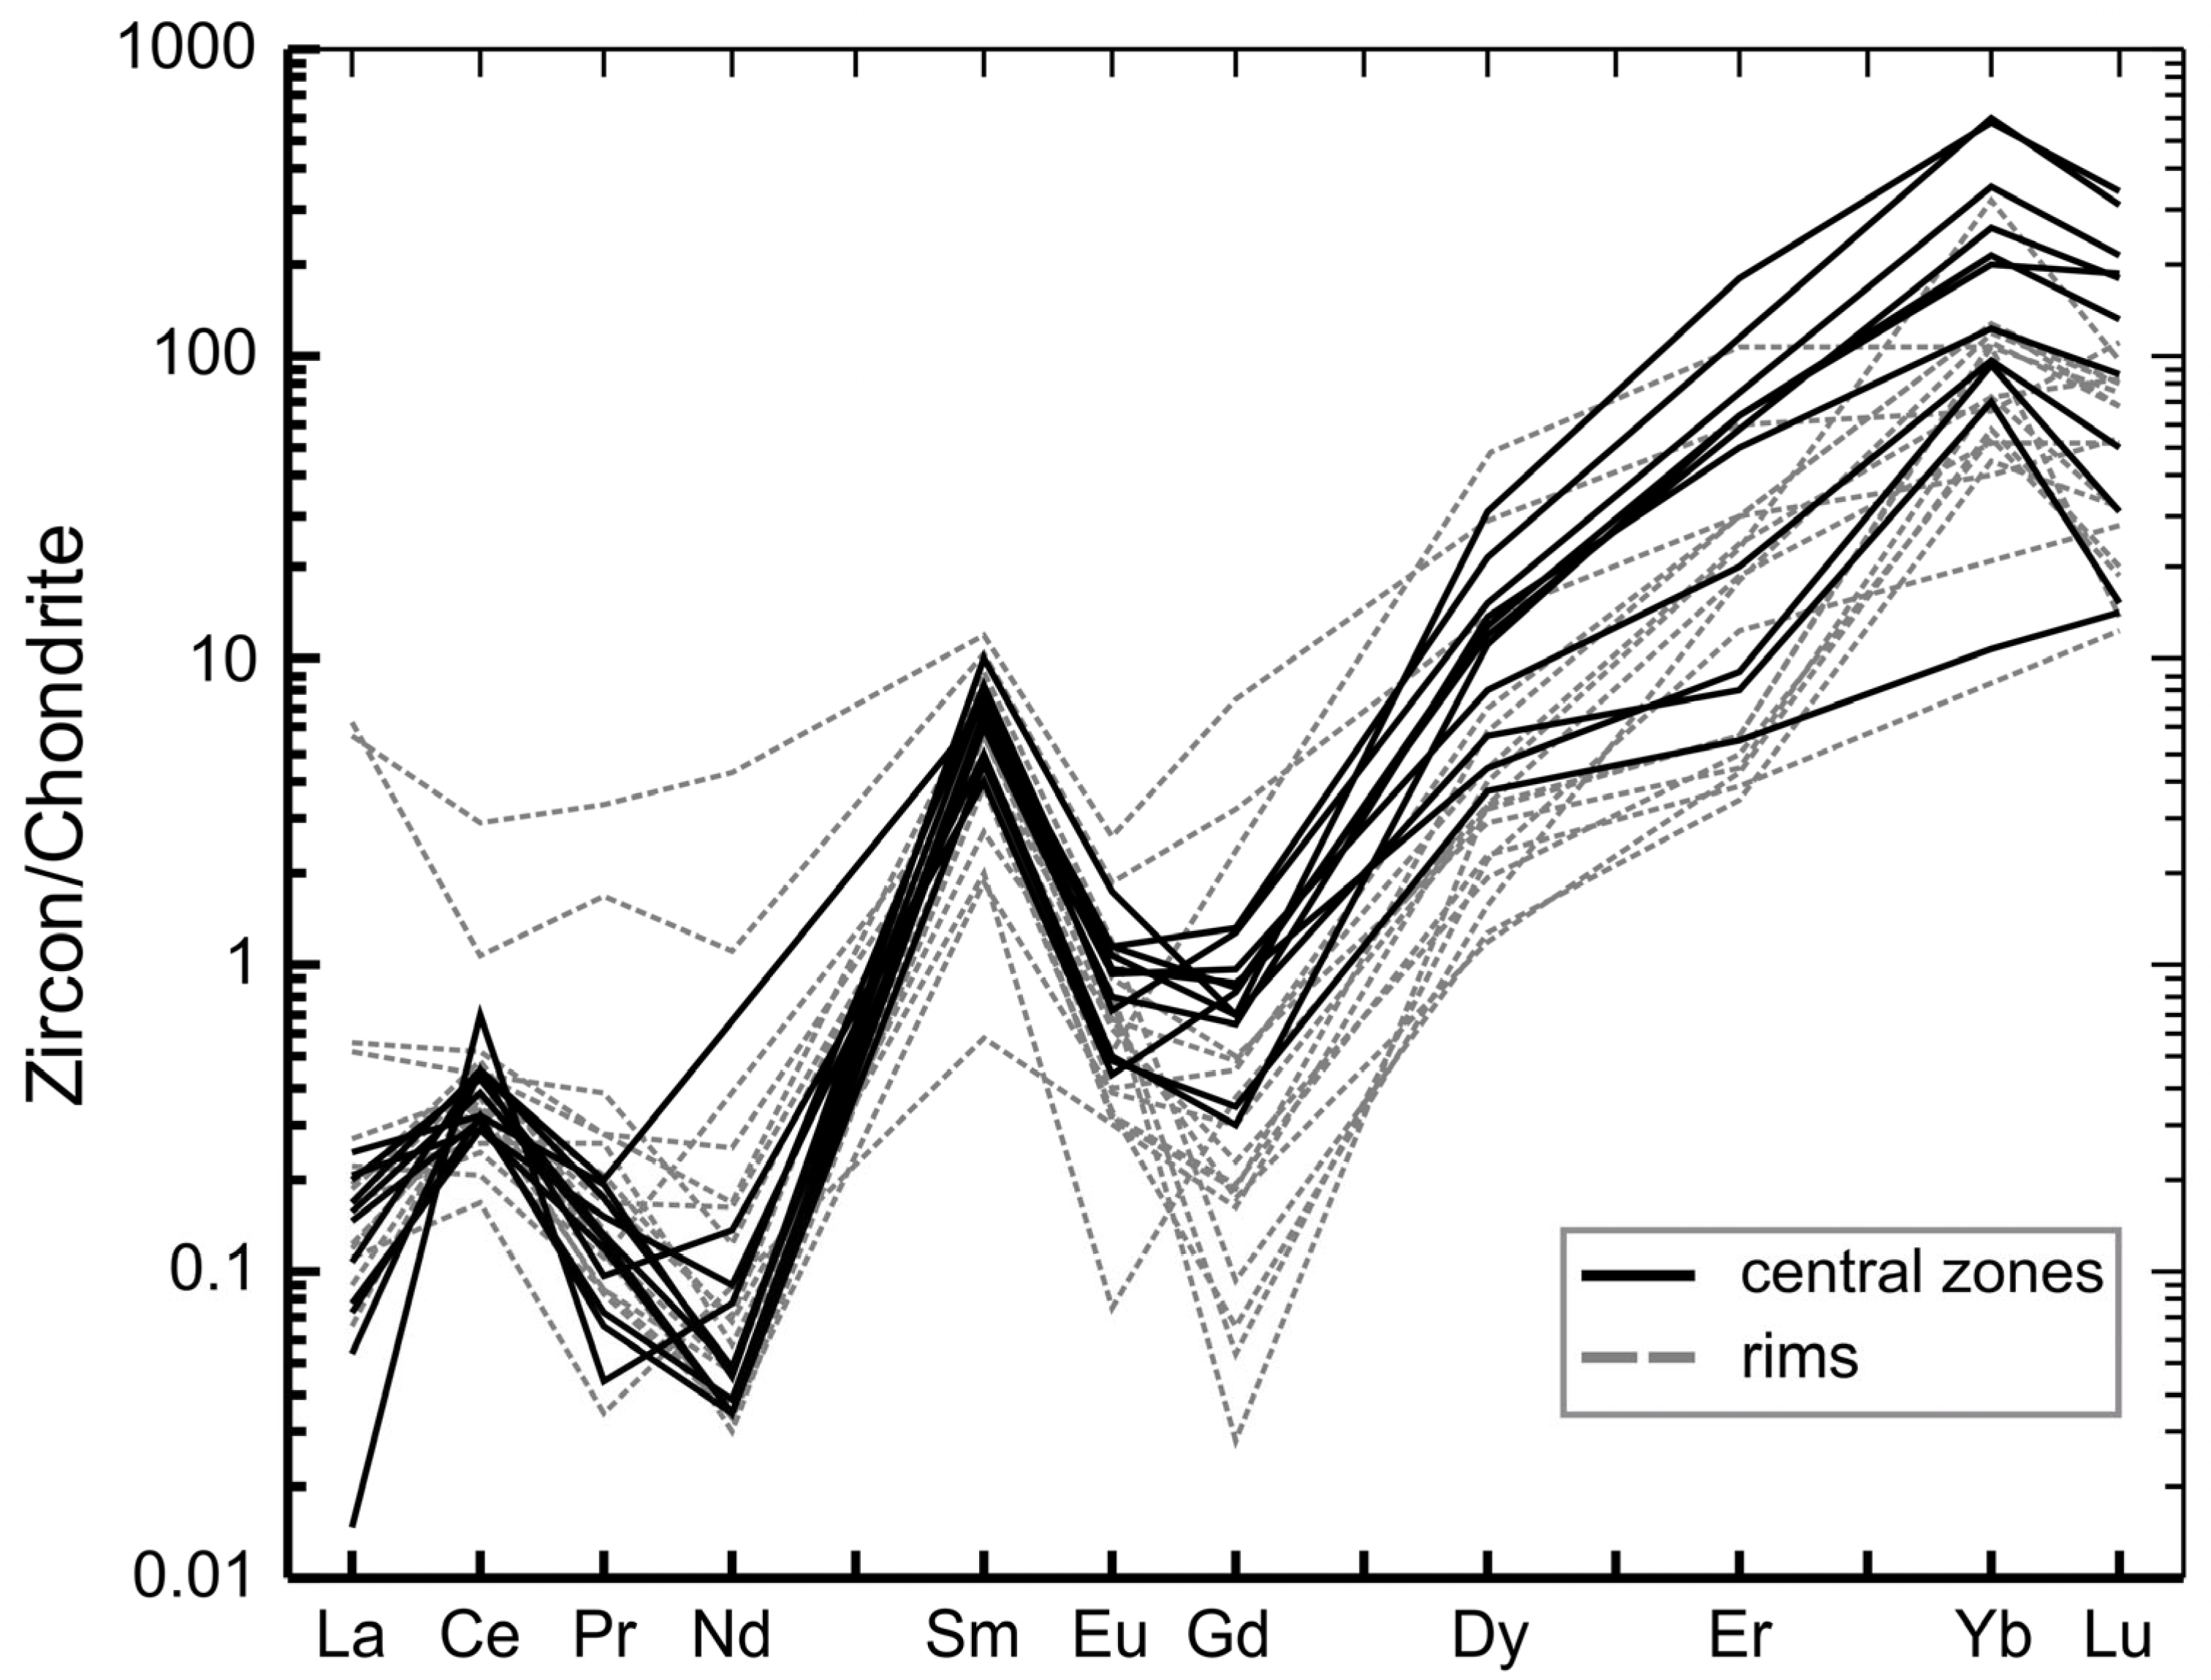
The central zones of zircon, which appear dark in CL images, are geochemically distinct and enriched in Hf, Nb, Th, Li, and Y. Hf contents range from 178,600 to 295,500 ppm (average~236,000 ppm). Notable average concentrations of other elements are: Nb (25–1500 ppm, average 690 ppm), Th (23–580 ppm, average 380 ppm), Li (12–110 ppm, average 46 ppm), and Y (14–250 ppm, average 66 ppm). In comparison, U (10 ppm), Sr—(4 ppm), Ba (1.8 ppm), and Ti (0.10 ppm) occur in significantly lower amounts. Average P and Ca contents are ~200 ppm, and ~20 ppm, respectively (Table 1). The cores of the zircons are notably depleted in rare earth elements, with the total REE ranging from 5 to 137 ppm (average of 52 ppm). This total is almost exclusively comprising HREEs, as LREE concentrations are consistently below 0.5 ppm. The Th/U ratio is highly variable (1.29–89.5). Chondrite-normalized REE patterns (Figure 4) show strong fractionation from LREE to HREE (LuN/LaN = 92–3360), with a distinct positive Ce anomaly (Ce/Ce* = 1.46–27.9) and negative Eu anomaly (Eu/Eu* = 0.23–0.66), signatures typical of magmatic zircons [27,28]. However, the REE patterns are complicated by inflections in Nd, Gd, and sometimes Er and Lu regions. Such features are atypical for zircon and may indicate a specific type of REE fractionation known as the tetrad effect. For its quantitative assessment, parameters for the third (TE3: Gd–Ho), fourth (TE4: Er–Lu), or first tetrad (TE1: La–Nd) are commonly used, provided no significant Ce anomaly is present within the corresponding element range [25,29]. However, a reliable calculation of the tetrad effect value was not feasible for the analytical points in this study. The average crystallization temperature for the central zircon zones, estimated using the Ti-in-zircon thermometer, is 450 °C.
To quantify the tetrad effect observed in zircon rims, the first tetrad parameter (TE1) was calculated for analytical points exhibiting no or minor Ce anomalies (Ce/Ce* = 0.34–1.63). The resulting TE1 values, derived via the refined formula of [25] that incorporates the standard deviation of normalized central element concentrations within a tetrad, show considerable variation, ranging from 0.20 to 1.56 (average 0.70). According to established classification [25], values below 0.8 (accounting for analytical uncertainty) correspond to a W-type tetrad effect, which is consistent with the patterns identified in this study.
Among all analyzed grains, the zircon containing points 1–2 is distinctive (Figure 3). It exhibits negative Ce anomalies (Ce/Ce* = 0.66 and 0.34, respectively), which are uncharacteristic of magmatic zircon [27,28]. The central zone of this grain appears heterogeneous in CL images, with a lighter core, a progressively darker zone towards the margin, and a distinct light gray rim. Analytical point 1, situated near the zircon margin, shows unique geochemical characteristics: it contains the highest concentrations of several impurity elements among all points analyzed, including Li (152 ppm), Th (1680 ppm), Nb (1070 ppm), Ca (1450 ppm), and P (560 ppm), and displays a distinct REE distribution pattern. The chondrite-normalized REE pattern for this point is flat, indicating undifferentiated LREE and HREE distributions. While a negative Eu anomaly remains, it is less pronounced (Eu/Eu* = 0.28). The Ce anomaly changes to a negative character with a Ce/Ce* value of 0.66, which is atypical for magmatic zircon. The calculated tetrad effect value for this point is TE1 = 0.37, calculated using the formula proposed by [25], corresponding to a W-type tetrad effect (TE < 0.8).

4.3. Oxygen Isotopic Composition of Zircons

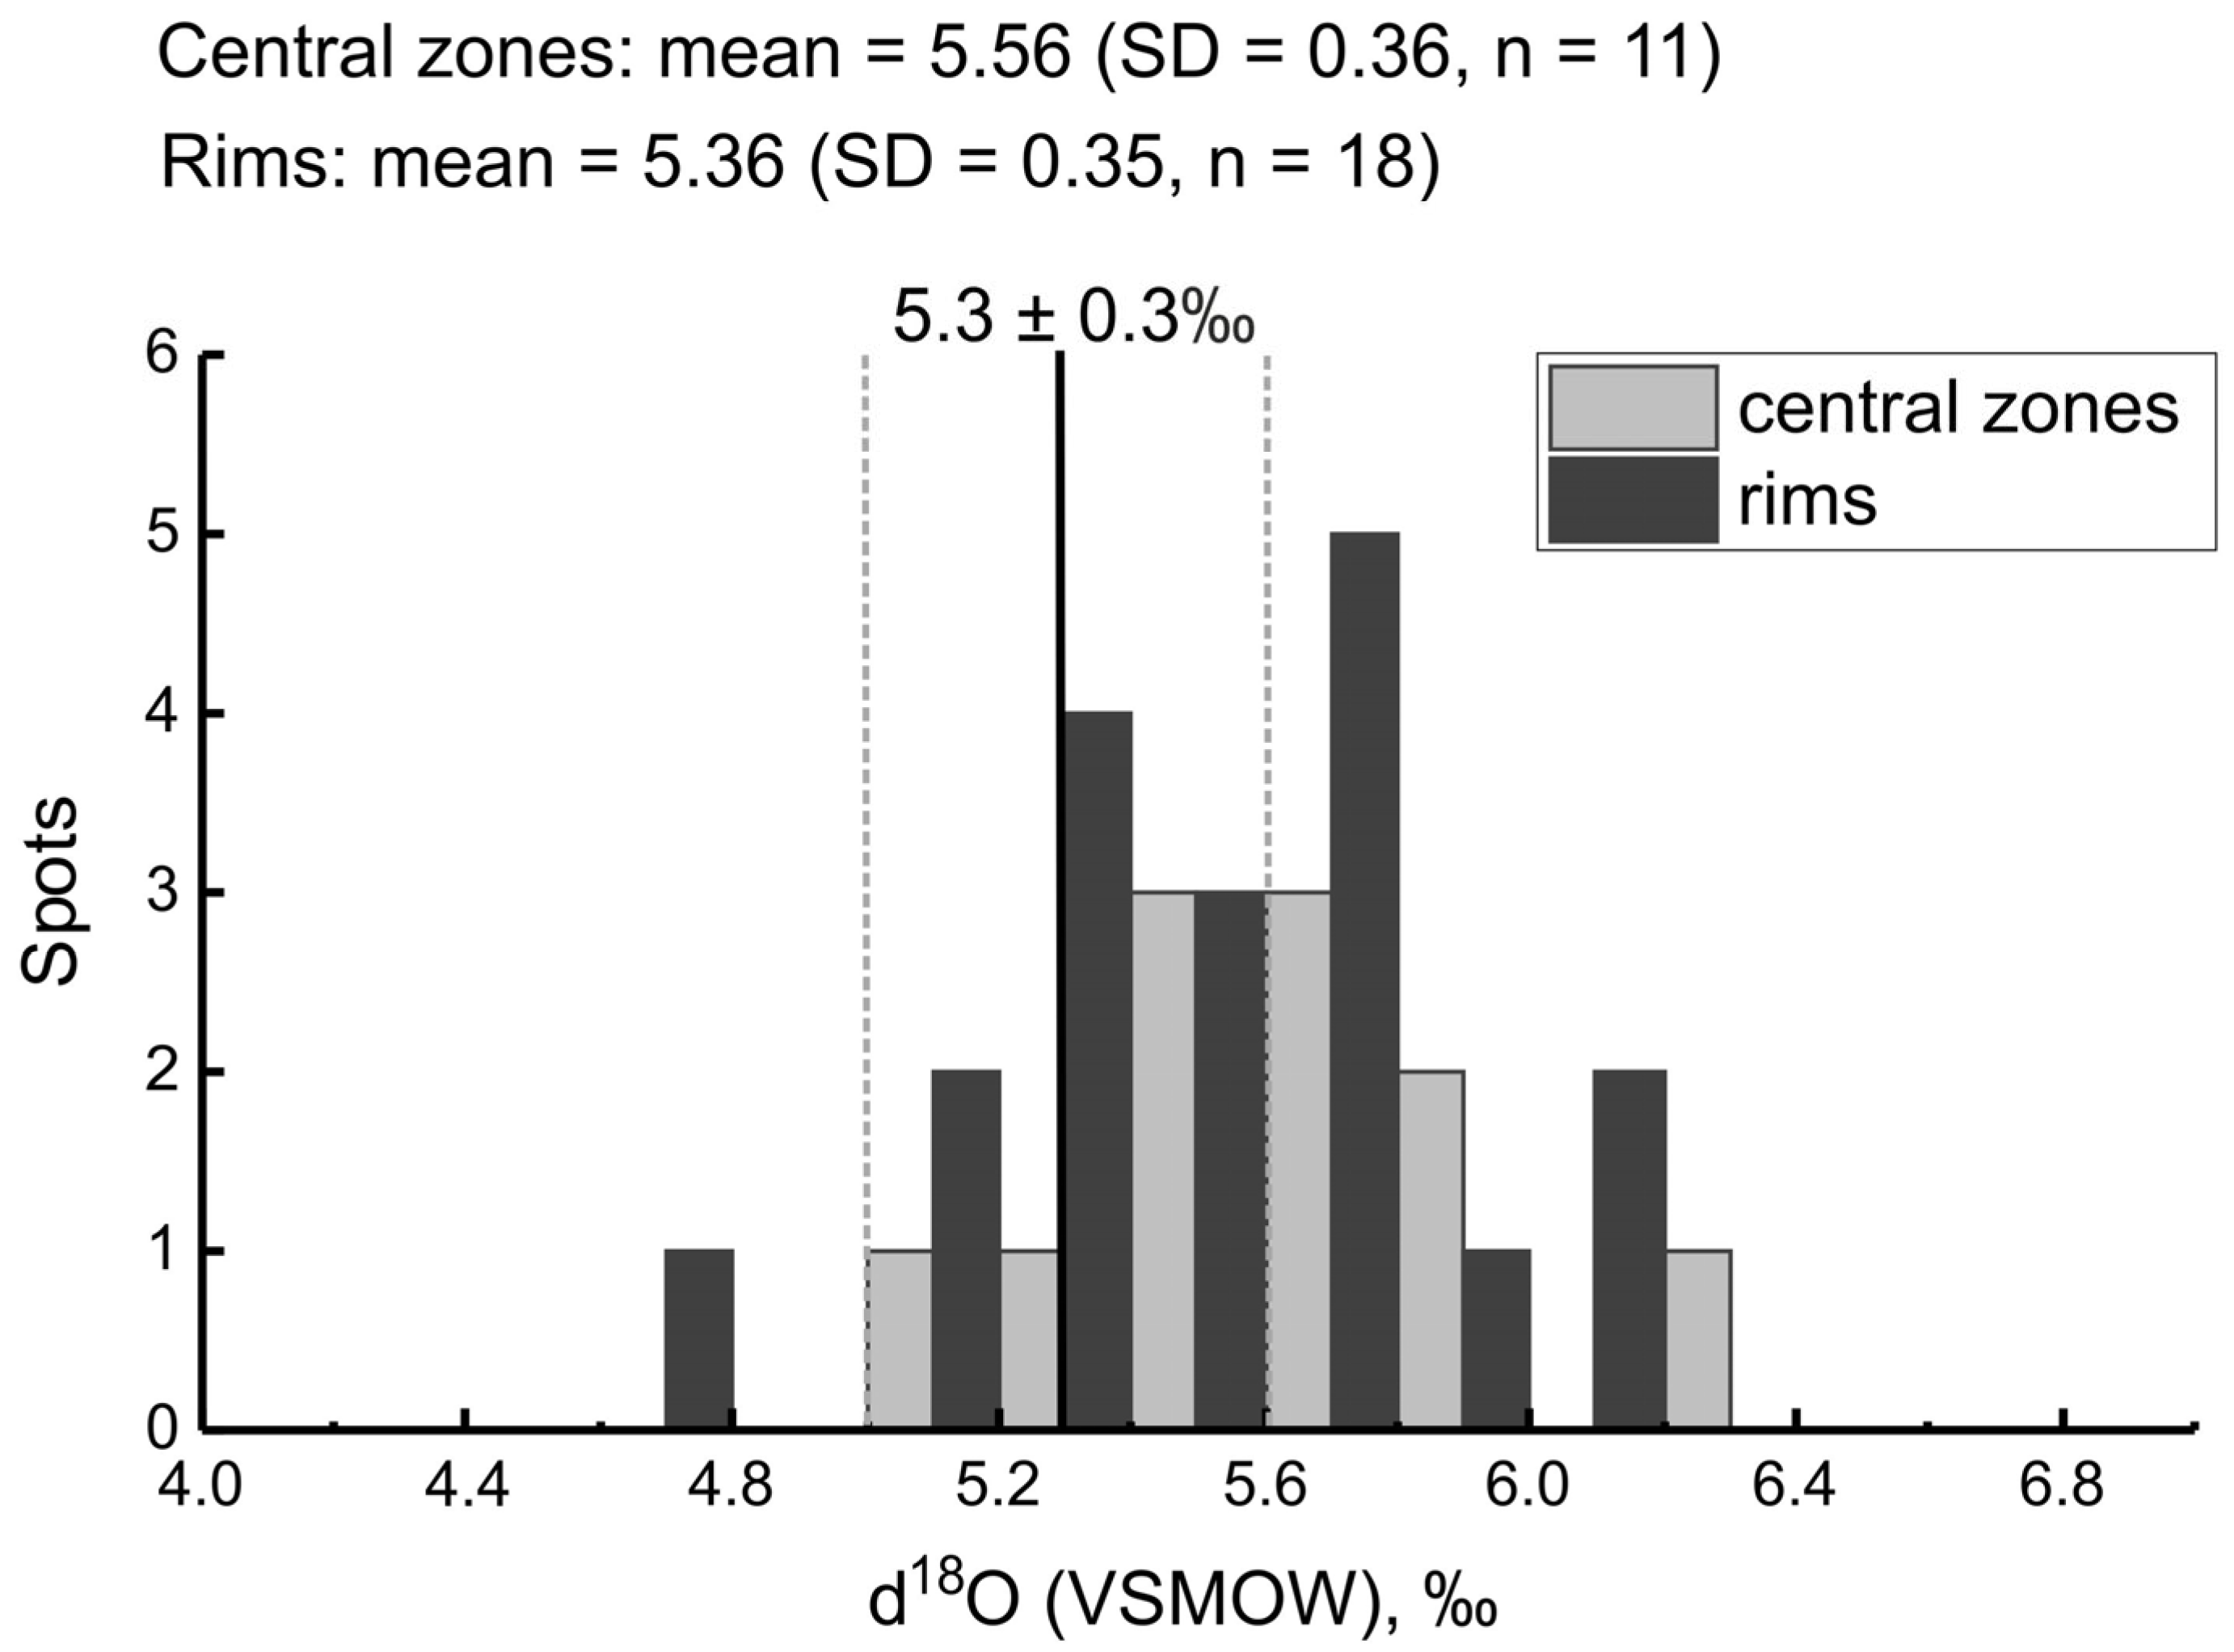
Following the acquisition of trace and REE compositional data, the same zircon domains were subsequently analyzed for their oxygen isotope signature (δ18O), ensuring geochemical comparison (Figure 3, Table 1). The obtained δ18O values exhibit a range from 4.75‰ to 6.36‰, with an average value of 5.57‰ (Figure 5). The δ18O values in the central zones and rims of zircon are comparable, although central zones exhibit a slightly higher mean value. The overall average (5.57‰) corresponds to the value of mantle zircon—5.3 ± 0.3‰ [30].

5. Discussion

A defining characteristic of the studied zircons from the Vasin-Mylk pegmatites is their exceptionally high Hf content, particularly within CL-bright rim zones (Hf 121,000–381,000 ppm). Previous work [13] identified zircon rims in these pegmatites that transition to hafnon, with HfO2 contents of 47–48 wt.% and Hf site occupancy coefficients of 0.52–0.54. Similarly, high Hf concentrations (HfO2 up to 39.21 wt.%) were observed in zircons from albite–spodumene pegmatites of the nearby Polmostundra deposit [5]. The studied zircons also resemble those from the Kolmozero deposit, which display slightly lower but still elevated Hf levels l (HfO2 up to 21.75 wt.%) [5]. All three occurrences share a common trend of increasing the Hf content from core to rim.
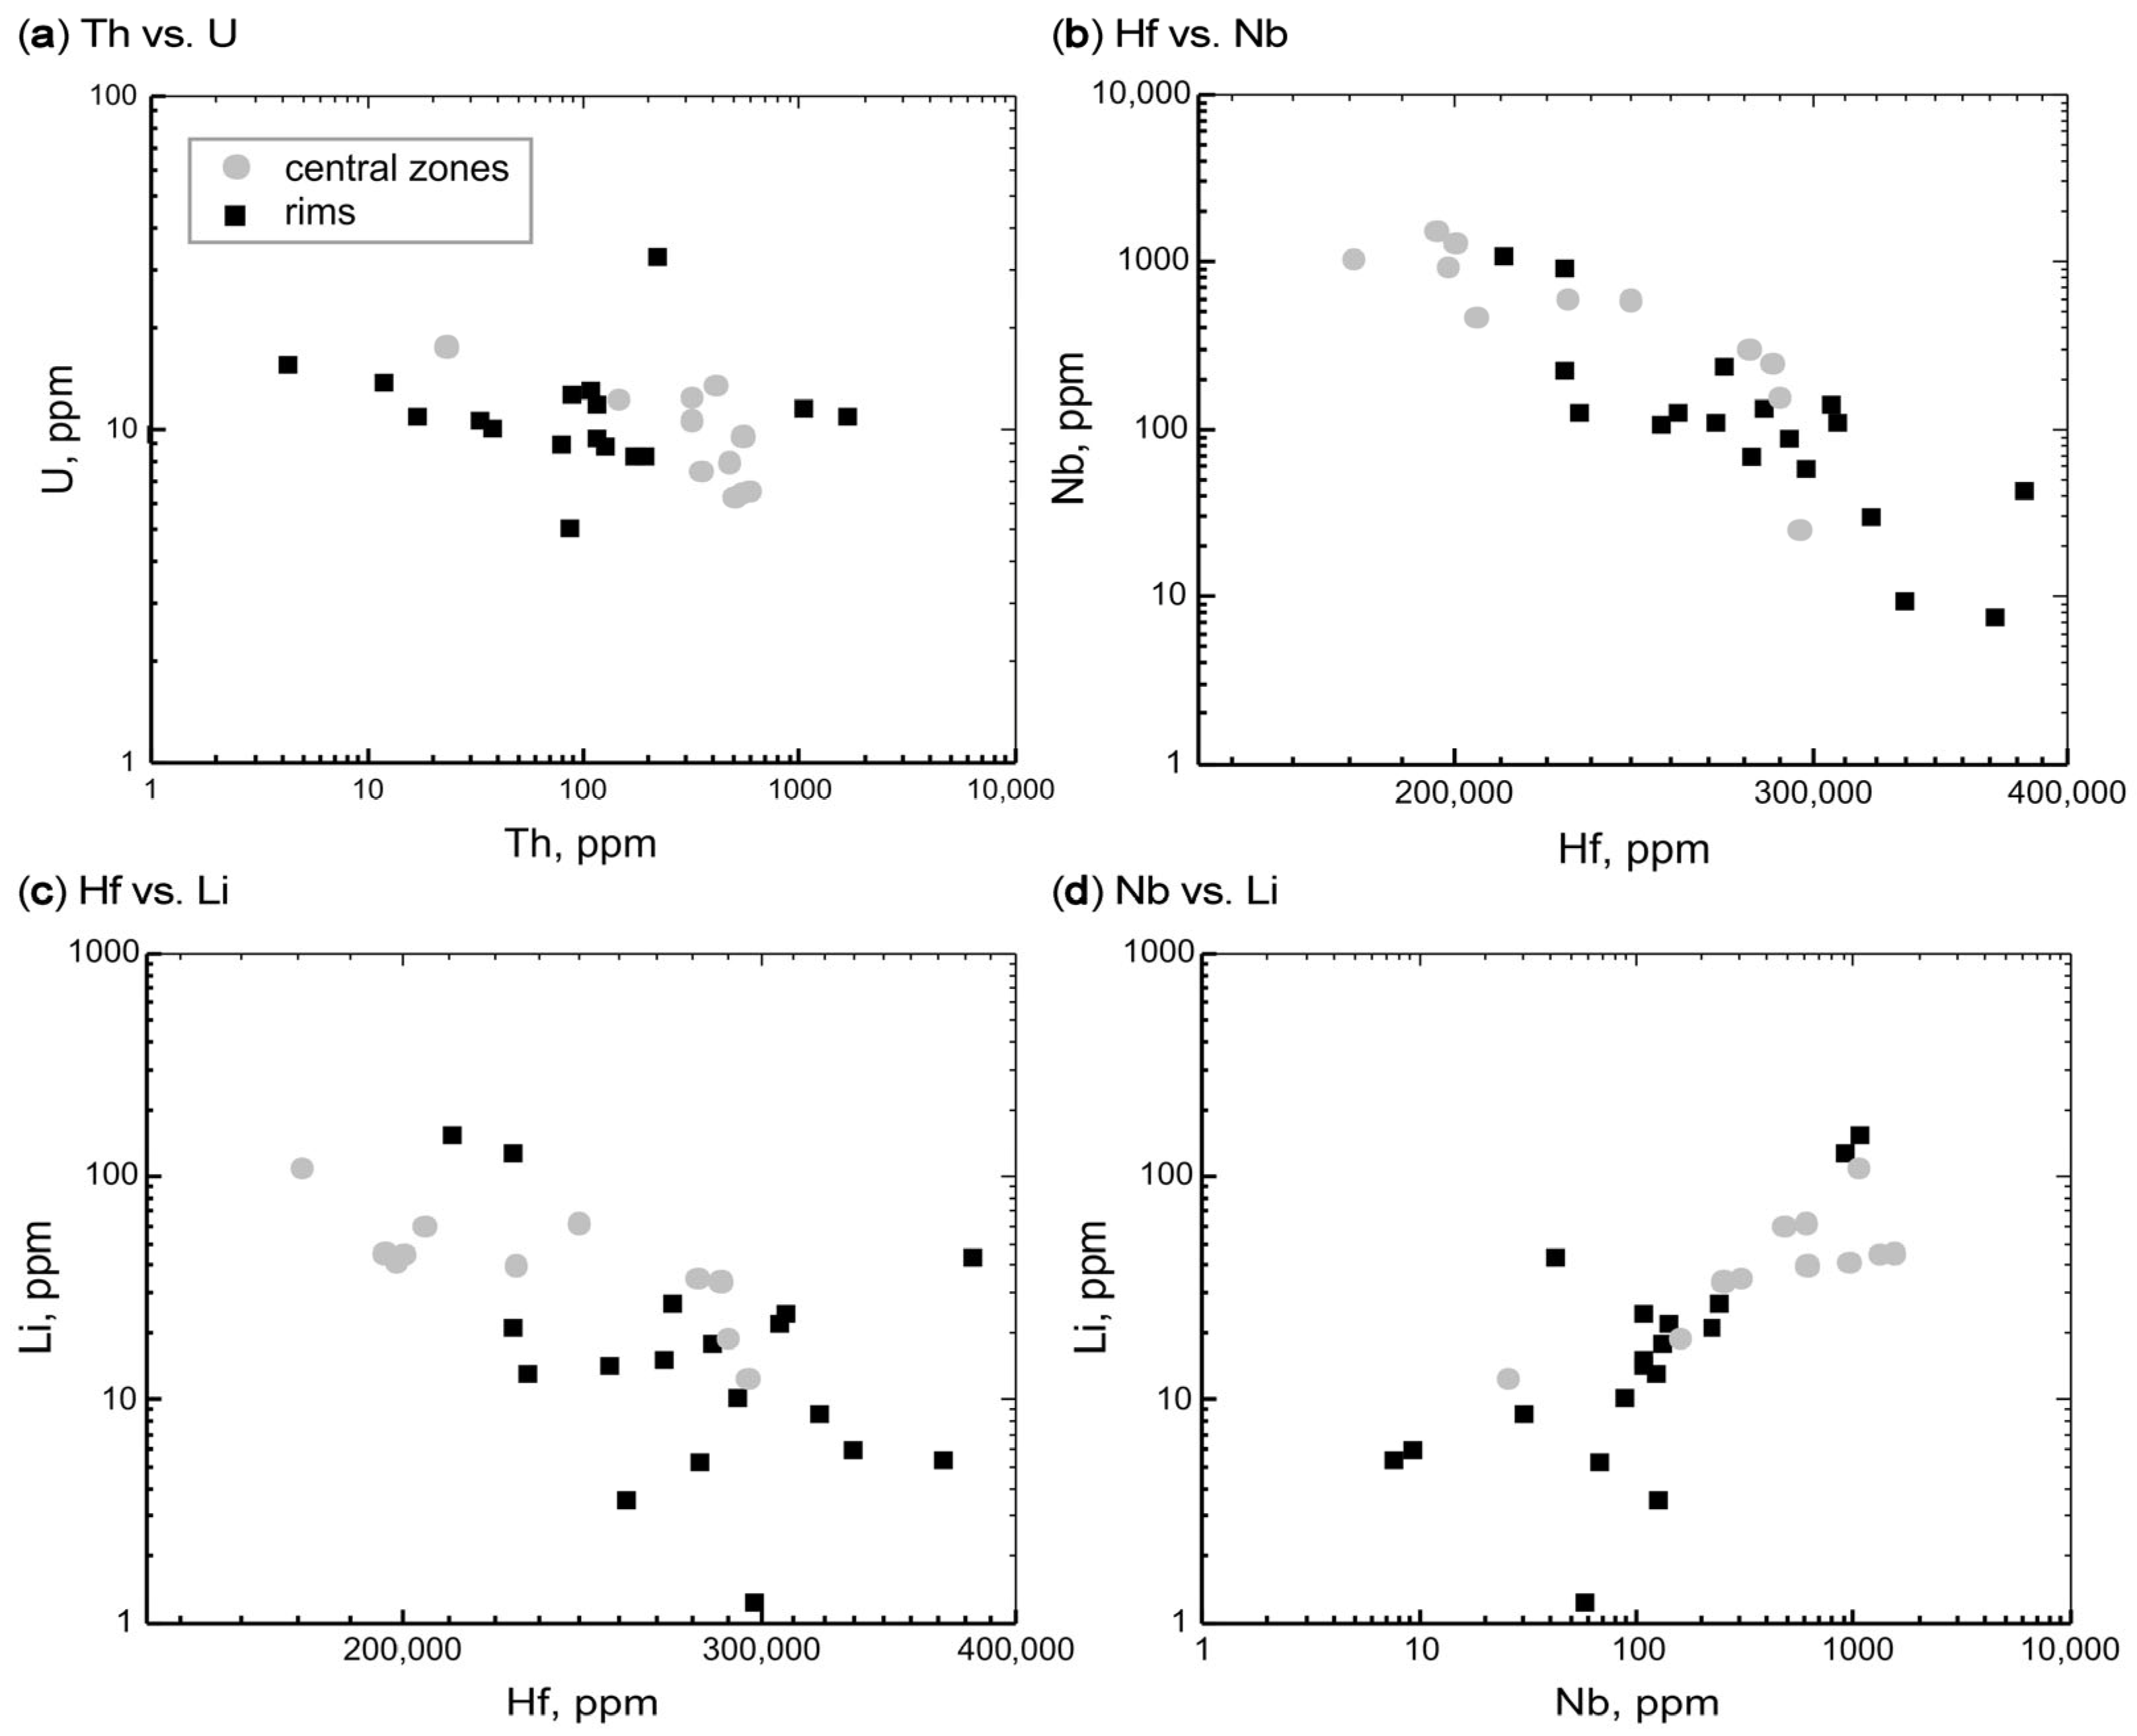
In the studied zircons from the Vasin-Mylk deposit, Hf content shows no significant positive correlation with other trace elements in the rims. However, a positive correlation with U (r = 0.78) exists in the central zones of zircons. These zircons are characterized by extremely low U contents (5–33 ppm), a distinctive feature of the late-generation zircons from the Vasin-Mylk pegmatite veins [7]. Notably, U-Th correlations are absent in the rims and negative in central zones (r = −0.82). On the Th-U diagram (Figure 6a), central zones and rims form two distinct clusters, suggesting different crystallization conditions.
A stable and significant negative correlation is observed between Hf and Nb concentrations in both the central zones and rims of the zircons (r = −0.86 and r = −0.62, respectively; Figure 6b), as well as between Hf and P. This pattern likely reflects the preferential incorporation of these elements into other accessory phases coexisting with zircon, such as apatite and minerals of the columbite group. In the central zones of zircon, Hf displays a significant negative correlation with Li (r = −0.72), whereas this correlation is absent in the high Hf rims (Figure 6c). The analyzed zircons are notably enriched in Li, with concentrations in the central zones being approximately twice those in the rims. This distribution trend is inversely related to that documented for zircons from the Polmostundra and Kolmozero deposits. Li content shows positive correlations with Th, Ca, HREE, P, Ti, Sr, and Ba in the rims and with Ca, Ti, Th, and LREE in the central zones. Notably, a strong positive correlation between Li and Nb characterizes the rims (r = 0.97, Figure 6d), mirroring the behavior reported for zircons from the Polmostundra deposit. Conversely, the correlation in the central zones is not significant, a feature also characteristic of zircons from the Kolmozero deposit [5].
Zircons from the Vasin-Mylk deposit pegmatites are generally characterized by low concentrations of most trace elements (Table 1). Furthermore, with the notable exception of Hf, trace element abundances in the central zones are either higher than or comparable to those in the rims. This trend contrasts with that observed in zircons from the Polmostundra and Kolmozero deposits, which show significant rim enrichment in Hf, Li, F, Cl, H2O, and Ca, alongside depletion in elements such as Th, Nb, U, Y, REE, and Ta [5].
A marked difference is observed between the REE patterns of the CL-dark central zones and the CL-light rims. The CL-dark central zones display well-differentiated spectra with pronounced negative Eu anomalies and predominantly positive Ce anomalies, consistent with a magmatic origin [27]. In contrast, the CL-light, high-Hf rims exhibit less differentiated, sometimes flattened REE patterns. These rims retain marked negative Eu anomalies but show Ce anomalies that vary in amplitude from weakly positive to absent or even negative. This shift in the sign of the Ce anomaly, or its complete disappearance within a single crystal, is typical of zircon that has experienced an alteration in its crystallization environment. This phenomenon could result from changing redox conditions (e.g., due to variations in the oxygen fugacity of the melt [27]) or from interaction with a late-stage fluid or fluid-saturated melt. Such interaction may have triggered recrystallization and the subsequent partitioning of Ce into co-crystallizing phases with a higher affinity for this element [31].
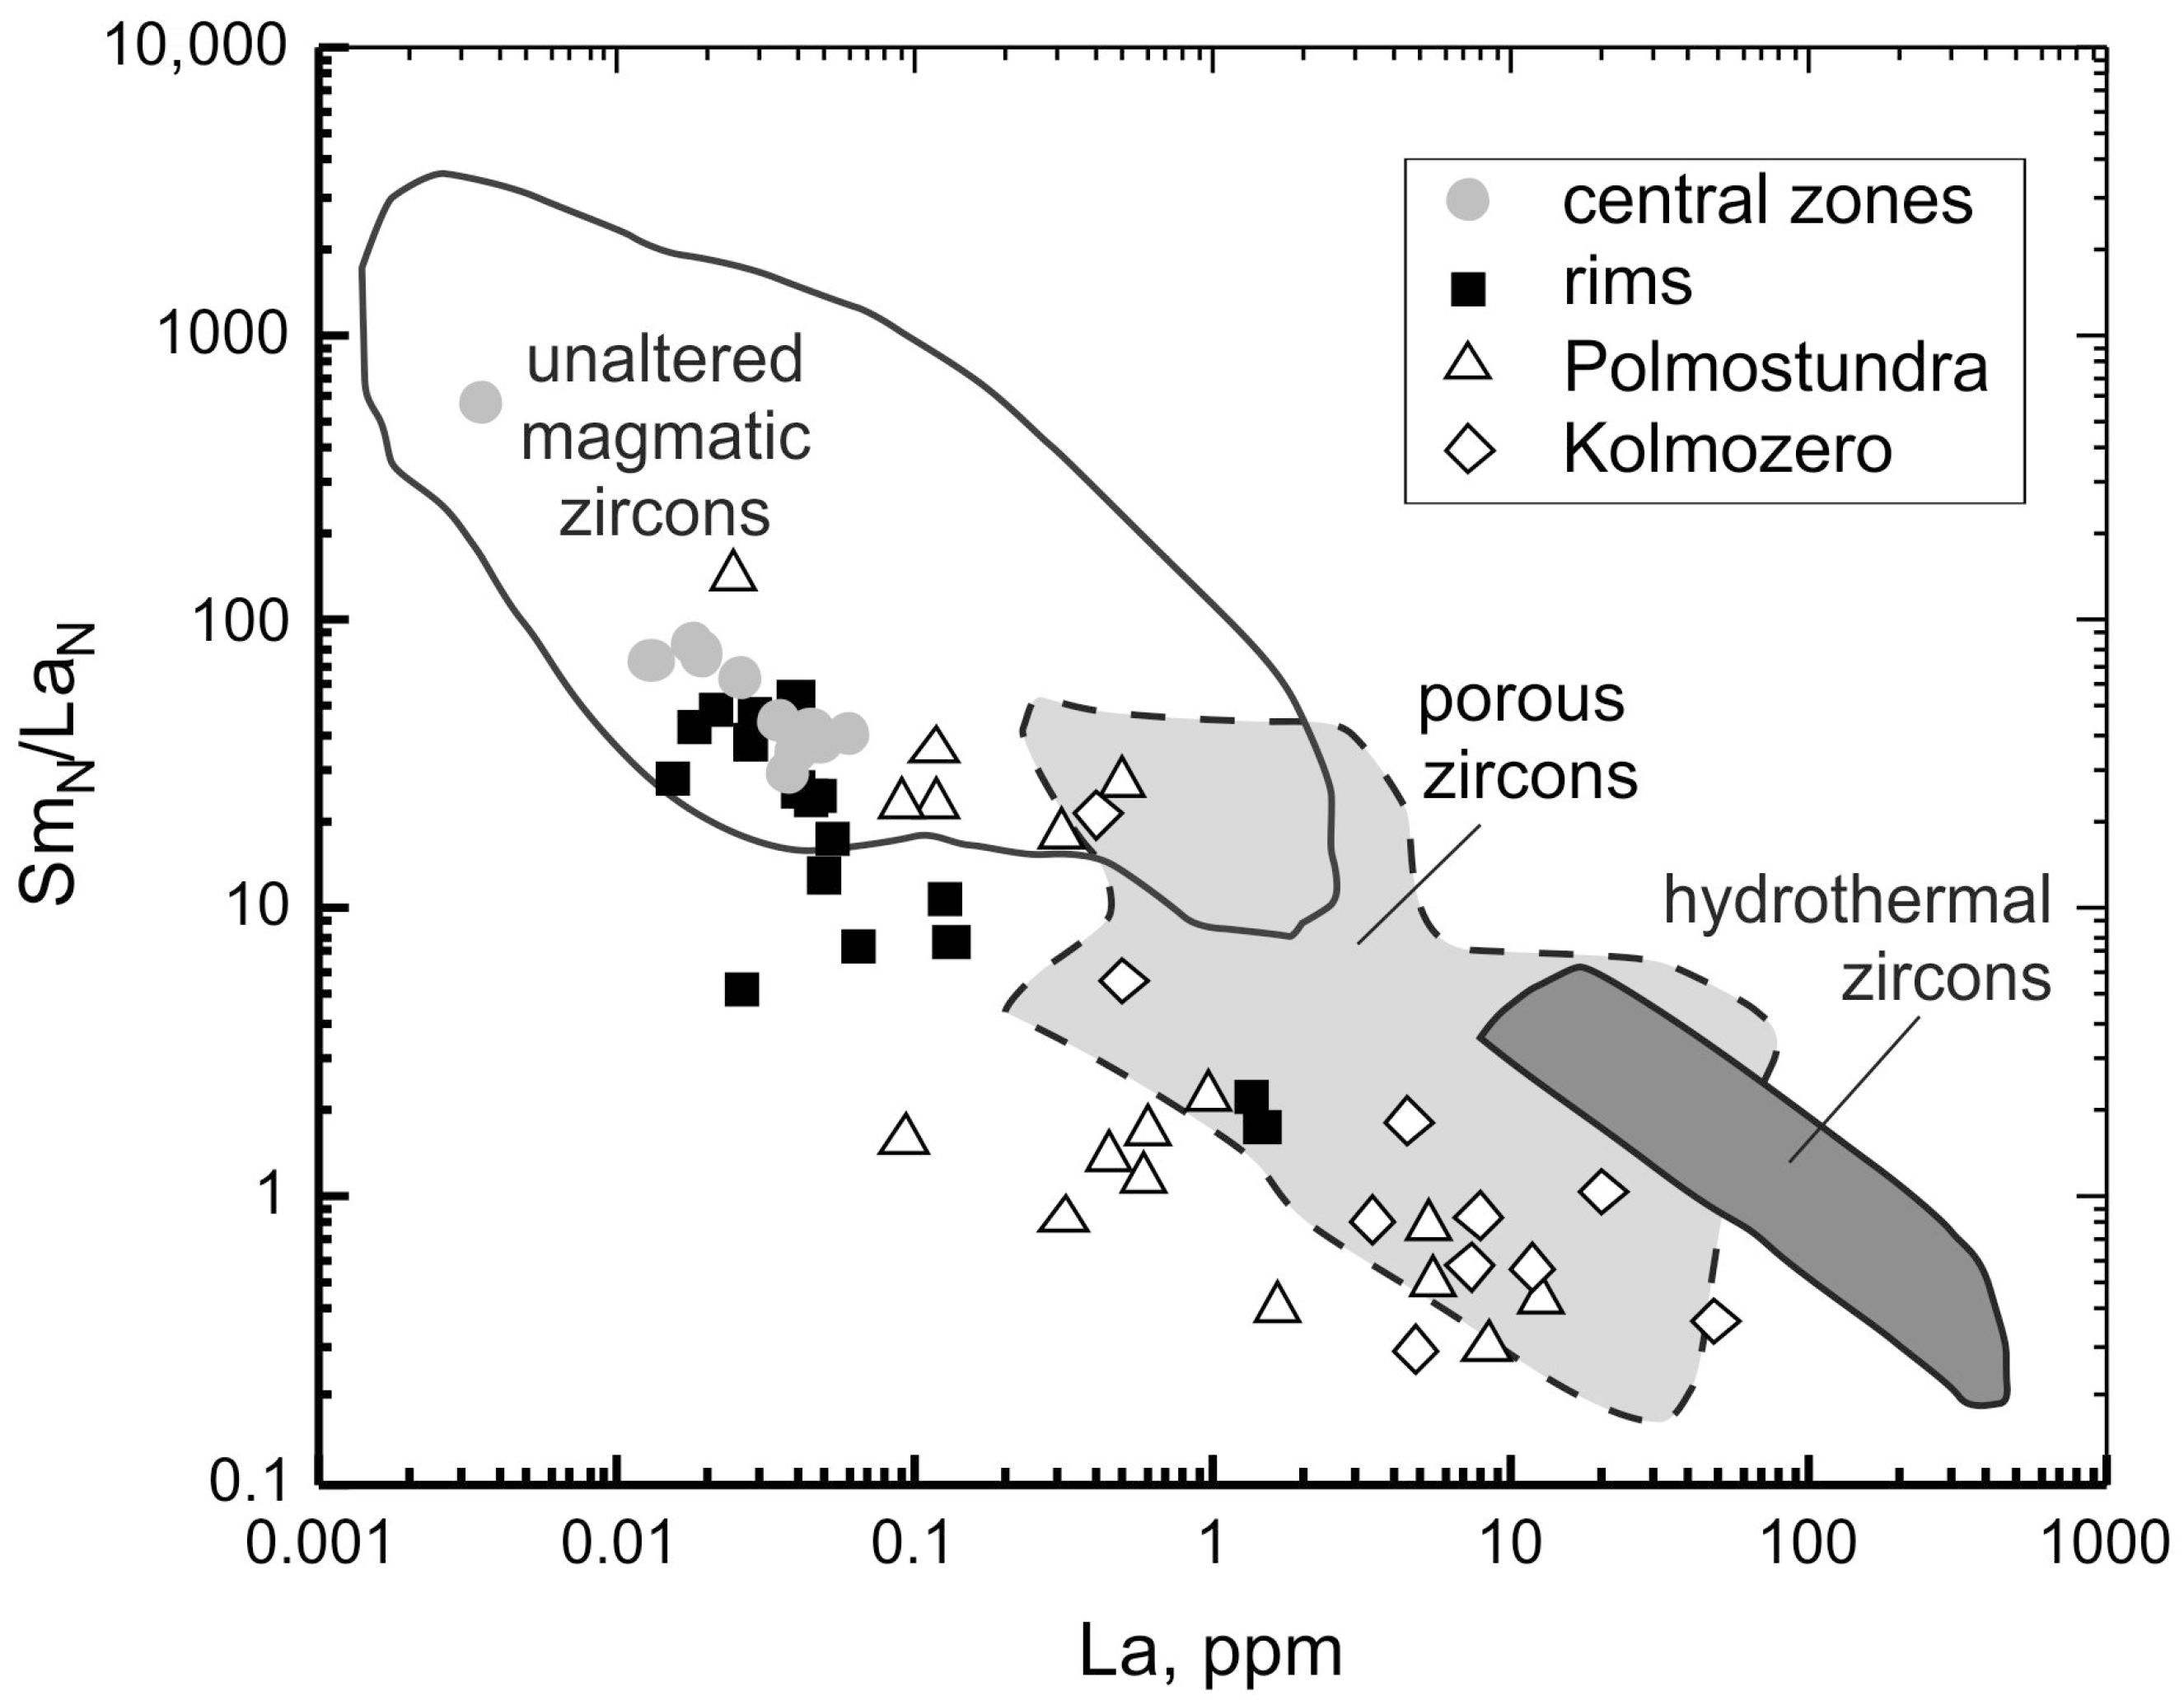
The La–SmN/LaN discrimination diagram (Figure 7) illustrates the degree of LREE differentiation and facilitates the genetic classification of zircons into three groups: magmatic, hydrothermal [32], and altered “porous” zircon that crystallized with significant fluid involvement and is often characterized by a porous internal structure [33]. The rim and central zone compositions of zircons from the Vasin-Mylk deposit form two distinct, compact clusters with a compositional continuum between them. The cluster of the central zone plots entirely within the magmatic zircon field. In contrast, the cluster of the high-Hf rim plots primarily within the magmatic field but partially extends beyond its boundary, approaching the area of altered “porous” zircon. Zircons from both the Vasin-Mylk and the Polmostundra deposits exhibit the uniform trend of compositional zoning within individual grains, a similarity that reflects the genetic affinity of these two pegmatite systems. Conversely, zircon compositions from the Kolmozero deposit plot entirely within the field defined by altered porous zircon.
The REE distribution patterns in both the rims and central zones of zircons from the Vasin-Mylk deposit display additional zigzag features, indicative of the tetrad effect type of REE fractionation [34]. Calculated tetrad effect values range from 0.20 to 1.56 (Table 1), with most data points corresponding to the W-type (TE < 0.8 when analytical uncertainty is considered). Only a single analytical point yields a value of 1.56, characteristic of the M-type. The M-type tetrad effect, distinguished by convex REE patterns, is commonly associated with highly evolved granitoid systems at advanced stages of magmatic differentiation [35,36]. In contrast, the W-type is exceptionally rare, not only in zircon but in rock-forming minerals in general [25,37,38]. A probable reason for its scarce detection is the preferential incorporation of certain REEs (La, Nd, Gd, Ho, Er, and Lu) into coexisting accessory phases [36], which smooths the chondrite-normalized patterns and obscures the tetrad signature. The genesis of the tetrad effect is broadly attributed to two principal mechanisms: the separation of a melt into immiscible silicate and fluoride phases or the interaction of the crystallizing system with a fluid enriched in F, Cl, CO2, and H2O [39,40,41]. In both cases, the key process is the REE redistribution which occurs under physicochemical conditions conducive to their non-charge and radius-controlled fractionation [42]. REE mobility is significantly enhanced during hydrothermal alteration, increasing with the fluid-to-melt ratio [39,41]. Zircon crystallizing near the magmatic–hydrothermal transition in late-stage granitic facies often yields low analytical totals [43,44], typically linked to the incorporation of volatiles. Zircons from granitic pegmatites, particularly those of the LCT-type, are known to host elevated concentrations of volatile and fluxing components (F, Li, B, Cl, CO2, and H2O) [5]. Consequently, the controlling factor for the manifestation of the W-type tetrad effect in the Vasin-Mylk zircons is likely the presence of a volatile-rich fluid phase in the pegmatite-forming melt. However, the obtained δ18O values (4.75–6.36‰) and their limited ranges (~1.6‰) are consistent with a closed magmatic system unaffected by external fluids of contrasting isotopic composition [45], supporting a magmatic origin for the zircons. The REE pattern of the central zones further confirms this magmatic genesis. In contrast, the CL-light rims reflect transitional conditions from magmatic to hydrothermal regimes. A similar magmatic–hydrothermal transition has been documented in the Dahongliutan LCT pegmatite based on titanite chemistry [46].
The Hf content in zircons directly reflects that of Hf in the parent melt, as zircon is a principal mineral capable of accumulating Hf through isomorphic substitution for Zr. The Hf content in zircons typically increases with progressive magmatic differentiation [27]. Consequently, high-Hf content serves as a reliable proxy for highly evolved granitoid rocks. Zircons from pegmatites often contain even higher Hf concentrations than those from granites [47]. In addition, the Zr/Hf ratio decreases during the fractionation of an Al-saturated melt (with high ASI ≥ 1.0 [48]). The increased Hf content in zircons positively correlates with the presence of high-Al minerals. Zircons from the Vasin-Mylk deposit are closely associated with albite, spodumene, lepidolite, and holtite, i.e., they crystallized from an alumina-saturated melt. Furthermore, zones containing high-Hf zircon are characterized by abundant Li-, F-, and B-bearing minerals (e.g., lepidolite, elbaite, and holtite) [13]. The saturation of a melt with fluxing components like Li, F, and B depresses the crystallization temperature, viscosity, and density [49]. This, in turn, enhances the compatibility of Zr and Hf in the melt [12], as the solubility is governed primarily by the extent of fractional crystallization. A decreasing melt temperature generally increases the partition coefficient for Hf between the zircon and melt, which is often manifested as a negative Hf-Ti correlation [50,51,52]. Notably, such a correlation is absent in the studied zircons. Thermometric estimates based on Ti content in zircon [18] indicate formation temperatures between 390 and 590 °C. These values are lower than typical for pegmatites, a feature likely attributable to the presence of fluid components (B, F, P, and H2O) in the pegmatite-forming melt [53].

6. Conclusions

  • Compositional data for a rare earth element in high-Hf zircons from the Vasin-Mylk rare-metal deposit indicate a high degree of differentiation within the parental magmatic melt. Consequently, these zircons serve as indicators of late evolutionary stages of highly differentiated LCT-type pegmatites.
  • The distinct rare earth element distribution patterns in zircon, displaying a W-type tetrad effect, indicate crystallization from a pervasively fluid-rich melt during the terminal stage of LCT pegmatite formation.
  • Oxygen isotope data indicate the absence of a significant influence from external fluids, suggesting that rare-metal mineralization formed from internal fluids within the pegmatite-forming melt.
  • Differences have been established between the “magmatic” central zones of zircons and the “transitional” (from magmatic to hydrothermal) high-Hf rims, reflecting the complex, multi-stage crystallization history of pegmatite bodies. Therefore, the high-Hf zircons from the Vasin-Mylk deposit record the transition from the magmatic to subsequent hydrothermal stage during highly differentiated pegmatite evolution.
This research elucidates the specific formation conditions of the unique high-Hf zircons at the Vasin-Mylk deposit and provides critical insights into the broader evolution of rare-metal pegmatites. The findings establish a framework for future fundamental and applied research in this domain. Moreover, studying high-Hf zircons is significant both for genetic tracing and as a potential source for Hf—a strategic metal essential for advanced technologies.

Author Contributions

Conceptualization, E.V.K., S.G.S. and N.M.K.; methodology, X.-H.L.; project administration, E.V.K., S.G.S. and N.M.K.; resources, S.G.S., N.M.K. and X.-H.L.; visualization, V.G.K.; original draft preparation, E.V.K.; review and editing, E.V.K., S.G.S., N.M.K. and V.G.K. All authors have read and agreed to the published version of the manuscript.

Funding

This research was supported by funding provided under the State Task of the Institute of Precambrian Geology and Geochronology Russian Academy of Sciences (project FMUW-2022-0005) and of the State Task of the Geological institute of the Kola Science Center Russian Academy of Sciences (project FMEZ-2024-0004).

Data Availability Statement

Data are contained within this article.

Acknowledgments

The authors are grateful to the analysts S.G. Simakin, E.V. Potapov (Valiev IPT RAS, Yaroslavl Branch) and O.L. Galankina (IPGG RAS) for their assistance in measuring zircon element compositions.

Conflicts of Interest

The authors declare no conflicts of interest.

References

  1. Cerný, P. Rare element granitic pegmatites. Part II: Regional and global environments and petrogenesis. Geosci. Can. 1991, 18, 68–81. Available online: https://id.erudit.org/iderudit/geocan18_2art02 (accessed on 15 December 2025).
  2. London, D. Ore-forming processes within granitic pegmatites. Ore Geol. Rev. 2018, 101, 349–383. [Google Scholar] [CrossRef]
  3. Meshram, R.R.; Singh, B.; Mishra, M.K.; Hrushikesh, H.; Siddiqui, A.; Shukla, D.; Akhtar, R.; Meshram, T.M. Petrological and Geochemical Studies of Lepidolite (LCT Type) and Non-Lepidolite Pegmatite’s from Chakrasila, Dhubri District, Assam, North East India. Open J. Geol. 2021, 11, 81–104. [Google Scholar] [CrossRef]
  4. Koopmans, L.; Martins, T.; Linnen, R.; Gardiner, N.J.; Breasley, C.M.; Palin, R.M.; Robb, L.J. The formation of lithium-rich pegmatites through multi-stage melting. Geology 2024, 52, 7–11. [Google Scholar] [CrossRef]
  5. Levashova, E.V.; Zozulya, D.R.; Morozova, L.N.; Skublov, S.G.; Serov, P.A. Zircon as an Indicator of Magmatic-Hydrothermal Transition in the Evolution of Rare Metal Pegmatite (using the example of the Kolmozero and Polmostundra lithium deposits, Kola Peninsula, Russia). Russ. Geol. Geophys. 2024, 65, 1316–1333. [Google Scholar] [CrossRef]
  6. Zozulya, D.; Morozova, L.N.; Kullerud, K.; Bazai, A. Nb-Ta-Sn Oxides from Lithium-Beryllium-Tantalum Pegmatite Deposits of the Kolmozero-Voronja Belt, NW Russia: Implications for Tracing Ore-Forming Processes and Mineralization Signatures. Geosciences 2024, 14, 9. [Google Scholar] [CrossRef]
  7. Kudryashov, N.M.; Lyalina, L.M.; Apanasevich, E.A. Age of rare metal pegmatites of Vasin-Mylk deposit (Kola region): Results of U-Pb geochronological study of microlite. Dokl. Earth Sci. 2015, 463, 753–756. [Google Scholar] [CrossRef]
  8. Kudryashov, N.M.; Udoratina, O.V.; Kalinin, A.A.; Lyalina, L.M.; Selivanova, E.A.; Grove, M.J. U-Pb (SHRIMP-RG) age of zircon from rare-metal (Li, Cs) pegmatites of the Okhmylk deposit of the Kolmozero-Voron’ya greenstone belt (northeast of the Fennoscandian shield). J. Min. Inst. 2022, 255, 448–454. [Google Scholar] [CrossRef]
  9. Salimgaraeva, L.; Berezin, A.; Sergeev, S.; Gubanov, N.; Stetskaya, E.; Skublov, S. Zircons from eclogite-associated rocks of the Marun–Keu complex, the Polar Urals: Trace elements and U–Pb dating. Geosciences 2024, 14, 206. [Google Scholar] [CrossRef]
  10. Neves, J.C.; Nunes, J.L.; Sahama, T.G. High hafnium members of the zircon-hafnon series from the granite pegmatites of Zambézia, Mozambique. Contrib. Mineral. Petrol. 1974, 48, 73–80. [Google Scholar] [CrossRef]
  11. Jacobsen, M.I.; Reeve, J.; Koepke, S.; Perera, N. Pegmatite mineralogy of Western Australia. Miner. Rec. 2007, 38, 319. Available online: https://www.researchgate.net/publication/299616057_Pegmatite_Mineralogy_of_Western_Australia (accessed on 15 December 2025).
  12. Yin, R.; Wang, R.C.; Zhang, A.C.; Hu, H.; Zhu, J.C.; Rao, C.; Zhang, H. Extreme fractionation from zircon to hafnon in the Koktokay No. 1 granitic pegmatite, Altai, northwestern China. Am. Mineral. 2013, 98, 1714–1724. [Google Scholar] [CrossRef]
  13. Kudryashov, N.M.; Skublov, S.G.; Galankina, O.L.; Udoratina, O.V.; Voloshin, A.V. Abnormally high-hafnium zircon from rare-metal pegmatites of the Vasin-Mylk deposit (the northeastern part of the Kola Peninsula). Geochemistry 2020, 80, 125489. [Google Scholar] [CrossRef]
  14. Pozhilenko, V.I.; Gavrilenko, B.V.; Zhirov, D.V.; Zhabin, S.V. Geology of Ore Areas of the Murmansk Region; Mitrofanov, F.P., Bichuk, N.I., Eds.; Kola Science Centre RAS: Apatity, Russia, 2002; p. 359.
  15. Hinton, R.W.; Upton, B.G.J. The chemistry of zircon: Variations within and between large crystals from syenite and alkali basalt xenoliths. Geochim. Cosmochim. Acta 1991, 55, 3287–3302. [Google Scholar] [CrossRef]
  16. Fedotova, A.A.; Bibikova, E.V.; Simakin, S.G. Ion-microprobe zircon geochemistry as an indicator of mineral genesis during geochronological studies. Geochem. Int. 2008, 46, 912–927. [Google Scholar] [CrossRef]
  17. McDonough, W.F.; Sun, S.S. The composition of the Earth. Chem. Geol. 1995, 120, 223–253. [Google Scholar] [CrossRef]
  18. Watson, E.B.; Wark, D.A.; Thomas, J.B. Crystallization thermometers for zircon and rutile. Contrib. Mineral. Petrol. 2006, 151, 413–433. [Google Scholar] [CrossRef]
  19. Mil, K.; Gołębiowska, B.; Pieczka, A.; Włodek, A. Titanite from the NYF-type pegmatites of Szklarska Poręba Huta quarry, Karkonosze granite massif, SW Poland. Acta Geol. Pol. 2024, 74, e20. [Google Scholar] [CrossRef]
  20. Maphumulo, M.S.; Ballouard, C.; Elburg, M.A. Age and origin of NYF pegmatites from the Mesoproterozoic Orange River pegmatite belt (Namaqualand, South Africa): Insights from monazite and titanite UPb geochronology and Nd isotope systematics. Lithos 2025, 510–511, 108110. [Google Scholar] [CrossRef]
  21. Zozulya, D.; Macdonald, R.; Bagiński, B.; Jokubauskas, P. Nb/Ta, Zr/Hf and REE fractionation in exotic pegmatite from the Keivy province, NW Russia, with implications for rare-metal mineralization in alkali feldspar granite systems. Ore Geol. Rev. 2022, 143, 104779. [Google Scholar] [CrossRef]
  22. Li, X.H.; Long, W.G.; Li, Q.L.; Liu, Y.; Zheng, Y.F.; Yang, Y.H.; Chamberlain, K.R.; Wan, D.-F.; Guo, C.-H.; Wang, X.-C.; et al. Penglai zircon megacrysts: A potential new working reference material for microbeam determination of Hf–O isotopes and U–Pb age. Geostand. Geoanal. Res. 2010, 34, 117–134. [Google Scholar] [CrossRef]
  23. Tang, G.Q.; Li, X.H.; Li, Q.L.; Liu, Y.; Ling, X.X.; Yin, Q.Z. Deciphering the physical mechanism of the topography effect for oxygen isotope measurements using a Cameca IMS-1280 SIMS. J. Anal. At. Spectrom. 2015, 30, 950–956. [Google Scholar] [CrossRef]
  24. Tang, G.Q.; Liu, Y.; Li, Q.L.; Feng, L.J.; Wei, G.J.; Su, W.; Li, Y.; Ren, G.H.; Li, X.H. New natural and fused quartz reference materials for oxygen isotope microanalysis. At. Spectrosc. 2020, 41, 188–193. [Google Scholar] [CrossRef]
  25. Monecke, T.; Kempe, U.; Monecke, J.; Sala, M.; Wolf, D. Tetrad effect in rare earth element distribution patterns: A method of quantification with application to rock and mineral samples from granite-related rare metal deposits. Geochim. Cosmochim. Acta 2002, 66, 1185–1196. [Google Scholar] [CrossRef]
  26. Belousova, E.A.; Griffin, W.L.; O’Reilly, S.Y.; Fisher, N.I. Igneous zircon: Trace element composition as an Indicator of Source Rock Type. Contrib. Mineral. Petrol. 2002, 143, 602–622. [Google Scholar] [CrossRef]
  27. Hoskin, P.W.O.; Schaltegger, U. The composition of zircon and igneous and metamorphic petrogenesis. Rev. Mineral. Geochem. 2003, 53, 27–62. [Google Scholar] [CrossRef]
  28. Harley, S.L.; Kelly, N.M. Zircon: Tiny but timely. Elements 2007, 3, 13–18. [Google Scholar] [CrossRef]
  29. Irber, W. The lanthanide tetrad effect and its correlation with K/Rb, Eu/Eu*, Sr/Eu, Y/Ho, and Zr/Hf of evolving peraluminous granite suites. Geochim. Cosmochim. Acta 1999, 63, 489–508. [Google Scholar] [CrossRef]
  30. Valley, J.W.; Kinney, P.D.; Schulze, D.J.; Spicuzza, M.J. Zircon megacrysts from kimberlite: Oxygen isotope variability among mantle melts. Contrib. Mineral. Petrol. 1998, 133, 1–11. [Google Scholar] [CrossRef]
  31. Zhao, Y.; Yang, W.; Leng, C.; Shan, Q.; Niu, H.; Li, N. Exotic REE behaviors of zircon in the Koktokay No. 3 granitic pegmatite, Xinjiang, northwest China. Ore Geol. Rev. 2023, 152, 105329. [Google Scholar] [CrossRef]
  32. Hoskin, P.W.O. Trace-element composition of hydrothermal zircon and the alteration of Hadean zircon from the Jack Hills, Australia. Geochim. Cosmochim. Acta 2005, 69, 637–648. [Google Scholar] [CrossRef]
  33. Bouvier, A.S.; Ushikubo, T.; Kita, N.T.; Cavosie, A.J.; Kozdon, R.; Valley, J.W. Li isotopes and trace elements as a petrogenetic tracer in zircon: Insights from Archean TTGs and sanukitoids. Contrib. Mineral. Petrol. 2012, 163, 745–768. [Google Scholar] [CrossRef]
  34. Kawabe, I.; Masuda, A. The original examples of lanthanide tetrad effect in solvent extraction: A new interpretation compatible with recent progress in REE geochemistry. Geochem. J. 2001, 35, 215–224. [Google Scholar] [CrossRef]
  35. Zhao, Z.; Xiong, X.; Han, X.; Wang, Y.; Wang, Q.; Bao, Z.; Borming, J. Controls on the REE tetrad effect in granites: Evidence from the Qianlishan and Baerzhe Granites, China. Geochem. J. 2002, 36, 527–543. [Google Scholar] [CrossRef]
  36. Nardi, L.V.; Formoso, M.L.; Jarvis, K.; Oliveira, L.; Neto, A.C.B.; Fontana, E. REE, Y, Nb, U, and Th contents and tetrad effect in zircon from a magmatic-hydrothermal F-rich system of Sn-rare metal-cryolite mineralized granites from the Pitinga Mine, Amazonia, Brazil. J. S. Am. Earth Sci. 2012, 33, 34–42. [Google Scholar] [CrossRef]
  37. Minuzzi, O.R.; Bastos Neto, A.C.; Formoso, M.L.; Andrade, S.; Janasi, V.A.; Flores, J.A. Rare earth element and yttrium geochemistry applied to the genetic study of cryolite ore at the Pitinga Mine (Amazon, Brazil). An. Acad. Bras. Ciências 2008, 80, 719–733. [Google Scholar] [CrossRef]
  38. Monecke, T.; Kempe, U.; Trinkler, M.; Thomas, R.; Dulski, P.; Wagner, T. Unusual rare earth element fractionation in a tin-bearing magmatic-hydrothermal system. Geology 2011, 39, 295–298. [Google Scholar] [CrossRef]
  39. Veksler, I.V.; Dorfman, A.M.; Kamenetsky, M.; Dulski, P.; Dingwell, D.B. Partitioning of lanthanides and Y between immiscible silicate and fluoride melts, fluorite and cryolite and the origin of the lanthanide tetrad effect in igneous rocks. Geochim. Cosmochim. Acta 2005, 69, 2847–2860. [Google Scholar] [CrossRef]
  40. Peretyazhko, I.S.; Savina, E.A. Tetrad effects in the rare earth element patterns of granitoid rocks as an indicator of fluoride-silicate liquid immiscibility in magmatic systems. Petrology 2010, 18, 514–543. [Google Scholar] [CrossRef]
  41. Zhao, Z.H.; Bao, Z.W.; Qiao, Y.L. A peculiar composite M-and W-type REE tetrad effect: Evidence from the Shuiquangou alkaline syenite complex, Hebei Province, China. Chin. Sci. Bull. 2010, 55, 2684–2696. [Google Scholar] [CrossRef]
  42. Sastri, V.S.; Bünzli, J.C.; Perumareddi, J.R.; Rao, V.R.; Rayudu, G.V.S. Modern Aspects of Rare Earths and Their Complexes; Elsevier: Amsterdam, The Netherlands, 2003. [Google Scholar] [CrossRef]
  43. Weber, B.; Schmitt, A.K.; de León, A.C.; González-Guzmán, R.; Gerdes, A. Neoproterozoic extension and the Central Iapetus Magmatic Province in southern Mexico–New U-Pb ages, Hf-O isotopes and trace element data of zircon from the Chiapas Massif Complex. Gondwana Res. 2020, 88, 1–20. [Google Scholar] [CrossRef]
  44. Breiter, K. Chemical compositions of zircon from rare-metal granites of different geochemical affiliations–A review. Geol. Carpathica 2025, 76, 227–243. [Google Scholar] [CrossRef]
  45. Hoefs, J. Stable Isotope Geochemistry; Springer: Berlin/Heidelberg, Germany, 2009; p. 437. [Google Scholar]
  46. Tuo, M.J.; Xia, Y.Q.; Madayipu, N.; Li, D.F.; Yu, J.; Li, N. Fingerprinting hydrothermal alteration associated with pegmatite-type Li-(Be) mineralization using titanite. Ore Geol. Rev. 2025, 187, 106993. [Google Scholar] [CrossRef]
  47. Cerný, P.; Meintzer, R.E.; Anderson, A.J. Extreme fractionation in rare-element granitic pegmatites; selected examples of data and mechanisms. Can. Mineral. 1985, 23, 381–421. Available online: https://pubs.geoscienceworld.org/mac/canmin/article-abstract/23/3/381/11780/Extreme-fractionation-in-rare-element-granitic (accessed on 15 December 2025).
  48. Linnen, R.L.; Cuney, M. Granite-related rare-element deposits and experimental constraints on Ta-Nb-W-Sn-Zr-Hf mineralization. In Rare-Element Geochemistry and Mineral Deposits; Linnen, R.L., Samson, I.M., Eds.; Geological Association of Canada, GAC Short Course: Québec, QC, Canada, 2005; pp. 23–46. [Google Scholar]
  49. Linnen, R.L.; Keppler, H. Melt composition control of Zr/Hf fractionation in magmatic processes. Geochim. Cosmochim. Acta 2002, 66, 3293–3301. [Google Scholar] [CrossRef]
  50. Claiborne, L.L.; Miller, C.F.; Walker, B.A.; Wooden, J.L.; Mazdab, F.K.; Bea, F. Tracking magmatic processes through Zr/Hf ratios in rocks and Hf and Ti zoning in zircons: An example from the Spirit Mountain batholith, Nevada. Mineral. Mag. 2006, 70, 517–543. [Google Scholar] [CrossRef]
  51. Claiborne, L.L.; Miller, C.F.; Gualda, G.A.; Carley, T.L.; Covey, A.K.; Wooden, J.L.; Fleming, M.A. Zircon as magma monitor: Robust, temperature-dependent partition coefficients from glass and zircon surface and rim measurements from natural systems. In Microstructural Geochronology: Planetary Records Down to Atom Scale; Moser, D.E., Corfu, F., Darling, J.R., Reddy, S.M., Tait, K., Eds.; Geophysical Monograph; American Geophysical Union: Washington, DC, USA, 2018; pp. 1–33. [Google Scholar] [CrossRef]
  52. Sawaki, Y.; Asanuma, H.; Sakata, S.; Abe, M.; Ohno, T. Trace-element composition of zircon in Kofu and Tanzawa granitoids, Japan: Quantitative indicator of sediment incorporated in parent magma. Isl. Arc 2022, 31, e12455. [Google Scholar] [CrossRef]
  53. London, D. Estimating abundances of volatile and other mobile components in evolved silicic melts through mineral–melt equilibria. J. Petrol. 1997, 38, 1691–1706. [Google Scholar] [CrossRef]
Figure 1. Geological map and cross-section of the Vasin-Mylk rare-metal pegmatite deposit (modified after [14]). The inset map illustrates the deposit location within the Kola Peninsula region.
Geosciences 16 00077 g001
Figure 2. Mineral assemblage of rare-metal pegmatites at the Vasin-Mylk deposit: albite (Ab), quartz (Qz), lepidolite (Lpd), tourmaline (Tur; rubellite variety), and holtite (Hlt).
Geosciences 16 00077 g002
Figure 4. Chondrite-normalized [17] REE patterns of zircons from the Vasin-Mylk pegmatites.
Geosciences 16 00077 g004
Figure 5. δ18O values of zircons from the Vasin-Mylk pegmatite deposit. The marked area indicates the typical mantle zircon range (δ18O = 5.3 ± 0.3‰) [30].
Geosciences 16 00077 g005
Figure 6. Binary plots of trace element concentrations in the studied zircons: (a) Th vs. U, (b) Hf vs. Nb, (c) Hf vs. Li, and (d) Nb vs. Li.
Geosciences 16 00077 g006
Figure 7. Discrimination diagrams for determining zircon genesis. Filled gray circles represent the central zones, and filled black squares represent the rims of the zircon from the Vasin-Mylk deposit. Open triangles correspond to zircon from the Polmostundra deposit and open rhombs correspond to zircon from the Kolmozero deposit [5]. Composition fields are shown according to [32,33].
Geosciences 16 00077 g007
Disclaimer/Publisher’s Note: The statements, opinions and data contained in all publications are solely those of the individual author(s) and contributor(s) and not of MDPI and/or the editor(s). MDPI and/or the editor(s) disclaim responsibility for any injury to people or property resulting from any ideas, methods, instructions or products referred to in the content.