Article

Integrating MCDA and Rain-on-Grid Modeling for Flood Hazard Mapping in Bahrah City, Saudi Arabia


by
Asep Hidayatulloh
1,
Jarbou Bahrawi
1,
Aris Psilovikos
2 and
Mohamed Elhag
1,2,3,4,5,*
1
Department of Water Resources, Faculty of Environmental Sciences, King Abdulaziz University, Jeddah 21589, Saudi Arabia
2
Laboratory of Ecohydraulics & Inland Water Management, Department of Ichthyology and Aquatic Environment, University of Thessaly, 38446 Nea Ionia, Magnisia, Greece
3
Aerospace Information Research Institute, Chinese Academy of Sciences, Beijing 100101, China
4
Department of Geoinformation in Environmental Management, CI-HEAM/Mediterranean Agronomic Institute of Chania, 73100 Chania, Crete, Greece
5
Department of Applied Geosciences, Faculty of Science, German University of Technology in Oman, Muscat 1816, Oman
*
Author to whom correspondence should be addressed.
Geosciences 2026, 16(1), 32; https://doi.org/10.3390/geosciences16010032
Submission received: 30 October 2025 / Revised: 25 December 2025 / Accepted: 26 December 2025 / Published: 6 January 2026

Abstract

Flooding is a significant natural hazard in arid regions, particularly in Saudi Arabia, where intense rainfall events pose serious risks to both infrastructure and public safety. Bahrah City, situated between Jeddah and Makkah, has experienced recurrent flooding owing to its topography, rapid urbanization, and inadequate drainage systems. This study aims to develop a comprehensive flood hazard mapping approach for Bahrah City by integrating remote sensing data, Geographic Information Systems (GISs), and Multi-Criteria Decision Analysis (MCDA). Key input factors included the Digital Elevation Model (DEM), slope, distance from streams, and land use/land cover (LULC). The Analytical Hierarchy Process (AHP) was applied to assign relative weights to these factors, which were then combined with fuzzy membership values through fuzzy overlay analysis to generate a flood susceptibility map categorized into five levels. According to the AHP analysis, the high-susceptibility zone covers 2.2 km2, indicating areas highly vulnerable to flooding, whereas the moderate-susceptibility zone spans 26.1 km2, representing areas prone to occasional flooding, but with lower severity. The low-susceptibility zone, covering the largest area (44.7 km 2), corresponds to regions with a lower likelihood of significant flooding. Additionally, hydraulic simulations using the rain-on-grid (RoG) method in HEC-RAS were conducted to validate the hazard assessment by identifying inundation depths. Both the AHP analysis and the RoG flood hazard maps consistently identify the western part of Bahrah City as the high-susceptibility zone, reinforcing the reliability and complementarity of both models. These findings provide critical insights for urban planners and policymakers to improve flood hazard mitigation and strengthen resilience to future flood events.

1. Introduction

Flooding in arid and semi-arid regions is increasingly intensified by climate change, rapid urbanization, and insufficient flood management infrastructure. In the Kingdom of Saudi Arabia (KSA), cities such as Bahrah have experienced severe flood events in recent years, leading to significant economic losses and posing serious threats to public safety [1]. Owing to its geographical location and hydrological conditions, Bahrah City is particularly vulnerable to flash floods triggered by intense, short-duration rainfall.
Geographic Information System (GIS) and Remote Sensing (RS) techniques have played a crucial role in analyzing natural hazards. Numerous studies have focused on flood hazard mapping and flood susceptibility analysis using GIS [2]. Flood hazard refers to the probability of floods of a given magnitude occurring in a specific place and time, whereas flood susceptibility indicates how prone an area is to flooding based on local conditions, without considering how often floods occur [3]. Several widely used approaches to natural hazard modeling include the Frequency Ratio (FR) method [4], Analytical Hierarchy Process (AHP) [5], Fuzzy Logic [5,6], Artificial Neural Networks (ANNs) [7], and Multi-Criteria Decision Analysis (MCDA) [8], which is used in this study. MCDA is a valuable tool for addressing complex decision-making problems, particularly when dealing with diverse and incomparable datasets or criteria. The integration of MCDA and GIS has been widely used in spatial modeling and natural hazard assessment, with studies demonstrating their effectiveness in generating hazard maps [9,10,11,12].
The AHP method [13] is among the most popular MCDA techniques for decision making. AHP within a GIS framework is a powerful tool for generating accurate flood hazard maps. A previous study highlighted the suitability of AHP as a cost-effective, user-friendly, and efficient method for flood hazard assessment in regional studies [14]. Additionally, AHP allows for the systematic evaluation of multiple flood-related factors, such as topography, land use/land cover (LULC), and rainfall, by assigning relative weights to each criterion. Integrating AHP with GIS enables spatial analysis and good visualization of flood-prone areas. Consequently, AHP has been widely applied in flood hazard assessments across different geographical regions, demonstrating its effectiveness in disaster management [15,16,17].
Hydraulic modeling plays a critical role in understanding flood dynamics. The rain-on-grid (RoG) method is a two-dimensional (2D) hydrodynamic approach that combines hydrological and hydraulic processes by applying rainfall directly to a 2D computational grid. Its growing popularity in flood hazard management is attributed to its ability to accurately simulate overland flow, generate realistic stage hydrographs with proper calibration [18], and incorporate effective rainfall inputs such as SWAT models [19]. Studies have demonstrated its sensitivity to topographic data quality and utility as an alternative to traditional hydrological modeling [20]. Successful applications of RoG include flood simulations in Jakarta, Indonesia [21]; Illinois, USA [22]; western Norway [23]; and the Adyar Basin in Chennai, India [24]. RoG has been applied at varying basin scales, including small or rural catchments [25] and medium [26] and large basins [27].
The main objective of this study is to develop a comprehensive framework for delineating flood susceptibility zones and quantifying flood hazards in Bahrah City through the integration of GIS-MCDA and rain-on-grid hydraulic modeling. The resulting maps provide essential inputs for subsequent flood hazard assessment. A key contribution of this study is the integration of GIS–MCDA-based flood susceptibility analysis with RoG hydrodynamic modeling [28,29]. This framework is further strengthened using spatial overlay and cross-classification to delineate zones where high susceptibility overlaps with greater modeled flood depths, effectively highlighting areas of elevated flood risk. Incorporating a 50-year return period of rainfall into the RoG simulations allows more detailed quantification of flood hazard and clarifies the distinction between susceptibility, hazard, and resulting flood hazard patterns across the study area [30].

2. Study Area

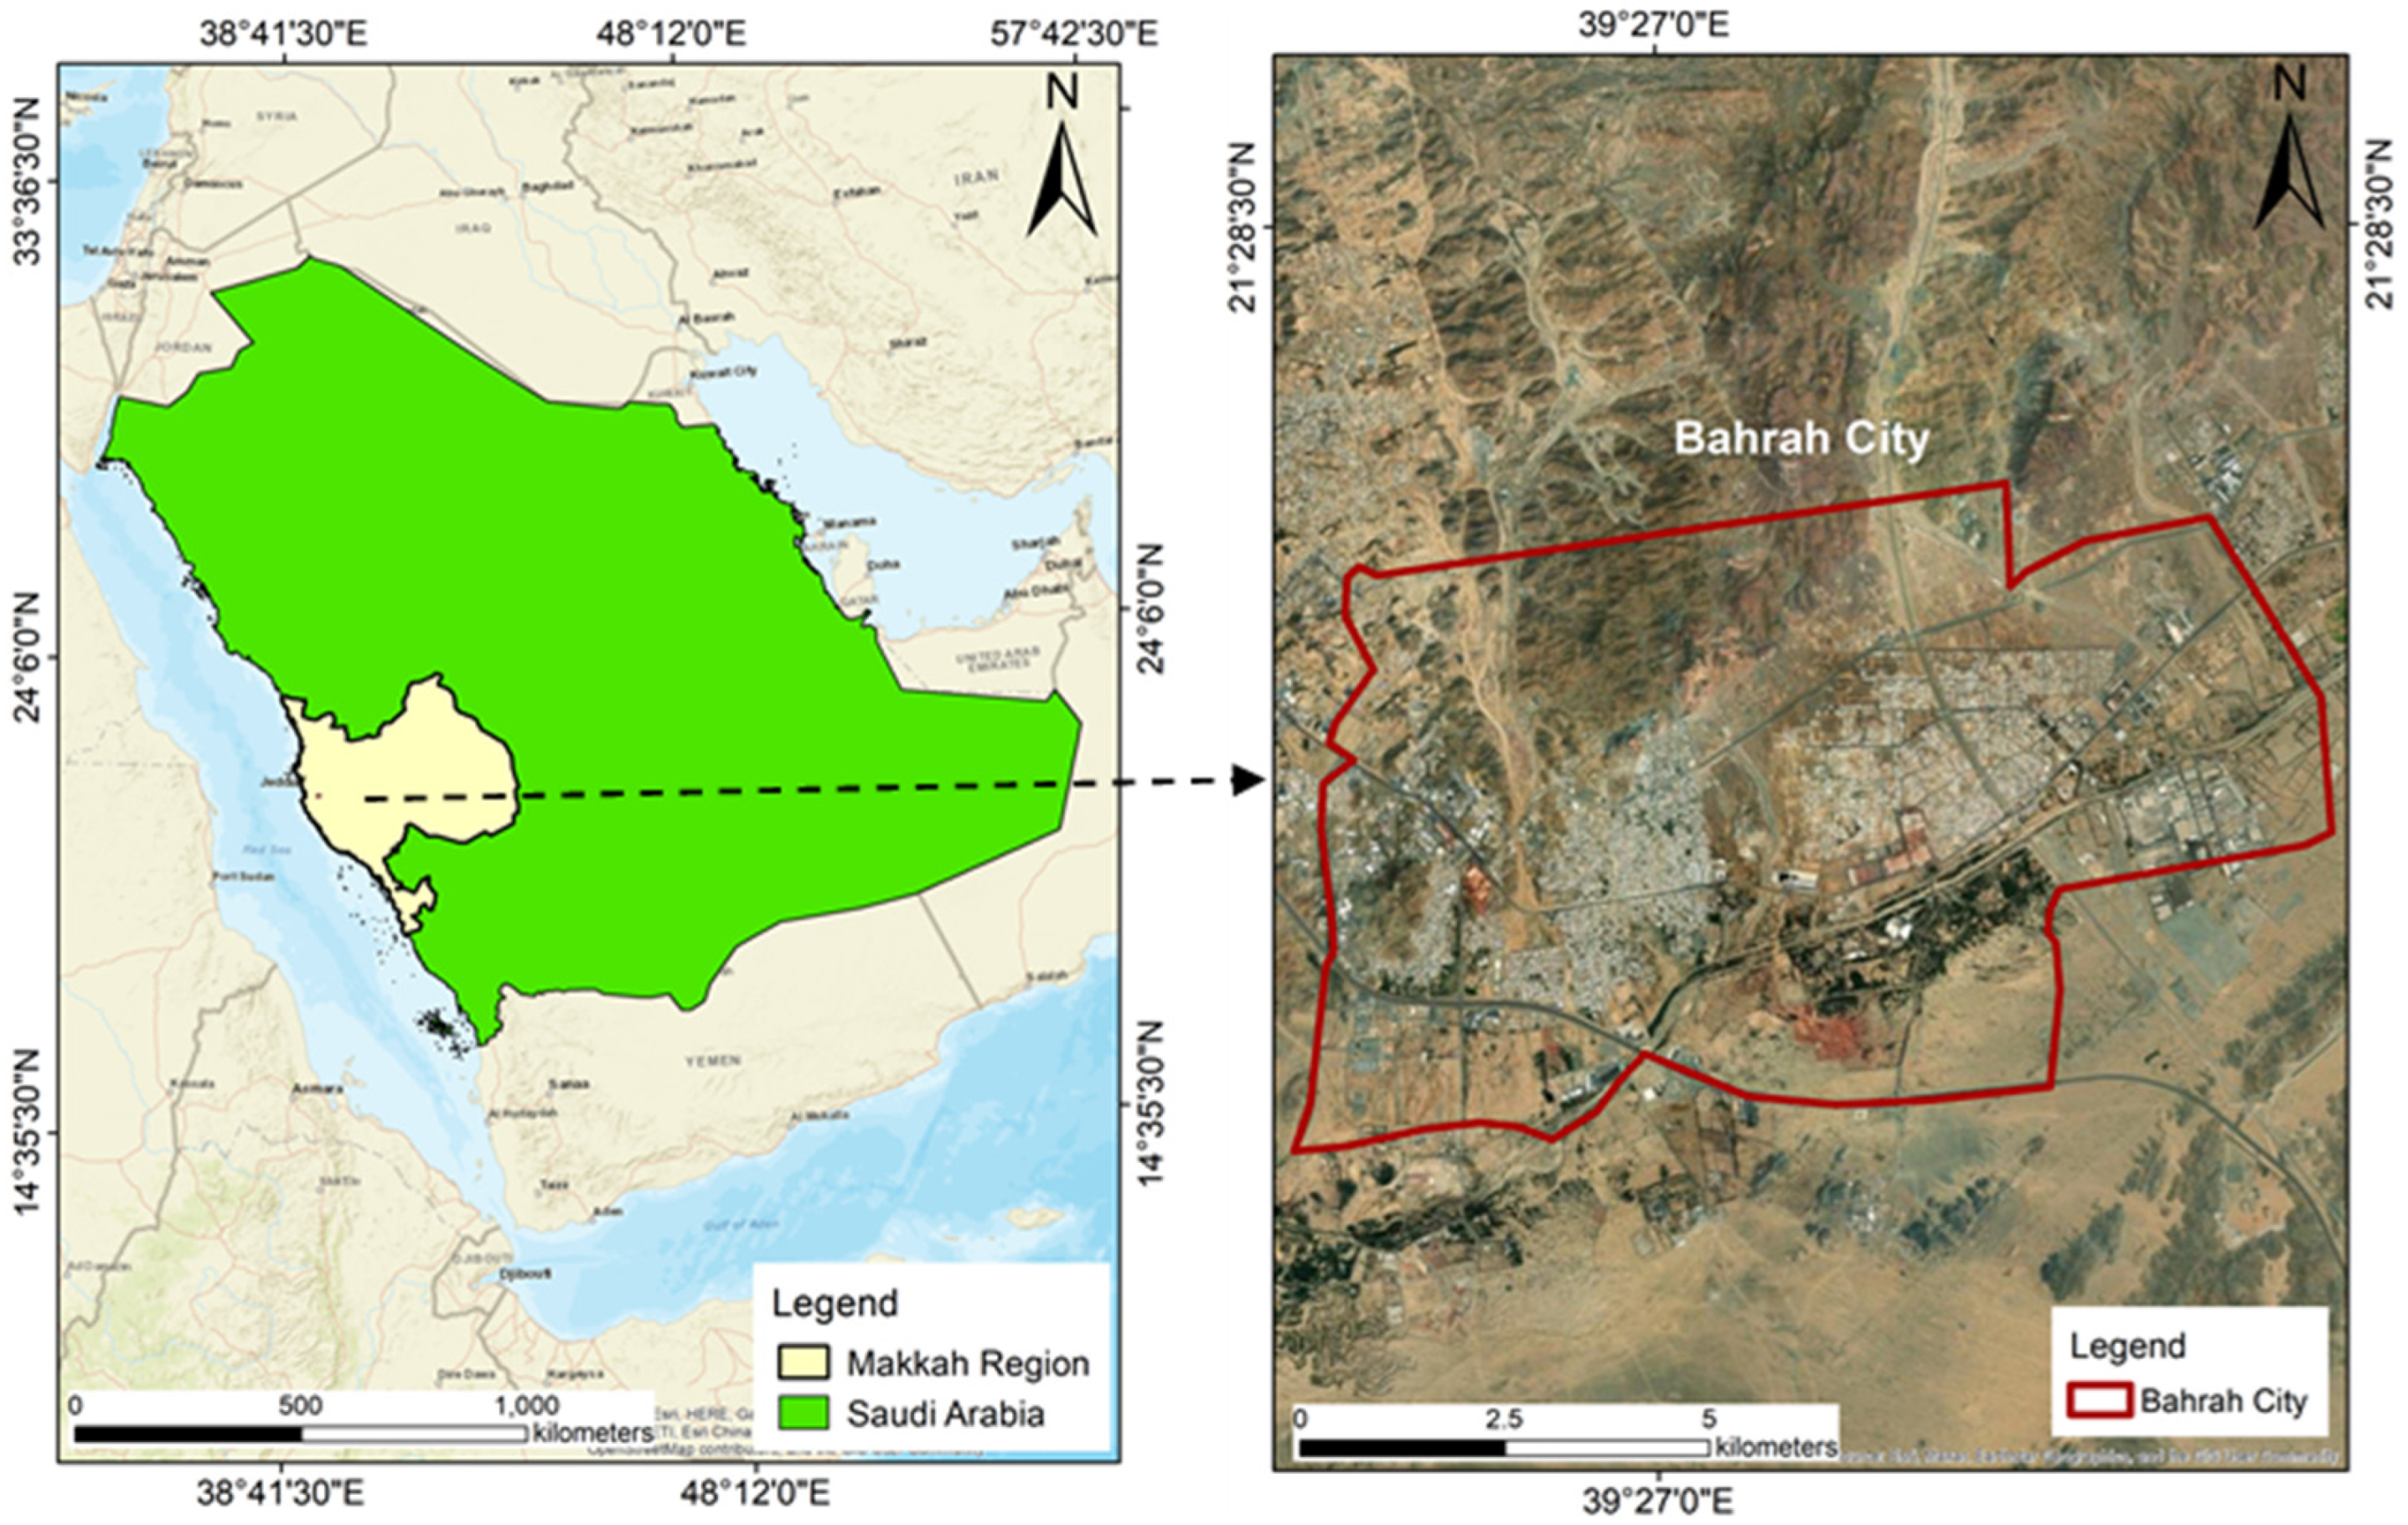
Bahrah City is located in western Saudi Arabia, approximately midway between Jeddah and Makkah City (Figure 1). Geographically, it lies at approximately 21°24′06″ N latitude and 39°27′03″ E longitude. The area of Bahrah City is 74.2 km2. The topography is generally flat, with wadies that can rapidly channel water during heavy rainfall. The lack of a drainage system increases the risk of flooding, particularly in low-lying and newly urbanized areas. Rapid population growth and infrastructure development further exacerbate cities’ vulnerability to extreme weather events [31].
Bahrah City has an arid climate, characterized by high temperatures and sporadic rainfall events that occur mainly during winter. The winter season, spanning November to February, experiences relatively mild temperatures (22–31 °C). In contrast, the summer months are notably hotter, with maximum temperatures frequently reaching 42 °C. Rainfall is generally sparse, with the highest precipitation recorded in November and December at approximately 25 and 20 mm, respectively. Rainfall is nearly absent throughout summer, contributing to the region’s predominantly arid conditions (https://worldweather.wmo.int). These climatic and hydrological patterns are consistent with broader trends observed in western Saudi Arabia, where rapid urbanization and population growth have intensified the vulnerability of cities to extreme weather events and flooding. Urban expansion often encroaches upon natural drainage paths, further exacerbating flood risks due to increased impervious surfaces and insufficient infrastructure to manage runoff [32,33].

3. Data Collection and Methodology

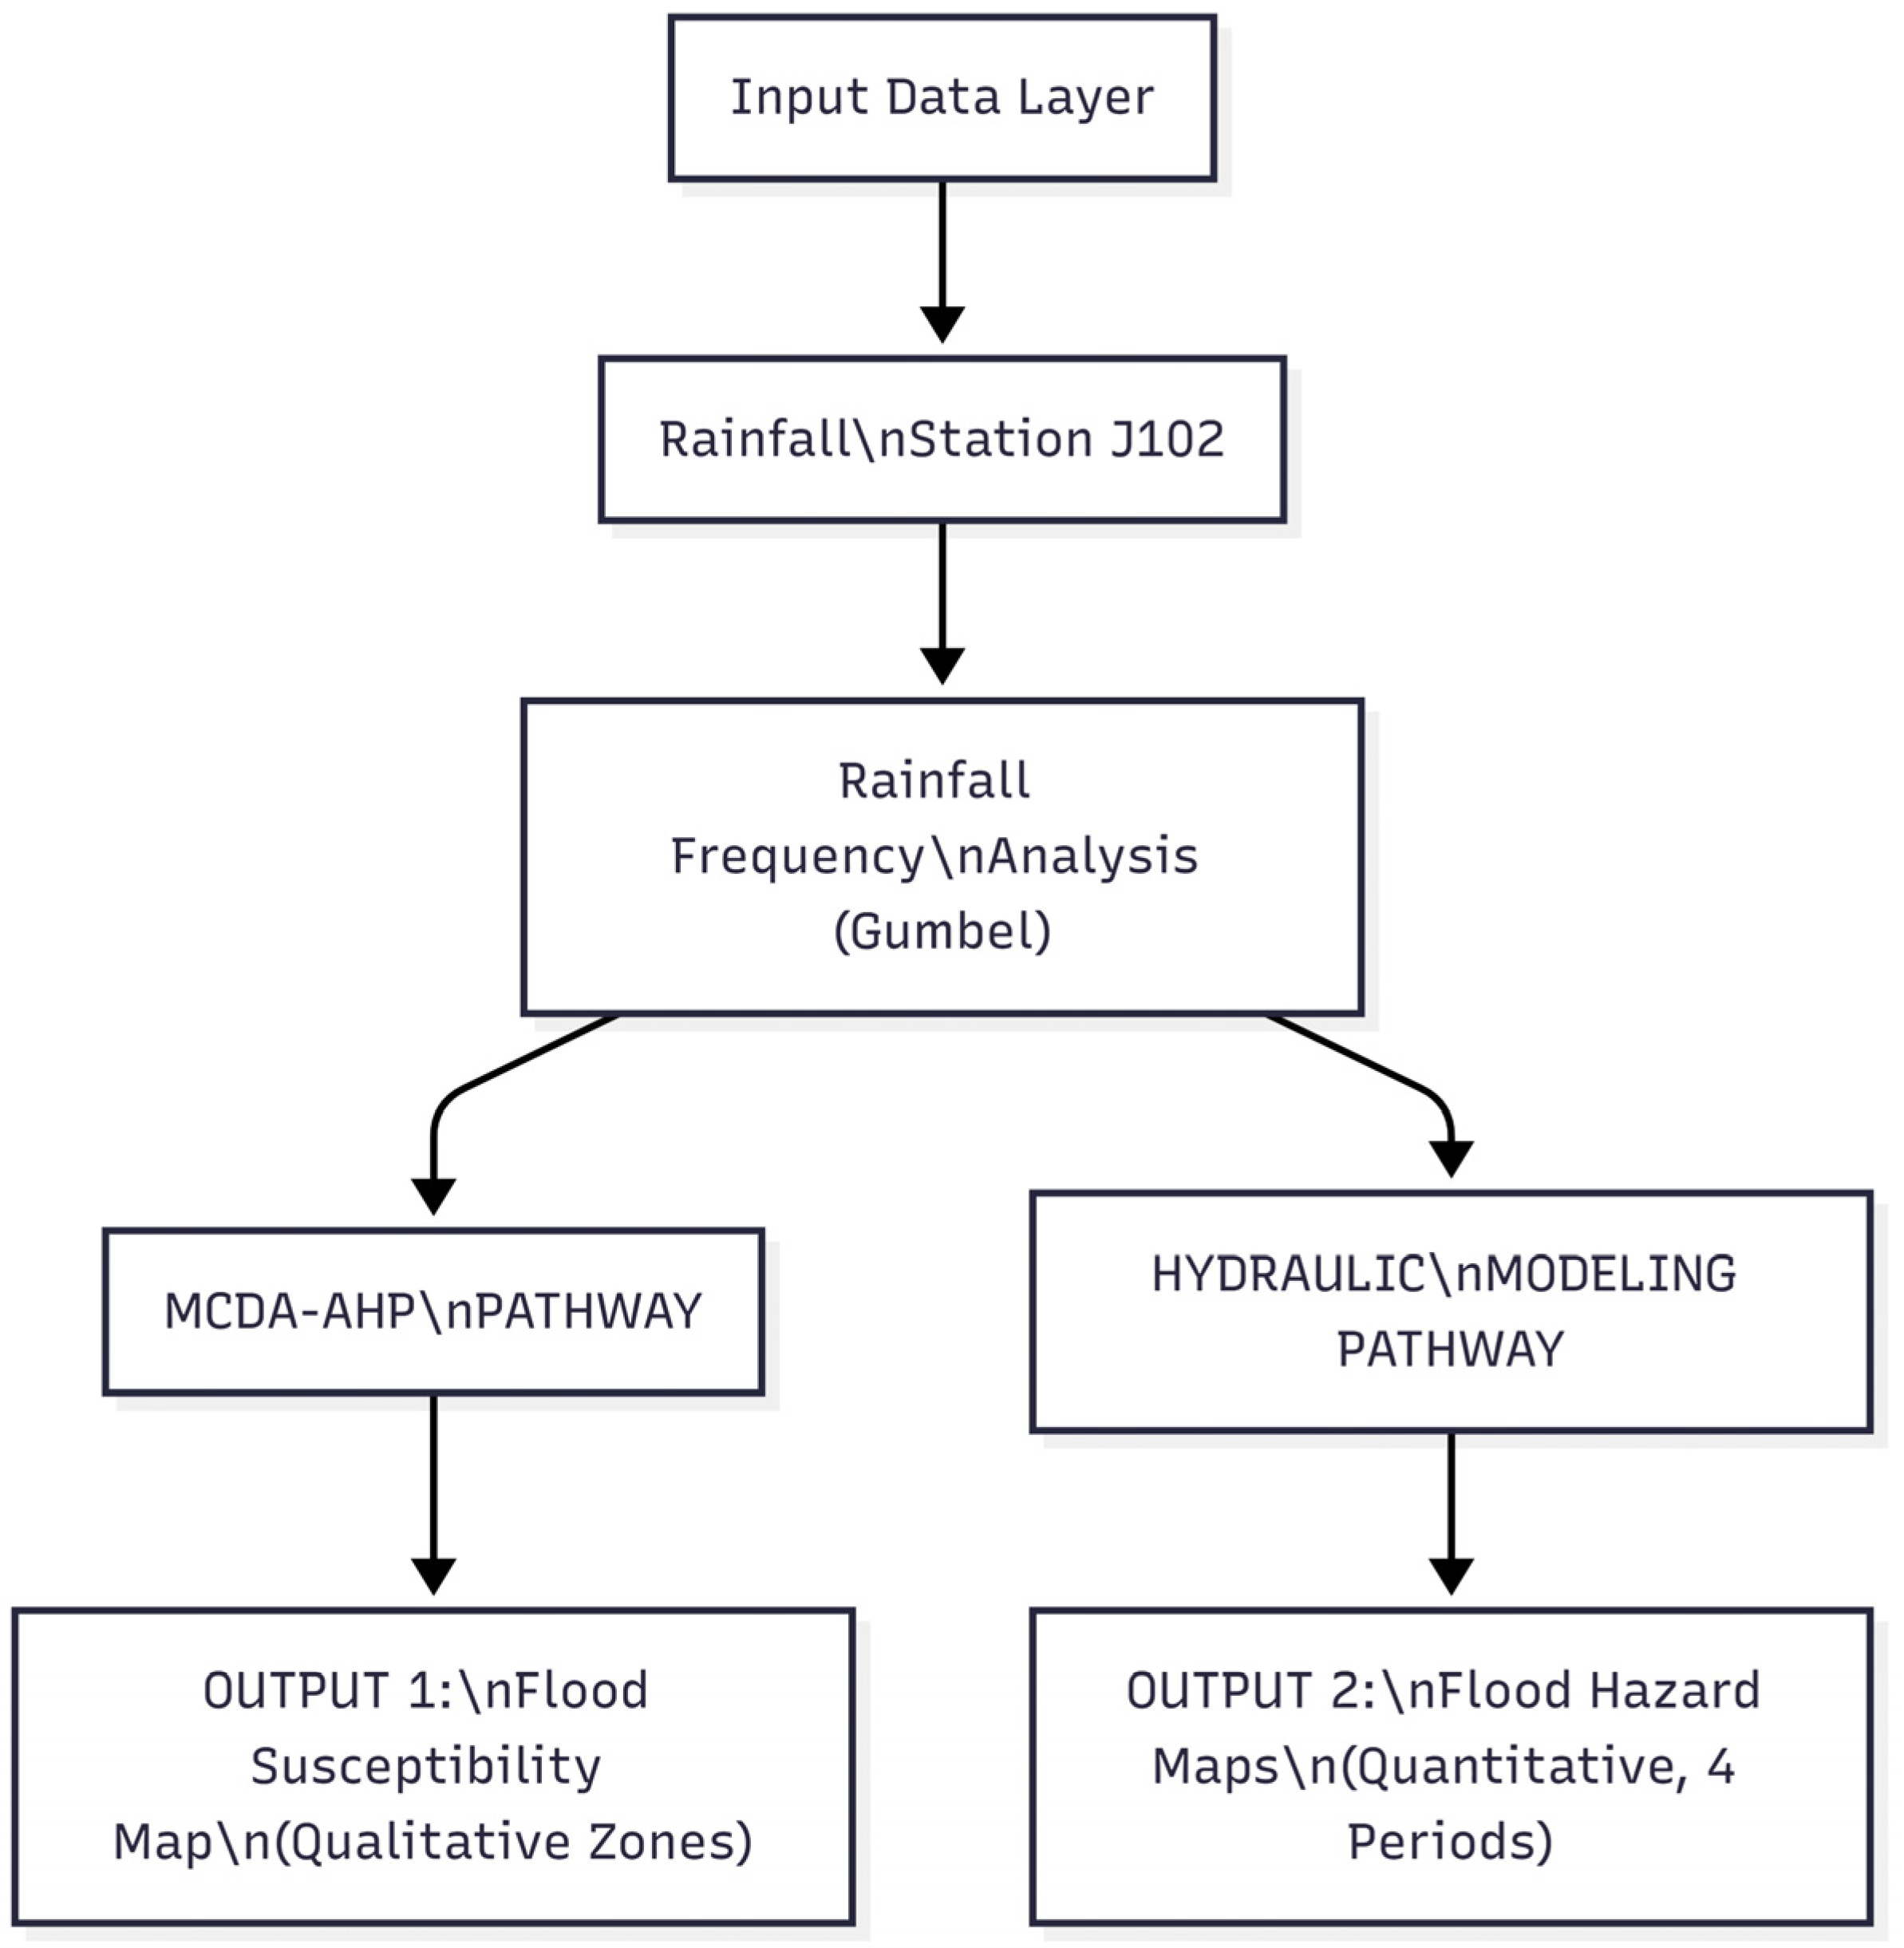
Figure 2 presents the overall framework of the study, outlining the integration of multiple methodologies: the MCDA approach combined with GIS, RS, and hydraulic modeling techniques.

3.1. Data Collection

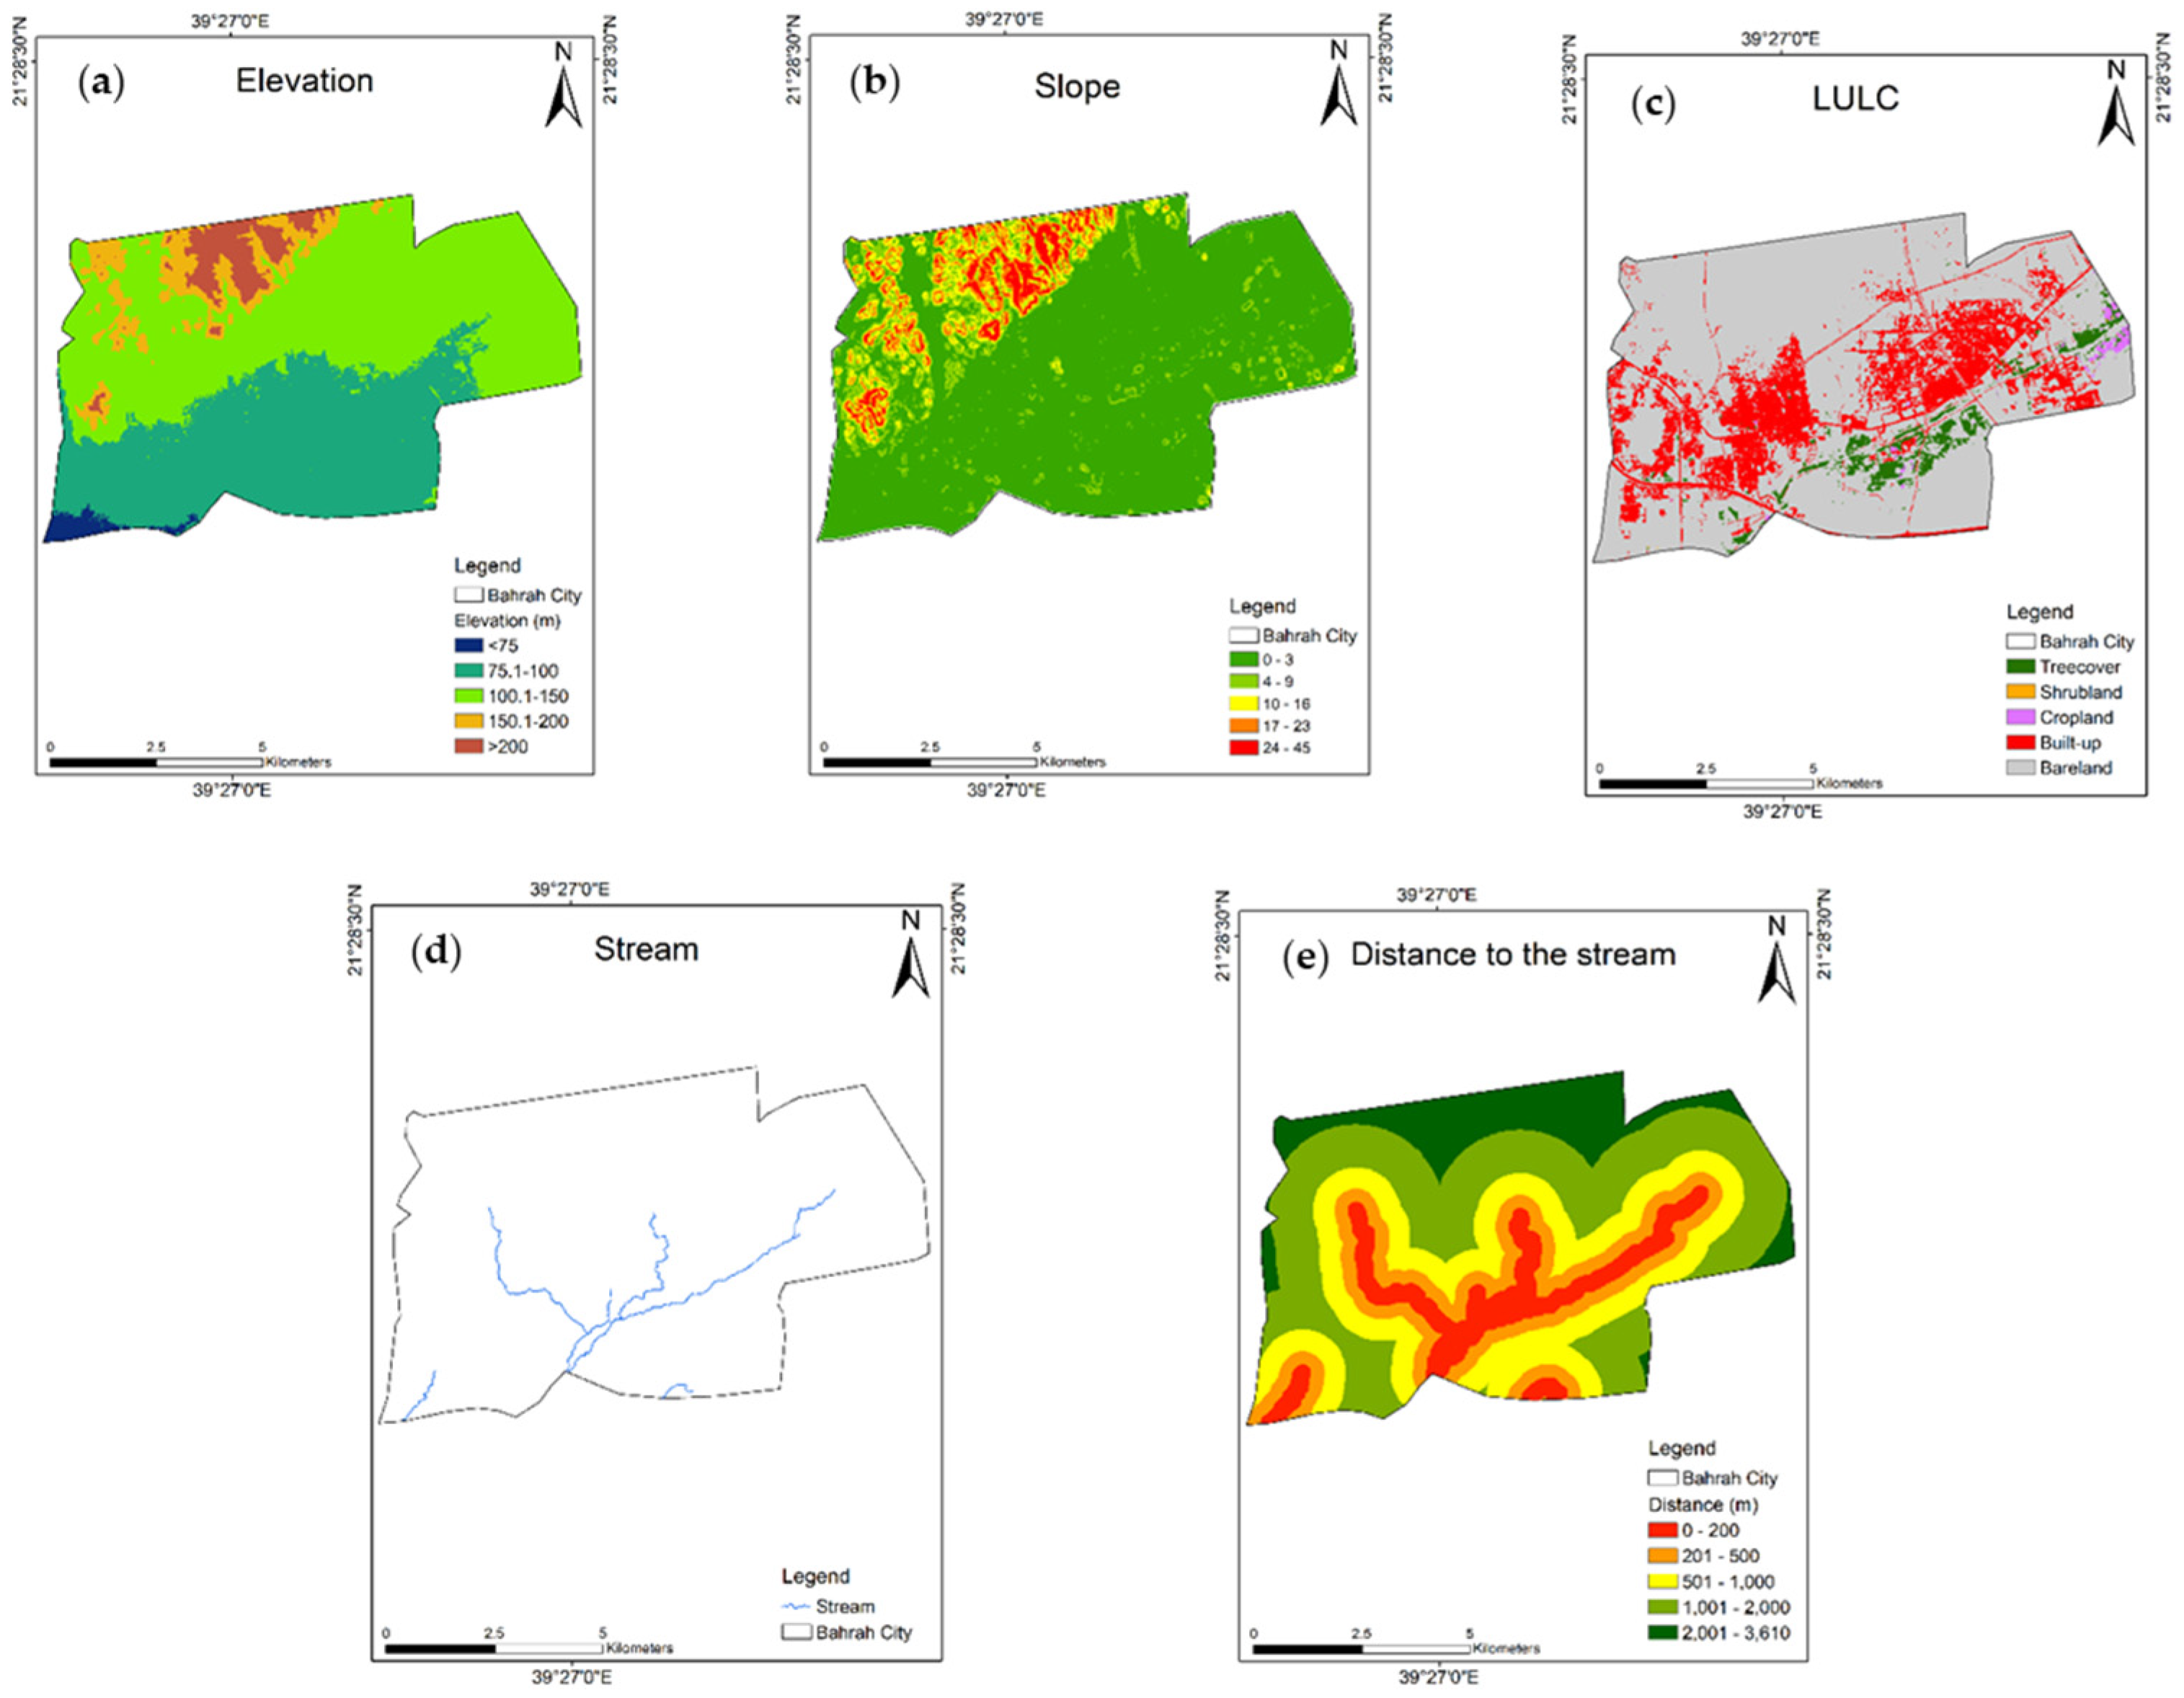
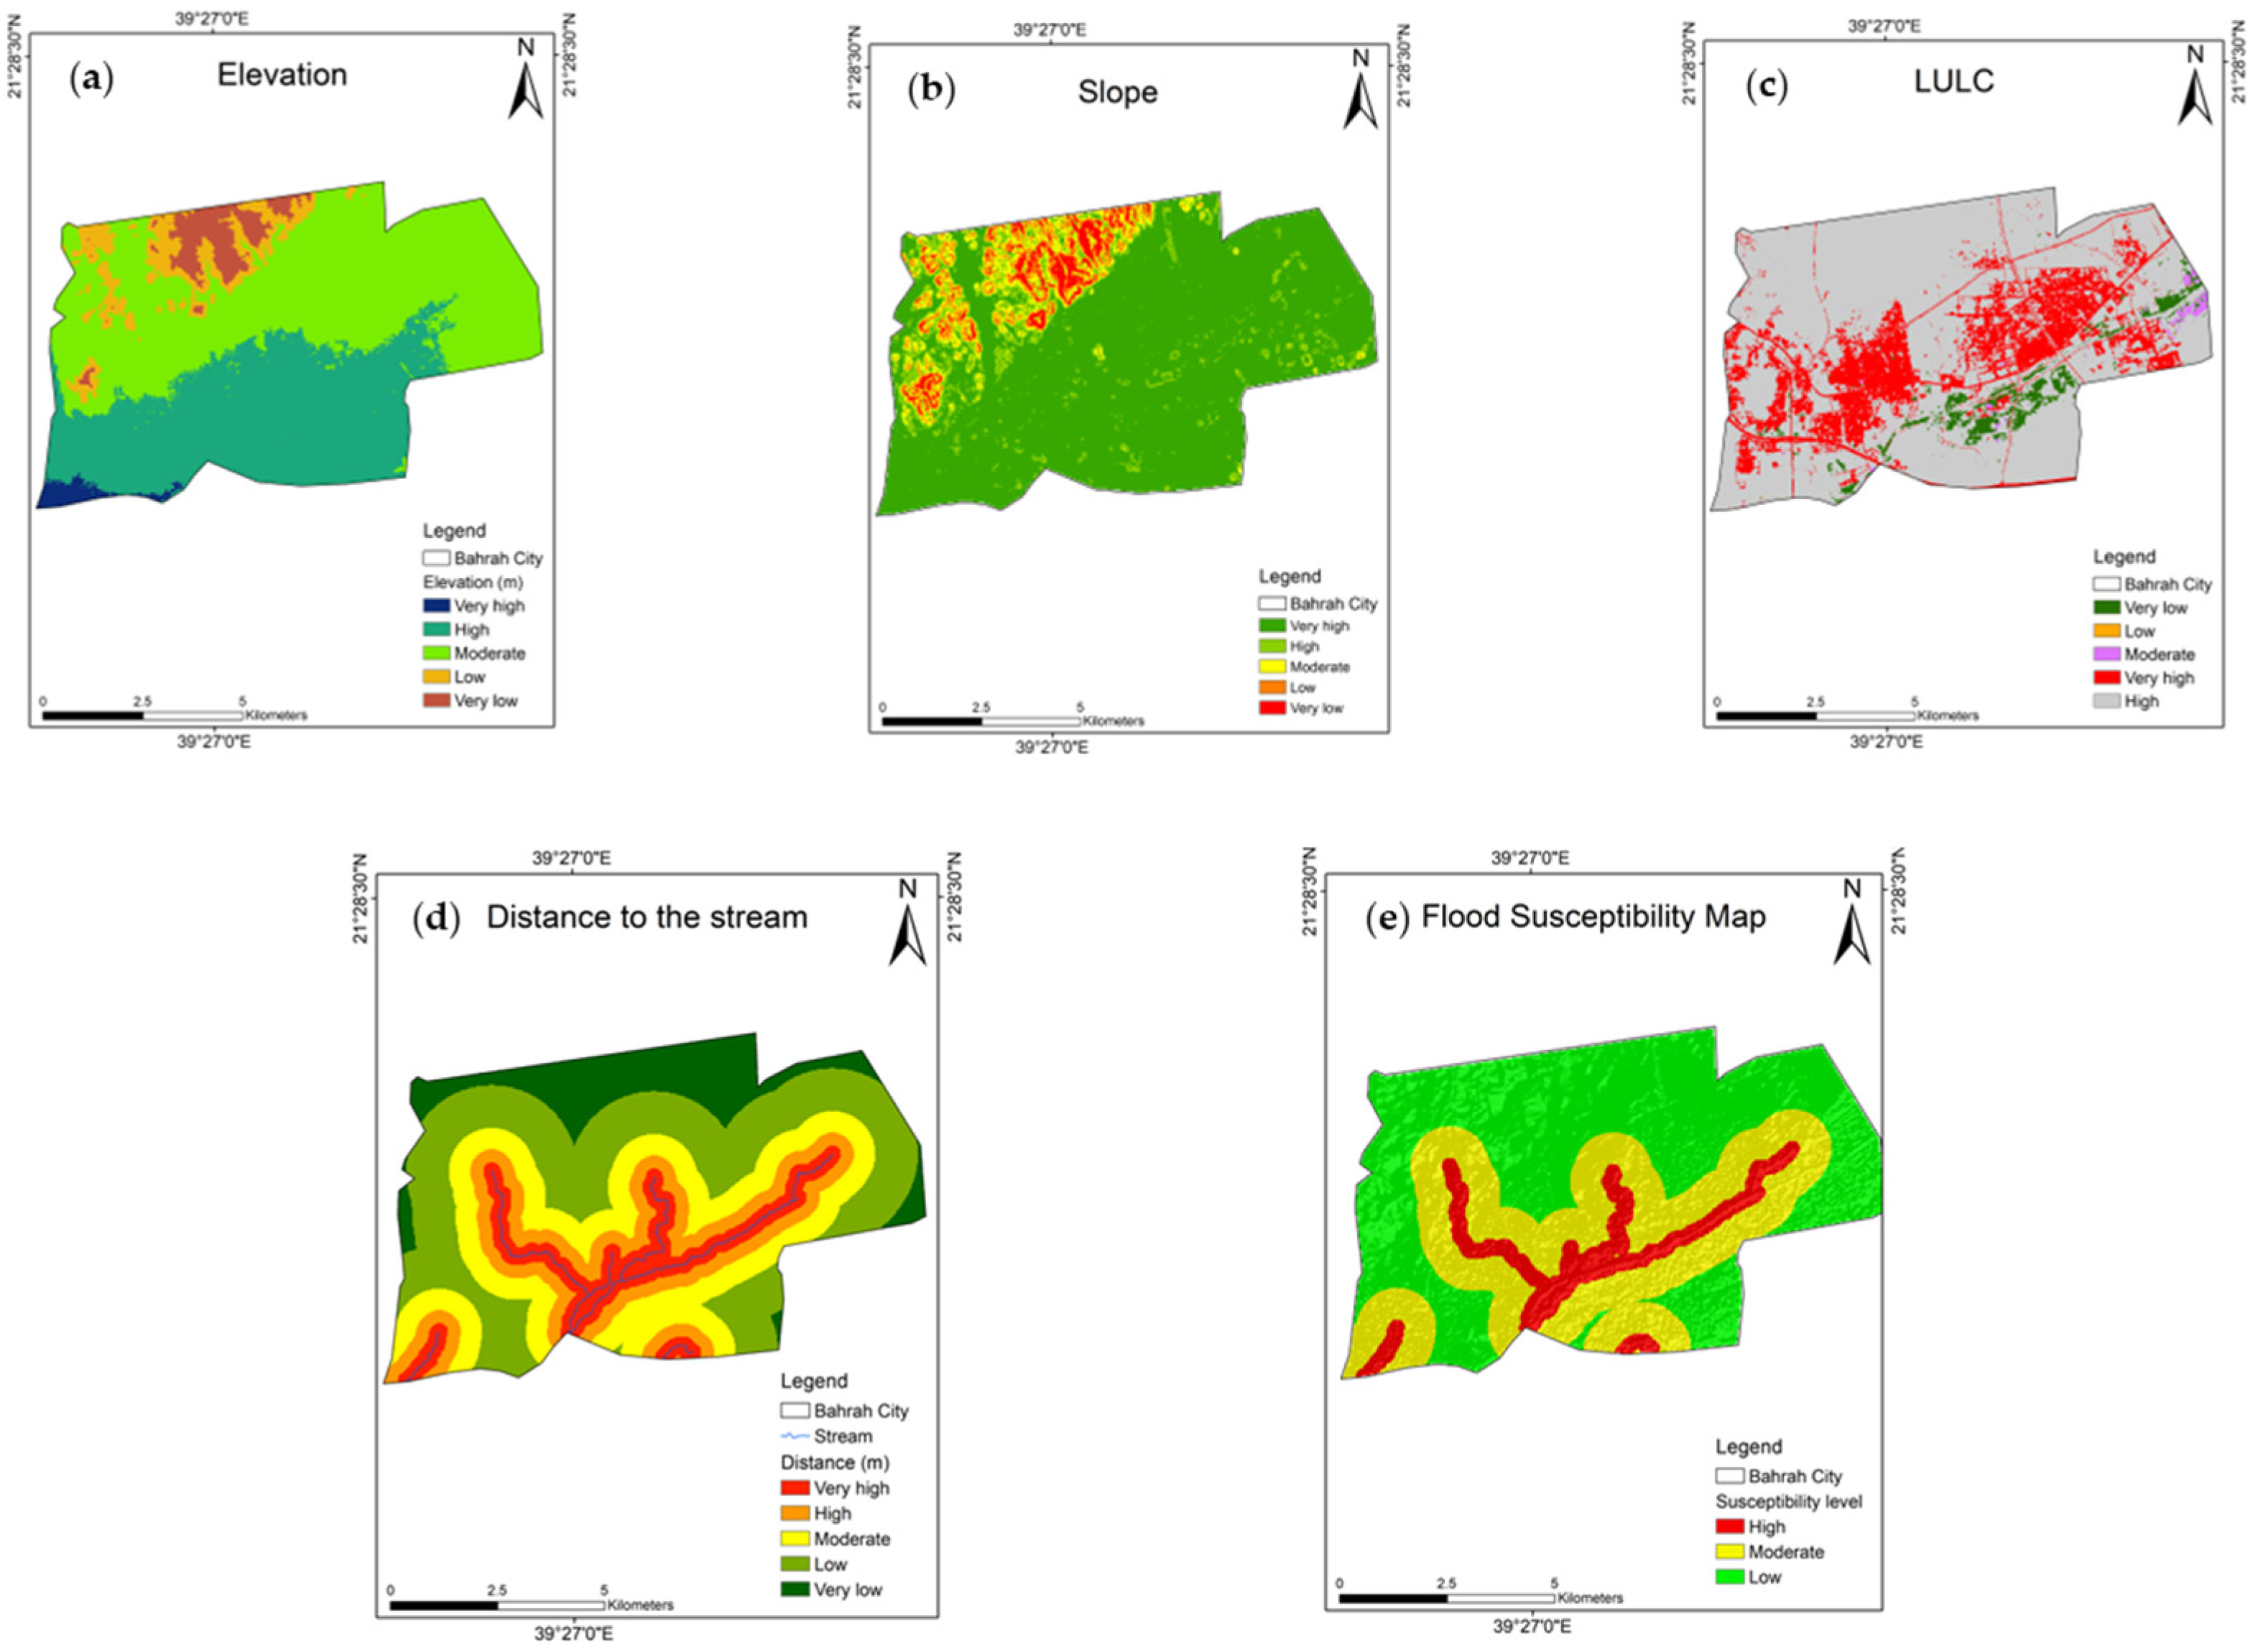
The Digital Elevation Model (DEM) of Bahrah City was sourced from the Copernicus DEM with a 30 m resolution, available at (https://opentopography.org/). The DEM was utilized to derive the slope and distance from the stream and was processed using GIS software. Areas with lower slopes allow more water to infiltrate the soil, leading to a higher risk of flooding compared with steeper slopes [34]. In this study, stream networks were extracted from the DEM using the Flow Accumulation tool in ArcMap. A threshold of 10% was applied, meaning that only cells with flow accumulation values above the top 10% were identified as stream channels, while the remaining 90% were considered non-streams or assigned no data. Distance from the stream was also considered a critical factor in the analysis. According to previous studies, areas closest to the stream are the most affected during floods due to the increased risk [35,36] of overflow and inundation [37]. The LULC data were obtained from the European Space Agency (ESA) World Cover map, which provides freely accessible 10 m resolution data (https://viewer.esa-worldcover.org/worldcover/, accessed on 7 September 2025). LULC was categorized into five classes: tree cover, shrubland, cropland, bare land/sparse vegetation, and built-up areas. All parameters were classified into five categories for consistency, following common practice in flood susceptibility and MCDA studies [38]. Rainfall was the only exception, as it remained uniform across Bahrah due to the relatively small size of the city. All parameters are presented in Figure 3.
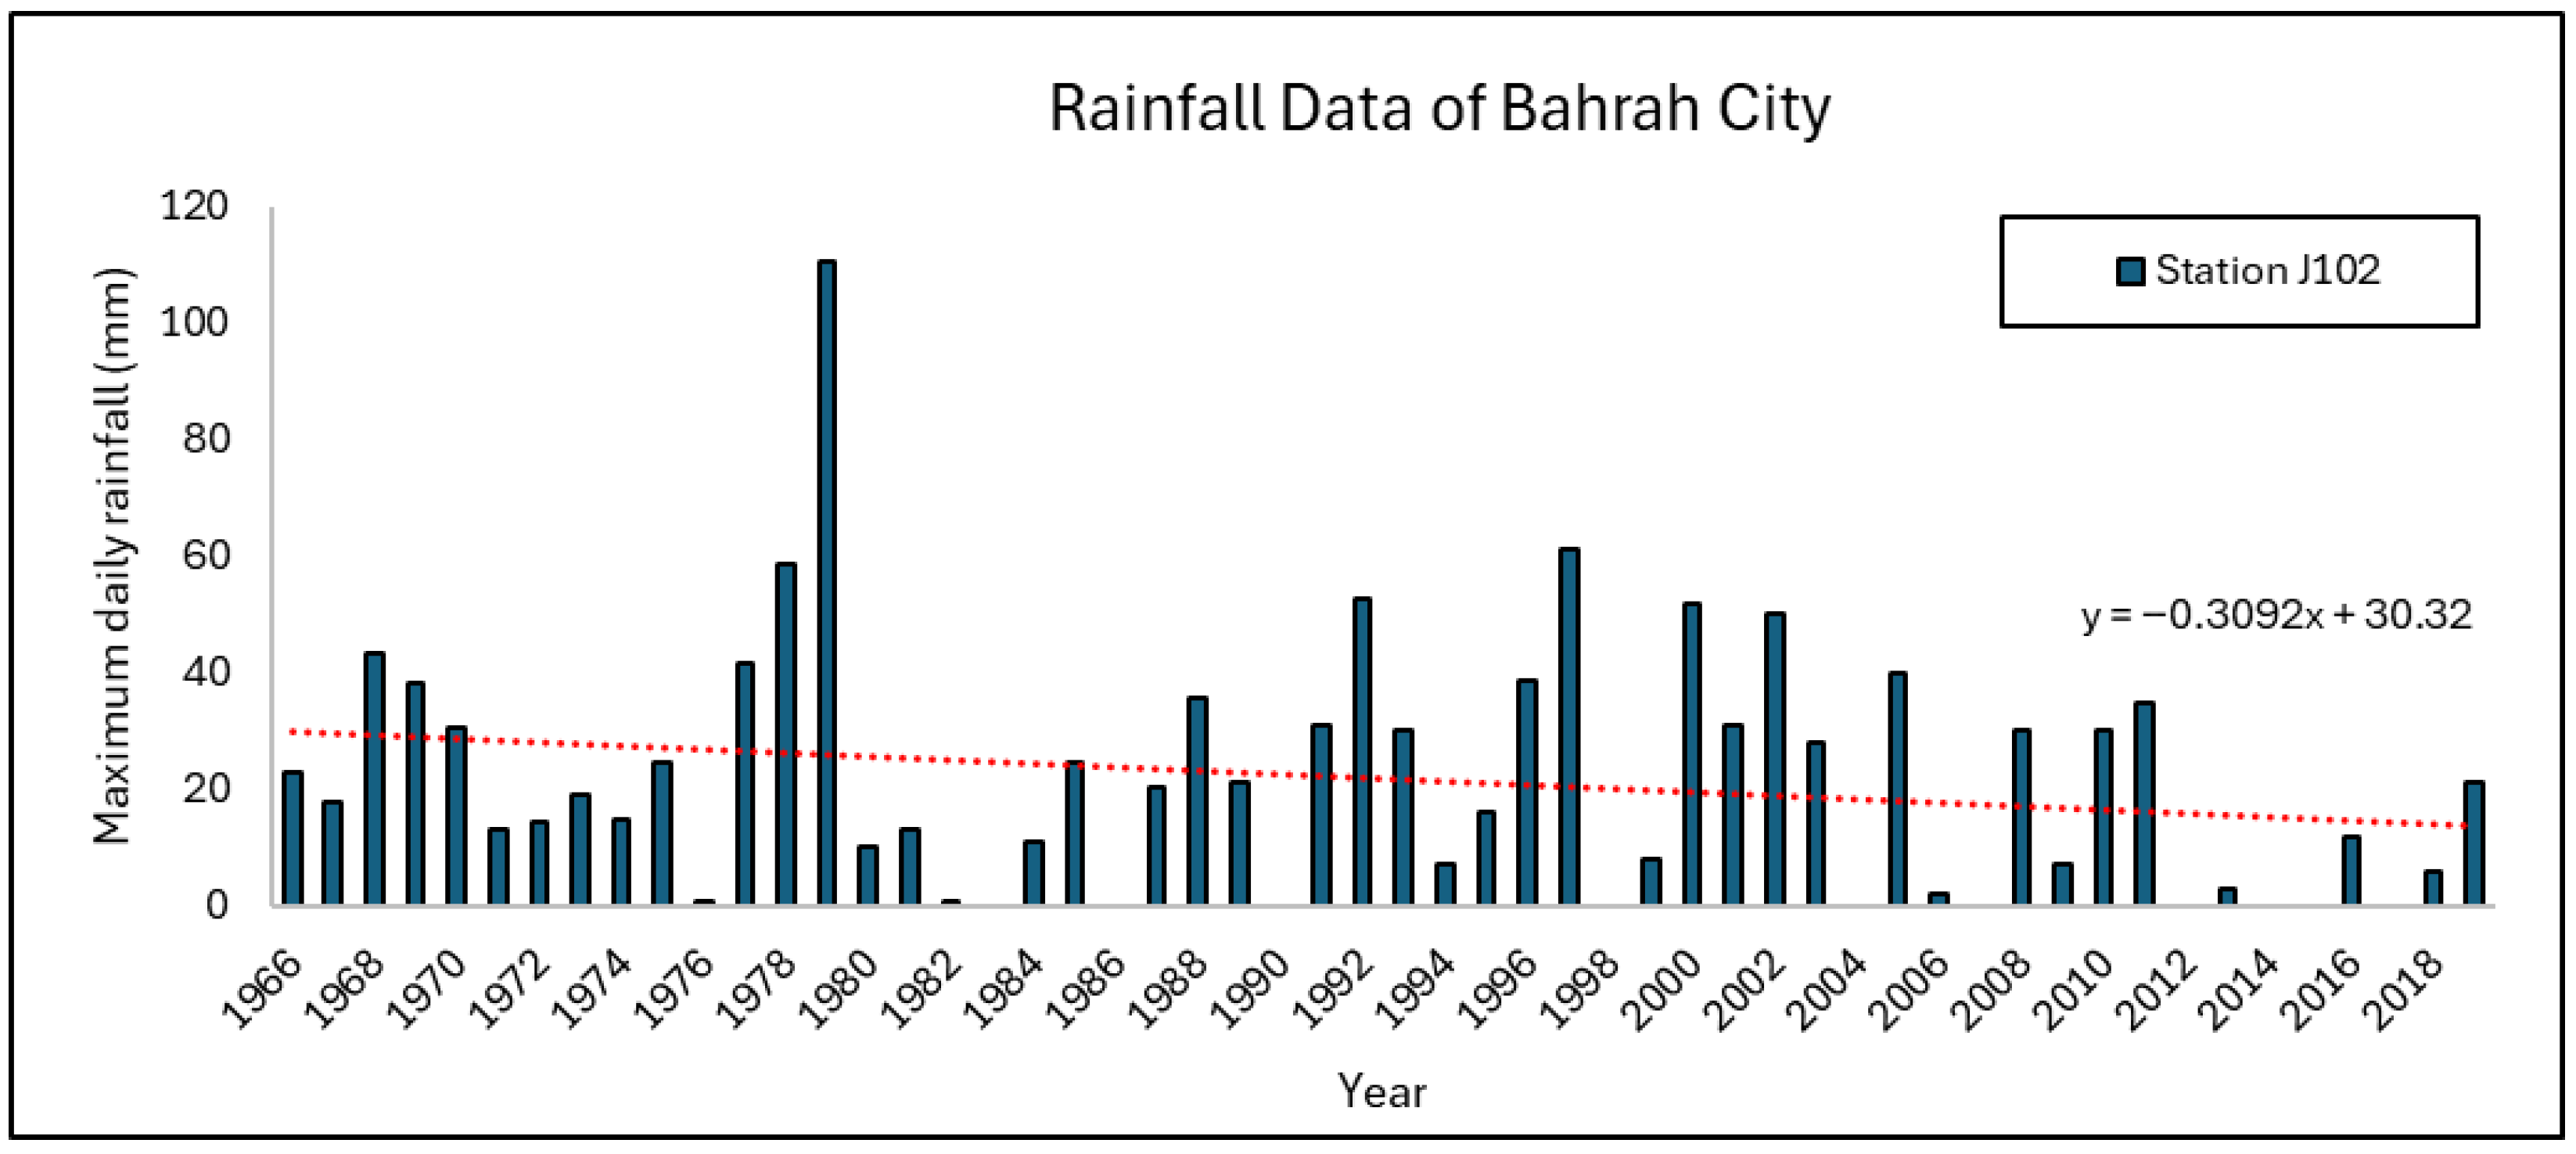
Table 1 provides information regarding the rainfall station in Bahrah City (J102) at 21°25′58.94″ N and 39°42′4.45″ E. The station actively recorded daily rainfall events from 1966 to 2019, covering a period of 54 years for daily rainfall. During this period, 44 storm events were recorded. Long-term datasets collected at this station are crucial for understanding rainfall patterns, assessing extreme precipitation events, and evaluating flood hazards in the region. The historical trend of maximum daily rainfall recorded at Station J102 is shown in Figure 4. The observed data exhibits significant interannual variability, with extreme rainfall events occurring sporadically, particularly in 1979, when the maximum daily rainfall exceeded 100 mm. Over the long-term period, the trend line suggests a slight decline in the maximum daily rainfall, with a negative slope of −0.3092 mm/year. This decreasing trend indicates a potential reduction in the intensity of extreme rainfall events over time, although the variability remains high, suggesting the influence of climatic factors and local meteorological conditions [39,40].

3.2. Rainfall Analysis

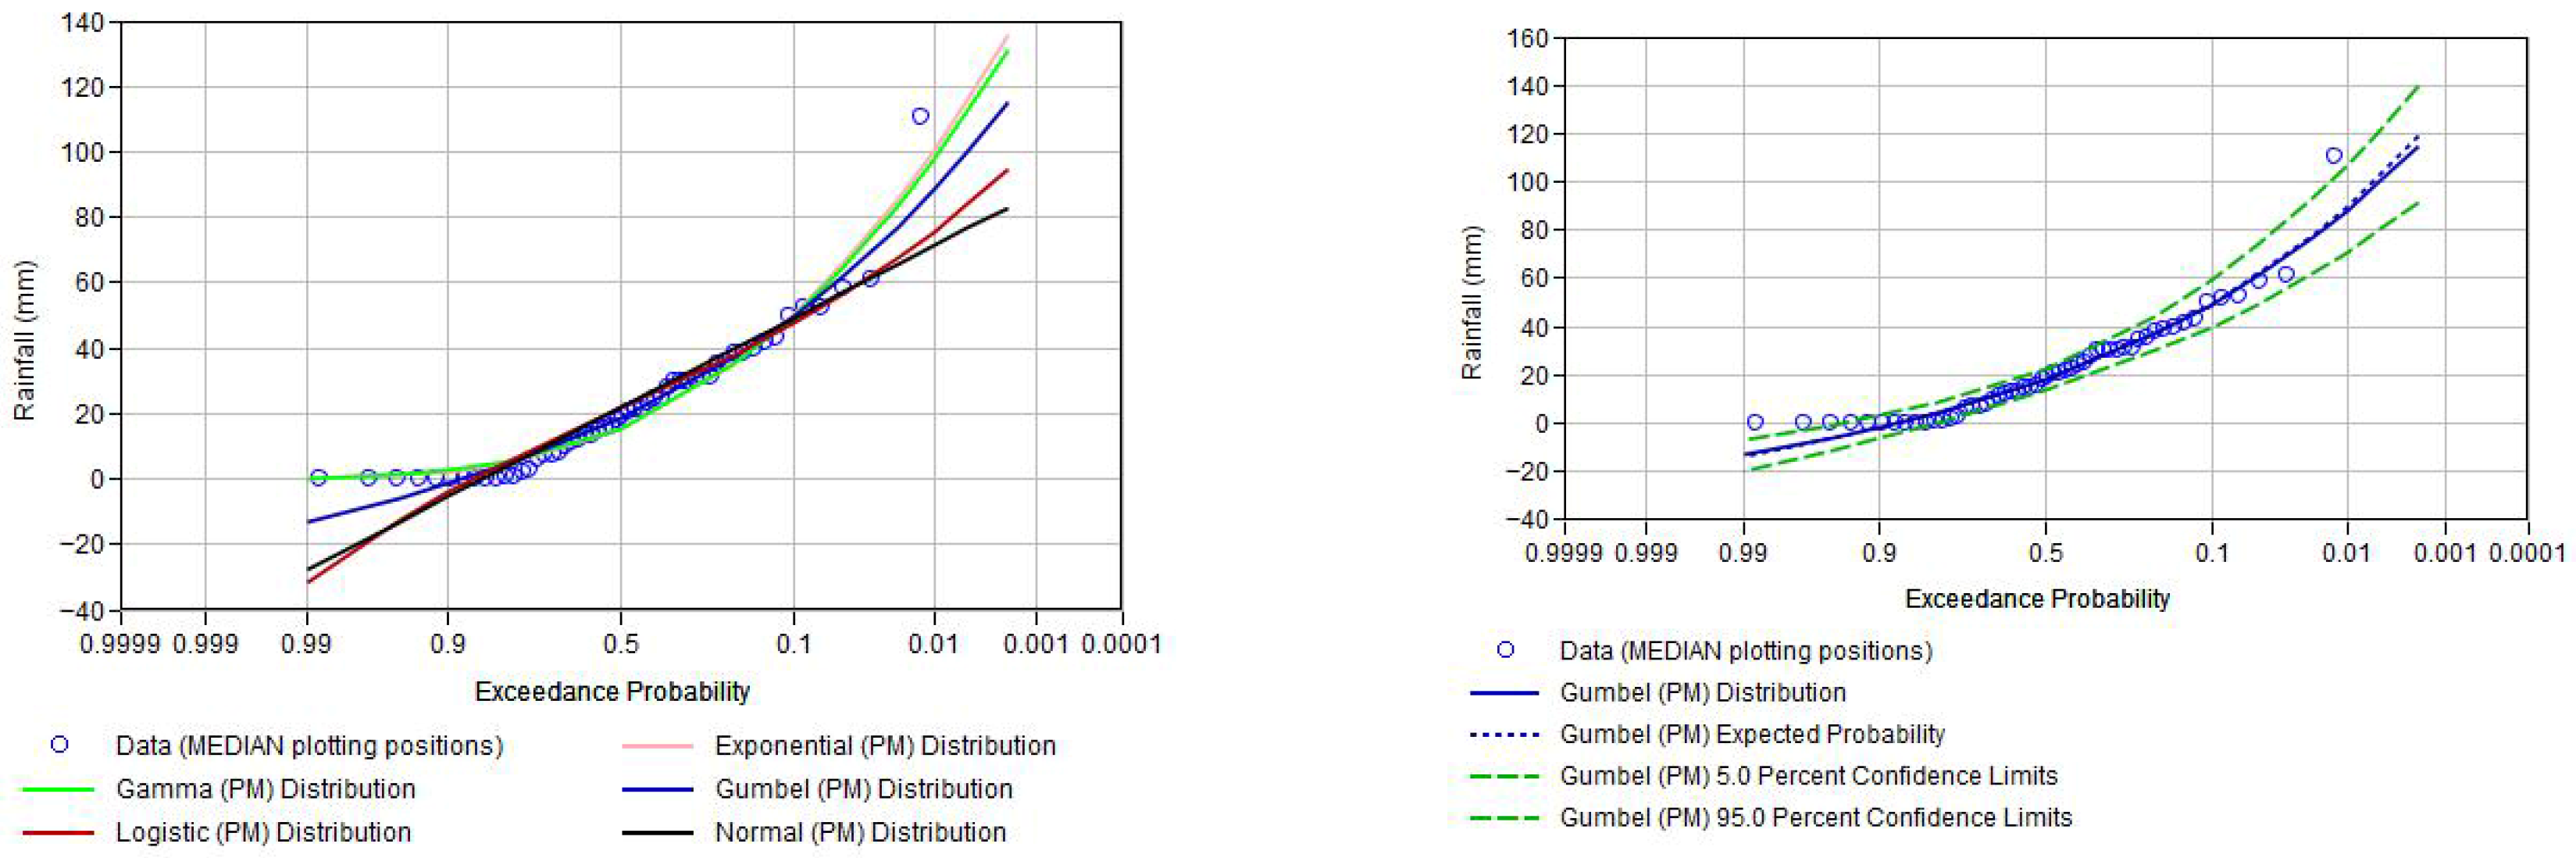
Figure 5 illustrates the probability distribution fitting of rainfall data using various statistical distributions analyzed with the HEC-SSP software (version 2.3) (https://www.hec.usace.army.mil/software/hec-ssp/, accessed on 7 September 2025). Figure 5 (left) presents a comparative analysis of multiple probability distributions, including Gamma, Logistic, Exponential, Gumbel, and Normal distributions, plotted against the observed rainfall data. The exceedance probability is represented on the x-axis, and the corresponding rainfall values in millimeters are shown on the y-axis. The observed data points, depicted as blue circles, indicate the empirical distribution of rainfall, whereas the fitted distributions are represented by differently colored lines. Statistical evaluation was performed using the Kolmogorov–Smirnov (K-S) test. A distribution-free statistical method was used to compare two empirical distributions or to test the goodness of fit of a sample distribution-free statistical method to compare two empirical distributions or to test the goodness of fit of a sample [41,42]. The results show that the Gumbel distribution yields the lowest K-S test value among the tested distributions, with a value of 0.123 (Table 2). Figure 5 (right) highlights the Gumbel distribution, displaying its expected probability curve along the 5% and 95% confidence limits. The observed data generally fell within these confidence bounds, reinforcing the suitability of the Gumbel distribution for modeling rainfall extremes [43].
The Gumbel distribution equation used to estimate the rainfall depths for various return periods is as follows [44]:
x = β 1 α ln l n T r ln T r 1
α = 1.2825 σ
  β = μ 0.45 σ
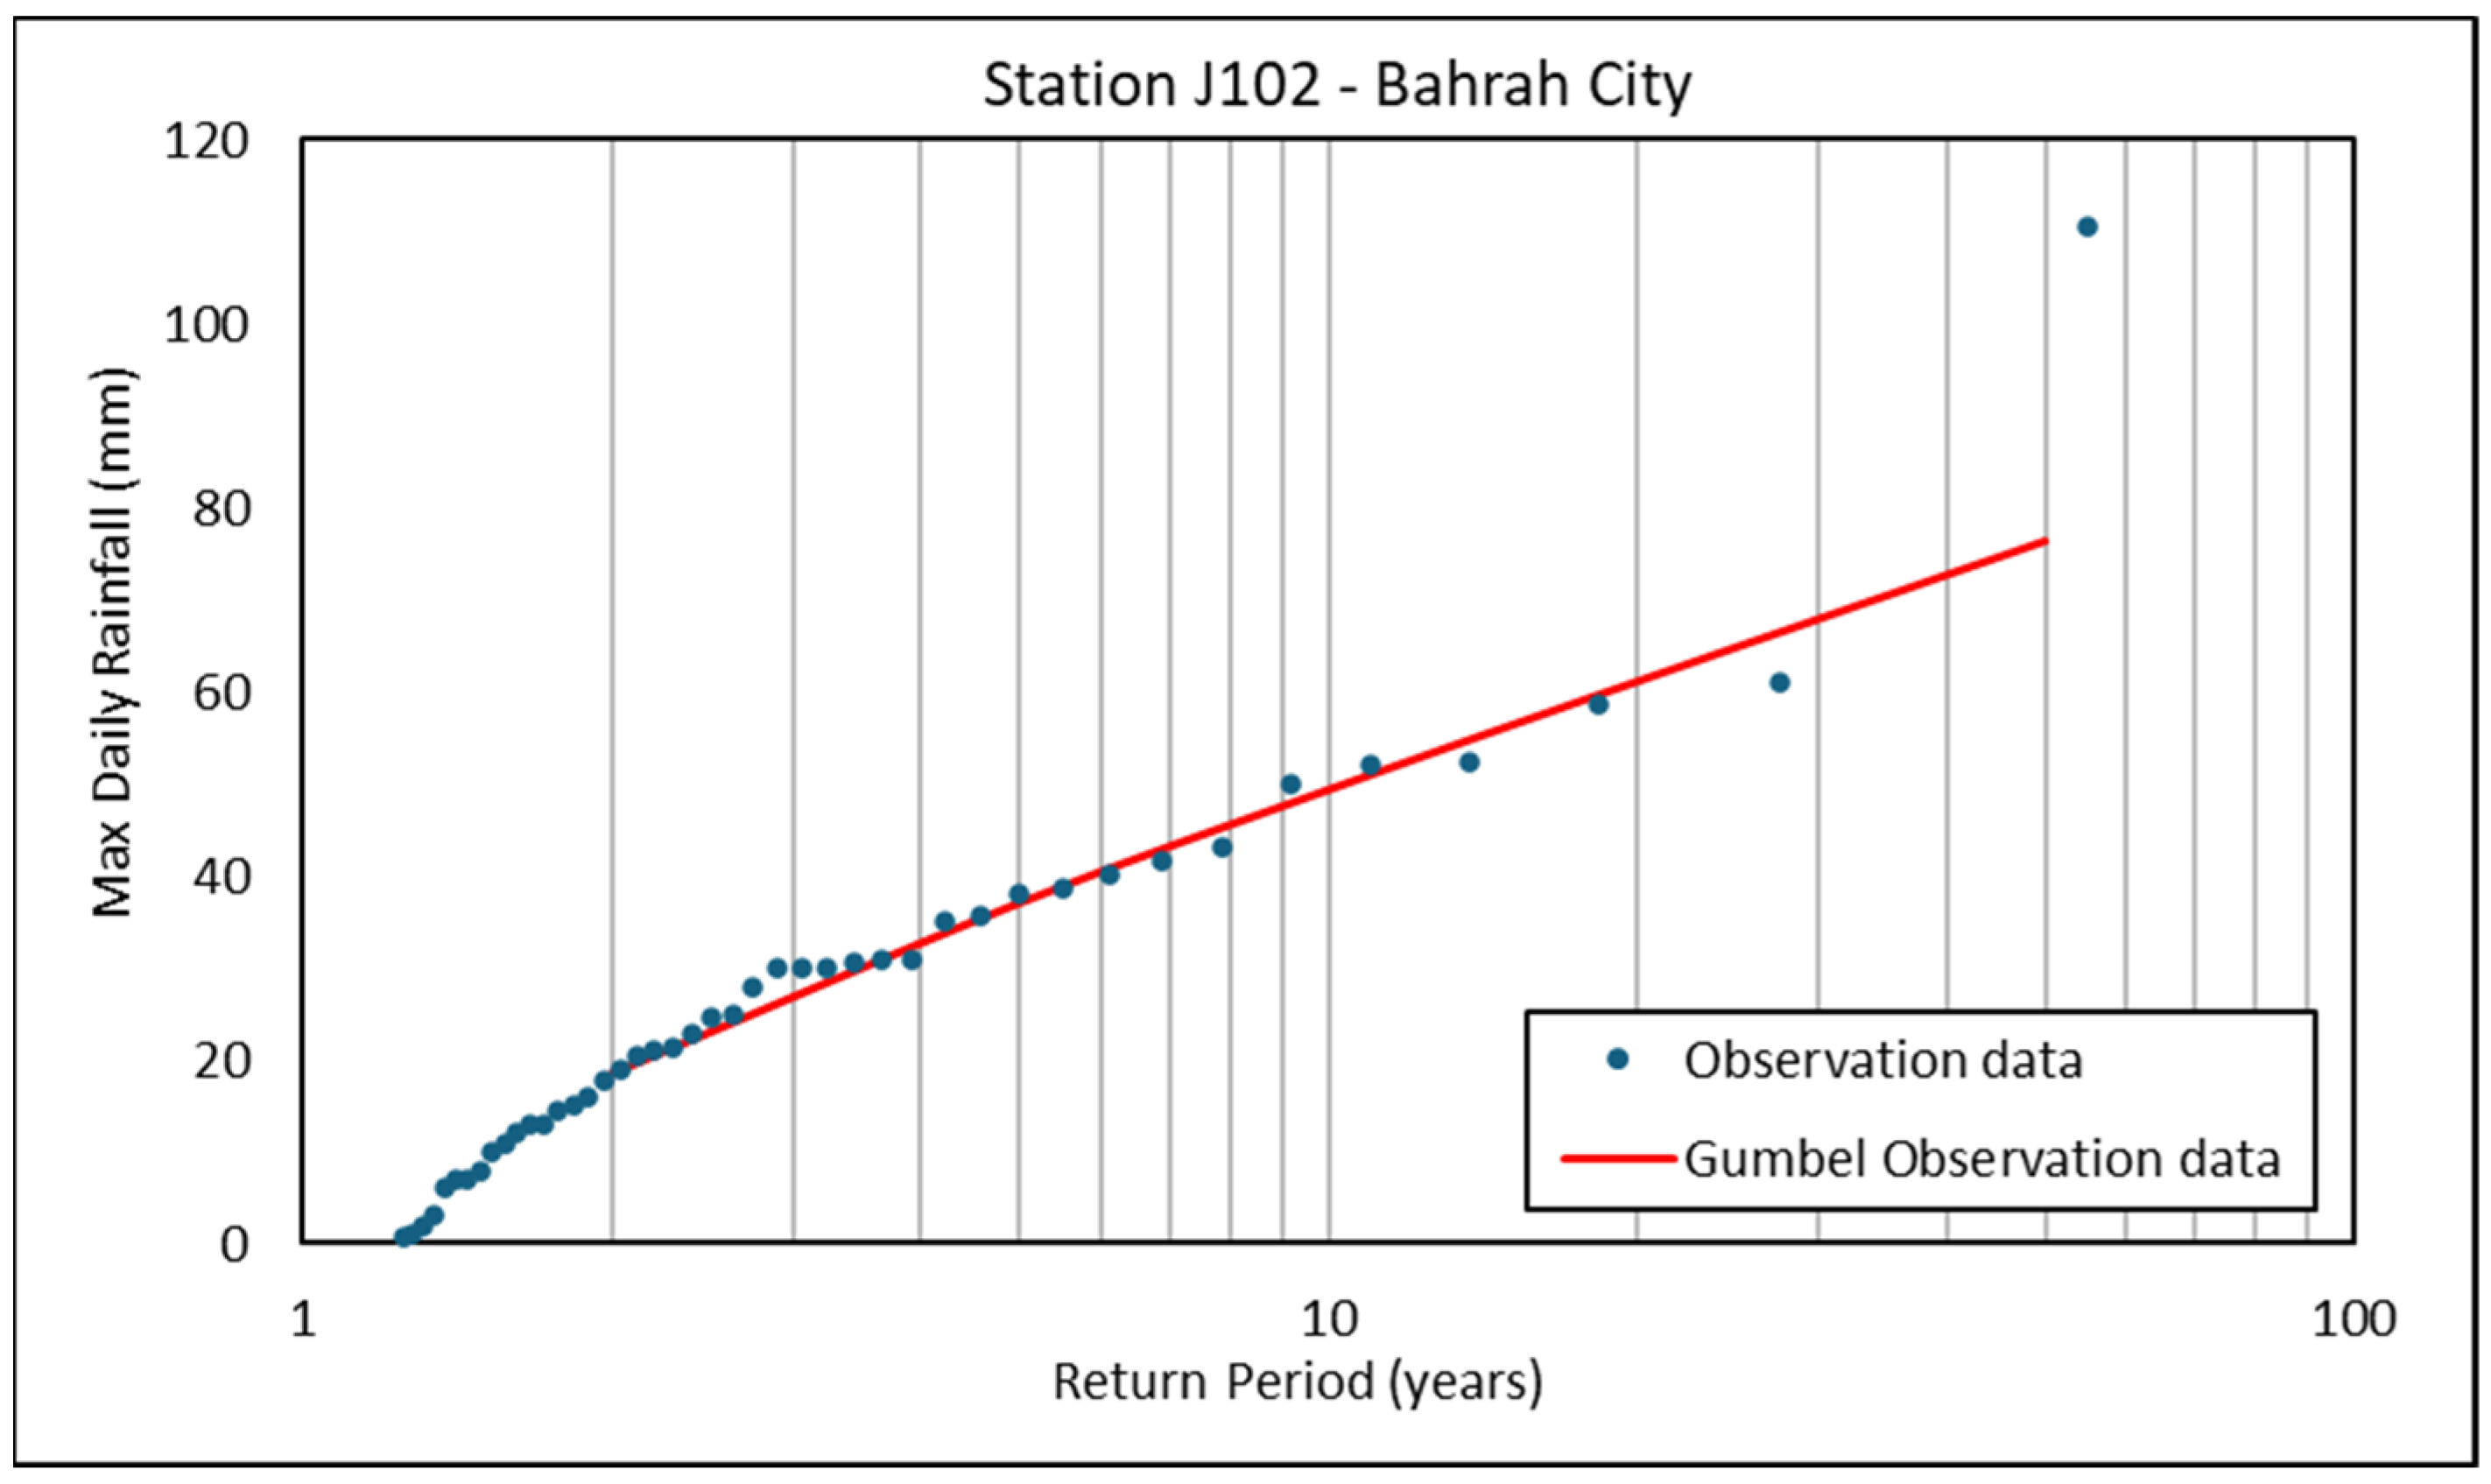
where x is rainfall depth, α and β are the distribution parameters, T r is the return period, μ is the mean of the rainfall data, and σ is the standard deviation of the rainfall data. Figure 6 presents a frequency analysis of the maximum daily rainfall using the Gumbel distribution, where the x-axis, displayed on a logarithmic scale, represents the return period (years), and the y-axis indicates the maximum daily rainfall (mm). The estimated rainfall depths corresponding to the return periods of 5, 10, 20, 50, 100, and 200 years are provided in Table 3.

3.3. Flood Susceptibility Mapping Using MCDA

The methodology consists of the following steps: (1) selecting key flood-influencing factors (elevation, slope, distance from streams, and LULC) and converting these factors into a raster grid, (2) determining their relative weights using AHP (Table 4), and (3) rating parameter classes to represent different levels of flood susceptibility [45]. The AHP method is widely used to assign objective weights to each factor, ensuring a systematic and transparent evaluation of their influence on flood susceptibility. Table 5 presents the ranking system, where ranks from 1 to 5 are assigned to different classes to represent flood susceptibility potential, ranging from very low to very high. This classification system provides a systematic framework for evaluating flood-prone areas [46].
The MCDA approach in this study is based on the equation proposed by Saaty (1980) [48], which integrates multiple criteria to quantify and prioritize the factors contributing to flood susceptibility. The flood hazard index (RI) was calculated using Equation (4), which expresses the index as the weighted sum of the selected parameters:
R I =   i = 1 n W i R i
where RI is the flood hazard index, Wi is the weight for each parameter, and Ri is the parameter input. This approach combines geospatial and environmental factors to proportionally assess their contributions to flood hazards.
The selection of the above flood conditioning factors in this study is based on previous flood studies in neighboring regions, such as Makkah and Jeddah, ensuring consistency with established approaches for arid urban watersheds. In addition, factors were tailored to the urban context of Bahrah City, where high proportions of impervious surfaces and bare land and less vegetation significantly influence runoff and flood patterns. Incorporating these urban-specific characteristics allows for a more realistic representation of flood susceptibility, capturing the spatial variability caused by human activities and LULC changes. Each factor was assigned a weight using the AHP method, reflecting its relative importance in contributing to flood susceptibility. This systematic weighting ensures that the MCDA framework reliably identifies high-risk zones and provides actionable insights for urban flood management and planning.

3.4. Hydraulic Simulation

In this study, hydraulic modeling was performed using the rain-on-grid (RoG) approach in HEC-RAS version 6.5 (https://www.hec.usace.army.mil/software/hec-ras/, accessed on 7 September 2025). RoG is a widely used method for simulating rainfall–runoff processes and flood hazards, especially in complex or ungauged catchments. Studies have shown that RoG in HEC-RAS can produce realistic hydrographs and flood hazard maps when the model is properly calibrated with observed data and accurate terrain information is used [25,26]. This method is based on the Shallow Water Equations (SWEs), also referred to as the Saint-Venant Equations (SVEs), which conserve mass and momentum to describe fluid flow (Equations (5)–(8)) [49].
H t + ( h u ) x + ( h v ) y = r i
u t + u u x + v u y = g H x + v t 2 u x 2 + 2 u y 2 c f u
v t + u v x + v v y = g H y + v t 2 v x 2 + 2 v y 2 c f v
c f = n 2 g V h 4 3
where h is water depth, H is water surface elevation (sum of bed elevation and water depth), t is time, u and v are the velocities in x and y directions, r is rainfall, i is infiltration (delta between r and i is net precipitation), g is gravitational acceleration, v t is the horizontal eddy viscosity, c f is the bottom friction coefficient, n is the Manning coefficient, and V = resultant velocity V = u 2 + v 2 .
The HEC-RAS model was run using the full SWEs with the Explicit Lax–Wendroff Method (SWE-ELM). The computational mesh was generated as a structured 2D grid with a point spacing of 75 m in both the x and y directions, resulting in a total of 13,051 cells. Manning’s roughness coefficient was set to 0.06 (default), although, in principle, spatially variable values should be assigned based on LULC classes (Figure 3c), and the boundary condition was specified as a normal depth of 0.01 m. The computational interval, or time step, was set to 1 min to ensure numerical stability. A 30 m DEM was used to represent topography, providing sufficient detail for urban-scale flood modeling. Critical factors such as terrain features, infiltration parameters based on soil type and land cover, and watershed boundaries were incorporated to capture realistic overland flow and runoff patterns. By accounting for these factors, the RoG model provides a robust representation of flood hazard under multiple rainfall scenarios.
The selection of a uniform 75 m structured grid reflects a deliberate, context-specific decision grounded in four methodological considerations:
  • Rain-on-Grid (RoG) Framework vs. Channel-Focused Modeling: Unlike traditional fluvial models, where flow is confined to discrete channels, RoG simulates rainfall-driven overland flow across the entire catchment. Flow paths are not predetermined but emerge dynamically from topography. A uniform grid ensures consistent representation of sheet flow, ponding, and intercell transitions without artificial bias introduced by localized mesh refinement that could distort overland flow routing patterns.
  • Computational Domain Characteristics (CDC): Bahrah City is a flat, urbanizing arid catchment (74.2 km2) with ephemeral, poorly defined wadis rather than continuous river networks. The absence of permanent, well-incised channels reduces the imperative for channel-specific refinement. Flow concentration occurs opportunistically across the urban fabric, making uniform discretization more aligned with the physical process being modeled.
  • Input Data Resolution Constraints (IDRC): The primary topographic input is a 30 m Copernicus DEM. Constructing a computational mesh finer than 75 m would risk over-representing DEM interpolation artifacts without commensurate accuracy gains. Conversely, adopting a variable-resolution mesh coarser than 75 m in outer areas would exceed the DEM’s native resolution, causing unnecessary smoothing. The uniform 75 m grid represents a balanced compromise: it is fine enough to resolve urban-scale features (blocks, major roads) while remaining computationally tractable and honoring input data limitations.
  • Baseline Model and Numerical Stability (BMNS): As the first hydrodynamic simulation for this catchment, we prioritized numerical stability and replicability. Variable meshing introduces additional complexity in setting time steps (Courant condition) and managing wetting/drying fronts, which can cause convergence failures in RoG simulations. A uniform mesh provides a stable, easily reproducible baseline against which future adaptive mesh refinement (AMR) strategies can be benchmarked.

4. Results

4.1. Flood Susceptibility Mapping Using MCDA-AHP

Figure 7 presents the spatial distribution of flood susceptibility maps across Bahrah City, as determined by the application of an MCDA integrated with the AHP framework. The flood susceptibility map categorizes the study area into three flood susceptibility levels: low, moderate, and high. These levels were classified based on the computed flood RI, enabling comprehensive zonation of the study area for hazard assessment. The resulting flood susceptibility map provides a data-driven basis for land use planning and targeted flood mitigation.
The spatial extents corresponding to each susceptibility level are summarized in Table 6. Specifically, the high-susceptibility zone encompasses 2.2 km2, delineating areas that exhibited the greatest susceptibility to flood events. This region typically reflects topographic and hydrologic factors, such as streams and low elevations, which significantly elevate flood danger. The moderate-susceptibility zone, covering 26.1 km2, includes areas with episodic flood potential. These locations are subject to occasional inundation, generally during extreme rainfall events. The largest proportion of Bahrah City, calculated at 44.7 km2, falls into the low-susceptibility category, suggesting minimal flood frequency and reduced hazard impact due to favorable geomorphological and land use characteristics. The calculated flood RI values for the entire study area ranged from 0 to 5. In this study, these values were manually reclassified into three qualitative levels: low risk (0–1.6), moderate risk (1.7–3.2), and high risk (3.3–5).

4.2. RoG Hydraulic Modeling Results

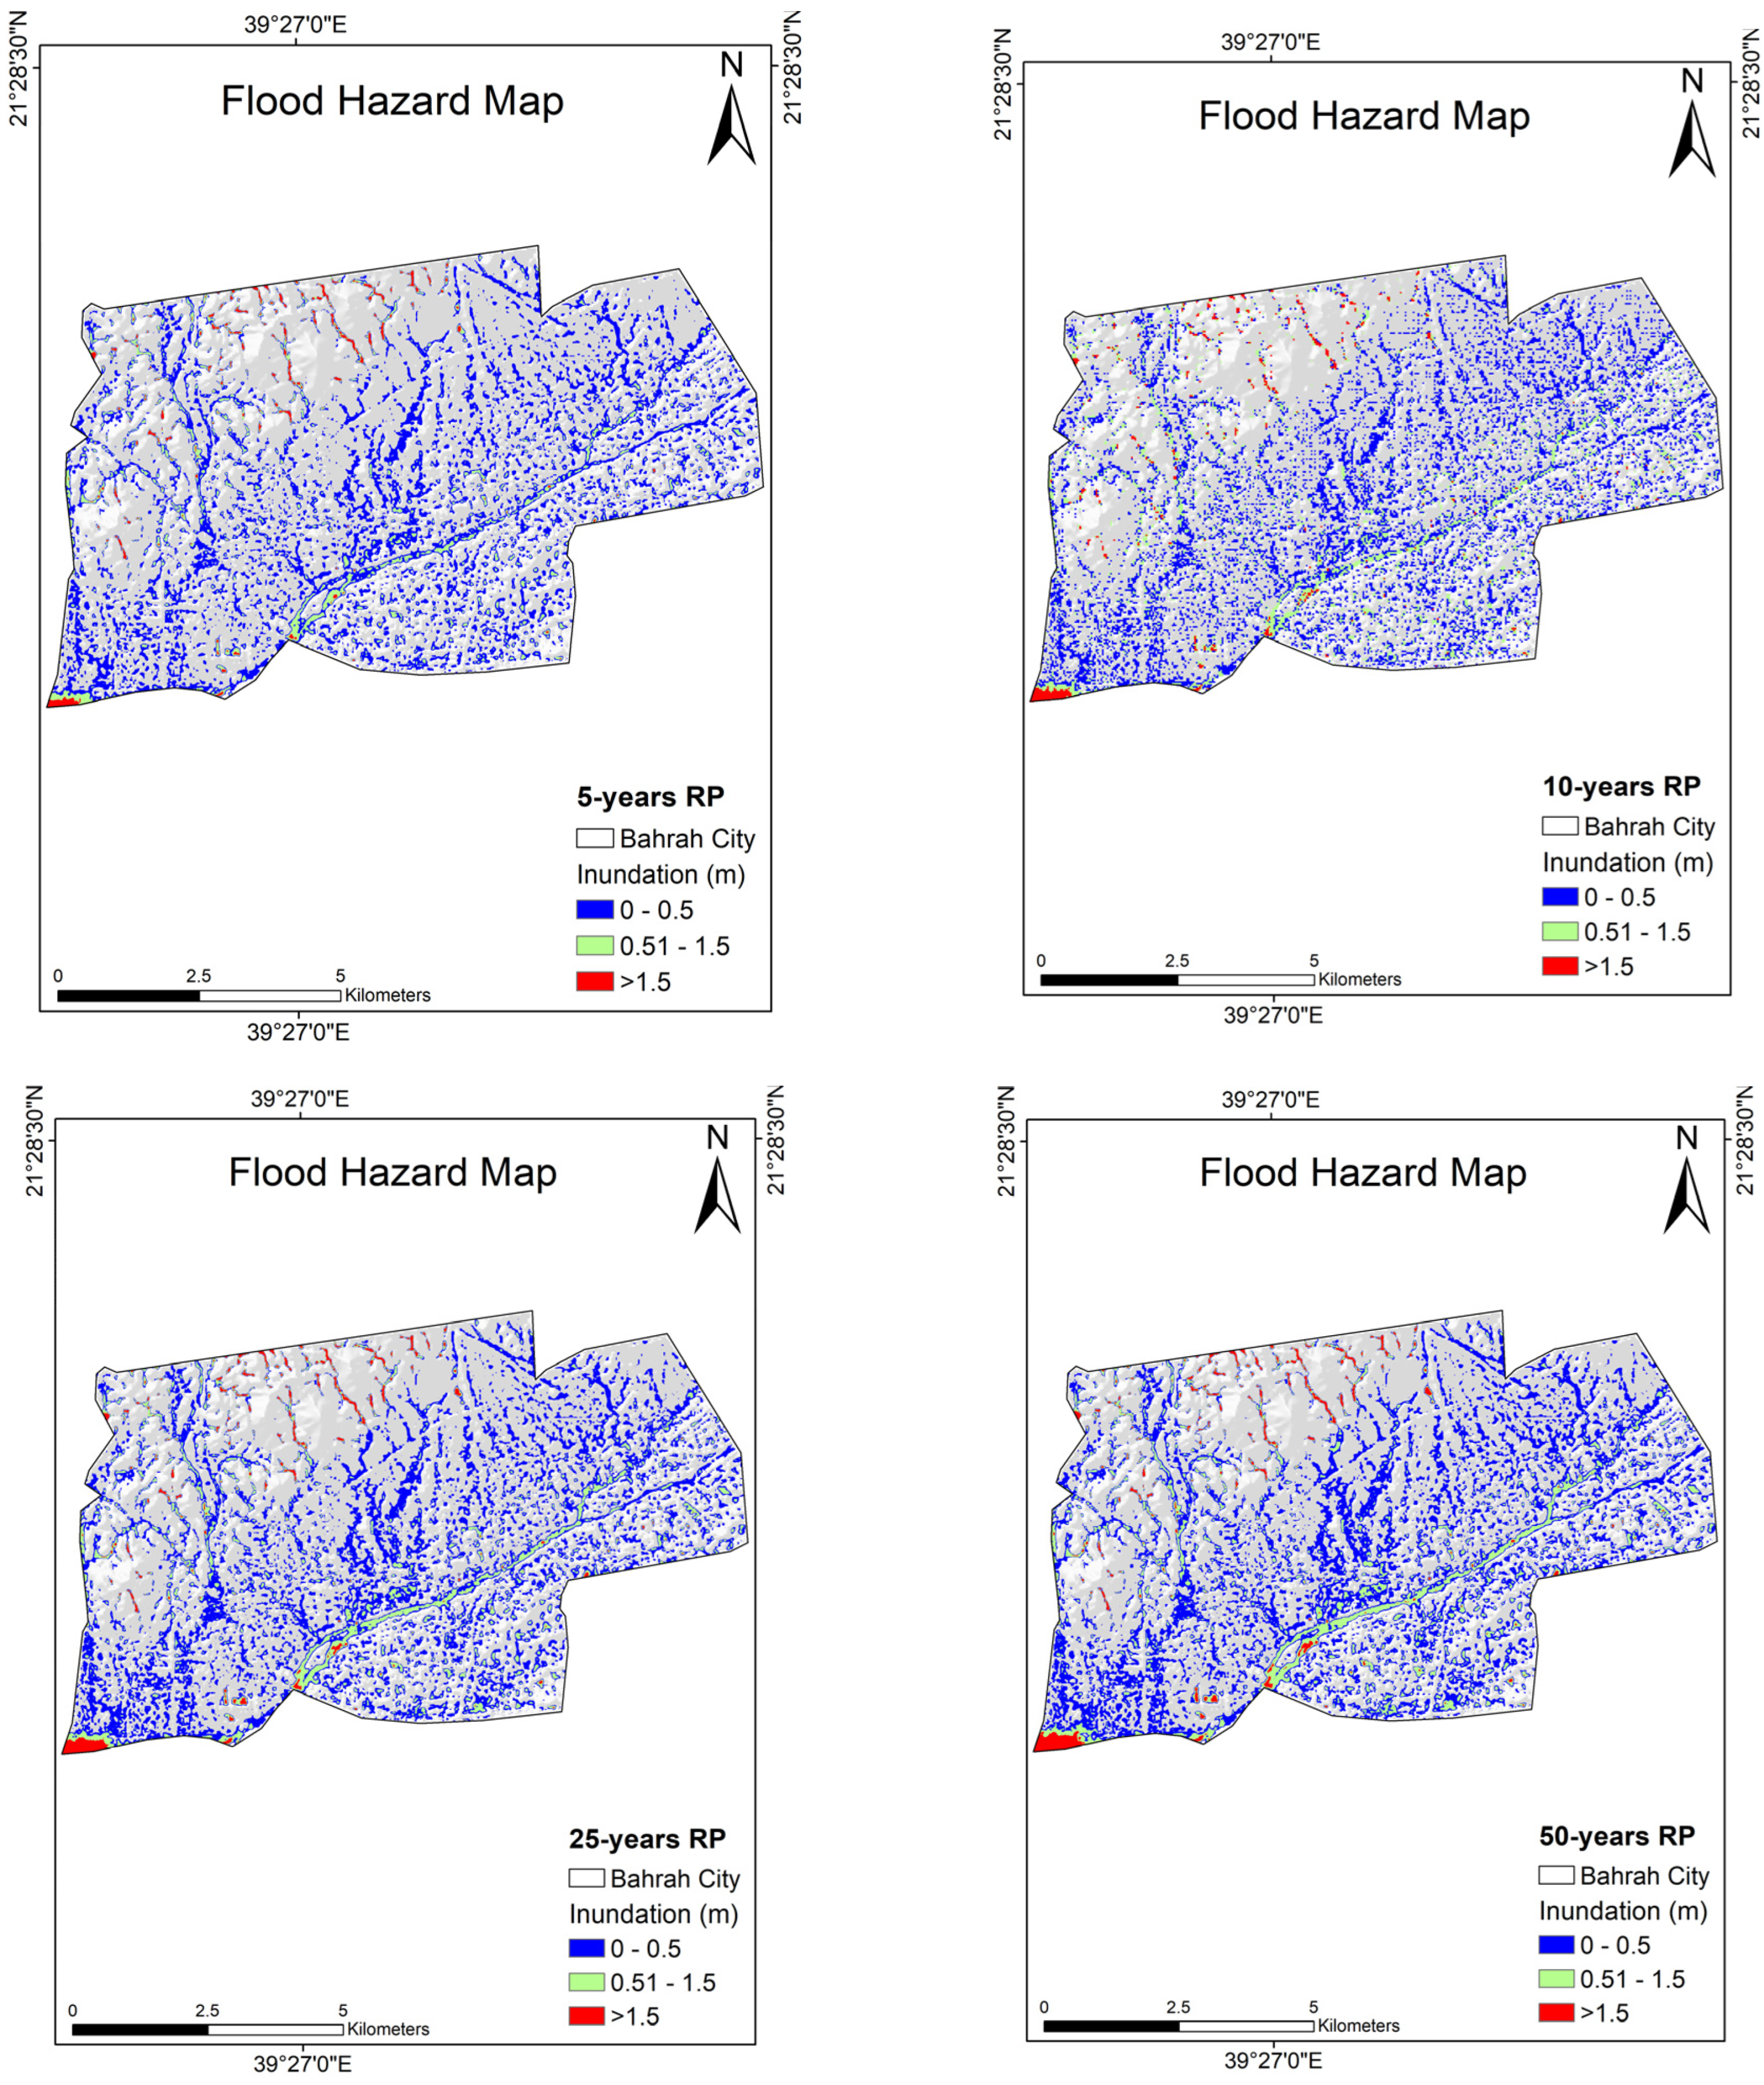
Following the MCDA-based flood hazard evaluation, RoG hydrodynamic modeling was employed to quantify the flood hazard characteristics of Bahrah City under varying return periods. This advanced modeling approach utilizes 2D SWEs to simulate rainfall-driven overland flow, producing inundation depth maps for different hydrological scenarios. Figure 8 depicts the flood hazard maps of Bahrah City for return periods of 5, 10, 25, and 50 years, revealing the dynamic response of the urban landscape to increasing rainfall. As the return period increased, both the extent and depth of the inundation expanded significantly, indicating a higher flood hazard associated with less frequent but more intense rainfall events. A minimum water depth threshold of 0.003 m (3 mm) was applied in HEC-RAS to ensure numerical stability and convergence during the simulations. Flood inundation depths were then classified into three hazard levels: shallow flooding (0–0.5 m, blue), moderate flooding (0.51–1.5 m, light green), and deep flooding (>1.5 m, red). Most inundated areas experienced shallow flooding, while deep flooding was restricted to structurally low-lying zones and areas adjacent to streams. The decision to apply a uniform n = 0.06 (the HEC-RAS default) was predicated on three pragmatic considerations:
  • Baseline Model Establishment: As this represents the first hydrodynamic simulation for Bahrah City, our priority was to establish a foundational model against which future, more parameterized versions could be benchmarked. A uniform value provides a clear reference point for assessing the incremental impact of spatial heterogeneity.
  • Absence of Local Calibration Data: We lack measured water surface elevations or discharge records from past flood events in Bahrah City necessary to calibrate and validate spatially variable roughness parameters. Without empirical data to constrain values for different land covers, arbitrarily assigning variable coefficients would introduce unsubstantiated assumptions that could be more misleading than a transparently simplistic uniform value.
  • Computational Efficiency: Our initial exploratory runs aimed to identify numerical stability issues and grid convergence behavior. A uniform coefficient simplified troubleshooting of model instabilities independent of parameter complexity.
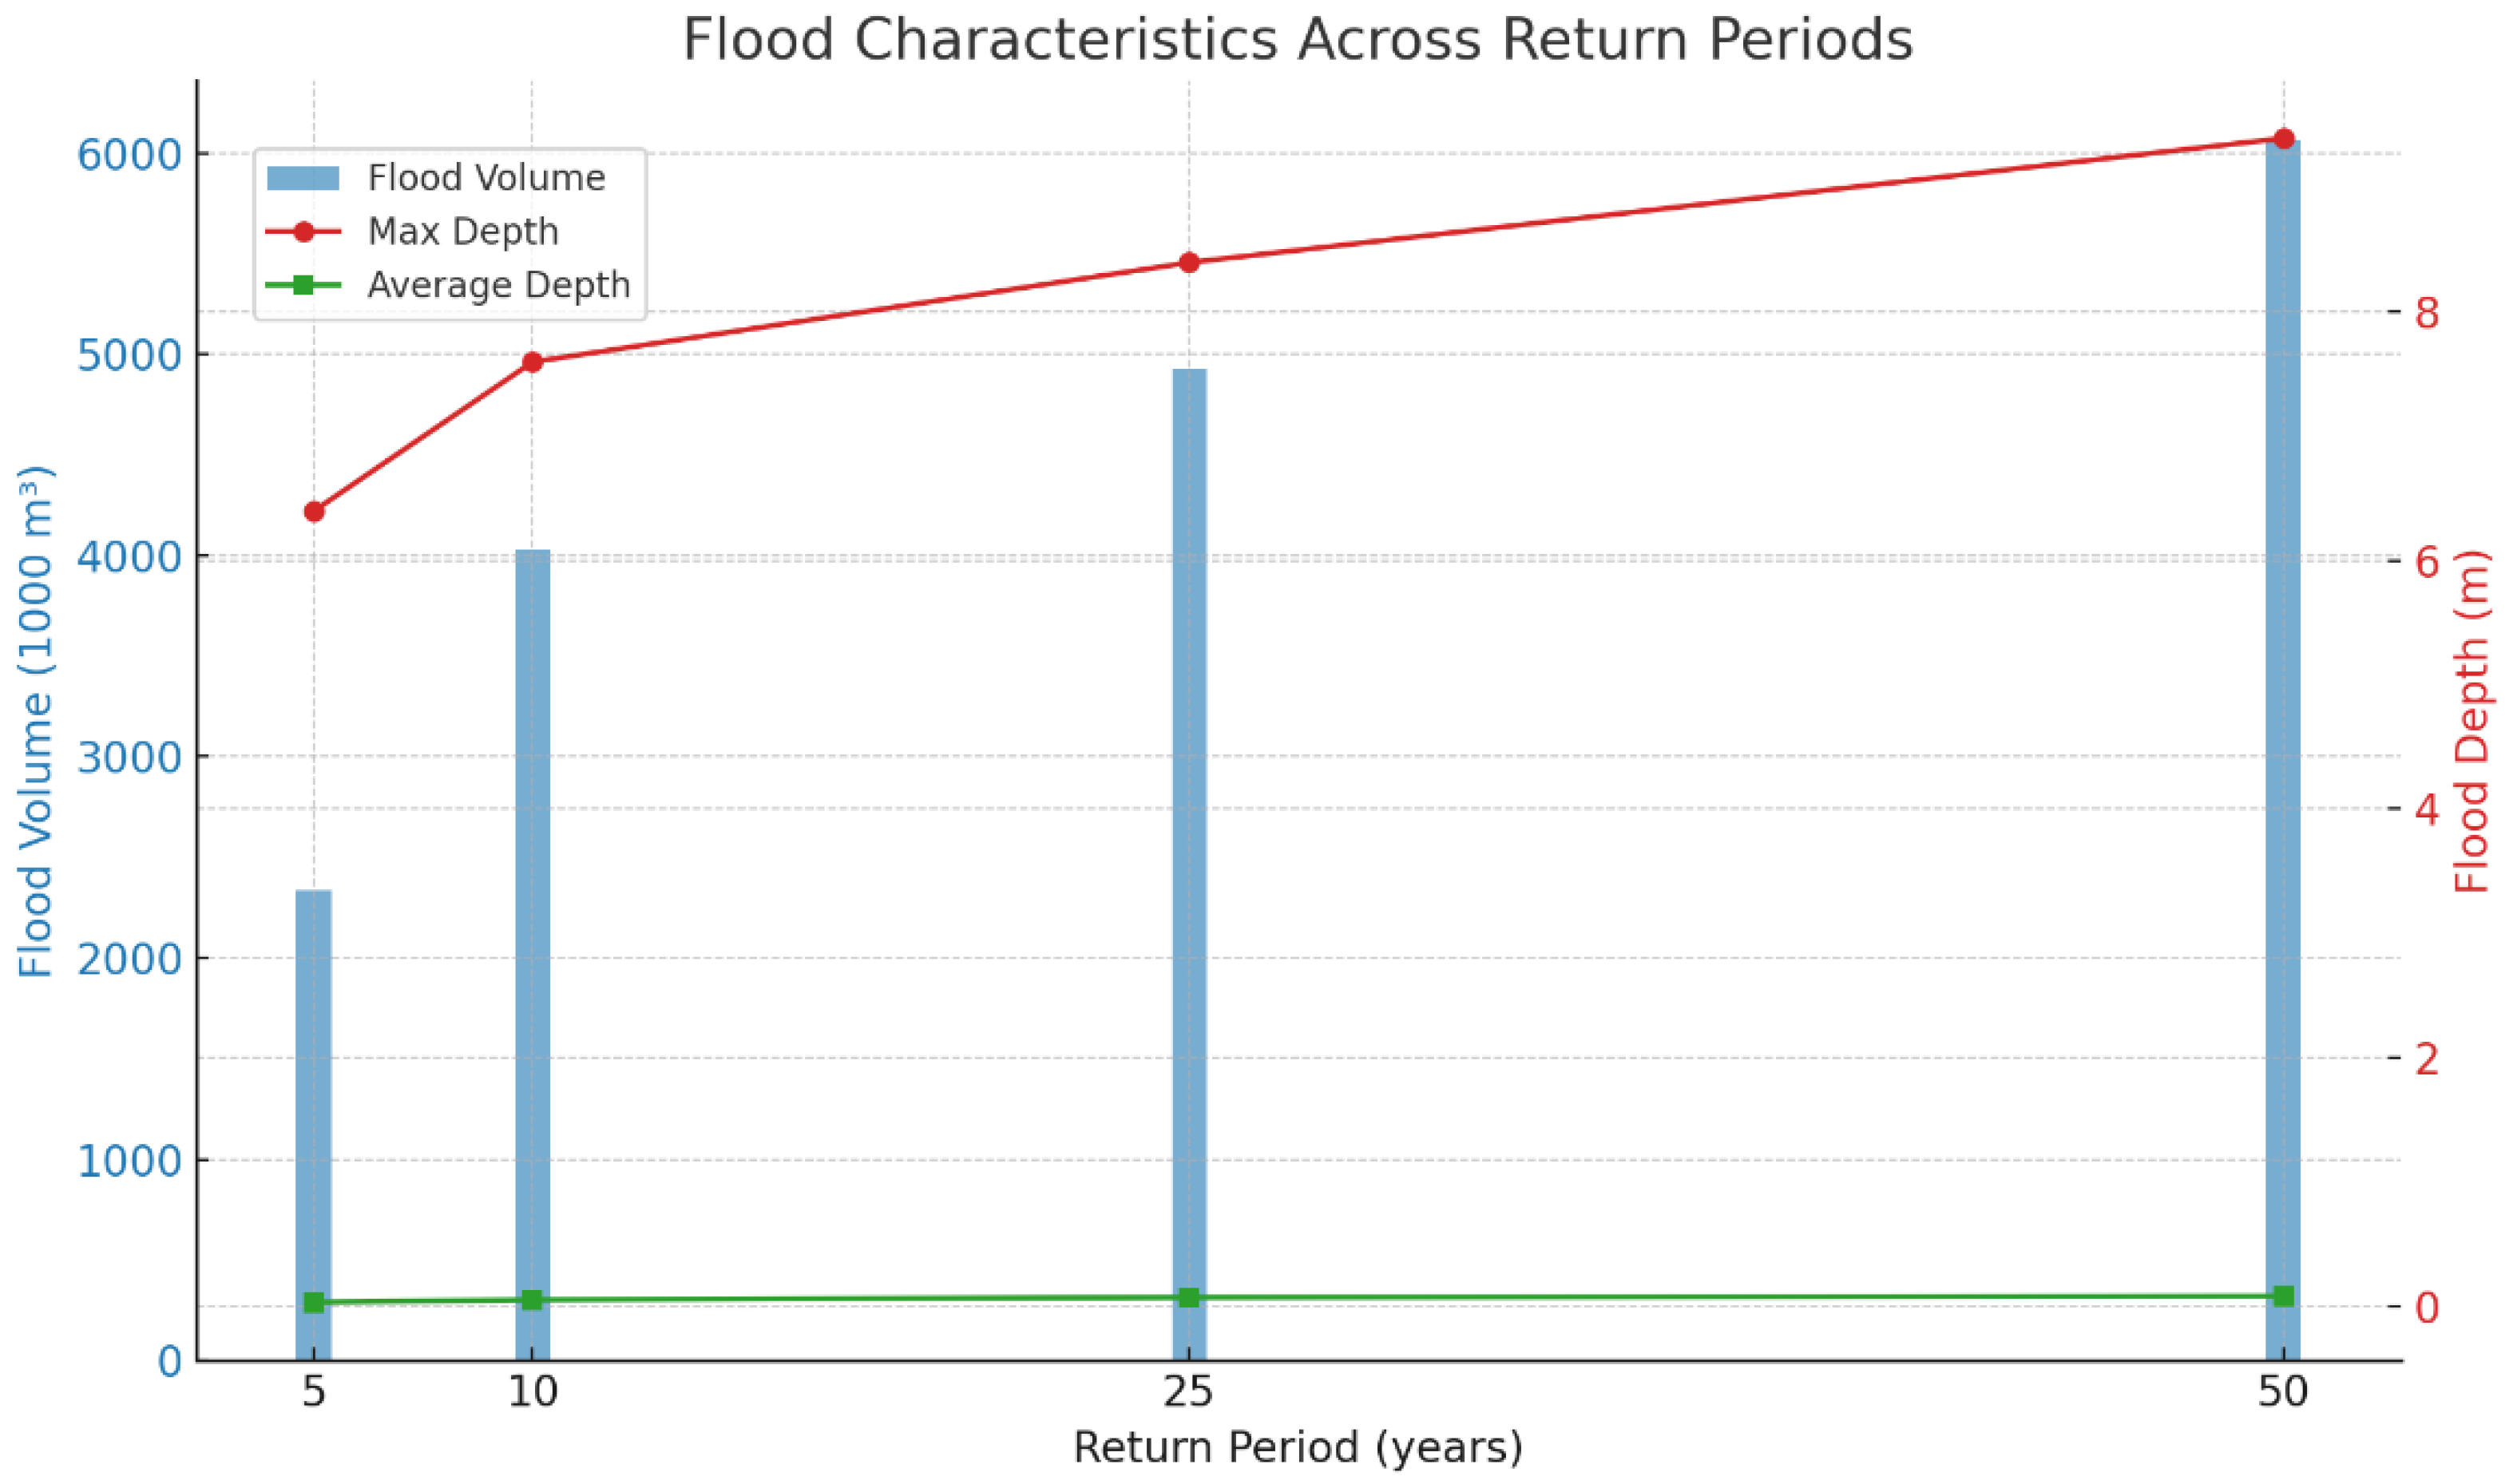
The bar chart in Figure 9 displays the flood volume (in 1000 m3), while the line plots depict trends in the maximum and average flood depths (in m). The data reveal that the total flood volume increases substantially from 2338.8 × 103 m3 for the 5-year event to 6058.5 × 103 m3 for the 50-year event (+159%), reflecting a growing magnitude and spatial coverage of floodwaters under more extreme scenarios. Similarly, the maximum inundation depth rises from 6.4 m to 9.4 m (+47%), indicating deeper flooding in low-lying areas. The average flood depth also increases from 0.03 m to 0.08 m (+167%), suggesting a broader and more sustained flood spread across the landscape. These findings highlight the growing impact of extreme rainfall and the need to consider return period variability in flood hazard management for Bahrah City.
The visualization threshold of 3 cm is justified by hydraulic, technical, and practical considerations. Hydraulically, while depths below 5 cm represent sheet flow that does not constitute actionable flooding for infrastructure or public safety, and agencies like FEMA and the UK Environment Agency use 0.1 m as a minimum mapping threshold, our 3 cm cutoff provides a conservative approach that acknowledges Bahrah’s flat terrain while excluding negligible flow. Technically, our 30 m DEM cannot reliably resolve micro-topographic depressions that would pond water to depths less than 3 cm, so retaining such values would falsely imply precision unsupported by input data quality, while depths between 0.003 and 0.05 m often represent transient model artifacts or interpolation noise rather than converged solutions. Practically, urban planners and emergency managers must focus on areas with meaningful inundation, and a 3 cm cutoff eliminates visual clutter while preventing misallocation of resources to hydraulically irrelevant zones.

5. Discussion

5.1. Comparison and Global Applications of MCDA and RoG Approaches

The integration of the MCDA–AHP method with RoG hydrodynamic modeling establishes a robust framework for urban flood hazard assessment by combining geospatial vulnerability analysis with process-based flood simulations. In this framework, the MCDA–AHP approach identifies flood-prone areas using spatial indicators such as land use, elevation, slope, and proximity to river networks, whereas the hydrodynamic model simulates flood behavior under various flow scenarios [50]. This integration allows detailed flood hazard mapping and quantification for multiple return periods. The strong spatial agreement between high-susceptibility areas identified through MCDA–AHP and those simulated by RoG validates the reliability of this combined methodology, supporting its application in resilient infrastructure planning and early warning system development [51].
A comparison between the AHP and RoG approaches across Bahrah City reveals consistent spatial patterns as well as localized differences. High-susceptibility zones from the AHP analysis generally coincide with areas experiencing greater flood depths in the RoG simulations, demonstrating the effectiveness of MCDA in delineating flood-prone zones. However, certain discrepancies occur in urbanized sectors where high susceptibility under AHP aligns with low hazard under RoG, likely due to variations in topography, river networks, and distribution of impervious surfaces [52]. Overall, both the AHP analysis and the RoG flood depth maps consistently identify the western part of Bahrah City as a high-susceptibility zone, reinforcing the reliability of both models. The elevated flood hazard in this region results from low-lying terrain that facilitates surface water accumulation and extensive urban development that reduces infiltration capacity, while high proportions of impervious surfaces intensify runoff and further exacerbate flood severity [53].
Globally, MCDA methods, especially AHP, are widely used for flood susceptibility and risk mapping across diverse regions [54,55,56,57,58]. These methods integrate environmental and socioeconomic factors to identify and prioritize flood-prone areas, proving valuable for strategic planning in settings with limited historical flood data. Their integration with hydrodynamic modeling balances strategic zoning with detailed scenario forecasting. In northern Chile, the AHP-based MCDA accurately identified flood-prone zones with hydrodynamic simulations matching historical events, despite limited data [51]. In West London, UK, the fusion of 1D/2D hydrodynamic models, machine learning, and socioeconomic data achieved near-perfect flood hazard predictions (R = 0.999), allowing precise urban vulnerability mapping [59]. Northern Morocco combined advanced hydrodynamic models with statistical and remote sensing, producing flood flow assessments closely aligned with historical records and stakeholder feedback [60]. The Ba River basin in Vietnam integrated hydrodynamics, machine learning, and AHP to simulate floods with high efficiency and predictive accuracy (AUC > 0.90) [61]. In Fuzhou, China, high-resolution hydrodynamic modeling enabled near real-time urban flash flood simulations with recommended spatial resolutions below 5 m for reliability [62,63].
The present study contributes to this growing body of work by applying RoG modeling to quantify flood hazards in an arid urban environment. In Bahrah City, high-susceptibility zones cover approximately 2.2 km2 (3.2%), moderate-susceptibility zones 26.1 km2 (38.2%), and low-susceptibility zones 44.7 km2 (65.4%). Hydraulic validation indicates that total flood volume increases by 159% between the 5-year and 50-year return periods, while maximum and average inundation depths rise by 47% and 167%, respectively. These findings highlight the complementary strengths of MCDA for strategic flood zoning and hydrodynamic modeling for detailed hazard quantification, offering powerful and transferable tools for urban flood hazard management globally.

5.2. Data Scarcity and DEM Resolution Limitations

This study is first and foremost constrained by data scarcity related to the urban drainage system and several additional conditioning factors. In Bahrah City, detailed information on stormwater drainage networks, such as pipe geometry, culverts, retention/detention structures, sewer systems, and small-scale engineered channels, was either unavailable, incomplete, or not provided in a usable digital format. Similarly, high-resolution data on building characteristics (e.g., floor level, construction type), road elevation profiles, underground infrastructure, and long-term soil moisture or groundwater observations were not accessible at the time of this study.
As a consequence, both the MCDA-AHP framework and the hydrodynamic model relied on a subset of conditioning factors that could be consistently mapped at the watershed scale using available datasets (e.g., topography, LULC, distance to stream, and rainfall). The absence of explicit representation of the stormwater drainage system and critical urban micro-structures likely results in underestimation or misplacement of localized inundation where drainage capacity is insufficient or where infrastructure strongly modifies natural flow paths. Therefore, the resulting flood susceptibility and flood hazard maps should be interpreted as first-order, regional-scale indicators of flood-prone areas rather than detailed street- or parcel-level predictions.
A second key limitation concerns the spatial resolution of the DEM used in this study. Numerous studies have demonstrated that using coarser DEMs (such as 30 m resolution) can significantly reduce the accuracy of flood simulations compared to high-resolution DEMs (less than 5 m). For example, switching from a 1 m to a 30 m DEM can introduce errors exceeding 30% in flood extent and up to 150% in mean flood depth [64,65]. These discrepancies are primarily due to the loss of detail in representing river channels and urban features, especially when the DEM grid size exceeds the width of important landscape elements, such as rivers or infrastructure [66]. This loss of detail can distort local flow pathways, smooth out small depressions, and alter floodplain connectivity, thereby affecting both hazard mapping and vulnerability assessment.
Best practice for urban flood hazard assessments is therefore to use the highest-resolution DEM available, ideally finer than 5 m [35,67]. High-resolution DEMs derived from LiDAR or UAV-based photogrammetry enable a more realistic representation of topography, drainage structures, and built-up areas and generally lead to more reliable estimates of inundation depth and extent. Where comprehensive high-resolution coverage is not available, a hybrid approach combining a detailed DEM for river channels, floodplains, and densely urbanized zones with a coarser DEM in the upstream catchment can partially mitigate DEM-related errors while keeping computational costs manageable.
In the present study, the use of a freely available 30 m DEM and the limited availability of detailed urban drainage data represent important methodological constraints that must be acknowledged. While such datasets are suitable for preliminary or regional-scale flood hazard screening, they inevitably increase uncertainty in highly urbanized environments. Consequently, the spatial patterns and magnitudes of flood depth and extent reported here should be viewed as conservative and screening-level estimates. Future work in Bahrah City should prioritize (i) acquisition of a higher-resolution DEM, (ii) comprehensive mapping and digitization of stormwater and sewer networks, (iii) integration of detailed urban infrastructure and building information, and (iv) incorporation of additional hydrological and socio-technical factors as data become available, in order to refine flood simulations and improve the robustness of susceptibility and hazard and assessments.
Under data-scarce conditions, validation relies on cross-comparing MCDA-AHP susceptibility zones with RoG inundation depths, following established protocols for ungauged arid catchments [26,28,60]. This spatial agreement approach is standard practice where measured discharge data is unavailable [18,20] and aligns with the recent literature demonstrating that internal consistency checks between independent modeling pathways provide robust validation when empirical observations are lacking [51,60]. While acknowledging limitations from absent drainage infrastructure data [26], this framework offers a transferable methodology for regions facing similar data constraints.
The innovation lies in integrating MCDA-AHP with rain-on-grid modeling, creating a hybrid framework that combines spatial susceptibility analysis with process-based flood simulation. This addresses a critical gap in arid urban environments like Bahrah City, where data scarcity limits traditional modeling. The methodology provides a cost-effective, open-access tool for quantifying flood hazards under multiple return periods, validated by consistent spatial agreement between models. This transferable framework offers urban planners’ actionable insights for targeted mitigation, establishing a replicable model for similar data-limited regions globally.

6. Conclusions

This study demonstrated that integrating remote sensing, GIS, and Multi-Criteria Decision Analysis (MCDA) together with rain-on-grid (RoG) modeling provides a robust, quantitative framework for flood hazard mapping in arid urban environments, such as Bahrah City. The main outcomes are summarized as follows:
  • The high-susceptibility zone covers 2.2 km2 (3.2%) and represents areas with the greatest flood vulnerability.
  • The moderate-susceptibility zone encompasses 26.1 km2 (38.2%), indicating areas prone to occasional moderate flood events.
  • The low-susceptibility zone spans 44.7 km2 (65.4%), representing regions with a low likelihood of significant flooding.
  • Hydraulic validation using the RoG method in HEC-RAS confirmed the spatial hazard patterns, showing that the flood volume increases by 159% from the 5-year to the 50-year return period.
  • The maximum inundation depth increases by 47%, while the average inundation depth rises by 167% over the same return period.
  • Both the AHP analysis and the RoG flood hazard maps consistently identify the western part of Bahrah City as the main high-susceptibility zone, reinforcing the reliability and complementarity of both models.
  • Utilizing a freely available 30 m DEM is practical for preliminary hazard mapping, while future studies should adopt a higher-resolution DEM for detailed assessments.
  • Collectively, these findings provide urban decision makers and planners with the ability to target mitigation priorities, enhance infrastructure resilience, and advance proactive disaster preparedness in relation to future flood hazard patterns and areas highly susceptible to flooding in Bahrah City.

Author Contributions

Conceptualization, M.E.; methodology, A.H., A.P. and M.E.; validation, J.B. and A.P.; formal analysis, A.H.; investigation, J.B.; resources, J.B.; writing—original draft, A.H.; writing—review and editing, M.E. All authors have read and agreed to the published version of the manuscript.

Funding

The project was funded by KAU Endowment (WAQF) at King Abdulaziz University, Jeddah, Saudi Arabia. The authors, therefore, acknowledge with thanks WAQF and the Deanship of Scientific Research (DSR) for technical and financial support.

Data Availability Statement

The data are available upon request.

Conflicts of Interest

The authors declare no conflicts of interest.

References

  1. Subyani, A.M. Hydrologic behavior and flood probability for selected arid basins in Makkah area, western Saudi Arabia. Arab. J. Geosci. 2011, 4, 817. [Google Scholar] [CrossRef]
  2. Foudi, S.; Osés-Eraso, N.; Tamayo, I. Integrated spatial flood risk assessment: The case of Zaragoza. Land Use Policy 2015, 42, 278–292. [Google Scholar] [CrossRef]
  3. Holik, A.; Tian, W.; Psilovikos, A.; Elhag, M. Towards a Near-Real-Time Water Stress Monitoring System in Tropical Heterogeneous Landscapes Using Remote Sensing Data. Hydrology 2025, 12, 325. [Google Scholar] [CrossRef]
  4. Alif, H.A.; Mashrafi, M.J.; Elhag, M.; Purohit, S. Artificial Intelligence-Driven Rainfall Forecasting and GIS-Based Flood Risk Mapping for Climate-Resilient Infrastructure in Bangladesh. Earth Syst. Environ. 2025, 1–30. [Google Scholar] [CrossRef]
  5. Parsian, S.; Amani, M.; Moghimi, A.; Ghorbanian, A.; Mahdavi, S. Flood hazard mapping using fuzzy logic, analytical hierarchy process, and multi-source geospatial datasets. Remote Sens. 2021, 13, 4761. [Google Scholar] [CrossRef]
  6. Pulvirenti, L.; Pierdicca, N.; Chini, M.; Guerriero, L. An algorithm for operational flood mapping from Synthetic Aperture Radar (SAR) data using fuzzy logic. Nat. Hazards Earth Syst. Sci. 2011, 11, 529–540. [Google Scholar] [CrossRef]
  7. Rabie, A.B.; Elhag, M.; Subyani, A. Remote Sensing, GIS, and Machine Learning in Water Resources Management for Arid Agricultural Regions: A Review. Water 2025, 17, 3125. [Google Scholar] [CrossRef]
  8. Samanta, S.; Koloa, C.; Pal, D.K.; Palsamanta, B. Flood risk analysis in lower part of Markham river based on multi-criteria decision approach (MCDA). Hydrology 2016, 3, 29. [Google Scholar] [CrossRef]
  9. Tien Bui, D.; Tuan, T.A.; Klempe, H.; Pradhan, B.; Revhaug, I. Spatial prediction models for shallow landslide hazards: A comparative assessment of the efficacy of support vector machines, artificial neural networks, kernel logistic regression, and logistic model tree. Landslides 2016, 13, 361–378. [Google Scholar] [CrossRef]
  10. Elhag, M.; Chaabani, A.; Zhang, L. Assessment of surface deformation patterns using InSAR data: Implications for human impacts in Makkah City, Saudi Arabia. Kuwait J. Sci. 2025, 52, 100419. [Google Scholar] [CrossRef]
  11. Mazarakis, V.; Tsanakas, K.; Greenbaum, N.; Batzakis, D.-V.; Sorrentino, A.; Tsodoulos, I.; Valkanou, K.; Karymbalis, E. Flood-Hazard Assessment in the Messapios River Catchment (Central Evia Island, Greece) by Integrating GIS-Based Multi-Criteria Decision Analysis and Analytic Hierarchy Process. Land 2025, 14, 658. [Google Scholar] [CrossRef]
  12. Shrestha, S.; Dahal, D.; Poudel, B.; Banjara, M.; Kalra, A. Flood Susceptibility Analysis with Integrated Geographic Information System and Analytical Hierarchy Process: A Multi-Criteria Framework for Risk Assessment and Mitigation. Water 2025, 17, 937. [Google Scholar] [CrossRef]
  13. Saaty, T.L. The analytic hierarchy process (AHP). J. Oper. Res. Soc. 1980, 41, 1073–1076. [Google Scholar]
  14. Zou, Q.; Zhou, J.; Zhou, C.; Song, L.; Guo, J. Comprehensive flood risk assessment based on set pair analysis-variable fuzzy sets model and fuzzy AHP. Stoch. Environ. Res. Risk Assess. 2013, 27, 525–546. [Google Scholar] [CrossRef]
  15. Ouma, Y.O.; Tateishi, R. Urban flood vulnerability and risk mapping using integrated multi-parametric AHP and GIS: Methodological overview and case study assessment. Water 2014, 6, 1515–1545. [Google Scholar] [CrossRef]
  16. Elhag, M.; Hamza, M.H.; Ouerghi, S.; Elsheikh, R.; Zhang, L.; Diani, K. From Data to Action: Rainfall Factor-Based Soil Erosion Assessment in Arid Regions Through Integrated Geospatial Modeling. Water 2025, 17, 1692. [Google Scholar] [CrossRef]
  17. Nyimbili, P.H.; Erden, T.; Karaman, H. Integration of GIS, AHP and TOPSIS for earthquake hazard analysis. Nat. Hazards 2018, 92, 1523–1546. [Google Scholar] [CrossRef]
  18. Chaabani, A.; Adem, E.; Elfeki, A.; Farran, M.M.; Shults, R.; Elhag, M. Hydrogeological mapping of fracture networks using earth observation data to improve rainfall–runoff modeling in arid mountains, Saudi Arabia. Open Geosci. 2024, 16, 20220679. [Google Scholar] [CrossRef]
  19. Zeiger, S.J.; Hubbart, J.A. Measuring and modeling event-based environmental flows: An assessment of HEC-RAS 2D rain-on-grid simulations. J. Environ. Manag. 2021, 285, 112125. [Google Scholar] [CrossRef]
  20. Shahbandeh, M.; Elhag, M. Microclimate changes and trend analysis of remotely sensed environmental parameters in West Asia Semi-arid region. Environ. Dev. Sustain. 2024, 26, 14433–14447. [Google Scholar] [CrossRef]
  21. Utama, R.N.; Ginting, B.M.; Ginting, S. Pemodelan Rain-On-Grid Untuk Kasus Banjir pada Polder Pluit, Jakarta. Rekayasa Sipil 2023, 17, 308–314. [Google Scholar] [CrossRef]
  22. Adem, E.; Elfeki, A.; Chaabani, A.; Alwegdani, A.; Hussain, S.; Elhag, M. Impact of satellite precipitation estimation methods on the hydrological response: Case study Wadi Nu’man basin, Saudi Arabia. Theor. Appl. Climatol. 2024, 155, 3907–3925. [Google Scholar] [CrossRef]
  23. Godara, N.; Bruland, O.; Alfredsen, K. Simulation of flash flood peaks in a small and steep catchment using rain-on-grid technique. J. Flood Risk Manag. 2023, 16, e12898. [Google Scholar] [CrossRef]
  24. Devi, N.N.; Kuiry, S.N. Rain-On-Grid Local-Inertial Formulation to Model Within Grid Topography. In Fluid Mechanics and Hydraulics; International Conference on Hydraulics, Water Resources and Coastal Engineering; Springer: Berlin/Heidelberg, Germany, 2021. [Google Scholar]
  25. David, A.; Schmalz, B. A Systematic Analysis of the Interaction between Rain-on-Grid-Simulations and Spatial Resolution in 2D Hydrodynamic Modeling. Water 2021, 13, 2346. [Google Scholar] [CrossRef]
  26. Ennouini, W.; Fenocchi, A.; Petaccia, G.; Persi, E.; Sibilla, S. A complete methodology to assess hydraulic risk in small ungauged catchments based on HEC-RAS 2D Rain-On-Grid simulations. Nat. Hazards 2024, 120, 7381–7409. [Google Scholar] [CrossRef]
  27. Elhag, M.; Bahrawi, J.; Zhang, L.; Ejaz, N. Assessment and quantification of sediment retention and dam management in arid environments using remote sensing techniques. Arab. J. Geosci. 2023, 16, 559. [Google Scholar] [CrossRef]
  28. Shawky, M.; Hassan, Q. Geospatial Modeling Based-Multi-Criteria Decision-Making for Flash Flood Susceptibility Zonation in an Arid Area. Remote. Sens. 2023, 15, 2561. [Google Scholar] [CrossRef]
  29. Adem, E.; Boteva, S.; Zhang, L.; Elhag, M. Estimation of evapotranspiration based on METRIC and SEBAL model using remote sensing, near Al-Jouf, Saudi Arabia. Desalination Water Treat. 2023, 290, 94–103. [Google Scholar] [CrossRef]
  30. Islam, T.; Zeleke, E.; Afroz, M.; Melesse, A. A Systematic Review of Urban Flood Susceptibility Mapping: Remote Sensing, Machine Learning, and Other Modeling Approaches. Remote Sens. 2025, 17, 524. [Google Scholar] [CrossRef]
  31. Baccari, N.; Hamza, M.H.; Slama, T.; Sebei, A.; Ouerghi, S.; Elsheikh, R.; Rebai, N.; Hasanean, H.; Almazroui, M.; Elhag, M. Assessment of Machine Learning Techniques in Mapping Land Use/Land Cover Changes in a Semi-Arid Environment. Earth Syst. Environ. 2025, 9, 519–539. [Google Scholar] [CrossRef]
  32. Bahrawi, J.; Ewea, H.; Kamis, A.; Elhag, M. Potential flood risk due to urbanization expansion in arid environments, Saudi Arabia. Nat. Hazards 2020, 104, 795–809. [Google Scholar] [CrossRef]
  33. Subyani, A. Flood vulnerability assessment in arid areas, Western Saudi Arabia. Int. J. River Basin Manag. 2012, 10, 197–203. [Google Scholar] [CrossRef]
  34. Shen, Q.; Zhang, Y.; Yan, Y.; Dong, H.; Lei, W. Experimental Study on Infiltration Characteristics of Shallow Rainwater in Expansive Soil Slopes at Different Gradients. Water 2025, 17, 642. [Google Scholar] [CrossRef]
  35. Adem, E.; Shults, R.; Ukasha, M.; Elfeki, A.; Alqahtani, F.; Elhag, M. Land subsidence and groundwater storage change assessment using InSAR and GRACE in the arid environment of Saudi Arabia. Nat. Hazards 2024, 120, 13137–13159. [Google Scholar] [CrossRef]
  36. Kharazmi, R.; Rahdari, M.R.; Rodríguez-Seijo, A.; Elhag, M. Long-Term Time Series Analysis of Land Cover Changes in an Arid Environment Using Landsat Data:(A Case Study Of Hamoun Biosphere Reserve, Iran). Desert 2023, 28, 123–144. [Google Scholar]
  37. Fernández, D.; Lutz, M.A. Urban flood hazard zoning in Tucumán Province, Argentina, using GIS and multicriteria decision analysis. Eng. Geol. 2010, 111, 90–98. [Google Scholar] [CrossRef]
  38. Malczewski, J. GIS and Multicriteria Decision Analysis; John Wiley & Sons: Hoboken, NJ, USA, 1999. [Google Scholar]
  39. Kumar, M.; Tiwari, R.K.; Rautela, K.S.; Kumar, K.; Khajuria, V.; Verma, I.; Safi, S.; Almazroui, M.; Al Kafy, A.; Zhang, L.; et al. Comparative assessment of process based models for simulating the hydrological response of the Himalayan River Basin. Earth Syst. Environ. 2025, 9, 299–313. [Google Scholar] [CrossRef]
  40. Ejaz, N.; Elhag, M.; Bahrawi, J.; Zhang, L.; Gabriel, H.F.; Rahman, K.U. Soil Erosion Modelling and Accumulation Using RUSLE and Remote Sensing Techniques: Case Study Wadi Baysh, Kingdom of Saudi Arabia. Sustainability 2023, 15, 3218. [Google Scholar] [CrossRef]
  41. Elhag, M.; Bahrawi, J.; Boteva, S. Input/output inconsistencies of daily evapotranspiration conducted empirically using remote sensing data in arid environments. Open Geosci. 2021, 13, 321–334. [Google Scholar] [CrossRef]
  42. Berger, V.; Zhou, Y. Kolmogorov–Smirnov Test: Overview; John Wiley & Sons: Hoboken, NJ, USA, 2014. [Google Scholar]
  43. Hidayatulloh, A.; Chaabani, A.; Zhang, L.; Elhag, M. DEM study on hydrological response in Makkah City, Saudi Arabia. Sustainability 2022, 14, 13369. [Google Scholar] [CrossRef]
  44. Kite, G.W. Frequency and Risk Analyses in Hydrology; Water Resources Publications: Littleton, CO, USA, 1977; p. 224. [Google Scholar]
  45. Allafta, H.; Opp, C. GIS-based multi-criteria analysis for flood prone areas mapping in the trans-boundary Shatt Al-Arab basin, Iraq-Iran. Geomat. Nat. Hazards Risk 2021, 12, 2087–2116. [Google Scholar] [CrossRef]
  46. Elhag, M.; Zhang, L.; Chaabani, A. Microwave data in surface deformation assessment due to anthropogenic activities in Makkah City, Saudi Arabia. Acta Geophys. 2025, 73, 5705–5717. [Google Scholar] [CrossRef]
  47. Rahmati, O.; Zeinivand, H.; Besharat, M. Flood hazard zoning in Yasooj region, Iran, using GIS and multi-criteria decision analysis. Geomat. Nat. Hazards Risk 2016, 7, 1000–1017. [Google Scholar] [CrossRef]
  48. Saaty, T. Fundamentals of decision making and priority theory with analytical hierarchical process. AHP Ser. 1980, 6. [Google Scholar]
  49. Mignot, E.; Paquier, A.; Haider, S. Modeling floods in a dense urban area using 2D shallow water equations. J. Hydrol. 2006, 327, 186–199. [Google Scholar] [CrossRef]
  50. Hussain, S.; Elfeki, A.M.; Chaabani, A.; Yibrie, E.A.; Elhag, M. Spatio-temporal evaluation of remote sensing rainfall data of TRMM satellite over the Kingdom of Saudi Arabia. Theor. Appl. Climatol. 2022, 150, 363–377. [Google Scholar] [CrossRef]
  51. Corvacho-Ganahín, Ó.; González-Pacheco, M.; Francos, M.; Carvalho, F. Evaluation of potential flood hazard through spatial zoning in Acha–Arica, northern Chile, integrating GIS, multi-criteria analysis and two-dimensional numerical simulation. Nat. Hazards 2023, 118, 755–783. [Google Scholar] [CrossRef]
  52. Adem, E.; Chaabani, A.; Elfeki, A.; Zhang, L.; Elhag, M. SBAS-InSAR/GNSS Surface Deformation Assessment in Arid Environments of Najran, Saudi Arabia. Earth Syst. Environ. 2023, 7, 601–616. [Google Scholar] [CrossRef]
  53. Dottori, F.; Salamon, P.; Bianchi, A.; Alfieri, L.; Hirpa, F.; Feyen, L. Development and evaluation of a framework for global flood hazard mapping. Adv. Water Resour. 2016, 94, 87–102. [Google Scholar] [CrossRef]
  54. Nachappa, T.G.; Piralilou, S.T.; Gholamnia, K.; Ghorbanzadeh, O.; Rahmati, O.; Blaschke, T. Flood susceptibility mapping with machine learning, multi-criteria decision analysis and ensemble using Dempster Shafer Theory. J. Hydrol. 2020, 590, 125275. [Google Scholar] [CrossRef]
  55. Tang, Z.; Zhang, H.; Yi, S.; Xiao, Y. Assessment of flood susceptible areas using spatially explicit, probabilistic multi-criteria decision analysis. J. Hydrol. 2018, 558, 144–158. [Google Scholar] [CrossRef]
  56. Abdullah, M.F.; Siraj, S.; Hodgett, R. An Overview of Multi-Criteria Decision Analysis (MCDA) Application in Managing Water-Related Disaster Events: Analyzing 20 Years of Literature for Flood and Drought Events. Water 2021, 13, 1358. [Google Scholar] [CrossRef]
  57. Hossain, M.N.; Mumu, U.H. Flood susceptibility modelling of the Teesta River Basin through the AHP-MCDA process using GIS and remote sensing. Nat. Hazards 2024, 120, 12137–12161. [Google Scholar] [CrossRef]
  58. Malik, S.; Pal, S.; Arabameri, A.; Chowdhuri, I.; Saha, A.; Chakrabortty, R.; Roy, P.; Das, B. GIS-based statistical model for the prediction of flood hazard susceptibility. Environ. Dev. Sustain. 2021, 23, 16713–16743. [Google Scholar] [CrossRef]
  59. Khoshkonesh, A.; Nazari, R.; Nikoo, M.; Karimi, M. Enhancing flood risk assessment in urban areas by integrating hydrodynamic models and machine learning techniques. Sci. Total Environ. 2024, 952, 175859. [Google Scholar] [CrossRef]
  60. Okacha, A.; Salhi, A.; Bouchouou, M.; Fattasse, H. Enhancing flood forecasting accuracy in Data-Scarce regions through advanced modeling approaches. J. Hydrol. 2024, 645, 132283. [Google Scholar] [CrossRef]
  61. Duy, N.H.; Pham, L.T.; Linh, N.X.; Van Truong, T.; Kha, D.D.; Hai, T.Q.; Bui, Q.-T. Flood risk assessment using machine learning, hydrodynamic modelling, and the analytic hierarchy process. J. Hydroinformatics 2024, 26, 1852–1882. [Google Scholar] [CrossRef]
  62. Xing, Y.; Liang, Q.; Wang, G.; Ming, X.; Xia, X. City-scale hydrodynamic modelling of urban flash floods: The issues of scale and resolution. Nat. Hazards 2018, 96, 473–496. [Google Scholar] [CrossRef]
  63. Budiman, J.; Bahrawi, J.; Hidayatulloh, A.; Almazroui, M.; Elhag, M. Volumetric Quantification of Flash Flood Using Microwave Data on a Watershed Scale in Arid Environments, Saudi Arabia. Sustainability 2021, 13, 4115. [Google Scholar] [CrossRef]
  64. Muthusamy, M.; Casado, M.; Butler, D.; Leinster, P. Understanding the effects of Digital Elevation Model resolution in urban fluvial flood modelling. J. Hydrol. 2021, 596, 126088. [Google Scholar] [CrossRef]
  65. Zandsalimi, Z.; Feizabadi, S.; Yazdi, J.; Neyshabouri, S.S. Evaluating the Impact of Digital Elevation Models on Urban Flood Modeling: A Comprehensive Analysis of Flood Inundation, Hazard Mapping, and Damage Estimation. Water Resour. Manag. 2024, 38, 4243–4268. [Google Scholar] [CrossRef]
  66. Jiang, W.; Yu, J.; Wang, Q.; Yue, Q. Understanding the effects of digital elevation model resolution and building treatment for urban flood modelling. J. Hydrol. Reg. Stud. 2022, 42, 101122. [Google Scholar] [CrossRef]
  67. Alexopoulos, M.J.; Dimitriadis, P.; Iliopoulou, T.; Bezak, N.; Kobold, M.; Koutsoyiannis, D. Effects of digital elevation model resolution on rain-on-grid simulations: A case study in a Slovenian watershed. Hydrol. Sci. J. 2024, 69, 1468–1485. [Google Scholar] [CrossRef]
Figure 1. Bahrah City, Kingdom of Saudi Arabia (KSA) (Source: Author).
Geosciences 16 00032 g001
Figure 2. The flowchart of flood hazard mapping used in this study.
Geosciences 16 00032 g002
Figure 3. Thematic parameters used in the MCDA-AHP-based flood susceptibility study of Bahrah City, including elevation (a), slope (b), LULC (c), stream (d), and distance to the stream (e).
Geosciences 16 00032 g003
Figure 4. Maximum daily rainfall in Bahrah City from 1966 to 2019.
Geosciences 16 00032 g004
Figure 5. Rainfall distribution comparisons with the Gumbel distribution provided the best fit to the observed data.
Geosciences 16 00032 g005
Figure 6. Frequency analysis of maximum daily rainfall in Bahrah City from 1966 to 2019.
Geosciences 16 00032 g006
Figure 7. Flood susceptibility map of Bahrah City.
Geosciences 16 00032 g007
Figure 8. Flood hazard maps of Bahra City based on inundation depth for 5-, 10-, 25-, and 50-year return periods.
Geosciences 16 00032 g008
Figure 9. Trends in flood volume and depth for different return periods in Bahra City.
Geosciences 16 00032 g009
Table 1. Station J102 in Bahrah City, Makkah region, Kingdom of Saudi Arabia (KSA).
Station
No.
Station
Name
CoordinatesRecorded
Storms
Total No
of Storms
Lat. (North)Long. (East)FromTo
J102Bahrah21°25′58.94′′39°42′4.45′′1966201944
Table 2. Statistical data and evaluation using the Kolmogorov–Smirnov (K-S) test.
DistributionKolmogorov–Smirnov Test
Gumbel0.123
Exponential0.185
Logistic0.134
Normal0.152
Gamma0.187
Table 3. Maximum daily rainfall corresponding to different return periods.
Return Period (years)5102050
Rainfall Predictions (mm)37.049.361.176.4
Table 4. The weight of each input parameter was determined using the AHP [47].
ParametersWeight
Elevation0.232
Slope0.138
LULC0.084
Distance to the stream0.546
Table 5. The flood potential rank for each classification and parameter.
No.ParameterClassificationRankNo.ParameterClassificationRank
1Elevation
(m)
0–7553Distance to the stream (m)0–1005
76–1004101–2504
101–1503251–5003
151–2002501–7502
>2001>7501
2Slope
(degree)
0–354LULCBuilt-up5
4–94Bare land4
10–163Cropland3
17–232Shrubland2
>231Tree cover1
Table 6. Flood susceptibility levels, corresponding areas, and risk index.
Susceptibility LevelArea (km2)PercentageRisk Index
High2.23.073.2–5
Moderate26.135.751.7–3.2
Low44.761.180–1.6
Disclaimer/Publisher’s Note: The statements, opinions and data contained in all publications are solely those of the individual author(s) and contributor(s) and not of MDPI and/or the editor(s). MDPI and/or the editor(s) disclaim responsibility for any injury to people or property resulting from any ideas, methods, instructions or products referred to in the content.