Article

Co- and Post-Seismic Hydrogeological Anomalies in Greece from Ancient Times to the Present: Spatiotemporal and Statistical Analysis Revealing Categories, Patterns, and Insights

by
Spyridon Mavroulis
*,
Andromachi Sarantopoulou
and
Efthymios Lekkas
Department of Dynamic, Tectonic, Applied Geology, Faculty of Geology and Geoenvironment, School of Sciences, National and Kapodistrian University of Athens, 15784 Athens, Greece
*
Author to whom correspondence should be addressed.
Geosciences 2025, 15(9), 367; https://doi.org/10.3390/geosciences15090367
Submission received: 17 July 2025 / Revised: 1 September 2025 / Accepted: 15 September 2025 / Published: 17 September 2025
(This article belongs to the Section Hydrogeology)

Abstract

Co- and post-seismic earthquake-induced hydrogeological anomalies (EQHAs) in Greece are mainly associated with moderate to strong earthquakes (Mw = 6.0–7.0), particularly when seismic intensities reach IX or above. The highest frequencies are observed in the Peloponnese and Ionian Islands, followed by Central Greece and the North Aegean, characterized by dense faulting and frequent strong earthquakes. EQHAs are classified into six main types, with hydraulic variations being the most common. About 77% of earthquakes produced only one or two types of EQHA, suggesting localized hydrogeological effects, while only a few induced multiple types. Strong events (Mw = 6.0–7.0), often historic, generated the broadest variety, highlighting the influence of local geological, hydrological, and tectonic conditions on magnitude alone. Springs and wells, representing 81% of the cases, dominate the affected systems, while lakes and rivers respond less often but significantly. Most EQHAs occur in Greece’s second seismic hazard zone (74%) due to its larger geographic area. EQHAs primarily develop in karstic and porous formations but also appear in impermeable rocks due to fracturing or karst. Larger earthquakes trigger anomalies at greater distances (>100 km). Though rarely fatal, EQHAs can damage water infrastructure, contaminate supplies, and cause shortages, underscoring the need for systematic monitoring and post-earthquake water resource management.

1. Introduction

In the frame of the presentation of the Environmental Seismic Intensity Scale 2007 (ESI-07), Michetti et al. [1] included earthquake-induced hydrogeological anomalies (EQHAs) in the category of secondary earthquake environmental effects (EEEs). This category includes the following: (i) variations in water level in wells and flow rate in springs, (ii) variations in the chemical–physical properties of water including temperature and turbidity, (iii) formations of new springs, and (iv) gas emissions, often sulphureous, resulting in burning of the surrounding vegetation.
Based on the study by Wang and Manga [2] on earthquakes and water, EQHAs are classified into several categories including groundwater-level changes, changes in streamflow, liquefaction, changes in groundwater temperature, and composition, and the response of mud volcanoes and geysers.
Several studies have documented a wide range of changes in the characteristics of both surface and groundwater bodies, such as rivers, streams [3], lakes, closed basins, and aquifers [4], as well as water intakes, including water and hot springs [5,6,7,8], wells [9,10,11,12,13,14,15,16,17], and boreholes [18]. These changes have been observed during and after the occurrence of earthquakes, which allow them to be classified into co-seismic, and post-seismic phenomena, respectively.
Among the most frequently observed co- and post-seismic EQHAs are groundwater level changes, with durations ranging from hours to several weeks. Roeloffs et al. [19] observed groundwater level variations that lasted up to 30 days following earthquakes at Long Valley caldera (California, US) generated from July 1989 to October 1999.
Similar co-seismic groundwater level variations were documented by Lin et al. [20] following the 6 February 2016 Mw = 6.4 Meinong earthquake (southern Taiwan), suggesting enhanced vertical hydraulic connectivity and increased vertical pressure gradients induced by the earthquake [20]. These hydraulic changes were also reflected in river discharge patterns, with significant post-earthquake flow increases downstream, which were linked to co-seismic groundwater level rises and widespread liquefaction in the area [20].
In several cases, as recorded during the 30 October 2020, Mw = 7.0 Samos (eastern Aegean Sea, Greece) earthquake by Uzelli et al. [17] and Mavroulis et al. [21], new springs emerged, existing ones dried up, and others presented an increased flow rate. Significant changes in spring and river discharge were also documented following normal faulting earthquakes [22], with excess flow lasting for 6–12 months.
Groundwater-level and temperature changes with significant post-seismic responses were also recorded after the 28 July 1976, Ms = 7.8 Tangshan earthquake in China [23]. Groundwater rose by several meters near the epicentre and maintained an upward flow for about five days. This effect was attributed to vertical hydraulic connection enhancements between shallow and deep aquifers causing upwelling of deep fluids [23].
Moreover, earthquakes can alter electrical conductivity and ionic composition among other physical and chemical properties of groundwater. These changes often result from mixing with deeper fluids, seawater intrusion, or enhanced water–rock interaction, as shown in studies by Yang et al. [24], Malakootian and Nouri [11], and Kim et al. [25].
A more recent focus is on changes in trace elements, which have been suggested to be more sensitive indicators of minor seismic events than major ion concentrations. Chen and Liu [7] studied the groundwater trace element changes by the 3 February 2022, ML = 3.3 Chaoyang district (Beijing, China) earthquake and reported that elements such as Li, Sc, Pb, and Zn showed distinct pre- and post-seismic trends, despite the absence of significant groundwater level changes in the monitored wells.
Regarding mechanisms that have been suggested to account for hydrologic responses, static poroelastic strain, undrained consolidation, and permeability enhancement are the primary ones [2,22,26,27,28,29,30]. The movement of fluids and gases within cracks or fractures in the crust is also considered as one of the primary mechanisms [31,32]. These mechanisms are not mutually exclusive and can occur simultaneously, potentially influencing one another.
As can be seen from the examples given above, the study of the EQHAs represents a multiparametric and multidisciplinary approach integrating geological, hydrological, hydrogeological, geochemical, and ecological components. Many researchers have examined records of these anomalies and associated phenomena. One focus has been identifying and differentiating the various responses of hydrological and hydrogeological systems during seismic ground shaking [2,3,9,10,17,24,25,33,34,35,36,37]. Another aim has been the detection and interpretation of the mechanisms responsible for EQHA generation, as well as the determination of controlling factors and underlying causes of these phenomena [4,9,22,25,26,35,38].
However, in Greece, studies of earthquake hydrology and, in particular, of hydrogeological anomalies during and after earthquakes, are limited. One of the most notable studies on EQHAs was carried out by Koumantakis et al. [39] during their hydrogeological research in the framework of the microzonation study of Kalamata City (SW Peloponnese), which was affected by the 13 September 1986 Ms = 6.2 earthquake, with extensive primary and secondary EEEs [40], including hydrogeological anomalies. Koumantakis et al. [39] found anomalies in wells in the affected area, which included turbidity, fluctuations in well water level, and water gushing along the stream bed.
Furthermore, another study investigating EQHAs in Greece is that of Tsermegas [41], which examines the impacts of seismic activity on the natural environment. Historical records of earthquakes in Greece document minor effects such as variations in groundwater level (19 cases), the emergence of water and mud pools (2 cases), and alterations in river courses (3 cases) [41].
The present study seeks to address this gap by offering a contribution to the emerging field of earthquake hydrology. It compiles and presents available information about EQHAs in Greece, as documented in various scientific sources. The objective is to highlight the spatial, qualitative, and quantitative characteristics of these anomalies at a national scale, encompassing both mainland and insular regions of Greece, and spanning a broad temporal range from ancient times to the present.
The research has uncovered a substantial body of relevant data concerning the spatial and temporal distribution of EQHAs, as well as their primary classifications. Furthermore, both statistical and spatiotemporal analyses were conducted, taking into account the hydrological and hydrolithological characteristics of the affected areas, including river basin districts, river basins, surface water bodies, groundwater systems, and drainage systems.

2. Methodology

The methodology was based on the steps applied by Mavroulis et al. [42] in their research on earthquake-triggered landslides in Greece. It initially includes revisiting the available scientific literature containing information about EQHAs in Greece. Relevant information was obtained from the following sources (Table 1):
  • Peer-reviewed journal articles that involve the evaluation and mapping of EEEs, including EQHAs;
  • Papers presented in national and international conferences that focus on assessing and mapping EEEs, including EQHAs;
  • Scientific books that provide catalogues and detailed information about earthquakes in Greece and the Eastern Mediterranean region covering their effects on both natural and built environments, with EQHAs included among the observed impact;
  • Doctoral theses examining earthquakes and their effects on the natural and built environment, including EQHAs;
  • Official reports derived from field investigations and reconnaissance surveys documenting earthquake impact and associated EQHAs on the affected areas.
For the research on the EQHAs in Greece, a total of 37 scientific sources were used (Table 1). Of these 37 sources, the majority belong to the first category of peer-reviewed journal articles (15 of 37, 40.54%), followed by scientific books that include information on earthquakes and their impacts (12 of 37, 32.43%). The remaining sources are represented in smaller numbers and percentages. Publications at national and international conferences and official reports from field reconnaissance surveys conducted after earthquakes each represent an equal share (4, 10.81%), while the proportion of doctoral dissertations is even smaller (2 out of 37, 5.41%).
Scientific books containing detailed descriptions of numerous earthquakes in Greece were among the most informative sources on EQHAs. They include the studies of Ambraseys [64], Spyropoulos [60], Papazachos and Papazachou [62], and Mavroulis [72], which comprise information about 30, 28, 30, and 17 earthquakes and the associated hydrogeological anomalies, respectively.
Other important sources, such as the studies by Ambraseys and Jackson [44,46], Soloviev et al. [70], Papadopoulos [65,69], Mavroulis and Lekkas [58], Mavroulis et al. [50], Taxeidis [71], and Choutzaios [61], were used for a smaller but substantial number of events (5 to 7). An additional 24 sources provided related information on one to three earthquakes.
The reviewed literature focused specifically on EQHAs, and the extracted data used in this study encompassed not only the induced effects but also the properties of the causative earthquakes. For each earthquake, the collected information was about origin time, epicentre coordinates (latitude and longitude), focal depth in km, magnitude, maximum intensity, and the affected area.
To provide a thorough and accurate account of earthquake data, multiple earthquake catalogues were consulted. These include the updated and expanded catalogue for Greece and nearby regions from 1900 to 2009, compiled by Makropoulos et al. [77]; the SHARE European Earthquake Catalogue (SHEEC) covering the period 1000–1899, developed by Stucchi et al. [78]; and its successor, the European Pre-Instrumental Earthquake Catalogue (EPICA), maintained and updated by the National Institute of Geophysics and Volcanology (INGV) [79] and Rovida et al. [80]. For earthquakes predating 1000 AD, data from the catalogue of Papazachos and Papazachou [62], which focuses on Greek seismicity, were also included.
The identification and spatial integration of EQHAs in the present study involved a multi-step approach, combining a comprehensive literature review, field investigations, data analysis, and the application of geographic information systems (GIS) for detailed spatial assessment. Many of the reviewed sources provided maps depicting locations of the EQHAs, for example, Koumantakis et al. [39] and Fountoulis and Mavroulis [40] provided maps for the 1986 Kalamata (SW Peloponnese) earthquake, and Mavroulis [72] provided maps for the central Ionian Islands and western Peloponnese. These mapped data facilitated precise localization, enabling georeferencing, digitization, and incorporation of relevant attributes into GIS attribute tables. For sources lacking explicit mapping of EQHAs, site identification was achieved through comprehensive evaluation of all available descriptive information, supplemented by the use of various cartographic materials, including topographic, geological, and hydrolithological maps. This integrative approach ensured accurate spatial identification of EQHAs even in the absence of direct graphical representations.
Additionally, cartographic resources and geospatial vector data were utilized to obtain geographic, qualitative, and quantitative data related to EQHAs. These materials include maps detailing the geological framework of the impacted regions, the lithological composition and age of the affected formations, as well as the hydrolithological properties of the affected areas. The geospatial vector data comprise shapefiles related to the hydrology of the affected areas including drainage system, river basin districts, river basins and water bodies. A comprehensive overview of the used data is provided in Table 2.
During the review of relevant literature, it was observed that EQHAs have also been associated with historical earthquakes predating the year 1900, including events from ancient times (B.C.). However, the available documentation for these secondary EEEs is often limited to broad descriptions, such as the general area of occurrence or a vague description of the EQHAs, without specific or detailed information. This lack of precision hinders the accurate determination of their locations.
To address this issue, a Location Reliability Index (LRI) was introduced for EQHAs. The LRI usually categorizes the spatial accuracy of event locations into four classes: (i) 0–100 m, (ii) 0–1 km, (iii) 0–10 km, and (iv) greater than 10 km. Based on the spatial resolution inferred from the source material, each EQHA is assigned an appropriate LRI value.
Such indices have been widely adopted in studies of both recent and historical seismic events to evaluate impacts on the natural environment across various seismotectonic settings. Notable examples include the assessment of primary and secondary EEEs from the 28 December 1908 Mw = 7.1 Messina (Italy) earthquake [86]; the 1953 earthquake sequence in the central Ionian Islands, among the most damaging in modern Greek history [52]; and the 4 February 1867 Cephalonia earthquake [55], the largest event in that region. The same LRI methodology was also effectively applied in a comprehensive analysis of earthquake-triggered landslides in Greece, spanning from antiquity to the present [42].
Given the inherent uncertainties of historical records, stemming from generalized descriptions and interpretative challenges, similar classification systems have been developed to assess the reliability of information. These typically include three categories: (i) low, (ii) moderate, and (iii) high reliability. In the context of this study, most EQHA data are derived from scientifically robust and peer-reviewed sources, and are therefore considered to fall within the high-reliability category. Any instances of lower reliability were clearly noted in the original sources and are excluded from the current analysis.
All hydrogeological anomaly observations in this study derive solely from field-based surveys in affected areas, without permanent instruments. The detection of anomalies depends on the presence of researchers or eyewitnesses and prevailing field conditions. Many observations pertain to historical events, documented through archival records, local testimonies, and historical or scientific accounts. Accordingly, reported frequencies reflect the availability and coverage of observations, rather than the true physical occurrence of the studied effects.
An overview of the adopted methodology is given in the flowchart in Figure 1.

3. Regional Setting

3.1. Morphology of Greece

To the north, Greece shares borders with Albania, North Macedonia, and Bulgaria from west to east, while Turkey lies to the east. The Ionian Sea defines its western boundary, and the Eastern Mediterranean lies to the south (Figure 2a). The country covers a total area of 131,957 km2, of which 130,647 km2 are land, with the remaining 1310 km2 consisting of hydrological features such as rivers, lakes, groundwater, and coastal waters. According to its administrative organization, Greece is divided into thirteen regions (Figure 2b). Extensive mountain ranges occupy about 80% of its surface area; diverse coastlines have a total length of about 15,000 km, while there are more than 6000 islands, of which about 227 are inhabited [87].
The region of Eastern Macedonia and Thrace features a diverse landscape, where the Rhodope Mountain range (Figure 3), reaching elevations up to 1953 m, coexists with fertile lowlands. The Nestos River, extending about 230 km in total, flows into the Thracian Sea (Figure 3), providing both arable land and essential water resources [85]. Central Macedonia includes the productive plains of Thessaloniki and Giannitsa (Figure 3), which are irrigated by major rivers such as Axios (388 km), and Aliakmonas (297 km) (Figure 3), forming a highly fertile agricultural zone [85]. In the west, the Region of Western Macedonia features a predominantly mountainous landscape interspersed with several lakes. In Epirus, the rugged terrain of the Pindos mountain range, rising to 2637 m, coexists with the clear waters of Kalamas (115 km), and Arachthos (110 km) Rivers [85] (Figure 3). In the fertile region of Thessaly, the Pineios River (205 km) irrigates the largest plain in Greece [85] (Figure 3). The landscape is framed by the peaks of Olympus (2917 m) (Figure 3) and Ossa (1978 m) Mts. In Central Greece, Giona (2510 m) and Parnassos (2457 m) Mts coexist with the lowlands of Boeotia, through which the Voiotikos Kifissos River (60 km) flows [85] (Figure 3). In the region of Western Greece, major rivers such as Acheloos (220 km) in Aetoakarnania, and Pineios (80 km) in NW Peloponnese [85] (Figure 3) provide fertile land and valuable water resources, linking the interior of the country with the Ionian coastline. In Peloponnese, the Taygetos Mt (2404 m) coexists with fertile plains and coastal zones, while Evrotas (82 km) and Alfios (112 km) Rivers (Figure 3) connect the mountainous interior to the surrounding seas [85]. In Attica, the Athens Basin is bounded westwards by Parnitha Mt. (1413 m) and eastwards by Penteli (1109 m), and Ymittos (1026 m) mountains, while the coastal zones along the Saronic Gulf contribute to the region’s diverse natural landscape. In the North Aegean, rocky terrains are interspersed with small fertile valleys. In the South Aegean, the Cyclades and Dodecanese Islands (Figure 3) constitute internationally renowned tourist destinations, despite their arid climate and limited surface water availability.
In Crete, the mountains of Lefka (2453 m), Psiloritis (2456 m), and Dikti (2148 m) (Figure 3) coexist with fertile plains, springs, and deep gorges, endowing the island with significant natural and cultural value. In the Ionian Islands, the lush landscape harmoniously integrates with an extensive drainage network and a highly indented coastline.

3.2. Geodynamic and Seismotectonic Setting of Greece

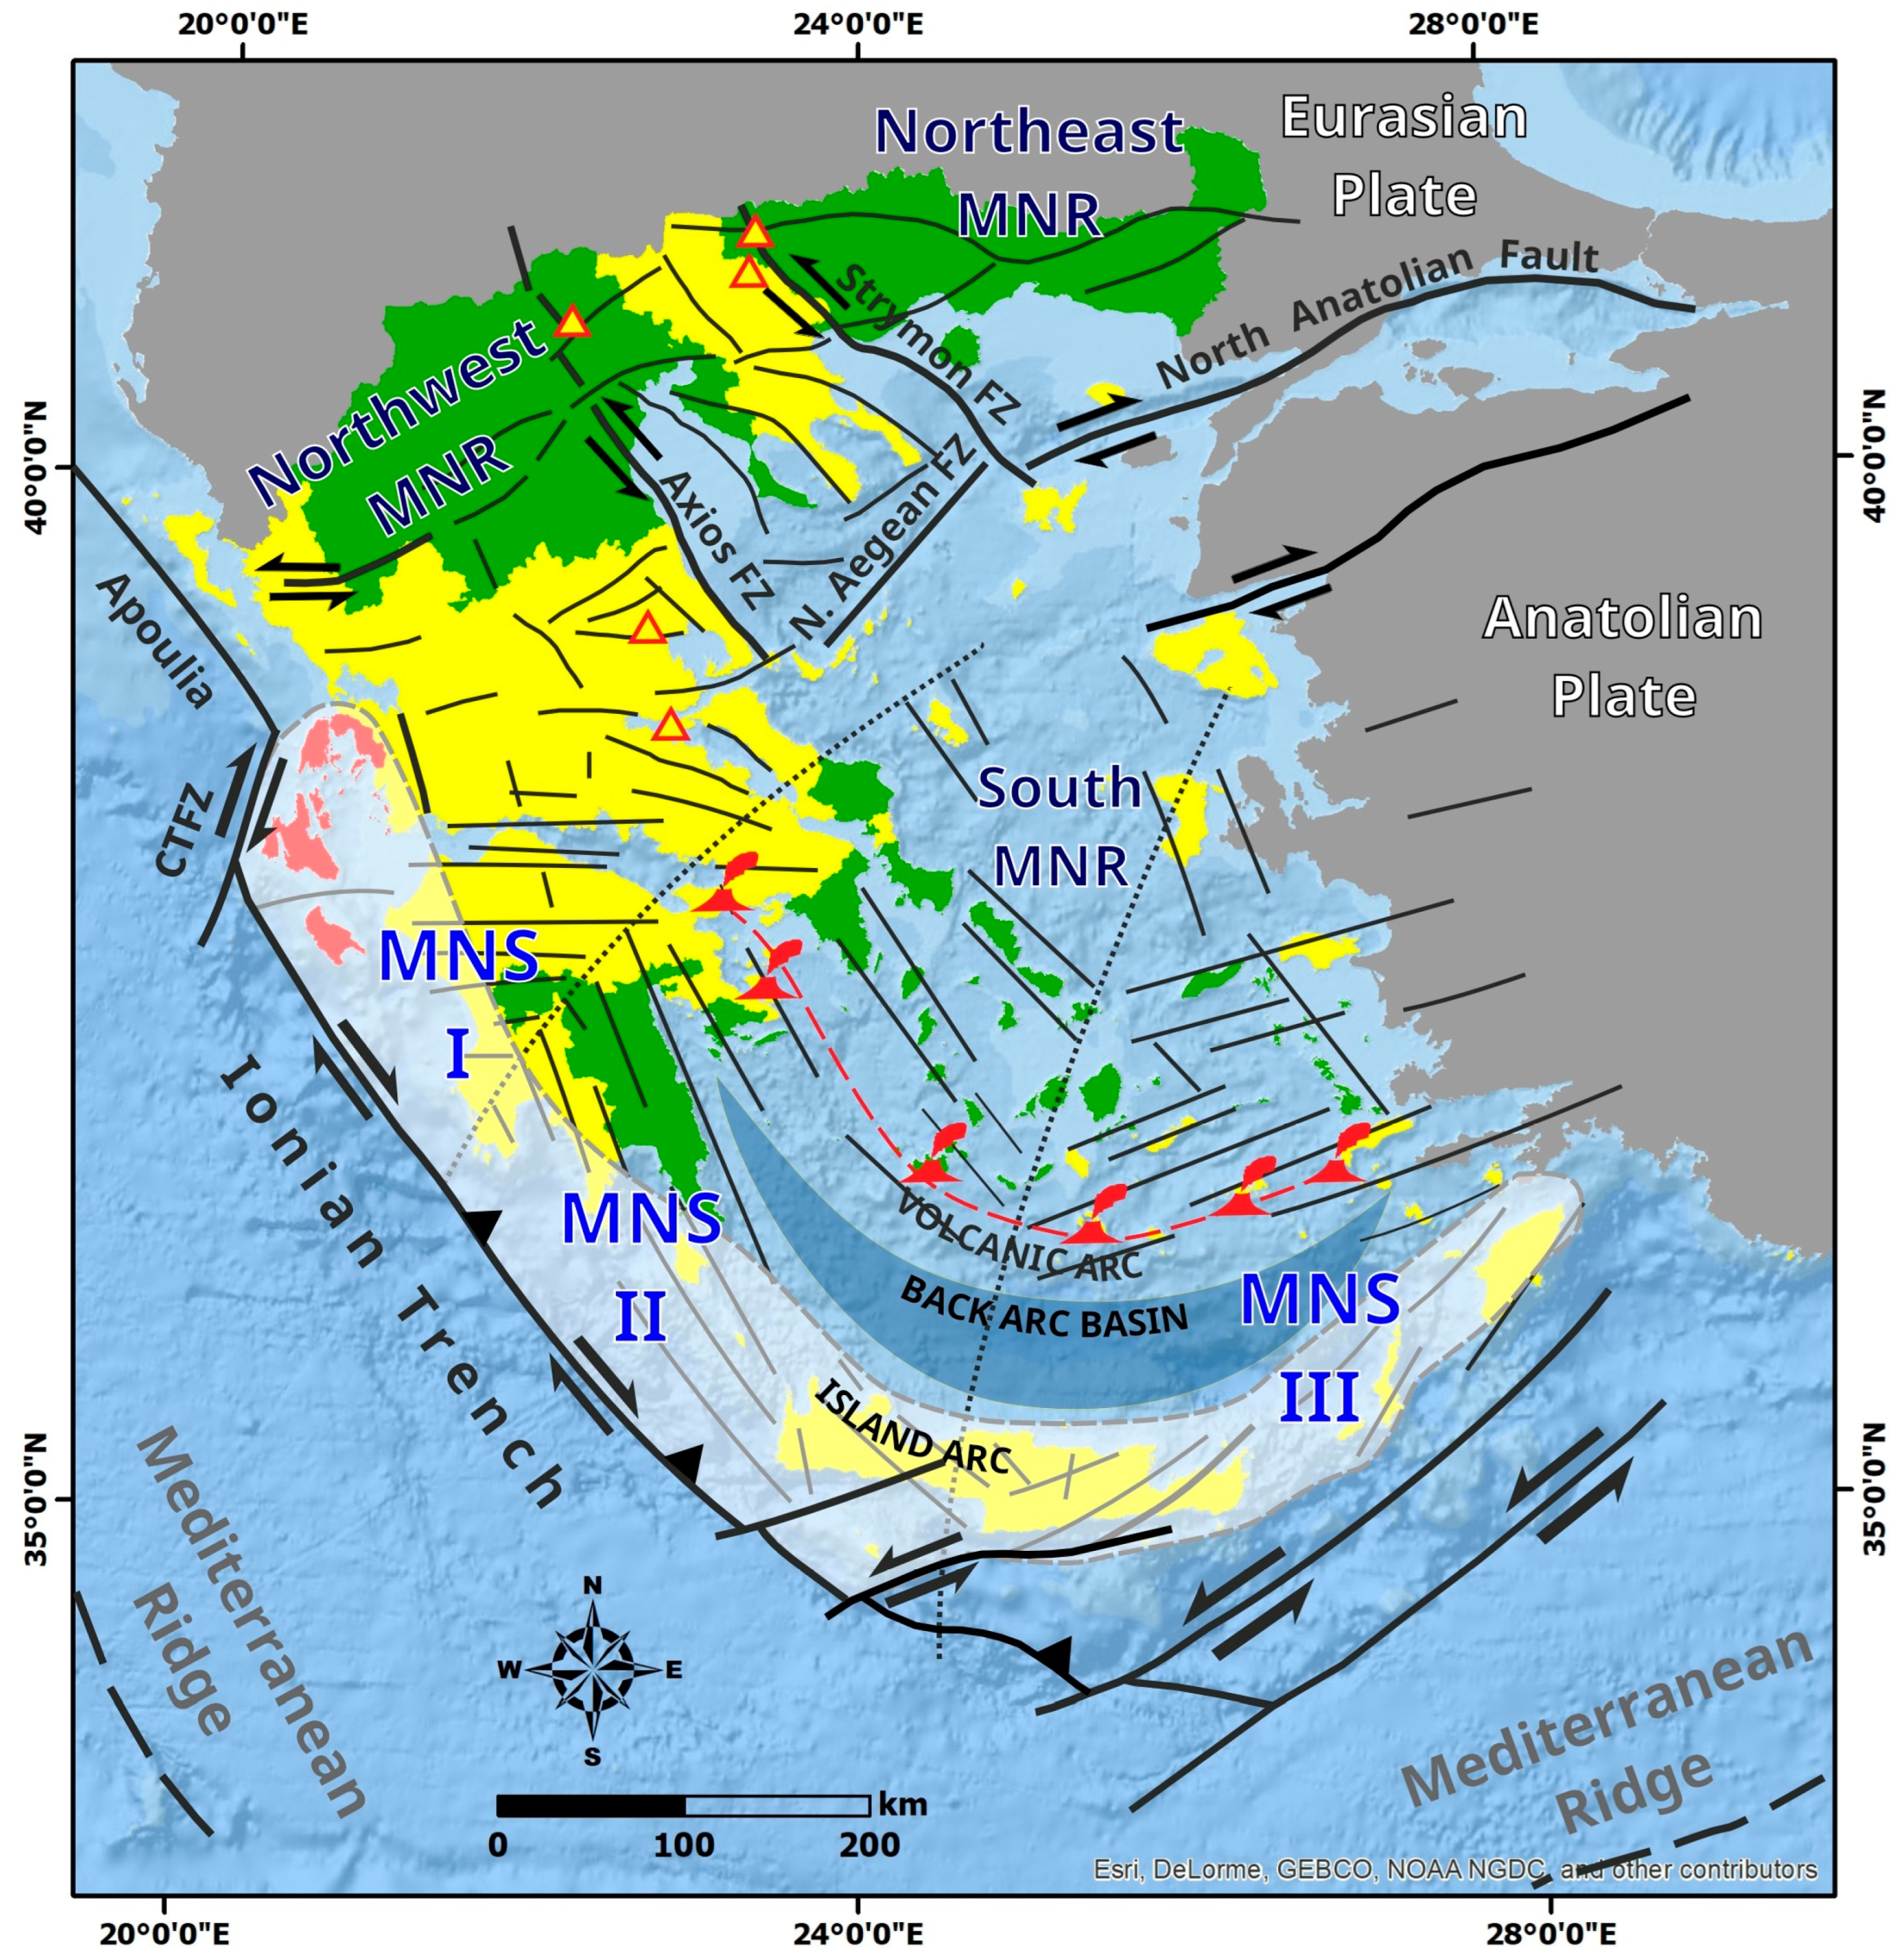
Τhe geodynamic setting of Greece is largely defined by the Hellenic Arc, a major structural component of the Alpine system and part of the southern Tethys orogenic belt [88] (Figure 4). The 1500 km long Hellenic Arc exhibits a morphotectonic curvature from NNW to SSE in mainland Greece, bending E–W near Crete, and shifting NE–SW toward the Dodecanese Islands and southwest Anatolia, where it meets the Taurus Arc [88,89]. The Hellenic Arc comprises the Hellenic Trench (Oinousses Abyss, Pliny and Strabo trenches) marking the convergent plate boundary with dextral strike-slip faulting and subduction [88]; the Island Arc (Peloponnese, Crete, Dodecanese) formed by deformation and uplift of Eurasian-margin sediments; the Cretan Sea back-arc basin due to lithospheric stretching; and the Aegean volcanic arc from subduction-related melting [88,90].
Southward, the Eastern Mediterranean Ridge is an accretionary prism from African-plate sediments influenced by Messinian evaporites [90,95,96]. Arc tectonics reflect subduction-related compression, left-lateral slip along trenches, normal convergence in the Ionian Sea, and strike-slip in the southeast, with paleomagnetic evidence of 40–60° dextral rotation since the mid-Miocene, most evident in the External Hellenides [88,97].
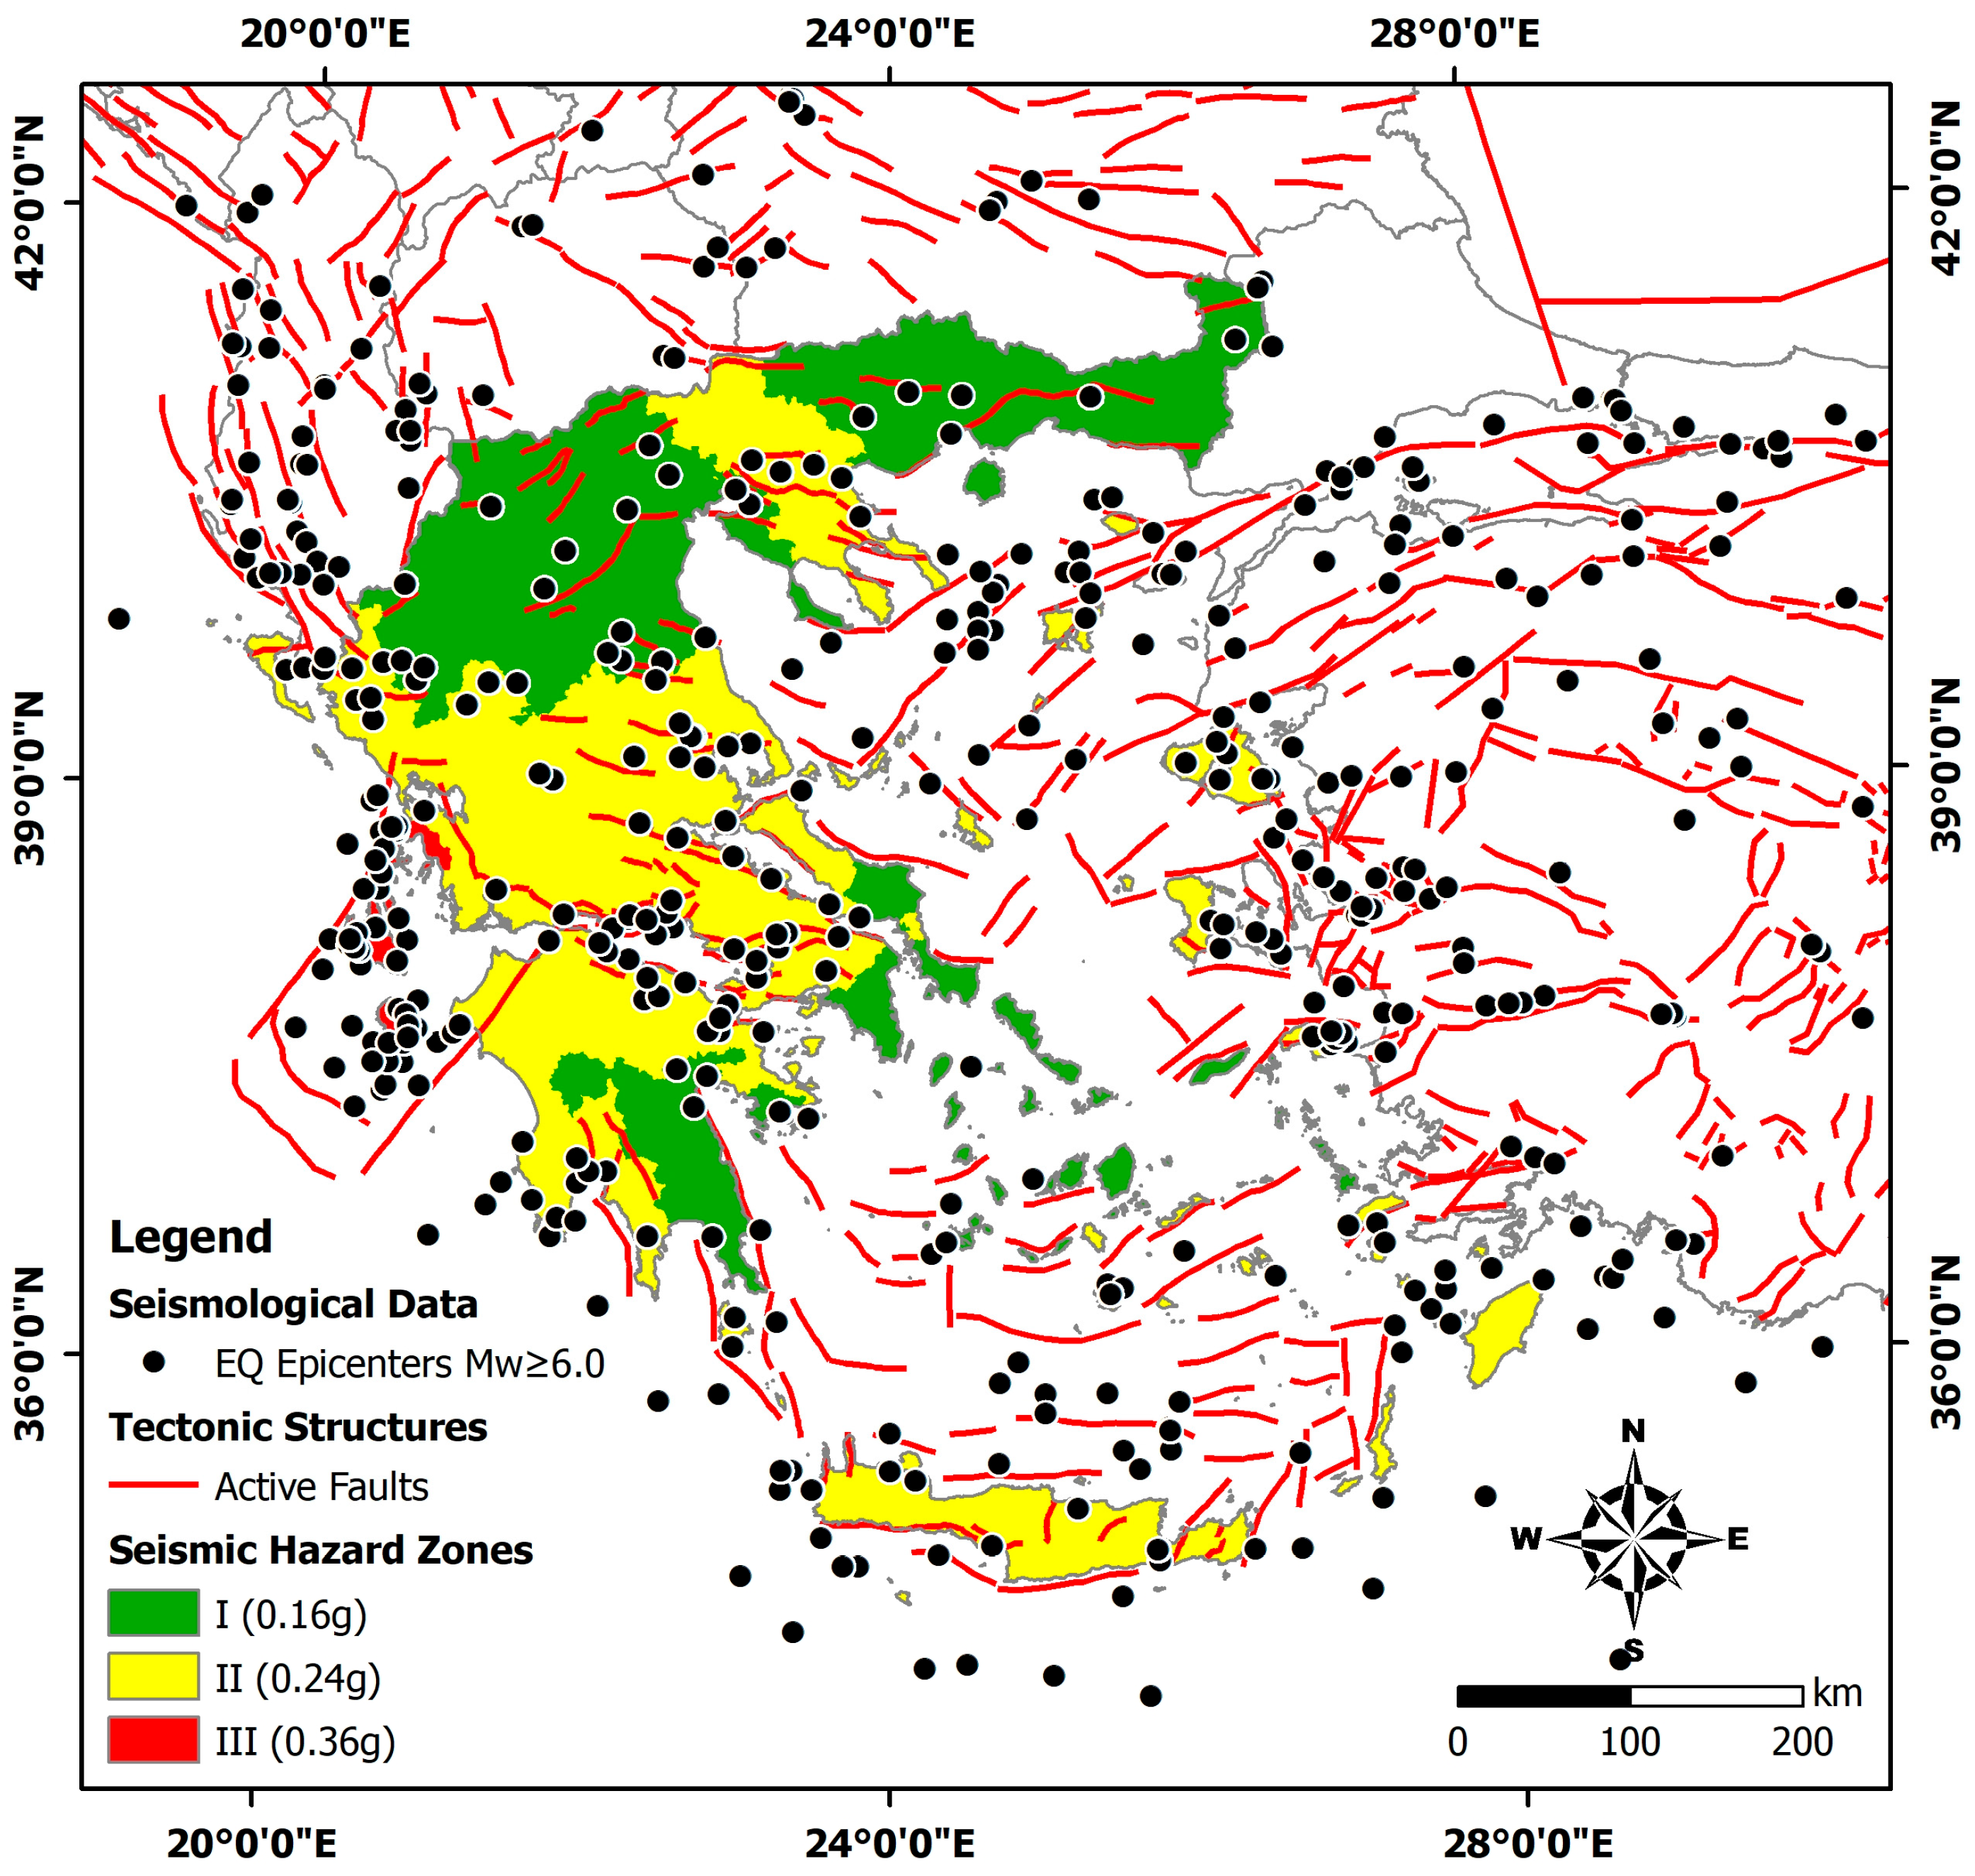
About 75% of the seismic events in Greece occur offshore or at depth, lessening inland impacts [77]. Major inland earthquakes, however, have caused severe damage and triggered landslides and tsunamis [42,60,62,64,98,99]. The country is divided into three seismic hazard zones [84] (Figure 5). Zone I (green) includes areas such as Eastern Macedonia, Thrace, and parts of the Cyclades. Zone II (yellow) covers the northern Ionian Islands, parts of the mainland Greece, and several Aegean islands. Zone III (red), the highest hazard zone, encompasses the southern Ionian Islands (e.g., Lefkada, Cephalonia, Ithaki and Zakynthos), where destructive earthquakes have historically occurred [50,52,55,100]. Recent studies suggest hazard in densely populated regions such as Attica and the Ionian Islands may be underestimated, warranting seismic code updates [101,102]. Strong and major earthquakes of Mw ≥ 6.0 in Greece mainly occur in the Ionian Sea, the Hellenic Arc, and parts of the Aegean [103,104]. Seismic risk is heightened by both tectonic activity and vulnerable urban infrastructure [105]. Major events, including the 1978 Thessaloniki Mw = 6.5 earthquake [106,107,108,109,110,111], the 1981 Alkyonides earthquake sequence with Mw up to 6.7 [112,113,114,115,116], the 1986 Kalamata (SW Peloponnese) Mw = 6.2 earthquake [40], and the 1995 Aegion (northern Peloponnese) Mw = 6.1 earthquake [117,118,119,120], caused extensive structural damage. While older regulations proved inadequate, the modern seismic codes in Greece rank among the world’s most stringent, enhancing future resilience.

3.3. Hydrology of Greece—Water Districts, River Basins, Rivers and Water Bodies

Greece is divided into 14 river basin districts (RBDs) [85,121] (Figure 6a). Each RBD encompasses a specific geographic area characterized by distinct hydrogeographical and environmental features, shaped by the region’s topography, climate, and prevailing hydrological processes.
Water bodies constitute sub-units within the RBDs. Each water body corresponds to a natural hydrological unit, such as a lake, a river basin, or an aquifer (including lacustrine, coastal, riverine, and groundwater systems). River basins form the fundamental element of the hydrological structure of water systems. In Greece, river basins vary significantly in size, morphology (Figure 6b), and hydrological behaviour, shaped by the country’s complex topography and diverse climatic conditions.
Within the RBDs, different hydrological responses often occur during and after seismic events. The characteristics of individual water systems, such as karst aquifers or alluvial zones, determine their response to seismic shaking, while river basins connect surface hydrology with subsurface flows and influence the spatial distribution of EQHAs.

3.4. Hydrogeological Regime of Greece

From a hydrogeological perspective, geological formations in the Greek territory are classified as permeable, semi-permeable, or impermeable [122]. Unconsolidated clastic deposits and limestones are the most permeable formations, covering approximately 15% and 35% of Greece, respectively [122]. Sandstones, conglomerates, volcanic rocks, ophiolites, and other compact formations are also classified as permeable due to well-developed primary and secondary porosity [122].
Semi-permeable formations include cohesive deposits and crystalline rocks, particularly when they have undergone fracturing and weathering. In contrast, impermeable formations are primarily composed of clayey–silty deposits, argillaceous schists, and unaltered crystalline rocks. These formations cover about 40% of the Greek territory [122].
In general, the hydrogeological picture of Greece is composed of three hydrogeological systems: (a) fractured and karstified carbonate formations, which act as aquifers, (b) folded schist–sandstone and schist formations, which constitute a relatively impermeable hydrogeological basement, and (c) clastic deposits ranging from unconsolidated to cohesive, forming an aquifer system within the younger sedimentary units [83]. The third system may also develop within formations classified as semi-permeable to impermeable, due to secondary porosity resulting from tectonic fracturing or weathering.
Porous formations are classified as follows: (i) granular alluvial deposits of variable permeability; (ii) granular non-alluvial deposits with moderate to very low permeability; and (iii) molassic granular deposits characterized by relatively low permeability [83]. Karstic formations include extensively developed limestones and marbles with moderate to high permeability; limestones and marbles of limited extent with variable permeability; and Triassic limestone breccias of the Ionian zone, which exhibit low to moderate permeability depending on the extent of karstification and fracturing [83]. Finally, impermeable formations comprise flysch sequences, metamorphic rocks, and igneous rocks of both plutonic and volcanic origin, which typically restrict groundwater flow due to their minimal porosity and very low hydraulic conductivity [83].

4. Co- and Post-Seismic Hydrogeological Anomalies in Greece

4.1. EQHAs and Causative Earthquakes

A comprehensive reassessment of existing data identified 94 earthquakes with EQHAs in Greece, occurring between 426 BC and 2020 with moment magnitudes ranging from Mw = 5.2 to Mw = 7.7. Of these, 59 earthquakes (62.77%) took place during ancient and historical periods (prior to 1900), while the remaining 35 events (37.23%) were instrumentally recorded after 1900 (Table 3).
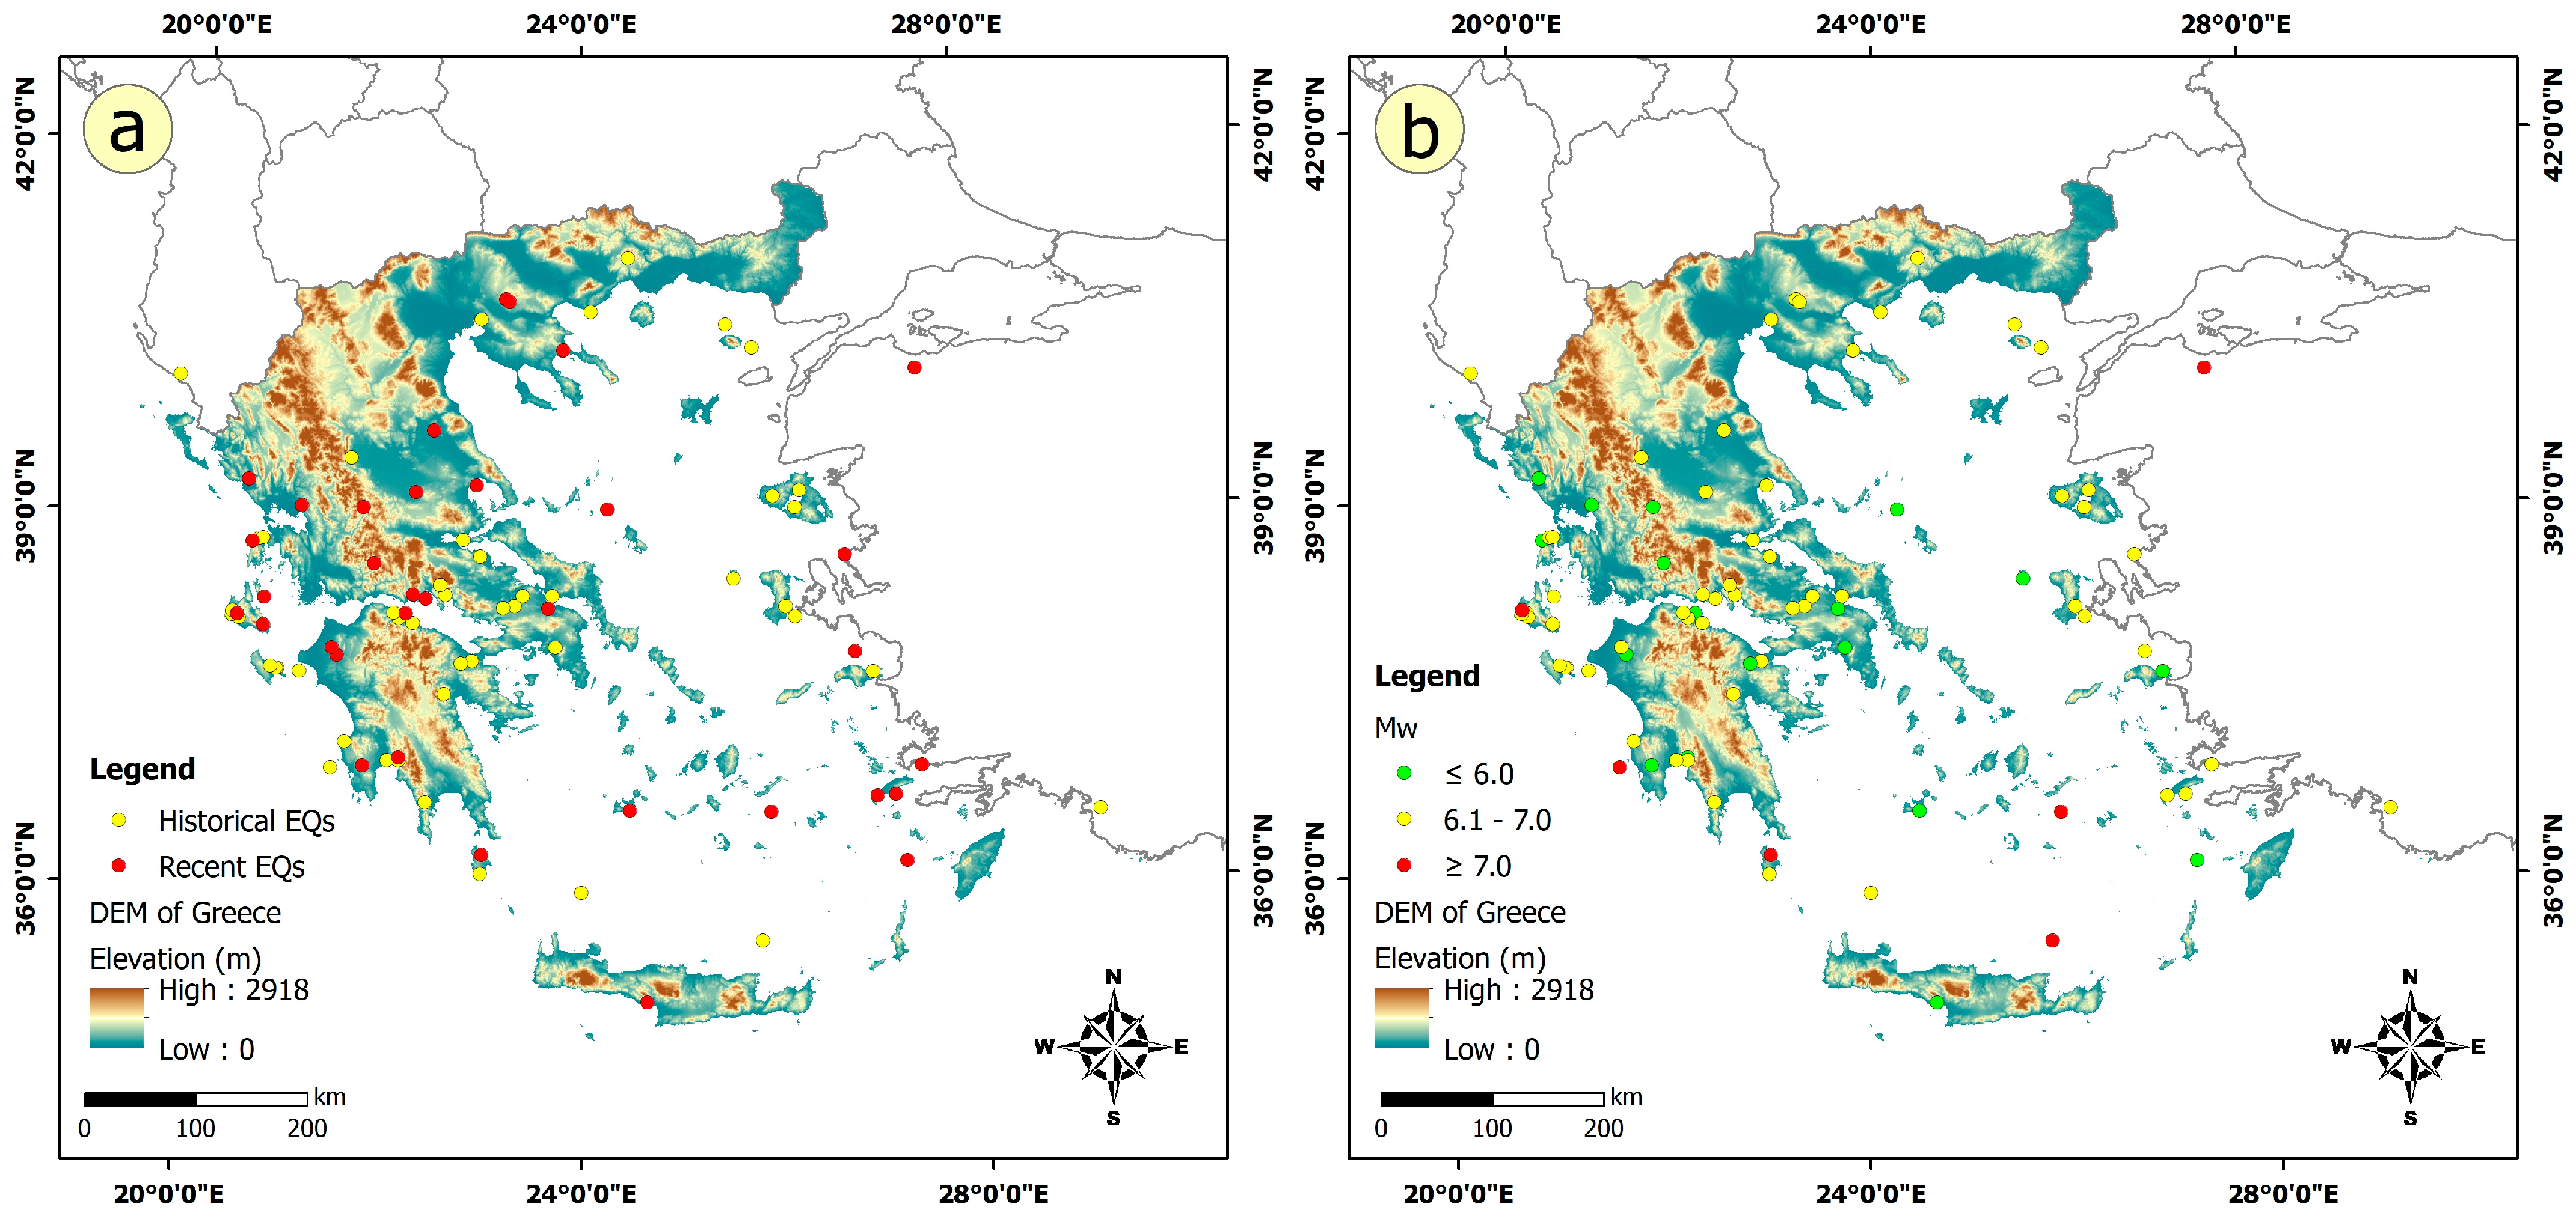
Based on the evaluated scientific sources and the available seismic catalogues, epicentres were identified for 82 of the 94 earthquakes, allowing for their cartographic representation (Figure 7). Of these events, five occurred outside the borders of Greece. However, since they induced hydrogeological anomalies within the Greek territory, they were included in the presented list. The epicentre of one of these earthquakes was located in Albania and corresponds to the historic event of 13 May 1895. The remaining four occurred along the western coastal area of Turkey (Asia Minor) and include the historic earthquake of 28 February 1851, as well as the recent events on 18 March 1953, 23 July 1949, and 20 July 2017, which affected the Lesvos, Chios, and Kos Islands, respectively.
Based on the overlay of earthquakes that have caused hydrogeological anomalies and the administrative regions of Greece, it was found that the majority of events (14 in total) occurred in Central Greece. Of these, 11 were located in the mainland part of the region, 1 in the Corinthian Gulf located between Central Greece to the north and the Peloponnese to the south, and 2 in the Evian Gulf, situated between Central Greece to the west and Evia Island to the east. This region is followed by the Ionian Islands region, which recorded 12 earthquakes, primarily affecting the central Ionian Islands (Lefkada, Cephalonia, Ithaki, and Zakynthos).
The Peloponnese follows with nine seismic events, and Western Greece with eight, one of which occurred in the Corinthian Gulf near the northern coast of the Peloponnese. The North Aegean region also recorded eight earthquakes, including five onshore and three offshore events. The South Aegean region follows with five offshore earthquakes. The remaining regions recorded fewer than five events each.
From the study of the spatial distribution of earthquakes and the evaluation of the available information, it was found that offshore earthquakes also have the potential to cause co- and post-seismic hydrogeological anomalies. This fact is evidenced by 23 offshore earthquakes, both in the Ionian and Aegean Seas, which have induced anomalies inland (Figure 7).
This distribution is primarily shaped and governed by the prevailing seismotectonic regime, particularly by the presence of faults and fault systems in the aforementioned areas, which are among the active faults of Greece [103,104], with a high potential for generating destructive earthquakes and triggering primary and secondary EEEs.

4.1.1. Minimum and Maximum Magnitudes and Intensities of Causative Earthquakes

The largest earthquake that has caused hydrogeological anomalies in Greece occurred on 12 October 1856 with a magnitude Mw = 7.7, affecting the southern and southeastern part of the Hellenic Arc, especially the islands of Crete and Rhodes, respectively. The Kythera earthquake on 11 August 1903, Mw = 7.6, is second in the list, followed by earthquakes with a magnitude equal to, slightly smaller, or larger than Mw = 7.0. Typical examples of such earthquakes are those in 426 BC in eastern Locris (Central Greece) with Mw = 7.0, on 4 February 1867 in Cephalonia (central Ionian Islands) with Mw = 7.15, on 27 August 1886 in Filiatra (SW Peloponnese) with Mw = 7.17, on 26 June 1926 in Rhodes Island with Mw = 7.0, on 18 March 1953 in Lesvos Island with Mw = 7.1, on 12 August 1953 in the central Ionian Islands with Mw = 7.0, on 9 July 1956 in Amorgos Island (Cyclades complex) with Mw = 7.1, and on 30 October 2020 in Samos Island (eastern Aegean) with Mw = 7.0. The smallest earthquake that has induced hydrogeological anomalies in Greece occurred on 20 March 1992 in Milos (Cyclades islands) with Mw = 5.2.
The diagram in Figure 8a shows the comparison of the number of earthquakes that have caused hydrogeological anomalies by magnitude class between historical and recent events. The analysis shows that most causative earthquakes, either historical or recent, have magnitudes larger than 6.0 and equal to or smaller than 7.0. In particular, 19 historical and 10 recent earthquakes are recorded in the 6.0 < Mw ≤ 6.5 class, and 22 historical and 7 recent earthquakes in the 6.5 < Mw ≤ 7.0 class. This finding indicates that strong earthquakes are the ones that have caused hydrogeological anomalies most often. At the same time, it is observed that historical earthquakes outnumber recent ones, which is probably due to the fact that they cover a significantly longer period of time than recent ones. However, the magnitude class 5.5 < Mw ≤ 6.0 shows an increased number of recent earthquakes (12 compared to 4 historical earthquakes).
Major earthquakes (7.0 ≤ Mw ≤ 8.0) occur rarely, both historically and recently. In particular, only two historical and two recent earthquakes are recorded in the 7.0 < Mw ≤ 7.5 class, while in the 7.5 < Mw ≤ 8.0 class, one earthquake is recorded in each group. This may indicate either the actual rarity of such major earthquakes that have caused hydrogeological anomalies, or incomplete recording of the corresponding effects in the past.
Finally, the existence of twelve earthquakes of unknown magnitude (of which eleven are historical) demonstrates the shortcomings in historical data and the limited documentation of some past seismic events. Overall, this diagram reveals that hydrogeological anomalies can be induced by earthquakes of different magnitudes, with a higher frequency of earthquakes with a moderate to large magnitude.
The diagram in Figure 8b shows the correlation of earthquakes that caused hydrogeological anomalies by their macroseismic intensity, separating the data into historical and recent earthquakes. The analysis of the diagram shows that most earthquakes with hydrogeological anomalies are reported in high seismic intensity class, most notably class IX, which records 14 historical and 11 recent events. This finding suggests that very strong earthquakes in Greece have an increased probability of causing hydrological changes.
The dominance of historical earthquakes at the higher intensities is particularly striking, as at intensity X, there are 11 historical earthquakes with hydrogeological anomalies and only 1 recent one, while at intensity XI, only 1 recent event is recorded. In contrast, a significant increase in the triggering of hydrogeological anomalies is observed in recent earthquakes at moderate intensity levels, such as VII and VIII intensities, where the number of recent earthquakes is 2 and 8, respectively, compared to 6 and 10 historical ones. This may be attributed to more extensive empirical and testimonial records from local populations even for earthquakes of moderate intensity, as well as to increased scientific interest and targeted observations regarding co- and post-seismic EQHAs.
At the same time, a significant number of earthquakes with unspecified seismic intensity is observed, mainly in the historical record (15 historical compared to 2 recent events), reflecting the insufficient documentation of historical phenomena and related data. Overall, the data indicate that although hydrogeological anomalies are more frequently observed in high-intensity earthquakes, under recent conditions they are now also recorded in lower-intensity events. This highlights the growing understanding of the interaction between earthquakes and water systems.

4.1.2. Minimum and Maximum Magnitudes and Intensities for EQHAs

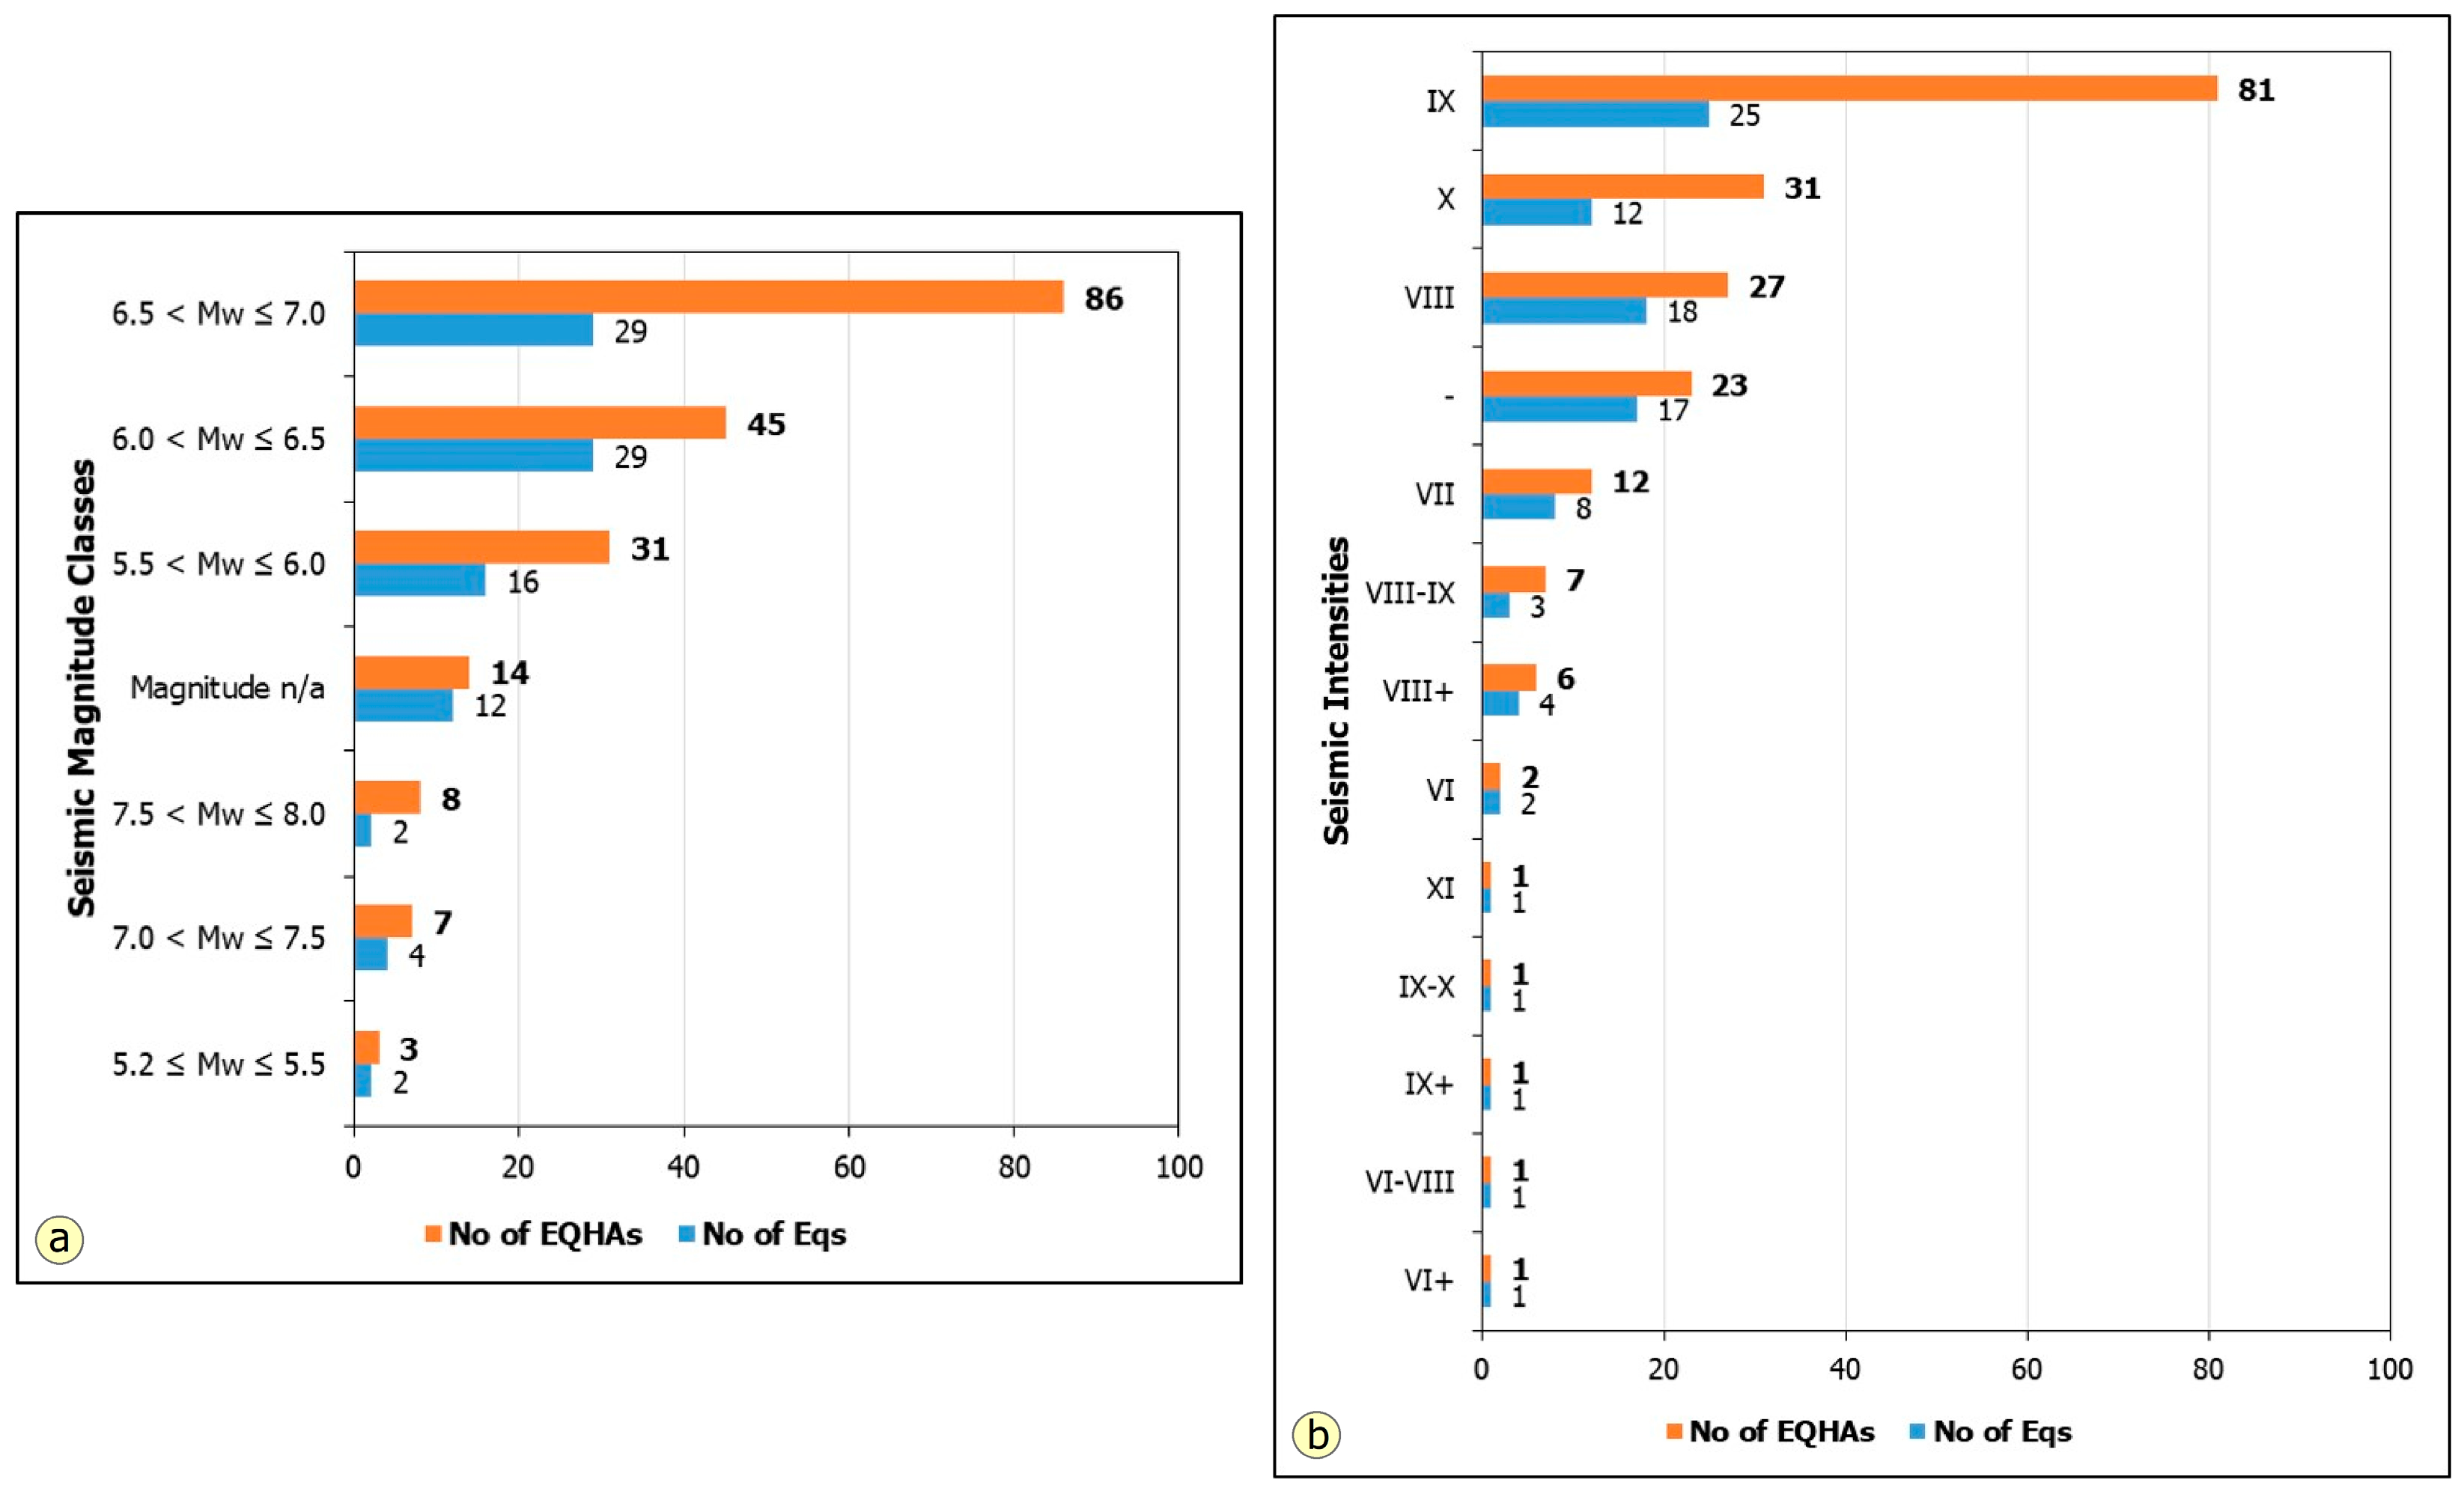
To study the frequency of the detected EQHAs by earthquake magnitude classes and seismic intensities, relevant diagrams were created (Figure 9). Regarding the first diagram, which depicts the frequency of EQHAs by magnitude (Mw) classes (Figure 9a), it is observed that the majority of EQHAs are associated with strong earthquakes. Specifically, the magnitude class 6.5 < Mw ≤ 7.0 contains the highest number of anomalies (86), while the class 6.0 < Mw ≤ 6.5 also shows a significant number of anomalies (45). The fact that in these classes the number of EQHAs significantly exceeds the number of corresponding seismic events indicates that strong earthquakes are particularly effective in causing such phenomena.
In contrast, moderate earthquakes (e.g., 5.2 ≤ Mw ≤ 5.5) exhibit a limited number of hydrogeological anomalies, indicating that the energy released by such earthquakes may not be sufficient to cause disturbances in hydrogeological systems. Similarly, the number of anomalies for major earthquakes is low (7.0 ≤ Mw ≤ 7.9), mainly due to their rarity and the small number of observations.
The second diagram shows hydrogeological anomalies in relation to seismic intensity (Figure 9b). From this distribution, it is observed that the highest intensities, especially intensity IX, are associated with the greatest number of EQHAs (81), a factor that highlights the strong influence of seismic intensity in causing these anomalies. This is followed by intensities X and VIII with 31 and 27 EQHAs, respectively, confirming that seismic intensity is a more significant correlating factor with hydrogeological impacts than seismic magnitude itself.
It is interesting to note that for the lower-intensity classes (VI–VII), the number of EQHAs is either small or equivalent to the number of earthquakes. This suggests that in areas experiencing low intensities during an earthquake, the likelihood of triggering hydrogeological phenomena is significantly reduced. Local intensity appears to play a decisive role in the occurrence of such phenomena.
In summary, it emerges that hydrogeological anomalies are strongly related to both seismic magnitude and, more importantly, seismic intensity. Strong and major earthquakes (6.0 ≤ Mw ≤ 7.9) and those accompanied by high intensities (Imax ≥ VIII) are the most capable of causing hydrogeological anomalies. This fact makes seismic intensity a particularly critical indicator for assessing the risk of such phenomena, with special importance for post-earthquake monitoring in regions of high seismicity.

4.2. Functional Categories and Types of EQHAs

The detected EQHAs in Greece have been classified into six functional categories: (i) hydraulic variations; (ii) water quality alterations; (iii) gas emissions; (iv) formation of water bodies; (v) morphological changes; and (vi) uncategorized anomalies (Table 4).
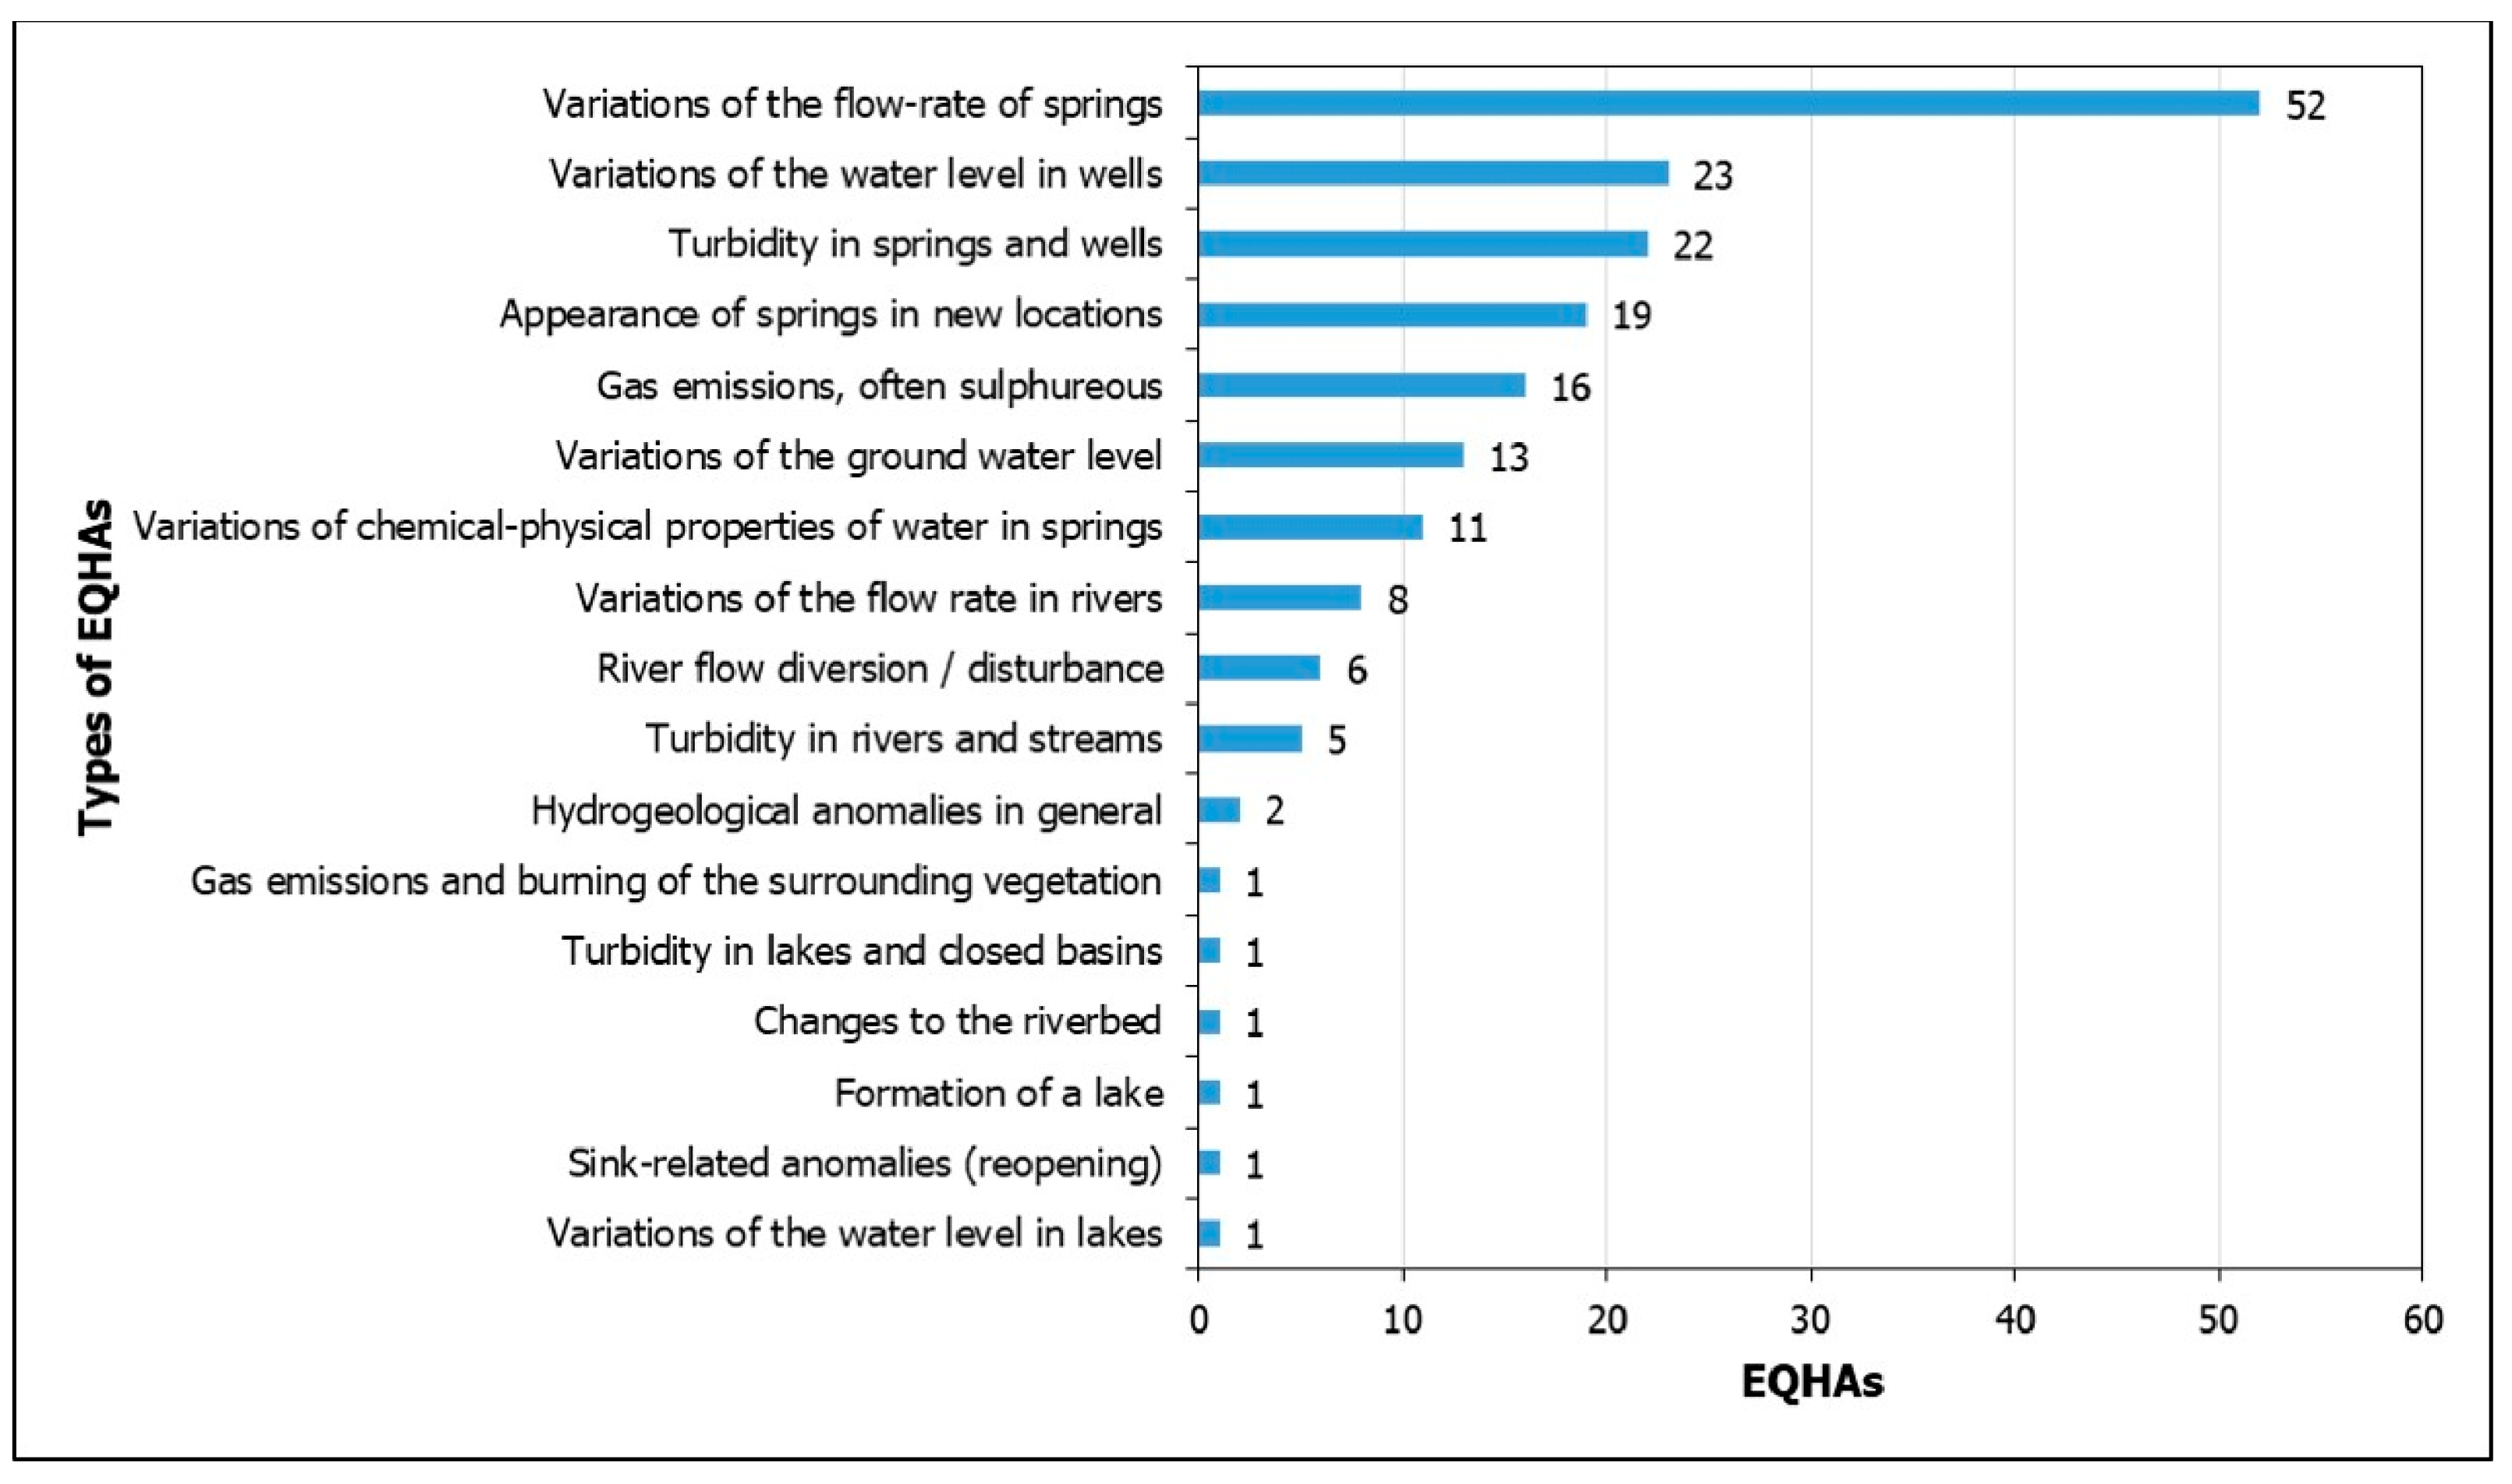
Regarding the frequency of EQHAs by functional category, a total of 183 cases were identified and are classified into six categories (Table 4). Hydraulic variations are the most common type of EQHAs, representing more than half of all documented cases (Table 4). The most frequently recorded EQHAs are mainly associated with springs and wells (Figure 10), indicating that groundwater systems are particularly sensitive to seismic processes. In particular, changes in spring flow constitute 28.42% of the recorded EQHAs (52 out of 183) (Figure 10), making them the most frequent type. Changes in the water level in wells (23 events, 12.57%) and turbidity in springs and wells (22 events, 12.02%) also occupy significant proportions (Figure 10). The appearance of springs in new locations (19 events, 10.38%) (Figure 10) indicates that seismic processes can cause a redistribution of the underground aquifer, creating new water outlets at the surface. Other important but less frequent EQHAs are gas emissions, changes in the chemical–physical composition of water (mainly temperature) and river flow disturbances and diversions (Figure 10). The former (16 events, 8.74%) mainly refer to sulphureous gases (Figure 10), which highlight the role of geothermal potential of faults. The latter (11 events, 6.01%) indicate thermal effects due to seismic activity, while the last two categories of EQHAs occupy small percentages (8 events and 4.37%, 6 events and 3.28%, respectively) (Figure 10), but are important in areas with large rivers and torrents.
The rarest types of EQHAs, which have been recorded only once (0.55%), are lake formation, riverbed changes, sinkhole-related anomalies, and vegetation burning from gas emissions (Figure 10). Although rare, these EQHAs can have adverse local impacts, e.g., flooding from overflow or morphological changes due to flow alterations causing impacts on the natural and built environment.
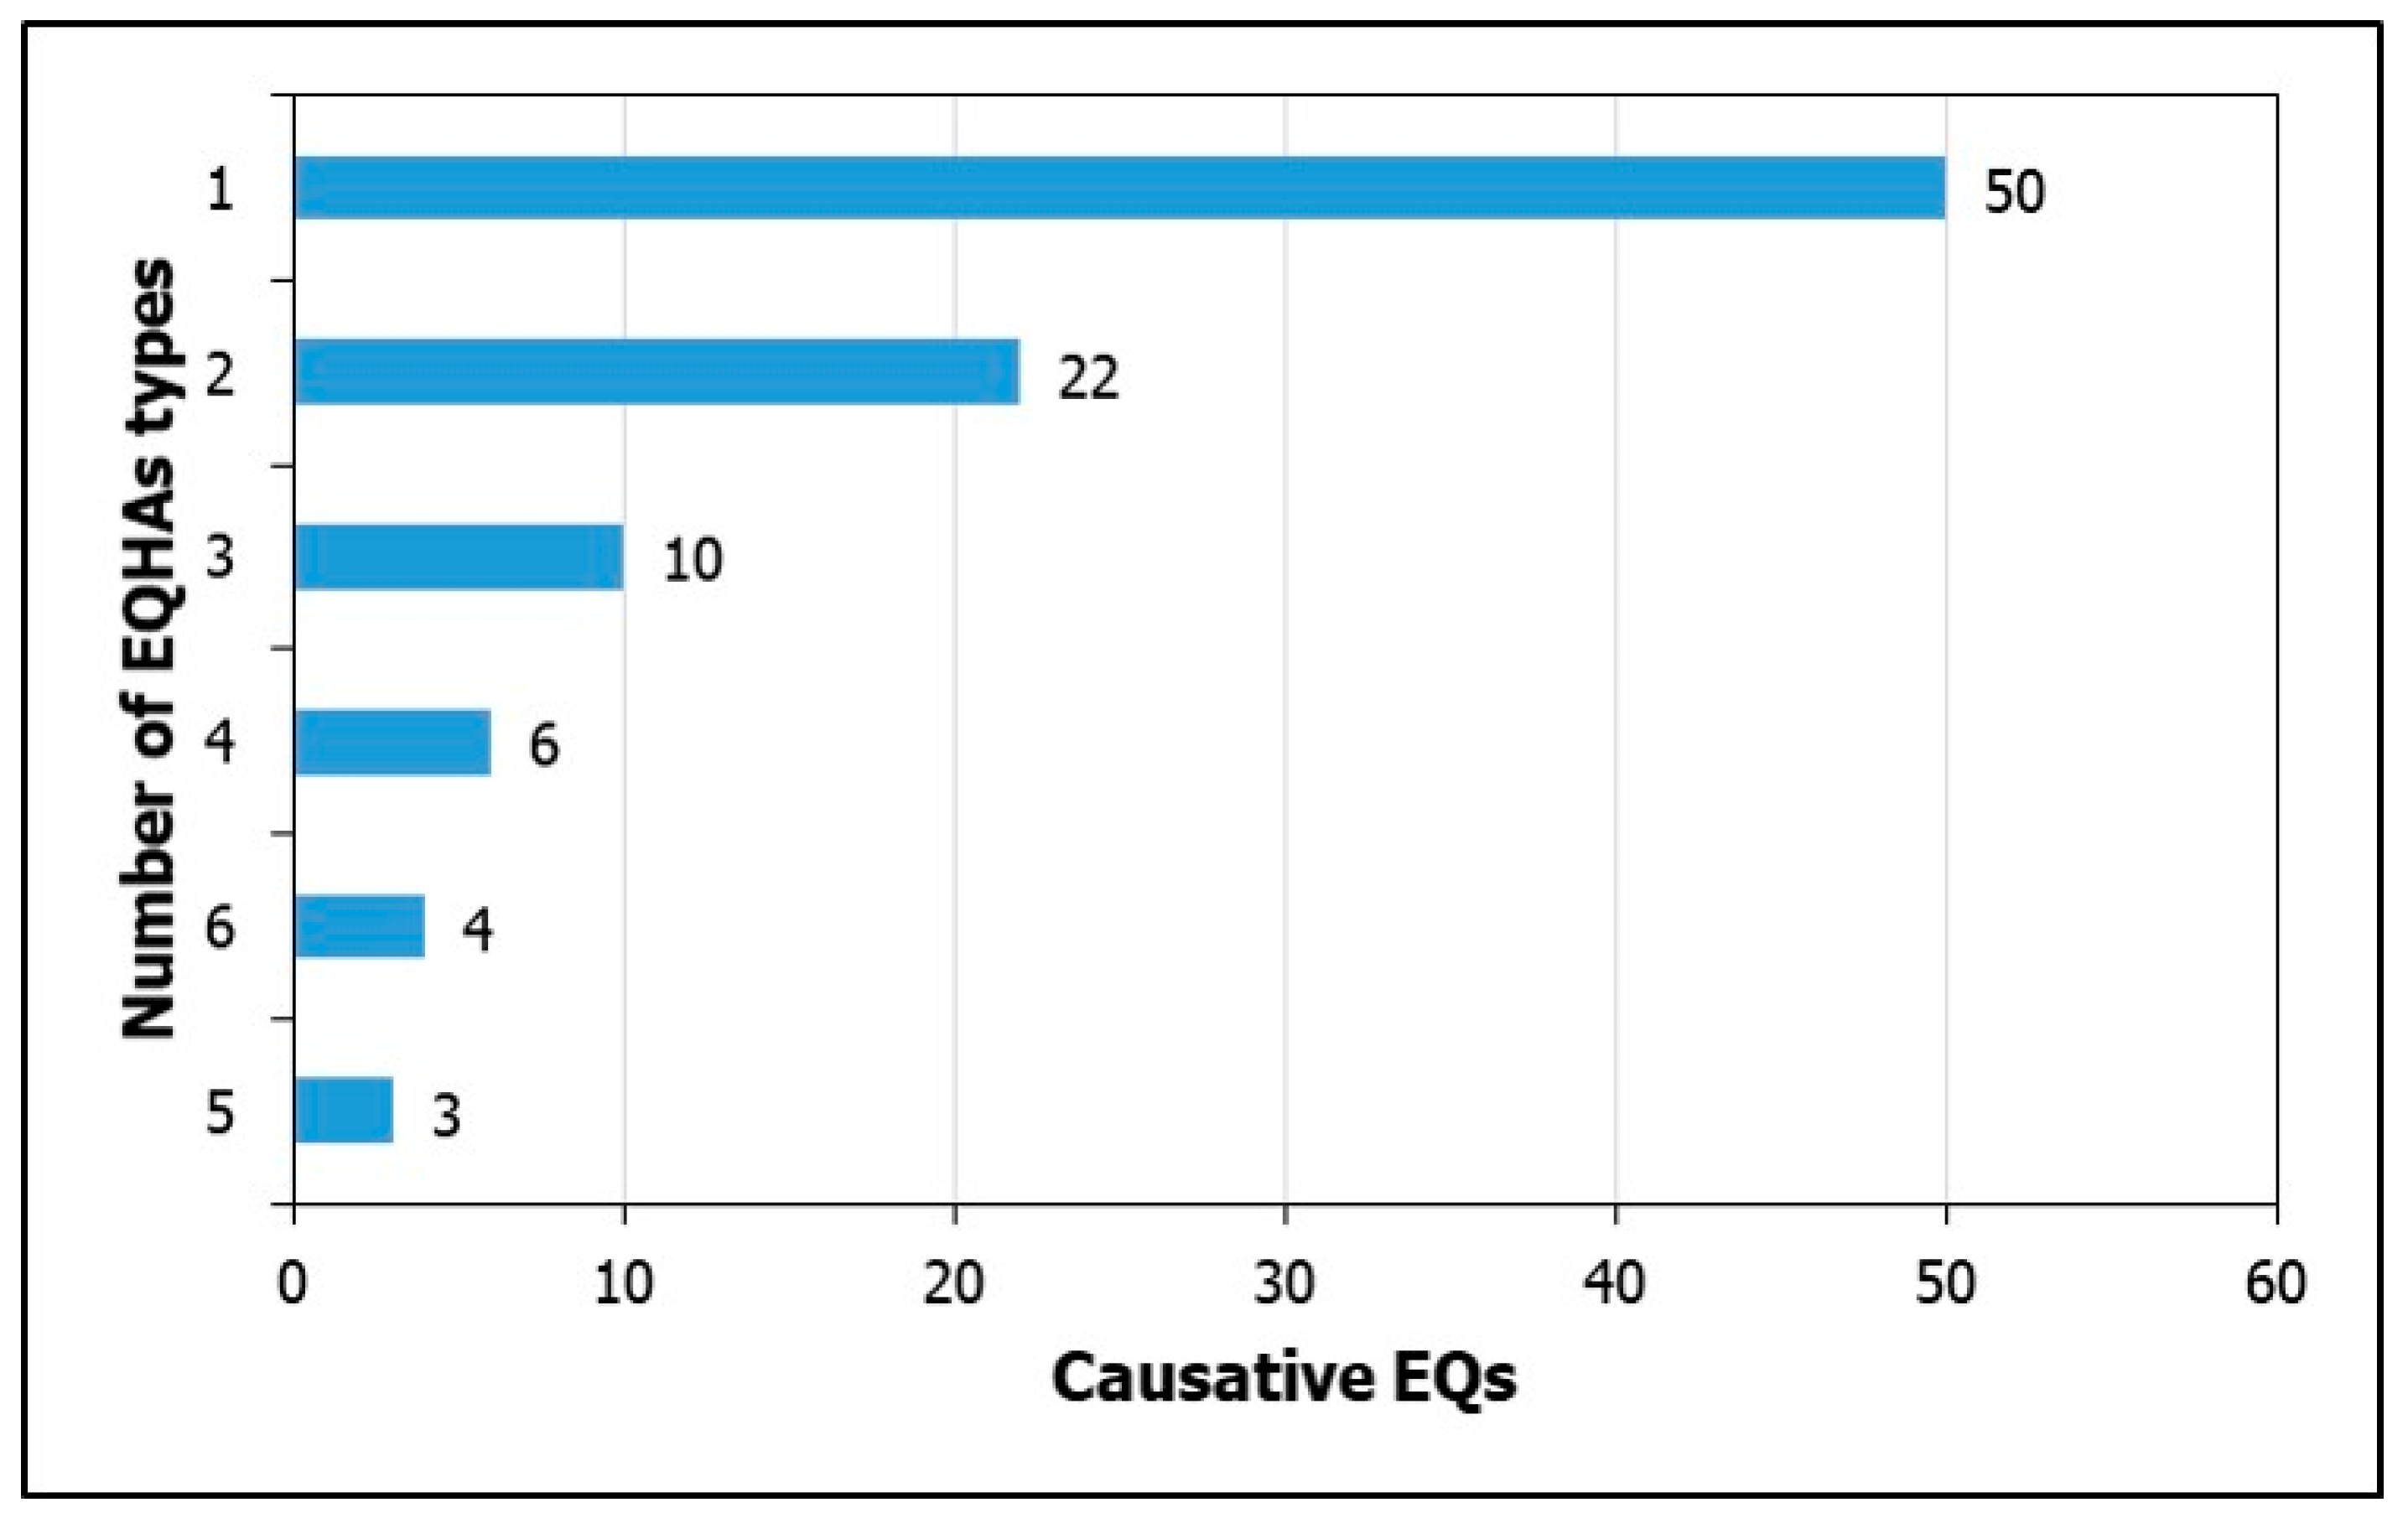
Regarding the frequency of earthquakes by number of types of EQHAs (Figure 11), it can be seen that about 77% of the earthquakes induced one or two types of EQHAs, suggesting that the effects on the hydrogeological regime are generally limited or simple. The decreasing frequency with increasing types of EQHAs reveals that complex hydrogeological responses are rarer and probably related to particular geological conditions or seismological properties.
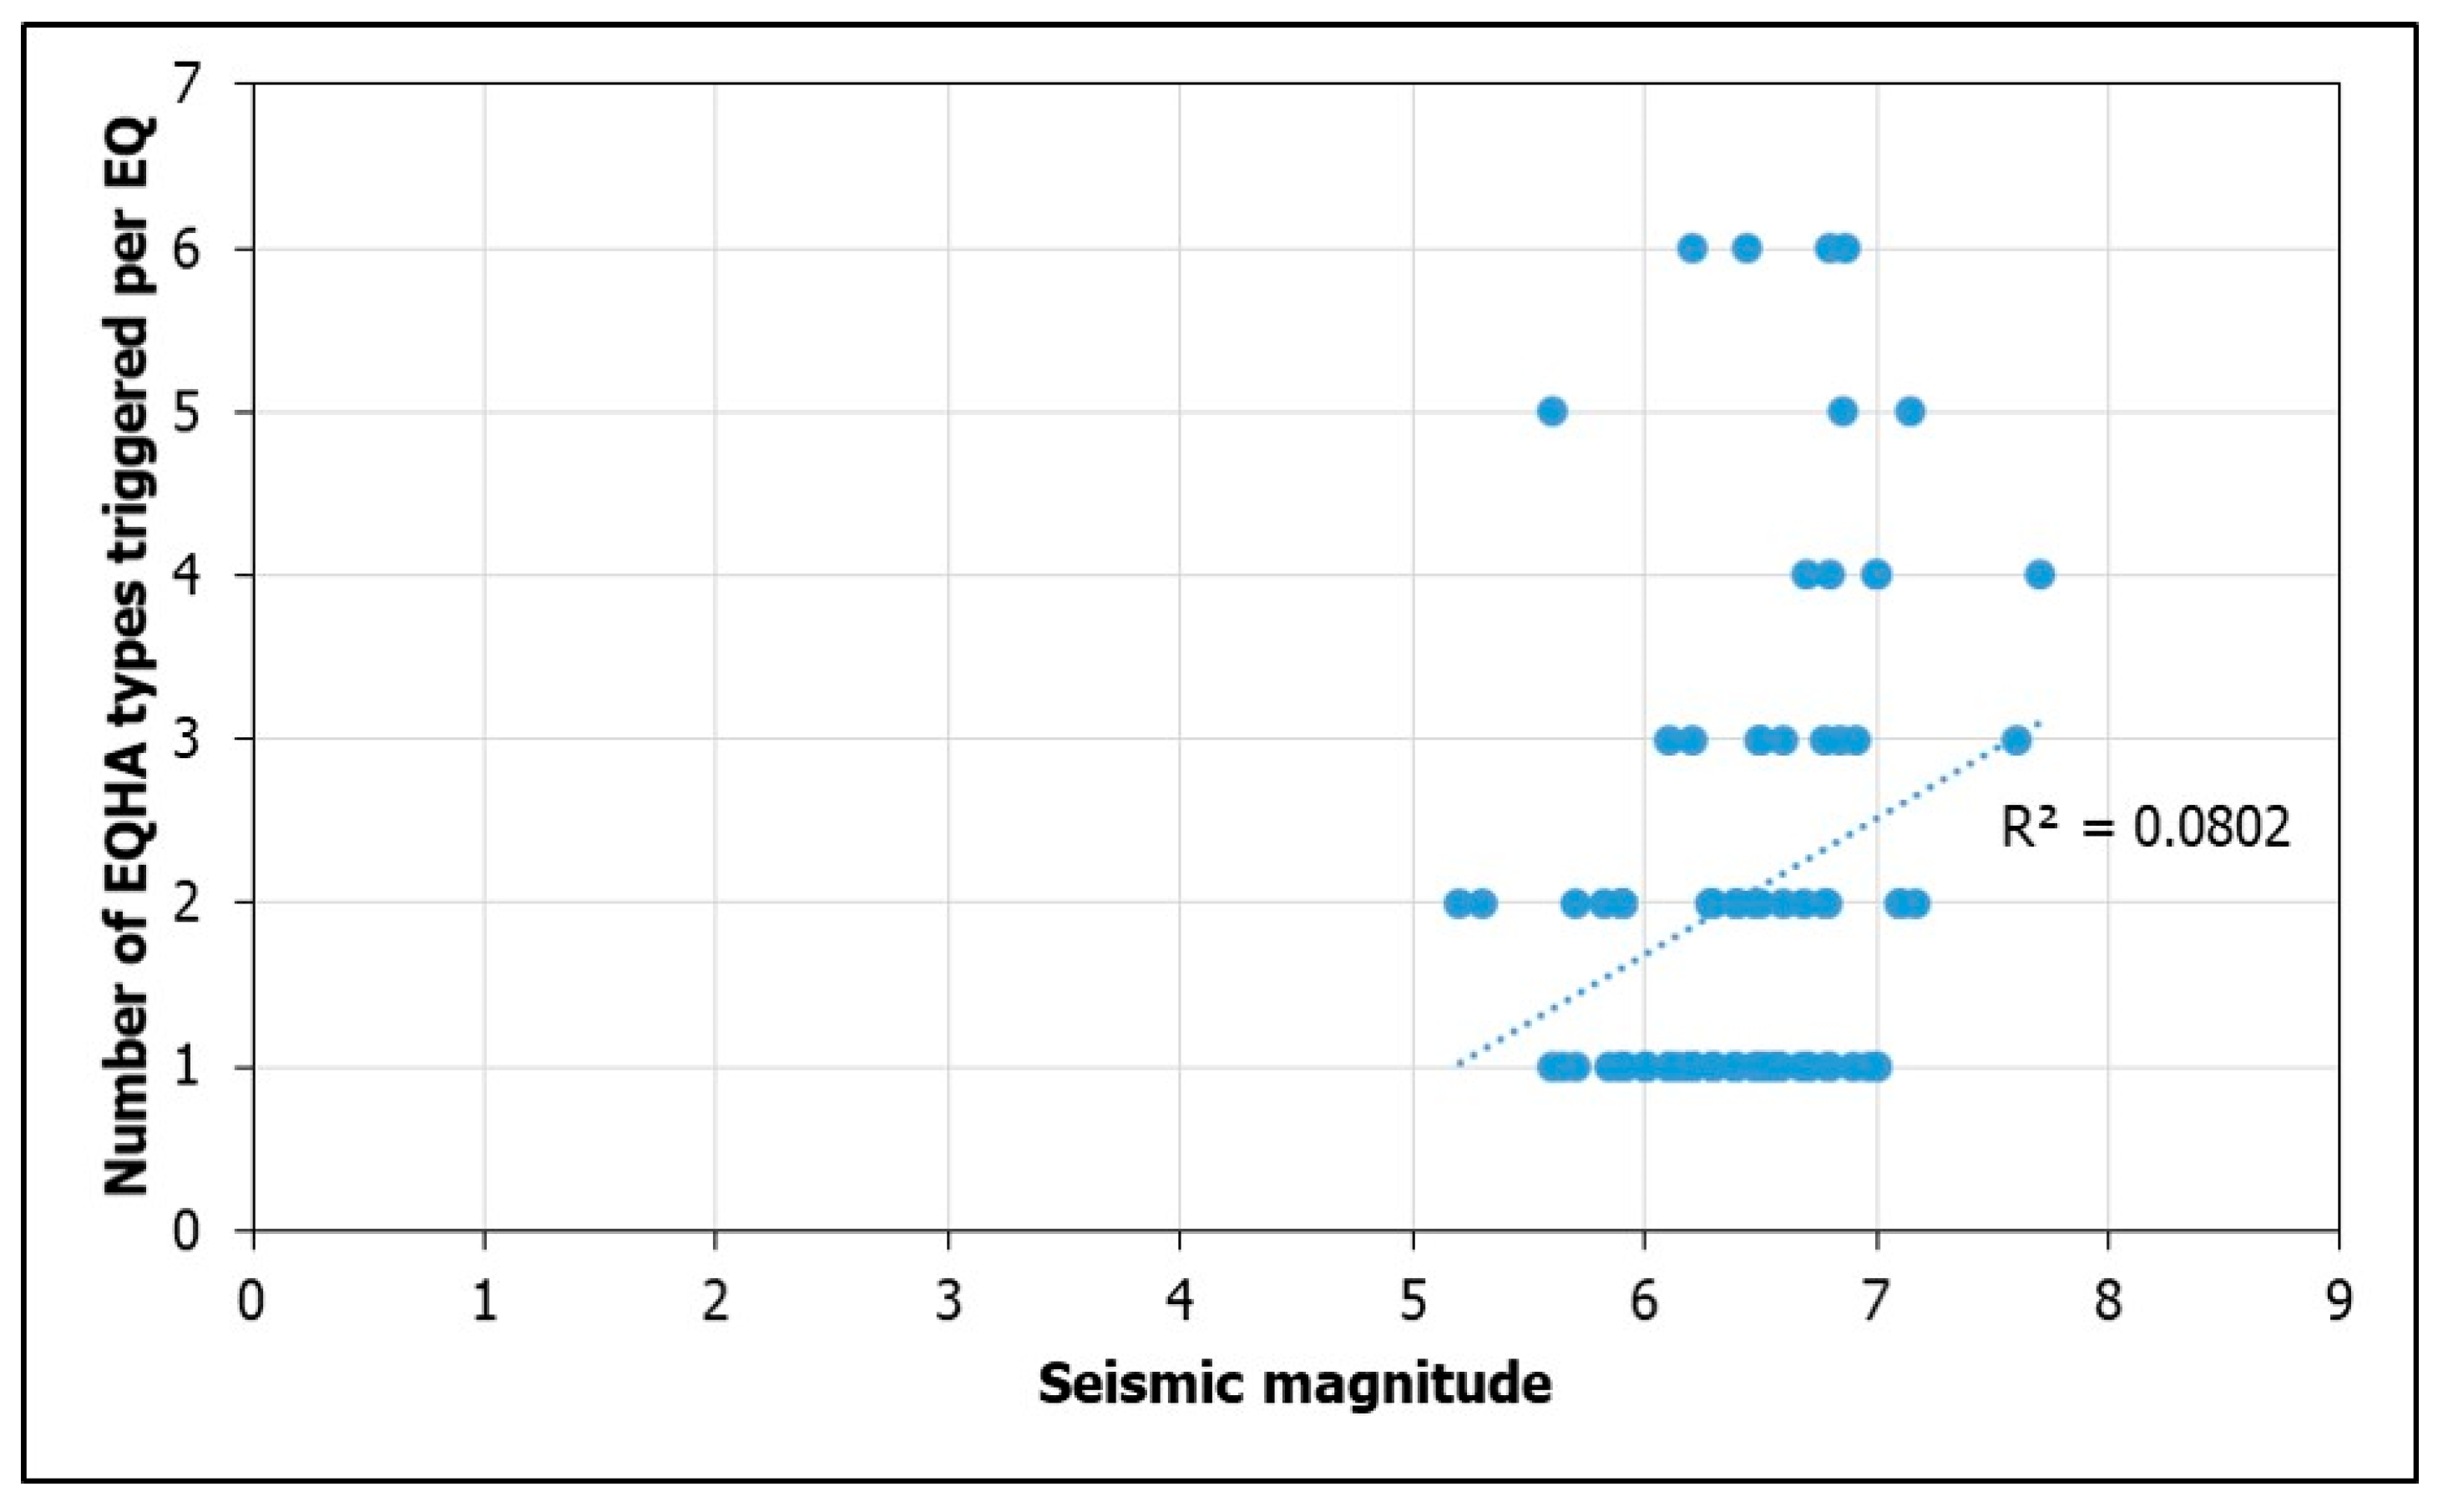
Analysis of the data showed that the earthquakes that induced the maximum number of types of hydrogeological anomaly (six types) belong to the magnitude class 6.0 < Mw < 7.0 and are related to historical events. Although these events induced most of the recorded types of EQHAs, the same database also includes earthquakes of a larger magnitude (Mw > 7.0) that are associated with a significantly smaller number of types of EQHAs. This finding suggests that the earthquake magnitude, although an important factor, is not sufficient to explain the diversity or number of EQHAs. Furthermore, of particular interest is the Mw = 5.6 earthquake of 15 July 1909, originating in the Chavari area (Elis, Peloponnese), which, despite its relatively small size, induced five different types of hydrogeological anomalies. This case reinforces the view that factors, such as the local tectonic structure, the hydrolithological properties of the affected formations, the focal depth, and the acceleration of the earthquake ground motion, play a crucial role in the activation or multiplicity of these phenomena.
This fact is also evident from the scatter plot based on the earthquake magnitude and the number of types of EQHAs per earthquake (Figure 12). It is evident that there is no strong linear correlation between the earthquake magnitude and the number of types of EQHAs. The coefficient of determination R2 = 0.0802 indicates that earthquake magnitude accounts for only 8.02% of the variability in EQHAs, suggesting the influence of additional determining factors. Although individual strong earthquakes (e.g., Mw ≈ 6.2–6.8) have induced up to six types of EQHAs, there are also stronger earthquakes that have had a lesser impact.

4.3. Temporal Distribution of EQHAs

From the temporal distribution of the detected EQHAs in Greece (Figure 13), a large variation in the number of types of hydrogeological anomalies per earthquake is detected. The mid-19th century (1820–1870) saw a high level of seismic activity, with repeated records of several types of EQHAs. Typical examples of such earthquakes are noted on 29 December 1820 in Zakynthos (Ionian Islands), on 30 October 1840 again in Zakynthos, on 18 April 1842 in Messinia (SW Peloponnese), on 7 March 1867 in Lesvos Island (NE Aegean), and on 1 August 1870 in Phocis (Central Greece), which are responsible for the triggering of most EQHA types by a single event.
As far as recent earthquakes are concerned, after 1900, two periods can be distinguished. The first period extends from the beginning of the century until the end of the 1950s, when earthquakes with more than two types of EQHAs have occurred. In particular, during the 1930s-1960s and around 1980–1990s, there are earthquakes causing several types of EQHAs (3–4), such as the earthquake of 23 July 1949 in Chios (NE Aegean), during the 1953 seismic sequence in the central Ionian Islands and, in particular, the largest foreshock on 11 August and the main shock on 12 August with 3 and 4 types of EQHAs, respectively, and the earthquake of 30 April 1954 at Sofades (Thessaly).
The second period runs from 1960 to 2020, when relevant data are available, during which only one or two types of EQHAs are recorded. Considering the scientific progress and the development and implementation of systems for recording such changes around the world, the limited recordings during the last 50 years can be attributed to a synergy of factors mainly related to the geological and hydrogeological properties of the affected areas, the earthquake parameters, and the absence of installed modern systems for recording such anomalies in Greece.

4.4. Duration of EQHAs

Regarding the duration of EQHAs in Greece, it is concluded that there are limited accurate related data. For 69 of the 94 earthquakes (73.4%) associated with EQHAs, no information is available regarding the duration of the induced anomalies. This highlights the incompleteness of the records, suggesting either insufficient historical documentation or a lack of systematic monitoring during the instrumental period. For the remaining 25 earthquakes, there is available information about the duration of EQHAs. In the frame of this study, the detected information is classified into four categories: (i) occurrence during the main earthquake, (ii) duration of a few hours after the main earthquake, (iii) duration up to 24 h after the main earthquake, and (iv) duration longer than 24 h, including days and months after the main earthquake (Figure 14).
In 11 of the 25 earthquakes (34.38%), EQHAs were classified into the fourth category, indicating that hydrogeological systems were deeply and prolonged affected and the impacts on groundwater potential may be long-lasting and not immediately reversible. In six earthquakes (18.75%), the EQHAs were classified into the second category. In three earthquakes (9.38%), EQHAs were observed during the main earthquake (first category). This suggests that the co-seismic hydrogeological anomalies are rare, while the majority of the hydrogeological responses show a delay in their onset. In one earthquake (3.13%), the anomalies lasted one day (third category). In four earthquakes (12.5%), the EQHAs presented variation in their duration, and it was not possible to classify them into only one of the aforementioned categories. Instead, they were assigned to multiple categories (e.g., in both the first and fourth, in both the second and fourth, as well as in the second, third, and fourth categories). This indicates that hydrogeological anomalies are not homogeneous in time, as they could be induced in different sources or regions, probably responding differently to the same seismic event.

4.5. Spatial Identification of the EQHAs and Location Reliability

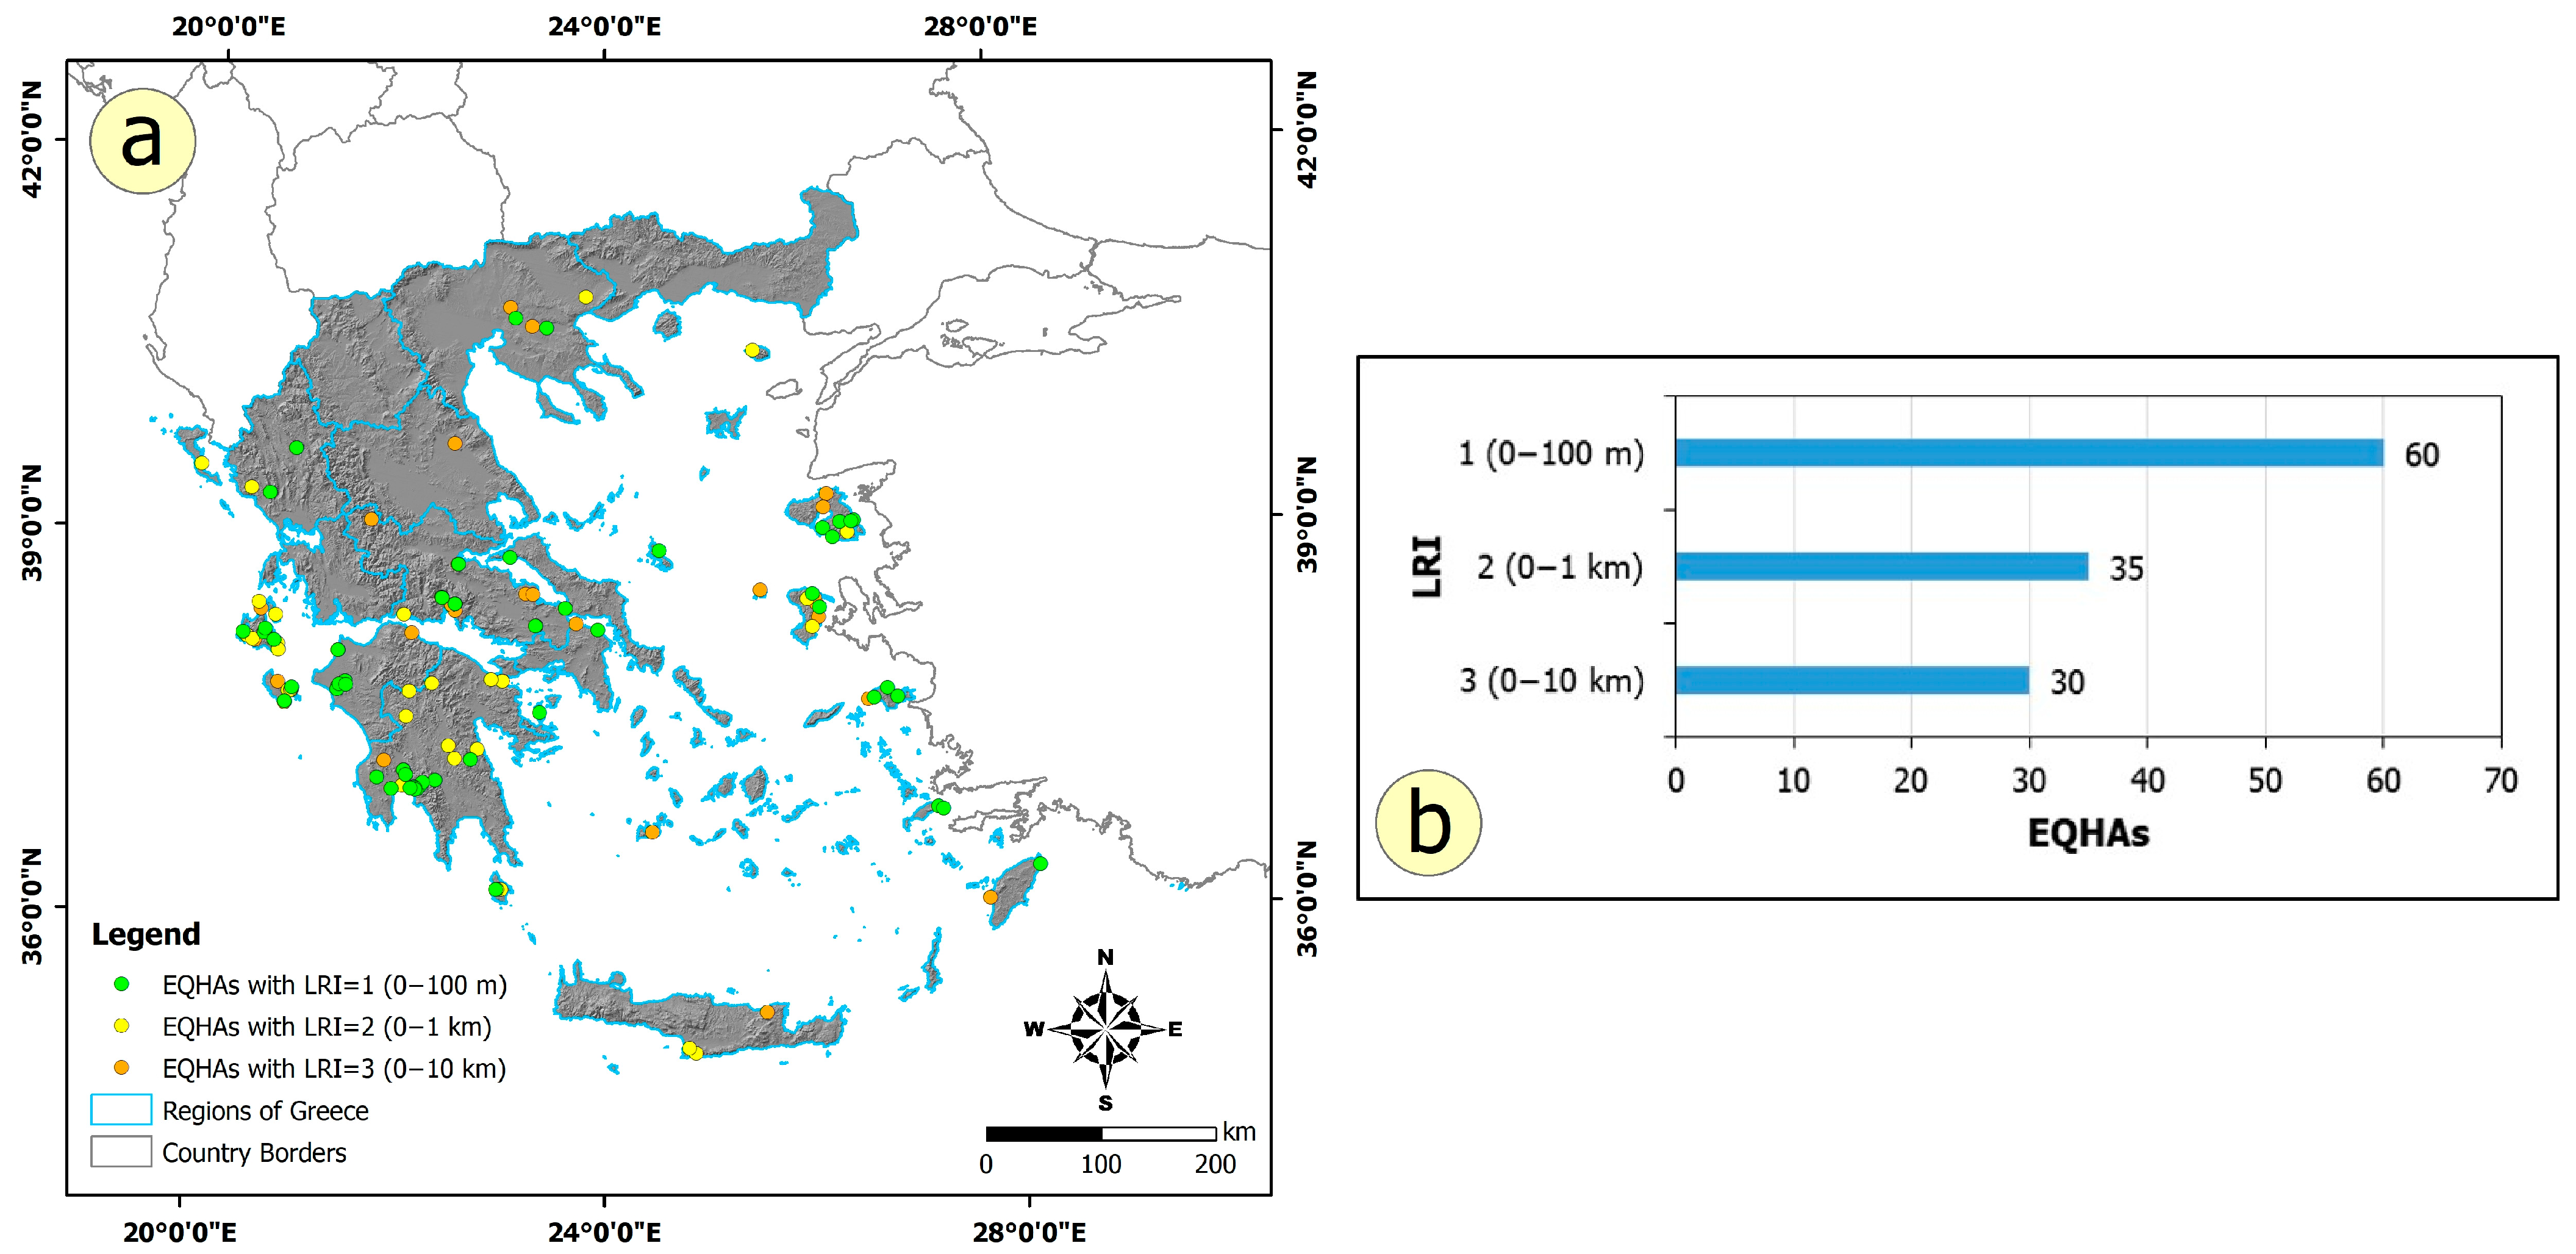
Regarding the reliability of locations of EQHAs in Greece, three classes were used: (i) LRI 1: 0–100 m, very high reliability; (ii) LRI 1: 0–1000 m, high reliability; (iii) LRI 3: 0–10 km, moderate reliability (Figure 15). The fourth class (LRI 4: > 10 km, low reliability) was not applied as the descriptions were too general, the geographical data extremely inadequate or unclear, and the geographical search area excessively broad, resulting in a substantial inability to determine their locations, even at an approximate level. The location of 60 out of 125 EQHAs (48%) was determined with very high reliability, while 35 EQHAs (28%) were mapped with high reliability (Figure 15). The remaining 30 EQHAs (24%) were mapped with moderate reliability (Figure 15).

4.6. Origin Time of the Spatially Identified EQHAs

Although the difference between historical and recent earthquakes that have caused hydrogeological anomalies is relatively large (59 historical compared to 35 recent ones), the same is not true for spatially identified EQHAs. One would expect the number of spatially identified EQHAs to follow the number of historical earthquakes and to be much higher than the recent records. However, this is not the case. If one observes the historical and recent anomalies that have been spatially identified (Figure 16), they will notice a numerical balance (62 and 63, respectively), but also an apparent discrepancy with the causative earthquakes.
The nearly equal distribution between historical and recent EQHAs, despite the significantly smaller number of recent events (35 recent vs. 59 historical), raises questions about the factors contributing to this apparent discrepancy. This difference can be attributed to several factors, primarily related to data recording. Modern inventories are clearly more complete and detailed, thanks to the use of improved documentation by institutions, media, and local authorities. As a result, hydrogeological anomalies are more easily detected, recorded, and correlated with seismic events, even when they are mild or localized.
In contrast, historical sources exhibit significant spatial and temporal gaps and ambiguities, as they tend to document only the most impressive, dramatic or destructive EQHAs, often overlooking or omitting milder hydrogeological effects. Additionally, recent earthquakes are much more precisely defined in terms of epicentre and time, which facilitates their correlation with specific anomalies. This contrasts with historical events, whose parameters are often vague or uncertain. Furthermore, human interventions in modern hydrological and hydrogeological systems, such as drilling, dam construction, drainage projects, and urban development, may have increased their sensitivity to seismic shaking, potentially leading to a higher frequency or intensity of related anomalies.

4.7. EQHAs in the Regions of Greece

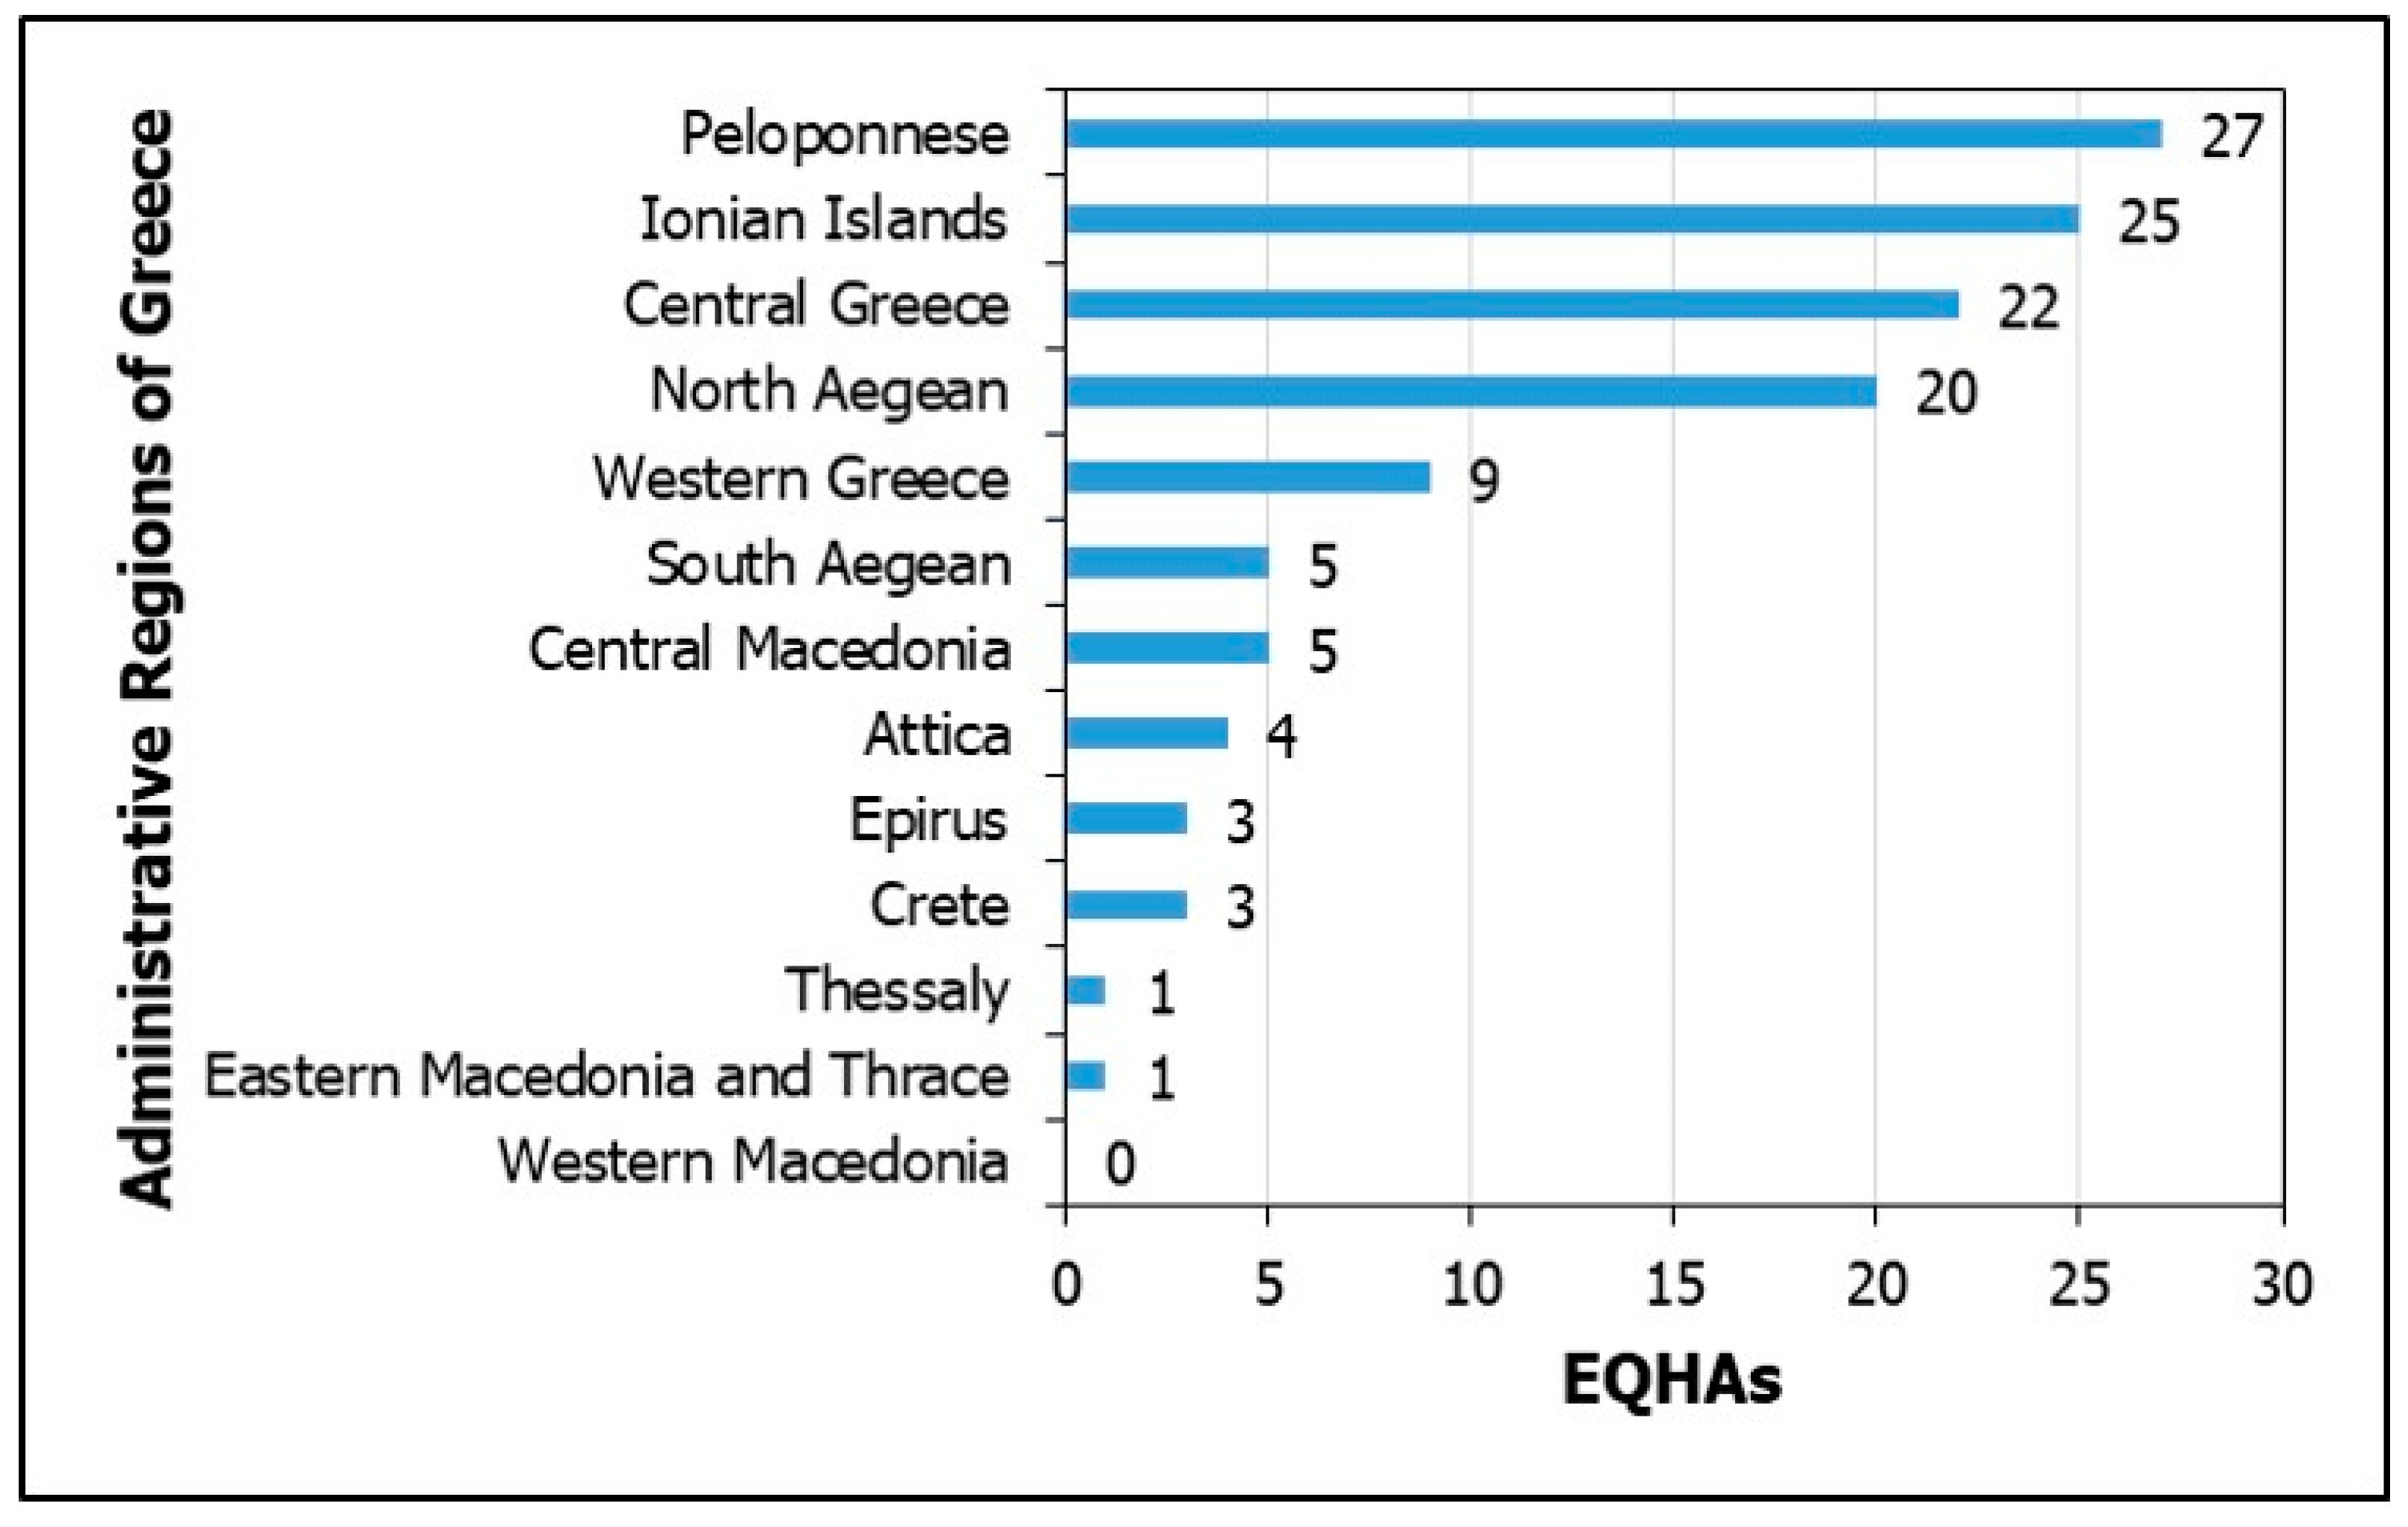
EQHAs have occurred in all regions of Greece except one, the region of Western Macedonia (Figure 17). However, the percentage of their occurrence varies from region to region. This variation is attributed to the seismotectonic characteristics of the regions.
More specifically, most hydrogeological anomalies have been recorded in regions of the western and southwestern part of Greece (Peloponnese and Ionian Islands with 27 and 25 EQHAs, respectively), with the regions of Central Greece and North Aegean following with numbers and percentages in the double digits (Figure 18).
A common characteristic of these regions is that they host many seismic faults [103,104], such as the Cephalonia transform fault zone [100], the seismic fault zone at the eastern margin of the Kalamata basin in the SW Peloponnese [40], and several seismic faults in the NE Aegean islands (Lesvos, Chios and Samos) [124,125]. These structures have hosted the epicentres of several earthquakes of large magnitude and intensity, resulting in extensive secondary effects on the natural environment [40,52,55], including EQHAs, among others.
The regions of Western Greece (nine EQHAs, 7.2%), South Aegean and Central Macedonia (five EQHAs, 4%), Attica (four EQHAs, 3.2%), Epirus and Crete (three EQHAs, 2.4%), and Thessaly along with Eastern Macedonia and Thrace (one ETHA, 0.8%) follow at the lower positions of this list with single-digit numbers and corresponding percentages (Figure 18).
Another case where the impact of geoenvironmental and seismotectonic characteristics of the affected areas is evident in the recorded EQHAs is the region of Eastern Macedonia and Thrace, which is noted for its moderate level of seismic activity [126,127]. This fact results in a limited number of destructive earthquakes, with consequent limited recording of EEEs and classification in the lowest seismic hazard zone in Greece (Zone I, 0.16 g).

4.8. EQHAs in Water Districts and River Basins

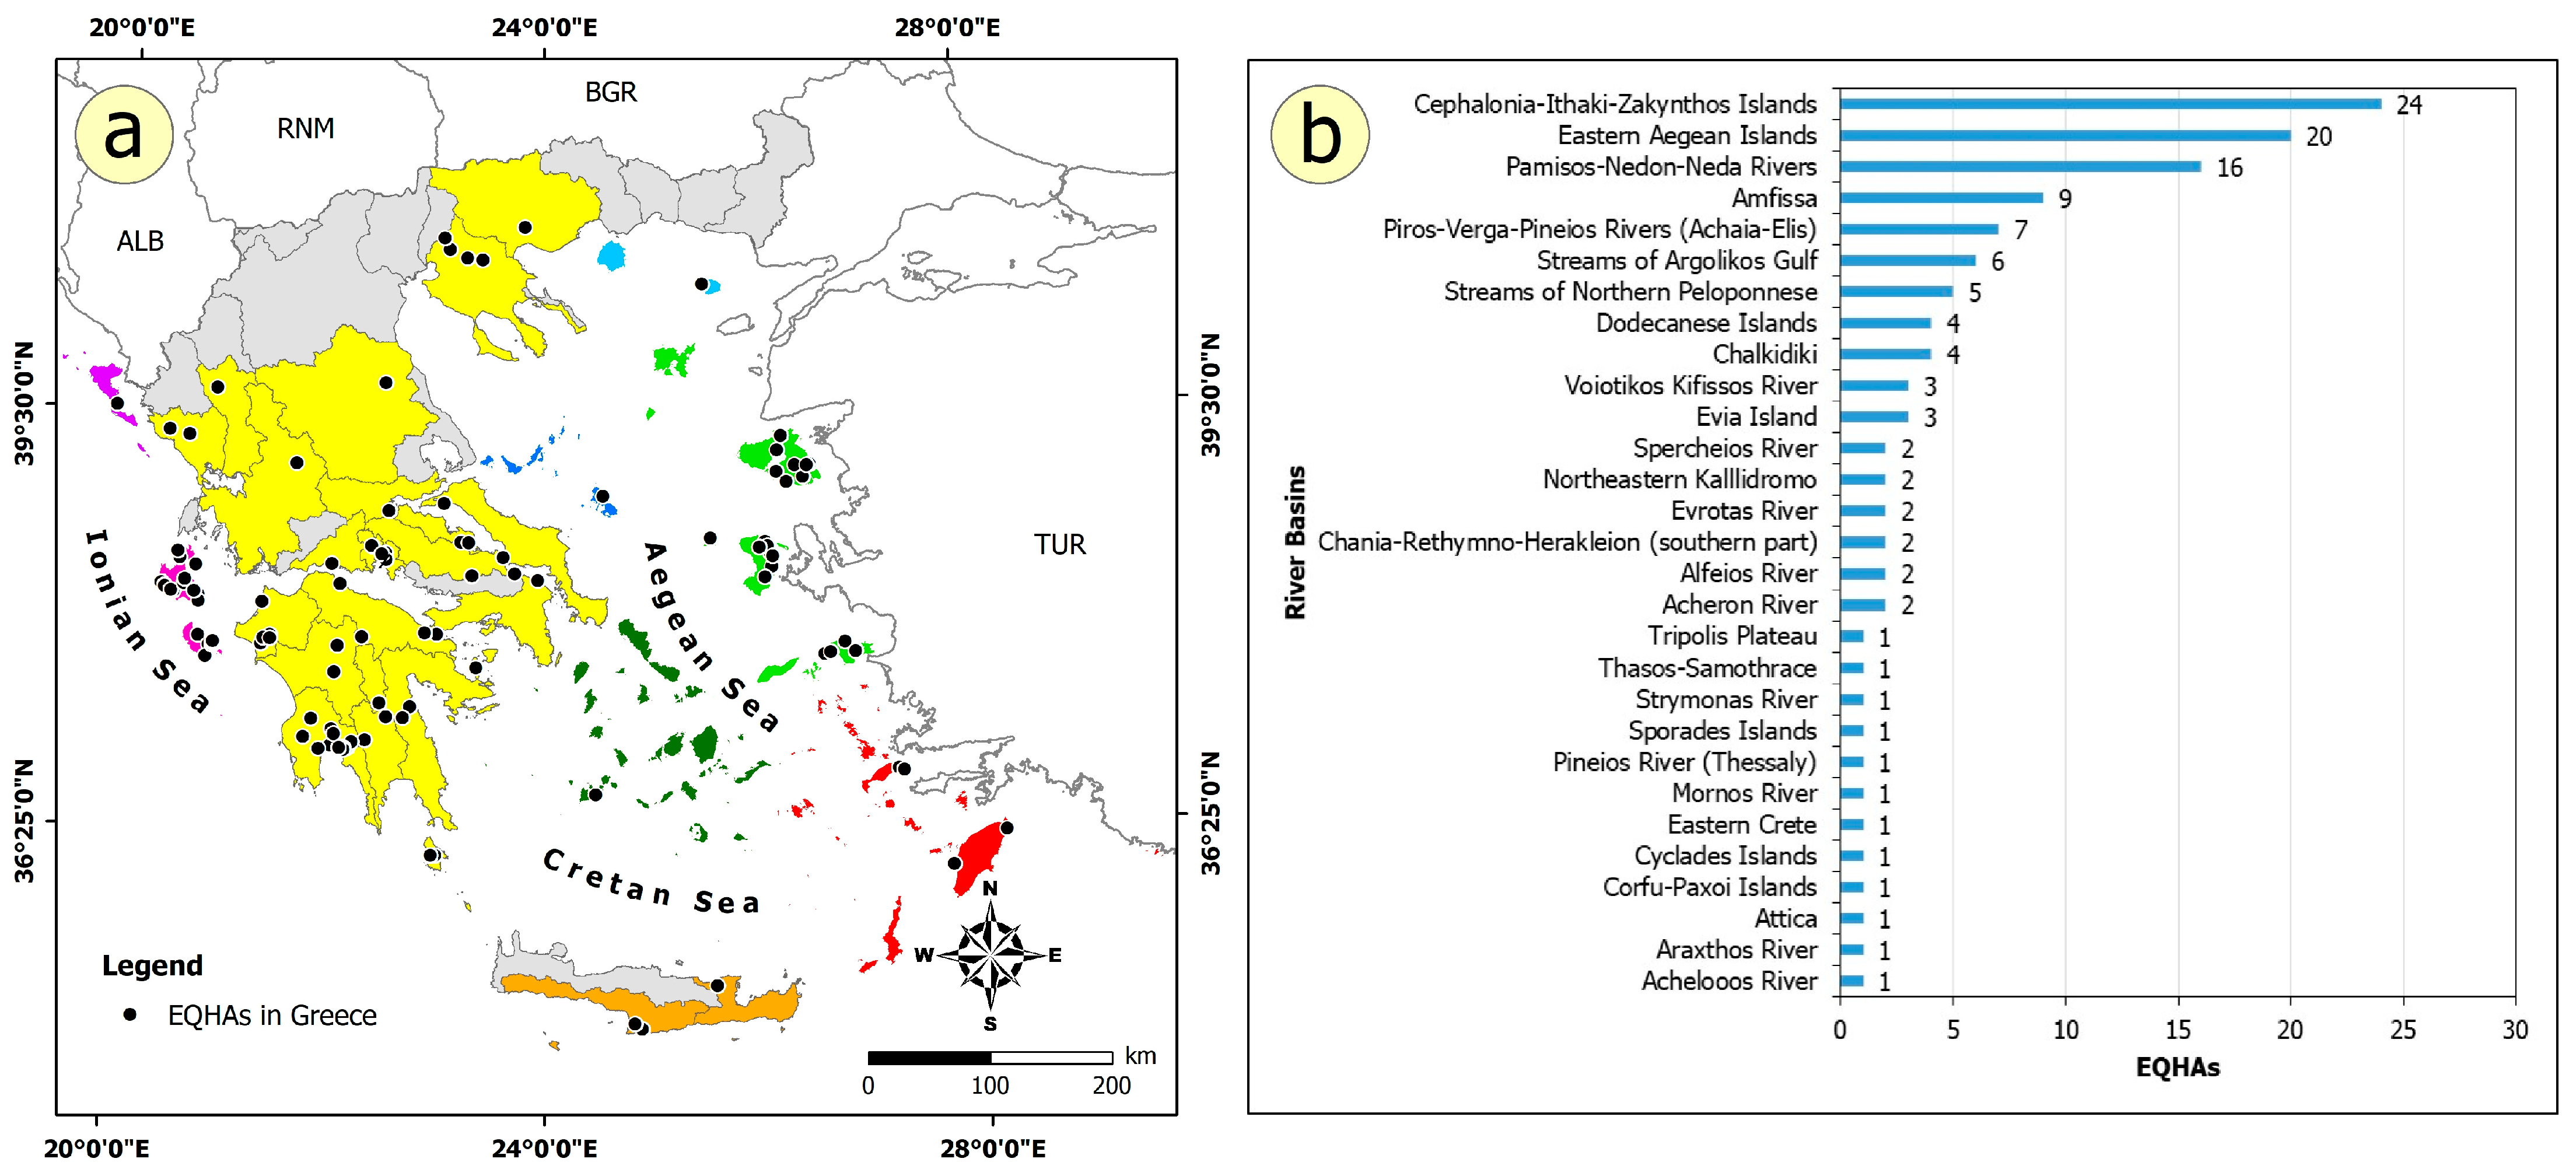
Regarding the distribution of EQHAs across the RBDs, it is observed that most of them have occurred in the RBDs of the Peloponnese, Central Greece, and the Aegean Islands (Figure 19). In the Peloponnese specifically, there are 63 EQHAs out of a total of 125 geographically identified across the country (Figure 19). More precisely, 36 are located in the RBD of Northern Peloponnese (28.8%), 18 in Western Peloponnese (14.4%), and 9 in Eastern Peloponnese (7.2%) (Figure 19). It is important to note that the RBD of Northern Peloponnese also includes the central Ionian Islands, with Cephalonia, Ithaki, and Zakynthos Islands accounting for 24 of the 36 EQHAs recorded in that district (Figure 19). In the RBD of the Aegean Islands, which includes all of them, EQHAs amount to 25 (20%), while in the RBD of Eastern Central Greece to 20 (16%) (Figure 19). The other RBDs follow with single-digit numbers of EQHAs and relative percentages (Figure 19).
If we take into account the individual drainage basins, a clear pattern emerges. The dominance of the basins located within the RBDs of Western Greece and the Aegean becomes evident once again (Figure 20a). In particular, the drainage basins of Northern Peloponnese stand out. As previously mentioned, this river basin district also includes the central Ionian Islands. Significant contributions are also observed from basins of the Aegean Islands and Central Greece, accounting for a large proportion of EQHAs in Greece.
More specifically, the top position on the relevant list is held by the drainage basins of the central Ionian Islands (Cephalonia, Ithaki, and Zakynthos), with 24 EQHAs (19.2%) (Figure 20b). The drainage basins of the Eastern Aegean Islands are in the second place, with 20 EQHAs (16%). The drainage basins developed within the neotectonic basin of Lower Messinia (Kalamata) are third, with 16 EQHAs (12.8%) (Figure 20b). The subsequent positions include basins with single-digit counts of EQHAs, such as the drainage basins of the Piros, Verga, and Pineios Rivers in NW Peloponnese (nine EQHAs, 7.2%); the torrent basins discharging into the Argolic Gulf (six EQHAs, 4.8%); and the torrent basins of Northern Peloponnese discharging into the Corinthian Gulf (five EQHAs, 4.0%) (Figure 20b). Among these, the drainage basin of Amfissa in Central Greece also holds a notable position, with nine EQHAs, accounting for 7.2% of the total (Figure 20b).
The list continues with drainage basins that have the lowest numbers of EQHAs and the smallest relative percentages, distributed across various RBDs throughout Greece (Figure 20b).

4.9. EQHAs in Water Bodies

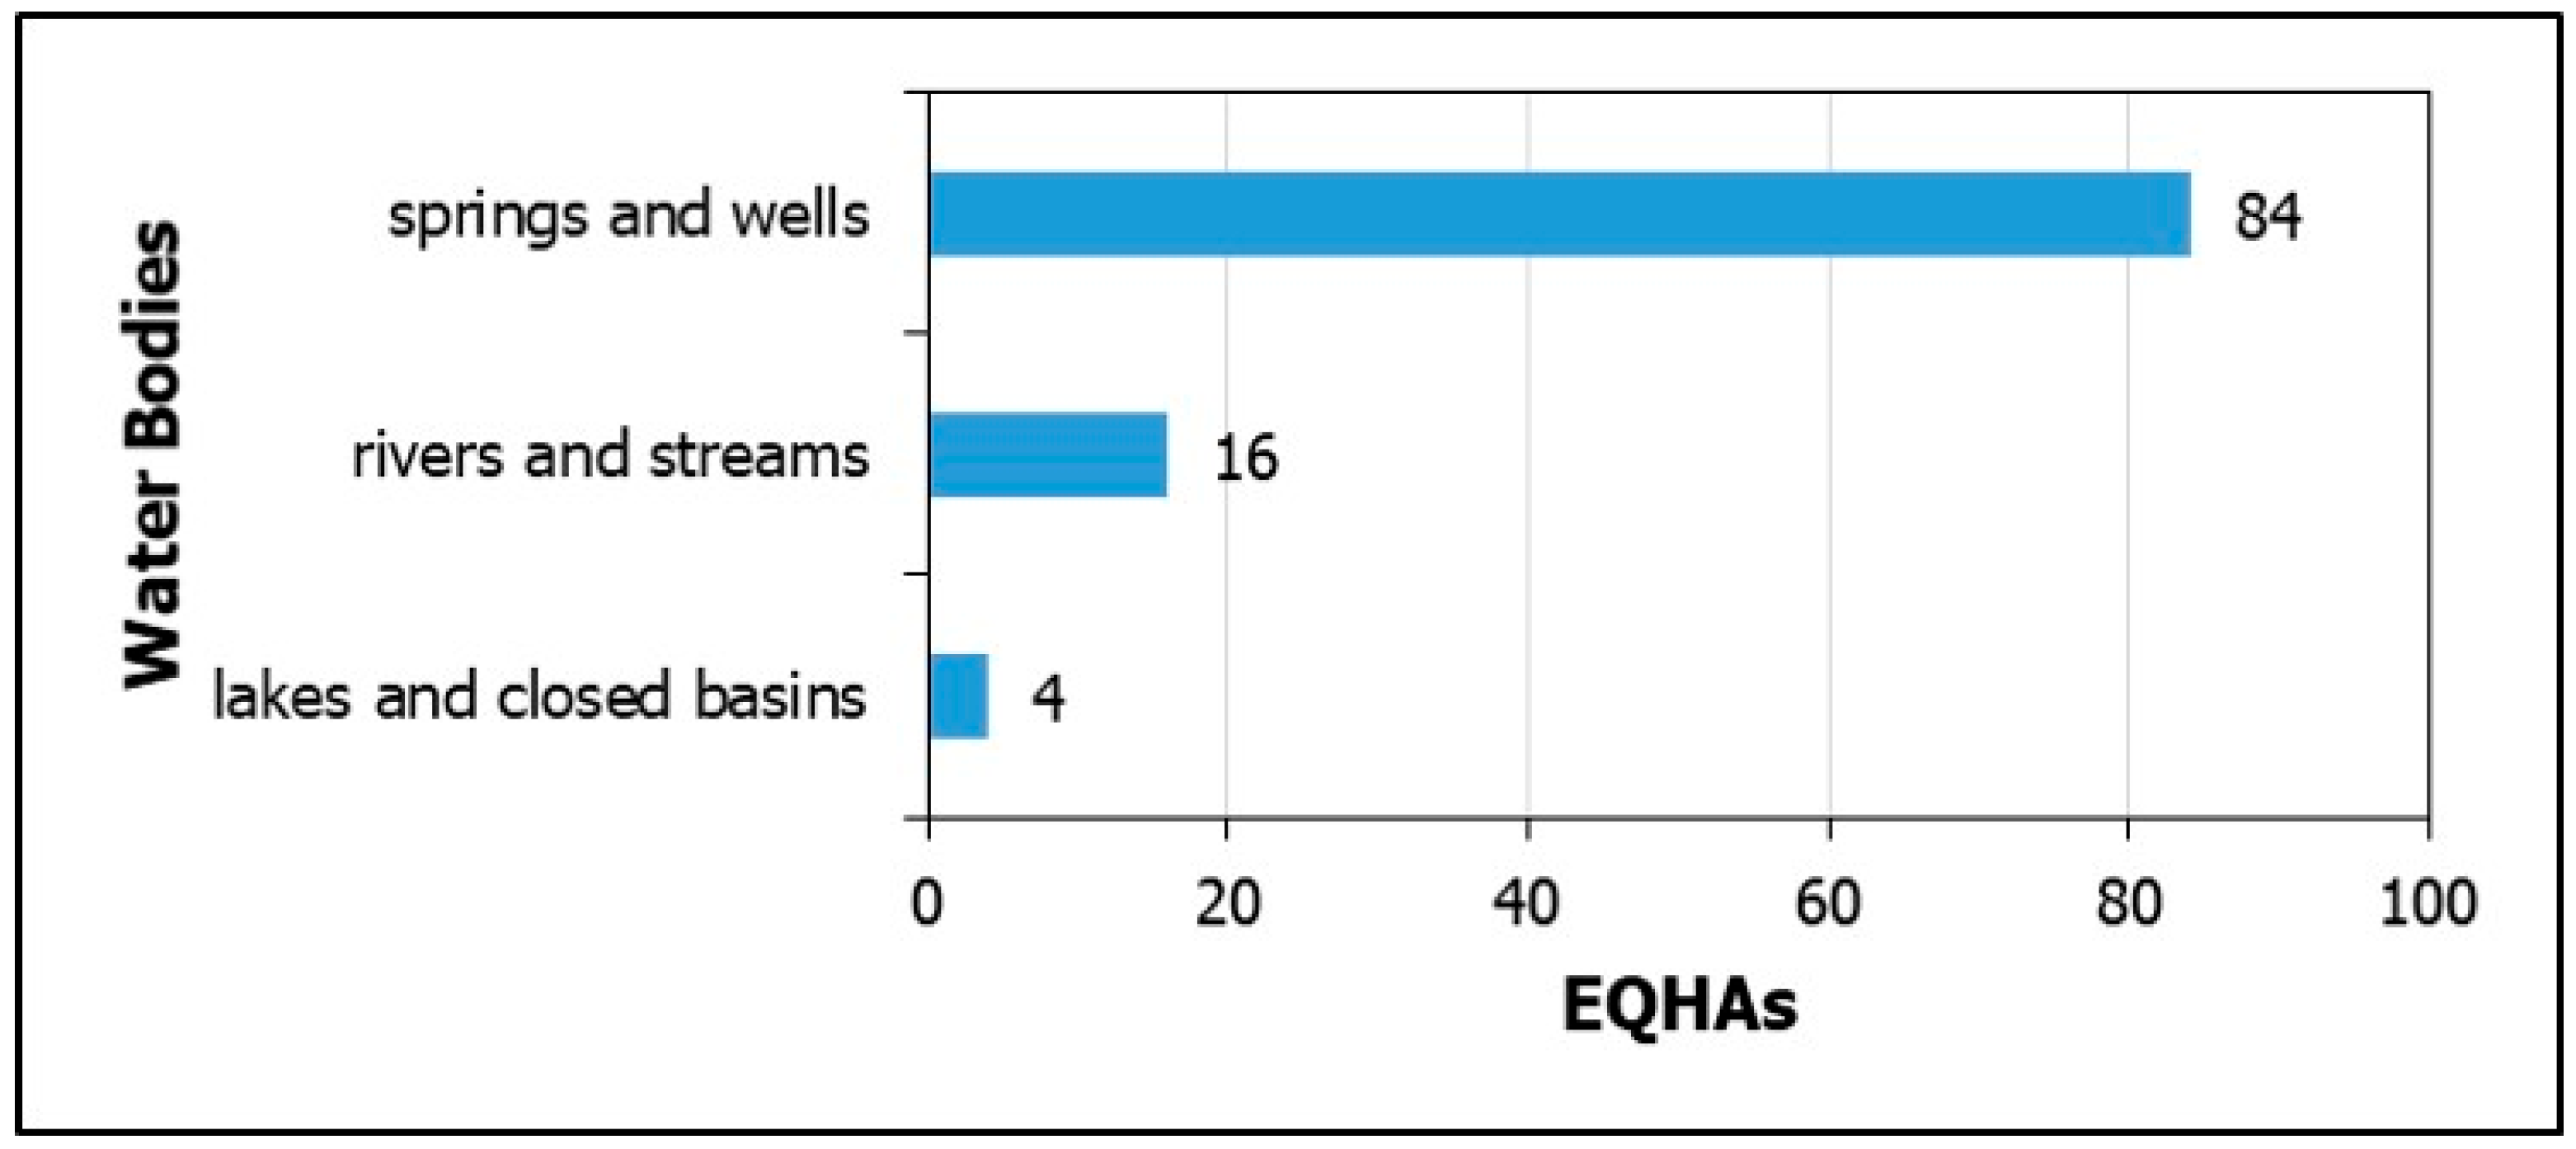
Regarding the water bodies affected by EQHAs in Greece, the following findings were recorded (Figure 21):
  • A total of 104 water bodies were affected by EQHAs.
  • A total of 84 (80.77%) of these were springs and wells. This indicates that aquifers are particularly sensitive to seismic disturbances, as temporary or permanent changes in pressure and hydraulic balance following earthquakes are more directly reflected in water intakes (springs, wells, and boreholes).
  • Overall, 16 (15.38%) were branches of the drainage system (rivers and streams).
  • Four (3.85%) were lakes and closed basins. This suggests a reduced direct interaction with the groundwater system, as well as a more stable hydraulic response of lakes to seismic shaking, unless accompanied by surface leakage or sink-related anomalies.

4.10. EQHAs in Seismic Hazard Zones

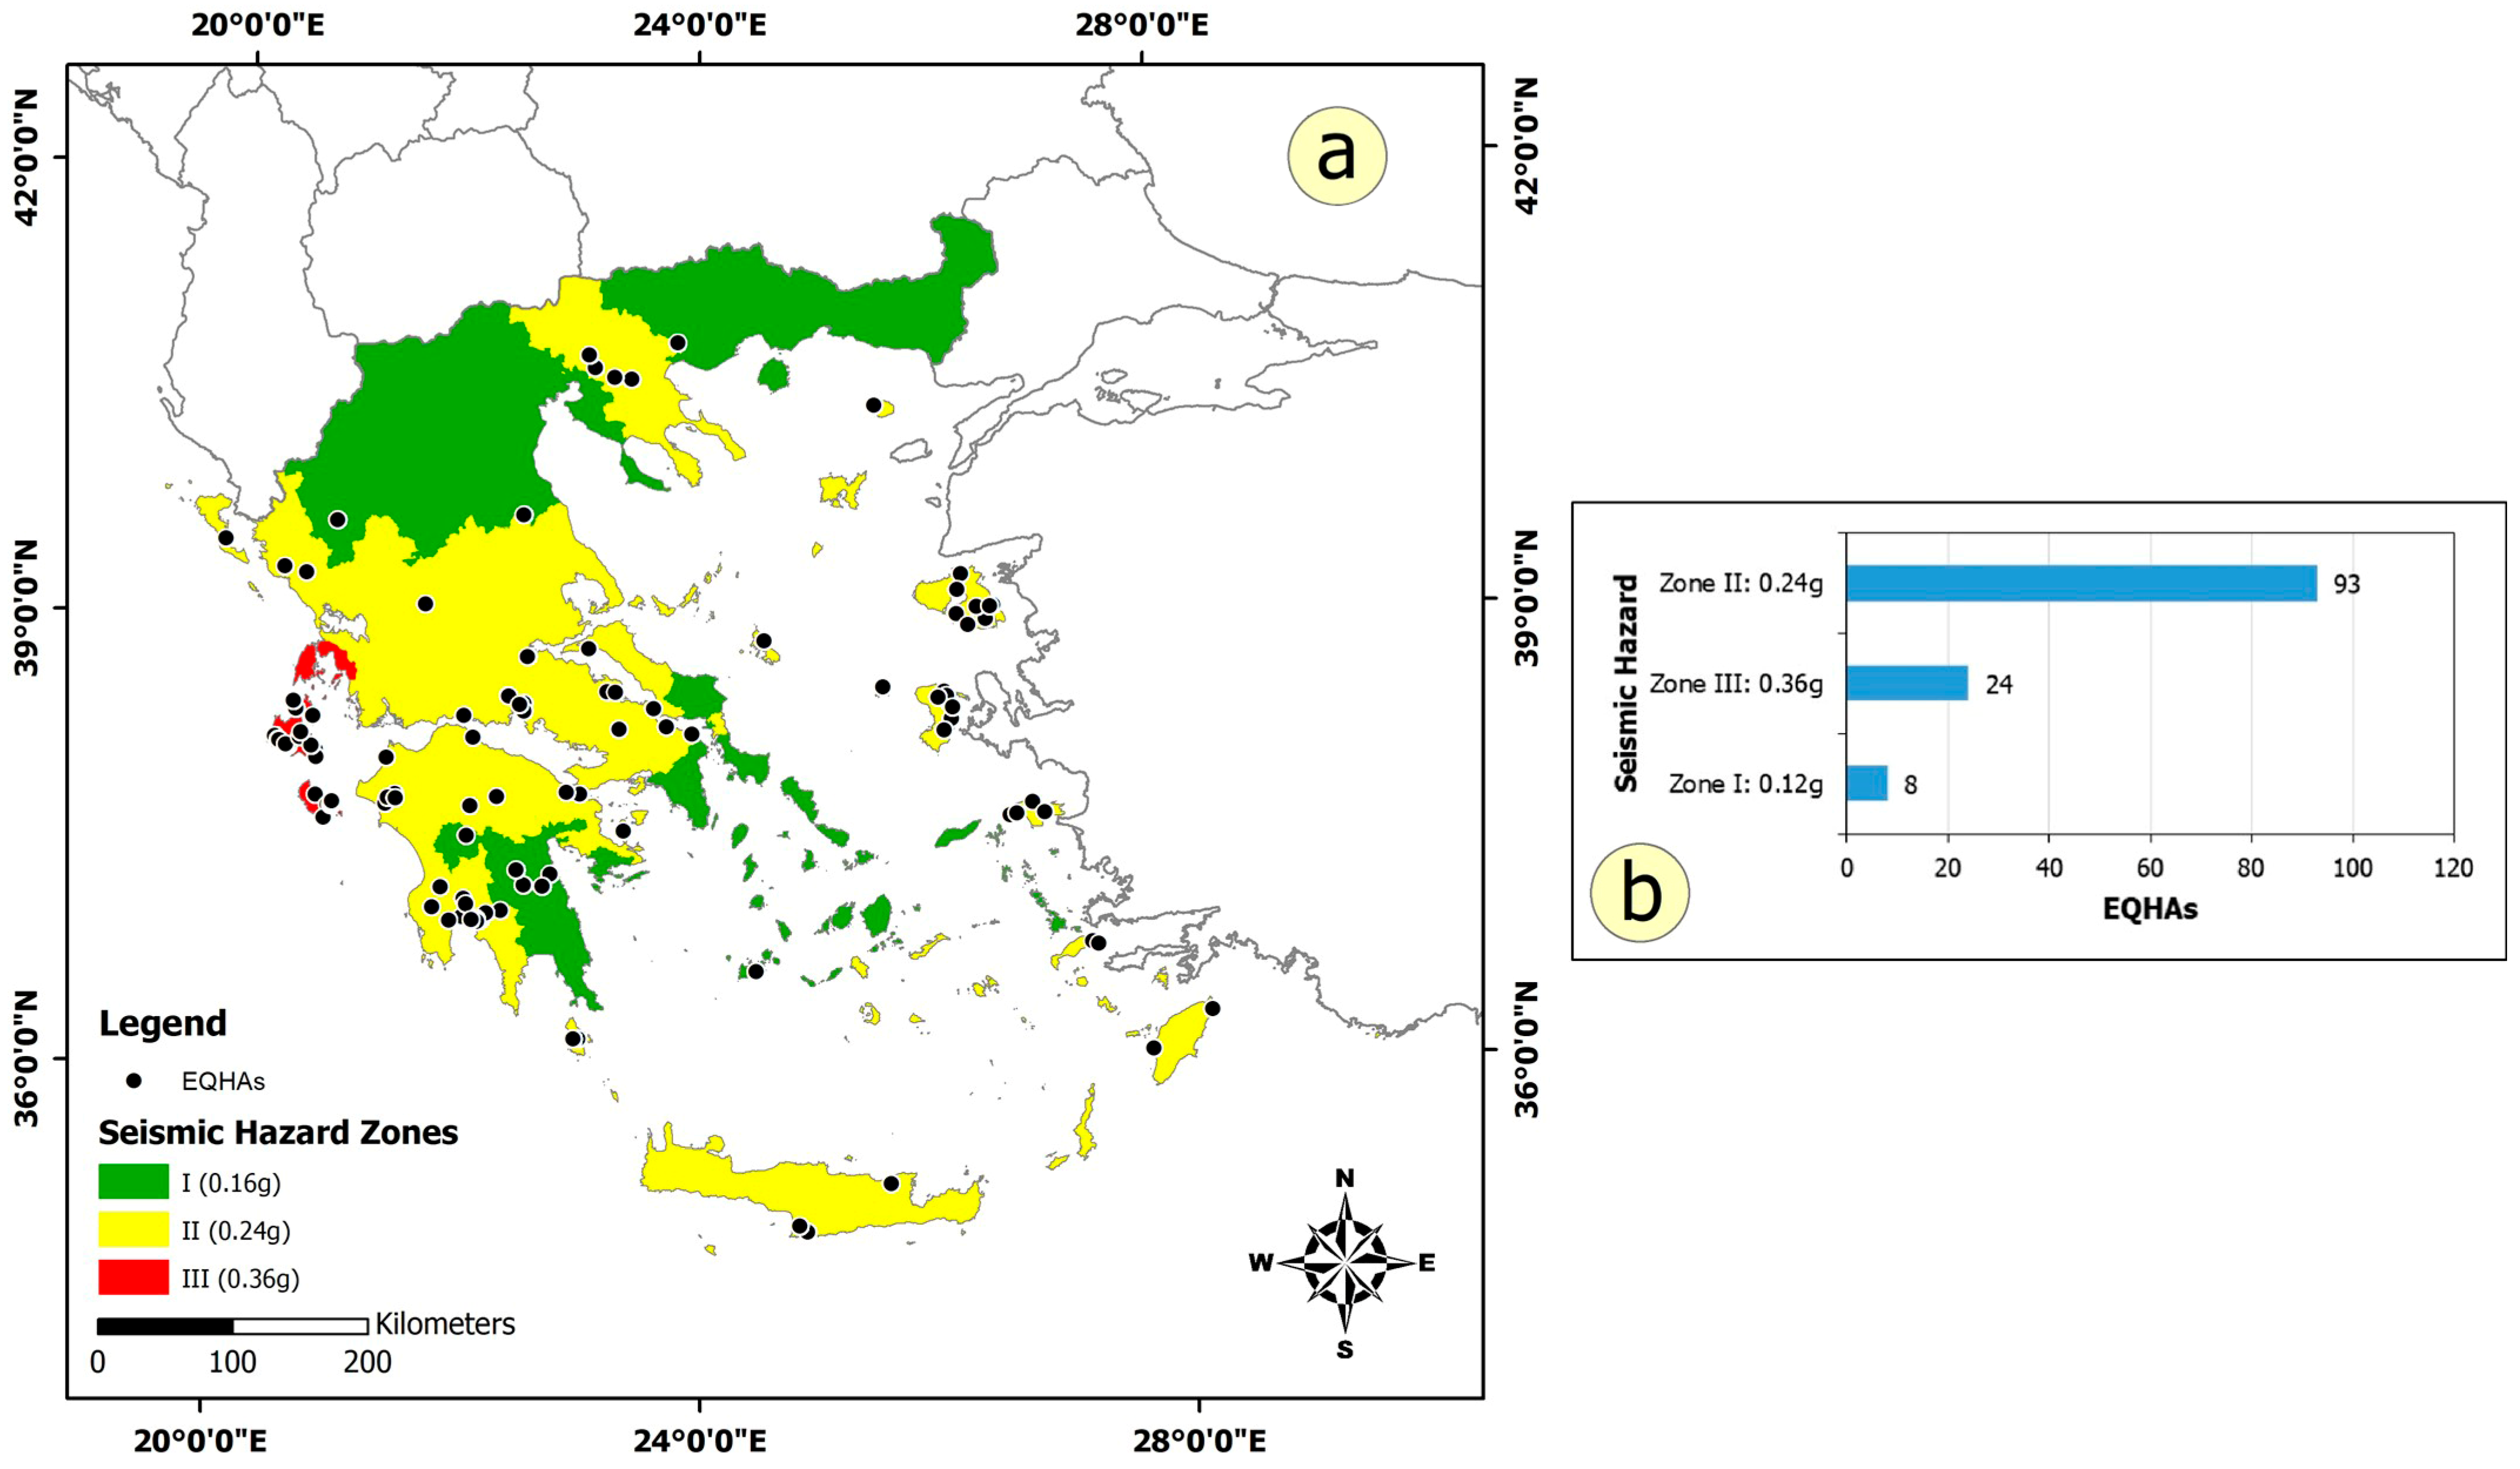
From the comparison of EQHAs with seismic hazard zones of Greece, it is concluded that the majority of them were induced in Zone II (93 out of 125 EQHAs, 74.40%), with Zone III following in second place (24 EQHAs, 19.20%), and Zone I having the lowest number of events (8 EQHAs, 6.40%) (Figure 22). It would be expected that Zone III, with the highest anticipated acceleration, would exhibit the greatest number of EQHAs, given the frequent occurrence of large destructive earthquakes. However, this variation is not linked to the seismotectonic regime, earthquake characteristics, or fault activity in the Ionian Islands, but rather to the considerably larger extent of Zone II.

4.11. EQHAs and Hydrolithological Properties of Affected Formations

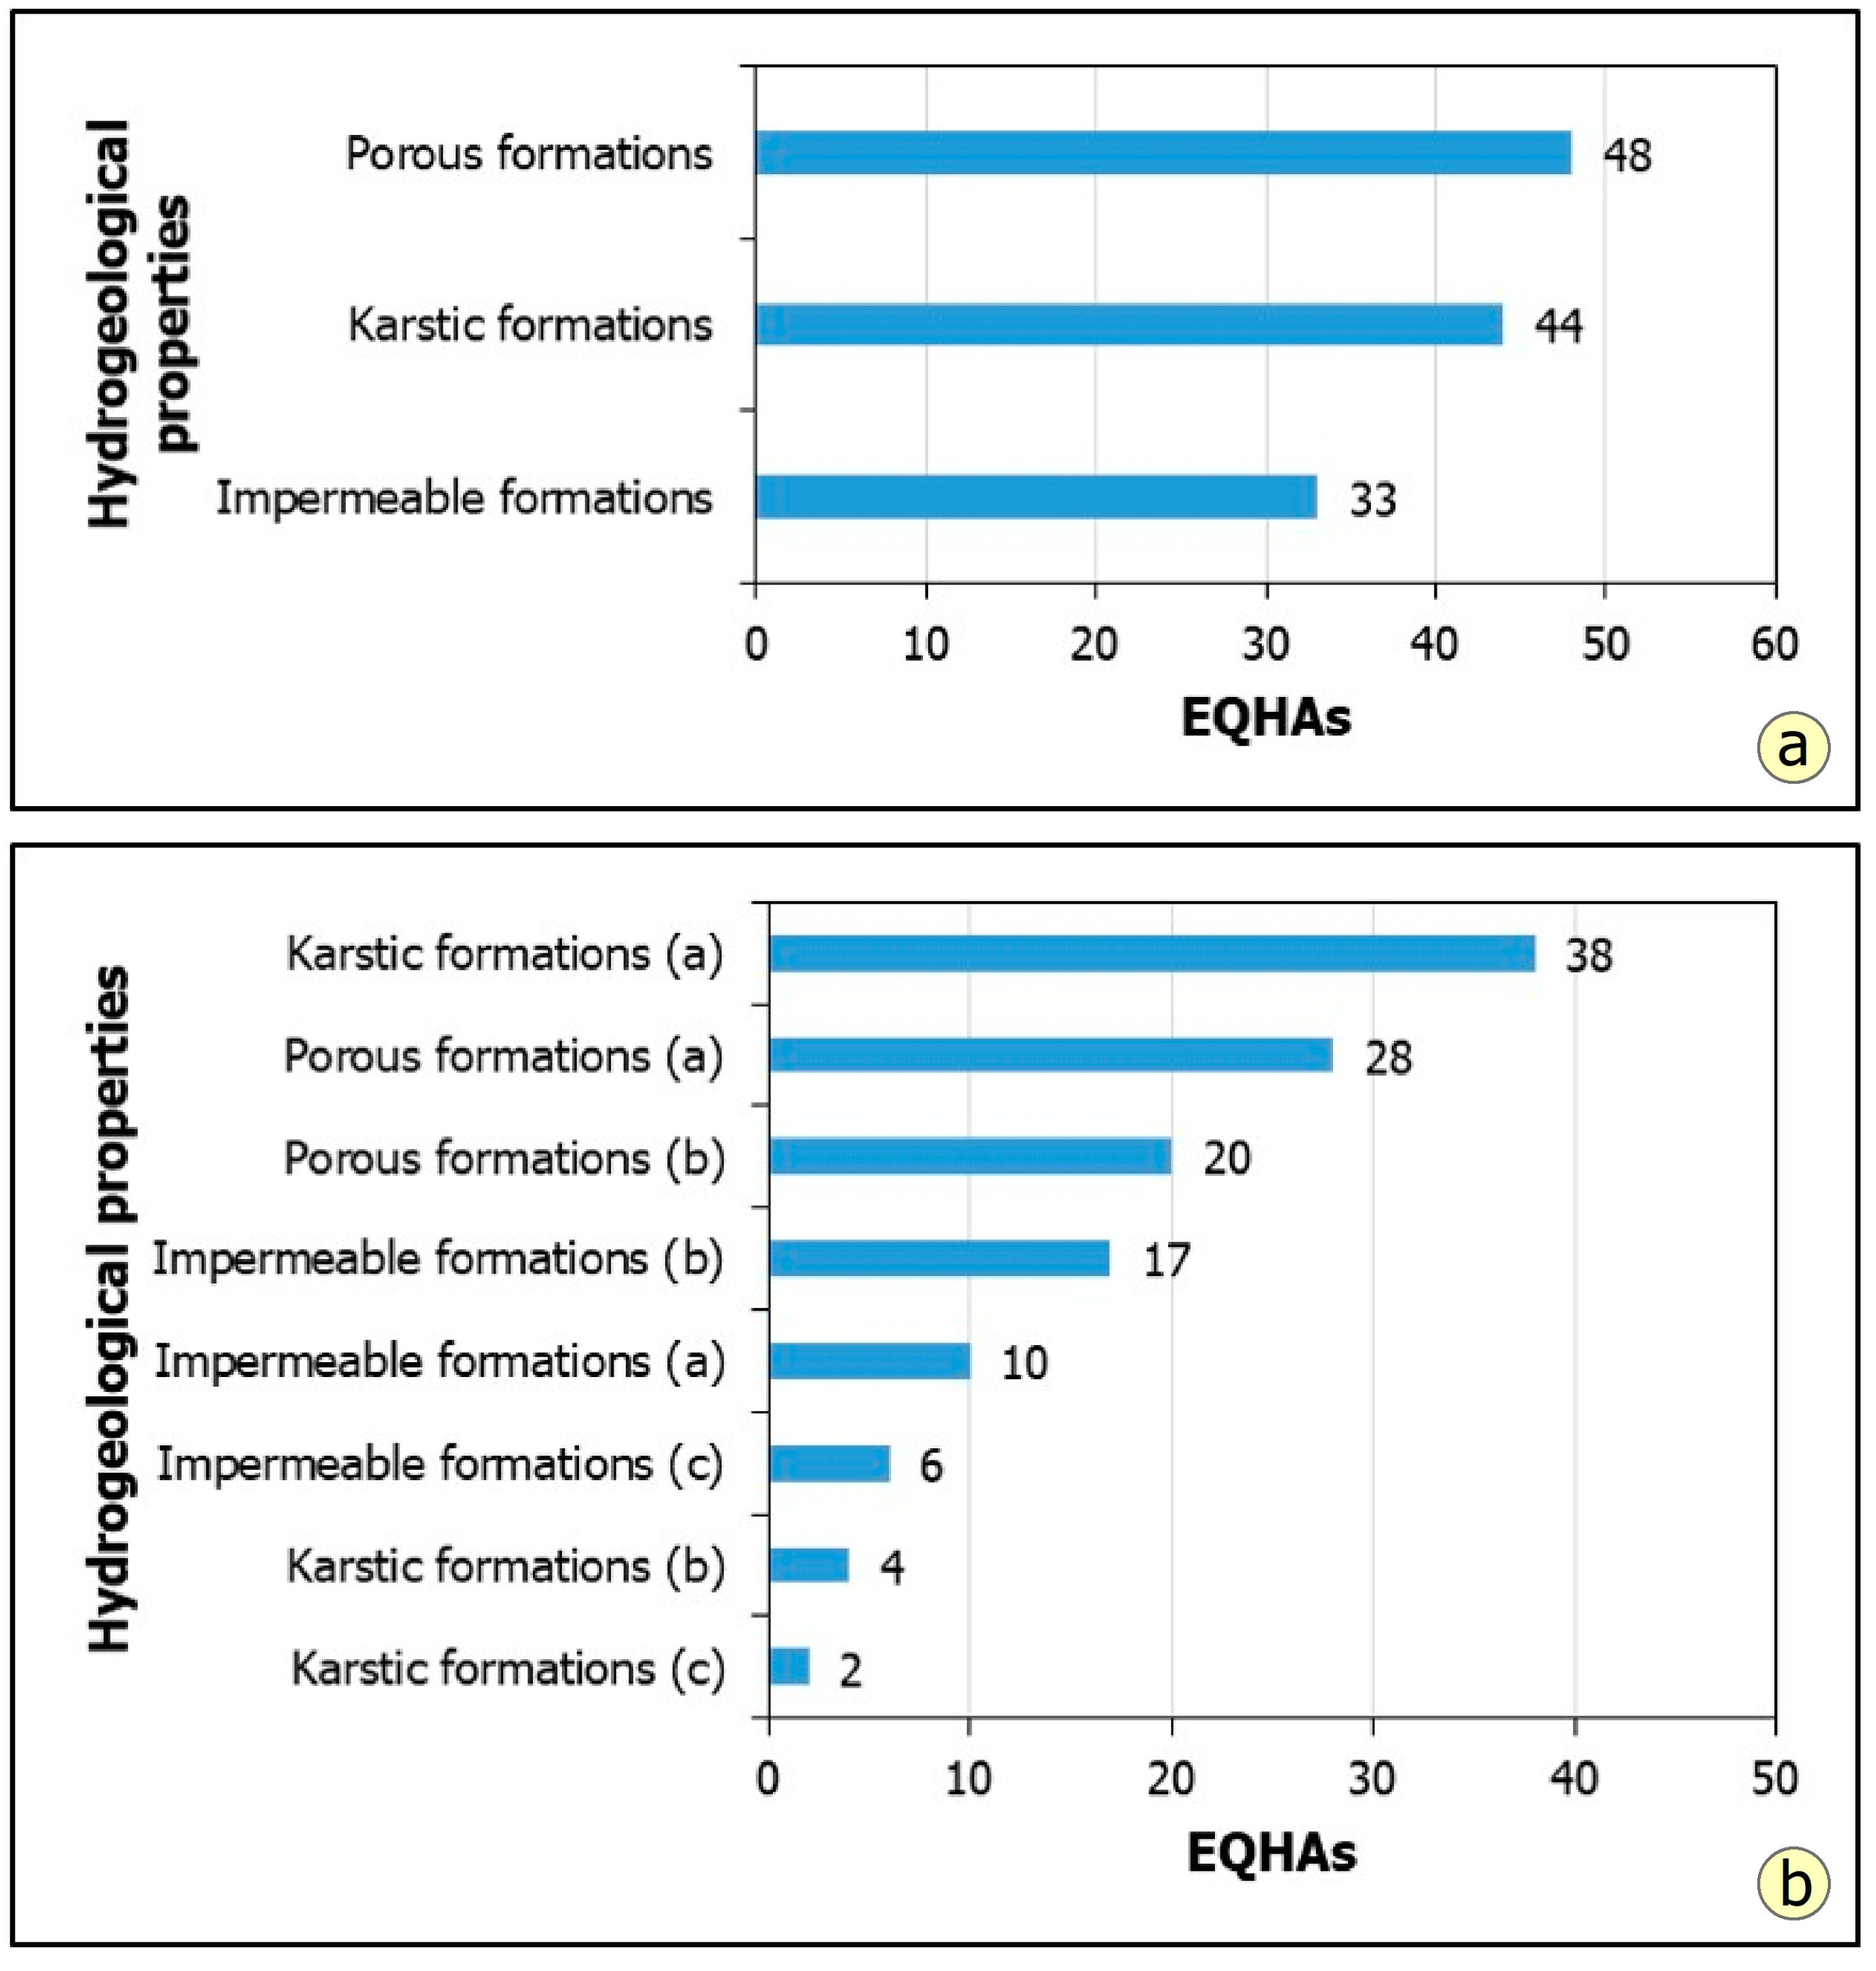
In the context of this research, we used the hydrolithological map of Greece [56] to determine which formations are the most susceptible to the occurrence of EQHAs based on their hydrolithological properties and their hydrogeological behaviour, with emphasis on their porosity, their karstification, their permeability, and their ability to function as aquifers. Based on these characteristics of the geological formations, it was found that most EQHAs have been recorded in permeable formations (Figure 23a). The first category includes porous and karstic formations, with 48 (38.4%) and 44 (35.2%) geographically identified EQHAs, respectively, followed by impermeable formations with 33 (26.4%) EQHAs (Figure 23a).
The porous formations, especially the granular alluvial deposits, are traversed by large rivers and streams that feed the unconfined aquifers. These deposits mainly develop along the beds of rivers and streams. The karstic formations, particularly the extensively developed and highly permeable limestones and marbles, generally exhibit intense karstification due to chemical weathering. Their typically large surface extent, intense tectonic deformation, lithological composition, and stratigraphic structure contribute to the development of fracture porosity and discontinuities (secondary porosity), resulting in permeability that ranges from moderate to high. Their surface spread favours the formation of extensive karst systems. Depending on the tectonic structure of the karst systems, distinct hydrogeological units are formed, which may discharge at different levels into inland basins (overflow springs) or coastal and offshore areas with corresponding springs.
Limestones and marbles of limited extent with variable permeability exhibit moderate karstification due to chemical weathering, which is restricted by the intercalation of semi-permeable and impermeable formations. As a result, groundwater flow is limited, on the one hand by the presence of impermeable formations, and on the other by major tectonic structures (faults, thrusts, etc.). A characteristic feature of these areas is the development of elongated basins with the presence of multiple contact springs at various elevations, as well as the formation of confined aquifers due to their tectonic structure.
Based on the individual hydrolithological properties and formation categories of karstic, porous, and impermeable formations, the following can be concluded (Figure 23b):
  • Karstic limestones and marbles with a large extent and moderate to high permeability host the majority of geographically identified EQHAs (38, 30.4%). This indicates that karstic formations are particularly susceptible to EQHAs, likely due to their complex flow networks and their sensitivity to seismic shaking and hydraulic disturbances.
  • The porous formations, particularly the granular alluvial deposits with variable permeability, as well as the non-alluvial deposits with low to very low permeability, account for 28 (%) and 20 (%) EQHAs, respectively.
  • This approach reveals that even impermeable formations can exhibit EQHAs. Specifically, marble and flysch or flysch-type deposits have shown 17 (13.6%) and 10 (8%) EQHAs, respectively, with plutonic and volcanic rocks following with 6 (4.8%) EQHAs. This phenomenon is attributed to the following factors:
    In the flysch formation, sandstones and conglomerates locally predominate, resulting in the formation exhibiting low to moderate permeability and the development of small-scale aquifers.
    In metamorphic rocks, particularly within the upper part of the impermeable formations, limestones and marbles are locally interbedded, where karst aquifers often develop.
    In plutonic and volcanic rocks, zones of intense fracturing develop locally, resulting in permeability ranging from low to moderate, and allowing the formation of local aquifers that can be affected during strong seismic events, leading to the generation of hydrogeological anomalies.

4.12. Maximum Epicentral Distances of EQHAs

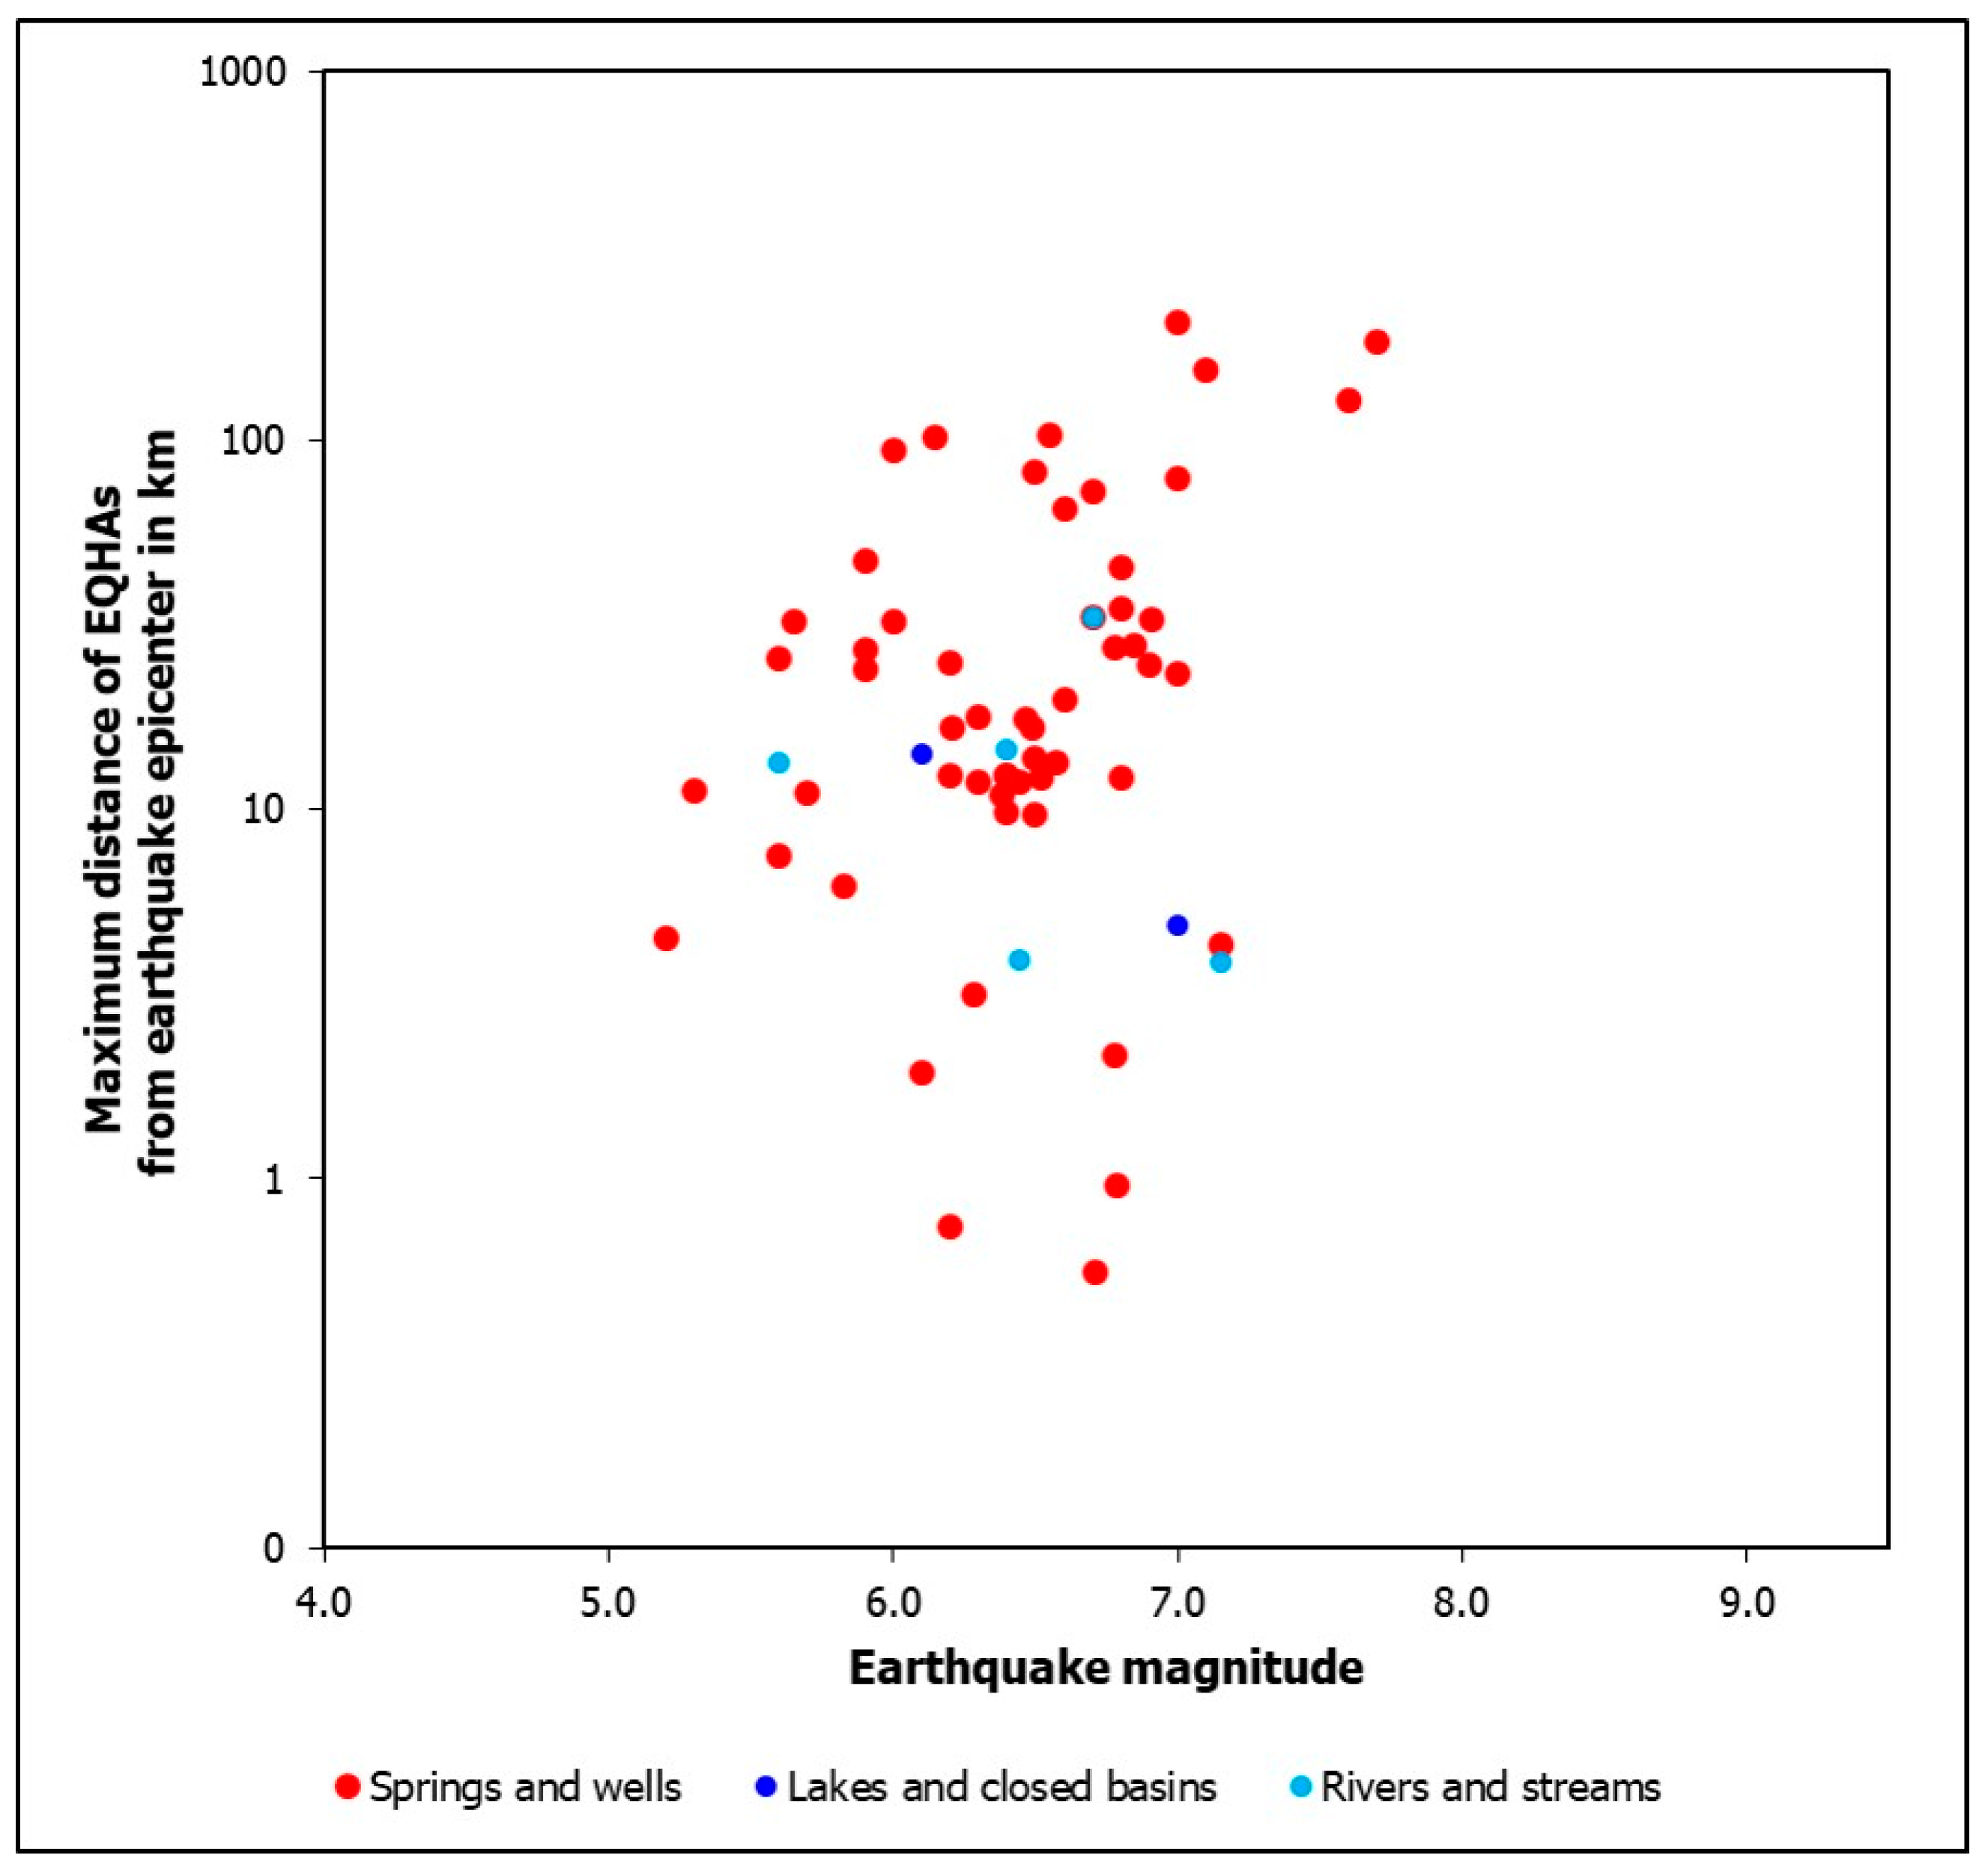
The epicentral distances of the EQHAs in Greece were determined using the EQHA locations identified in the present study and the earthquake magnitudes from the previously mentioned catalogues. For each earthquake, the maximum epicentral distance of hydrogeological anomalies was then recorded. These maximum distances were then plotted against the moment magnitude (Mw) of the causative earthquakes in Figure 24.
Regarding springs and wells, although a general trend of increasing maximum distance with increasing magnitude is evident, the data show substantial scatter (Figure 24), highlighting the influence of site-specific conditions. For instance, large earthquakes such as the 26 June 1926 Mw = 7.0 Rhodes (Dodecanese Island complex) and the 11 August 1903 Mw = 7.6 Kythera earthquakes induced hydrogeological anomalies at considerable distances of ~208 km and ~128 km, respectively, supporting the presence of long-range hydrogeological responses. Similarly, the 18 March 1953 Mw = 7.1 Lesvos earthquake generated hydrogeological anomalies up to ~156 km from the epicentre. However, several moderate and strong events with magnitudes ranging from Mw = 5.6 to Mw = 6.5 also present large epicentral distances, including the 5 February 1966 Mw = 6.0 Kremasta (Central Greece) and the 13 May 1895 Mw = 6.15 Margariti (Epirus) earthquakes, with anomalies recorded at epicentral distances of about 94 km and 102 km, respectively. Conversely, some strong and major events, such as the 18 August 1853 Mw = 6.71 Thiva (Central Greece) and the 4 February 1867 Mw = 7.15 Cephalonia (central Ionian Islands) earthquakes resulted in anomalies at distances of only about 0.6 km and 4.3 km, respectively. This variability suggests that factors other than earthquake magnitude exert significant control over the spatial extent of hydrogeological responses. Notably, EQHAs at considerable distances during moderate earthquakes indicate the high sensitivity of groundwater systems.
Regarding lakes and closed basins, it is also concluded that factors beyond earthquake magnitude may exert strong control on the spatial manifestation of hydrogeological responses. Despite its higher magnitude, the 12 August 1953 Mw = 7.0 Cephalonia earthquake produced anomalies at a maximum epicentral distance of only ~4.89 km, whereas the smaller 2014 Cephalonia event generated anomalies up to ~14.12 km away.
As far as rivers and streams are concerned, the dataset reveals notable variability in the relationship between earthquake magnitude and the maximum epicentral distance at which hydrogeological anomalies in rivers and streams were observed (Figure 24). For instance, the 4 February 1867 Mw = 7.15 Cephalonia earthquake induced anomalies at a distance of only 3.85 km, while the 5 July 1902 Mw = 6.4 Thessaloniki earthquake led to observations as far as 14.52 km from the epicentre. Similarly, the lower-magnitude 30 May 1909 Mw = 5.6 Chavari (northwestern Peloponnese) earthquake induced anomalies up to ~13.44 km away, surpassing those of much larger events. These examples suggest that while a general trend of increasing potential influence with magnitude is present, the actual epicentral distances of observed anomalies are highly variable. This scatter reflects the strong influence of site-specific factors. Notably, the 1840 Zakynthos (Mw = 6.44) and 1867 Cephalonia (Mw = 7.15) earthquakes both show anomalously short distances (~3.9 km), indicating that either anomalies were restricted to areas close to the epicentre or that observations at greater distances were not recorded. Overall, these results underscore that while earthquake magnitude provides a useful first-order control on the potential reach of hydrogeological effects, it is not the sole determinant, and local geological and hydrogeological settings play a critical role in modulating the spatial extent of seismic responses.

4.13. Impact of EQHAs on the Built and Natural Environment and the Local Population

EQHAs are not only of academic significance but also hold practical implications. For instance, post-seismic fluctuations in groundwater levels can influence water availability [128]. In certain cases, it becomes necessary to assess whether an earthquake contributed to water supply disruptions in the context of insurance claims [129]. Additionally, earthquake-driven rises in groundwater levels may trigger flooding [130] and pose hazards to underground waste storage facilities [129,131].
In Greece, EQHAs typically do not result in direct impacts on the population, such as fatalities or injuries, unlike other secondary effects, such as the earthquake-triggered landslides [42]. However, EQHAs often disturb the balance of the hydrogeological systems, affecting both the quality and quantity of available water resources. These disruptions can have significant consequences for human health, public water supply, agriculture, and the natural environment. In particular, they have the potential to cause indirect impacts on the local population through cases, outbreaks and epidemics of infectious diseases [132]. Such outcomes are primarily linked to the degradation of water supply infrastructure and reduced access to clean water, as will be illustrated through specific examples from Greece. These effects of hydrogeological anomalies can be divided into the following categories: (i) destruction or contamination of water supply sources and networks; (ii) drying up of springs and wells; (iii) well overflows and artesian phenomena; (iv) river diversions and subsequent flooding events; (v) water turbidity and unpleasant odours.
The most common and directly damaging category of EQHAs involves the destruction of water supply infrastructure and the deterioration of water quality due to the influx of turbidity or contaminated liquids. Notable examples come from the central Ionian Islands during the destructive earthquake sequence of August 1953. In the town of Vathi on Ithaki Island, the largest foreshock on 11 August damaged the aqueduct and compromised the purity of local wells, resulting in a shortage of drinking water. In response, health authorities implemented a general vaccination campaign against typhoid fever and regularly disinfected aqueducts and wells using calcium hypochlorite [52]. In the towns of Lixouri and Argostoli of Cephalonia Island, the main shock on 12 August caused wells to become highly turbid or collapse due to the failure of nearby structures. This led to urgent water supply issues, prompting immediate intervention by public health services [52]. The problem was temporarily mitigated by repurposing open wells originally intended for agricultural use, though this posed a significant risk of waterborne and gastrointestinal diseases. Disaster response personnel of the time addressed the issue by distributing disinfection tablets and chlorination sachets for water treatment in the affected areas [52]. Similar conditions were documented in Messene town (SW Peloponnese) following the 1846 earthquake, where the rising water table led to contamination of wells and the outbreak of epidemics [58,64].
Such public health impacts continue to occur today, particularly when earthquakes with large magnitude and high intensity induced hydrogeological anomalies with impact on water bodies damage critical infrastructure, including water supply systems. These disruptions can hinder access to safe water, sanitation, and hygiene services, which are factors essential for preventing disease outbreaks and protecting public health in disaster-affected areas [132].
The disappearance or reduction in spring and well water supply is linked to changes in groundwater flow and can have significant impacts on the earthquake-affected local population. In Antipata village on Cephalonia, wells up to 5 m deep were completely drained following the 12 August 1953 main shock, resulting in a shortage of drinking water [52]. Similar incidents have been documented as early as the 19th century, for example, in Elis (NW Peloponnese) in 1820, where springs vanished and wells emptied immediately after the earthquake, causing serious disruption to local water supply [60]. Comparable effects continue to be observed even after recent seismic events. A characteristic case occurred in Skyros Island (Northern Sporades island complex) following the 2001 earthquake, when a spring vital to the island’s water supply dried up, leading to a severe water shortage [62].
The sudden appearance or outflow of water, often manifested through artesian flows, can lead to flooding or damage to water intake structures such as wells and boreholes. During the 1805 Athens earthquake, the Ilisos River turned into a raging torrent, inundating nearby areas [60]. In 1820, the Alfios River overflowed, drowning flocks of sheep and sweeping away houses and people [64]. Following the 12 August 1953 earthquake, the Acheloos River in Aetoloakarnania temporarily altered its course, resulting in the flooding of adjacent rice and vegetable crops [52]. During the 2008 earthquake in NW Peloponnese, artesian phenomena and uncontrolled outflows damaged borehole seals in the affected area [47].
The presence of turbid or malodorous water typically indicates chemical or microbiological alterations within the hydrogeological system. During the 9 October 1984 earthquake in Pelekanada (Messinia, SW Peloponnese), pronounced turbidity was observed in the area’s primary water source, raising significant concern among local residents [72]. Similarly, in Arcadia (central Peloponnese) in 1820, lakes were reported to flood with malodorous water, and subsequent fumes were believed to have triggered epidemics affecting both humans and animals [60].

5. Discussion

The current study focuses on the collection and assessment of data concerning co- and post-seismic EQHAs in Greece, spanning from ancient times to the present, relying solely on existing published scientific sources. This strategy enabled an in-depth analysis based on the available scientific literature, highlighting multiple qualitative, quantitative, and spatial characteristics of these earthquake-induced phenomena in Greece.
The results of the present study include a wide range of phenomena, comprising mainly qualitative observations and related information. In contrast, the contribution by Wang and Manga [2] places greater emphasis on quantitatively measurable changes, such as groundwater level fluctuations, changes in stream flow, liquefaction phenomena, changes in groundwater temperature, changes in groundwater composition, and the reaction of volcanic or geothermal systems such as mud volcanoes and geysers. This difference does not necessarily indicate a different nature of the phenomena, but more likely differences in approach, intensity of observation, and availability of quantitative and measurable data with permanent recording networks over long periods of time.
Many studies have used diverse sources such as archival documents, ancient writings, press reports, maps, and guides. Yet, newspapers, especially local ones, remain underused despite their valuable insights into destructive events [52,55]. Recent research shows their importance in reconstructing seismic events and identifying related anomalies. Historical data are increasingly recognized for improving geohazard assessments and risk reduction [133,134]. Still, their limitations require careful evaluation, and future studies should systematically integrate such sources [135,136,137].
The study of EQHAs is essential for comprehensive seismic hazard and risk assessment, as these phenomena represent critical geohazards. Mapping anomalies, documenting their qualitative and quantitative characteristics, identifying their types, and analyzing their mechanisms and controlling factors enhance understanding of aquifer behaviour under seismic stress. Earthquakes can modify aquifer permeability and connectivity, while monitoring anomalies provides insight into recharge and discharge processes. Sudden physical or chemical changes may serve as early warning signals of contamination, enabling timely measures to protect water quality and ensure supply security.
Systematic documentation and mapping of EQHAs also reveal vulnerable zones, guiding targeted monitoring and preparedness strategies. Knowledge of typical hydrogeological responses facilitates rapid evaluation of co- and post-seismic impacts on springs, boreholes, and networks, supporting effective water resource management. Integrating these data into long-term risk reduction and policy frameworks not only improves hazard mitigation but also strengthens the sustainable management of water resources, thereby increasing community resilience in seismically active regions.
It is significant to note that the available scientific sources used to detect data of EQHAs in Greece lack sufficient interpretative analysis. Although their occurrence during or after seismic shaking suggests a causal link, the underlying mechanisms, triggering factors, spatial correlations, and long-term evolution remain poorly described and analyzed. This absence of a systematic explanatory framework limits the ability to assess aquifer behaviour under seismic stress and constrains correlations with controlling factors, a shortcoming particularly evident in the national context. By contrast, numerous international studies have investigated earthquake-induced anomalies, offering valuable methodological approaches and interpretative insights. To advance understanding, it is essential to systematically incorporate this international knowledge, thereby strengthening the interpretation and evaluation of hydrogeological anomalies in seismic hazard research.
Based on the findings of the present study the EQHAs in Greece, as well as the results of previous research on other categories of secondary EEEs [42], it is observed that EQHAs in Greece are significantly fewer. This can be attributed to a combination of natural, geological, hydrogeological, and methodological factors. Firstly, Greece features rugged terrain, deformed and weathered geological formations, and steep slopes of tectonic origin, among other properties that make it particularly prone to landslide phenomena. Landslides are triggered directly by seismic shaking and do not require specific conditions to occur, unlike hydrogeological anomalies, which appear only when particular geological structures are present, such as aquifers, karstic formations, or intensely fractured zones. Secondly, many anomalies, including minor changes in spring flow or groundwater quality, may go unnoticed in isolated or unmonitored areas due to the lack of monitoring stations. This highlights the need for systematic networks designed with dense coverage in historically and recently affected regions (Peloponnese, Ionian Islands, Central Greece, North Aegean) and dispersed coverage in less affected ones (Western Greece, South Aegean, Central Macedonia). Such an integrated strategy enables timely detection of anomalies, supports risk assessment and emergency management, ensures preventive coverage, facilitates comparative analysis across diverse geological contexts, and strengthens predictive models, thereby improving both scientific documentation and civil protection at the national scale.

6. Conclusions

In Greece, EQHAs are mainly associated with strong earthquakes (Mw = 6.0–7.0), particularly at seismic intensities of IX or higher, though modern observations now detect them even at lower intensities. They are widespread across the country except Western Macedonia, with highest frequencies in the Peloponnese and Ionian Islands, followed by Central Greece and the North Aegean, reflecting dense faulting and frequent strong earthquakes. Seismic intensity is a stronger predictor than magnitude. Six EQHA types are recognized, with hydraulic variations most common. About 77% of earthquakes produced only one or two types, while strong historical events (Mw = 6.0–7.0) generated the widest variety, underscoring the role of local geological, hydrological, and tectonic conditions. Groundwater systems, especially springs and wells, are most sensitive, while rarer phenomena like sinkholes or lake formation can cause severe localized effects.
Temporally, historical events (1820–1870) showed complex EQHA responses, while after 1900 two phases emerge: multiple types until the late 1950s, then mostly one or two per event, a trend attributed to monitoring limitations rather than reduced activity. Duration data are scarce, missing for over 70% of cases, but when available, anomalies often persisted beyond 24 h. Spatially, most anomalies were precisely located, with historical and recent earthquakes yielding comparable numbers despite fewer modern events, reflecting improved detection and human interventions in hydrological systems. Within RBDs, EQHAs cluster in the Peloponnese, Central Greece, and Aegean Islands, affecting mainly springs and wells (81%), though rivers and lakes also respond under specific conditions. Most occur in the second seismic hazard zone (74%), concentrated in karstic and porous formations but also present in impermeable settings with fracturing. Larger earthquakes produce anomalies at greater distances, exceeding 100 km, with local geology strongly modulating reach. While rarely causing casualties, EQHAs can damage water infrastructure, reduce supply, contaminate sources, and trigger flooding or disease outbreaks. Systematic monitoring and documentation are therefore essential for understanding aquifer behaviour under seismic stress, detecting issues with water quality, identifying vulnerable zones, and improving preparedness and post-earthquake water resource management.

Author Contributions

Conceptualization, S.M.; methodology, S.M.; software, S.M. and A.S.; validation, S.M. and A.S.; formal analysis, S.M. and A.S.; investigation, S.M., A.S. and E.L.; resources, E.L.; data curation, S.M. and A.S.; writing—original draft preparation, S.M.; writing—review and editing, S.M. and A.S.; visualization, S.M. and A.S.; supervision, S.M. and E.L.; project administration, S.M.; funding acquisition, E.L. All authors have read and agreed to the published version of the manuscript.

Funding

This research received no external funding.

Data Availability Statement

The original contributions presented in this study are included in the article. Further inquiries can be directed to the corresponding author.

Acknowledgments

Three anonymous reviewers and the Assistant Editor are acknowledged for their constructive comments that helped improve the clarity, the scientific soundness, and the overall merit of this work.

Conflicts of Interest

The authors declare no conflicts of interest.

References

  1. Michetti, A.M.; Esposito, E.; Guerrieri, L.; Porfido, S.; Serva, L.; Tatevossian, R.; Vittori, E.; Audemard, F.; Azuma, T.; Clague, J.; et al. Environmental Seismic Intensity Scale 2007—ESI. Mem. Descr. Carta Geol. Ital. 2007, 74, 7–54. [Google Scholar]
  2. Wang, C.-Y.; Manga, M. Earthquakes and Water. In Encyclopedia of Complexity and Systems Science; Meyers, R., Ed.; Springer: New York, NY, USA, 2014. [Google Scholar] [CrossRef]
  3. Koizumi, N.; Minote, S.; Tanaka, T.; Mori, A.; Ajiki, T.; Sato, T.; Takahashi, H.A.; Matsumoto, N. Hydrological changes after the 2016 Kumamoto earthquake, Japan. Earth Planets Space 2019, 71, 128. [Google Scholar] [CrossRef]
  4. Charmoille, A.; Fabbri, O.; Mudry, J.; Guglielmi, Y.; Bertand, C. Post-seismic permeability change in a shallow fractured aquifer following a M-L 5.1 earthquake (Fourbanne karst aquifer, Jura outermost thrust unit, eastern France). Geophys. Res. Lett. 2005, 32, L18406. [Google Scholar] [CrossRef]
  5. Sanz de Ojeda, A.; Alhama, I.; Sanz, E. Aquifer sensitivity to earthquakes: The 1755 Lisbon earthquake. J. Geophys. Res. Solid Earth 2019, 124, 8844–8866. [Google Scholar] [CrossRef]
  6. Sato, T.; Kazahaya, K.; Matsumoto, N.; Takahashi, M. Deep groundwater discharge after the 2011 Mw 6.6 Iwaki earthquake, Japan. Earth Planets Space 2020, 72, 54. [Google Scholar] [CrossRef]
  7. Gori, F.; Barberio, M.D. Hydrogeochemical changes before and during the 2019 Benevento seismic swarm in central–southern Italy. J. Hydrol. 2022, 604, 127250. [Google Scholar] [CrossRef]
  8. Chen, Y.; Liu, J. Groundwater trace element changes were probably induced by the ML 3.3 earthquake in Chaoyang district, Beijing. Front. Earth Sci. 2023, 11, 1260559. [Google Scholar] [CrossRef]
  9. Akita, F.; Matsumoto, N. Hydrological responses induced by the Tokachi-oki earthquake in 2003 at hot spring wells in Hokkaido, Japan. Geophys. Res. Lett. 2004, 31, L16603. [Google Scholar] [CrossRef]
  10. Yaltirak, C.; Yalçin, T.; Bozkurtoğlu, E.; Yüce, G. Water-level changes in shallow wells before and after the 1999 İzmit and Düzce earthquakes and comparison with long-term water-level observations (1999–2004), NW Turkey. Turk. J. Earth Sci. 2005, 14, 281–309. [Google Scholar]
  11. Malakootian, M.; Nouri, J. Chemical Variations of Ground Water Affected by the Earthquake in Bam Region. Int. J. Environ. Res. 2010, 4, 443–454. [Google Scholar]
  12. Shi, Z.; Wang, G.; Liu, C. Co-seismic groundwater level changes induced by the May 12, 2008 Wenchuan earthquake in the near field. Pure Appl. Geophys. 2013, 170, 1773–1783. [Google Scholar] [CrossRef]
  13. Sun, X.; Wang, G.; Yang, X. Coseismic response of water level in Changping well, China, to the Mw 9.0 Tohoku earthquake. J. Hydrol. 2015, 531, 1028–1039. [Google Scholar] [CrossRef]
  14. Shibata, T.; Takahashi, R.; Takahashi, H.; Kagoshima, T.; Takahata, N.; Sano, Y.; Pinti, D.L. Coseismic changes in groundwater level during the 2018 Hokkaido Eastern Iburi earthquake. Earth Planets Space 2020, 72, 23. [Google Scholar] [CrossRef]
  15. Huang, X.; Zhang, Y. Various far-field hydrological responses during 2015 Gorkha earthquake at two distant wells. Earth Planets Space 2021, 73, 119. [Google Scholar] [CrossRef]
  16. Lan, S.-S.; Gu, H.-B.; Liu, Y. Changes in groundwater level and tidal response caused by the Wenchuan earthquake, China. Hydrogeol. J. 2021, 29, 1329–1341. [Google Scholar] [CrossRef]
  17. Uzelli, T.; Bilgiç, E.; Öztürk, B.; Baba, A.; Sözbilir, H.; Tatar, O. Effects of seismic activity on groundwater level and geothermal systems in İzmir, Western Anatolia, Turkey: The case study from October 30, 2020 Samos Earthquake. Turk. J. Earth Sci. 2021, 30, 758–778. [Google Scholar] [CrossRef]
  18. Cox, S.C.; Rutter, H.K.; Sims, A.; Manga, M.; Weir, J.J.; Ezzy, T.; White, P.A.; Horton, T.W.; Scott, D. Hydrological effects of the Mw 7.1 Darfield (Canterbury) earthquake, 4 September 2010, New Zealand. N. Z. J. Geol. Geophys. 2012, 55, 231–247. [Google Scholar] [CrossRef]
  19. Roeloffs, E.; Sneed, M.; Galloway, D.L.; Sorey, M.L.; Farrar, C.D.; Howle, J.F.; Hughes, J. Water-level changes induced by local and distant earthquakes at Long Valley caldera, California. J. Volcanol. Geotherm. Res. 2003, 127, 269–303. [Google Scholar] [CrossRef]
  20. Lin, Y.-Y.; Wang, S.-J.; Lai, W.-C. The research of Meinong earthquake induced hydrological anomalies and increased vertical permeability in southwestern Taiwan. In Proceedings of the EGU General Assembly 2020, Online, 4–8 May 2020. [Google Scholar] [CrossRef]
  21. Mavroulis, S.; Triantafyllou, I.; Karavias, A.; Gogou, M.; Katsetsiadou, K.-N.; Lekkas, E.; Papadopoulos, G.A.; Parcharidis, I. Primary and secondary environmental effects triggered by the 30 October 2020, Mw = 7.0, Samos (Eastern Aegean Sea, Greece) earthquake based on post-event field surveys and InSAR analysis. Appl. Sci. 2021, 11, 3281. [Google Scholar] [CrossRef]
  22. Muir-Wood, R.; King, G.C.P. Hydrological signatures of earthquake strain. J. Geophys. Res. Solid Earth 1993, 98, 22035–22068. [Google Scholar] [CrossRef]
  23. Ma, Y.; Wang, G.; Sun, Z.; Yu, R.; Yu, H. Groundwater level and temperature changes following the great Tangshan earthquake of 1976 near the epicenter. Geomat. Nat. Hazards Risk 2023, 14, 2197103. [Google Scholar] [CrossRef]
  24. Yang, P.; Sun, X.; Liu, D.; He, Z.; Li, Y. Hydrochemical Characteristics of Groundwater at the Epicenter of the 2021 Biru M6.1 Earthquake in Central Tibet. Water 2021, 13, 3111. [Google Scholar] [CrossRef]
  25. Kim, J.; Joun, W.-T.; Lee, S.; Kaown, D.; Lee, K.-K. Hydrogeochemical evidence of earthquake-induced anomalies in response to the 2017 MW 5.5 Pohang earthquake in Korea. Geochem. Geophys. Geosyst. 2020, 21, e2020GC009532. [Google Scholar] [CrossRef]
  26. Wakita, H. Water wells as possible indicators of tectonic strain. Science 1975, 189, 553–555. [Google Scholar] [CrossRef]
  27. Rojstaczer, S.; Wolf, S.; Michel, R. Permeability enhancement in the shallow crust as a cause of earthquake-induced hydrological changes. Nature 1995, 373, 237–239. [Google Scholar] [CrossRef]
  28. Wang, C.-Y.; Wang, C.-H.; Manga, M. Coseismic release of water from mountains: Evidence from the 1999 (Mw 7.5) Chi-Chi earthquake. Geology 2004, 32, 769–772. [Google Scholar] [CrossRef]
  29. Elkhoury, J.E.; Brodsky, E.E.; Agnew, D.C. Seismic waves increase permeability. Nature 2006, 411, 1135–1138. [Google Scholar] [CrossRef] [PubMed]
  30. Kinoshita, C.; Kano, Y.; Ito, H. Shallow crustal permeability enhancement in central Japan due to the 2011 Tohoku earthquake. Geophys. Res. Lett. 2015, 42, 773–780. [Google Scholar] [CrossRef]
  31. Sibson, R.H.; Rowland, J.V. Stress, fluid pressure and structural permeability in seismogenic crust, North Island, New Zealand. Geophys. J. Int. 2003, 154, 584–594. [Google Scholar] [CrossRef]
  32. Matsumoto, N.; Roeloffs, E.A. Hydrological response to earthquakes in the Haibara well, central Japan—II. Possible mechanism inferred from time-varying hydraulic properties. Geophys. J. Int. 2003, 155, 899–913. [Google Scholar] [CrossRef]
  33. Waller, R.M. Effects of the March 1964 Alaska Earthquake on the Hydrology of the Anchorage Area, Alaska; Professional Paper 544-B; U.S. Geological Survey; U.S. Government Printing Office: Washington, DC, USA, 1966. [Google Scholar] [CrossRef]
  34. Rojstaczer, S.; Wolf, S. Permeability changes associated with large earthquakes: An example from Loma Prieta, California. Geology 1992, 20, 211–214. [Google Scholar] [CrossRef]
  35. Koizumi, N.; Kano, Y.; Kitagawa, Y.; Sato, T.; Takahashi, M.; Nishimura, S.; Nishida, R. Groundwater anomalies associated with the 1995 Hyogo-ken Nanbu earthquake. J. Phys. Earth 1996, 44, 373–380. [Google Scholar] [CrossRef]
  36. Esposito, E.; Pece, R.; Porfido, S.; Tranfaglia, G. Hydrological anomalies connected to earthquakes in southern Apennines (Italy). Nat. Hazards Earth Syst. Sci. 2001, 1, 137–144. [Google Scholar] [CrossRef]
  37. Esposito, E.; Pece, R.; Porfido, S.; Tranfaglia, G. Ground Effects and Hydrological Changes in the Southern Apennines (Italy) in Response to the 23 July 1930 Earthquake (MS = 6.7). Nat. Hazards Earth Syst. Sci. 2009, 9, 539–550. [Google Scholar] [CrossRef]
  38. Zhou, B.; Liu, Q.; Chen, S.; Yang, Z. Well water temperature responses to earthquakes: Single- and double-aquifer models. Geophys. J. Int. 2025, 241, 1698–1711. [Google Scholar] [CrossRef]
  39. Koumantakis, I.; Mimidis, T.; Stavropoulou, X. Hydrogeological investigation within the framework of the microzoning study of Kalamata. Bull. Geol. Soc. Greece 1989, 23, 297–318. [Google Scholar]
  40. Fountoulis, I.G.; Mavroulis, S.D. Application of the Environmental Seismic Intensity scale (ESI 2007) and the European Macroseismic Scale (EMS-98) to the Kalamata (SW Peloponnese, Greece) earthquake (Ms = 6.2, September 13, 1986) and correlation with neotectonic structures and active faults. Ann. Geophys. 2013, 56, S0675. [Google Scholar] [CrossRef]
  41. Tsermegas, I. The Effects of Earthquakes on the Natural Environment in Greece. Misc. Geogr. 1998, 8, 67–76. [Google Scholar] [CrossRef]
  42. Mavroulis, S.; Sarantopoulou, A.; Lekkas, E. Earthquake-Triggered Landslides in Greece from Antiquity to the Present: Temporal, Spatial and Statistical GIS-Based Analysis. Land 2025, 14, 307. [Google Scholar] [CrossRef]
  43. Papastamatiou, D.; Mouyaris, N. The earthquake of April 30, 1954, in Sophades (Central Greece). Geophys. J. Int. 1986, 87, 885–895. [Google Scholar] [CrossRef]
  44. Ambraseys, N.N.; Jackson, J. Seismicity and associated strain of central Greece between 1890 and 1988. Geophys. J. Int. 1990, 101, 663–708. [Google Scholar] [CrossRef]
  45. Lekkas, E.; Kolyva, M.; Antonopoulos, G.; Kopanas, I. The earthquakes of Zakynthos. An interpretation of the descriptions of earthquakes and correlation with the existing geological structure. Ann. Geol. Pays Hell. 1997, 1, 1033–1073. [Google Scholar]
  46. Ambraseys, N.N.; Jackson, J.A. Seismicity and Strain in the Gulf of Corinth (Greece) since 1694. J. Earthq. Eng. 1997, 1, 433–474. [Google Scholar] [CrossRef]
  47. Mavroulis, S.D.; Fountoulis, I.G.; Skourtsos, E.N.; Lekkas, E.L.; Papanikolaou, I.D. Seismic intensity assignments for the 2008 Andravida (NW Peloponnese, Greece) strike-slip event (June 8, Mw = 6.4) based on the application of the Environmental Seismic Intensity scale (ESI 2007) and the European Macroseismic scale (EMS-98). Geological structure, active tectonics, earthquake environmental effects and damage pattern. Ann. Geophys. 2013, 56, S0681. [Google Scholar] [CrossRef]
  48. Lekkas, E.L.; Mavroulis, S.D. Earthquake environmental effects and ESI 2007 seismic intensities of the early 2014 Cephalonia (Ionian Sea, Western Greece) earthquakes (January 26 and February 3, Mw 6.0). Nat. Hazards 2015, 78, 1517–1544. [Google Scholar] [CrossRef]
  49. Lekkas, E.L.; Mavroulis, S.D. Fault zones ruptured during the early 2014 Cephalonia Island (Ionian Sea, Western Greece) earthquakes (January 26 and February 3, Mw 6.0) based on the associated co-seismic surface ruptures. J. Seismol. 2016, 20, 63–78. [Google Scholar] [CrossRef]
  50. Mavroulis, S.; Stanota, E.-S.; Lekkas, E. Evaluation of environmental seismic intensities of all known historical and recent earthquakes felt in Zakynthos Island, Greece using the Environmental Seismic Intensity (ESI 2007) scale. Quat. Int. 2019, 532, 1–22. [Google Scholar] [CrossRef]
  51. Triantafyllou, I.; Papadopoulos, G.A.; Lekkas, E. Impact on built and natural environment of the strong earthquakes of 23 April 1933, and 20 July 2017, in the southeast Aegean Sea, eastern Mediterranean. Nat. Hazards 2020, 100, 671–695. [Google Scholar] [CrossRef]
  52. Mavroulis, S.; Lekkas, E. Revisiting the Most Destructive Earthquake Sequence in the Recent History of Greece: Environmental Effects Induced by the 9, 11 and 12 August 1953 Ionian Sea Earthquakes. Appl. Sci. 2021, 11, 8429. [Google Scholar] [CrossRef]
  53. Mavroulis, S.; Mavrouli, M.; Lekkas, E. Geological and hydrometeorological hazards and related disasters amid COVID-19 pandemic in Greece: Post-disaster trends and factors affecting the COVID-19 evolution in affected areas. Saf. Sci. 2021, 138, 105236. [Google Scholar] [CrossRef] [PubMed]
  54. Triantafyllou, I.; Koukouvelas, I.; Papadopoulos, G.A.; Lekkas, E. A Reappraisal of the Destructive Earthquake (Mw 5.9) of 15 July 1909 in Western Greece. Geosciences 2022, 12, 374. [Google Scholar] [CrossRef]
  55. Mavroulis, S.; Mavrouli, M.; Lekkas, E.; Carydis, P. Reconstructing Impact of the 1867 Ionian Sea (Western Greece) Earthquake by Focusing on New Contemporary and Modern Sources for Building Damage, Environmental and Health Effects. Geosciences 2024, 14, 214. [Google Scholar] [CrossRef]
  56. Papanikolaou, D.; Lekkas, E.; Syskakis, D.; Adamopoulou, E. Correlation on neotectonic structures with the geodynamic activity in Milos during the earthquakes of March 1992. Bull. Geol. Soc. Greece 1993, 28, 413–428. [Google Scholar]
  57. Pavlides, S.; Valkaniotis, S.; Papathanassiou, G.; Sboras, S.; Chatzipetros, A. Surface effects of the strong June 8, 2008, NW Peloponnese earthquake. In Proceedings of the 3rd National Conference on Earthquake Engineering and Engineering Seismology, Athens, Greece, 5–7 November 2008. (In Greek with English abstract). [Google Scholar]
  58. Mavroulis, S.; Lekkas, E. Evaluation of seismic intensities of historical earthquakes in the southern and southwestern Peloponnese (Greece) based on the Environmental Seismic Intensity (ESI 2007) scale. In Proceedings of the 9th International INQUA Meeting on Paleoseismology, Active Tectonics and Archeoseismology (PATA), Possidi, Greece, 25–27 June 2018. [Google Scholar]
  59. Guidoboni, E.; Comastri, A.; Traina, G. Catalogue of Ancient Earthquakes in the Mediterranean Area up to the 10th Century; INGV-SGA: Bologna, Italy, 1994. [Google Scholar]
  60. Spyropoulos, P. Chronicle of the Earthquakes of Greece, from Antiquity to Present; Dodoni Publications: Athens, Greece, 1997; p. 456. (In Greek) [Google Scholar]
  61. Choutzaios, G.M. Contribution to the Study of the Seismicity of the Island of Lesvos and the Surrounding Area (Chios-Lemnos-Agios Efstratios-Psara-Antipsara-Oinuses); Publications of the Prefectural Government of Lesvos: Mytilini, Greece, 1998. (In Greek) [Google Scholar]
  62. Papazachos, B.; Papazachou, K. The Earthquakes of Greece; Ziti Publications: Thessaloniki, Greece, 2003; p. 286. [Google Scholar]
  63. Guidoboni, E.; Comastri, A. Catalogue of Earthquakes and Tsunamis in the Mediterranean Area from the 11th to the 15th Century; INGV-SGA: Bologna, Italy, 2005; p. 1037. [Google Scholar]
  64. Ambraseys, N. Earthquakes in the Mediterranean and Middle East, a Multidisciplinary Study of Seismicity Up to 1900; Cambridge University Press: Cambridge, UK, 2009; p. 970. [Google Scholar]
  65. Papadopoulos, G.A. A Seismic History of Crete—The Hellenic Arc and Trench—Earthquakes and Tsunamis: 2000 BC–2011 AD; Oselotos Publications: Athens, Greece, 2011; p. 416. [Google Scholar]
  66. Papadopoulos, G.A. Kythera—The Earthquake and Tsunamis from Antiquity to Present; Oselotos Publications: Athens, Greece, 2013; p. 106. (In Greek) [Google Scholar]
  67. Papadopoulos, G.A. The Earthquake Log of Creta by Pavlos Vlastos. 464 BC–1926 AD; Oselotos Publications: Athens, Greece, 2013; p. 204. (In Greek) [Google Scholar]
  68. Papadopoulos, G. Rhodes—The Earthquake and Tsunamis from Antiquity to Present; Oselotos Publications: Athens, Greece, 2014; p. 224. (In Greek) [Google Scholar]
  69. Papadopoulos, G. Lesvos—Chios—Psara. The Earthquake and Tsunamis from Antiquity to Present; Oselotos Publications: Athens, Greece, 2015; p. 244. (In Greek) [Google Scholar]
  70. Soloviev, S.L.; Solovieva, O.N.; Go, C.N.; Kim, K.S.; Shchetnikov, N.A. Tsunamis in the Mediterranean Sea 2000 B.C.-2000 A.D.; Springer Science & Business Media: Dordrecht, The Netherlands, 2000; p. 256. [Google Scholar]
  71. Taxeidis, K. Study of Historical Seismicity of the Eastern Aegean Islands. Ph.D. Thesis, National and Kapodistrian University of Athens, Athens, Greece, 2003. Available online: http://macroseismology.geol.uoa.gr/studies/TAXE003.pdf (accessed on 20 August 2024).
  72. Mavroulis, S. Environmental Effects and Evaluation of Environmental Intensities of Historic and Recent Earthquakes in Western Greece (Western Peloponnese and Central Ionian Islands) and Correlation with Active Tectonics and Seismological Parameters. Ph.D. Thesis, National and Kapodistrian University of Athens, Athens, Greece, 2020; p. 876. [Google Scholar]
  73. Schmidt, J. Studien über Erdbeben; Alwin Georgi: Leipzig, Germany, 1879; p. 393. [Google Scholar]
  74. Christomanos, A.K. The Island of Samothraki and the Earthquake of January 28 (February 9) 1893; Printing Office of Hestia, K. Meissner and N. Cargadouri: Athens, Greece, 1899; p. 51. (In Greek) [Google Scholar]
  75. Platakis, E. The Earthquakes of Crete from Ancient to Modern Times. Kritika Chronika 1950, 4, 463–528. (In Greek) [Google Scholar]
  76. Lekkas, E.; Mavroulis, S.; Carydis, P.; Skourtsos, E.; Kaviris, G.; Paschos, P.; Ganas, A.; Kazantzidou-Firtinidou, D.; Parcharidis, I.; Gatsios, T.; et al. The March 21, 2020, Mw 5.7 Epirus (Greece) Earthquake. Newsl. Environ. Disaster Cris. Manag. Strateg. 2020, 17, 75. [Google Scholar] [CrossRef]
  77. Makropoulos, K.; Kaviris, G.; Kouskouna, V. An updated and extended earthquake catalogue for Greece and adjacent areas since 1900. Nat. Hazards Earth Syst. Sci. 2012, 12, 1425–1430. [Google Scholar] [CrossRef]
  78. Stucchi, M.; Rovida, A.; Gomez Capera, A.A.; Alexandre, P.; Camelbeeck, T.; Demircioglu, M.B.; Gasperini, P.; Kouskouna, V.; Musson, R.M.W.; Radulian, M.; et al. The SHARE European earthquake catalogue (SHEEC) 1000–1899. J. Seismol. 2013, 17, 523–544. [Google Scholar] [CrossRef]
  79. Istituto Nazionale di Geofisica e Vulcanologia (INGV). EPICA—European PreInstrumental Earthquake CAtalogue, Version 1.1; Istituto Nazionale di Geofisica e Vulcanologia (INGV): Rome, Italy, 2021; Available online: https://www.emidius.eu/epica/data/EPICA_v1.1.xlsx (accessed on 6 January 2024).
  80. Rovida, A.; Antonucci, A.; Locati, M. The European Preinstrumental Earthquake Catalogue EPICA, the 1000–1899 catalogue for the European Seismic Hazard Model 2020. Earth Syst. Sci. Data 2022, 14, 5213–5231. [Google Scholar] [CrossRef]
  81. Mouyiaris, N.; Andronopoulos, V.; Eleftheriou, A.; Kynigalaki, M.; Koukis, G.; Rontogianni, T.; Mettos, A.; Katsikatsos, G.; Perisoratis, K.; Drakopoulos, I.; et al. Seismotectonic Map of Greece with Seismogeological Data, Scale 1:500.000; Geological Map Publication Office, Directorate of General Services, Institute of Geology and Mineral Research: Athens, Greece, 1989. [Google Scholar]
  82. Papanikolaou, D. Geology of Greece (with Attached Geotectonic Map of Greece and the Mediterranean); Patakis Publications: Athens, Greece, 2015; p. 448. [Google Scholar]
  83. Smyrniotis, K.; Perellos, V.; Georgalas, L.; Salachoris, M. Hydrolithological Map of Greece, Digital Geospatial Database; Athens, November 1996. Available online: https://ypen.gov.gr/wp-content/uploads/2023/10/%CF%85%CE%B4%CF%81%CE%BF%CE%BB%CE%B9%CE%B8%CE%BF%CE%BB%CE%BF%CE%B3%CE%B9%CE%BA%CF%8C%CF%82-%CE%95%CE%BB%CE%BB%CE%AC%CE%B4%CE%B1%CF%82.pdf (accessed on 5 May 2025).
  84. EAK. Modification of the Provisions of the Greek Seismic Code EAK 2000; Earthquake Planning and Protection Organization: Neo Psychiko, Greece, 2003. [Google Scholar]
  85. General Directorate of Waters. 2nd Revision of River Basin Management Plans for the 14 Water Districts of the Country; Ministry of Environment and Energy, General Secretariat for Natural Environment and Waters: Athens, Greece, 2023; Available online: https://wfdver.ypeka.gr/el/management-plans-gr/2revision-approved-management-plans-gr/ (accessed on 10 January 2025).
  86. Comerci, V.; Vittori, E.; Blumetti, A.M.; Brustia, E.; Di Manna, P.; Guerrieri, L.; Lucarini, M.; Serva, L. Environmental effects of the December 28, 1908, Southern Calabria–Messina (Southern Italy) earthquake. Nat. Hazards 2015, 76, 1849–1891. [Google Scholar] [CrossRef]
  87. Hellenic Statistical Authority. Census Results of Population and Housing 2021, 31 August 2023. Available online: https://elstat-outsourcers.statistics.gr/Booklet_AποτελεσματαΠληθυσμου2023_II%20EN_FINAL2_WEB.pdf (accessed on 5 July 2025).
  88. Papanikolaou, D.I. The geology of Greece. In Regional Geology Reviews; Springer International Publishing: Cham, Switzerland, 2021; p. 345. [Google Scholar]
  89. Monod, O. La “courbure d’Isparta”: Une mosaique de blocs autochthones surmontes de nappes composites á la junction de l’arc hellenique et de l’arc taurique. Bull. Soc. Geol. Fr. 1976, 18, 521–531. [Google Scholar] [CrossRef]
  90. Huguen, C.; Mascle, J.; Chaumillon, E.; Woodside, J.M.; Benkhelil, J.; Kopf, A.; Volkonskaia, A. Deformational styles of the Eastern Mediterranean Ridge and surroundings from combined swath mapping and seismic reflection profiling. Tectonophysics 2001, 343, 21–47. [Google Scholar] [CrossRef]
  91. Mariolakos, I.; Papanikolaou, D. The Neogene basins of the Aegean Arc from the Paleogeographic and the Geodynamic point of view. In Proceedings of the International Symposium on the Hellenic Arc and Trench System (H.E.A.T.), Athens, Greece, 9–10 April 1981. [Google Scholar]
  92. Mariolakos, I.; Papanikolaou, D. Deformation pattern and relation between deformation and seismicity in the Hellenic Arc. Proc. Bull. Geol. Soc. Greece 1987, 19, 59–76. [Google Scholar]
  93. Mariolakos, I.; Papanikolaou, D.; Lagios, E. A neotectonic geodynamic model of Peloponnesus based on morphotectonics, repeated gravity measurements and seismicity. Geol. Jb. 1985, B50, 3–17. [Google Scholar]
  94. Mariolakos, I.; Zagorchev, I.; Fountoulis, I.; Ivanov, M. Neotectonic Transect Moesia Apulia Field Trip Guide Book. In Proceedings of the 32nd International Geological Congress—Pre-Congress Field Trip, Firenze, Italy, 20–28 August 2004. [Google Scholar]
  95. Finetti, I. Structure, stratigraphy and evolution of Central Mediterranean. Bol. Geol. Teor. Appl. Trieste 1982, 34, 296–298. [Google Scholar]
  96. Finetti, I.; Papanikolaou, D.; Del Ben, A.; Karvelis, P. Preliminary geotectonic interpretation of the East Mediterranean chain and the Hellenic Arc. Bull. Geol. Soc. Greece 1990, 25, 509–526. [Google Scholar]
  97. Le Pichon, X.; Angelier, J. The Hellenic Arc and Trench system: A key to the neotectonic evolution of the Eastern Mediterranean area. Tectonophysics 1979, 60, 1–42. [Google Scholar] [CrossRef]
  98. Gogou, M.; Mavroulis, S.; Evelpidou, N.; Lekkas, E. Earthquakes and Tsunamis: Natural Hazards over the Aegean Archipelago. In The Handbook of Environmental Chemistry; Springer: Berlin/Heidelberg, Germany, 2023; pp. 1–38. [Google Scholar] [CrossRef]
  99. Mavroulis, S.; Gogou, M.; Lekkas, E. Earthquake-Induced Tsunamis in Western Greece (Ionian Sea and Western and Southern Peloponnese): Use of Tsunami Quantities, Impact and ITIS-2012 Intensities for Highlighting Susceptible Areas. Geosciences 2023, 13, 28. [Google Scholar] [CrossRef]
  100. Sakkas, V.; Kapetanidis, V.; Kaviris, G.; Spingos, I.; Mavroulis, S.; Diakakis, M.; Alexopoulos, J.D.; Kazantzidou-Firtinidou, D.; Kassaras, I.; Dilalos, S.; et al. Seismological and Ground Deformation Study of the Ionian Islands (W. Greece) during 2014–2018, a Period of Intense Seismic Activity. Appl. Sci. 2022, 12, 2331. [Google Scholar] [CrossRef]
  101. Kaviris, G.; Zymvragakis, A.; Bonatis, P.; Kapetanidis, V.; Spingos, I.; Mavroulis, S.; Kotsi, E.; Lekkas, E.; Voulgaris, N. A Logic-Tree Approach for Probabilistic Seismic Hazard Assessment in the Administrative Region of Attica (Greece). Appl. Sci. 2023, 13, 7553. [Google Scholar] [CrossRef]
  102. Kaviris, G.; Zymvragakis, A.; Kapetanidis, V.; Kouskouna, V.; Spingos, I.; Sakellariou, N.; Voulgaris, N. A logic-tree based probabilistic seismic hazard assessment for the central Ionian Islands of Cephalonia and Ithaca (Western Greece). J. Seismol. 2024, 28, 1087–1103. [Google Scholar] [CrossRef]
  103. Caputo, R.; Chatzipetros, A.; Pavlides, S.; Sboras, S. The Greek Database of Seismogenic Sources (GreDaSS): State-of-the-art for northern Greece. Ann. Geophys. 2012, 55, 859–894. [Google Scholar]
  104. Styron, R.; Pagani, M. The GEM Global Active Faults Database. Earthq. Spectra 2020, 36, 160–180. [Google Scholar] [CrossRef]
  105. Petseti, A.; Nektarios, M. Earthquake insurance for Greece: Comparative analysis and pricing issues. J. Risk Financ. 2013, 14, 251–265. [Google Scholar] [CrossRef]
  106. Psycharis, I. The Salonica (Thessaloniki) Earthquake of June 20, 1978; California Institute of Technology, Earthquake Engineering Research Laboratory: Pasadena, CA, USA, 1978; p. 32. [Google Scholar]
  107. Papazachos, B.; Mountrakis, D.; Psilovikos, A.; Leventakis, G. Surface fault traces and fault plane solutions of the May–June 1978 major shocks in the Thessaloniki area, Greece. Tectonophysics 1979, 53, 171–183. [Google Scholar] [CrossRef]
  108. Maley, R.P.; Bufe, C.G.; Yerkes, R.F.; Carver, D.L.; Henrisey, R. The May–July 1978 Earthquake Sequence Near Thessaloniki, Greece; Open-File Report 80-937; U.S. Geological Survey: Menlo Park, CA, USA, 1980; pp. 1–37. [Google Scholar]
  109. Soufleris, C.; Jackson, J.A.; King, G.C.P.; Spencer, C.P.; Scholz, C.H. The 1978 earthquake sequence near Thessaloniki (northern Greece). Geophys. J. R. Astron. Soc. 1982, 68, 429–458. [Google Scholar] [CrossRef]
  110. Tranos, M.D.; Papadimitriou, E.E.; Kilias, A.A. Thessaloniki–Gerakarou Fault Zone (TGFZ): The western extension of the 1978 1181 Thessaloniki earthquake fault (Northern Greece) and seismic hazard assessment. J. Struct. Geol. 2003, 25, 2109–2123. [Google Scholar] [CrossRef]
  111. Theodulidis, N.; Roumelioti, Z.; Panou, A.; Savvaidis, A.; Kiratzi, A.; Grigoriadis, V.; Dimitriu, P.; Chatzigogos, T. Retrospective Prediction of Macroseismic Intensities Using Strong Ground Motion Simulation: The Case of the 1978 Thessaloniki (Greece) Earthquake (M6.5). Bull. Earthq. Eng. 2006, 4, 101–130. [Google Scholar] [CrossRef]
  112. Berz, G.; Hettler, E. Earthquakes in Greece, February/March 1981; EERI Reconnaissance Report; Earthquake Engineering Research Institute: Oakland, CA, USA, 1981; Available online: https://www.eeri.org/lfe/pdf/Greece_AlcionidesIsles_Berz%26Hettler_Nov81.pdf (accessed on 5 July 2025).
  113. Mariolakos, I.; Papanikolaou, D.; Symeonidis, N.; Lekkas, S.; Karotsieris, Z.; Sideris, C.H. The deformation of the area around the Eastern Corinthian Gulf, affected by the earthquakes of February-March 1981. In Proceedings of the HEAT Symposium, Athens, Greece, 8–10 April 1981; Volume 1, pp. 400–420. [Google Scholar]
  114. Papazachos, B.C.; Comninakis, P.E.; Papadimitriou, E.E.; Scordilis, E.M. Properties of the February–March 1981 seismic sequence in the Alkyonides gulf of Central Greece. Ann. Geophys. 1984, 2, 537–544. [Google Scholar]
  115. Christoulas, S.G.; Tsiambaos, G.K.; Sabatakakis, N.S. Engineering Geological Conditions and the Effects of the 1981 Earthquake in Athens. Greece Eng. Geol. 1985, 22, 141–155. [Google Scholar] [CrossRef]
  116. Hubert, A.; King, G.; Armijo, R.; Meyer, B.; Papanastasiou, D. Fault reactivation, stress interaction and rupture propagation of 1190 the 1981 Corinth earthquake sequence. Earth Planet. Sci. Lett. 1996, 142, 573–585. [Google Scholar] [CrossRef]
  117. Bernard, P.; Briole, P.; Meyer, B.; Lyon-Caen, H.; Gomez, J.-M.; Tiberi, C.; Berge, C.; Cattin, R.; Hatzfeld, D.; Lachet, C.; et al. The Ms = 6.2, June 15, 1995 Aigion earthquake (Greece): Evidence for low angle normal faulting in the Corinth rift. J. Seismol. 1997, 1, 131–150. [Google Scholar] [CrossRef]
  118. Tselentis, G.A.; Melis, N.S.; Sokos, E.; Papatsimpa, K. The Egion June 15, 1995 (6.2 ML) earthquake, western Greece. Pure Appl. Geophys. 1996, 147, 83–98. [Google Scholar] [CrossRef]
  119. Lekidis, V.A.; Karakostas, C.Z.; Dimitriu, P.P.; Margaris, B.N.; Kalogeras, I.; Theodulidis, N. The Aigio (Greece) seismic sequence of June 1995: Seismological, strong motion data and effects of the earthquakes on structures. J. Earthq. Eng. 1999, 3, 349–380. [Google Scholar] [CrossRef]
  120. Bouckovalas, G.D.; Gazetas, G.; Papadimitriou, A.G. Geotechnical aspects of the 1995 Aegion, Greece, earthquake. In Proceedings of the 2nd International Conference on Earthquake Geotechnical Engineering, Lisbon, Portugal, 21–25 June 1999; A.A. Balkema: Rotterdam, The Netherlands, 1999; pp. 739–748. [Google Scholar]
  121. European Parliament and Council. Directive 2000/60/EC establishing a Framework for Community Action in the Field of Water Policy; Official Journal of the European Communities L 327: Luxembourg, 2000; pp. 1–73. [Google Scholar]
  122. Institute of Geological and Mineral Exploration (IGME). Appendix 3—estimation of groundwater potential. In Draft Program for the Management of the Water Resources of the Country; Ministry of Development, Directorate of Water Resources and Natural Resources: Athens, Greece, 1996; 327p, Available online: https://www.itia.ntua.gr/el/getfile/574/1/documents/appendix_3.pdf (accessed on 10 July 2025).
  123. Seismological Laboratory of the National and Kapodistrian University of Athens. Earthquake Catalogue Search. Available online: http://www.geophysics.geol.uoa.gr/stations/gmapv3_db/index.php (accessed on 10 January 2024).
  124. Mountrakis, D.; Kilias, A.; Vavliakis, E.; Psilovikos, A.; Karakaisis, G.; Papazachos, C.; Thomaidou, E.; Seitanidis, G. “Samos” sheet; scale 1:75000. In Neotectonic Map of Greece; Earthquake Planning and Protection Organization: Athens, Greece, 2006; p. 78. [Google Scholar]
  125. Chatzipetros, A.; Kiratzi, S.; Sboras, N.; Zouros, S.; Pavlides, S. Active faulting in the north eastern Aegean Sea Islands. Tectonophysics 2013, 597–598, 106–122. [Google Scholar] [CrossRef]
  126. Mountrakis, D.; Tranos, M.; Papazachos, C.; Thomaidou, E.; Karagianni, E.; Vamvakaris, D. Neotectonic and seismological data concerning major active faults, and the stress regimes of Northern Greece. In Tectonic Development of the Eastern Mediterranean Region; Robertson, A.H.F., Ed.; Geological Society, London, Special Publications: London, UK, 2006; Volume 260, pp. 649–670. [Google Scholar] [CrossRef]
  127. Gkarlaouni, C.; Papadimitriou, E.; Kilias, A.; Falalakis, G.; Gemitzi, A. The Evolution of the Stress Field in Eastern Macedonia and Thrace. Bull. Geol. Soc. Greece 2007, 40, 321–332. [Google Scholar] [CrossRef]
  128. Chen, J.; Wang, C.-Y.; Tan, H.; Rao, W.; Liu, X.; Sun, X. New lakes in the Taklamakan Desert. Geophys. Res. Lett. 2012, 39, 1–5. [Google Scholar] [CrossRef]
  129. Roeloffs, E.A. Persistent water level changes in a well near Parkfield, California, due to local and distant earthquakes. J. Geophys. Res. 1998, 103, 869–889. [Google Scholar] [CrossRef]
  130. Chen, J.; Wang, C.-Y. Rising springs along the Silk Road. Geology 2009, 37, 243–246. [Google Scholar] [CrossRef]
  131. Carrigan, C.R.; King, G.C.P.; Barr, G.E.; Bixler, N.E. Potential for water-table excursions induced by seismic events at Yucca Mountain, Nevada. Geology 1991, 19, 1157–1160. [Google Scholar] [CrossRef]
  132. Mavrouli, M.; Mavroulis, S.; Lekkas, E.; Tsakris, A. The Impact of Earthquakes on Public Health: A Narrative Review of Infectious Diseases in the Post-Disaster Period Aiming to Disaster Risk Reduction. Microorganisms 2023, 11, 419. [Google Scholar] [CrossRef]
  133. Luino, F.; Barriendos, M.; Gizzi, F.T.; Glaser, R.; Gruetzner, C.; Palmieri, W.; Porfido, S.; Sangster, H.; Turconi, L. Historical Data for Natural Hazard Risk Mitigation and Land Use Planning. Land 2023, 12, 1777. [Google Scholar] [CrossRef]
  134. Glade, T. Landslide hazard assessment and historical landslide data—An inseparable couple? In The Use of Historical Data in Natural Hazard Assessments—Advances of Technological and Natural Hazard Research; Glade, T., Albini, P., Frances, F., Eds.; Kluwer: Norwell, MA, USA, 2001; pp. 153–169. [Google Scholar]
  135. Ibsen, M.-L.; Brunsden, D. The nature, use and problems of historical archives for the temporal occurrence of landslides, with specific reference to the south coast of Britain, Ventnor, Isle of Wight. Geomorphology 1996, 15, 241–258. [Google Scholar] [CrossRef]
  136. Musson, R.M. The use of newspaper data in historical earthquake studies. Disasters 1986, 10, 217–223. [Google Scholar] [CrossRef] [PubMed]
  137. Harbi, A.; Sebaï, A.; Rouchiche, Y.; Kherchouche, R. Short note on the contribution of newspapers and periodicals of the nineteenth and twentieth centuries to the discovery of new historical earthquakes in Algeria. J. Seismol. 2020, 24, 1281–1289. [Google Scholar] [CrossRef]
Figure 1. Flow chart of the applied methodology.
Geosciences 15 00367 g001
Figure 2. (a) Map illustrating the thirteen administrative regions of Greece. The abbreviations are as follows: EM-T—Eastern Macedonia and Thrace; CM—Central Macedonia; WM—Western Macedonia; EP—Epirus; TH—Thessaly; WG—Western Greece; II—Ionian Islands; PEL—Peloponnese; NA—North Aegean; SA—South Aegean; and CR—Crete. Greece borders Albania (AL), North Macedonia (RNM), and Bulgaria (BG) to the north, from west to east. To the east, it adjoins Turkey (TUR), while its western boundary is the Ionian Sea and its southern limit is the Eastern Mediterranean Sea. (b) Residential areas in Greece affected by earthquakes and EQHAs, as discussed in the main text.
Geosciences 15 00367 g002
Figure 3. Morphological map of Greece highlighting the key landforms, such as mountains, plateaus, lowlands, and the main rivers. Basins and lowlands are indicated with green lettering: EV: Evros; XK: Xanthi–Komotini; TG: Thessaloniki–Giannitsa; TP: Thessalian plain; Κ: Kalamata; E: Evrotas, M: Messara. Mountains are labelled in black: R: Rhodope; O: Olympus; PMR: Pindos Mountain Range; V: Vardoussia; G: Ghiona; P: Parnassos; E: Erymanthos; K: Kyllini; M: Mainalo; T: Taygetos; P: Parnon; L: Lefka; I: Idi (Psiloritis); D: Dikti. Major rivers of Greece discussed in the text are indicated with blue numbers: 1: Kalamas; 2: Acherontas; 3: Louros; 4: Arachthos; 5: Acheloos; 6: Mornos; 7: Pineios (Peloponnese); 8: Alfios; 9: Pamissos (Peloponnese); 10: Evrotas; 11: Voiotikos Kifissos; 12: Spercheios; 13: Pineios (Thessaly); 14: Aliakmonas; 15: Axios; 16: Strymonas; 17: Nestos; 18: Evros.
Geosciences 15 00367 g003
Figure 4. The current structure of the Hellenic Arc consisting of its main elements (trench, island arc, back-arc basin, and volcanic arc) organized from S to N. The morphoneotectonic regions (MNR) of Greece, as defined by Mariolakos and Papanikolaou [91,92] and Mariolakos et al. [93,94], are shown alongside major fault zones, which exhibit varying orientations and characteristics, thereby forming distinct morphoneotectonic sectors. Additionally, the seismic hazard zones of Greece, based on anticipated peak ground acceleration (PGA) over a 475-year recurrence interval [84], are also depicted. The red volcanoes represent active volcanoes of the present volcanic arc and the yellow triangles the Plio-Quaternary volcanic centres.
Geosciences 15 00367 g004
Figure 5. Map illustrating the active faults in Greece, based on the GEM Global Active Faults Database (GAF-DB) compiled by Styron and Pagani [104]. It also shows the spatial distribution of Mw ≥ 6.0 earthquakes according to the seismic catalogues of Makropoulos et al. [77], Stucchi et al. [78], and Rovida et al. [80]. In addition, the seismic hazard zones of Greece are presented.
Geosciences 15 00367 g005
Figure 6. Maps showing (a) the RBDs and (b) the water basins of Greece based on the approved River Basin Management Plans for the Water Districts of Greece [85]. The abbreviations of the river basins in Mainland Greece (b) are as follows in alphabetical order: A: Amfissa; AB: Attica Basin; ACH: Acheloos; AL: Acheron and Louros; ALF: Alfios; AR: Arachthos; CH: Chalkidiki; EI: Evia Island; EV: Evrotas; M: Mornos; NK: North Kallidromo; SBNP: stream basin of Northern Peloponnese; PIN: Pineios; PNN: Pamissos–Nedontas–Neda; PVP: Pineios–Vergas–Piros; SBAG: stream basin of the Argolic Gulf; SP: Spercheios; STR: Strymonas; T: Tripolis plateau basin; VK: Voiotikos Kifissos. The abbreviations of the river basins in insular Greece (b) are as follows in alphabetical order: C-I-Z: Cephalonia–Ithaki–Zakynthos; CRH-N: Chania–Rethymno–Herakleion—North; CRH-S: Chania–Rethymno–Herakleion—South; CY: Cyclades; DOD: Dodecanese; EA: Eastern Aegean; KP: Kerkyra–Paxoi; SPO: Sporades; TS: Thassos–Samothraki.
Geosciences 15 00367 g006
Figure 7. (a) Spatial distribution of earthquakes that induced hydrogeological anomalies in Greece. (b) The earthquakes that induced hydrogeological anomalies in Greece shown by their moment magnitude (Mw).
Geosciences 15 00367 g007
Figure 8. Diagrams illustrating the frequency of (a) historical and recent earthquakes that have induced hydrogeological anomalies categorized by magnitude class, and (b) of historical and recent earthquakes that have induced hydrogeological anomalies classified according to seismic intensity.
Geosciences 15 00367 g008
Figure 9. (a) Frequencies of earthquakes (Eqs) and EQHAs in Greece by seismic magnitude classes. (b) Frequencies of earthquakes (Eqs) and EQHAs in Greece by seismic intensities.
Geosciences 15 00367 g009
Figure 10. Frequency of EQHAs by specific type, such as variations in spring flow rates, water level changes in wells, turbidity, gas emissions, and rare phenomena like lake formation or sinkhole reopening.
Geosciences 15 00367 g010
Figure 11. The frequency of earthquakes by the total EQHAs types per earthquake. The majority of the earthquakes presented only one type of EQHA, while only 4 earthquakes induced the maximum number of types.
Geosciences 15 00367 g011
Figure 12. The scatter plot illustrates the relationship between earthquake magnitude (Mw) on the horizontal axis and the number of types of EQHAs on the vertical axis. Each point represents an earthquake for which both variables are recorded. A linear regression line is also included in the plot, attempting to depict a potential correlation between earthquake magnitude and the number of types of EQHAs. The coefficient of determination (R2 = 0.0802) indicates that magnitude accounts for only 8.02% of the variance in the number of EQHA types. This suggests a weak or non-linear correlation between the two variables and the likely influence of additional factors.
Geosciences 15 00367 g012
Figure 13. Diagrams illustrating the number of EQHAs types in Greece by year of occurrence: (a) 426 BC to 1834; (b) 1840 to 1880; (c) 1881 to 1938; (d) 1941 to 2020.
Geosciences 15 00367 g013
Figure 14. Frequency of EQHAs by single or combined class durations, indicating complex timing behaviour in some events. Duration classes: Class 1 (co-seismic effects), Class 2 (a few hours after the main shock), Class 3 (up to 24 h after the main shock), and Class 4 (more than 24 h after the main shock).
Geosciences 15 00367 g014
Figure 15. (a) The spatial distribution of EQHAs in Greece based on their LRI. (a) LRI = 1 (0–100 m, very high reliability), (b) LRI = 2 (0–1 km, high reliability), and (b) LRI = 3 (0–10 km, moderate reliability). (b) The frequency of EQHAs in Greece by LRI classes.
Geosciences 15 00367 g015
Figure 16. Spatial distribution of EQHAs in Greece (a) before 1900 (historical EQHAs) and (b) after 1900 (recent EQHAs). The maps included only the spatially identified events based on the available geographic information.
Geosciences 15 00367 g016
Figure 17. The most EQHAs-affected regions of Greece. (a) Numbers of EQHAs in the regions of Greece. (b) ETLs per 100 km2 in the regions of Greece. The Ionian Islands (western Greece) and the North Aegean regions (northeastern Greece), presented in red, hold first place in both maps.
Geosciences 15 00367 g017
Figure 18. Diagram showing the frequency of spatially identified EQHAs by the regions of Greece.
Geosciences 15 00367 g018
Figure 19. (a) Map of the distribution of geographically identified co- and post-seismic hydrogeological anomalies in the RBDs of Greece. The legend for the RBDs is available in Figure 6a. (b) The frequency of the EQHAs by the RBDs of Greece.
Geosciences 15 00367 g019
Figure 20. (a) Map of the distribution of spatially identified EQHAs in the river basins of Greece. The legend for the RBDs is available in Figure 6b. (b) The frequency of the EQHAs by the river basins in Greece.
Geosciences 15 00367 g020
Figure 21. The frequency of the EQHAs in Greece by water bodies.
Geosciences 15 00367 g021
Figure 22. (a) Map showing the distribution of EQHAs in Greece. (b) The frequency of the detected EQHAs by seismic hazard zone according to the relevant map [84].
Geosciences 15 00367 g022
Figure 23. The frequency of the geographically identified EQHAs in Greece by (a) main hydrogeological formation type (porous, karstic, impermeable) and by (b) subtypes of hydrogeological formations: karstic formations (a): limestones and marbles of extensive occurrence, with moderate to high permeability; karstic formations (b): limestones and marbles of limited extent, with variable permeability; karstic formations (c): Triassic breccia with low to moderate permeability; porous formations (a): granular alluvial deposits with variable permeability; porous formations (b): granular non-alluvial sediments of moderate to very low permeability; impermeable formations (a): flysch; impermeable formations (b): metamorphic rocks; impermeable formations (c): plutonic and volcanic formations.
Geosciences 15 00367 g023
Figure 24. Maximum epicentral distance of EQHAs in Greece versus earthquake magnitude based on the data of the present study. The red points correspond to EQHAs in springs and wells, the blue points represent to EQHAs in lakes and closed basins, and the light blue points indicate EQHAs in rivers and streams.
Geosciences 15 00367 g024
Table 1. The types, numbers and percentages of the available sources used and evaluated for the temporal, spatial and statistical analysis of co- and post-seismic EQHAs in Greece.
Type
of Sources
No.
of Sources
Percentage
of Sources
Evaluated
Sources
Peer-reviewed journal articles that involve the evaluation and mapping of EEEs, including EQHAs1540.54%[21,40,43,44,45,46,47,48,49,50,51,52,53,54,55]
Papers presented in national and international conferences that focus on assessing and mapping EEEs, including EQHAs410.81%[39,56,57,58]
Scientific books that provide catalogues and detailed information about earthquakes in Greece and the Eastern Mediterranean region covering their effects on both natural and built environments, with EQHAs included among the observed impact1232.43%[59,60,61,62,63,64,65,66,67,68,69,70]
Doctoral theses examining earthquakes and their effects on the natural environment, including EQHAs25.41%[71,72]
Official reports derived from field investigations and reconnaissance surveys documenting earthquake impact and associated EQHAs410.81%[73,74,75,76]
Table 2. Cartographic resources and geospatial vector data used for the temporal, spatial and statistical analysis of the co- and post-seismic hydrogeological anomalies in Greece along with their type, scale or cell size and sources.
DataData TypeMap Scale/
Geometry Type
Data Source
Seismotectonic Map of GreeceRaster1:500,000[81]
Geotectonic Map of Greece:
Geotectonic Units and
Tectonostratigraphic Terranes
Raster1:200,000[82]
Hydrolithological Map of GreeceRaster1:1,000,000[83]
Seismic Hazard Zonation
Map of Greece
RasterPolygons[84]
Drainage networkVectorLines[85]
Water districtsVectorPolygons[85]
River basinsVectorPolygons[85]
Lake water bodiesVectorPolygons[85]
Coastal water bodiesVectorPolygons[85]
River water bodiesVectorPolygons[85]
Groundwater bodiesVectorPolygons[85]
Table 3. Historical and recent earthquakes in Greece, together with the number and types of hydrogeological anomalies linked to each event and the respective sources evaluated in this study. Seismological parameters were obtained from the EPICA catalogue for historical earthquakes [79,80]; from Makropoulos et al. [77] for events between 1900 and 2009; and from the earthquake catalogue of the Seismological Laboratory of the National and Kapodistrian University of Athens [123], for events after 2009. Seismic intensity data were mainly sourced from Papazachos and Papazachou [62], the EPICA catalogue for historical earthquakes [79,80], and the references cited in the last column of the table for more recent events.
No.Earthquake
Origin Time
Earthquake
Coordinates
MwImaxMost Earthquake-Affected Area, RegionNo of
EQHAs
Sources for
EQHAs
LatitudeLongitude
1BC 426 October38.8522.787ΧMaliac Gulf, Thessaly4[59,60,62,64,70]
2BC 263–221----Methana, Peloponnese1[64]
3BC 198 c.38.423.76.4-Chalkis, Evia Island3[59,62,64]
4BC 94----Evia Island1[60]
5AD 36138.422.66.8IXDelfoi,
Mainland Greece
2[59,62]
6AD 59740.724.16.7VIIIAmphipolis,
Macedonia
1[62]
7June 140238.16822.2726.67IXXylokastro,
Peloponnese
3[60,62,63]
824 April 154439.521.66.4VIIIXiromero,
Western Greece
1[64]
928 June 162538.82720.6696.47-Lefkada Island,
Ionian Islands
2[62,72]
109 March 163036246.52VIII–IXHerakleion, Crete3[64,65,66]
115 November 163337.78220.8966.57VIII–IXZakynthos Island,
Ionian Islands
4[45,50,64,72]
128 September 171438.17920.4876.28VIIICephalonia Island,
Ionian Islands
2[60,62]
131736- --Cephalonia Island,
Ionian Islands
2[60,64]
1422 June 175940.63622.9446.58IXThessaloniki,
Central Macedonia
1[62]
1524 July 176638.220.426.57IXCephalonia Island,
Ionian Islands
1[60]
162 November 179137.78120.8836.79VIIIZakynthos Island,
Ionian Islands
1[50]
1729 June 179836.14922.9886.38VIIIKythira Island,
Attica Region
1[66]
1817 September 180537.98323.7335.92VIIAthens,
Attica Region
1[60]
192 June 1809----Zakynthos Island,
Ionian Islands
2[50,72]
2021 February 182038.83420.7086.55ΙΧLefkada Island,
Ionian Islands
2[64,72]
2129 December 182037.76421.1216.86ΙΧZakynthos Island,
Ionian Islands
4[50,60,62,64]
225 May 182941.13524.56.96ΧDrama,
Eastern Macedonia and Thrace
1[62]
233 April 183137.75726.9765.65VIISamos Island,
NE Aegean
1[71]
241 January 1834----Ancient Olympia,
Western Greece
1[64]
2530 October 184037.79420.8266.44ΙΧZakynthos Island,
Ionian Islands
6[45,50,60,62,64]
2618 April 184237.05822.156.21VIIIMessinia,
Peloponnese
3[58,64,72]
2711 October 184539.126.2176.28XLesvos Island,
NE Aegean
3[61,62,69]
2810 June 184637.05722.0326.78XMessinia,
Peloponnese
3[58,65,72]
2928 February 185136.57529.2156.79IX–XRhodes Island,
Dodecanese Islands
1[68]
3018 August 185338.31923.3176.71XThiva,
Mainland Greece
3[46,62,64]
312 September 185338.423.46.3 Thiva,
Mainland Greece
1[62]
3229 September 185338.323.26.3VIIIThiva,
Mainland Greece
2[44,64]
3312 October 185635.625.87.7IXHeraklion, Chania (Rhodes Island), Crete4[60,62,65,68]
3421 February 185837.8722.886.5IXCorinth, Peloponnese4[46,62,64,73]
3528 May 1858-- Corinth, Peloponnese1[60]
3612 March 1860----Ioannina, Epirus1[64]
376 August 186040.425.86.2VIISamothraki Island, NE Aegean4[60,62,64,74]
3826 December 186138.20722.1266.69XAegion,
Western Greece
1[64]
3916 August 186338.326.16.2VIIIChios Island,
NE Aegean
3[60,62,71]
402 September 1863----Giannitsa,
Central Macedonia
1[64]
414 February 186738.23320.4247.15ΧCephalonia Island,
Ionian Islands
5[55,60,64,72,73]
427 March 186739.23826.2646.85ΧLesvos Island,
NE Aegean
4[61,64,69,71]
4320 September 186736.72222.4246.49ΙΧLaconia, Peloponnese2[64,70]
449 September 1869----Aegean Sea1[70]
451 August 187038.4822.556.8ΙΧFokis,
Mainland Greece
2[46,64]
4625 October 187038.4822.556.1VIIIFokis,
Mainland Greece
2[46,64]
4726 June 187637.84622.7715.85VIINemea (Corinthia),
Peloponnese
1[62]
482 September 1880----Achaia (Strezova),
Peloponnese
1[70]
493 April 188138.2226.1956.47XChios Island,
NE Aegean
1[71]
5027 August 188636.98821.4677.17XFiliatra, Peloponnese3[58,60,72]
519 September 188838.2522.0726.2IXAegion, Peloponnese2[46,64]
5226 October 188939.19425.9876.78IXLesvos Island,
NE Aegean
2[64,69]
5326 June 189038.53325.5675.83VIIPsara Island,
NE Aegean
2[64,71]
549 February 189340.58925.5266.84IXSamothraki Island,
NE Aegean
3[60,61,62]
5527 April 1894 (16)38.71622.9596.91XLokris,
Mainland Greece
3[60,62,70]
5613 May 189540.12719.7836.15VIIIMargariti, Epirus1[64]
572 June 189837.622.67VIITripolis, Peloponnese1[44]
589 November 1898----Kyparissia,
Peloponnese
2[58,72]
5922 January 189937.221.66.5-Kyparissia,
Peloponnese
4[44,64,72]
605 July 190240.823.26.4IXThessaloniki,
Macedonia
2[60,62]
6111 August 190336.3237.6IXKythira Island,
Attica Region
2[65,66]
6230 May 190938.2522.25.9VIIIFokis,
Mainland Greece
1[44]
6315 July 190937.921.55.6IXChavari (Elis),
Peloponnese
1[54]
6421 November 1914----Crete Island1[67]
6527 November 191438.820.65.9IXLefkada Island,
Ionian Islands
3[62,70,72]
664 June 191539.121.15.9VIIIAgrafa, Thessaly1[44]
6724 December 191738.6521.865.7VIIINafpaktia,
Western Greece
1[60]
6816 July 191836.2227.266.0VIMilos Island,
Cyclades Islands
1[62]
6926 June 192636.7526.987.0XIRhodes Island,
Dodecanese Islands
2[65,75]
7026 September 193240.3923.816.8XAthos,
Central Macedonia
2[60,62]
7123 April 193336.7627.176.5IXKos Island,
Dodecanese Islands
1[51]
7220 July 193838.323.665.9VIIIOropos,
Attica Region
2[44,60]
731 March 194139.7322.466.1VIIILarissa, Thessaly1[60]
7423 July 194938.7126.726.7IXChios Island,
NE Aegean
5[60,61,62,69,70]
7518 March 195340.227.527.1IXLesvos Island,
NE Aegean
1[69]
7611 August 195338.3520.746.6VIIICephalonia Island,
Ionian Islands
2[52,72]
7712 August 195338.1320.747IXCephalonia Island,
Ionian Islands
2[52,72]
7830 April 195439.2322.286.5IX+Sophades, Thessaly3[43,60,62]
799 July 195636.6425.917.1IXAmorgos Island, Cyclades Islands1[60]
8014 May 195935.1124.655.9VIII+Heraklion, Crete3[60,62,65]
816 July 196538.3722.46.2VIII+Eratini,
Mainland Greece
1[44]
825 February 196639.121.746IXKremasta,
Mainland Greece
1[60]
8320 June 197840.7823.246.2VIII+Thessaloniki,
Macedonia
1[62]
849 July 198039.2922.916.2VIII+Almyros, Thessaly1[44]
859 October 198437.0121.795.3-Pelekanada,
Peloponnese
1[72]
8613 September 198637.0822.155.7IXKalamata,
Peloponnese
3[39,40,72]
8720 March 199236.6624.495.2VI+Milos Island,
Cyclades Islands
1[56]
8815 June 199538.422.276.3VIIIAegion, Peloponnese1[60]
8926 July 200139.124.276VIISkyros Island,
Sporades Islands
1[62]
908 June 200837.9621.456.3VIII–IXAndravida,
Peloponnese
2[47,57]
9126 January 201438.2120.476.1VIIICephalonia Island,
Ionian Islands
3[48,49,72]
9220 July 201736.9927.446.6VIKos Island,
Dodecanese Islands
1[51]
9321 March 202039.320.545.6VI–VIIIParga, Epirus2[53,76]
9430 October 202037.9226.86.9VIISamos Island,
NE Aegean
1[21]
Table 4. Functional categories (6) and types (17) of the detected EQHAs in Greece.
Functional Categories of Co- and Post-Seismic Hydrogeological AnomaliesTypes of Co- and Post-Seismic Hydrogeological Anomalies
Hydraulic variations
(97 cases)
  • Variations in the flow rate of springs including drying up
  • Variations in the water level in wells including drying up
  • Variations in the groundwater level
  • Variations in the flow rate in rivers
  • Variations of the water level in lakes
Water quality alterations
(39 cases)
  • Water turbidity in springs and wells
  • Water turbidity in lakes and closed basins
  • Water turbidity in rivers and streams
  • Variations in chemical–physical properties of water in springs
    (most commonly temperature)
Gas emissions
(17 cases)
  • Gas emissions, often sulphureous
  • Gas emissions resulting burning of the surrounding vegetation
Formation of water bodies
(20 cases)
  • Appearance of springs in new locations
  • Formation of a lake
Morphological changes
(8 cases)
  • River flow diversion/disturbance
  • Morphological changes to the riverbed
  • Sink-related anomalies (reopening)
Uncategorized anomalies
(2 cases)
  • Phenomena not described in detail
Disclaimer/Publisher’s Note: The statements, opinions and data contained in all publications are solely those of the individual author(s) and contributor(s) and not of MDPI and/or the editor(s). MDPI and/or the editor(s) disclaim responsibility for any injury to people or property resulting from any ideas, methods, instructions or products referred to in the content.