Article

Geomagnetic Signatures of Moderate Earthquakes from Kumaun Himalaya, India

CSIR-National Geophysical Research Institute, Hyderabad 500007, India
*
Author to whom correspondence should be addressed.
Geosciences 2025, 15(9), 365; https://doi.org/10.3390/geosciences15090365
Submission received: 19 April 2025 / Revised: 1 August 2025 / Accepted: 12 August 2025 / Published: 16 September 2025
(This article belongs to the Section Geophysics)

Abstract

In this study, a statistical analysis of ground geomagnetic data has been attempted to extract the seismo-electromagnetic (SEM) signatures associated with moderate earthquakes in the region of the seismic gap in the Kumaun Himalaya, Uttarakhand, India. We applied the discrete wavelet transform (DWT) method to the geomagnetic data to identify the ULF energy of the signal. The ULF energy obtained in the central frequency range of 0.01 Hz was further filtered to extract the anomalous ULF energy, which is associated with pre-earthquake processes. We also applied multifractal analysis to the geomagnetic data to classify the complexities in the signal, which are indicative of the seismotectonic environment. We observed enhancements in the ULF energy anomalies associated with large-magnitude earthquakes occurring in the western part of Nepal, even over large epicentral distances (~120 km). The multifractal analysis shows the overlap of anomalies in the Hwp and Hwn signatures in most cases, which suggests that multiple mechanisms generate low- and high-frequency components in the anomalous data. This reflects the complex nature of seismicity in this region of the Main Central Thrust (MCT).

1. Introduction

1.1. Seismotectonics of Uttarakhand and Western Nepal

The continental collision of the Indian and Eurasian plates gave rise to the continuous arc of the Himalaya between 77° E and 89° E longitudes, around 45 Ma [1]. Major geological faults along the collisional boundary accommodate the relative convergence: the Main Himalayan Thrust (MHT), the surface expression of which is the Main Frontal Thrust (MFT) [2,3], the Main Boundary Thrust (MBT), and the Main Central Thrust (MCT), as shown in Figure 1. The Himalayan frontal arc has been generating moderate to very large earthquakes [4] during the past 1000 years; at least four earthquakes of Mw > 8 occurred on the shallow portion of the megathrust boundary, with the maximum size of Mw 8.6 associated with the Assam earthquake of 1950 [5]. The last large Himalayan earthquake, of Mw 7.8, occurred (at 15 km depth) on 25 April 2015 in the Nepal Himalaya [6].
The Garhwal–Kumaon segment of the Himalayan arc, including Uttarakhand and western Nepal, has not experienced a major earthquake in the last 500 years or more, and is seismically a critically vulnerable section that has the potential to generate very large earthquakes [7]. The focal mechanism solution from the hundreds of moderate earthquakes in these regions consistently points to thrust faulting that dips toward the north or northeast, with a few toward the northwest [8,9]. The maximum compressive stress direction plunges horizontally, while the minimum compressive stress is oriented vertically, indicating a thrust stress regime. Seismicity is often shallow and is concentrated in specific sections, suggesting the presence of fluid-rich zones and localized stress accumulation with convergence to the tune of 18 mm/yr, as per GPS measurements [10]. The region of the Indo-Gangetic plains, with its high sediment thickness and population density, may be poised for a mega earthquake in the near future, which would result in huge loss of life and property because of destruction due to high peak ground acceleration and liquefaction, as happened in the 1934 Nepal–Bihar earthquake. In such a scenario, all efforts to decipher the structural composition, configuration, nature, and rates of deformation that contribute to the seismogenesis of the central Himalayan region are critical.

1.2. Electromagnetic Signatures of Earthquake Processes

The process of the accumulation of stress in the Earth’s crust due to tectonic loading, subsequent fracturing, and deformation (both brittle and ductile) leads to changes in different geophysical and geochemical properties, which can produce a variety of signatures that have been reported over several centuries. At intervals, when the loading exceeds the frictional forces on a fault zone, it will slip, resulting in an earthquake. Over the last few decades, observations have been made of several categories of electromagnetic signatures from both ground and space data that have been associated with seismogenic environments (SEM). Perturbations of the upper and lower ionosphere, detectable as anomalous VLF/LF signatures as well as in total electron content (TEC) variations, have been consistently observed from ground and space data associated with earthquake phenomena; the signatures of ULF lithospheric radiation comprise a recurrent indication of earthquake activity [11,12,13] and others. Correlations between variations in the geomagnetic field and telluric currents have been investigated in previous studies [14,15,16,17,18,19,20,21,22,23,24,25,26,27,28] to illustrate the induction effects produced by stress changes in crustal rocks. Explanations of the physical phenomena have also been proposed [29,30,31,32,33,34,35]. These recent works make the case for the nature of anomalous SEM signatures as an indicator of pre-earthquake processes, which is governed by the specific combination of active forces and fault parameters in each case. In this work, we analyzed geomagnetic data from one station, PTY in the Kumaun Himalaya, recorded over approximately 2.5 years, to investigate the nature of the signatures linked with the occurrence of moderate earthquakes, primarily on the MCT, in this region.

2. Data

2.1. Geomagnetic Data

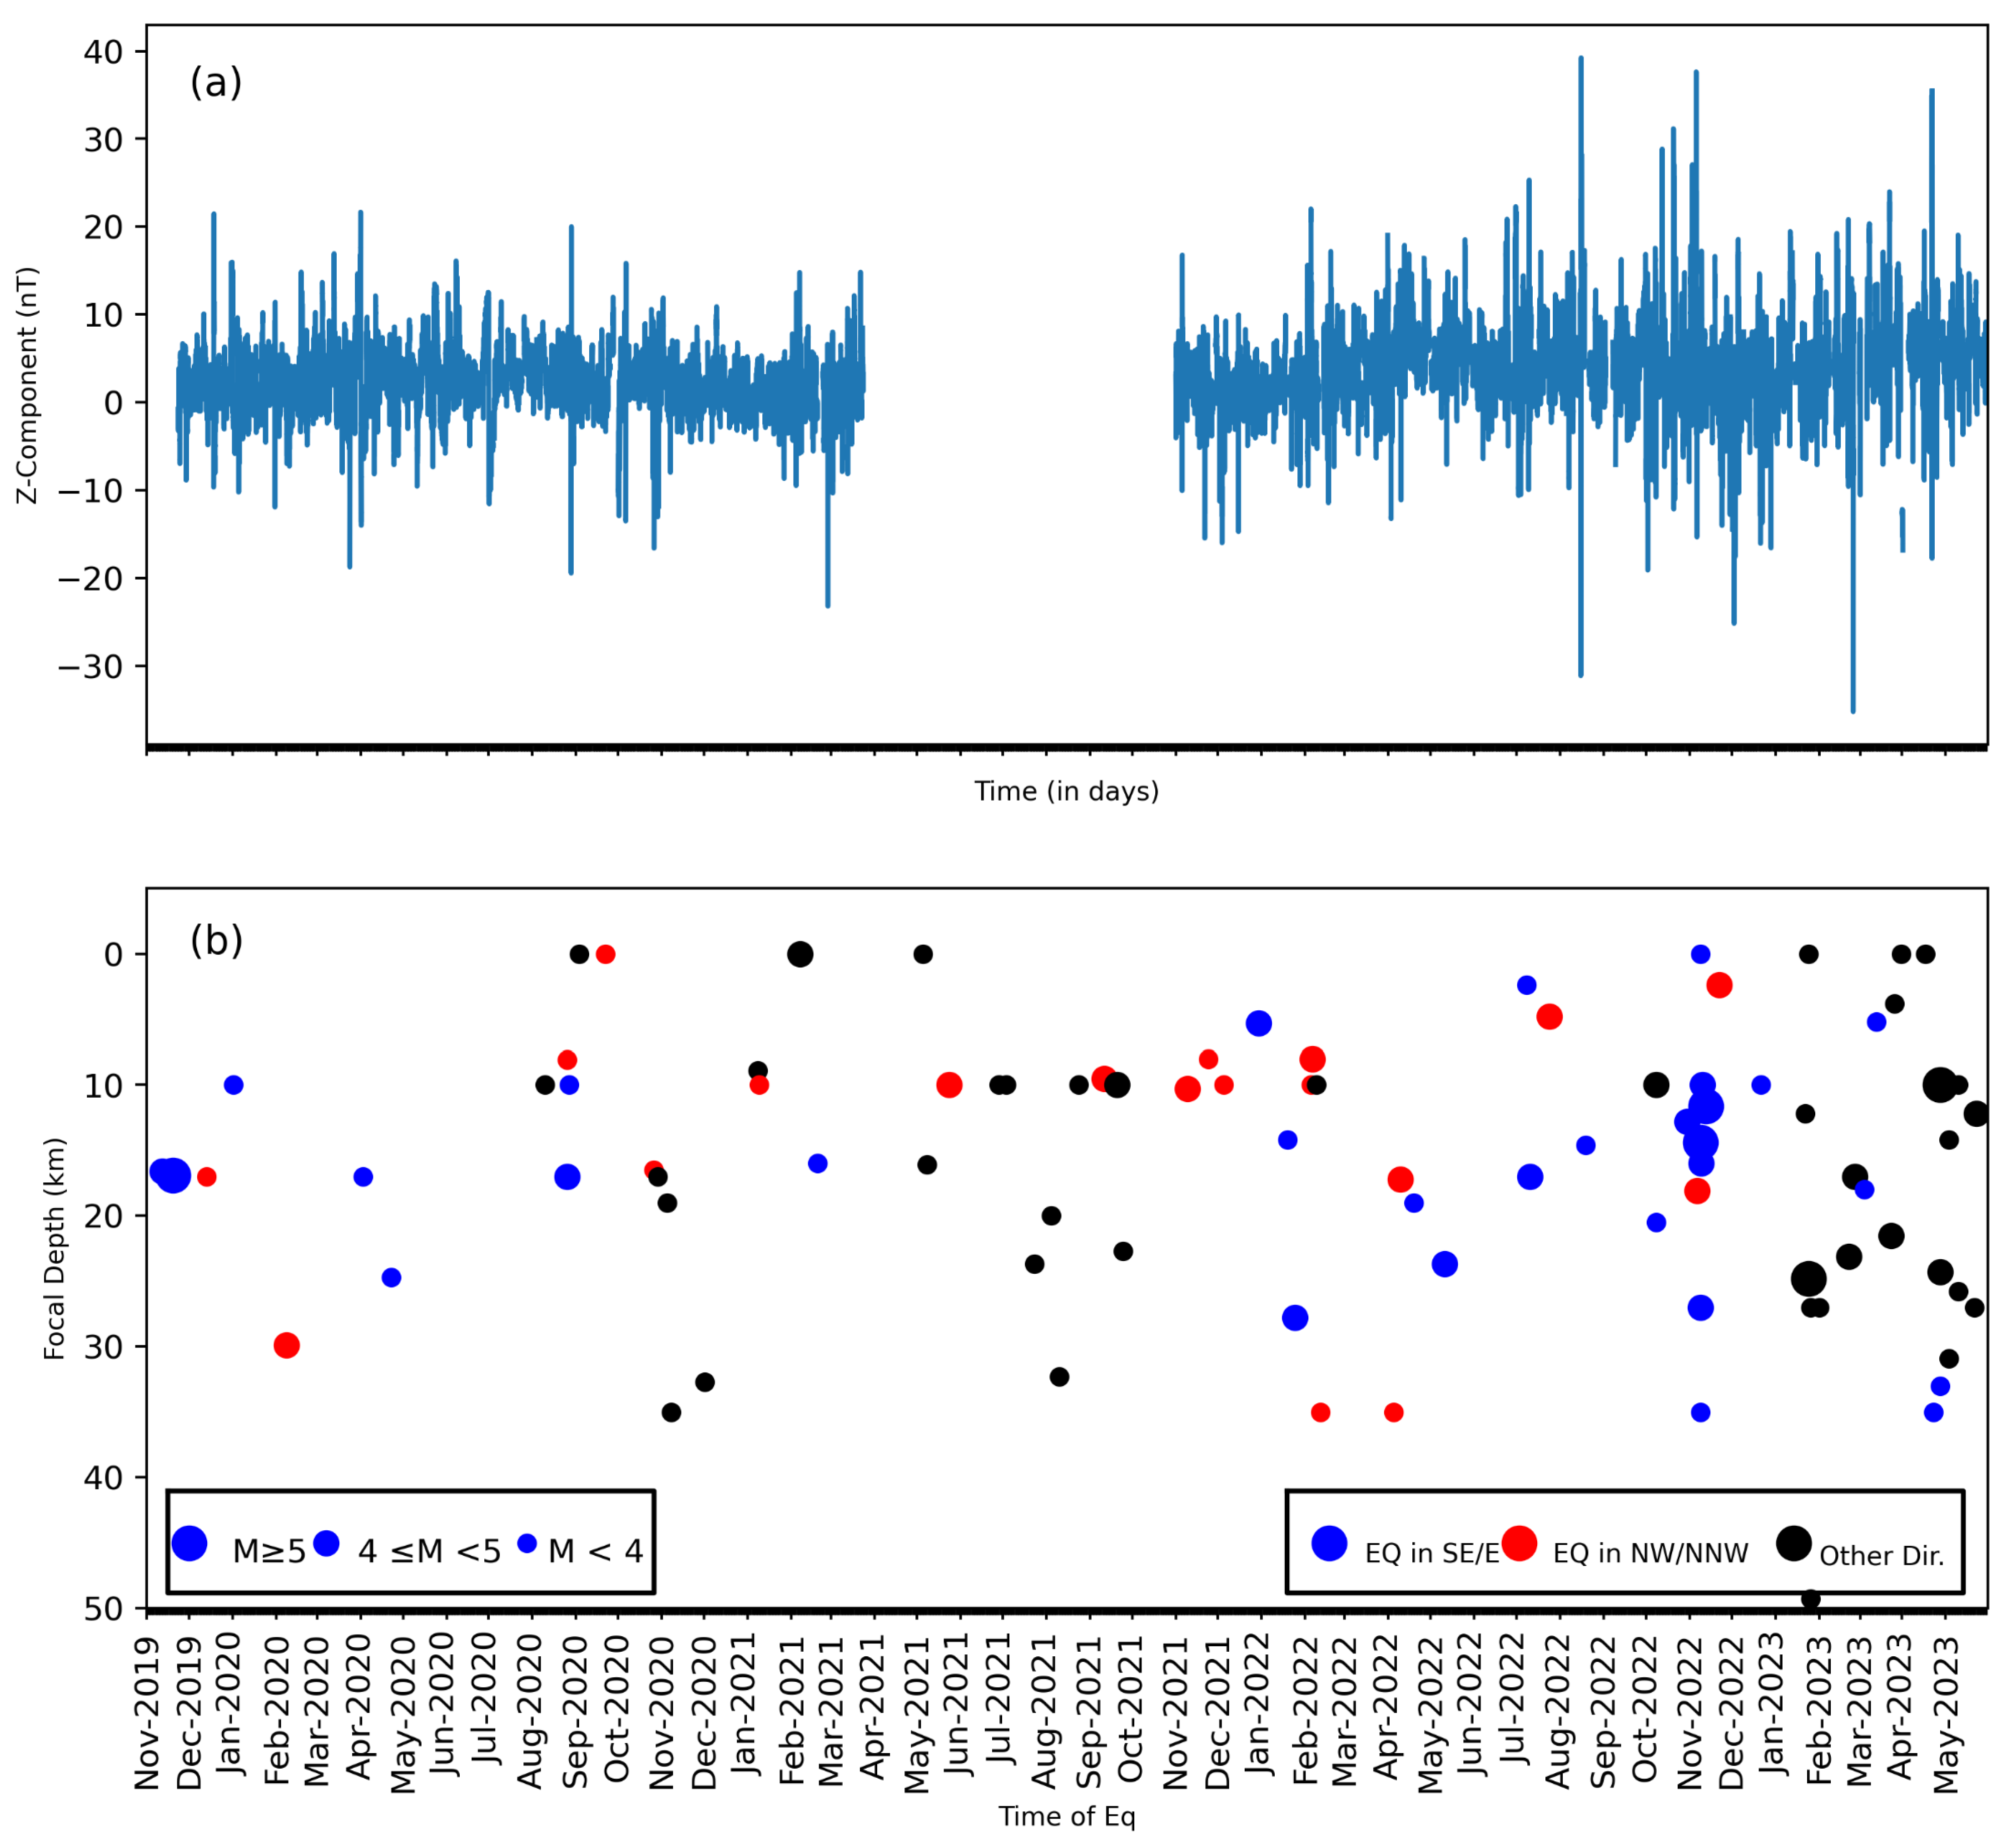
The geomagnetic station of CSIR-NGRI (79.97° E, 30.08° N) is located in Patiyasar (PTY), Uttarakhand, at an elevation of 2050 m, 2.5 km north of the MCT (Figure 1). Three-component (H, D, and Z) geomagnetic data are recorded by a Lemi-424 Fluxgate magnetometer at a sampling frequency of 1 Hz [26]. The loss of data from April 2021 to November 2021 was due to a malfunction in the recording instruments. After conversion to local time (LT), night-time (22:00 to 02:00 hour), Z-component data, excluding those days when Kp > 3 over the period from November 2019 to May 2023, have been used for this analysis, as shown in Figure 2a. This exclusion was intended to ensure that the data did not include signatures indicating ionospheric and magnetospheric disturbances. The international geomagnetic reference field (IGRF) correction was applied to the data to remove the main field effects. Preprocessing included cleaning, i.e., the removal of spikes and the replacement of missing data with NAN values and detrending. The resultant data lay in the range of −20 to +25 nT, with a standard deviation of 3.66 nT. Earlier studies [36,37,38,39] suggest that the Z-component of the geomagnetic field is more sensitive to influences from local variations, including lithospheric contributions, although some authors have reported such signatures in the H-component as well [40].

2.2. Earthquake Data

The earthquake catalog was obtained from the International Seismological Center (https://www.isc.ac.uk/iscbulletin/search/catalogue/) for M ≥ 3.5, within a radius of 250 km from PTY. A total of 93 earthquakes (Figure 2b), with focal depths up to 50 km, are documented. These earthquakes are listed in Table S1 in the Supplementary Materials. Most of the earthquakes are clustered around the MCT distributed in the north, northwest, and southeast directions from PTY (Figure 1). Anomalous signatures obtained from geomagnetic data are correlated with the occurrence patterns of these earthquakes, except during the intervals where there are data gaps.

3. Approach Chosen for Data Analysis

There are several approaches for extracting the subtle signatures of SEM from ground geomagnetic data [21,22,23,24,25,26,27,28,36,37,38,39,40,41,42]. In this work, the aim is to identify the patterns of SEM from the PTY site, centrally situated within the cluster of moderate earthquakes. A few months’ worth of this data has previously been analyzed in Ref. [26], in which anomalous signatures of 1–7 nT in the Z diurnal were identified 1–11 days prior to earthquakes; anomalous signatures of night-time Pc4 were also identified 1–11 days prior to earthquakes. In the present work, we continue to search for SEM signatures in the night-time ULF phenomena in the Z-component, which best represents the changes induced by lithospheric processes. We employ the discrete wavelet transform (DWT) technique to extract the ULF signals, avoiding the artifacts of FFT [43]. The decomposed reconstructed signal is then transformed to energy, which facilitates the identification of prominent anomalous ULF events.
Furthermore, multifractal analysis is carried out to decipher the levels of complexity in the data to identify correlations with the occurrence patterns of earthquakes. Fractal methods have been used by previous researchers to describe the nonlinear characteristics of the geomagnetic data associated with different stages of lithospheric pre-earthquake processes [44,45,46,47,48]. We have used both a 10-day moving mean of ULF energy computations and multifractal analysis of the Z-component of the geomagnetic signal to reduce the shorter and more rapid fluctuations and enhance the smooth variations for better interpretation.

3.1. Energy in the ULF Signal from DWT

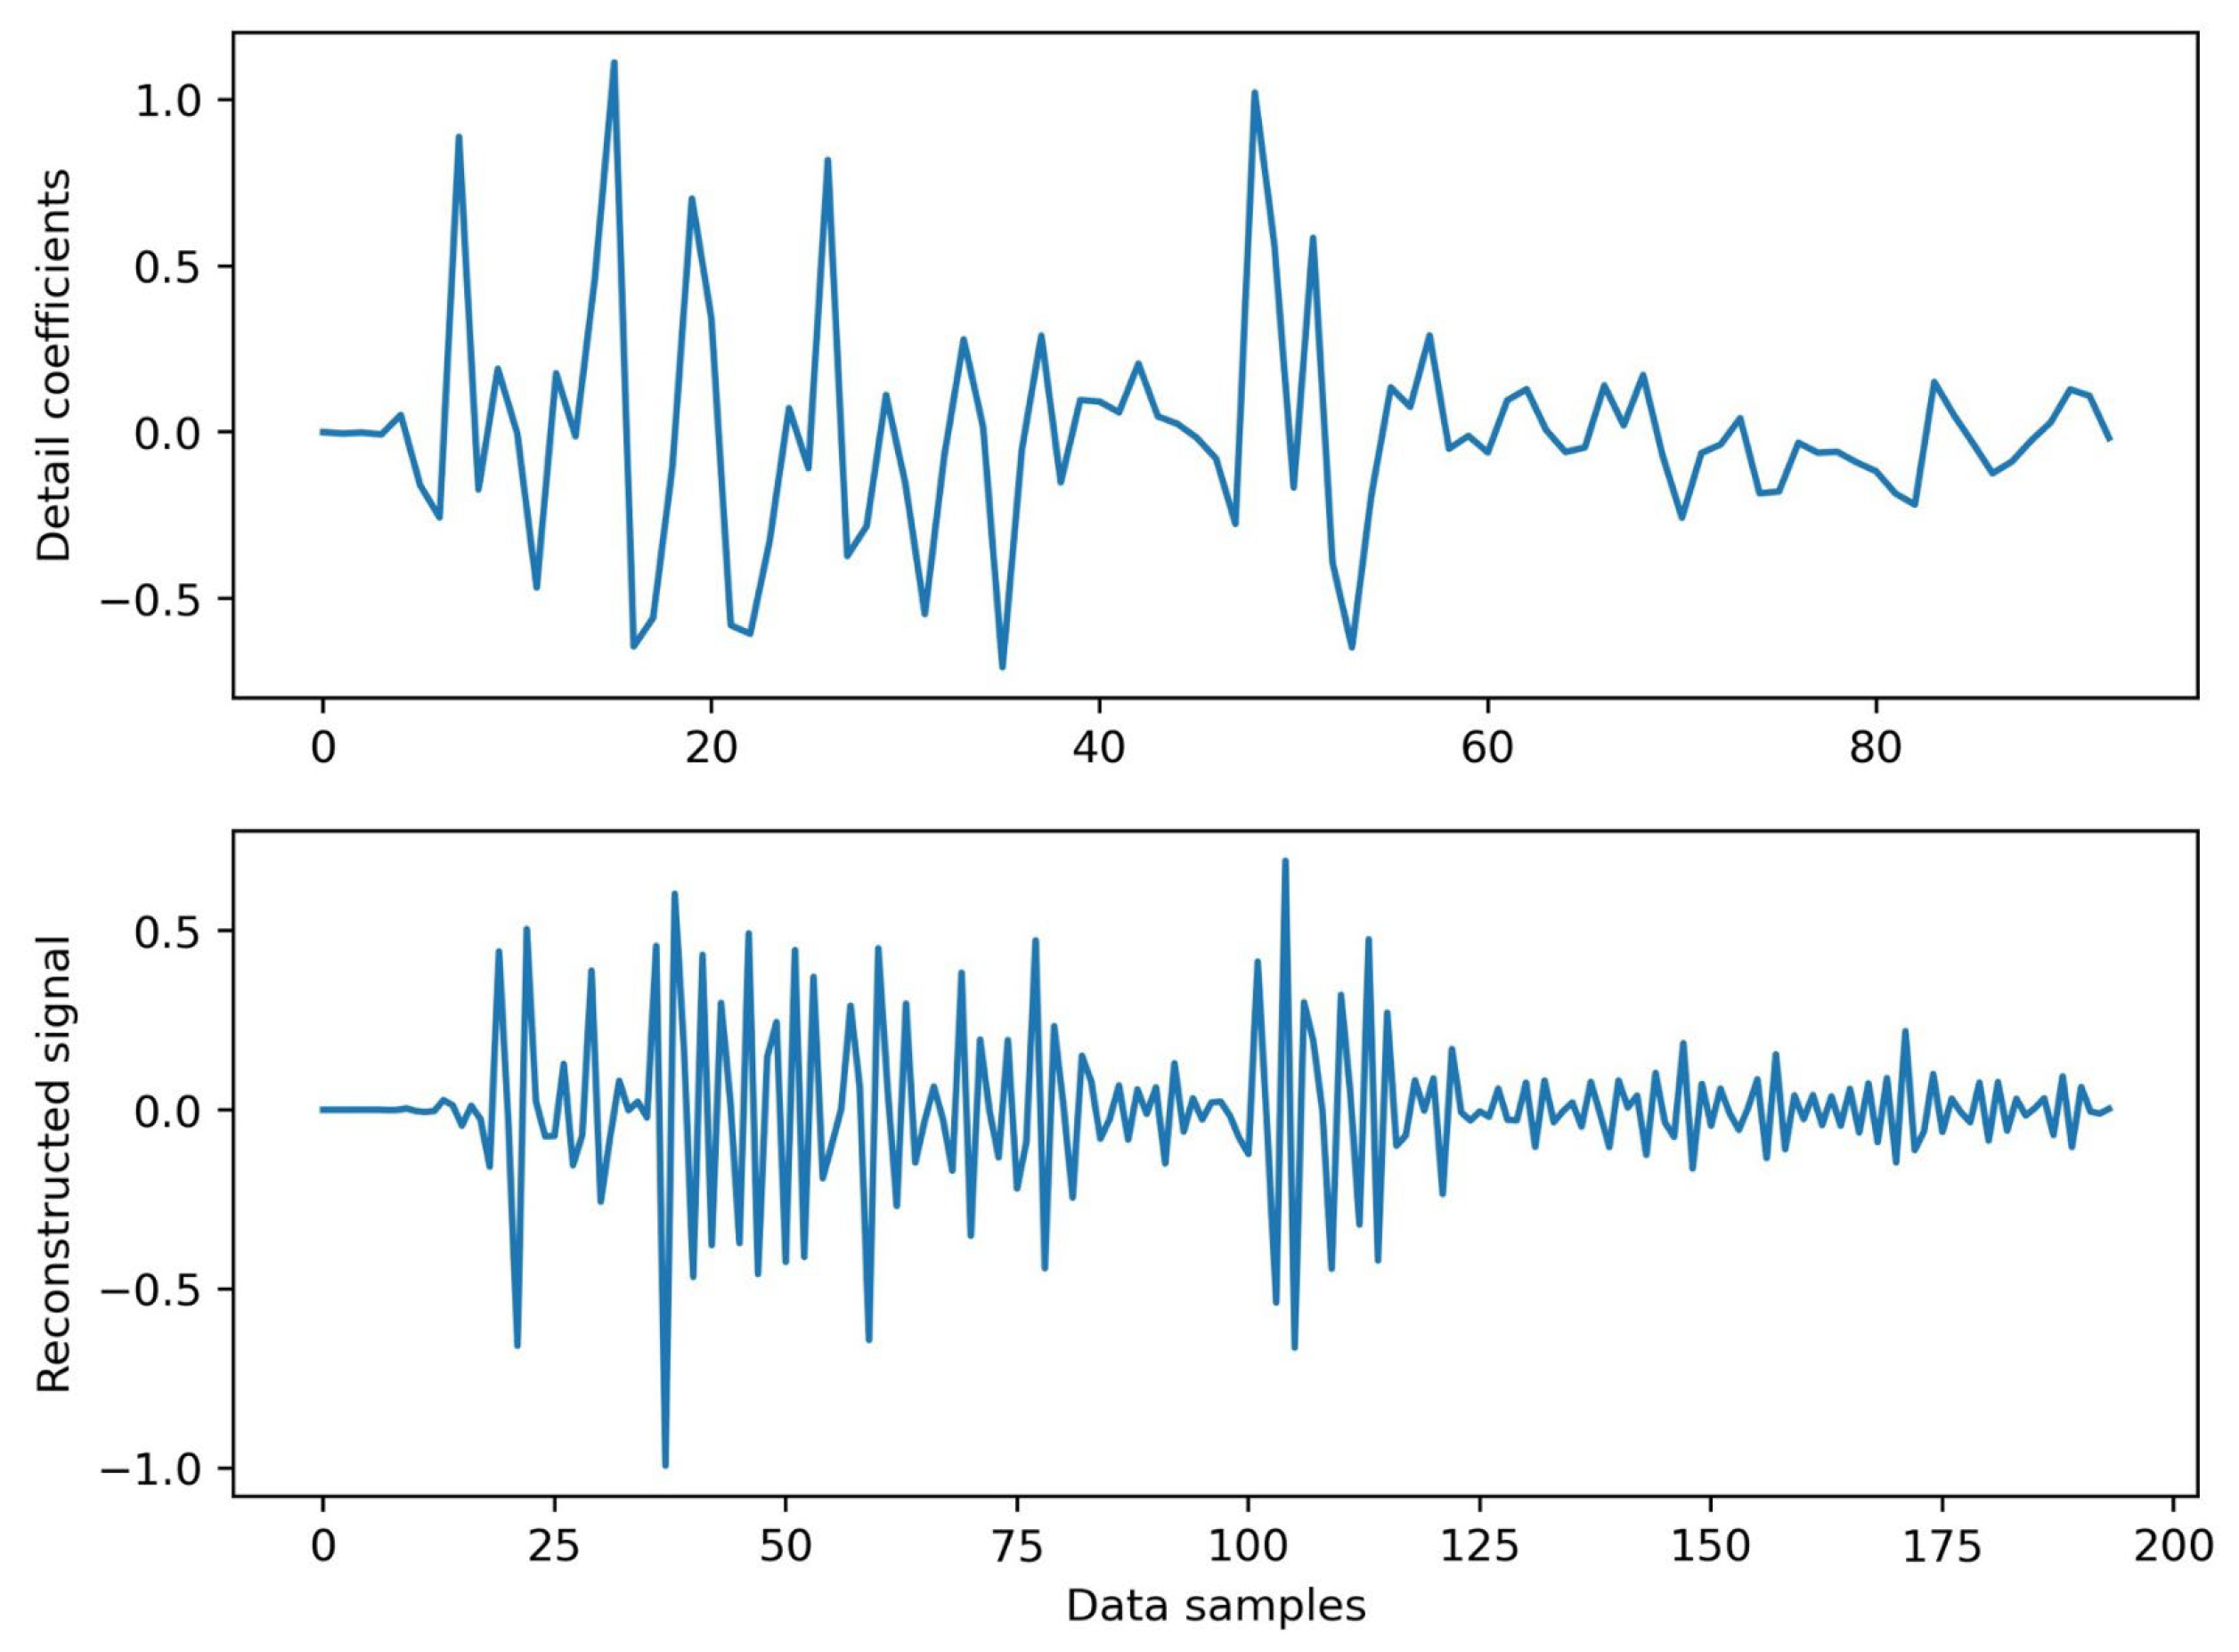
To extract the ULF ranges from the raw data, decomposition is carried out by convolving iteratively with the Daubechies 5 wavelet (“db5”) up to level six. The db5 wavelet is preferred for use as the mother wavelet for the analysis of Z time series data, as reported previously [41,42,49]. The db5 wavelet has proven its effectiveness in isolating ULF anomalies due to its property of orthogonality and efficacy of handling non-stationary signals, due to its compact support nature. The detail and approximation coefficients are computed for the night-time Z time series in a sliding window of 3600 data points for each hour. Each data window is extended by 25% to avoid edge effects, and that extension is later cropped to an hour. The detail coefficients obtained at level 6 are used to reconstruct the signal, which exhibits a central frequency of ~0.01 Hz. The power spectral density (PSD) of the reconstructed signal produces its maximum amplitude at 0.01 Hz, providing verification of the DWT decomposition [42]. The detail coefficients at level six using DWT and their reconstructed signal using inverse DWT for a sampled hour are shown in Figure 3.
The energy of the reconstructed signal at each hour is computed by multiplying the variance by the length of the signal over each hour window, ignoring the NAN values. The derived variance/energy of the reconstructed signal for the duration of the study period (Nov 2019 to Mar 2023) is analyzed for anomalous signatures, which could be produced by lithospheric processes. The set criterion ( μ + n σ , where n is 1, 2, 3…) is imposed for defining and isolating the anomalous signatures, which are well established in the geomagnetic time series, as characterized by a Gaussian distribution [42]. By considering the background geomagnetic field as noise that follows a normal distribution, the background energy levels are eliminated, and the residual high-energy ULF events are assumed to reflect lithospheric sources of energy.

3.2. Multifractal Computations of the Geomagnetic Signal

Multifractal computations are performed on the Z component data using the wavelet leader technique, with the support of the wavelet function ψ 0 , as proposed in Ref. [50], to overcome shortcomings like applicability to only a single singularity, no contact support, and instability in the scaling function [51,52]. In the first step of multifractal analysis, the signal x(t) of every night-time hour is decomposed to its maximum level, where the maximum level (j) is defined by l o g 2 ( l e n g t h   o f   ( x ( t ) ) / ( l e n g t h   ( ψ 0 ) + 1 ) .
The decomposition of signal x(t) at the maximum level (j) using the wavelet function ψ 0 at the dyadic scale can be defined as:
w x j , k = x t   2 j ψ 0 ( 2 j t k ) d t   ,
where w x j , k are the wavelet coefficients at scale/maximum level j and time k .
The largest value of coefficients is obtained at the scale 2 j from the union of scales at 2 j 1 , while 3 λ   j , k at a dyadic scale is considered the wavelet leader for the computed hour [53], i.e.,
L X j ,   k   L λ   =   s u p λ 3 λ | w x ( d λ )   | .  
where L X j ,   k is the wavelet leader at scale j and time k and 3 λ represents the coefficients obtained after the union of the coefficients available at scale 2 j and 2 j 1 .
The wavelet leaders selected at each level follow a power–law relationship with scale j and provide the supreme value of the scaling exponent, proportional to the Holder exponent. Thus, the Holder exponent h and wavelet leaders at scale j and time k at the limit of scales 2 j 0 are related, as [54], i.e.,
L X j ,   k C   2 j h .  
For the purposes of generalization of the Holder exponent values, the wavelet leader L X j ,   k is partitioned using moment order q in a range of −10 to +10, based on the length of the data. Furthermore, the structure function of the wavelet leader is estimated at each scale ( 2 j ) with moment order q , in order to estimate the range of the Holder exponent. The structure function S L q ,   j represents the time averages of the qth powers of L X j ,   k at scale ( 2 j ), which are defined as:
S L q ,   j = 1 n j k = 1 n j L X j , k q ,
where n j is the number of wavelet leaders at scale j.
Since the time series function and wavelet leaders follow the regularity condition, the structure functions also follow power–law behavior for 2 j 0 and can be defined as follows [52]:
S L q ,   j = C q 2 j ζ ( q ) .  
From the above relationship, scaling exponents ζ ( q ) are computed from the structure function, based on regression lines between l o g 2 j versus S L q ,   j , which, alternatively, can be defined as:
ζ L ( q )   =   j = j 1 2 w j   l o g 2   S L q ,   j ,    
where w j is the weight factor.
Theoretically, the function for the multifractal spectrum of the scaling exponent ζ L ( q ) is based on Legendre transforms, defined as:
f h   m i n q 0 1   +   q h     ζ L q   ,  
where h is the global Holder exponent and f h is a function of the global Holder exponent.
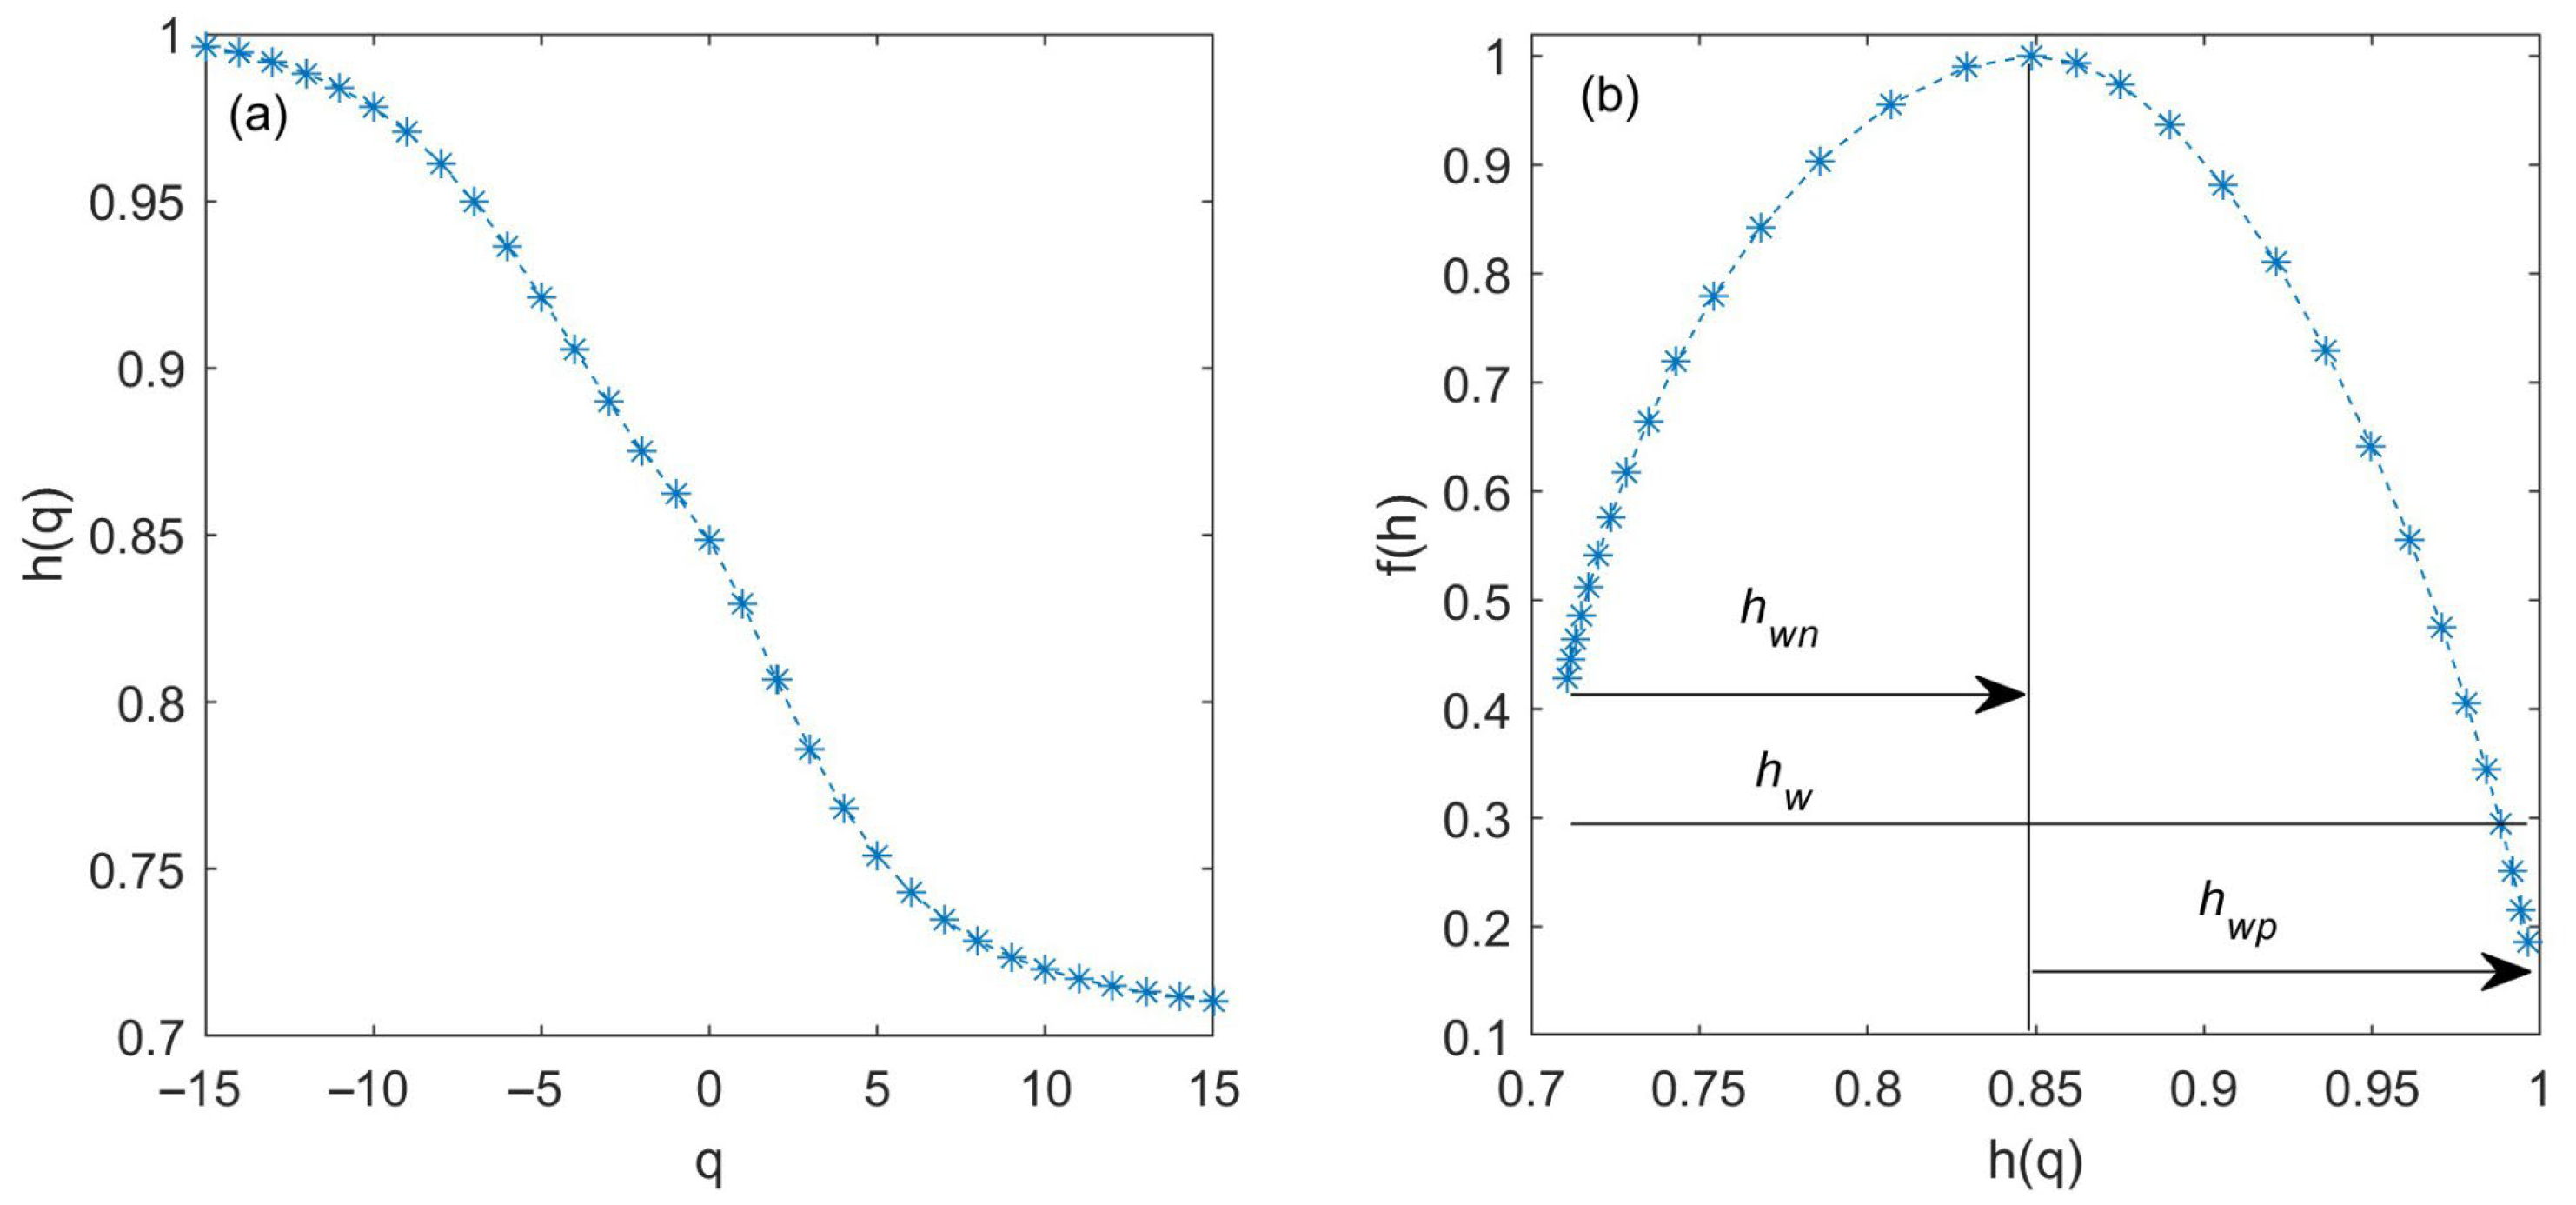
The spectrum width is obtained from the Holder exponent values to determine the degree of intermittency or multifractality in the signal. A larger width of the spectrum (hmax-hmin) indicates greater multifractality or intermittency and vice versa. The total width of the multifractal spectrum h w ( h from q     t o + q ) indicates the overall fluctuations in the signal, while the right-side spectrum width h w p ( h from 0   t o + q ) indicates the intermittency in the signal due to fluctuation in lower-frequency components. Similarly, the left-side spectrum width h w n ( h from q     t o     0 ) indicates intermittency due to higher-frequency components (Figure 4). In the present study, we have computed the multifractal spectra at a sliding window of 1800 data points and created a time series of three multifractal parameters, that is, h w ,     h w p , and h w n . Anomalous fluctuations are extracted by the same condition of >mean plus standard deviation ( μ + σ ).

4. Results

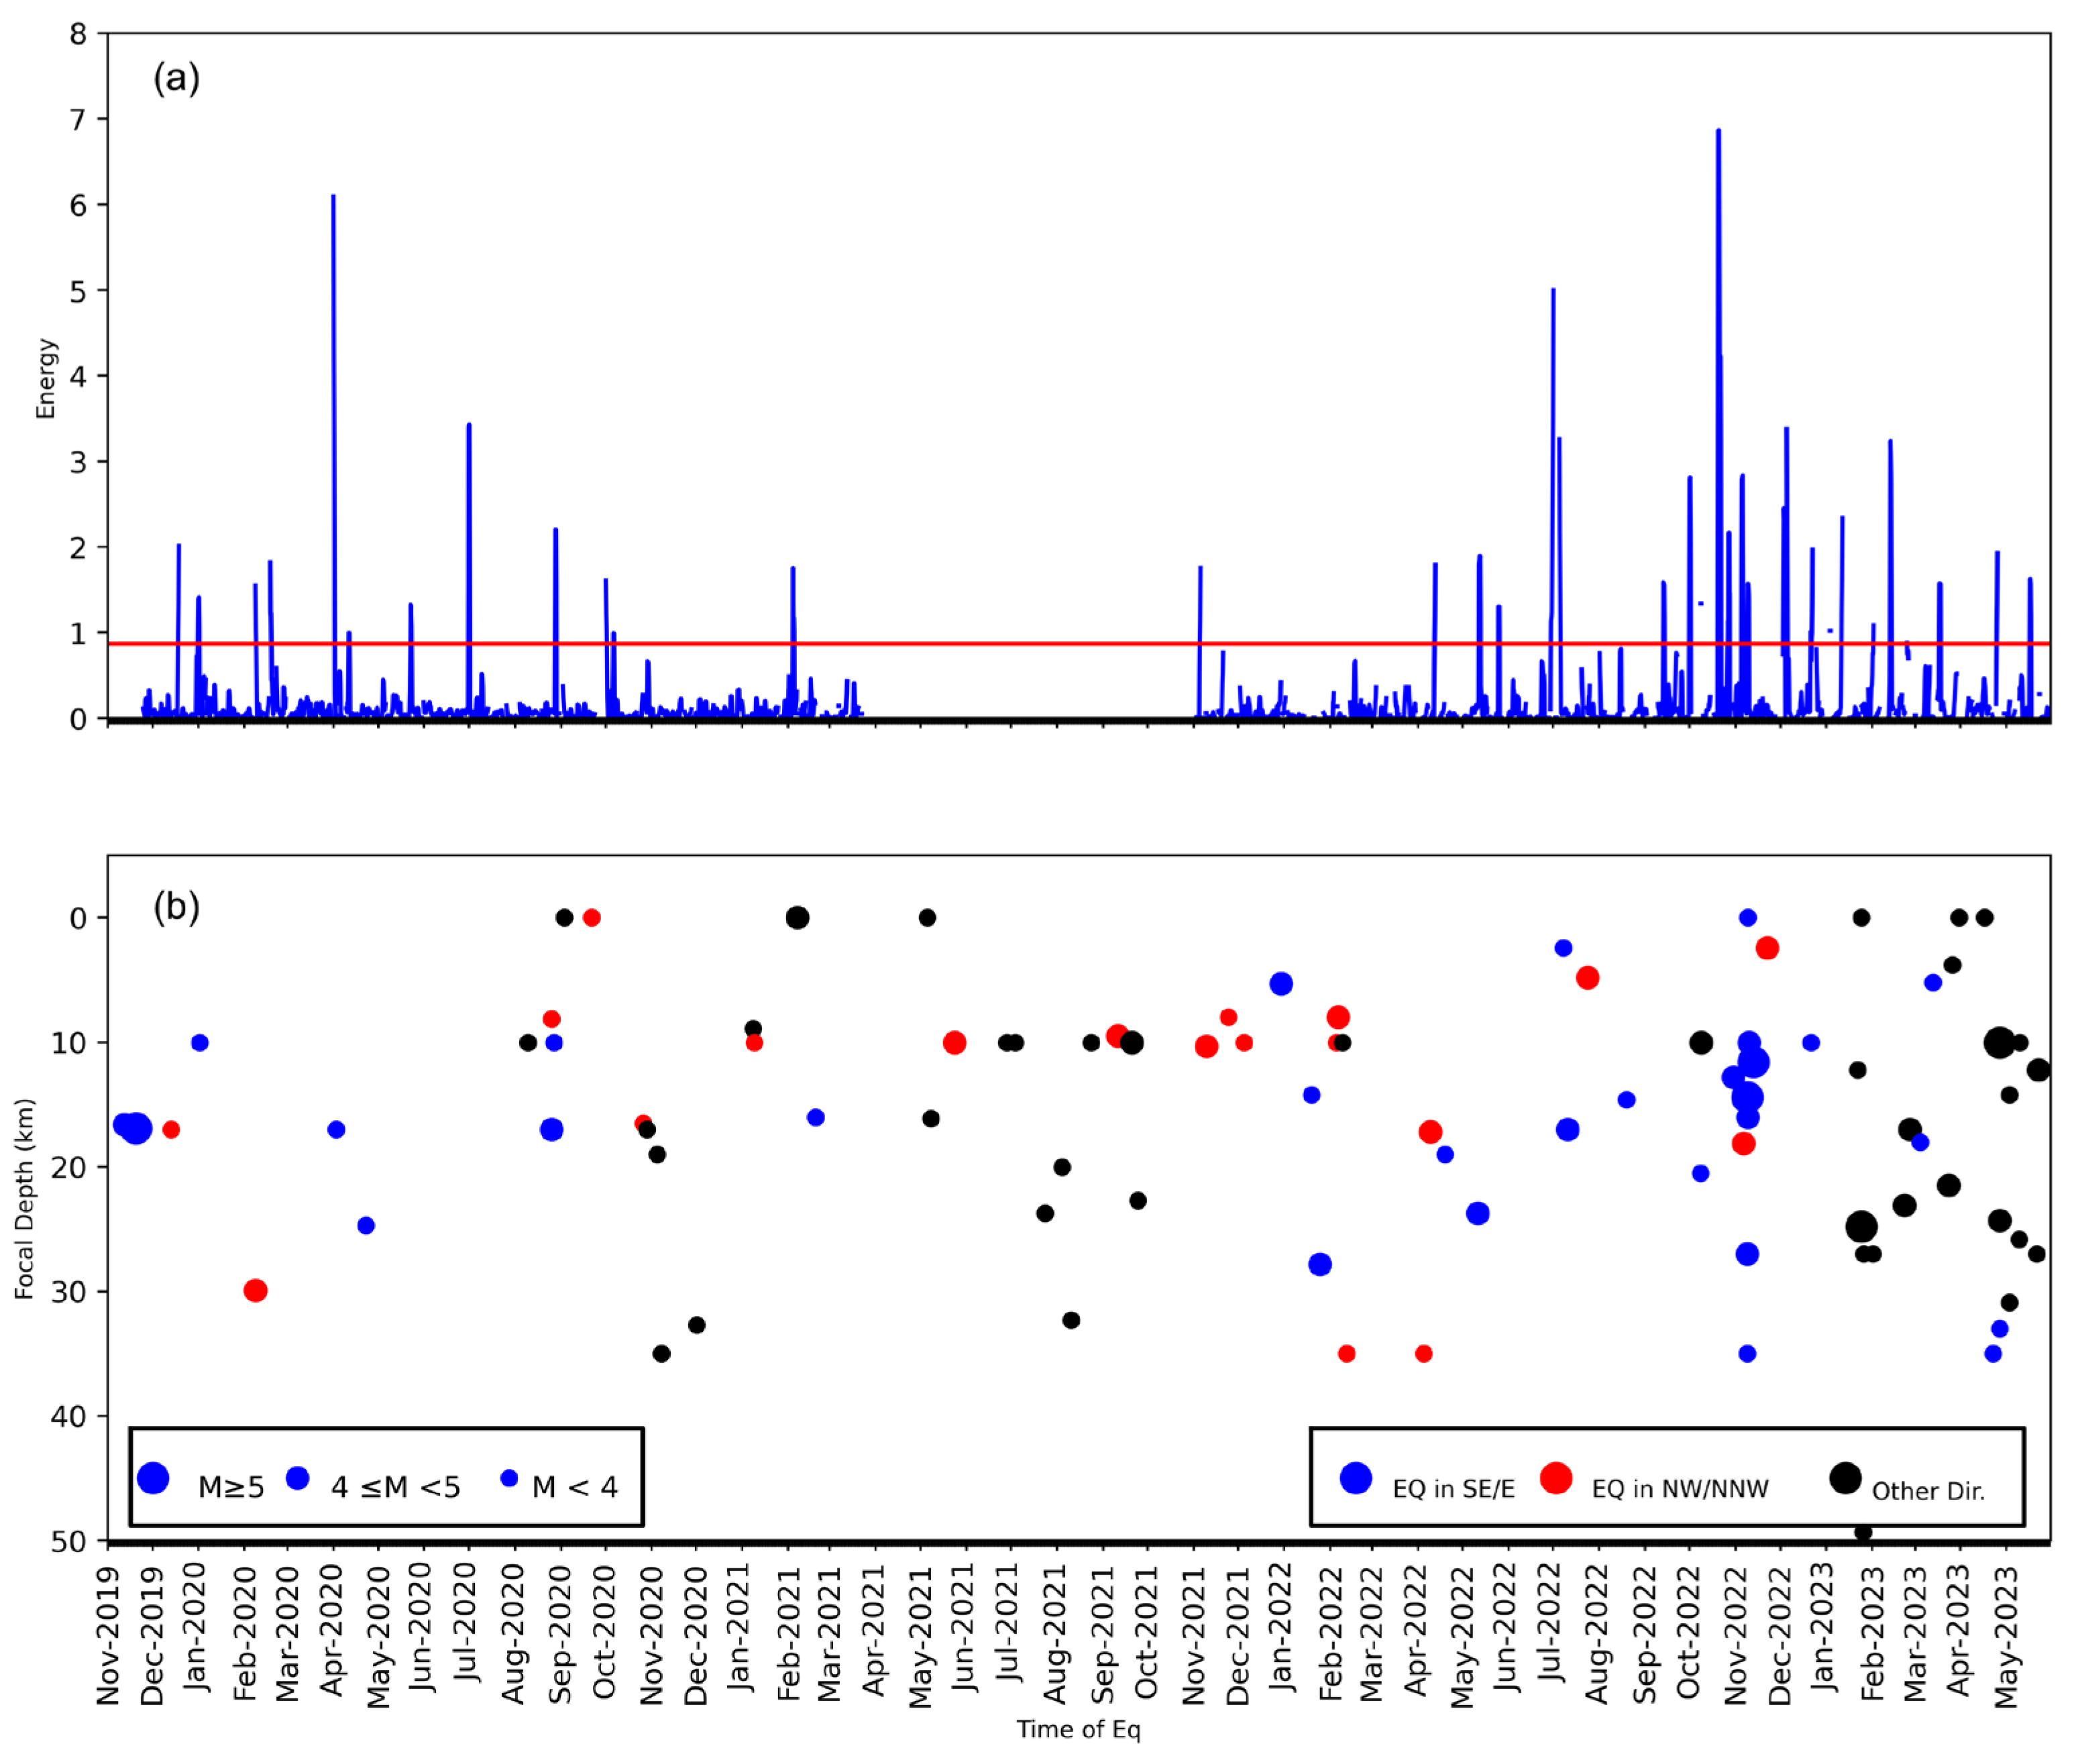
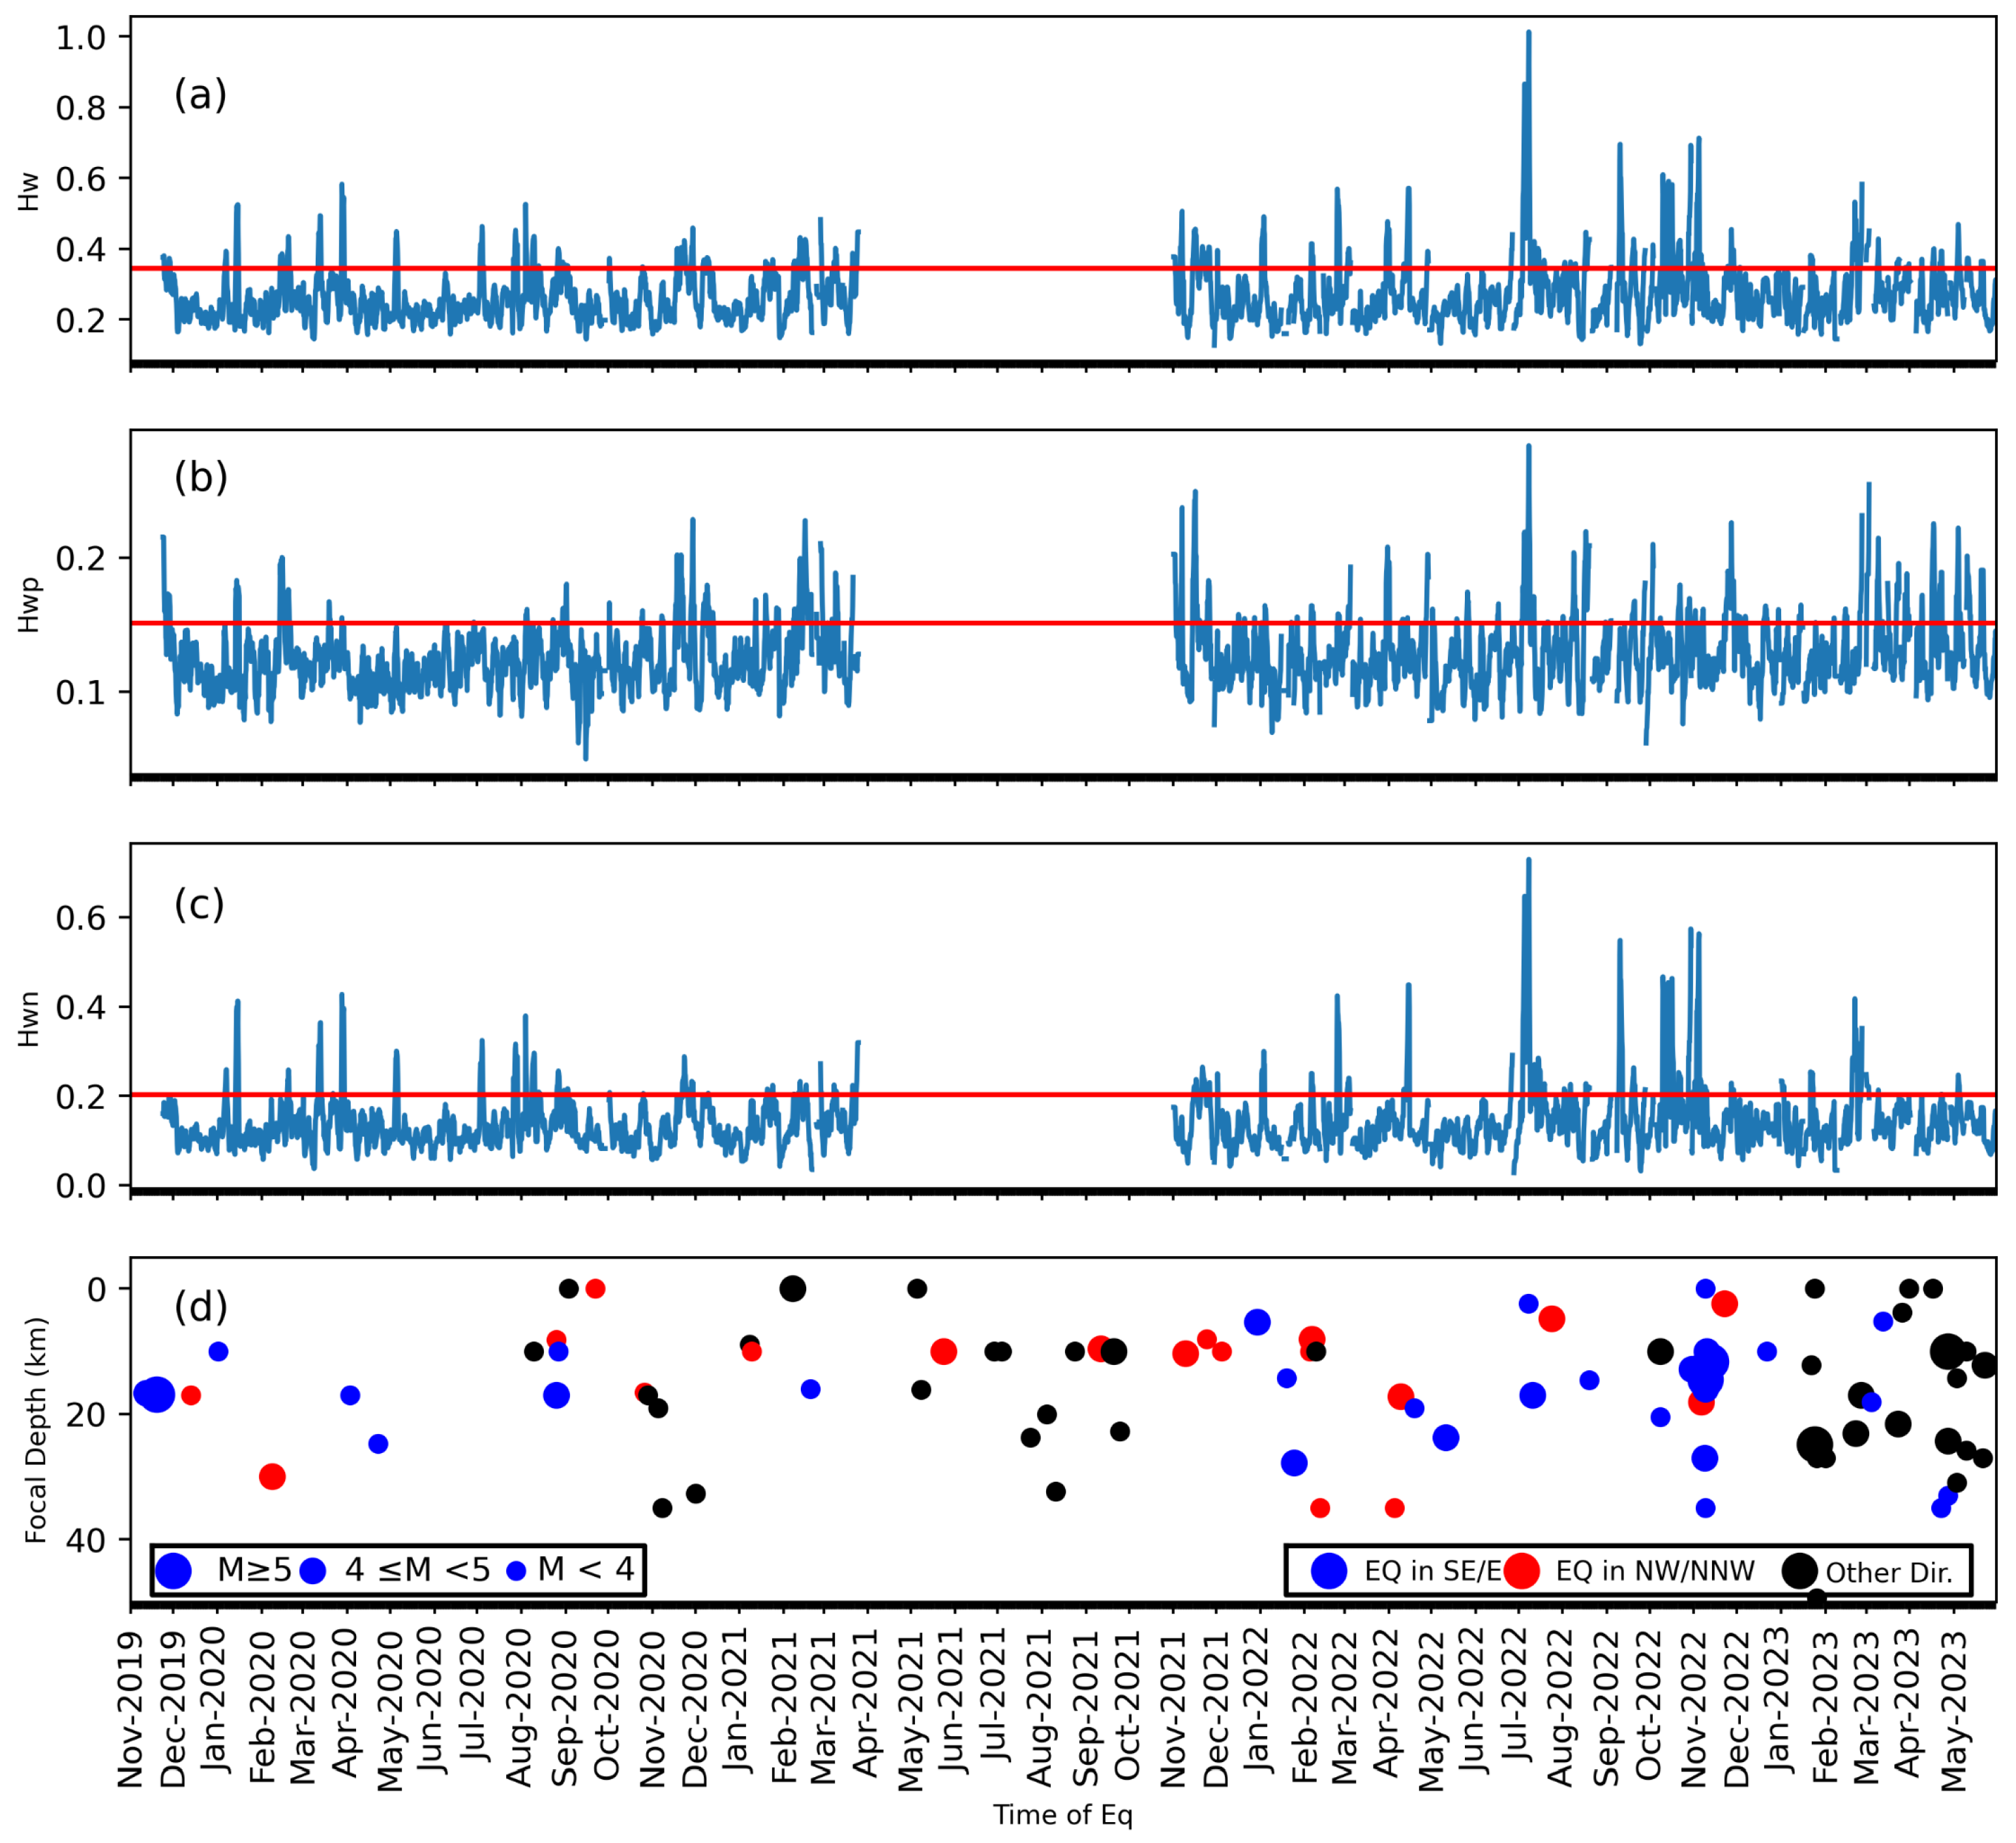
The results obtained from the DWT (Figure 5) and multifractal analysis (Figure 6) represent the amplitudes, persistence, and patterns of anomalous signatures in each parameter. The red horizontal lines in Figure 5 and Figure 6 represent the threshold value and the amplitude of ULF energy, and any computed multifractal components greater than the red line are considered anomalies. A concise summary is presented in Table 1.

4.1. Results from the DWT

The anomalous ULF energies observed during the study period (above the red line in Figure 5) are often observed to have an earthquake occurring within 1–14 days prior to the anomaly. A few earthquakes cannot be distinctly associated with specific anomalous signatures as their occurrences are very close to each other in time, e.g., earthquakes on 27 Aug and 3 Sep 2020 are considered to enhance the anomalous signature in energy on 26 Aug 2020; 1 and 6 days before the earthquake events occurred. In a similar fashion, two earthquakes that occurred on 8 and 10 July 2022 are also attributed to only one anomalous signature of energy on 29 Jun–5 Jul 2020; 10 and 12 days before the earthquakes, respectively. Moreover, the earthquake that occurred on 24 Jul 2022 was preceded by the same anomalous signature, but this was approximately 21 days before, which seems out of range when compared with other events and anomalies; therefore, we have refrained from linking this event with anomalous signatures. Similarly, the three earthquakes occurring on 8–9 Oct 2022 are also attributable to only one anomalous energy event observed on 31 Sep—1 Oct; that is, 9–10 days before the event. Thus, it is again difficult to link the anomalous signatures with any specific earthquake. Nine earthquakes occurred during the period of 6–12 Nov 2022: one earthquake on 6 Nov 2022, five earthquakes on 8 Nov 2022, and three earthquakes during the period of 9–12 Nov 2022. The only anomaly of ULF energy is attributed to the earthquake that occurred on 6 to 8 Nov 2022, but the earthquakes on 8 Nov 2022 were dominant and in the SE direction, while the earthquake on 6 Nov 2022 was an isolated earthquake in the NW direction. In this situation, we consider that the anomalous energy on 5–6 Nov 2022 can be attributed to the earthquake occurring on 8 Nov 2022. Furthermore, the earthquakes occurring on 9 to 12 Nov 2022 can be attributed to the anomalous energy observed on 9 Nov 2022. Thus, the presence of anomalous energy prior to more than one earthquake indicates that these anomalous signatures can be attributed to processes occurring prior to earthquakes in the subsurface of active tectonic areas. Apart from single anomalous energy events attributable to multiple earthquakes in the near future, few earthquakes occurred at a significant difference in time that are attributable to isolated anomalous energy, like the earthquake occurring on 1 Jan 2020, which was preceded by anomalous energy on 30 Dec 2020; that is, 1 day prior. Similarly, the earthquakes occurring on 8 Feb 2020 and 2 April 2020 were preceded by anomalous energy on 7 Feb 2020 and 31 Mar 2020; that is, 1 and 2 days prior to the event, respectively. Furthermore, the earthquake that occurred on 7 Feb 2021 was preceded by anomalous energy on 4 Feb 2021. Again, the earthquake that occurred on 9 Nov 2021 was preceded by anomalous energy on 5–6 Nov 2021; that is, 4 days before the earthquake event. A further two earthquakes occurred on 19 April and 11 May 2022; these were preceded by anomalous energy on 12–13 April that was attributed to the former earthquake, while the anomalous signature on 12 and 25 May 2022 could be attributed to the latter earthquake. Similarly, the earthquake that occurred on 30 Oct 2022 was preceded by two anomalous signatures of energy on 20–22 Oct and 28 Oct 2022, preceding them by 8 and 2 days, respectively. Moreover, the five earthquake events that occurred from 22 Jan to 26 Jan 2023 were associated with two anomalies 9 and 18 days before, i.e., one singular anomaly on 3 Jan 2023 and one persisting anomaly during the period of 13–14 Jan 2023. The earthquake on 1 Feb corresponded to simultaneous anomalous ULF energy on 1 Feb 2023. The four earthquakes that occurred from 26 Feb to 13 Mar 2023 were preceded by ULF anomalous energy from 16 to 17 Mar 2023, i.e., a minimum of 7 days prior to the events. Similarly, the five earthquakes from 24 Mar to 23 Apr 2023 were preceded by anomalous ULF energy during the period from 16 to 17 Mar 2023, i.e., a minimum of 6 days prior to the earthquakes. Furthermore, the 10 earthquakes during the period from 27 Apr to 11 May 2023 are followed by anomalous ULF energy during the period from 22–24 Apr 2023, i.e., 5 to 20 days prior to the events. The two earthquakes that occurred during 22–23 May 2023 were preceded by anomalies on 14–16 May 2023, i.e., 7 days prior to the events.

4.2. Results from the Multifractal Analysis

From the multifractal analysis, we found 21 anomalous signatures in the multifractal component that were often concurrent with an anomalous signal in energy (Figure 6). Like the responses of energy from the DWT analysis, few anomalies in the multifractal component were attributable to the multiple earthquake events that occurred very close to each other. For example, two earthquakes occurred on 27 Aug and 3 Sep 2020 and are associated with anomalous signatures observed on 28 Aug 2020; that is, 1 day after and 8 days before the earthquakes, respectively. Furthermore, the earthquakes occurring on 8 and 9 Jan 2021 were preceded by an anomalous h w p component on 6–10 Dec 2020, which was almost 1 month before, and with no anomalous signature in energy-estimated DWT. Thus, based on trends of occurrence of anomalies in the multifractal component, we have ignored this anomaly in terms of linking it with the earthquakes, which occurred after a comparatively large time gap. The two earthquakes that occurred on 24 Nov and 4 Dec 2021 were linked with the common anomalies observed on 15–17 Nov 2021; that is, 9 and 18 days before the earthquake events, respectively. Similarly, 4 earthquakes occurring during the period 4–12 Feb 2022 were associated with an anomalous signature on 5–6 Feb 2022; that is, 1 day after and 6 days before the earthquakes, respectively. Furthermore, the two earthquakes occurring on 5 and 9 April 2022 were preceded by a common anomaly ( h w p and hw multifractal component) on 30–31 Mar 2022; that is, 5 and 9 days before the earthquakes, respectively. The two earthquakes that occurred on 8 and 10 Jul 2022 were preceded by anomalous signatures (in the h w p , h w n , and h w multifractal components) on 3–8 Jul 2022; that is, 5–7 days prior to the earthquake event, which is also common with anomalous signatures of energy from DWT. The three-earthquake event that occurred during the period 8–9 Oct 2022 was associated with two anomalous signatures on 2–5 Oct and 10–16 Oct 2022 ( h w p ; h w p and h w n ); that is, 6 days before and 2 days after the earthquake events, and these anomalies are also common with the anomalous energy from the DWT analysis. Similarly, nine earthquakes occurred during the period 6–12 Nov 2022 and were associated with common anomalies ( h w n and h w ) observed on 3–4 Nov 2022; that is, 3 to 9 days before the occurrence of the earthquakes. There were also a few multifractal anomalies that are attributable to those earthquakes that were isolated from nearby earthquakes in terms of time, such as the earthquakes that occurred on 8 Feb 2020, preceded by an anomalous multifractal signature by h w , h w p , and h w n from 14–16 Jan 2020; that is, 15 days prior to the event. Furthermore, the earthquake that occurred on 2 Apr 2020 was preceded by anomalous h w and h w n signatures on 12–13 Mar and 28–29 Mar 2020; that is, 15 and 4 days prior to the event, respectively. Similarly, the anomaly that occurred on 9 Aug 2020 was preceded by anomalous h w n and h w n signatures on 28–29 Jul (11 days prior) and 3–4 Aug 2020 (5 days prior), including simultaneous anomalies in h w n and h w . Earthquakes occurred on 1 Dec 2020, 7 Feb, and 19 Feb, preceded by anomalous h w p ; h w p ; h w p and h w signals 4, 12, and 7 days prior to the earthquake events. Similarly, the earthquakes that occurred on 9 Nov 2021, 11 May 2022, and 19 Aug 2022 were preceded by anomalous h w p and h w , h w p , h w p (large amplitude), and h w signals 4, 13, 11, and 4 days prior to the earthquake events. The earthquakes that occurred during 22–25 Jan 2023 were preceded by three anomalies: 30 Dec 2022 to 2 Jan 2023 ( h w p and h w n anomalies); 13–14 Jan 2023 ( h w p ); and 21–24 Jan 2023 ( h w n ). Furthermore, the earthquake that occurred on 1 Feb 2023 did not correspond to any anomalous signatures. The earthquake that occurred on 26 Feb 2023 was followed by anomalies on 25–26 Feb 2023 ( h w n and h w p ), i.e., 1 day prior to the event. Furthermore, the earthquake that occurred on 3 Mar 2023 was preceded by h w p anomalies 2 days earlier. The earthquake that occurred on 13 Mar 2023 was preceded by h w p anomalies (on 8–15 Mar 2023) five days earlier. The two earthquakes that occurred on 24 and 26 Mar 2023 were preceded by h w p anomalies on 23–25 Mar 2023; i.e., 1–3 days prior to the event. Similarly, the earthquake that occurred on 31 Mar 2023 was preceded by an h w p anomaly (28–31 Mar 2023); i.e., 3 days prior to the event. The next earthquake that occurred on 17 Apr 2023 was followed by two anomalous h w p signatures on 8–10 Apr and 15–18 Apr 2023; i.e., 9 days prior to the event. Moreover, the four earthquakes that occurred from 27 to 28 Apr 2023 were preceded by h w p anomalies 6 days prior to the events. Similarly, the three earthquakes that occurred from 1 to 4 May 2023 were followed by h w p and h w n anomalies prior to 1–3 days of events. The next four earthquakes that occurred from 10 to 23 May 2023 were preceded by an h w p anomaly on 9–12 May 2023; i.e., 1–12 days prior to the events.

5. Discussion

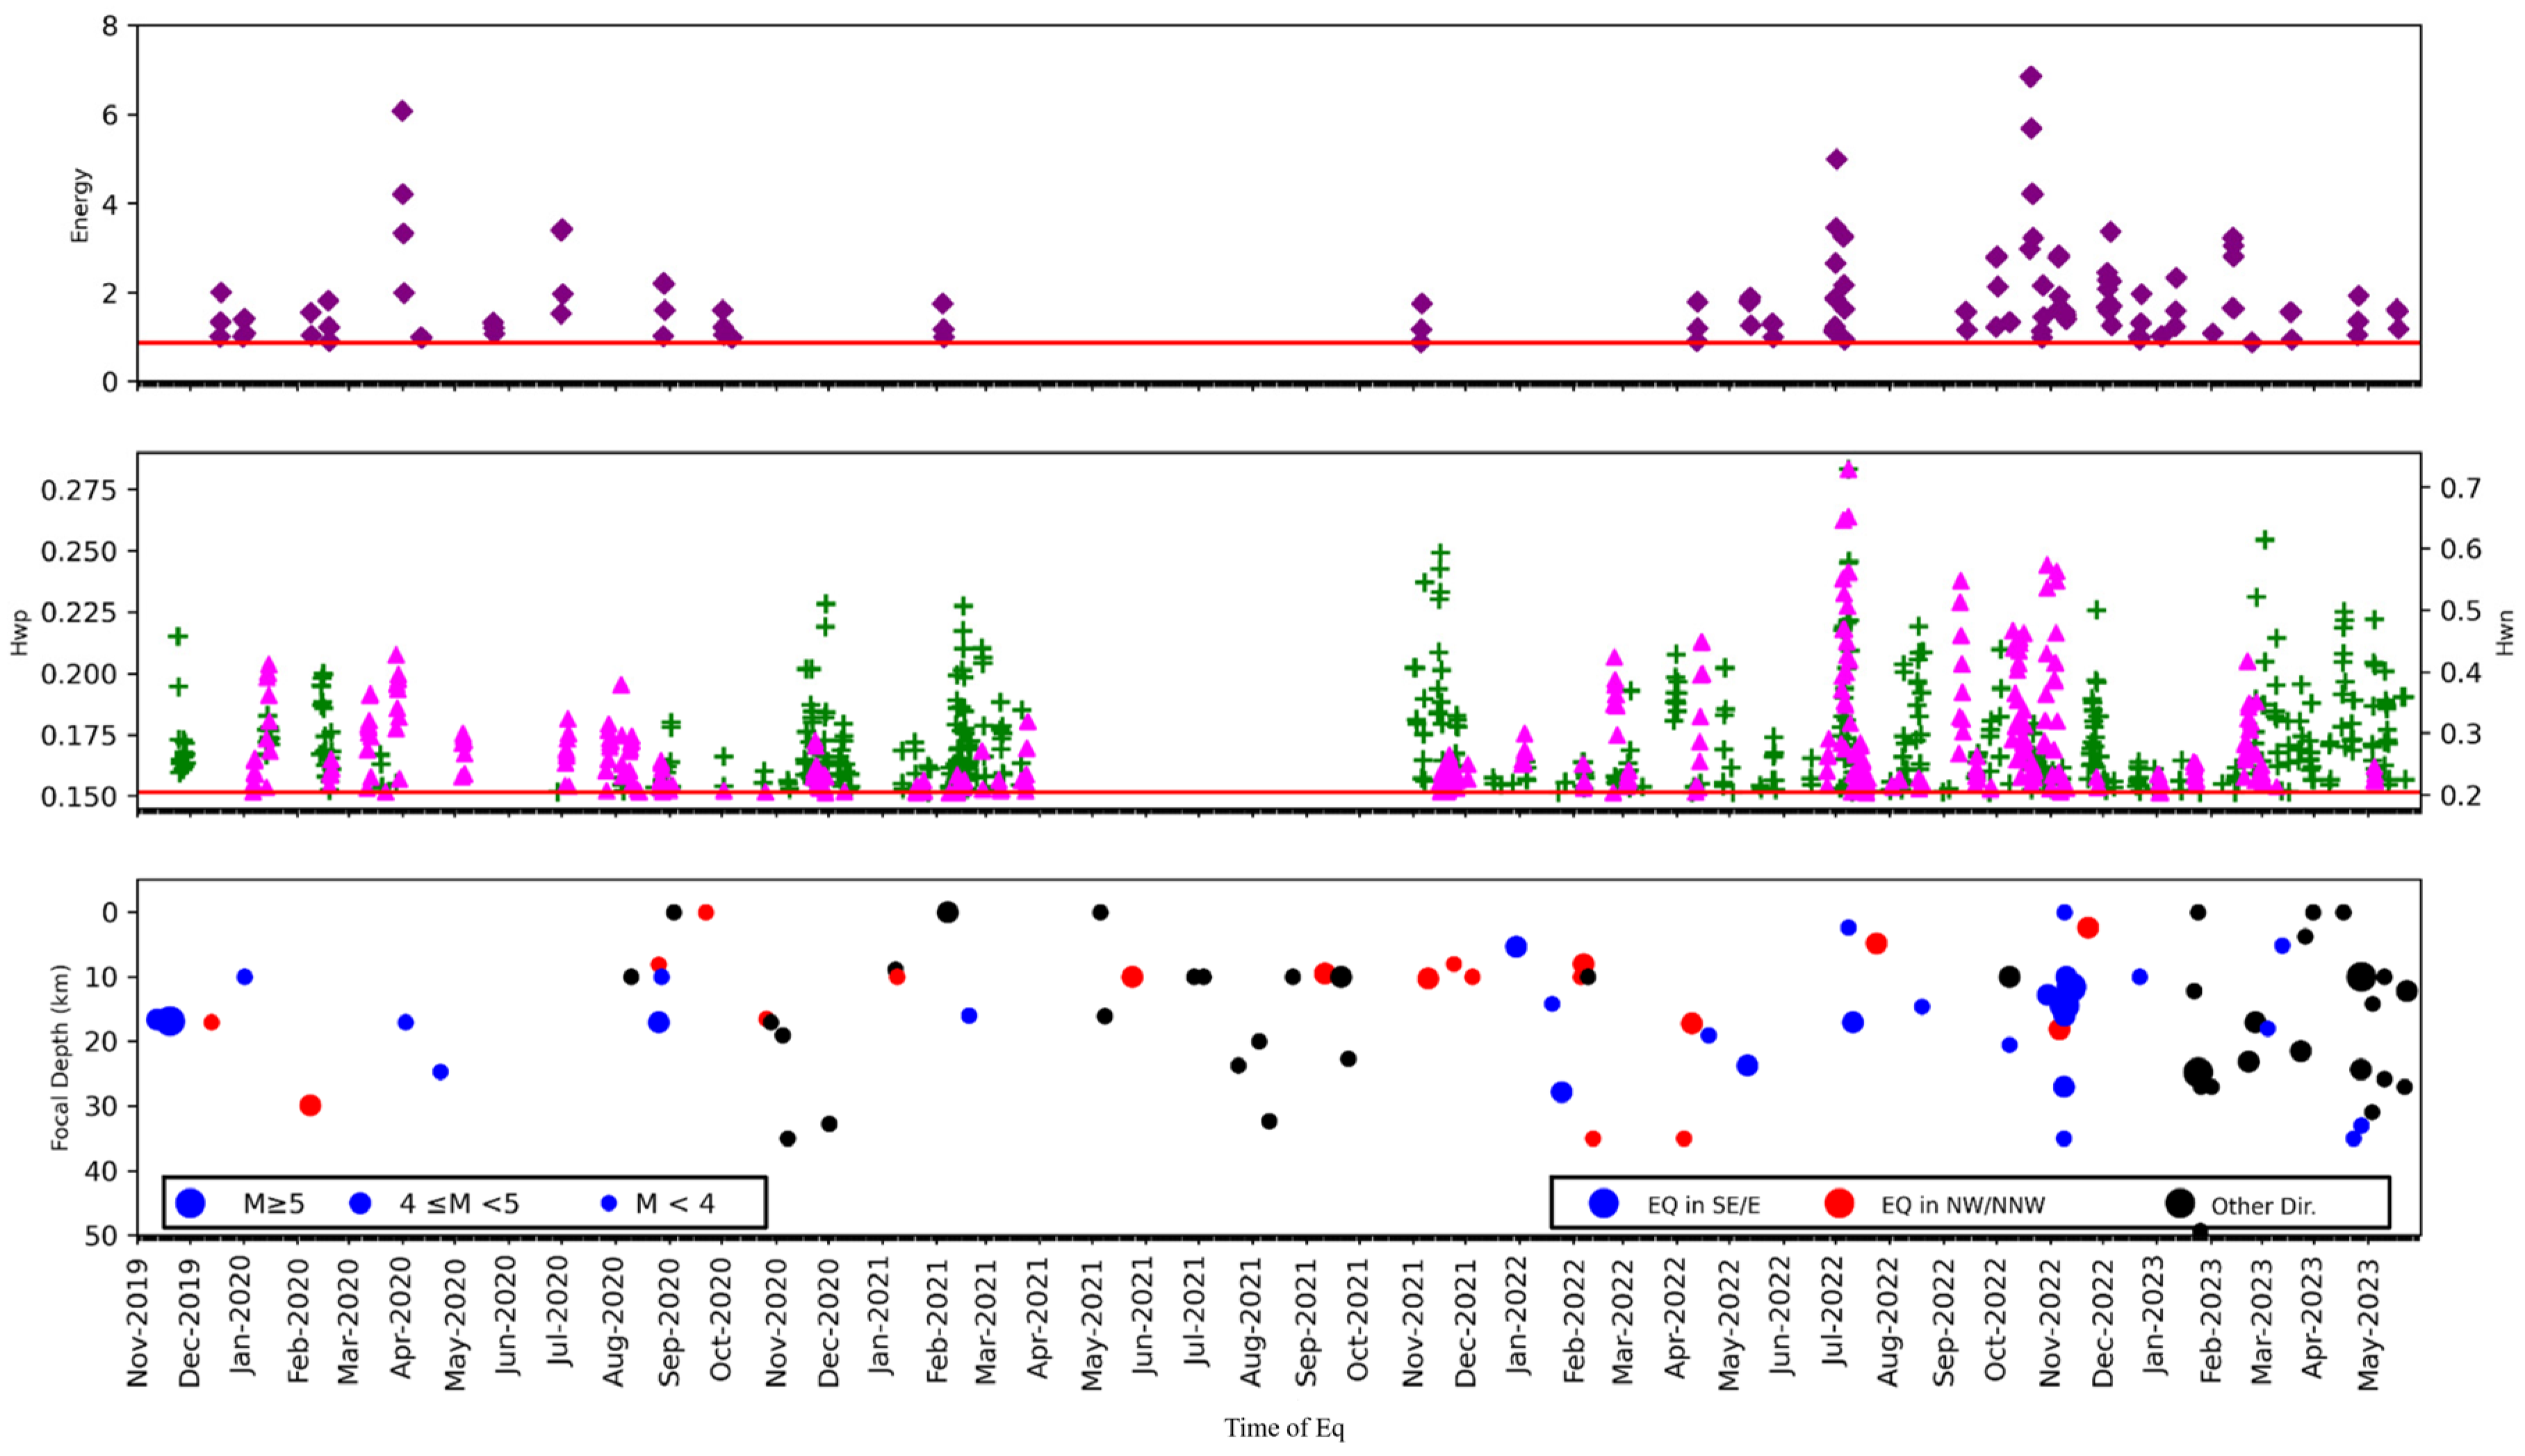
We examined the combination of anomalies in ULF energies and h w p and h w n signatures in relation to earthquake occurrence patterns, as shown in Figure 7. In the first instance, the correspondence was noticeable between the occurrence of ULF with h w n / h w p anomalies: high ULF energies occurred around the time of prominent h w n anomalies (Aug 2022, Nov 2022), whereas dominant h w p anomalies occurred along with moderate-to-low ULF energies (Mar–May 2023). Furthermore, the higher h w n and ULF anomalies occurred around the times of the earthquakes to the E/SE of PTY (blue circles in Figure 7, bottom panel). We analyzed the details of these correlations over the entire data duration.
In the second half of December 2019, a cluster of h w p anomalies occurred, 5 days after an M > 5 earthquake to the SE, at a depth of 15 km. Then, 13 days later, an M > 2 earthquake occurred to the NW at a similar depth, which was followed by a ULF energy surge 7 days later. The longer-lasting fractal anomalies could reflect a combination of EM disturbances from post- and pre-earthquake processes from both the NW and SE. The small-amplitude ULF signals could be due to the NW earthquake. Signatures of h w n were observed during the first half of January 2020, along with a few weaker h w p and ULF anomalies. These were followed by an earthquake 4 < M < 5 about 30 days later, to the NW, at a depth of 30 km. During the second week to the end of April 2020, scattered h w n anomalies, along with a few h w p anomalies, led to prominent ULF energy signals. One M < 4 earthquake followed immediately, followed by another, 20 days later, at 15 and 30 km depths, respectively. Small-amplitude h w n anomalies were observed in early June 2020, along with small-amplitude ULF in late June 2020, which re-emerged in early August 2020. Overlapping h w n and h w p anomalies were seen in early September, along with ULF anomalies in late September to early October 2020. The early September cluster coincided with a M < 4 shallow earthquake. One M > 5 earthquake and 2 smaller ones occurred 9 days after the end of the early September cluster to the NW and SE of PTY. A shallow M < 4 earthquake off the MCT coincided with the last of the anomaly in early October 2020. Another M < 4 earthquake occurred to the NW, 19 days later. Two small clusters of h w p and h w n anomalies occurred in early and late November 2020, when 2 M < 4 earthquakes were recorded that coincided with the second cluster. Anomalies in h w p and h w n were widespread during December 2020, with a 3 M < 4 deeper crustal earthquake that occurred at this time. Two more occurred in mid-February 2021, 23 days after the last anomalous signature. From the last week of February 2021 to mid-April 2021, intermittent h w p anomalies with few h w n anomalies were observed, with a few low-amplitude ULF anomalies occurring in the first week of March 2021 also. This last cluster coincided with a shallow 4 < M < 5 earthquake, followed by a small mid-crustal earthquake to the SE in mid-March 2021. Twelve mid-crustal earthquakes occurred from the end of July to October 2021, mostly at focal depths of < 10 km, but due to the 7-month data gap, no anomalies could be analyzed during this time. Two of these earthquakes were to the NW, the others were to the north of the MCT and several tens of kilometers north of it. From December 2021 onward, the frequency of anomalies increased: intermittent overlapping h w p and h w n anomalies could be observed right up until Dec 2022. From January to May 2023, h w p anomalies were again more prominent, along with ULF signatures a few days before or after. The clusters from December 2021 to March 2022 coincided with several moderate earthquakes: first, three shallow earthquakes to the NW occurred, then three shallow-to-mid-crustal SE earthquakes occurred in February 2022, followed by three more NW earthquakes in March 2022. A fresh cluster of anomalies occurred in early April 2022, along with three clusters in May 2022; the one in mid-May overlapped both h w n and h w p anomalies, as well as small-amplitude ULF anomalies. The occurrence of ULF anomalies became more prominent in June 2022, simultaneous to the h w p anomalies in June 2022 and h w p along with h w n anomalies in the first half of August 2022. Two SE earthquakes occurred during this cluster, followed by one to the NW. The cluster in Sept 2022 was predominantly of h w p signatures, while one SE earthquake of M < 4 occurred a few days after. October and November 2022 were marked by prominent h w n and ULF anomalies, overlapped by smaller clusters of Hwp. Two off-MCT and two SE earthquakes occurred during Nov 2022. The anomalies continued up to December 2022, with eight SE earthquakes, two of them of M > 5, and two NW earthquakes occurring during the first half of the month. January 2023 saw a few small h w p anomalies, along with moderate ULF anomalies. Several off-MCT earthquakes were recorded about 15 days later, toward the end of February 2023. Prominent h w p and smaller h w n anomalies were observed from mid-March 2023 to May 2023, along with a few small-amplitude ULF anomalies. Eight earthquakes occurred off-MCT in this period, as well as four SE earthquakes. In short, h w p anomalies were more dominant during the months from December to March; in 2022, they were also prevalent during August, September, and November; in 2023, they extended to May. Anomalies in h w n occurred more frequently during the middle months, from July to September. While this pattern is not distinguishable in the earthquake catalog, we suggest that the dry and wet seasons may affect the physical processes of EM signatures, thereby producing a broad seasonal trend. The latter halves of 2019 and 2022 experienced more SE earthquakes; 2021 and the first half of 2023 saw more off-MCT earthquakes. This may be due to the alternation of locations of stress accumulation.
In a study of ULF signatures [55] carried out in the Andaman–Nicobar subduction zone, with a similar frequency and magnitudes of earthquakes, 54 ULF anomalies occurred over 13 months, associated with 63 earthquakes (4.5 < M < 5.3), which were recorded at focal depths up to 100 km and epicentral distances of 200 km. Only 15 among the anomalies had substantial amplitudes; the largest were followed by earthquakes on the SS fault, while moderate ULF anomalies preceded events on the WAF. It was also found that these ULF anomalies occurred 2 weeks to 3 days before the following seismic event.
Previous studies [39] of geomagnetic data at Kakioka (KAK) station in Japan from 2001 to 2010, wherein the authors analyzed the energy of the vertical component of signals in ULF frequency around 0.01 Hz, performing DWT analysis using the statistical epoch analysis (SEA) approach, ULF magnetic anomalies appeared 6–15 days before earthquakes. They also noted that the geomagnetic signatures at KAK station was more sensitive to shallow and small epicentral distance earthquakes (<100 km radius and crustal focal depths) than to more distant earthquakes that were generated in the upper mantle [56]. Ref. [42] revisited this work and validated the results through multiple sensitivity analyses and identified more statistically significant anomalies after testing multiple outlier rejection schemes, applying the SEA algorithm to only upper-mantle earthquakes to reproduce the results. They reported anomalies 6–15 days prior to the main event, as in [55], for earthquakes within a radius of 100 km, and identified pre-earthquake anomalies within 11–15 days for earthquakes with an epicentral distance between 100 and 216 km, which were not observed by the authors of [55,56]. In this study, we detected 100 anomalies in ULF energies over ~2.5 years, during which time, 93 moderate earthquakes were recorded at focal depths of up to 50 km and epicentral distances of 250 km. With multiple anomalies occurring before and after the earthquakes, we have not definitively assigned individual anomalies to earthquakes but have focused on the nature and trend of anomalies.
In a recent analysis of mono and multifractal analysis of geomagnetic data in the region of moderate earthquakes in Andaman–Nicobar [27], the anomalous signatures of multifractal parameters were noted 10–20 days prior to moderate earthquakes during the period from March 2019 to April 2020. The two types of enhancements highlighted in the study, that is, h m a x (maximum values of the Holder exponent function) with f m a x (maximum number of the Holder exponent function) and of h w (spectrum width) with f D (monofractal dimension), indicate anomalies with low-frequency and high-frequency perturbations, respectively. Multifractal analysis of the ULF geomagnetic data during the Guam earthquake (Ms = 8.0) in 1993 by the authors of [36] showed a decrease in h w n and an increase in h w 30 days prior to the earthquake. This region is tectonically highly active due to the subduction of the Pacific plate under the Philippine plate, exhibiting a strike-slip fault along the trench [56].
In the present study, enhancements in h w n and h w p frequently overlap or occur very close to each other in time. Only in Feb–Mar 2021 and Apr–May 2023 were persistent h w p anomalies observed, during which time earthquake events occurred 50–80 km north of the MCT (Figure 7). Furthermore, the persistence of anomalies was quite similar in all cases, which possibly reflects the similar earthquake characteristics in a broader sense, that is, moderate magnitude earthquakes with the predominance of a thrust environment in all these earthquakes. The anomalies, which occurred in h w n along with h w , were linked to the earthquakes occurring on the MCT, except for a few earthquakes with M < 3.8 that were attributed to h w p with h w ,. The anomalous signatures in h w p , along with h w , were observed on the MCT fault but were in the NW direction (Figure 6).
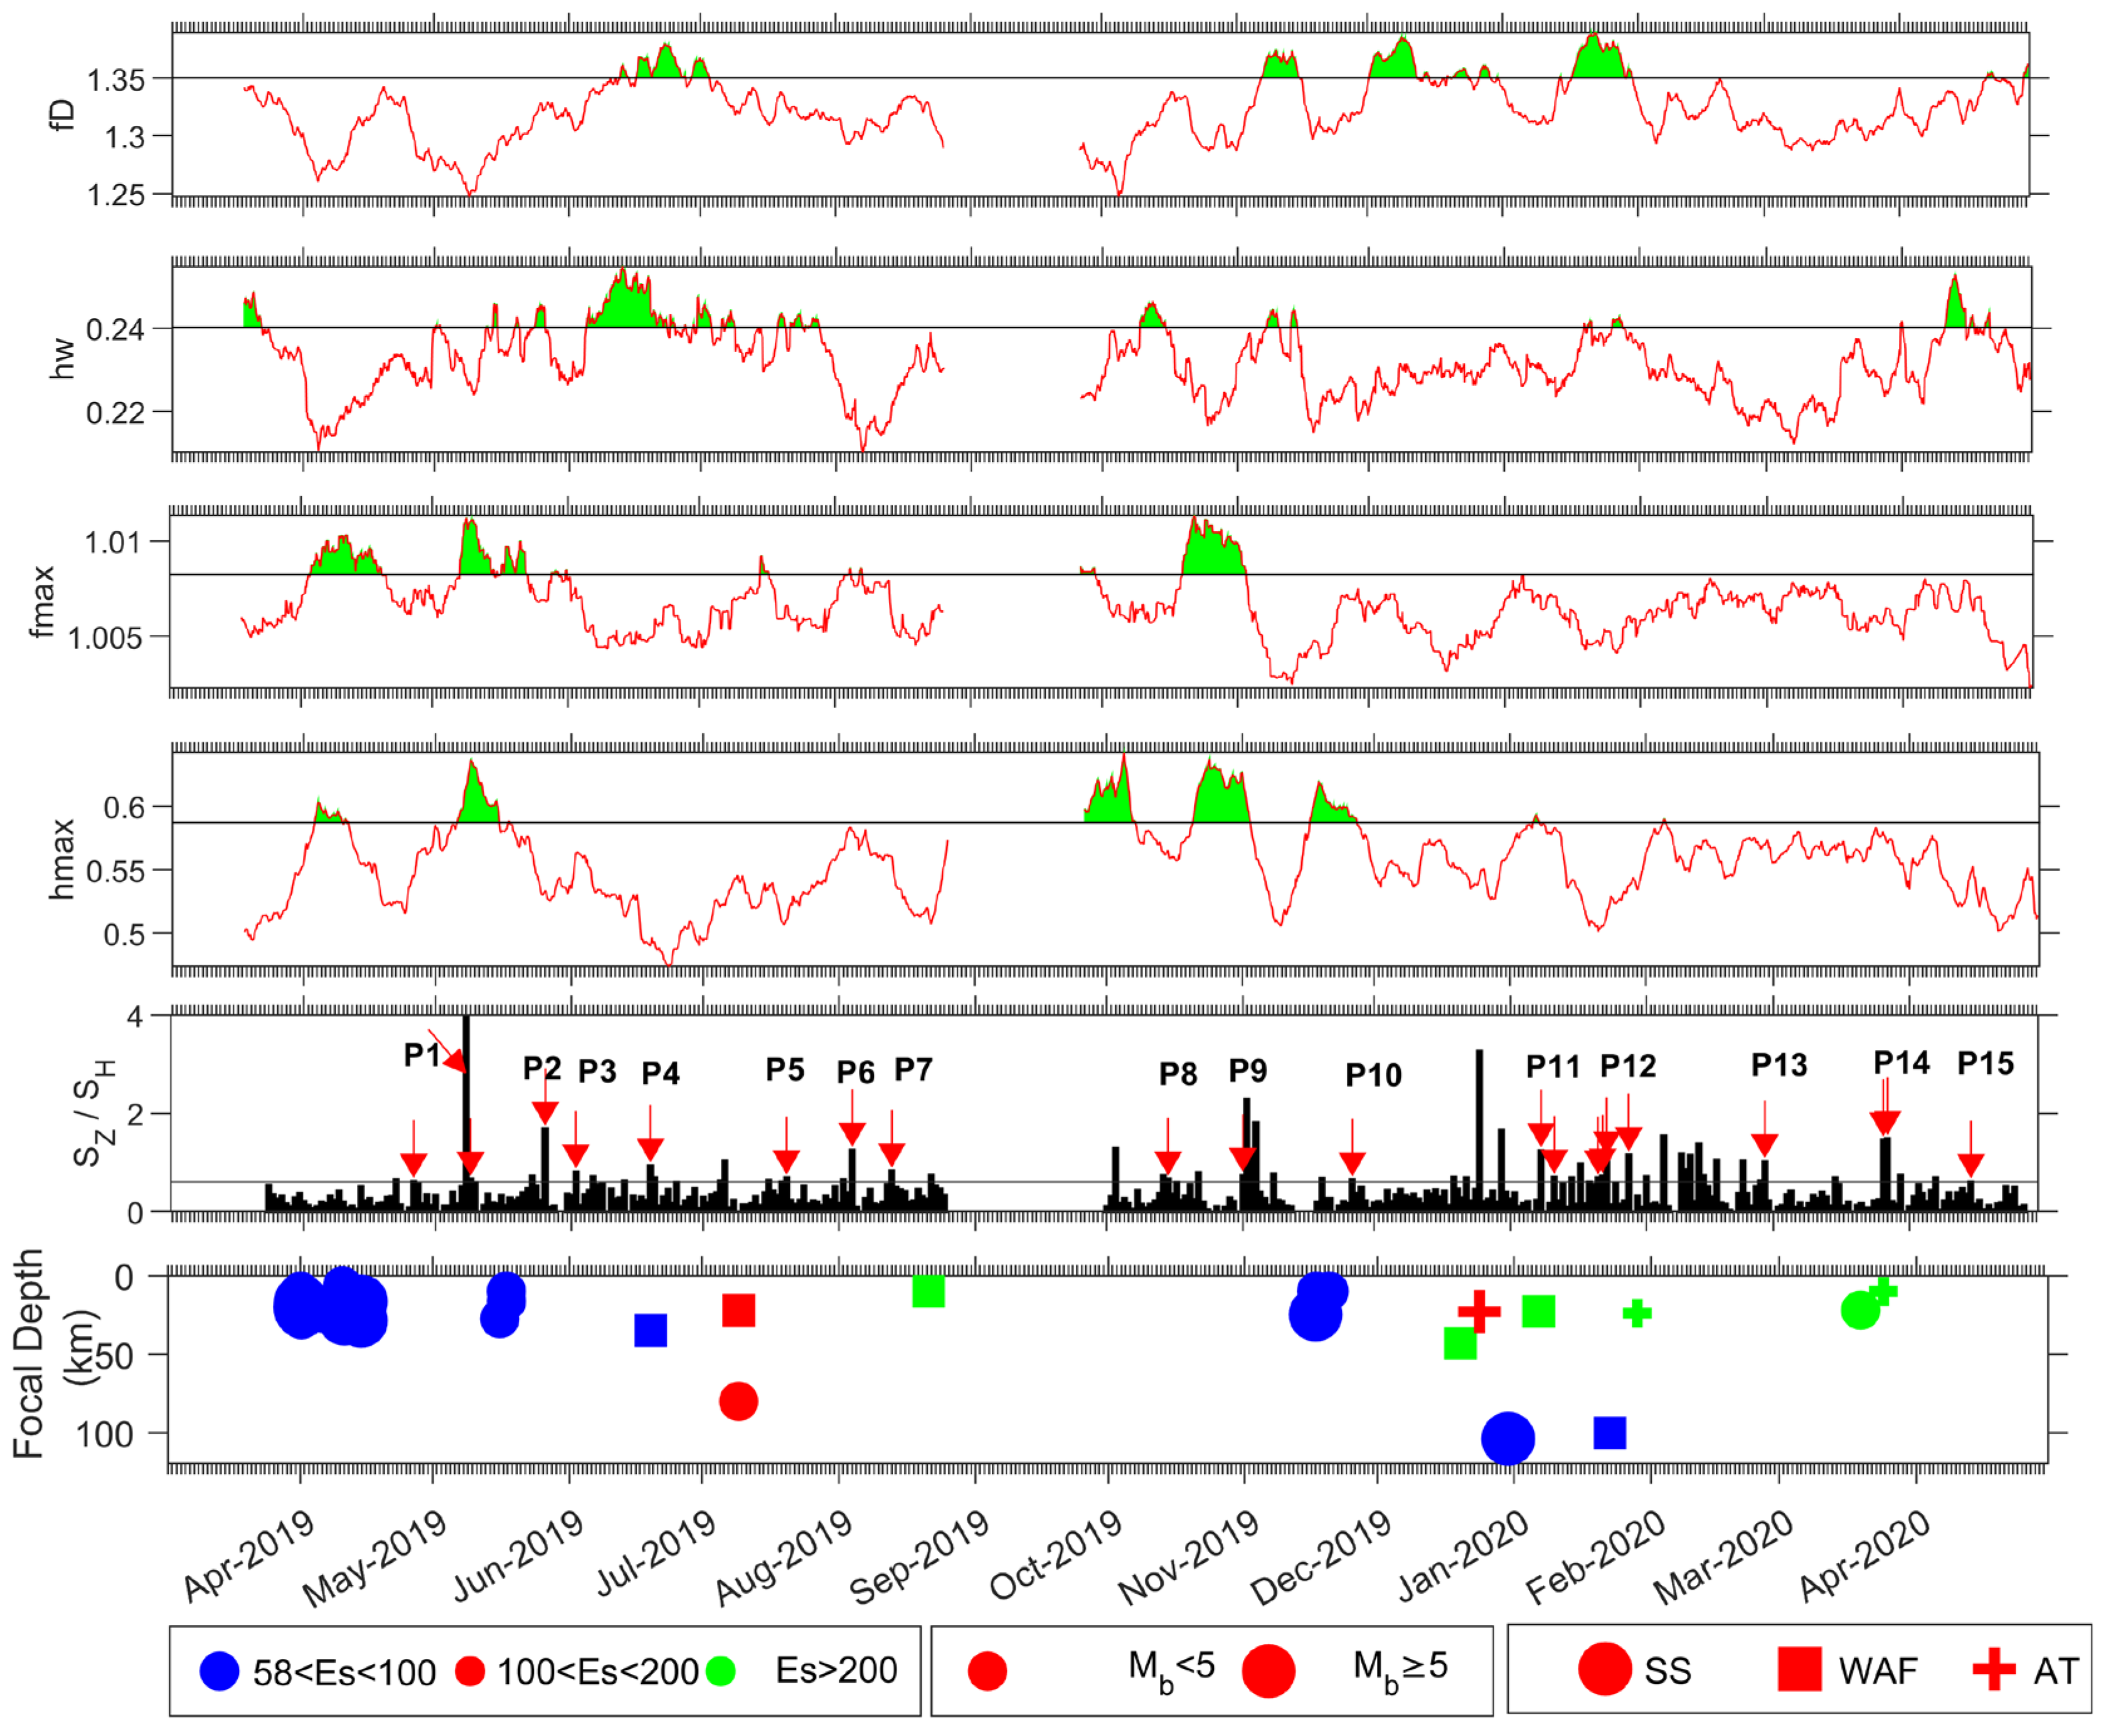
We compared the results from the Andaman–Nicobar region and Kumaun Himalaya more closely to extract the overall signatures of anomalous geomagnetic signatures, which can be taken as robust indicators of earthquake processes for future studies. Figure 8 presents a combined figure showing the ULF and fractal anomalies from the former study, to highlight the similarities and differences in the trends.
The earthquakes in the Nicobar region, which occurred most frequently on the N–S trending Suleiman Strand (SS) fault, were of a strike-slip nature (indicated by circles), while the ones on the West Andaman Fault (WAF) and the Andaman Trench (AT) had a thrust component [57]. The former were closest to the recording station CBY, with epicentral distances around 100 km. The corresponding ULF amplitudes were the largest. Significant ULF anomalies occurred along with anomalies in h m a x , preceding the SS fault earthquakes (Apr, Jun, and Dec 2019). ULF anomalies and synchronous anomalies in f D and h w were observed, preceding earthquakes on the WAF and AT (Jan and Apr 2020). The enhancements in h m a x were indicative of lower-frequency perturbations, which it was suggested were due to electrokinetic processes, whereas enhancements in f D and h w indicated high-frequency processes that were generally related to extensive microfracturing mechanisms. The large-amplitude ULF anomalies, which were prominent along with h m a x enhancements, further reinforced the dominance of mechanisms that produced low-frequency signatures in the geomagnetic data. These combinations of anomalies suggest that electrokinetic processes are linked to the strike-slip earthquakes on the SS fault, while microfracturing processes are associated with earthquakes on the WAF and AT faults.
Unlike in the subduction zone in the Nicobar area, the spatial distribution of earthquakes in the Kumaun Himalaya showed a diffused spatial distribution, with a complex geometry of major and minor faults characterizing the region [58]. The occurrence frequency of moderate earthquakes is also higher, which is consistent with a scenario of a long stretch of collision zone that is under considerable stress. The average duration of persistence of multifractal parameters in the Andaman-Nicobar subduction was 5 days, while in the current study, it is ~2 days. Almost 95% of the seismicity is found to be down to ∼24 km in depth, with a few scattered hypocentres in the deeper crust at between 30 and 50 km in depth. The majority of the moderate and large earthquakes in the Uttarakhand Himalaya are of the thrust type, including those in the western Nepal region [58,59]. Focal mechanisms in the seismogenic upper crust reveal the thrusting of the Indian Plate beneath the Lesser Himalaya, with compression behavior that is normal to the strike of the Main Central Thrust (MCT) region [60]. The multifractal anomalies in h w n and h w that are associated with the MCT (in the E/SE) correspond to high-frequency perturbations with a larger amplitude of ULF energy; earthquakes in western Nepal correspond to a slightly higher dominance of h w n , as well as amplitudes of energy. This association, which is distinctly different from that of the Nicobar earthquakes, leads us to suggest that a combined mechanism of microfracturing, along with motional induction, may be a possible source of these signatures. Furthermore, the earthquakes that occurred away from the MCT are mainly attributed to the anomalies in h w p and h w , which indicate low-frequency perturbations with low-amplitude ULF energy, possibly due to electrokinetic processes [59].
The amplitude ranges of h w p and h w n in the Andaman region are 0.11–0.145 and 0.09–0.12, respectively, while in the Himalayan region they are 0.15–0.275 and 0.20–0.70, respectively. The low amplitude and relatively smooth variations in the multifractal parameters from Nicobar make the identification of SEM anomalies easier. In the Kumaun region of seismicity, the crustal configuration as well as the stress accumulation scenario are more complex. Lateral changes in the Moho depths and lithospheric thicknesses allow four tectonic blocks to be demarcated between the epicenters of the 1803 and 1505 prehistoric events. Several sub-parallel trust faults run across this segmented region [60], which leads to a complex tectonic environment. The earthquakes occur along the active thrust faults, as well as along the transverse structures perpendicular to the E–W thrusts (Figure 1). This complexity is clearly reflected in the superposed trends of the multifractal parameters, which makes them very suitable indicators of the mechanisms that generate them.
Earthquake forecasting is a critical issue in terms of livelihoods and infrastructure, but the diverse field of earthquake forecasting has always been a debatable topic within the community of Earth scientists. Previous studies have clearly demonstrated that there is an emission from the electromagnetic field prior to earthquakes, which can be detected in the geomagnetic data. Statistical analysis, which can help to improve the confidence level of SEM signatures, can only be performed for moderate earthquakes, which occur frequently enough to be studied over a few years. The fundamental physics of how stress accumulates and causes changes in the physical parameters of the affected rocks, how earthquakes form, long-term and short-term triggering mechanisms, the role of fluids, and interactions among fault parameters like friction and heterogeneity all contribute to the generation of a large variety of SEM signatures. Our study shows that SEM signatures are reflected in fractal parameters, along with measures of ULF energy, and hold promise for studying underlying mechanisms in environments of moderate seismicity.

6. Conclusions

  • This study shows that the moderate earthquakes in eastern Kumaun and western Nepal have signatures of high-energy ULF emissions and high-frequency components in multifractal parameters. The earthquakes to the west and north are associated with moderate ULF emissions and a low-frequency component of fractal parameters.
  • As electromagnetic emissions are affected by several mechanisms like stress concentration and the presence of fluids or other conductors, these differences reflect variations in structural and geological configurations, as well as differences in earthquake mechanisms.
  • The SEM signatures of moderate earthquakes from the Andaman–Nicobar subduction zone have different characteristics compared to the current study. This implies that the chosen SEM parameters are sensitive indicators of the underlying processes. It also means that a compilation of many studies of moderate earthquakes in different tectonic regimes can lead to robust models of these signatures vis-à-vis seismo-tectonic processes.

Supplementary Materials

The following supporting information can be downloaded at: https://www.mdpi.com/article/10.3390/geosciences15090365/s1.

Author Contributions

R.P.: Conceptualization, methodology, software, formal analysis, data curation, and writing—original draft preparation. K.A.: Validation, investigation, writing—review and editing, visualization, supervision and project administration, and funding acquisition. All authors have read and agreed to the published version of the manuscript.

Funding

This research received no external funding. The APC was funded by CSIR-NGRI, India.

Institutional Review Board Statement

Not applicable.

Informed Consent Statement

Not applicable.

Data Availability Statement

Data is available at the Data Centre of CSIR-NGRI and will be available in public domain after expiry of the lock-in period.

Acknowledgments

The authors are thankful to the Director of the CSIR-National Geophysical Research Institute, India, for granting permission to publish the work (NGRI/Lib/2025/Pub-53). The data at PTY was acquired through the ProbHim project. The authors acknowledge the earthquake data from the ISC catalog (http://www.isc.ac.uk/iscbulletin/search/catalogue/). The authors also acknowledge N. Phani Chandrasekhar for his contributions in maintaining the remote site observatories in order to acquire uninterrupted data.

Conflicts of Interest

The authors declare no conflicts of interest.

References

  1. Aitchison, J.C.; Ali, J.R.; Davis, A.M. When and where did India and Asia collide? J. Geophys. Res. Solid Earth 2007, 112, B0542. [Google Scholar] [CrossRef]
  2. Gansser, A. The geodynamic history of the Himalaya. In Zagros Hindu Kush Himalaya Geodynamic Evolution; American Geophysical Union: Washington, DC, USA, 1981; Volume 3, pp. 111–121. [Google Scholar]
  3. Lavé, J.; Avouac, J.P. Fluvial incision and tectonic uplift across the Himalayas of central Nepal. J. Geophys. Res. Solid Earth 2001, 106, 26561–26591. [Google Scholar] [CrossRef]
  4. Bilham, R. Himalayan earthquakes: A review of historical seismicity and early 21st century slip potential. Geol. Soc. Lond. Spec. Publ. 2019, 483, 423–482. [Google Scholar] [CrossRef]
  5. Gupta, H.; Gahalaut, V.K. Seismotectonics and large earthquake generation in the Himalayan region. Gondwana Res. 2014, 25, 204–213. [Google Scholar] [CrossRef]
  6. Angster, S.; Fielding, E.J.; Wesnousky, S.; Pierce, I.; Chamlagain, D.; Gautam, D.; Upreti, B.N.; Kumahara, Y.; Nakata, T. Field reconnaissance after the 25 April 2015 M 7.8 Gorkha earthquake. Seismol. Res. Lett. 2015, 86, 1506–1513. [Google Scholar] [CrossRef]
  7. Rajendran, C.P.; Sanwal, J.; John, B.; Anandasabari, K.; Rajendran, K.; Kumar, P.; Jaiswal, M.; Chopra, S. Footprints of an elusive mid-14th century earthquake in the central Himalaya: Consilience of evidence from Nepal and India. Geol. J. 2019, 54, 2829–2846. [Google Scholar] [CrossRef]
  8. Shanker, D.; Paudyal, H.; Singh, H.N. Discourse on seismotectonics of Nepal Himalaya and vicinity: Appraisal to earthquake hazard. Geosciences 2011, 1, 1–15. [Google Scholar]
  9. Kanaujia, J.; Ravi Kumar, M.; Sunilkumar, T.C.; Naresh, B.; Devi, A.; Vijayaraghavan, R.; Suresh, G.; Saha, S.; Srinivas, D.; Solomon Raju, P. Nature of the Himalayan Seismicity Belt in the Garhwal–Kumaun Segment and its tectonic implications. Seismol. Res. Lett. 2024, 95, 2386–2398. [Google Scholar] [CrossRef]
  10. Yadav, R.K.; Gahalaut, V.K.; Bansal, A.K.; Sati, S.P.; Catherine, J.; Gautam, P.; Kumar, K.; Rana, N. Strong seismic coupling underneath Garhwal–Kumaun region, NW Himalaya, India. Earth Planet. Sci. Lett. 2019, 506, 8–14. [Google Scholar] [CrossRef]
  11. Ohta, K.; Watanabe, N.; Hayakawa, M. The observation of ULF emissions at Nakatsugawa in possible association with the 2004 Mid Niigata Prefecture earthquake. Earth Planets Space 2005, 57, 1103–1108. [Google Scholar] [CrossRef]
  12. Pulinets, S.; Ouzounov, D. Lithosphere–Atmosphere–Ionosphere Coupling (LAIC) model—An unified concept for earthquake precursors validation. J. Asian Earth Sci. 2011, 41, 371–382. [Google Scholar] [CrossRef]
  13. Molchanov, O.A.; Hayakawa, M.; Oudoh, T.; Kawai, E. Precursory effects in the subionospheric VLF signals for the Kobe earthquake. Phys. Earth Planet. Inter. 1998, 105, 239–248. [Google Scholar] [CrossRef]
  14. Liu, J.Y.; Chen, C.H.; Chen, Y.I.; Yen, H.Y.; Hattori, K.; Yumoto, K. Seismo-geomagnetic anomalies and M ≥ 5.0 earthquakes observed in Taiwan during 1988–2001. Phys. Chem. Earth Parts A/B/C 2006, 31, 215–222. [Google Scholar] [CrossRef]
  15. Lei, Y.; Jiao, L.; Chen, H. Possible correlation between the vertical component of lithospheric magnetic field and continental seismicity. Earth Planets Space 2018, 70, 179. [Google Scholar] [CrossRef]
  16. Chen, C.H.; Liu, J.Y.; Lin, P.Y.; Yen, H.Y.; Hattori, K.; Liang, W.T.; Chen, Y.I.; Yeh, Y.H.; Zeng, X. Pre-seismic geomagnetic anomaly and earthquake location. Tectonophysics 2010, 489, 240–247. [Google Scholar] [CrossRef]
  17. Fujinawa, Y.; Takahashi, K.; Noda, Y.; Iitaka, H.; Yazaki, S. Remote detection of the electric field change induced at the seismic wave front from the start of fault rupturing. Int. J. Geophys. 2011, 1, 752193. [Google Scholar] [CrossRef][Green Version]
  18. Takla, E.M.; Yumoto, K.; Liu, J.Y.; Kakinami, Y.; Uozumi, T.; Abe, S.; Ikeda, A. Anomalous geomagnetic variations possibly linked with the Taiwan earthquake (Mw = 6.4) on 19 December 2009. Int. J. Geophys. 2011, 1, 848467. [Google Scholar] [CrossRef]
  19. Takla, E.M. Local time dependence of earthquakes occurrence and its possible connection with geomagnetic diurnal variations. NRIAG J. Astron. Geophys. 2022, 11, 132–141. [Google Scholar] [CrossRef]
  20. Fidani, C. The central Italy electromagnetic network and the 2009 L’Aquila earthquake: Observed electric activity. Geosciences 2011, 1, 3–25. [Google Scholar] [CrossRef]
  21. Fidani, C.; Orsini, M.; Iezzi, G.; Vicentini, N.; Stoppa, F. Electric and magnetic recordings by Chieti CIEN Station during the intense 2016–2017 seismic swarms in Central Italy. Front. Earth Sci. 2020, 8, 536332. [Google Scholar] [CrossRef]
  22. Xu, G.; Han, P.; Huang, Q.; Hattori, K.; Febriani, F.; Yamaguchi, H. Anomalous behaviors of geomagnetic diurnal variations prior to the 2011 off the Pacific coast of Tohoku earthquake (Mw9.0). J. Asian Earth Sci. 2013, 77, 59–65. [Google Scholar] [CrossRef]
  23. Han, P.; Hattori, K.; Xu, G.; Ashida, R.; Chen, C.H.; Febriani, F.; Yamaguchi, H. Further investigations of geomagnetic diurnal variations associated with the 2011 off the Pacific coast of Tohoku earthquake (Mw 9.0). J. Asian Earth Sci. 2015, 114, 321–326. [Google Scholar] [CrossRef]
  24. Han, P.; Hattori, K.; Huang, Q.; Hirooka, S.; Yoshino, C. Spatiotemporal characteristics of the geomagnetic diurnal variation anomalies prior to the 2011 Tohoku earthquake (Mw 9.0) and the possible coupling of multiple pre-earthquake phenomena. J. Asian Earth Sci. 2016, 129, 13–21. [Google Scholar] [CrossRef]
  25. Yao, X.; Feng, Z.; Teng, Y.; Wang, Y.; Zheng, Q. Geomagnetic variations associated with strong earthquakes in Yunnan area. Open J. Earthq. Res. 2017, 6, 228. [Google Scholar] [CrossRef][Green Version]
  26. Bulusu, J.; Arora, K.; Singh, S.; Edara, A. Simultaneous electric, magnetic and ULF anomalies associated with moderate earthquakes in Kumaun Himalaya. Nat. Hazards 2023, 116, 3925–3955. [Google Scholar] [CrossRef]
  27. Prajapati, R.; Arora, K. Fractal analysis of geomagnetic data to decipher pre-earthquake process in Andaman-Nicobar region, India. Nonlinear Process. Geophys. Discuss. 2024, 32, 1–21. [Google Scholar]
  28. Wang, Z.; Ni, Z.; Chen, S.; Su, S.; Yuan, J. Characteristics of Local Geomagnetic Field Variations and the Tectonic Stress Field Adjacent to the 21 May 2021, Ms 6.4 Yangbi Earthquake, Yunnan, China. Appl. Sci. 2022, 12, 1005. [Google Scholar] [CrossRef]
  29. Dologlou, E. Possible relationship between Seismic Electric Signals (SES) lead time and earthquake stress drop. Proc. Jpn. Acad. Ser. B 2008, 84, 117–122. [Google Scholar] [CrossRef]
  30. Freund, F. Pre-earthquake signals: Underlying physical processes. J. Asian Earth Sci. 2011, 41, 383–400. [Google Scholar] [CrossRef]
  31. Freund, F.; Pilorz, S. Electric currents in the Earth crust and the generation of pre-earthquake ULF signals. Front. Earthq. Predict. Stud. 2012, 464–508. [Google Scholar]
  32. Helman, D.S. Earth electricity: A review of mechanisms which cause telluric currents in the lithosphere. Ann. Geophys. 2013, 56, G0564. [Google Scholar]
  33. Helman, D.S. Seismic electric signals (SES) and earthquakes: A review of an updated VAN method and competing hypotheses for SES generation and earthquake triggering. Phys. Earth Planet. Inter. 2020, 302, 106484. [Google Scholar] [CrossRef]
  34. Scoville, J.; Heraud, J.; Freund, F. Pre-earthquake magnetic pulses. Nat. Hazards Earth Syst. Sci. 2015, 15, 1873–1880. [Google Scholar] [CrossRef]
  35. Tsutsui, M. Behaviors of electromagnetic waves directly excited by earthquakes. IEEE Geosci. Remote Sens. Lett. 2014, 11, 1961–1965. [Google Scholar] [CrossRef]
  36. Ida, Y.; Hayakawa, M.; Adalev, A.; Gotoh, K. Multifractal analysis for the ULF geomagnetic data during the 1993 Guam earthquake. Nonlinear Process. Geophys. 2005, 12, 157–162. [Google Scholar] [CrossRef]
  37. Potirakis, S.M.; Hayakawa, M.; Schekotov, A. Fractal analysis of the ground-recorded ULF magnetic fields prior to the 11 March 2011 Tohoku earthquake (MW = 9): Discriminating possible earthquake precursors from space-sourced disturbances. Nat. Hazards 2017, 85, 59–86. [Google Scholar] [CrossRef]
  38. Hattori, K. ULF geomagnetic changes associated with large earthquakes. Terr. Atmos. Ocean. Sci. 2004, 15, 329–360. [Google Scholar] [CrossRef]
  39. Hattori, K.; Takahashi, I.; Yoshino, C.; Isezaki, N.; Iwasaki, H.; Harada, M.; Kawabata, K.; Kopytenko, E.; Kopytenko, Y.; Maltsev, P.; et al. ULF geomagnetic field measurements in Japan and some recent results associated with Iwateken Nairiku Hokubu earthquake in 1998. Phys. Chem. Earth Parts A/B/C 2004, 29, 481–494. [Google Scholar] [CrossRef]
  40. Hattori, K.; Han, P.; Huang, Q. Global variation of ULF geomagnetic fields and detection of anomalous changes at a certain observatory using reference data. Electr. Eng. 2013, 182, 9–18. [Google Scholar] [CrossRef]
  41. Han, P.; Hattori, K.; Hirokawa, M.; Zhuang, J.; Chen, C.H.; Febriani, F.; Yamaguchi, H.; Yoshino, C.; Liu, J.Y.; Yoshida, S. Statistical analysis of ULF seismomagnetic phenomena at Kakioka, Japan, during 2001–2010. J. Geophys. Res. Space Phys. 2014, 119, 4998–5011. [Google Scholar] [CrossRef]
  42. Warden, S.; MacLean, L.; Lemon, J.; Schneider, D. Statistical analysis of pre-earthquake electromagnetic Anomalies in the ULF Range. J. Geophys. Res. Space Phys. 2020, 125, e2020JA027955. [Google Scholar] [CrossRef]
  43. Chavez, O.; Millan-Almaraz, J.R.; Pérez-Enríquez, R.; Arzate-Flores, J.A.; Kotsarenko, A.; Cruz-Abeyro, J.A.; Rojas, E. Detection of ULF geomagnetic signals associated with seismic events in Central Mexico using Discrete Wavelet Transform. Nat. Hazards Earth Syst. Sci. 2010, 10, 2557–2564. [Google Scholar] [CrossRef]
  44. Hayakawa, M.; Ito, T.; Smirnova, N. Fractal analysis of ULF geomagnetic data associated with the Guam earthquake on August 8, 1993. Geophys. Res. Lett. 1999, 26, 2797–2800. [Google Scholar] [CrossRef]
  45. Smirnova, N.; Hayakawa, M.; Gotoh, K.; Volobuev, D. Scaling characteristics of ULF geomagnetic fields at the Guam seismoactive area and their dynamics in relation to the earthquake. Nat. Hazards Earth Syst. Sci. 2001, 1, 119–126. [Google Scholar] [CrossRef]
  46. Gotoh, K.; Hayakawa, M.; Smirnova, N. Fractal analysis of the ULF geomagnetic data obtained at Izu Peninsula, Japan in relation to the nearby earthquake swarm of June–August 2000. Nat. Hazards Earth Syst. Sci. 2003, 3, 229–236. [Google Scholar] [CrossRef]
  47. Smirnova, N.A.; Kiyashchenko, D.A.; Troyan, V.N.; Hayakawa, M. Multifractal approach to study the earthquake precursory signatures using the ground-based observations. Rev. Appl. Phys. 2013, 2, 58–67. [Google Scholar]
  48. Hattori, K.; Serita, A.; Yoshino, C.; Hayakawa, M.; Isezaki, N. Singular spectral analysis and principal component analysis for signal discrimination of ULF geomagnetic data associated with 2000 Izu Island Earthquake Swarm. Phys. Chem. Earth Parts A/B/C 2006, 31, 281–291. [Google Scholar] [CrossRef]
  49. Jach, A.; Kokoszka, P.; Sojka, J.; Zhu, L. Wavelet-based index of magnetic storm activity. J. Geophys. Res. Space Phys. 2006, 111, A09215. [Google Scholar] [CrossRef]
  50. Jaffard, S. Pointwise regularity associated with function spaces and multifractal analysis. Banach Cent. Publ. 2006, 72, 93. [Google Scholar]
  51. Serrano, E.; Figliola, A. Wavelet leaders: A new method to estimate the multifractal singularity spectra. Phys. A Stat. Mech. Appl. 2009, 388, 2793–2805. [Google Scholar] [CrossRef]
  52. Wendt, H.; Abry, P.; Jaffard, S. Bootstrap for empirical multifractal analysis. IEEE Signal Process. Mag. 2007, 24, 38–48. [Google Scholar] [CrossRef]
  53. Lashermes, B.; Jaffard, S.; Abry, P. Wavelet leader based multifractal analysis. In Proceedings of the (ICASSP’05) IEEE International Conference on Acoustics, Speech, and Signal Processing 2005, Philadelphia, PA, USA, 23–23 March 2005; Volume 4, pp. iv/161–iv/164. [Google Scholar]
  54. Wendt, H. Contributions of Wavelet Leaders and Bootstrap to Multifractal Analysis: Images, Estimation Performance, Dependence Structure and Vanishing Moments. Confidence Intervals and Hypothesis Tests. Ph.D. Thesis, Ecole Normale Supérieure de Lyon-ENS LYON, Lyon, France, 2008. [Google Scholar]
  55. Arora, K.; Prajapati, R. Patterns of Seismo-Electromagnetic Signatures of Moderate Earthquakes in Diverse Tectonic Settings. J. Geol. Soc. India 2025, 101, 815–820. [Google Scholar] [CrossRef]
  56. Harris, R.O. Geodynamic patterns of ophiolites and marginal basins in the Indonesian and New Guinea regions. Geol. Soc. Lond. Spec. Publ. 2003, 218, 481–505. [Google Scholar] [CrossRef]
  57. Moeremans, R.; Singh, S.C.; Mukti, M.; McArdle, J.; Johansen, K. Seismic images of structural variations along the deformation front of the Andaman–Sumatra subduction zone: Implications for rupture propagation and tsunamigenesis. Earth Planet. Sci. Lett. 2014, 386, 75–85. [Google Scholar] [CrossRef]
  58. Mukhopadhyay, B. Clusters of moderate size earthquakes along Main Central Thrust (MCT) in Himalaya. Int. J. Geosci. 2011, 2, 318. [Google Scholar] [CrossRef]
  59. Gao, Y.; Wang, D.; Wen, J.; Hu, H.; Chen, X.; Yao, C. Electromagnetic responses to an earthquake source due to the motional induction effect in a 2-D layered model. Geophys. J. Int. 2019, 219, 563–593. [Google Scholar] [CrossRef]
  60. Mandal, P.; Prathigadapa, R.; Srinivas, D.; Saha, S.; Saha, G. Evidence of structural segmentation of the Uttarakhand Himalaya and its implications for earthquake hazard. Sci. Rep. 2023, 13, 2079. [Google Scholar] [CrossRef]
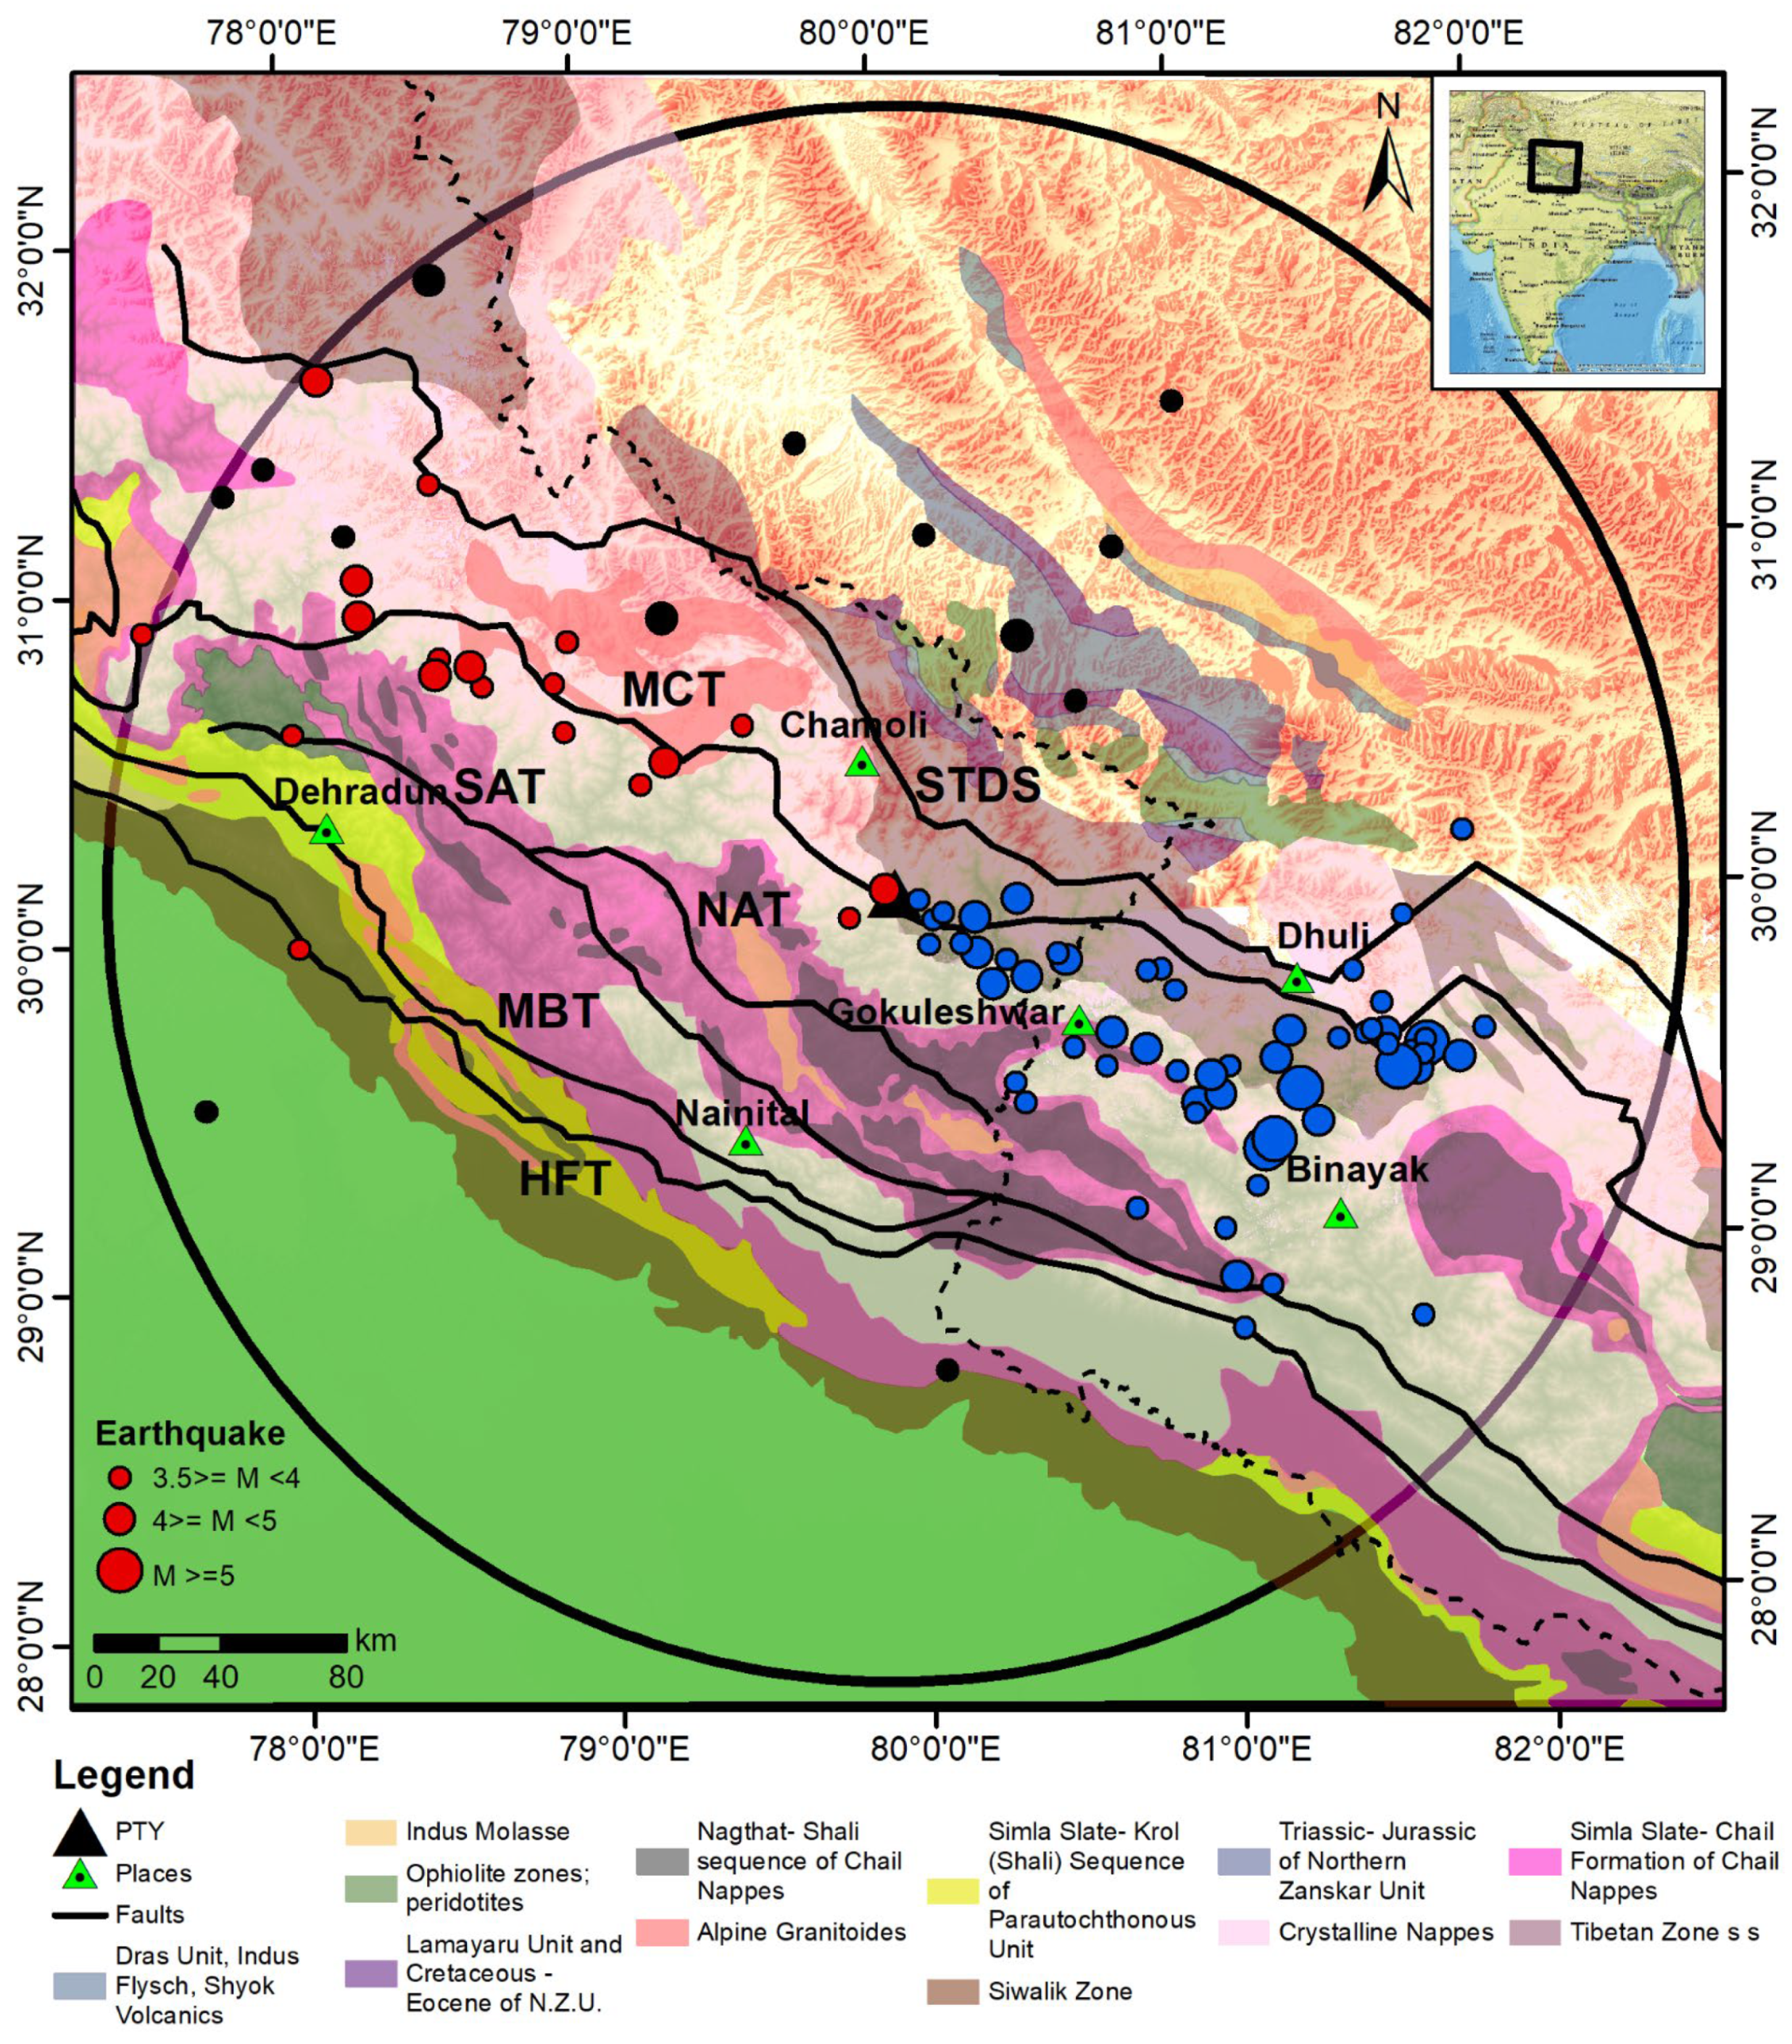
Figure 1. The geological map of the study area, superimposed on the topography, shows the main thrust faults and the distribution of earthquakes during the period from Nov 2019 to May 2023, within a radius of 250 km (solid circle) around the location of PTY, which is marked by a black triangle. The earthquakes occurring on the MCT in the SE direction are shown as blue circles, and earthquakes on the MCT in the NW direction are shown as red circles. The earthquakes that are not on the MCT are shown as black circles.
Geosciences 15 00365 g001
Figure 2. (a) Nighttime Z variations from Nov 2019 to May 2023; (b) earthquakes showing magnitude, focal depth, and direction from PTY.
Geosciences 15 00365 g002
Figure 3. An example of 6th-level DWT detail wavelet coefficients (top panel) from db5 wavelets and the reconstructed signal (bottom panel) from detail wavelet coefficients at the 6th level of geomagnetic data on 23 Dec 2019.
Geosciences 15 00365 g003
Figure 4. An example of variation in the Holder exponent (a) used in the computation of multifractal spectrum width, and (b) of geomagnetic data on 23 Dec 2019.
Geosciences 15 00365 g004
Figure 5. The temporal variation of ULF energy computed from DWT (a) and temporal location of earthquakes with magnitude, focal depth, and azimuth from station (b).
Geosciences 15 00365 g005
Figure 6. The temporal variation in multifractal parameter h w , h w p , h w n (ac) with their enhancements, and the temporal location of earthquakes with magnitude, focal depth, and azimuth from station (d).
Geosciences 15 00365 g006
Figure 7. Anomalies in ULF energy (top panel), h w p , h w n (middle panel; the green cross represents h w p and the pink triangle represents h w n ), and the temporal pattern of earthquakes with magnitude, focal depth, and direction from PTY (bottom panel).
Geosciences 15 00365 g007
Figure 8. Anomalies in the fractal parameters and ULF polarization ratios (adopted from [27,56] for moderate earthquakes near Nicobar Island, India).
Geosciences 15 00365 g008
Table 1. The following table comprises the occurrence of earthquakes, their characteristics, and the corresponding details of the anomalous signature of energy from DWT and multifractal parameters. The meanings of the keywords used in the table are listed below.
DatefD
(km)
Mag.Ep_DistAzimuth
/Fault
DWT ResponseAmplitude
/ULF Energy
Fractal ResponseRemarks
12-11-201916.64.426.77E/MCTData sort----Prior data are not available
19-11-201916.95.3142.93SE/MCTData sort----Prior data are not available
13-12-2019173.871.98NW/MCTData sort----Prior data are not available
01-01-2020103.678.25SE/MCT30-Dec-2019
1 prior
2.10, 1.35 Higher amplitude for SE Eq
08-02-202029.94.63.22Over_st/MCT7 Feb-2020
1 prior
1.6414–16 Jan; 15 d priors, h w n , h w p , h w Smaller amp./ h w n also appear with h w p and Hw due to large mag. and smallest Ep_dist.
02-04-2020173.9117.87SE/MCT31 Mar–01 Apr;
2 prior
6.2128–29 Mar; 4 prior, h w , h w n (dom);12–13 Mar; 15 d prior, h w , h w n Large amp/ h w , h w n for SE Eq
22-04-202024.73.6126.24SE/SATNil NilNo corresponding SEM signatures
09-08-2020103.6114.63NNE/Unkn. 3–4 Aug, 5 d prior, h w n , h w ; 28–29 Jul, 11 d prior, h w n , h w ; simul., h w n and h w
25-08-20208.13.5116.42NW/MCT No corresponding signature, possibly due to SE Eq together
25-08-2020174.2116.88SE/MCT Same as above
27-08-2020103.887.88SSE/MCT1 d post;2.161 d post; h w n and h w ;Eq. in southern region; large h w n and h w appear
03-09-202003.5152.70S/Unkn6 prior;2.168 prior, h w n , h w Same as above
21-09-202003.6196.87NW/STDSnil nilNo corresponding signature
26-10-202016.53.9247.42NW/Unknnil nilNo corresponding signature, possibly due to subsequent Eqs in different directions
28-10-2020173.8118.20SW/MCTnil nilSame as above remark
04-11-2020193.586.93SW/MCTnil nilSame as above remark
07-11-2020353.584.18NE/Unknnil nilSame as above remark
01-12-202032.73.7189.16W/HFT 27–30 Nov, 4 d prior, h w p ;
08-01-20218.93.616.03Over_st/MCTnil 6–10 h w p ; ~30 d priorNot considered as an SEM signature due to unusual and large duration (~5 days) before Eq
09-01-2021103.8162.45NW/MCTnil No corresponding signatures
07-02-202104.390.90NE/Unkn4 Feb, 3 d prior1.8125 Jan h w p ; 12 d priorNo corresponding signatures
19-02-2021163.619.75SSE/overst
/MCT
12–17 h w p , h w , 7 d priorSE earthquake; h w p and h w
05-05-202103.571.36 Data gap
08-05-202116.13.557.13 Data gap
23-05-2021104.2114.71 Data gap
28-06-2021103.87.806 Data gap
02-07-2021103.9158.15 Data gap
23-07-202123.73.6146.38 Data gap
04-08-2021203.5228.91 Data gap
10-08-202132.33.6197.34 Data gap
23-08-2021103.7119.28 Data gap
11-09-20219.54.683.70 Data gap
20-09-2021104.381.71 Data gap
24-09-202122.73.641.39 Data gap
09-11-202110.34.6244.65NW/Unkn5–6 Nov, 4 d prior1.815–6 Nov, 4 prior, h w p , h w Small amp./ h w p , h w for NE Eq
24-11-202183.6241.28NW/Unkn 15–17 Nov, 9 prior, h w p (strong), h w Only h w p and h w for NE Eq
04-12-2021103.8131.09NW/MCTnil 15–17 Nov, 18 prior, h w p (strong), h w Only h w p and h w for NE Eq
29-12-20215.34.458.15SE/MCTnil nilNo corresponding signature for SEE Eq
19-01-202214.23.693.88SE/MCT 2–3 Jan h w n , h w 17 d priorOnly h w n , and h w component for SE Eq
24-01-202227.84.142.33SE/MCT-----
04-02-2022103.5208.31NW/Unkn 5–6 Feb, h-all, 1 d post h w n extra with h w p and h w correspond to 4 subsequent Eqs in northern direction
06-02-202284245.54NW/STDS 5–6 Feb, h-all, 1 d priorFor above comment
09-02-2022103.5130.00NE/Unkn 5–6 Feb, h-all, 4 d priorFor above comment
11-02-2022353.8126.94NW/MCT 5–6 Feb, h-all, 6 d priorFor above comment
05-04-2022353.8146.75NNW/Unknnilnil30–31 Mar, h w p , h w , 6 d priorno amp; h w p and h w for NW Eq; for next Eq also
09-04-202217.24.3191.46NW/MCTnilnil30–31 Mar, h w p , h w Above remark same
19-04-2022193.575.02SE/MCT12–13 Apr, 7 d prior1.8114–15 Apr, 5 d prior, h w p (strong), h w small amp, h w p and h w for SE Eq due to small magnitude
11-05-202223.74.849.55SE/MCT12 May, 1 d post; 25 May, 14 d prior1.9924–25 May, 13 d prior, h w p small amplitude, only h w p for SE Eq due to large magnitude of Eq
08-07-20222.43.915.08Over_stE/
MCT
29 Jun–5 Jul, 10 d prior5.43–8 Jul, 5 d prior, h-allmoderate magnitude; large amp. and hall, unique from other SE Eq possibilities due to more eastern Eq and moderate magnitude
10-07-202217493.84SE/MCT29 Jun–5 Jul, 12 d prior5.403–8 Jul, 7 d prior, h-all
24-07-20224.84161.2NW/MCT29 Jun–5 Jul, 26 d prior5.43–8 Jul, 21 d prior, h-allnot considered for SEM due to unusually large number of prior days
19-08-202214.63.724.65Overst_SE/
MCT
nil 8 Aug, 11 prior, h w p ; 15–20 Aug, 4 d prior, h w p (strong) h w no amp., h w p and h w SEM anomaly for SE Eq due to small mag Eq
08-10-202220.53.716.72Overst_SE/
MCT
31 Sep–1 Oct, 9 d prior2.82–5 Oct, h w p 6 d prior; 10–16, h w n   h w , 2 d postlarge amp.; SE Eq, small to large mag. Eq, h w p also present with h w n and h w , possibly due to more eastern Eqs present (for mod and large mag. Eqs)
08-10-2022104.939.07ESE/MCT31 Sep–1 Oct, 9 d prior2.82–5 Oct, h w p 6 d prior; 10–16, h w n   h w , 2 d post
09-10-2022103.6179.4NE/Unkn31 Sep–1 Oct, 10 d prior2.82–5 Oct, h w p 7 d prior; 10–16, h w n   h w , 3 d post
30-10-202212.84.4121.4SEE/MCT20–22 Oct, 8 d prior; 28 Oct, 2 prior6.91, 2.102–5 Oct, 28 d prior; 10–16, h w n   h w , 20 d prior; 28–30 Oct,2 d prior, h w n   h w p large amp., mod mag., h w p also present with h w n and h w Eqs, possibly due to more eastern Eqs being present
06-11-202218.14.5152.6NW/MCT5–6 Nov, 1 prior,2.863–4 Nov, 3 d prior, h w n (strong), h w ,not considered for this Eq due to subsequent dominant Eq in SE direction
08-11-2022274.7152.4SEE/MCT5–6 Nov, 3 prior,2.863–4 Nov, 5 d prior, h w n (strong), h w ,
08-11-2022353.5149.4SE/MBT5–6 Nov, 3 prior,2.863–4 Nov, 5 d prior, h w n (strong), h w ,
08-11-202214.45.9143.2SE/MCT5–6 Nov, 3 prior,2.863–4 Nov, 5 d prior, h w n (strong), h w ,small to mod. mag. Eq in SE directionLarge amp, h w n and Hw present for SE Eqs
08-11-2022103.8105.9SE/MCT5–6 Nov, 3 prior,2.863–4 Nov, 5 d prior, h w n (strong), h w ,
08-11-202203.6172.4SE/MCT/STDS5–6 Nov, 3 prior,2.863–4 Nov, 5 d prior, h w n (strong), h w ,
09-11-2022164.232.04stsn SE/MCT9 Nov. Simultaneous1.583–4 Nov, 6 d prior, h w n (strong), h w ,small amp, mod. magnitude Eq; h w n and h w p for SE Eq
09-11-2022104.1163.0SE/MBT9 Nov. Simultaneous1.583–4 Nov, 6 d prior, h w n (strong), h w p
12-11-202211.65.3142.5SE/MCT9 Nov. 3 d prior1.583–4 Nov, 9 d prior, h w n (strong), h w ,
22-01-202312.23.526.41285188SEE/MCT3 Jan, 13–14 Jan1.56, 330 Dec–2 Jan, h w p and h w n ; 13–14 hwp; 21–24 h w n small to mod amp.; h w p , h w n —very small to mod. small mag. Eq
24-01-202324.85.6175.1345405SEE/MCT3 Jan, 13–14 Jan1.56, 330 Dec–2 Jan, h w p and h w n 13–14 hwp; 21–24 hwnsmall to mod amp; h w p , h w n —very small to mod. mag. Eq
24-01-202303.6160.9061784NEE/STDS3 Jan, 13–14 Jan1.56, 330 Dec–2 Jan, h w p and h w n ; 13–14 hwp; 21–24 hwnsmall to mod amp; h w p , h w n —very small to mod. small mag. Eq
25-01-202349.33.6171.3197248SEE/MCT3 Jan, 13–14 Jan1.56, 330 Dec–2 Jan, h w p and h w n ; 13–14 hwp; 21–24 h w n small to mod amp; h w p , h w n —very small to mod. small mag Eq
26-01-2023273.5148.1686039SEE/MCT3 Jan, 13–14 Jan1.56, 330 Dec–2 Jan, h w p and h w n ; 13–14 hwp;21–24 h w n small to mod amp; h w p , h w n —very small to mod. small mag. Eq
01-02-2023273.5174.3250963SEE/MCT01-Feb1.51----small amp, small mag. Eq
22-02-202323.14.7174.4369709SEE/MCT15–18 Feb, 415–18 Feb h w p ; 21–24 h w n large mag., h w p , hwn (mod), mod. mag. Eq
26-02-2023174115.7151921SEE/unknown--- 25–26, Feb h w n , h w p h w n (mod), h w p (strong), mod. mag. Eq
03-03-2023183.7147.893641SE/Unknown--- 1–3 Mar h w p h w p (strong), small mag. Eq
13-03-20235.23.7214.5163843SE/Unknown--- 8–12 Mar h w p h w p (strong), small mag. Eq
24-03-202321.54185.9171992SEE/MCT16–17 mar2.823–25 Mar, h w p mod amp, h w p (mod), mod. mag. Eq
26-03-20233.83.7174.9520327SEE/MCT16–17 mar2.823–25 Mar, h w p mod amp, h w p (mod), small mag. Eq
31-03-202303.8180.7622673NEE/STDS 28–31 Mar, h w p h w p (strong), small mag. Eq
17-04-202303.6252.3814862NE/MCT--- 8–10 Apr, h w p ; 15–18 h w p Apr h w p (strong), small mag. Eq
23-04-2023353.5177.0987389SE/HFT--- 8–10 Apr, h w p 15–18 h w p Apr h w p (strong), small mag. Eq
27-04-202324.34.4161.6058988SEE/MCT22–24 Apr2.221–23 h w p mod amp, h w p (mod), mod mag. Eq
27-04-2023105.1168.7926929SEE/MCT22–24 Apr2.221–23 h w p mod amp, h w p (mod), large mag. Eq
27-04-2023333.6147.0693867East/STDS22–24 Apr2.221–23 h w p mod amp, h w p (mod), large mag. Eq
28-04-2023104.2131.4541371SEE/MCT22–24 Apr2.221–23 h w p mod amp, h w p (mod), mod mag. Eq
01-05-202368.53.5191.3260161SEE/MCT--- 1–5 May h w p , h w n small h w p (strong), h w n small mag. Eq
04-05-202330.93.687.50638019NE/MCT--- 1–5 May h w p , h w n small h w p (strong), h w n small mag. Eq
04-05-202314.23.7163.273757SEE/MCT--- 1–5 May h w p , h w n small h w p (strong), h w n small mag. Eq
10-05-202325.83.8155.5813625SEE/MCT--- 9–12 h w p h w p (mod), small mag. Eq
11-05-2023103.655.14957113SEE/MCT--- 9–12 h w p h w p (mod), small mag. Eq
22-05-2023273.5157.1302744SEE/MCT16–14 May1.5319–21 h w p small mag, h w p (mod), small mag. Eq
23-05-202312.24.2132.3489941SEE/MCT16–14 May1.5319–21 h w p small mag, h w p (mod), mod mag. Eq
Mag.—Magnitude of earthquake; fD—focal depth; Ep_Dist—Epicentral Distance (in Km); Eq—earthquake, d-day; Over_st—station’s location; Large amp—M 2.8; Small amp-M < 2.8; MCT-main central thrust fault; AMCT—Aside of main central thrust fault; Unkn—unknown fault; STDS—South Tibetan Detachment System; HFT—Himalayan Frontal Thrust.
Disclaimer/Publisher’s Note: The statements, opinions and data contained in all publications are solely those of the individual author(s) and contributor(s) and not of MDPI and/or the editor(s). MDPI and/or the editor(s) disclaim responsibility for any injury to people or property resulting from any ideas, methods, instructions or products referred to in the content.