Article

Challenges in the Detection of Water-Filled Cavities in Karst Environments Using Electrical Resistivity Tomography

by
Sergio Negri
1 and
Dora Francesca Barbolla
2,*
1
Department of Biological and Environmental Sciences and Technologies, University of Salento, Campus Ecotekne, 73100 Lecce, Italy
2
Institute of Heritage Science (ISPC), National Research Council (CNR), Campus Ecotekne, 73100 Lecce, Italy
*
Author to whom correspondence should be addressed.
Geosciences 2025, 15(9), 349; https://doi.org/10.3390/geosciences15090349
Submission received: 10 May 2025 / Revised: 3 August 2025 / Accepted: 31 August 2025 / Published: 5 September 2025
(This article belongs to the Section Geophysics)

Abstract

Electrical resistivity tomography (ERT) is one of the most commonly used geophysical methods for imaging the distribution of electrical resistivity in the subsurface. It is often employed to characterise heterogeneity in karst regions and locate cavities and conduits below the surface. The resistivity contrast between the host rock and the cavity depends on the material filling the cavity. Air has a high electrical resistivity and should therefore produce strong reflections and refractions off cavity walls. However, cavities are not always easily detectable. A decrease in resistivity contrast at the interface between rock and air may result from different physical conditions relating to pore saturation, fracturing and stress near the cavity walls. Our first goal is to understand how extensive fracturing and hydrogeological conditions in the first subsurface layers can affect electric current flow in the presence of a karst tunnel. We use the commercial Res2Dmod software 3.0 to simulate an ERT on several ground models. The results, which are based on hydrogeological models, are presented for several conditions of a karst conduit: empty; full of water within a homogeneous background; and below the groundwater level in the presence of extensive fractures in the shallow layer above it.

1. Introduction

The karst environment is characterised by a complex structure and a unique type of landscape formed from highly soluble rocks, such as limestone, marble, and gypsum. These landscapes frequently feature extensive subsurface water systems and caverns [1]. Over geological time, karst openings changed as water dissolved minerals in cracks. These fissures grew into channels, some of which eventually widened to form caves [2]. Karst systems are extremely complex and are often associated with environmental and geological hazards. The presence of joints, fractures, and cavities leads to a situation of risk of weakness of the rock mass, reducing stability; therefore, where urban centre infrastructures are present, they can create a dangerous situation. Consequently, the study and characterization of these karst elements is important in terms of preventing risks to people and things. Specific stability charts have recently been proposed in the literature for use at the preliminary stage of assessing the stability of the cavities [3]. Geophysical methods are often employed to characterize heterogeneities in karst regions, locating cavities and conduits below the surface. These can provide useful subsurface information concerning, for instance, hazard estimation. Since the 1960s, geophysical methods have been used to investigate and evaluate geotechnical problems mainly related to voids and sinkholes, or epikarst structures [4]. Integrated geophysical methods are often used in karst environments to minimize solution uncertainty. A geophysical method often used in karst environments to detect cavities is the ERT method, which is quite resolving and reaches important depths when compared with, for example, ground-penetrating radar (GPR) in the presence of conductive soils. Electrical resistivity tomography (ERT) is one of the most commonly used geophysical methods for imaging the distribution of electrical resistivity in the subsurface, with applications ranging from geological and hydrogeological investigations to environmental monitoring, engineering site characterization, and the detection of subsurface cavities in karst environments e.g., [5,6,7,8,9,10]. Several methods have been developed for direct current (DC) resistivity data interpretation. Barbolla et al. [11] introduced the application of the continuous wavelet transform to DC resistivity data, developing a method that does not require a starting model or other a priori information. The most used method is based on the inversion process and there are stable and fast automatic data inversion techniques e.g., [12,13,14].
Of all of the physical properties, the electrical resistivity of geological materials exhibits one of the largest ranges, with sedimentary rocks generally being the most conductive due to their high pore fluid content. The electrical properties of the interstitial fluid in sedimentary rocks are probably more important than those of the host rock. The resistivity of saline groundwater can be as low as 0.05 Ωm, whereas the resistivity of some groundwater and glacial meltwater can exceed 1000 Ωm [15]. As mentioned by Rashid et al. [16], an increase in soil moisture from 10% to 20% can reduce resistivity by up to 14 Ωm [17,18]; fine-grained soils, such as clay, have low porosity and permeability, resulting in low resistivity [19]; an increase in the fine fraction of more than 50% reduces resistivity to 5 Ωm [20]. The karst elements can be partially or entirely air- or water-filled and the contrast of electrical resistivity with the host medium depends on the filling materials. In a fairly homogeneous medium, the resistivities increase if the cavities are air-filled and decrease if they are filled with clay or water. The ERT method can detect fractures if the electric resistivity values are different from those of the host rock [21]. The presence of clay or water within the cracks of a calcarenitic host rock will satisfy this criterion, as the resistivity of such a rock is less than 20 Ωm. This is in contrast with the several thousands of Ωm of the calcarenite. In the case of air-filled fractures, the resistivity is very high. This strong variability in fracture resistivity can lead to confusion when interpreting the results, especially if the fractures are close together. Several other factors influence cavity and conduit detection in karst terrain, such as the depth, the size, the geometry, the orientation, and the distance to the edge of the cavity or conduit [22]. In the literature, there are many examples of the application of ERT, in a variety of different geological settings, to the detection of cavities while evaluating geological contexts other than karst terrains. Maillol et al. [23] applied surface and downhole resistivity surveys for delineating uncharted mine galleries in West Bengal, India. The results show that ERT is a reliable tool to image water-filled voids but that it is not applicable for the detection of dry voids in high resistivity host. Roth and Nyquist [24] tested ERT at a site located in a corner of an athletic field complex where around 15 sinkholes form each year. The site is underlain by a formation consisting of alternating layers of limestone and dolomite. They found that ERT surveys can reveal the locations of voids if multiple orientations of the test line are used and the lines are spaced at intervals of 5 m or less. Boucher et al. [25] conducted a survey above a known water-filled conduit. The results identify a low resistivity anomaly (which was found to have moved when compared with the actual position of the conduit) that they interpreted as induced by a fractured zone and not the conduit. Zhu et al. [26] applied ERT surveys to locate karst conduits in the Inner Bluegrass Region, in Kentucky. Their results show undistinguishable differences in the anomaly signals between the water-filled conduit and other water-bearing features such as water-filled fracture zones. Conversely, Putiska et al. [27] presented the results of ERT simulations on cavity models containing a thin, highly conductive layer around an air-filled cavity. An air-filled cavity with very high resistivity appears as conductive on the inverse resistivity section. Martorana and Capizzi [28] studied the effects of three-dimensional structures present below or near the survey line on the 2D ERT inversion. They found that these effects can result in interpretative errors, such as the detection of false cavities or resistive blocks in the vertical direction, or incorrect estimations of depth and structure dimensions. Even in contexts that are not necessarily karstic, the ERT method has had difficulty distinguishing between different types of rock. A study by Guinea et al. [29] revealed that, while the resistivity of macronodular gypsum was as expected, that of layered gypsum was lower than expected despite its high gypsum content. The presence of secondary microcrystalline gypsum in the layered units and the complex lithofacies were identified as the cause of the discrepancy. We focus on karst environments and ask ourselves some questions: is it always possible to detect a cavity or a karst tunnel? Are there particular geological and hydrogeological conditions that physically prevent their detection? If the cavity is detected, can the geometry and depth be reconstructed?
We focused our study on the Salento peninsula, a sub-region that extends over the southern part of Apulia, in SE Italy. The region is seriously affected by the development of sinkholes related to dissolution processes due to the diffuse carbonate outcrops [30]. We consider the Torre Castiglione area in particular, where sinkhole evolution is strongly influenced by the interaction between fresh and brackish water: this process results in a strongly enhanced dissolution of soluble rocks and an increase in karstification. In this area cave divers identified a water-filled karst tunnel which develops at a depth upper to 3 m at the top. Direct measurements show that the thickness of the vaults is approximately 3.50 m, comparable to the depth of the water table level. In order to physically characterize this area, geophysical investigations were conducted through the use of GPR and electrical resistivity tomography (ERT) methods. The GPR results show the presence of groups of cavities at expected depths. The ERT results detect conductive anomalies but at a depth greater than the actual depth. This work aims to identify and explain the pitfalls of possible ERT inversion models in particular karst environments, which can lead to data misinterpretation. To understand why the cavities are incorrectly positioned, we performed ERT simulations considering different surface fracture system geometries and resistivity contrasts. Depending on the type of rock, water-filled cavities are conductive in a relatively resistive environment. This study presents a case in a karst environment where the depths of the cavities are known. However, the results of the ERT data inversion overestimate the depth of the water-filled cavities.

2. Torre Castiglione: Geological Setting

The Apulia carbonate platform was a significant paleogeographic feature along the southern coastline of the Mesozoic Tethys Ocean. Forming part of the stable and relatively undeformed foreland of the Apennine thrust belt, it is bounded on both sides by basin deposits. To the west, the margin is buried under Apennine thrust sheets, while to the east the adjacent paleogeographic domains are the vast Ionian Basin to the south and the Umbria–Marche Basin to the north. To the west, the Apulia Platform has been downfaulted beneath the terrigenous sediments of the Apennine foredeep, and to the southeast, the Jurassic–Early Cretaceous margin lies 20–30 km from the current coastline of Apulia [31,32,33].
Torre Castiglione is located in the north-western Salento peninsula, which is a Mediterranean area between the Adriatic Sea to the NE and the Ionian Sea to the SW (Figure 1a,b). Slope instability is widespread along the coast of Salento, caused by wave erosion and sinkhole formation (Figure 1c). These karst landforms are common in Salento and can produce unexpected damage to the human-made environment, especially when they occur as catastrophic collapses [34,35,36]. Salento’s geology is characterised by Jurassic and Cretaceous limestones and dolostones overlain by Tertiary and Quaternary clastic carbonates and subordinate clays. The area is a wide horst divided into uplifted and downthrown blocks with high-angle faults that mostly run from north-west to south-east. The present form of the Salento peninsula was established during the early Pleistocene, a time marked by tectonic uplift and a significant drop in sea level, resulting in its present position [37].
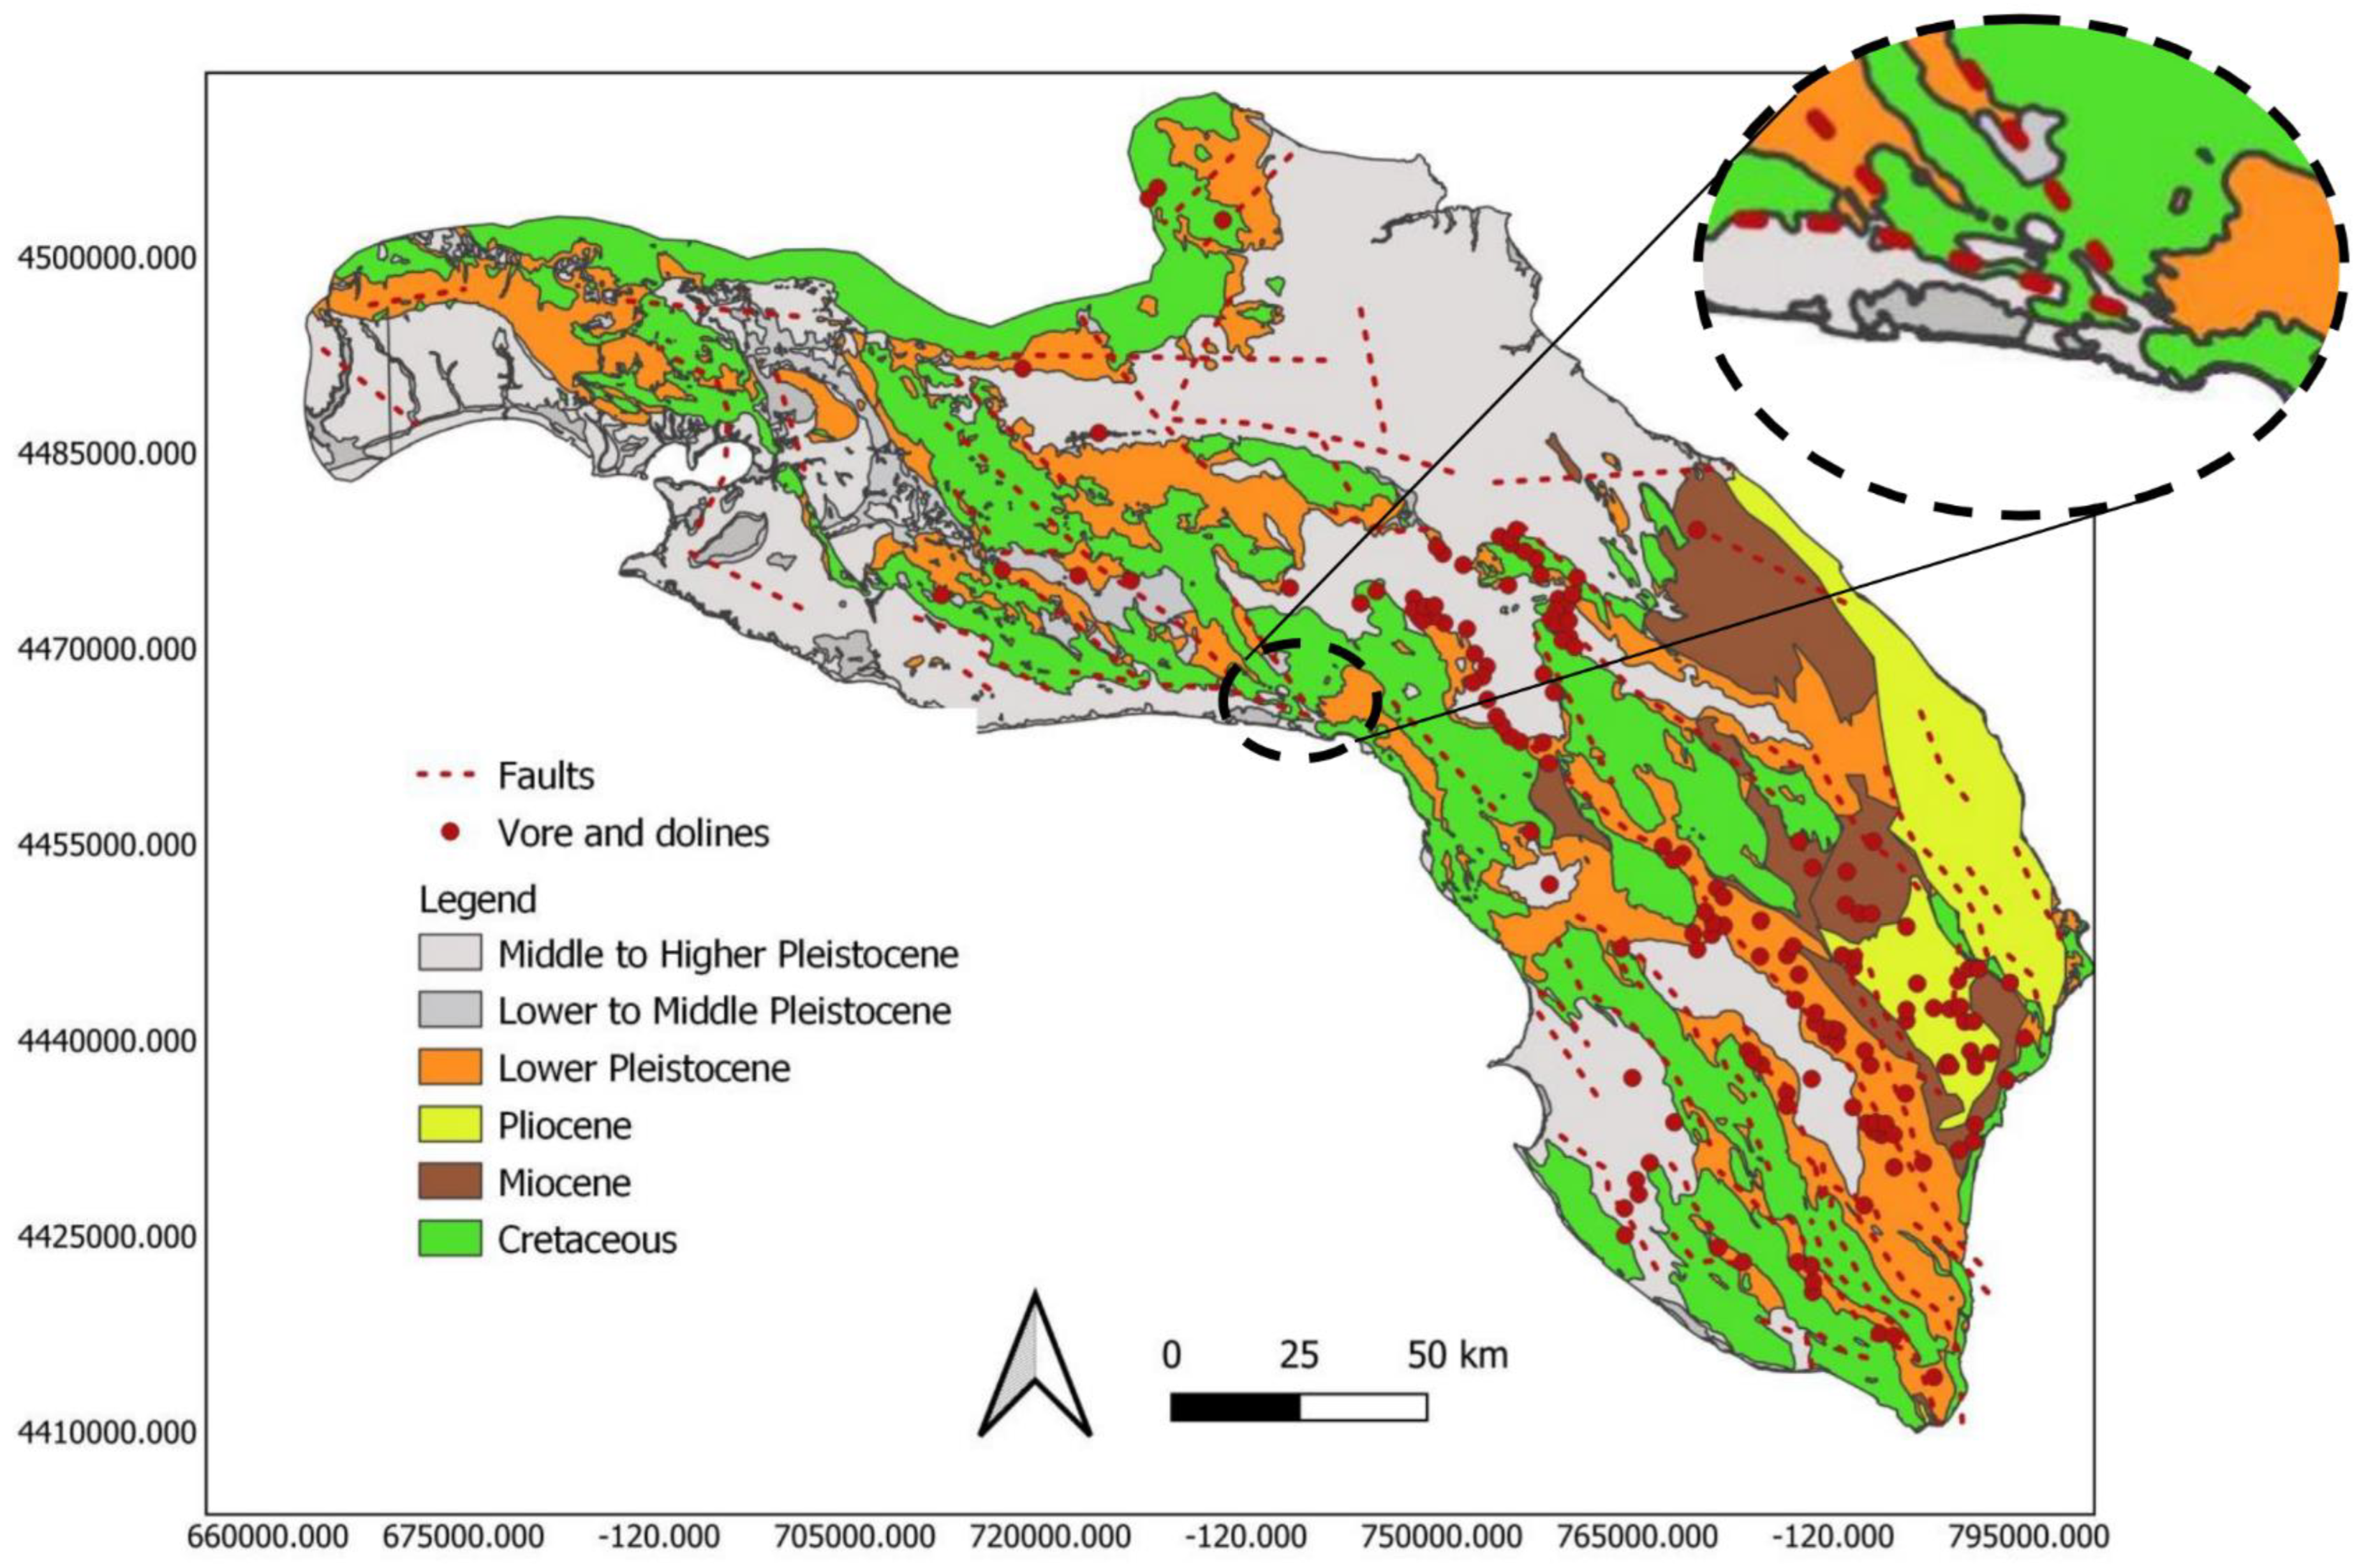
The local geology consists of Cretaceous bedrock formed from limestone and dolomitic limestone. This is covered by Pliocene and Pleistocene calcarenite and limestone deposits [38] (see Figure 2). The latter unit emerges along the coast from Torre Castiglione to Torre Lapillo, where the studied sinkholes are located. The geological setting is completed by sand beaches and recent dunes. The concentration of sinkholes in the proximity of the coastline is also due to active hyper karst processes [39,40] related to the mixing of saltwater encroaching from the sea and fresh groundwater from the aquifer, which increases the aggressiveness and the dissolution capability of water. The study of the distribution of fractures around the sinkholes reveals three main discontinuity systems [41]. The most frequent is the WNW–ESE system, closely followed by the NNW–SSE system. A wider group of discontinuities ranging from WSW–ENE to W–E is less frequent but still significant. These two systems roughly coincide with the main orientation of the elongated sinkholes’ major axes at Torre Castiglione.
The survey area is located south of the Nardò Technical Centre (NTC), a well-known vehicle development and testing centre (Figure 1b). The investigated area is characterized by a sinkhole (Figure 1c) that runs very close to the province road SP 340. Previous studies conducted by cave divers in this area show the presence of a karst conduit accessible from the sinkhole, which runs parallel to the SP340 road, WNW-ESE oriented, and which branches out into two channels towards NW, which are at least 50 m long. Both of the conduits are 5.5 m high with the top about 3 m deep, meaning that their centroid is about 6 m deep. The brackish water table is about 3.5 m deep, meaning that the conduits are water-filled. Direct measurements of water salinity and conductivity showed values of 6.16 g/L and 9.630 μS/cm, respectively.

3. Methods

This study involved carrying out GPR and ERT geophysical surveys on a known karst system in order to test how geophysical methods respond in the presence of a cavity. As previously stated, ERT is widely used to study karst environments, though problems in the interpretation of geophysical models are always present. In this work, we apply the inversion process, using L1 and L2 norm-based optimisation methods, through an iteratively reweighted least-squares algorithm [43]. This approach can introduce ambiguities due to the non-uniqueness of the solution to the nonlinear, highly underdetermined problem, as is typically the case with inverse geoelectrical problems. Thus, the integration between different methods is necessary to reduce uncertainties, especially when the investigated medium is strongly heterogeneous and characterized by dense fractures, and in the presence of seawater intrusion. We used two geophysical methods: electrical resistivity tomography (ERT) and ground-penetrating radar (GPR). The acquisition profile (Figure 1b) crosses the karst conduit transversely: this choice was made due to difficulties in accessing the entire area.
Given that, in karst regions, the shallow layer is generally strongly fractured with a complex structure and different size voids, to study how some geological structures could influence the ERT results, we first modelled a karst conduit (empty and full of water) within a homogeneous background. We then evaluated the case of the same karst conduit below the groundwater level and the presence of heterogeneities in the shallow layer above it. We simulated ERT surveys on different models using the 2D finite difference method. The dipole–dipole array is one of the most commonly used electrode configurations for detecting subsurface lateral changes. In their study, Doyoro et al. [44] inferred that, despite being more vulnerable to measurement noise and often producing a low signal-to-noise ratio, the dipole–dipole array is the most effective for studying subsurface targets like cavities. Thus, in our study, we chose to use the dipole–dipole array.

3.1. Ground-Penetrating Radar (GPR)

Ground-penetrating radar (GPR) uses high-frequency electromagnetic waves to explore the subsurface. It is a non-invasive and rapid method for characterising and detecting the shallow subsurface [45,46]. GPR is widely used in various geological contexts, including identifying tectonic structures [47], conducting geotechnical investigations [48], and for sedimentological, geomorphological, and geoarchaeological applications [49,50,51]. Short pulses of electromagnetic energy are released by the transmitting antenna of the GPR system. This energy passes through the material and is then reflected at an interface between materials with different dielectric properties. Strong reflections from lithological boundaries are caused by abrupt changes in dielectric properties [52]. However, several factors, such as differences in sediment moisture and groundwater levels, as well as diffractions resulting from subsurface and surface infrastructure, can make the measurement and interpretation of GPR survey results difficult [46,53]. Two-way travel time (TWT) refers to the time between signal transmission, reflection, and reception, and is commonly measured in nanoseconds. This is a function of reflector depth and the propagation of electromagnetic (EM) velocity [46,52]. A continuous profile of the shallow subsurface is provided by GPR, with horizontal survey distance displayed against vertical TWT. Vertical TWT can be converted to depth using knowledge of the propagation velocity. The dielectric coefficient and electrical conductivity of the subsurface strongly impact resolution and depth penetration [52,54]. Higher water content diminishes propagation velocity, whereas saline water, clay or differing degrees of peat decay increase electrical conductivity, leading to rapid signal attenuation [55].
The GPR data were collected with a 200 MHz antenna with 180 ns, sample/scan 512 by means of a Sir 3000 GSSI (Figure 3a). All GPR data were acquired in monostatic, continuous mode, i.e., the antenna was moved continuously along the profile with a constant speed and at reference marker distance of 2 m. The data were processed by horizontal normalization and background removal using the ReflexW software v9.5 [56]. We estimated the average velocity of electromagnetic propagation using the diffraction hyperbola method, obtaining a velocity of v = 8 cm/ns. Once the average velocity is known, the time scale of the radar section can be converted to depth.

3.2. Electrical Resistivity Tomography (ERT)

The ERT survey was conducted with a Syscal R1 (Iris), using a dipole–dipole array of 48 electrodes, with a dipole spacing of 2 m (Figure 3b). The inversion process provided a real resistivity model. This was then interpreted.
RES2DINV software 2024.1 [57] was used for data inversion and to obtain two-dimensional resistivity models of the subsoil. We used the L2 norm-based optimisation method, through an iteratively reweighted least-squares algorithm [43].
We used a minimum damping factor equal to 0.02 and an initial damping factor equal to 0.15. We chose model cells with widths of half the unit spacing.

3.3. Numerical Modeling

We considered a karst conduit and developed several 2D resistivity models to represent different karstic subsurface structures in limestone terrain. The ERT simulation is performed using the RES2DMOD software [58], through 48 electrodes with 2 m spacing (which leads to a 94 m long profile) and the dipole–dipole array with the n factor ranging from 1 to 8. These parameters are fixed for all of the analysed models. The data are inverted through the RES2DINV software, using the L1 norm-based least-square optimisation method, which provides improved results for resistivity models with sharp boundaries, and the parameters shown in Table 1. We approximate the body section to an ellipse 9 m wide (along its major axis) and 4 m thick. The centre is located at x = 47 m and its depth top is z = −3 m. As this work specifically examines the cavities in the karstic environment, the host medium of the models was considered as dry limestone rock with resistivity values ranging from 1500 to 100,000 Ωm to illustrate different degrees of karstification. When the water table is above the cavity, we used resistivity values of 500 Ωm for the limestone rock under the water table and of 10 Ωm for the water-filled cavity. We used the resistivity value of 1,000,000 Ωm for the air-filled cavity and voids. In karst environments, voids are formed when the rock fractures or fissures, which in turn leads to variations in the electrical resistivity of the rock. If the rock is dry, its resistivity increases as the degree of fracturing and void expansion increases. Numerical models always simplify reality. Our aim was to understand how fracturing influences the location of the cavity. To achieve this, we varied the resistivity of the surface layer and the unsaturated (vadose) zone. By changing the resistivity, we analysed different degrees of fracturing. Considering the actual heterogeneity, associating the variations in resistivity with different degrees of fracturing is a simplification of the model.

4. Results

4.1. Geophysical Survey Results

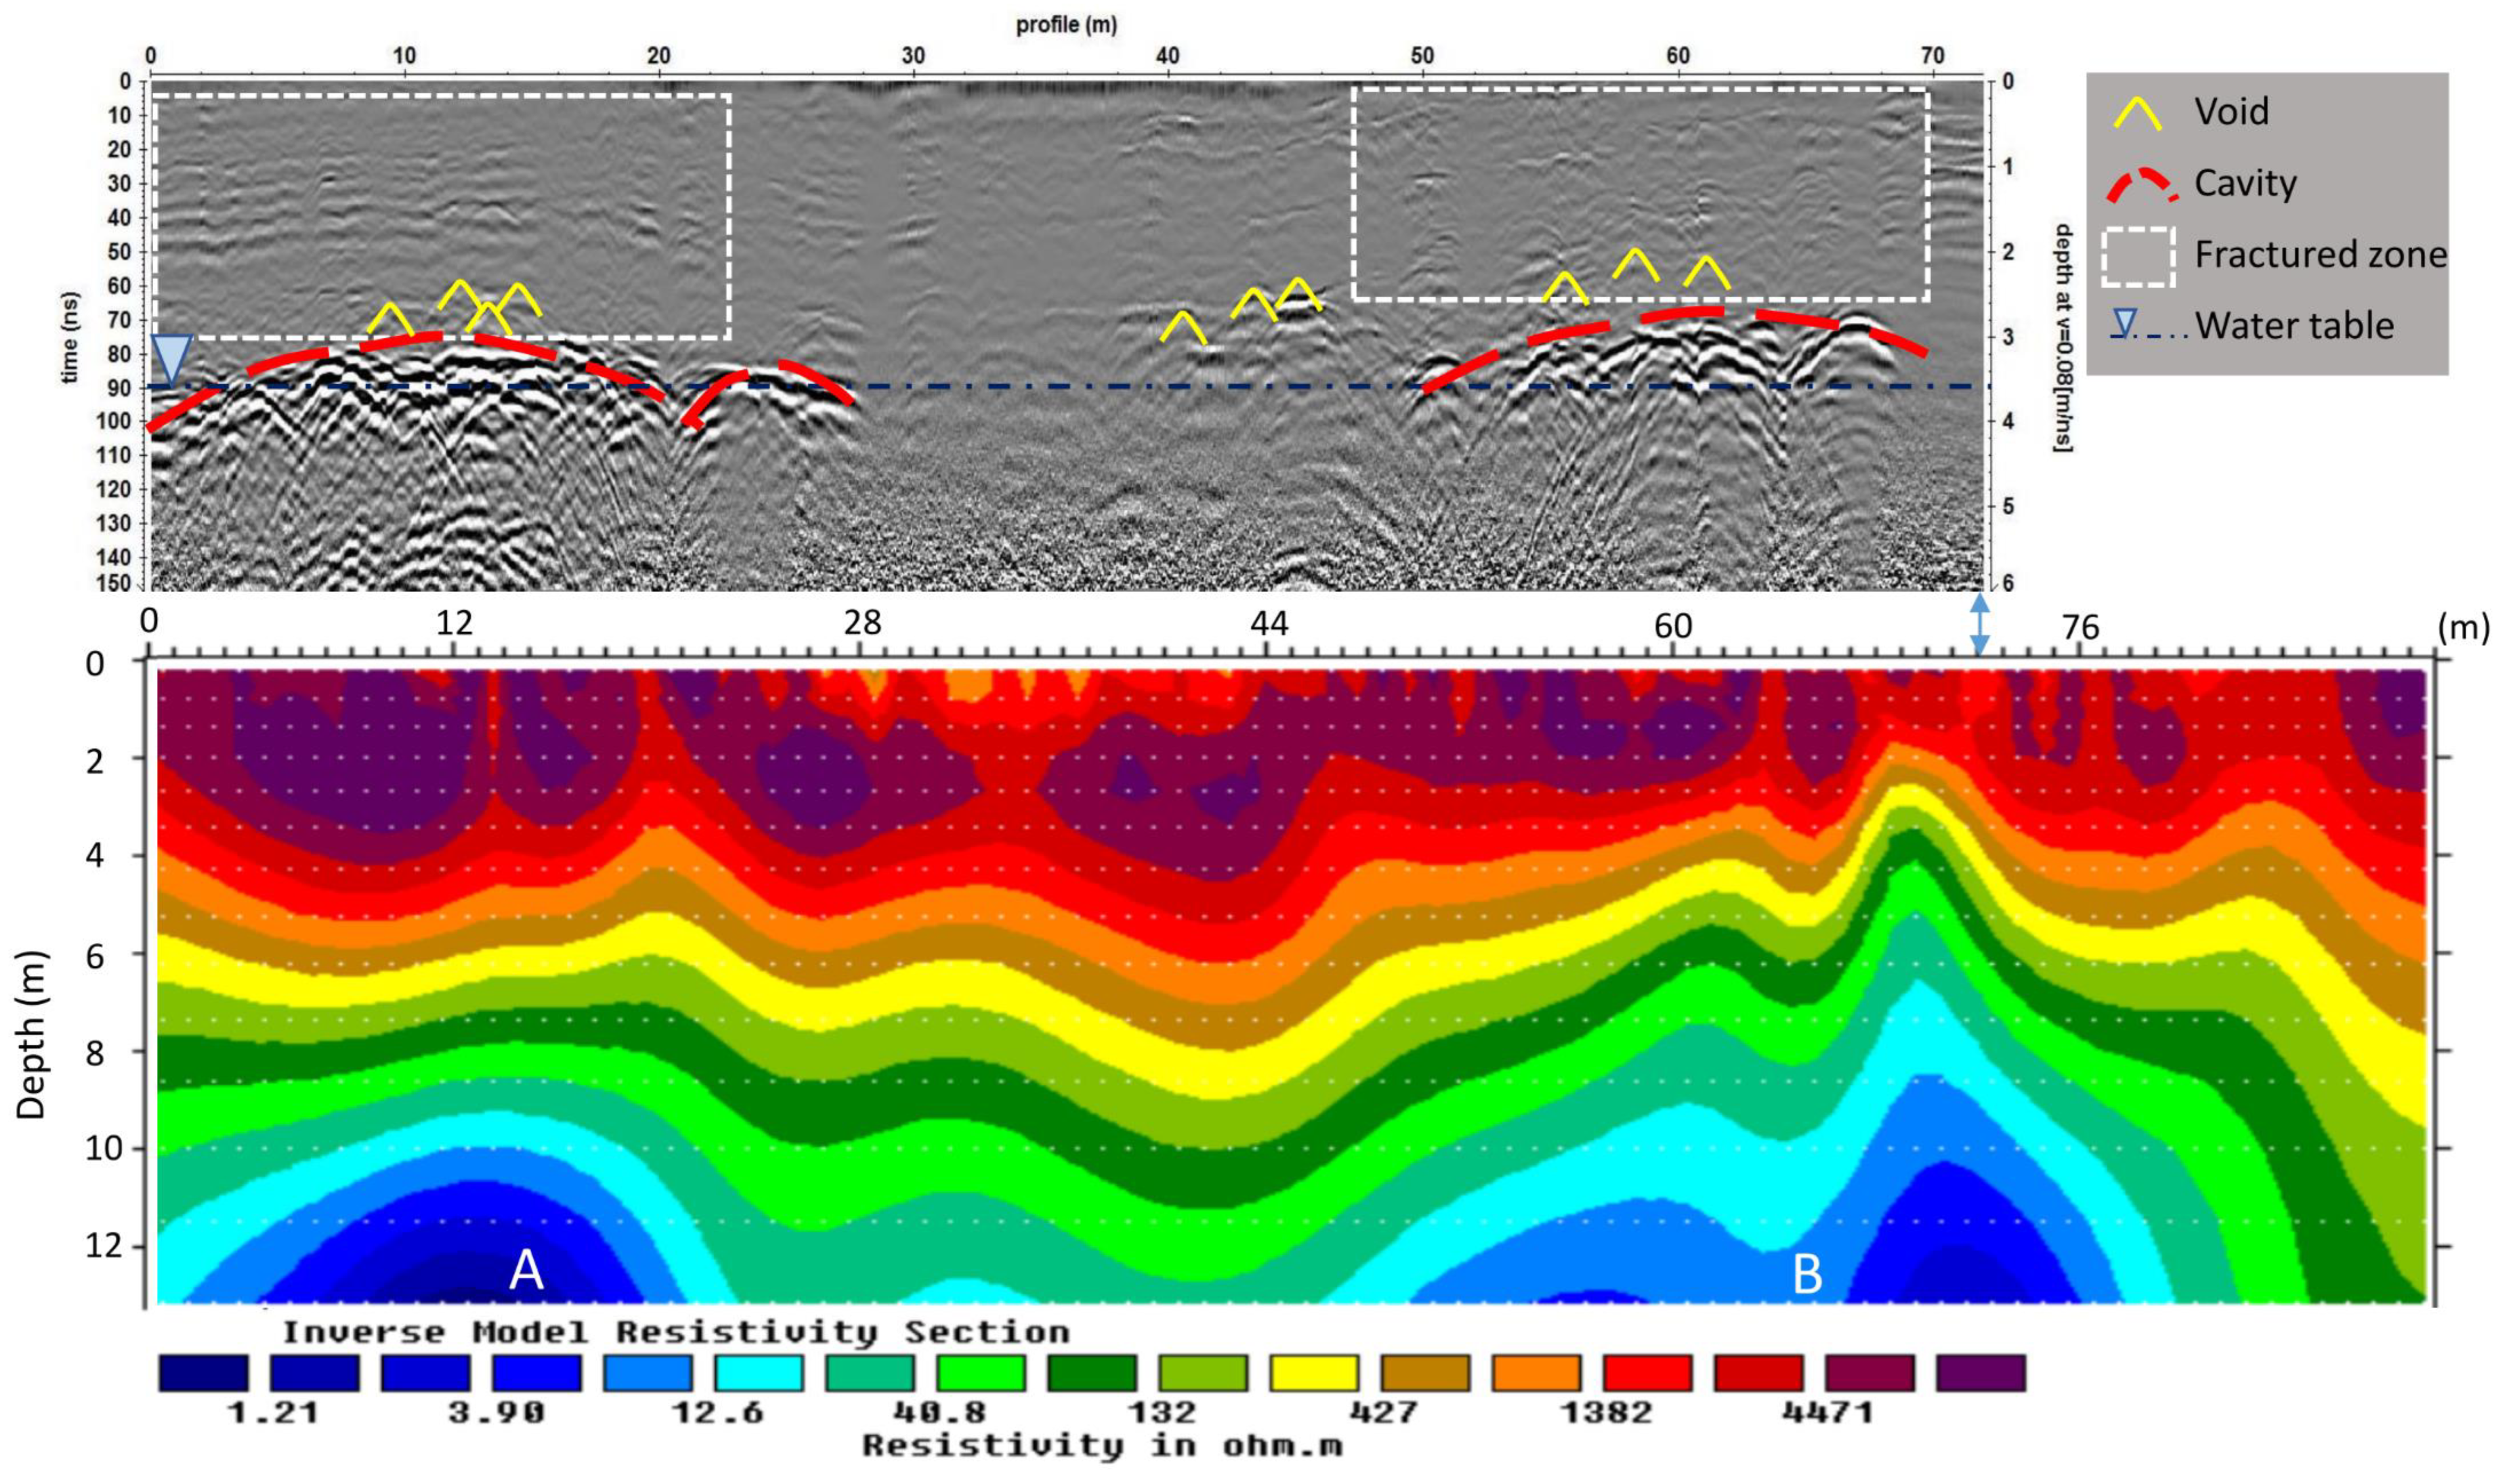
The radar section shows strong signal reflections between about 2.8 m and 3.8 m of depth. Many anomalies are likely, due to high fracturing, voids and the presence of cavities (Figure 4a). The strong signal reflections between 4 m and 30 m on the x-axis at about 3 m depth correspond to the top of the gallery explored by cave divers. However, the detected anomalies highlight a complex structure of the karst system, different from the strong simplification shown by cave divers.
The image from the ERT survey in Figure 4b, shows a shallow layer with higher resistivity (about 2600 to 10,000 Ωm) and two conductive areas (about 5 Ωm) labelled A and B. Area A is placed between 2 m and 27 m on the x-axis and it extends vertically from a depth of about 8 m. Considering the x-position of A, we find that it corresponds to the explored caves area and, in fact, about the same x-positions are highlighted by the GPR survey, though the depth is strongly increased. The area B result is placed between 51 m and 80 m on the x-axis and it extends vertically from a depth of about 5 m. This conductive area is detectable in the radar section following the typical black and white banding of signal which increases in size relative to the time axis. It is clearly visible along the progressive from x = 30 m to x = 50 m and over, starting from 85 ns. Additionally, the estimated depth is greater in this case, when compared with the GPR data. Several high-resistivity areas are interpreted as fractures. In the middle (between 42 m and 50 m on the x-axis) there is a shallow area with resistivity of about 8000 Ωm that corresponds to fractures also identified from the GPR. The highest resistivity area (greater than 10,000 Ωm) is located from 8 m to 27 m on the x-axis and corresponds to the centre of the anomalies found from GPR.

4.2. ERT Simulation Results

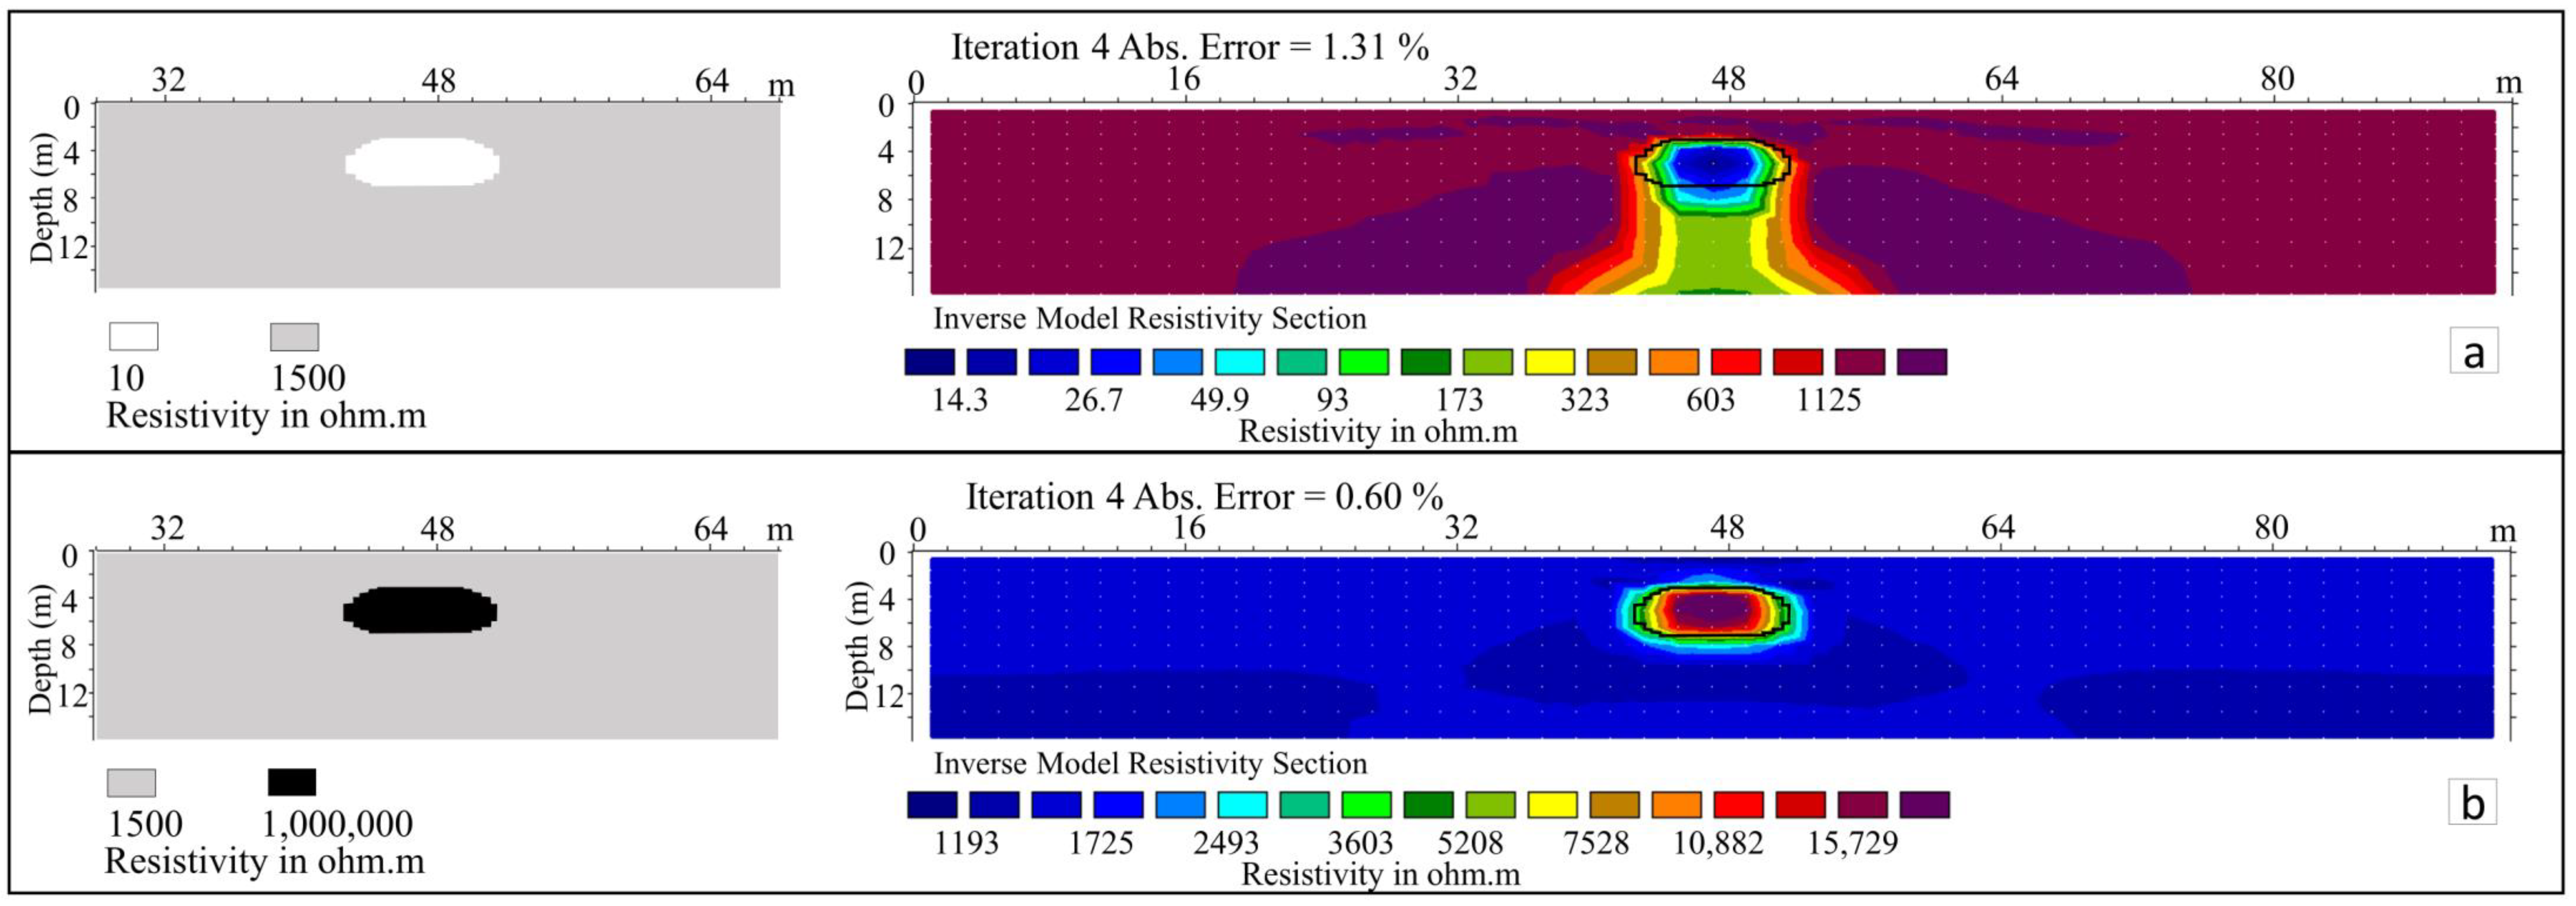
In this section, we present the results of resistivity synthetic data inversions. In nature, karst conduits can be air-filled, water-saturated, or sediment-filled. To evaluate the effect of some possible karst structures we generated different synthetic models, starting from a simple one: a karst conduit (empty and full of water) within a homogeneous background (Figure 5). In the model with the water-filled conduit, the resistivity imaging displays an anomaly centered at x = 47 m with a thicker size than the actual cavity model (Figure 5a). This anomaly is centered at x = 47 m and the top is z = −3 m deep. The geometry accuracy is considerably varied for the upper and the lower boundaries: the top of the anomaly is z = −3 m deep and it coincided with the actual cavity model, while the bottom boundary extended beyond that of the actual model. Contrariwise, in the model with the empty conduit (Figure 5b) the inverse resistivity section displays an anomaly exactly coinciding with the actual conduit position, defining its top and bottom boundaries.We studied how the measures of electrical potential in the detection of a water-filled karst conduit are influenced by the following:
-
a resistive shallow layer;
-
a thin void above the cavity with different widths and at several depths.
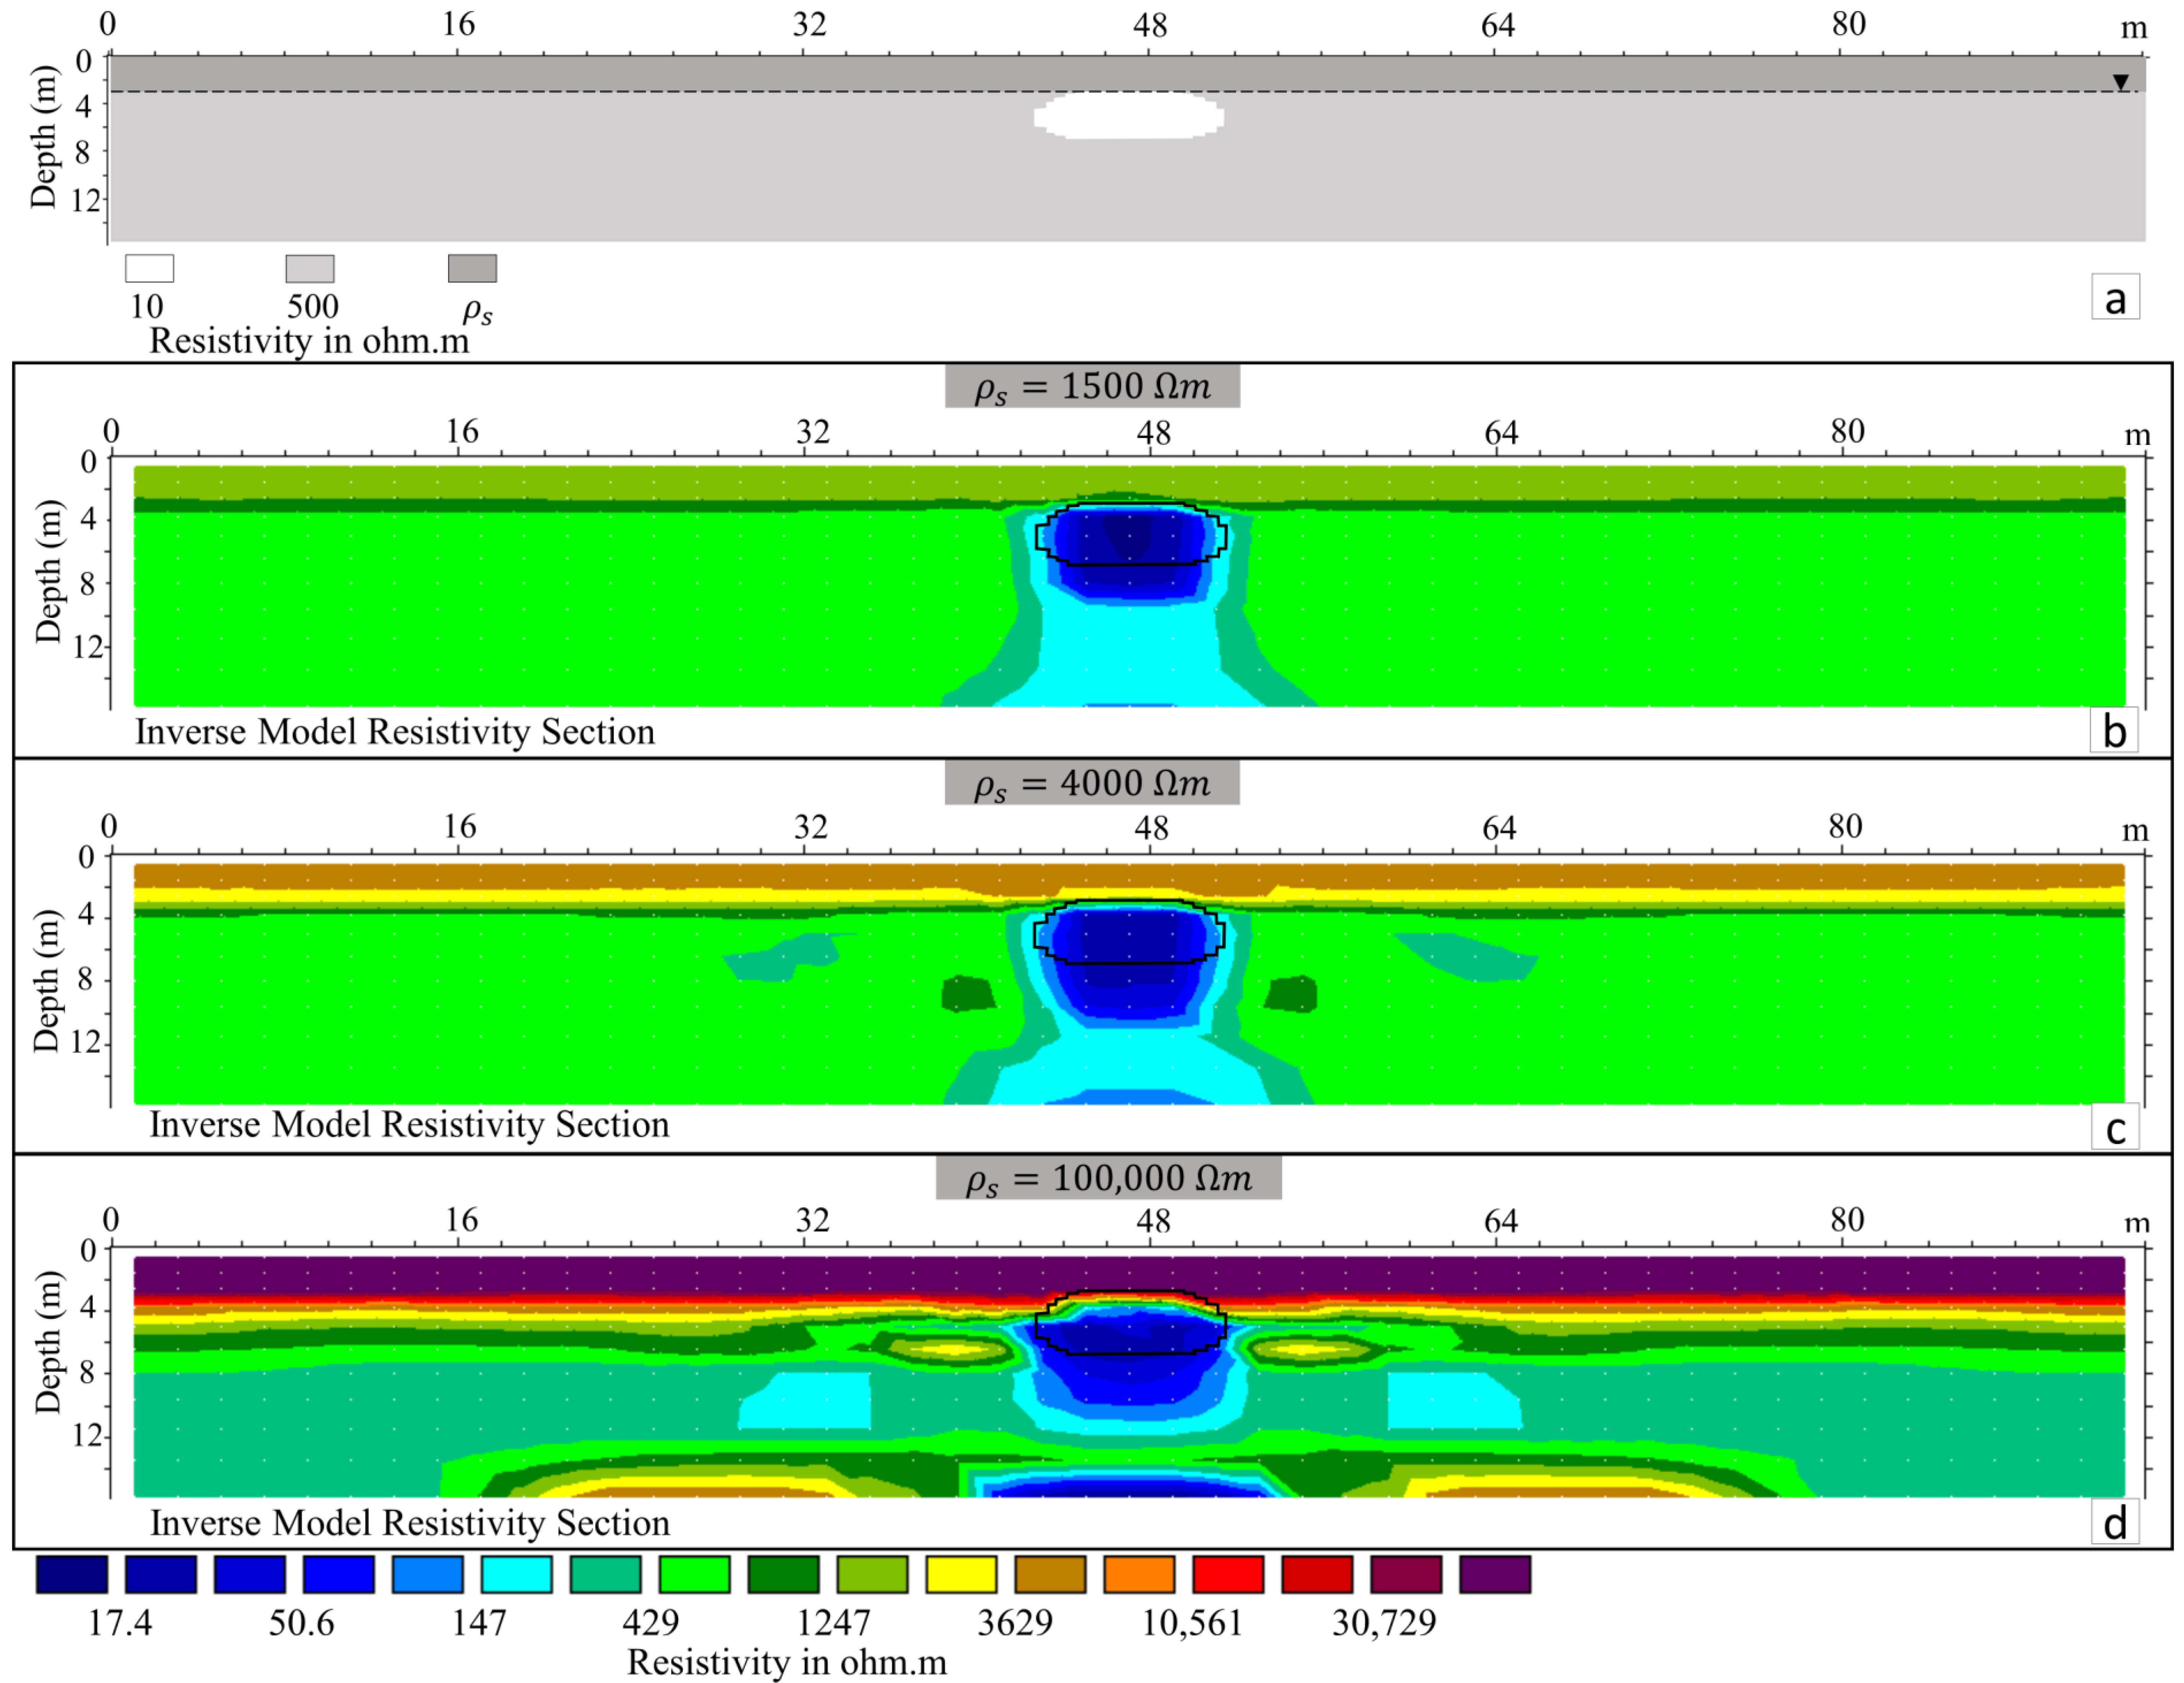
We now consider a conduit under the water table and three different degrees of karstification identifiable with different resistivities of the shallow layer (dry limestone). As described above, the model is a simplification: the surface resistive layer represents a fractured, unsaturated zone. The variation in resistivity is used to model different degrees of fracturing. Figure 6 shows inverse model resistivity sections for a water-filled cavity under a resistive shallow layer with different electrical resistivities ( ρ s ) . The presence of the conductive body is detected in all of the cases: the top depth anomaly coincides with the actual cavity top boundary in models with ρ s = 1500   Ω m and ρ s = 4000   Ω m (Figure 6a–c). The inverse section for the model with a higher resistivity shallow layer (Figure 6d) displays an overestimated top-depth anomaly and considerable artifact contaminations. In all of the cases, the anomaly has a thicker size than the actual modelled cavity.
A karst system is often characterized by high-density fracture zones. When such a phenomenon increases, noticeable voids are formed of different sizes and orientations. Is it always possible to locate a water-filled conduit when a fracture system develops above it? We studied the case of a thin horizontal void at different heights above the conduit. We modelled a void 20 cm thick and evaluated the influence of its width on the results of the data inversion by considering three different widths: smaller, equal, and longer than the maximum width of the cavity.
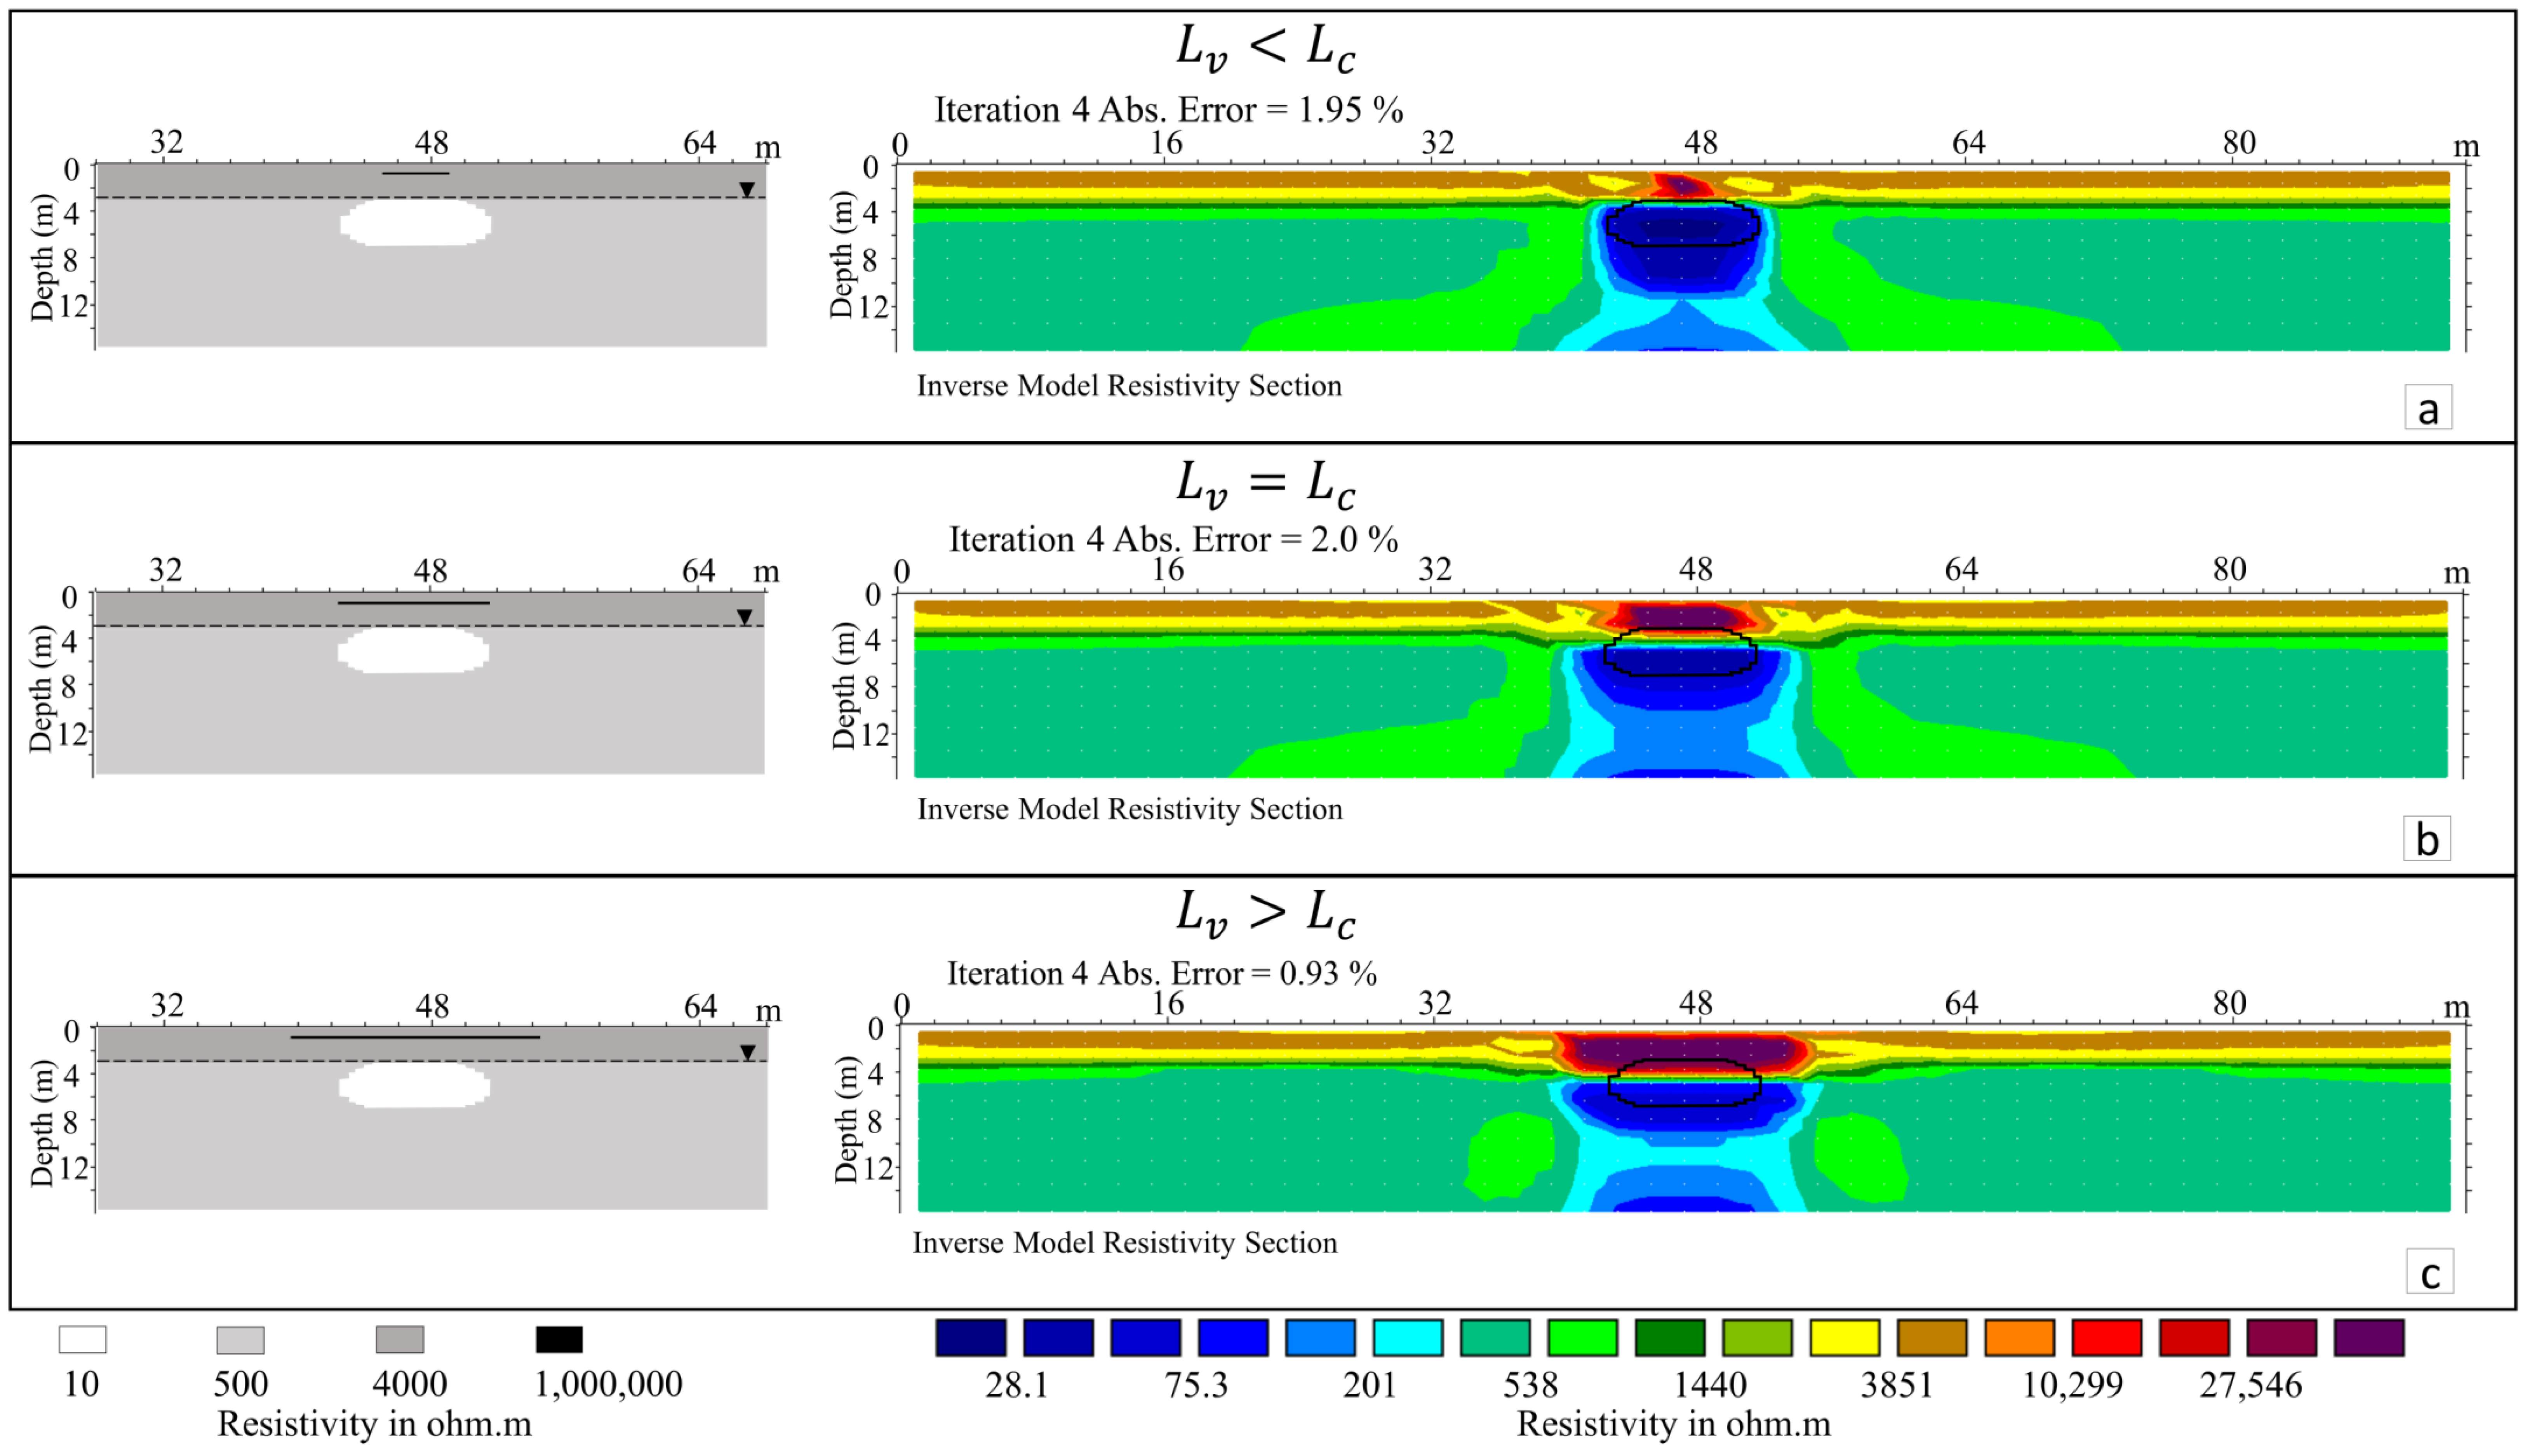
Figure 7 shows the inverse resistivity sections of models in which the void is 90 cm deep at the top: when its width is smaller than the cavity size (Figure 7a), the inversion displays a conductive anomaly thicker than the actual cavity, centred at x = 47 m, with the upper boundary about 3 m deep and the horizontal extension slightly wider than the actual cavity. A resistive anomaly centred at x = 47 m detects the shallow void with low accuracy and without allowing one to obtain information about its shape and depth. When the void width is equal to that of the cavity (Figure 7b), the inverse section shows a resistive anomaly that extends from the surface to a depth of about z = −4 m and a conductive anomaly visibly larger and deeper than the modelled conduct. This behaviour is emphasized when the void width is larger than that of the conduit (Figure 7c) by showing a thicker resistive anomaly whose width corresponds to that of the void.
By increasing the depth of the void to 2 m and 2.8 m top depth (Figure 8 and Figure 9, respectively) the inverse resistivity sections show the same behaviour, though the conductive anomaly deepens further than that described previously.

5. Discussions

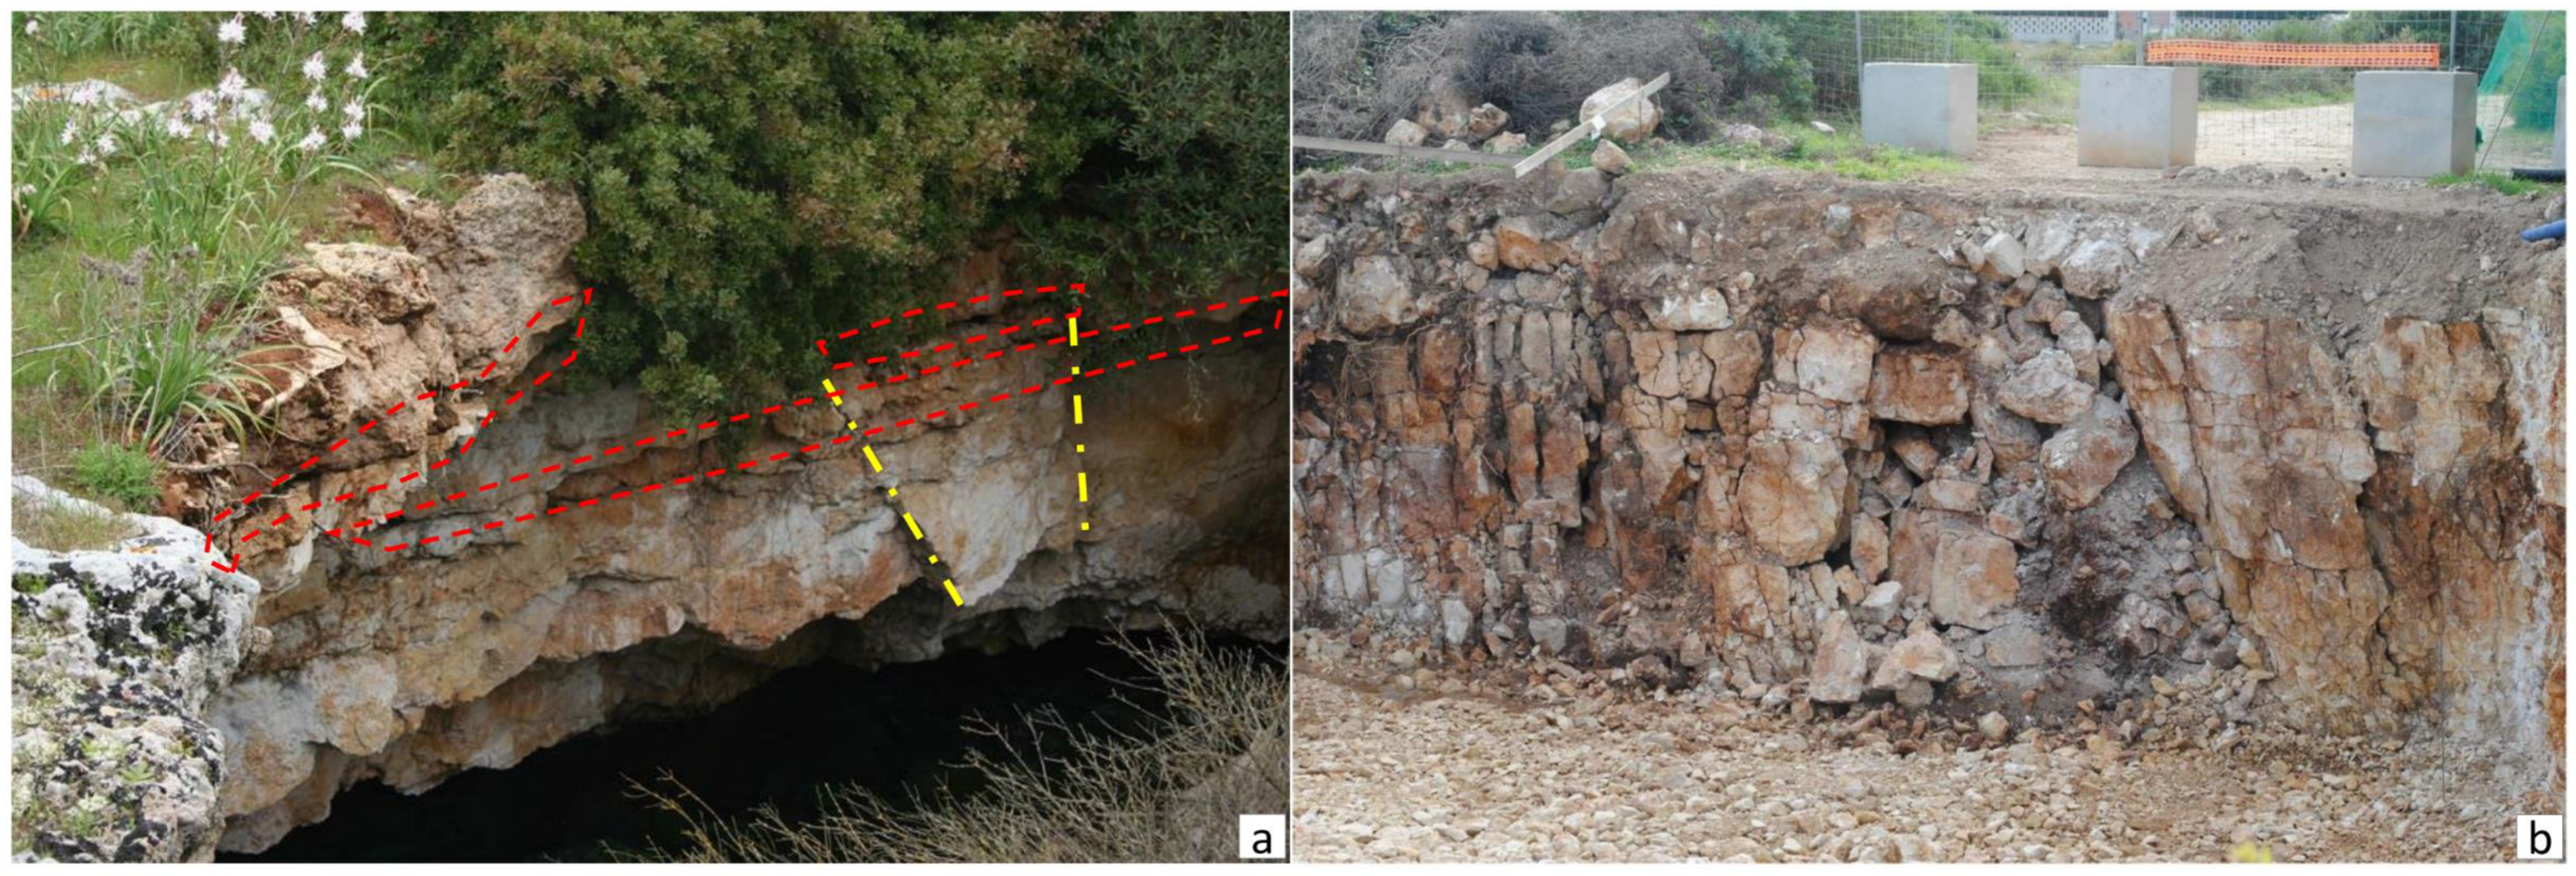
The GPR results have detected anomalies that highlight the complex structure of the karst system in the investigated area. Thus, the image produced by the cave divers’ results is a strong simplification. We have identified a shallow fractured zone and a group of cavities at about 3–3.5 m depth in the first meters of the profile. Figure 10 shows the sinkhole features in the investigated area. Systems of horizontal, subhorizontal and subvertical fissures are evident on the vault of the sinkhole (Figure 10a). The rocks in the surrounding area are strongly fractured (Figure 8b). In correspondence with points A and B in Figure 3b, the ERT resistivity inversion detects two low-resistivity areas, but the estimated depth is greater than that of the anomalies found by the GPR. The aim of the synthetic models is to attempt to explain this behaviour.
The presence of complex surface fractures in the rock above a cavity can mask the cavity filled with water. In order to demonstrate this, we presented several geological cases starting from simple models with cavities filled with water and air. As seen in Figure 5, the cavity is visible in both cases. Figure 6 shows more complex models, in which we considered the presence of an aquifer and the cavity underneath it. By increasing the resistivity of the surface rocks, artifacts increase, and the inversion identifies the water-filled cavity at a greater depth than in reality. Thus, the presence of highly fractured rocks on the shallow layer makes it difficult to resolve the inversion process. We added shallow fractures with different widths and brought them closer to the water surface (Figure 7, Figure 8 and Figure 9). By widening the fractures (when their length is equal to or greater than the width of the cavity) and increasing their depth until the water surface (from 90 cm to 2.80 m) the inverse resistivity sections show the conductive anomaly at a greater depth. The results obtained when considering a void with a horizontal extension greater than that of the cavity at a depth close to the water table (see Figure 9c) are comparable with those of the experimental section of the case study presented (see Figure 4b). In this case, the roughness of the top of the cavity or karst conduit creates voids in the upper part, between the rock surface and the water table level. The cavity is therefore partially filled with water, with an estimated filled volume of around 90%. Severe erosion occurs near the cavity’s boundaries and the cracks above the water table level could extend well beyond them. In this condition the electric method is unable to resolve the right shape and position of the cavity. When the air-filled fracture is close to the water-filled cavity information is lost. The real case is more geologically complex, so the interference of several cavities makes the situation even worse.

6. Conclusions

Locating a subsurface cavity or conduit is a challenging task in a karst environment, and the knowledge of geology and hydrogeology about the studied area is fundamental. A karst feature is often not easy to detect, mainly due to background complex structures—in some cases, it is difficult to identify the actual depth of a karst conduit. We studied resistivity imaging uncertainties in the case of water-filled subsurface cavities using synthetic models. The obtained results indicate that the anomalous image of the conduit in the inverse section is highly dependent on horizontal fractures. Specifically, we presented the case of a thin horizontal empty fracture above a water-filled karst conduit, showing that, when the width of the fracture is comparable to or greater than that of the cavity, the anomaly related to the conduit tends to be distorted with respect to its actual depth. The thin void above the conductive zone creates conditions that enhance the resistivity anomaly in the inversion section, which leads to the effect that the resistivity of the water-filled cavity appears underestimated and at a greater depth.
We have demonstrated that, in a karst environment with water-filled or partially filled cavities, small but extensive shallow fractures can have a significant impact on the ERT results obtained using this interpretation method. Integrating multiple geophysical methods is always fundamental. Further studies of the inversion method are required to determine the most suitable approach for these circumstances in the future.

Author Contributions

Conceptualization: S.N. and D.F.B.; methodology: S.N. and D.F.B.; software: D.F.B.; formal analysis and investigation: S.N. and D.F.B.; writing—original draft preparation: D.F.B.; writing—review and editing: S.N. and D.F.B. All authors have read and agreed to the published version of the manuscript.

Funding

This research received no external funding.

Data Availability Statement

Data associated with this research are available and can be obtained by contacting the corresponding author.

Conflicts of Interest

The authors declare no conflicts of interest.

Abbreviations

The following abbreviations are used in this manuscript:
ERTElectrical resistivity tomography
GPRGround-penetrating radar
DCDirect current
TWTTwo-way travel time

References

  1. Zerga, B. Karst topography: Formation, processes, characteristics, landforms, degradation and restoration: A systematic review. Watershed Ecol. Environ. 2024, 6, 252–269. [Google Scholar] [CrossRef]
  2. Stevanović, Z.; Gunn, J.; Goldscheider, N.; Ravbar, N. Karst: Environment and Management of Aquifers; The Ground Water Project: Guelph, ON, Canada, 2024. [Google Scholar]
  3. Perrotti, M.; Lollino, P.; Fazio, N.L.; Parise, M. Stability charts based on the finite element method for underground cavities in soft carbonate rocks: Validation through case-study applications. Nat. Hazard. Earth Syst. 2019, 19, 2079–2095. [Google Scholar] [CrossRef]
  4. Chalikakis, K.; Plagnes, V.; Guerin, R.; Valois, R.; Bosch, F.P. Contribution of geophysical methods to karst-system exploration: An overview. Hydrogeol. J. 2011, 19, 1169–1180. [Google Scholar] [CrossRef]
  5. Cook, K.L.; Van Nostrand, R.G. Interpretation of resistivity data over filled sinks. Geophys. Prospect. 1954, 21, 716–723. [Google Scholar] [CrossRef]
  6. Vincenz, A. Resistivity investigations of limestone aquifers in Jamaica. Geophysics 1968, 33, 980–994. [Google Scholar] [CrossRef]
  7. Dutta, N.; Bose, R.; Saikia, B. Detection of solution channels in limestone by electrical resistivity method. Geophys. Prospect. 1970, 18, 405–414. [Google Scholar] [CrossRef]
  8. Greenfield, R.J. Review of geophysical approaches to the detection of karst. Bull. Assoc. Eng. Geol. 1979, 16, 393–408. [Google Scholar] [CrossRef]
  9. Militzer, H.; Rösler, R.; Lösch, W. Theoretical and experimental investigations for cavity research with geoelectrical resistivity methods. Geophys. Prospect. 1979, 27, 640–652. [Google Scholar] [CrossRef]
  10. Smith, D.L. Application of the pole–dipole resistivity technique to the detection of solution cavities beneath highways. Geophysics 1986, 51, 833–837. [Google Scholar] [CrossRef]
  11. Barbolla, D.F.; Negri, S.; Fedi, M. Analysis of direct current resistivity data using continuous wavelet transform. Geophysics 2022, 87, E319–E334. [Google Scholar] [CrossRef]
  12. De Groot-Hedlin, C.; Constable, S. Occam’s inversion to generate smooth, two-dimensional models form magnetotelluric data. Geophysics 1990, 55, 1613–1624. [Google Scholar] [CrossRef]
  13. Li, Y.G.; Oldenburg, D.W. Approximate inverse mapping in DC resistivity problems. Geophys. J. Int. 1992, 109, 343–362. [Google Scholar] [CrossRef]
  14. Loke, M.H.; Barker, R.D. Rapid least-squares inversion of apparent resistivity pseudosections using a quasi-Newton method. Geophys. Prospect. 1996, 44, 131–152. [Google Scholar] [CrossRef]
  15. Everett, M.E. Near-Surface Applied Geophysics; Cambridge University Press: Cambridge, UK, 2013; 442p, ISBN 978-1-107-01877-8. [Google Scholar]
  16. Ur Rashid, M.; Ahmed, W.; Zeb, M.J.; Mahmood, Z.; Khan, S.; Waseem, M. Geoelectrical and magnetic survey of Tatta Pani thermal spring: A case study from Kotli District. Geomech. Geophys. Geo-Energy Geo-Resour. 2021, 7, 41. [Google Scholar] [CrossRef]
  17. Kibria, G.; Hossain, M. Investigation of geotechnical parameters affecting electrical resistivity of compacted clays. J. Geotech. Geoenviron. Eng. 2012, 138, 1520–1529. [Google Scholar] [CrossRef]
  18. Ozcep, F.; Yıldırım, E.; Tezel, O.; Asci, M.; Karabulut, S. Correlation between electrical resistivity and soil–water content based artificial intelligent techniques. Int. J. Phys. Sci. 2010, 5, 47–56. [Google Scholar]
  19. Abu-Hassanein, Z.S.; Benson, C.H.; Blotz, L.R. Electrical resistivity of compacted clays. J. Geotech. Eng. 1996, 122, 397–406. [Google Scholar] [CrossRef]
  20. Long, M.; Donohue, S.; L’Heureux, J.S.; Solberg, I.L.; Rønning, J.S.; Limacher, R.; O’Connor, P.; Sauvin, G.; Rømoen, M.; Lecomte, I. Relationship between electrical resistivity and basic geotechnical parameters for marine clays. Can. Geotech. J. 2012, 49, 1158–1168. [Google Scholar] [CrossRef]
  21. Szalai, S.; Kovács, A.; Kuslits, L.; Facskó, G.; Gribovszki, K.; Kalmár, J.; Szarka, L. Characterisation of Fractures and Fracture Zones in a Carbonate Aquifer Using Electrical Resistivity Tomography and Pricking Probe Methodes. J. Geosci. Environ. Prot. 2018, 6, 1–21. [Google Scholar] [CrossRef]
  22. Satitpittakul, A.; Vachiratienchai, C.; Siripunvaraporn, W. Factors influencing cavity detection in Karst terrain on two-dimensional (2-D) direct current (DC) resistivity survey: A case study from the western part of Thailand. Eng. Geol. 2013, 152, 162–171. [Google Scholar] [CrossRef]
  23. Maillol, J.M.; Seguin, M.-K.; Gupta, O.P.; Akhauri, H.M.; Sen, N. Electrical resistivity tomography survey for delineating uncharted mine galleries in West Bengal, India. Geophys. Prospect. 1999, 47, 103–116. [Google Scholar] [CrossRef]
  24. Roth, M.J.S.; Nyquist, J.E. Evaluation of multi-electrode earth resistivity testing in karst. ASTM Geotech. Test. J. 2003, 26, 167–178. [Google Scholar] [CrossRef]
  25. Boucher, M.; Girard, J.-F.; Legchenko, A.; Baltassat, J.-M.; Dörfliger, N.; Chalikakis, K. Using 2D inversion of magnetic resonance soundings to locate a water-filled karst conduit. J. Hydrol. 2006, 330, 413–421. [Google Scholar] [CrossRef]
  26. Zhu, J.; Currens, J.; Dinger, J. Challenges of using electrical resistivity method to locate karst conduits—A field case in the Inner Bluegrass Region, Kentucky. J. Appl. Geophys. 2011, 75, 523–530. [Google Scholar] [CrossRef]
  27. Putiška, R.; Nikolaj, M.; Dostál, I.; Kušnirák, D. Determination of cavities using electrical resistivity tomography. Contrib. Geophys. Geod. 2012, 42, 201–211. [Google Scholar] [CrossRef]
  28. Martorana, M.; Capizzi, P. Evaluation of Artifacts and Misinterpretation in 2D Electrical Resistivity Tomography Caused by Three-Dimensional Resistive Structures of Regular or Irregular Shapes. Appl. Sci. 2023, 13, 2015. [Google Scholar] [CrossRef]
  29. Guinea, A.; Playà, E.; Rivero, L.; Martinez, N.; Cutipa, V. Geoelectrical methods for evaluating the characteristics of different gypsum varieties in gypsum quarries. Eng. Geol. 2025, 353, 108112. [Google Scholar] [CrossRef]
  30. Festa, V.; Fiore, A.; Parise, M.; Siniscalchi, A. Sinkhole evolution in the Apulian karst of southern Italy: A case study, with some considerations on sinkhole hazards. J. Cave Karst Stud. 2012, 74, 137–147. [Google Scholar] [CrossRef]
  31. De’ Dominicis, A.; Mazzoldi, G. Interpretazione geologico-strutturale del margine orientale della Piattaforma Apula. Mem. Soc. Geol. Ital. 1987, 38, 163–176. [Google Scholar]
  32. de Alteriis, G.; Aiello, G. Stratigraphy and tectonics offshore of Puglia (Italy, southern Adriatic Sea). Mar. Geol. 1993, 113, 239–253. [Google Scholar] [CrossRef]
  33. Bosellini, A.; Morsilli, M.; Neri, C. Long-term event stratigraphy of the Apulia platform margin (Upper Jurassic to Eocene, Gargano, Southern Italy). J. Sediment. Res. 1999, 69, 1241–1252. [Google Scholar] [CrossRef]
  34. Johnson, K.S. Development of the Wink Sink in west Texas due to salt dissolution and collapse. In Proceedings of the 2nd Multidisciplinary Conference on Sinkholes and the Environmental Impact of Karst, Orlando, FL, USA, 9–11 February 1987; pp. 127–136. [Google Scholar]
  35. Tharp, T.M. Mechanics of upward propagation of cover-collapse sinkholes. Eng. Geol. 1999, 52, 23–33. [Google Scholar] [CrossRef]
  36. Osborne, R.A.L. Cave breakdown by vadose weathering. Int. J. Speleol. 2002, 31, 37–53. [Google Scholar] [CrossRef]
  37. Doglioni, C.; Mongelli, F.; Pieri, P. The Puglia uplift (SE Italy): An anomaly in the foreland of the Apenninic subduction due to buckling of a thick continental lithosphere. Tectonics 1994, 13, 1309–1321. [Google Scholar] [CrossRef]
  38. D'Alessandro, A.; Massari, F.; Davaud, E.; Ghibaudo, G. Pliocene–Pleistocene sequences bounded by subaerial unconformities within foramol ramp calcarenites and mixed deposits (Salento, SE Italy). Sediment. Geol. 2004, 166, 89–144. [Google Scholar] [CrossRef]
  39. Cigna, A.A.; Forti, P. The speleogenetic role of the air flow caused by convection. Int. J. Speleol. 1986, 15, 41–52. [Google Scholar] [CrossRef]
  40. White, W.B. Surface and near-surface karst landforms. In: Higgins, C.G., Coates, D.R. (Eds.), Groundwater geomorphology: The role of subsurface water in earth-surface processes and landforms. Geol. Soc. Am. Spec. Paper 1990, 252, 157–175. [Google Scholar]
  41. Bruno, E.; Calcaterra, D.; Parise, M. Development and morphometry of sinkholes in coastal plains of Apulia, southern Italy. Preliminary sinkhole susceptibility assessment. Eng. Geol. 2008, 99, 198–209. [Google Scholar] [CrossRef]
  42. Mammadova, L. Numerical modeling of groundwater flow with a focus on the salento aquifer. Ph.D. Thesis, Università del Salento, Lecce, Italy, 2025. [Google Scholar]
  43. Loke, M.H.; Acworth, R.; Dahlin, T. A comparison of smooth and blocky inversion methods in 2D electrical imaging surveys. Explor. Geophys. 2003, 34, 182–187. [Google Scholar] [CrossRef]
  44. Doyoro, Y.G.; Chang, P.-Y.; Puntu, J.M. Uncertainty of the 2D Resistivity Survey on the Subsurface Cavities. Appl. Sci. 2021, 11, 3143. [Google Scholar] [CrossRef]
  45. Davis, J.; Annan, A. Ground penetrating radar for high-resolution mapping of soil and rock stratigraphy. Geophys. Prospect. 1989, 37, 531–551. [Google Scholar] [CrossRef]
  46. Neal, A. Ground-penetrating radar and its use in sedimentology: Principles, problems and progress. Earth-Sci. Rev. 2004, 66, 261–330. [Google Scholar] [CrossRef]
  47. Ercoli, M.; Cirillo, D.; Pauselli, C.; Jol, H.M.; Brozzetti, F. Ground-penetrating radar signature of Quaternary faulting: A study from the Mt. Pollino region, southern Apennines, Italy. Solid. Earth 2021, 12, 2573–2596. [Google Scholar] [CrossRef]
  48. Venkateswarlu, B.; Tewari, V.C. Geotechnical applications of ground penetrating radar (GPR). J. Ind. Geol. Cong. 2014, 6, 35–46. [Google Scholar]
  49. Neal, A.; Roberts, C.L. Applications of ground-penetrating radar (GPR) to sedimentological, geomorphological and geoarchaeological studies in coastal environments. In Coastal and Estuarine Environments: Sedimentology, Geomorphology and Geoarchaeology; Geological Society of London: London, UK, 2000. [Google Scholar]
  50. Barbolla, D.F.; Ferrari, I.; Giuri, F.; Miccoli, I.; Scardozzi, G.; Ferrari, V.; Leucci, G. Multichannel GPR and multi-depth electromagnetic surveys for the study of Villa Eucheria and Aquinum at Castrocielo (Frosinone, Central Italy). J. Appl. Geophys. 2024, 228, 105466. [Google Scholar] [CrossRef]
  51. Barbolla, D.F.; Miccoli, I.; Ditaranto, I.; Scardozzi, G.; Giuri, F.; Ferrari, I.; Leucci, G. Geophysical Surveys to Highlight Buried Ancient Walls of Ugento (Lecce, Italy). NDT 2024, 2, 204–213. [Google Scholar] [CrossRef]
  52. Jol, H.M.; Smith, D.G. Ground penetrating radar of northern lacustrine deltas. Can. J. Earth Sci. 1991, 28, 1939–1947. [Google Scholar] [CrossRef]
  53. Bano, M.; Marquis, G.; Nivière, B.; Maurin, J.; Cushing, M. Investigating alluvial and tectonic features with ground-penetrating radar and analyzing diffractions patterns. J. Appl. Geophys. 2000, 43, 33–41. [Google Scholar] [CrossRef]
  54. Cassidy, N.J. Electrical and magnetic properties of rocks, soils and fluids. In Ground Penetrating Radar: Theory and Applications; Jol, H.M., Ed.; Elsevier: Amsterdam, The Netherlands, 2009; pp. 41–72. [Google Scholar]
  55. Theimer, B.D.; Nobes, D.C.; Warner, B.G. A study of the geoelectrical properties of peatlands and their influence on ground-penetrating radar surveying. Geophys. Prospect. 1994, 42, 179–209. [Google Scholar] [CrossRef]
  56. Sandmeier, K.J. ReflexW Version 8.1. Program for Processing of Seismic, Acoustic or Electromagnetic Reflection, Refraction and Transmission Data; Software Manual: Karlsruhe, Germany, 2016; p. 628. [Google Scholar]
  57. Loke, M.H. RES2DINV Version 3.45. Rapid 2-D Resistivity & IP Inversion Using the Least-Squares Method; Geotomo Software: Gelugor, Malaysia, 2000. [Google Scholar]
  58. Loke, M.H. RES2DMOD Version 3.03. Rapid 2D Resistivity Forward Modeling Using the Finite-Difference and Finite-Element Methods; Geotomo Software: Gelugor, Malaysia, 2016. [Google Scholar]
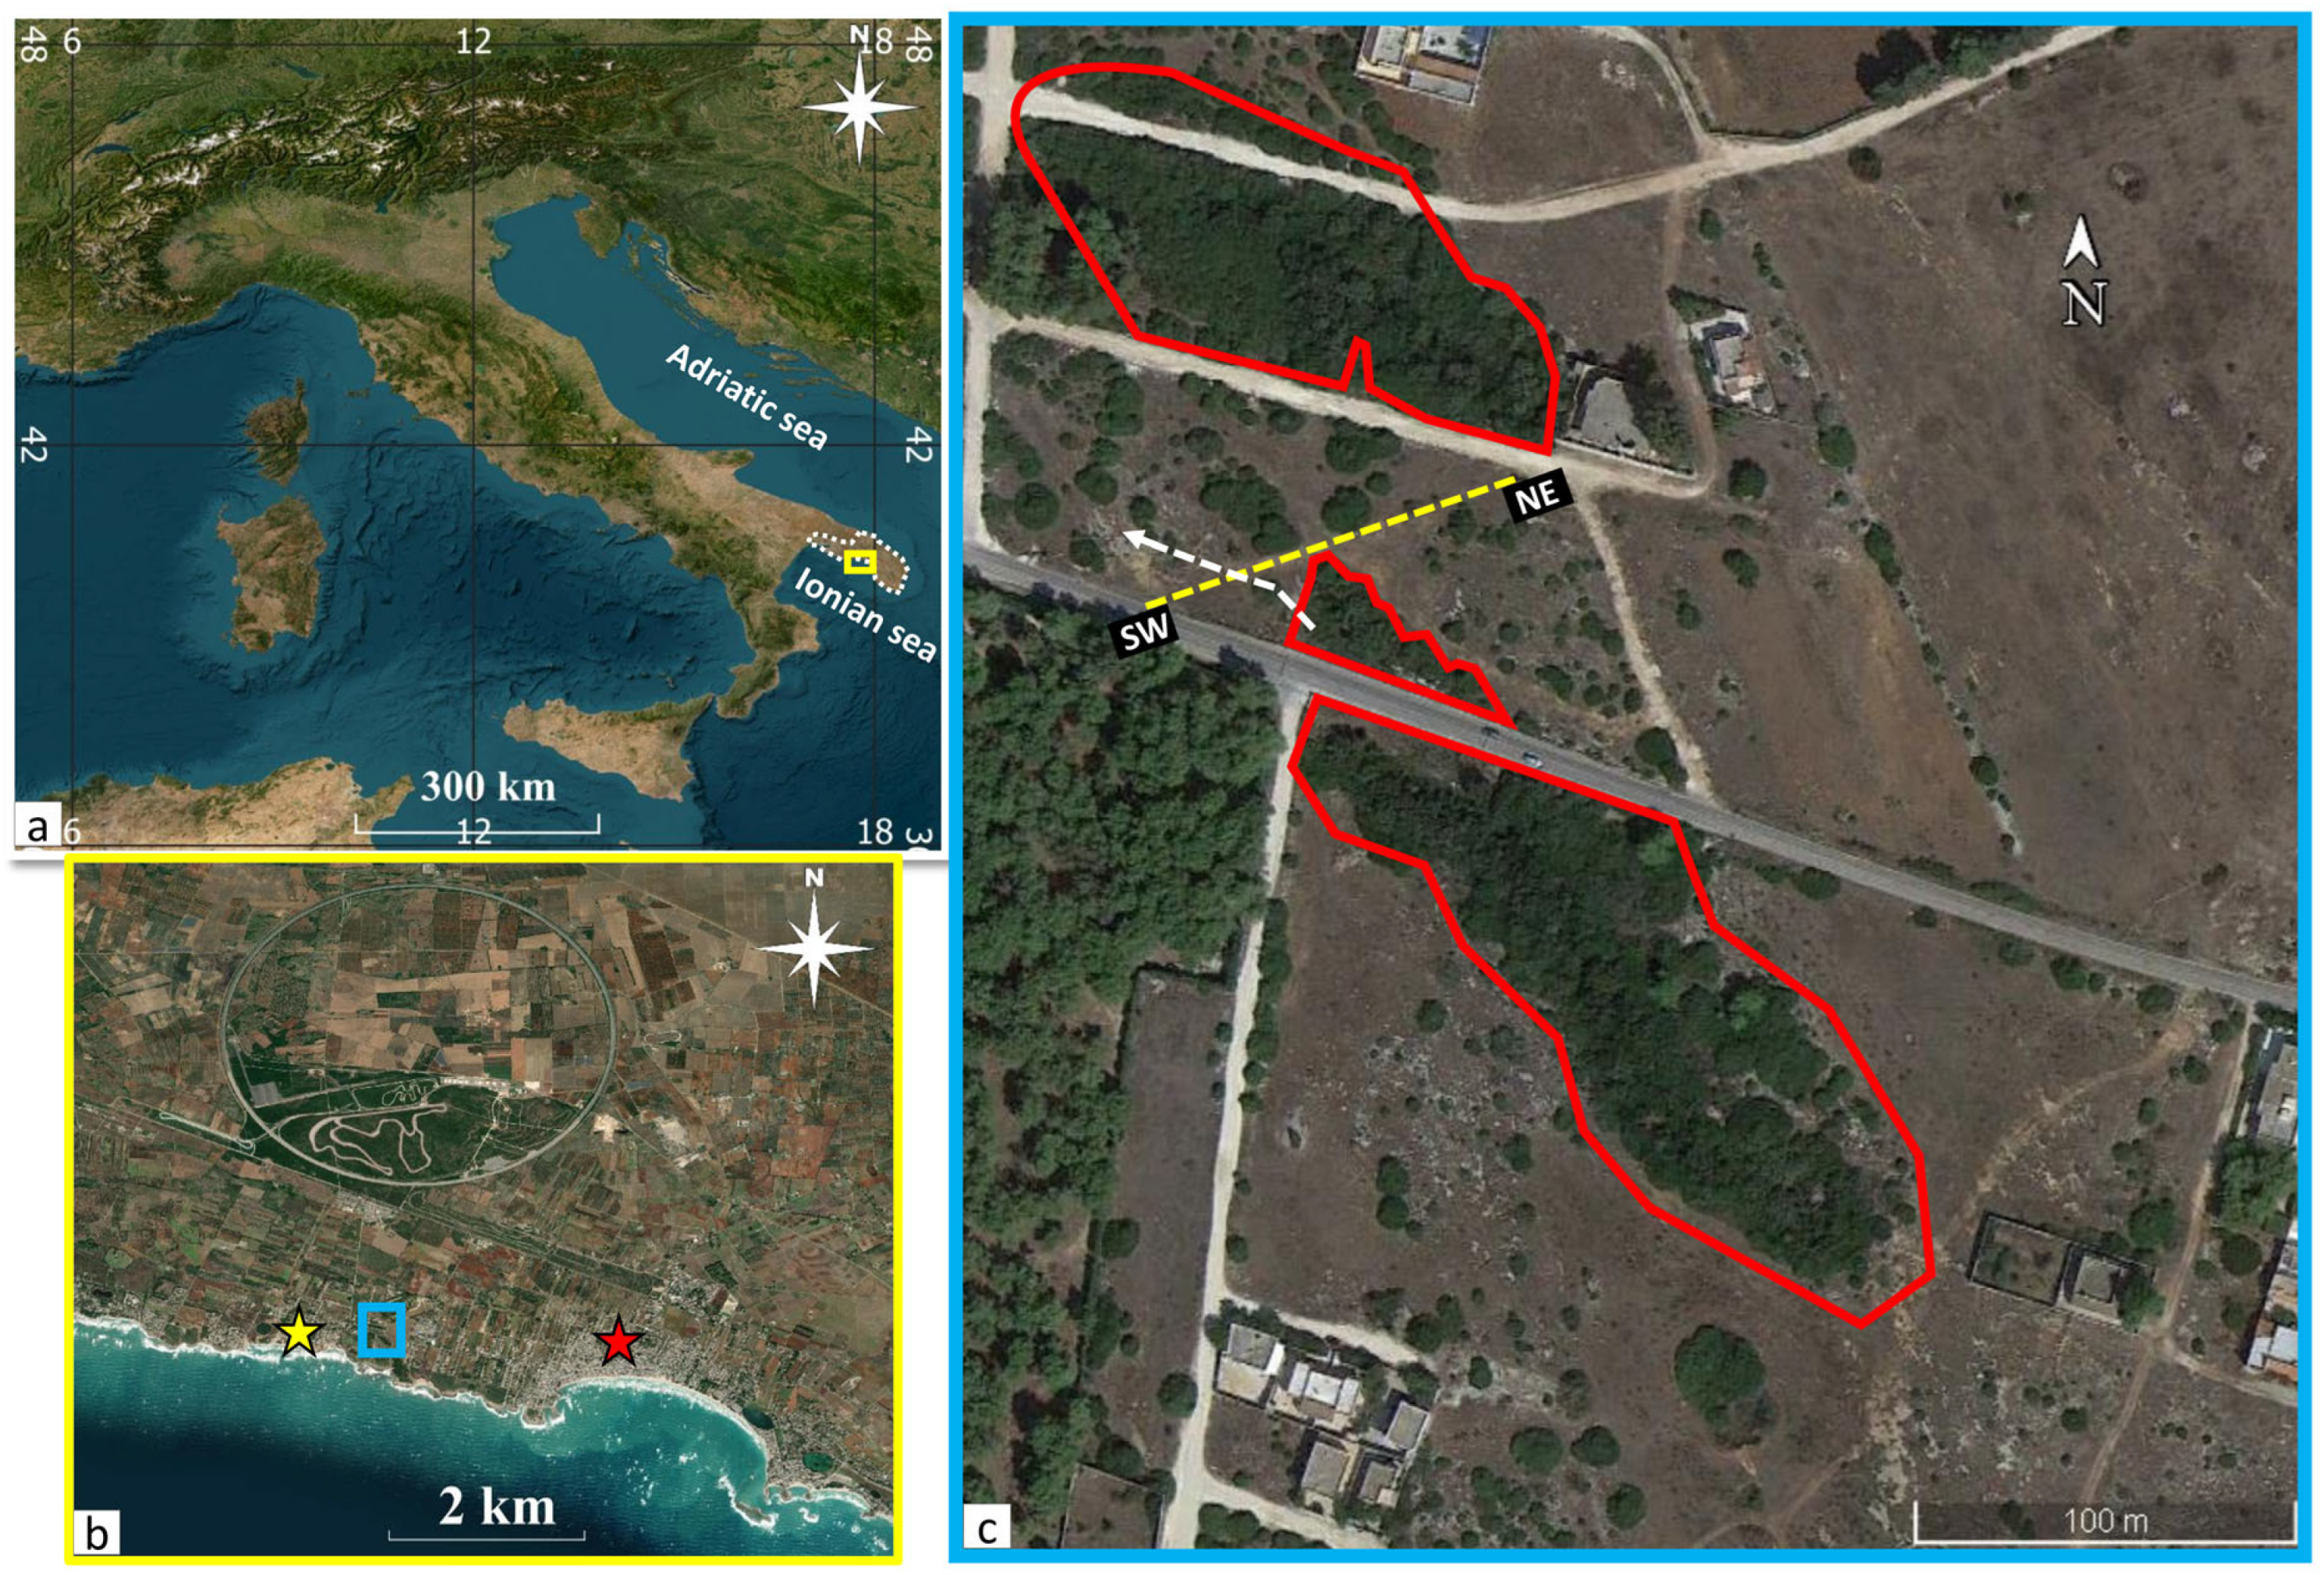
Figure 1. Torre Castiglione (yellow rectangle) is in the Salento area highlighted by white dashed line (South Apulian region) (a); the investigated area is located to the south of the high-speed test track in Nardò: the same lithological unit can be seen along the coast from Torre Castiglione (yellow star) to Torre Lapillo (red star), where the sinkholes were studied (blue rectangle) (b); this area is characterized by the presence of several sinkholes (red lines) (c). The profile of the ERT and GPR surveys is marked with the dashed yellow line. The direction of the karst conduit that is accessible from the sinkhole is marked with the dashed white arrow.
Geosciences 15 00349 g001
Figure 2. Geological map of the investigated area [42].
Geosciences 15 00349 g002
Figure 3. Images taken during the GPR (a) and ERT (b) surveys.
Geosciences 15 00349 g003
Figure 4. Radar section and ERT model. (a) The interpreted radargram shows several voids (yellow curves) and large, shallow fractured zones (white dashed rectangles). The red dashed lines indicates the anomalies due to cavities. The blue dashed line indicates the depth of the water table from direct measurement. (b) The ERT model shows a high-resistivity shallow layer and the presence of two conductive anomalies, A and B. The RMS error is 6.5% obtained at the 4th iteration.
Geosciences 15 00349 g004
Figure 5. Inverse model resistivity sections from synthetic data set for a water-filled cavity (a) and an empty cavity (b). On the left is the geometry of the synthetic resistivity models. For better illustration, only a 40 m horizontal section of the models is presented.
Geosciences 15 00349 g005
Figure 6. Inverse model resistivity sections from synthetic data set for a water-filled cavity under a resistive shallow layer with different electrical resistivities (ρs): (a) the geometry of the synthetic resistivity model: the dashed line marked with a triangle represents the water table; (b) ρs = 1500 Ωm; (c) ρs = 4000 Ωm; (d) ρs = 1,000,000 Ωm. The black shape indicates the actual conduit boundary.
Geosciences 15 00349 g006
Figure 7. Inverse model resistivity sections of synthetic models. A water-filled cavity is under a void (black solid line) 20 cm thick and 90 cm deep (top) with widths ( L v ) that are (a) smaller than that of the cavity ( L c ); (b) equal to that of the cavity; and (c) greater than that of the cavity. On the left is the geometry of the synthetic resistivity models. For better illustration, only a 40 m horizontal section of the models is presented. The dashed line marked with a triangle represents the water table.
Geosciences 15 00349 g007
Figure 8. Inverse model resistivity sections of synthetic models. A water-filled cavity is under a void (black solid line) 20 cm thick and 2 m deep (top) with widths ( L v ) (a) smaller than that of the cavity ( L c ); (b) equal to that of the cavity; and (c) greater than that of the cavity. On the left is the geometry of the synthetic resistivity models. For better illustration, only a 40 m horizontal section of the models is presented. The dashed line marked with a triangle represents the water table.
Geosciences 15 00349 g008
Figure 9. Inverse model resistivity sections of synthetic models. A water-filled cavity is under a void (black solid line) 20 cm thick and 2.80 m deep (top) with widths ( L v ) (a) smaller than that of the cavity ( L c ); (b) equal to that of the cavity; and (c) greater than that of the cavity. On the left is the geometry of the synthetic resistivity models. For better illustration, only a 40 m horizontal section of the models is presented. The dashed line marked with a triangle represents the water table.
Geosciences 15 00349 g009
Figure 10. Sinkhole features in the investigated area. Systems of horizontal (red dashed lines), subhorizontal (red dashed lines) and subvertical (yellow dashed lines) fissures are evident on the sinkhole’s vault (a). The rocks in the surrounding area are heavily fractured (b).
Geosciences 15 00349 g010
Table 1. Inversion parameters details.
Inversion Parameters
Initial damping factor0.15
Minimum damping factor0.03
Value to increase damping factor1.05
Ratio of the vertical/horizontal filter weight0.5
Number of nodes4
Type of forward modeling methodFinite-Difference
Model refinementModel cells with normal widths
Ratio of thickness of first layer/unit electrode spacing0.34
Factor to increase layer thickness with depth1.1
Factor to increase model depth range1.1
Disclaimer/Publisher’s Note: The statements, opinions and data contained in all publications are solely those of the individual author(s) and contributor(s) and not of MDPI and/or the editor(s). MDPI and/or the editor(s) disclaim responsibility for any injury to people or property resulting from any ideas, methods, instructions or products referred to in the content.