Abstract
This study experimentally investigated the influence of vegetation integrity, vertical architecture and morphology, flexibility, and patch length on tsunami bore attenuation and structural force reduction, using Pandanus odoratissimus (screwpine) as a model species. A key aspect of the experimental design was the simulation of vegetation breakage, defined as occurring when the tsunami water depth exceeded 80% of tree height, a critical threshold for structural failure. Results showed that vegetation under non-breaking conditions significantly attenuated water levels and hydrodynamic forces, with maximum tsunami force reductions of up to 70% for rigid and 66.5% for flexible vegetation, particularly when the patch extended further inland (i.e., longer vegetation length). In contrast, vegetation breakage led to a notable decline in protective performance, with horizontal and uplift force reductions dropping between 10.1–45.2% and 10.7–16.7%, respectively, in short patches. Flexible vegetation exhibited the greatest loss of effectiveness due to structural collapse. However, longer vegetation patches played a compensatory role, maintaining higher force reduction even under breaking conditions. Notably, broken P. odoratissimus still contributes to energy dissipation through its intact dense aerial roots that resist flow near the bed. These findings highlight the importance of maintaining vegetation integrity for effective tsunami mitigation, while also recognizing that partially damaged vegetation retains some protective function, particularly when configured in extended patches.
1. Introduction
Tsunamis are among the most catastrophic natural hazards affecting coastal regions, often resulting in severe human and ecological losses. As an integral component of the disaster life cycle in coastal zones, tsunamis necessitate comprehensive mitigation strategies that are not only effective but also sustainable and economically viable. Over the past few decades, coastal vegetation has gained prominence as a valuable green infrastructure solution, offering natural protection against various hydrodynamic forces, including tsunamis. Coastal forests, in particular, function as semi-permeable barriers that absorb, reflect, and reduce the energy of incoming waves through the interaction of water with dense root systems, trunks, and foliage [1,2,3].
Extensive studies have demonstrated that the presence of coastal vegetation significantly attenuates tsunami wave energy, thereby reducing wave height, velocity, and the resulting hydrodynamic forces exerted on inland areas (e.g., [4,5,6,7]). These findings have led to the widespread recognition of coastal forests as cost-effective and environmentally friendly alternatives to traditional engineered defenses. The performance of these vegetative buffers, however, is highly contingent upon multiple factors, including species characteristics (e.g., tree height, trunk diameter, aerial structure), spatial configuration (e.g., forest width and density), and the nature of the tsunami event itself.
Despite their potential, the protective function of coastal forests is not absolute, especially under high-magnitude tsunami conditions. For example, in Aceh, Indonesia—one of the regions hardest hit by the 2004 Indian Ocean tsunami—extensive mangrove forests failed to provide adequate protection [8]. Despite spanning over 53,000 hectares, large portions of these vegetated areas, including aquaculture ponds embedded within them, suffered severe damage. Notably, a 600-m-wide forest belt in Aceh Besar was completely destroyed, illustrating that forest width alone cannot ensure effective mitigation when confronted with near-field, high-energy tsunami waves [9,10]. Likewise, the Great East Japan Earthquake of 2011 led to the failure of extensive sea walls and coastal forests. On the Sendai Plain, the tsunami penetrated 0.4 to 1.6 km inland, where pine tree belts were fully destroyed, and caused partial destruction up to 5.2 km inland [11,12]. Despite being damaged or broken, coastal trees were still found to contribute to drag forces and flow resistance. Field observations and modeling studies indicate that residual vegetation elements—such as stumps, aerial roots, or partially intact canopy structures—can still obstruct flow, trap debris, and dissipate energy [6,13,14]. This suggests that even in the event of failure, vegetation may retain partial mitigation functions, although the extent of this effect remains poorly quantified.
To enhance the design of tsunami-resilient coastal zones, it is critical to quantitatively evaluate the behavior and failure mechanisms of coastal vegetation under extreme hydrodynamic loading. Tree damage mechanisms—such as trunk breakage, root-soil failure, and erosion-induced displacement—are governed by complex interactions between tsunami parameters and vegetation morphology. For instance, tree breakage is influenced by bending moments associated with water depth and velocity, while tree overturning often depends on root anchorage strength and soil cohesion [15,16,17].
Pandanus odoratissimus, commonly known as skewpine, is a tropical sand dune species noted for its distinctive structural features, including a dense canopy and prominent aerial roots [18]. Field observations indicate that this species is effective in reducing tsunami force when wave depths remain below critical thresholds, typically less than 80% of the tree height. However, when subjected to higher wave loads, P. odoratissimus trees tend to fail at the upper limit of their aerial roots. The breaking threshold also appears to increase with forest width, attributed to the reduction in wave velocity within wider vegetative zones [6].
Numerous prior studies have examined the role of vegetation in tsunami mitigation using numerical simulation approaches. Nandasena et al. [19] conducted numerical simulations to evaluate the performance of P. odoratissimus under varying tsunami conditions but did not incorporate tree failure mechanisms. As such, their models may have overestimated the protective effects of intact vegetation. Koshimura et al. [20] introduced a fragility function for Rhizophora species based on field data, correlating tree damage probability with maximum bending moments. Later studies by [6,19] used nonlinear wave models to simulate vegetation breaking, showing that failure significantly alters wave transmission and force reduction. It is highlighted that return flows, rather than the initial wavefront, were often responsible for extensive tree damage, indicating the importance of evaluating bidirectional loading effects [21].
While prior studies have explored vegetation-induced drag and wave attenuation, limited work has incorporated the impact of tree failure on downstream hydrodynamic forces and consequent damage to built infrastructure. Notably absent are experimental investigations that evaluate how vegetation breakage affects the protective function of coastal forests for structures situated behind them. This study addresses that research gap by examining, through laboratory experimentation, the effects of forest destruction—specifically tree breakage—on tsunami-induced forces acting on coastal buildings. To the best of the authors’ knowledge, this represents the first experimental effort aimed at quantifying how vegetation breakage influences the tsunami-induced forces (structural loads) acting on coastal buildings and infrastructure.
Although this study does not analyze the complex dynamics of broken tree fragments in detail, field observations following the 2004 tsunami in Sri Lanka and Thailand, as well as the 2011 Great East Japan Earthquake tsunami, suggest that dislodged tree parts often become entangled within root systems or adjacent vegetation [22,23,24,25]. Such entrapment can contribute to increased flow resistance, further emphasizing the multifaceted role of vegetation in tsunami mitigation. This initial investigation lays the groundwork for more comprehensive analyses of broken-tree interactions in future research.
2. Materials and Methods
2.1. Experimental Setting
The experimental study was performed in a transparent flume at Saitama University, Japan, with internal dimensions of 18 m in length, 0.4 m in width, and 0.6 m in depth, as depicted in Figure 1. To simulate tsunami-like flows, bore waves were produced by rapidly releasing water from an upstream reservoir via a vertically lifting gate. This setup, adapted from [26], generated dam-break waves exhibiting turbulent leading fronts, similar to the broken wave stage of tsunamis [27]. A physical model scale of 1:30 was used, based on Froude scaling, to ensure dynamic consistency with real-world tsunami behavior.
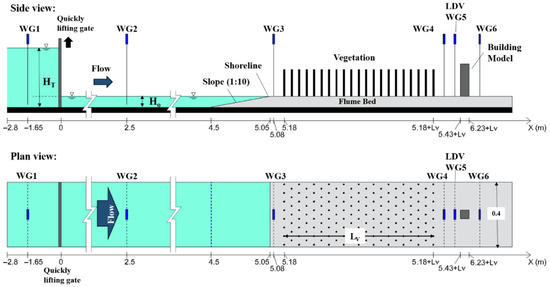
Figure 1.
Schematic layout of the experimental flume, showing wave gauge positions (WG1–WG6) and the location of velocity measurements (LDV). Here, HT denotes the upstream reservoir depth, Ho is the initial downstream water depth, and Lv represents the vegetation length. (All dimensions are in meters; illustrations not to scale.).
The flume consisted of a 4.5 m flat section, transitioning to a 1:10 sloping beach starting 5.05 m from the gate to represent a natural coastal profile [28]. Tests were conducted under wet-bed conditions, with an initial downstream water depth (Ho) fixed at 5.5 cm. The upstream reservoir depth (HT) was varied between 0.3 m and 0.5 m to maintain HT/Ho ratios exceeding 2, which is critical for forming fully developed bores and achieving the desired flow impact on vegetation structures.
Wave surface profiles were captured using six ultrasonic wave gauges (Tokyo Keisoku Co., Ltd., Tokyo, Japan). Flow velocity at specific locations near the structure (WG5) and shoreline (WG3) was measured using a Laser Doppler Velocimeter (LDV; Model S800-00, Kanomax Japan Co., Ltd., Suita, Japan). A tri-axial load cell (Model ATO-LC-MA02, ATO Load Cell, San Francisco, CA, USA; maximum capacity 200 N; accuracy ± 0.1% FS) recorded the forces acting on the building model. Data acquisition was performed at a sampling rate of 100 Hz through three synchronized HEX direct transmitters. The load cell’s calibration was verified using precision weights prior to each test run.
2.2. Vegetation Model Schemes
The study modeled the coastal tree Pandanus odoratissimus (Figure 2a), a species typically reaching 10 m in height with trunk diameters between 0.05 m and 0.2 m [29]. Its distinctive aerial roots—around 30 per tree—measure 5–10 cm in diameter [30]. Vegetation parameters, such as trunk diameter (d), height (h), and spacing (s), were based on post-tsunami field data [30] and tsunami mitigation guidelines [29], as listed in Table 1.
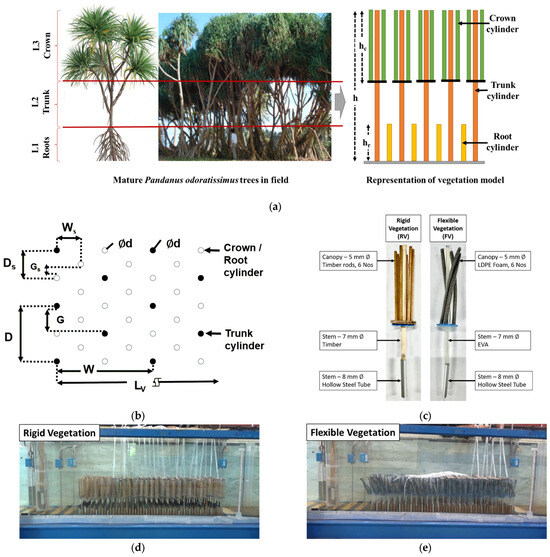
Figure 2.
Vegetation configurations: (a) Conceptual model of the three-layered vegetation structure representing Pandanus odoratissimus, including trunk, aerial roots, and crown components. (b) Plan view of vegetation arrangement. (c) Fabrication of rigid and flexible vegetation models. (d) Photographs of the flume setup with rigid and (e) flexible vegetation configurations.

Table 1.
Experimental vegetation specifications of Pandanus odoratissimus.
The spatial arrangement followed a staggered grid with lateral spacing (D = s) and longitudinal spacing (W = √3D) (Figure 2b). The gap-to-diameter ratio (G/d) was set at 3.4, yielding a vegetation density of 30 trees per 100 m2.
To examine the effect of vegetation thickness, two forest lengths (Lv) were selected using the summed tree diameter method (dn, No.cm) [4]. Vegetation thicknesses of 120 and 240 No.cm, within the recommended range of 100–300 No.cm, were used to represent conditions capable of reducing tsunami velocity and trapping debris at 3–5 m flow depths.
Both rigid (RV) and flexible (FV) artificial vegetation fields were developed to study the role of mechanical flexibility in wave–vegetation interaction. To simulate Pandanus odoratissimus, Young’s modulus (E) was taken as 2.0 GPa, within the species’ typical range of 0.5–10 GPa [31,32]. Because direct scaling of E does not accurately reflect deformation behavior, flexural rigidity (EI)—which depends on both E and the moment of inertia (I = πd4/64)—was scaled according to flexural rigidity, following an [SF]5 relation [33,34].
To maintain flow similarity and correct hydrodynamic loading, both rigid and flexible models had identical dimensions: 7 mm diameter and 0.25 m height, following Froude similarity law. Flexibility was defined by the response to flow: rigid elements remained static, while flexible ones deformed visibly. Rigid models were made from pine wood, while flexible trunks and crowns were fabricated from EVA copolymer and sponge rubber, respectively. Table 2 details the physical and mechanical properties of the vegetation models.
Table 2.
Characteristics of tested vegetation elements.
Unlike simplified vertical-cylinder models, this study included all major structural features of Pandanus odoratissimus—aerial roots, trunk, and crown—by constructing a three-layer tree model (Figure 2a). A single 7 mm cylinder represented the trunk; three 7 mm cylinders modeled the aerial roots; and six 5 mm cylinders simulated the crown. This design, adapted from earlier works [35,36], accounted for vertical variation in drag and the structural complexity of real trees [37] (see Appendix A).
While care was taken to ensure geometric and dynamic similarity, it is important to acknowledge the inherent limitations of scaling mechanical properties, such as flexibility in physical modeling. Accurately replicating the dynamic deformation behavior of real vegetation—especially under complex unsteady flow—is challenging, as full similitude in material response is difficult to achieve. Differences in strain rate sensitivity, damping, and internal structural heterogeneity may influence model behavior at a reduced scale. These limitations are common in laboratory-based vegetation studies and should be considered when extrapolating results to real-world conditions.
Root elements were arranged with wider spacing to reflect natural distribution, while crown elements were concentrated near the trunk to simulate dense foliage. Previous research indicated that tree failure typically occurs just above the root base [38], prompting the root section to be modeled as rigid in all cases.
To replicate natural breakage during tsunami impact, the model trees were modified: a hollow steel tube (8 mm OD) was inserted in the trunk section up to the root height (see Figure 2c). These models were placed atop short wooden cylinders representing the aerial roots, anchored to the flume bed. When the flow exceeded 80% of tree height—the observed failure threshold—trees were manually removed, while the root section remained in place (Figure 5a). Post-tsunami field surveys in Medilla, Sri Lanka, documented that Pandanus odoratissimus trees typically broke just above the aerial root zone, as the roots absorbed a significant portion of the bending moment during wave impact [6]. Importantly, the aerial root structure often remained firmly embedded in the ground even after the trunk failed, continuing to provide resistance to flow and influencing hydrodynamic behavior despite the partial collapse of the tree.
Four vegetation model configurations were tested (Table 3), varying in vegetation length and rigidity. Models were positioned starting 5 cm inland from the shoreline. Arrangement of vegetation inside the flume is depicted in Figure 2d,e. Tsunami-damaged trees often become floating debris that may obstruct flow or cause additional structural damage; however, this secondary effect was excluded from the current analysis.
Table 3.
Vegetation model configurations.
Tree rows were manually removed upon reaching the breaking threshold, with the number of removed rows determined from pretests conducted under non-breaking conditions. For practicality, trees were lifted in batches of three rows per event. Due to the manual nature of tree removal, repeated trials were performed for each case. Tests were accepted once force measurements varied by less than 5% from the average, minimizing human-induced variability and ensuring result consistency.
2.3. Building Model
A simplified building model with a total height of 24 cm was constructed to prevent overtopping during wave impact tests. The structure featured a square footprint of 8 cm × 8 cm and was assembled from 3 mm-thick acrylic panels. It was positioned centrally in the flume to ensure symmetric flow conditions. To reduce sidewall interference, the blockage ratio (building width to flume width) was limited to 0.2 (Figure 3). Despite variations in vegetation field length, a uniform 25 cm gap was maintained between the vegetation edge and the building to ensure consistency across all experiments.
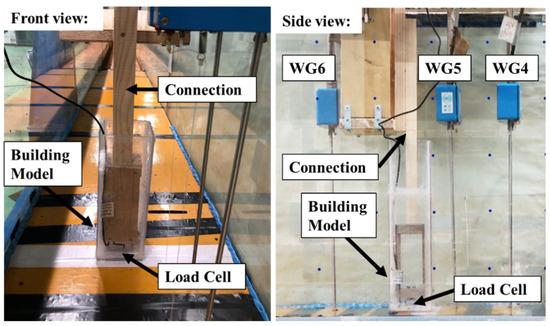
Figure 3.
Installation of the load cell on the structural model for real-time measurement of tsunami-induced forces. WG4–WG6 indicate the positions of wave gauges installed near the structure.
Hydrodynamic forces were recorded using a three-axis load cell installed at the building’s base and enclosed within the structure (Figure 3). A 1 mm clearance was provided between the base and the flume bed to eliminate friction while allowing unrestricted movement. The force-mounting setup aligned with the structure’s centerline to accurately transmit loads and reduce unwanted bending moments, following the approach outlined by [39].
2.4. Operational Conditions
The experimental cases outlined in Table 4 were systematically categorized into four groups to isolate and analyze the effects of vegetation and structural elements on tsunami-induced bore flow. Case NN represents the baseline condition with no vegetation or building, allowing for the assessment of undisturbed bore flow characteristics. Case BM includes the building model without any vegetation, serving to evaluate the hydrodynamic forces acting solely on the structure. Cases labeled RVXNB and FVXNB incorporate rigid (RV) and flexible (FV) vegetation, respectively, without accounting for tree-breaking effects, and are combined with the building model to examine vegetation–structure interactions under intact vegetation conditions. Finally, cases RVXB and FVXB use the same vegetation types but include the influence of tree-breaking mechanisms. In these notations, the variable X indicates the vegetation length (either 1 or 2), as defined in Table 3.
Table 4.
Test Case Matrix.
Tsunami-like bore waves were produced by rapidly opening a gate to release impounded water with upstream depths (HT) ranging from 0.3 to 0.5 m. The initial wave conditions, shoreline wave height, velocity, and Froude number were optimized through trial-and-error to replicate realistic tsunami flows. Measurements at the shoreline location (WG3, Figure 1) confirmed that bore height and velocity increased with HT, eventually stabilizing near the maximum reservoir depth. Higher HT values were selected to ensure sufficiently high water levels capable of triggering tree breakage. Bore variation at the shore for the selected tsunami conditions is illustrated in Figure 4.
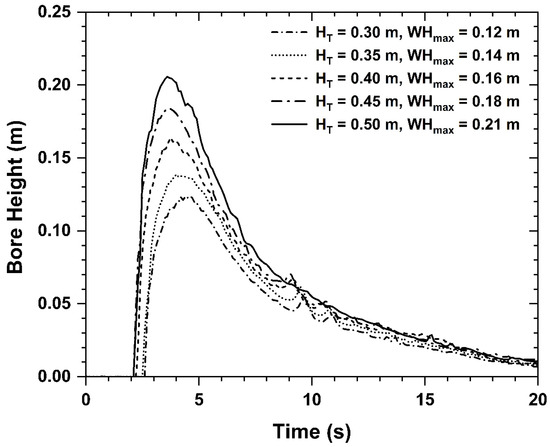
Figure 4.
Time series of shoreline bore elevations recorded at WG3 for Case NN, corresponding to varying impounded water depths (HT = 0.30 to 0.50 m). HT denotes the upstream reservoir depth, and WHMax represents the measured maximum bore height at the shoreline.
Table 5 presents the measured bore heights and corresponding Froude numbers (Fr = u0/√gh0), which ranged from 2.0 to 2.2. These values align with field-scale tsunami simulations (Fr = 1.34–2.6) under prototype conditions with water depths between 3.6 m and 6.3 m. The experimental wave parameters are consistent with field observations from major events like the 2004 Indian Ocean Tsunami (IOT) and 2011 Great East Japan Earthquake and Tsunami (JGET), which reported wave heights of 2.6–9 m and flow velocities of 2–5 m/s [40,41]. This alignment validates the experimental setup’s suitability for studying tsunami-induced forces on coastal structures.
Table 5.
Maximum wave heights and Froude numbers on the shore for the selected tsunami intensities.
2.5. Tree Breaking Conditions
Figure 5a presents the conceptual diagram illustrating the tree-breaking phenomenon. Trees were manually removed once the predefined breaking threshold was reached (see Figure 5b), with the number of rows determined based on preliminary non-breaking tests. For operational efficiency, trees were lifted in groups of three rows at a time. As the removal process was manual, multiple trials were conducted for each test case to ensure consistency.
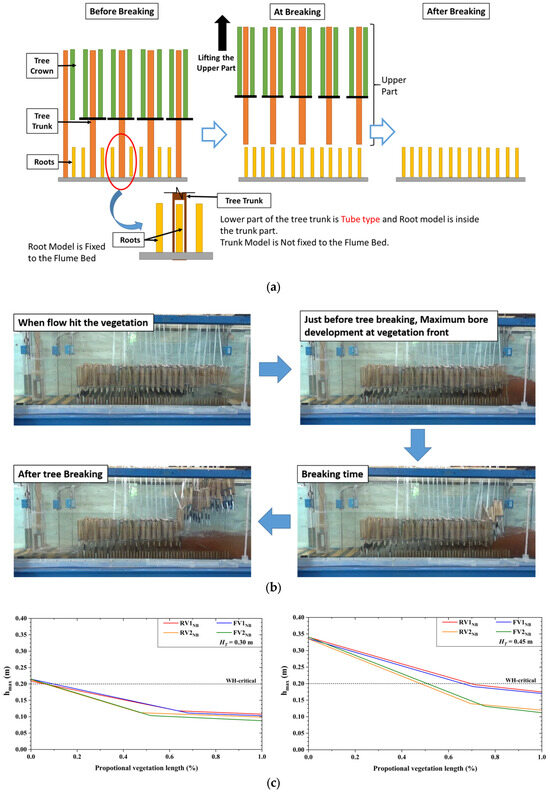
Figure 5.
Tree-breaking condition: (a) Conceptual illustration of the tree-breaking mechanism. (b) Experimental snapshots capturing the onset of tree breakage. (c) Maximum incident bore heights within the vegetation zone for impounded water depths HT = 0.30 m and 0.45 m. The dashed line indicates the critical water depth for breakage (WH-critical), as determined from previous studies. RV1NB represents non-breaking rigid vegetation with Lv = 0.56 m, RV2NB for non-breaking rigid vegetation with Lv = 1.11 m, FV1NB denotes non-breaking flexible vegetation with Lv = 0.56 m, and FV2NB corresponds to non-breaking flexible vegetation with Lv = 1.11 m. Lv is the vegetation length.
However, this manual tree-breaking approach introduces certain limitations. Under natural conditions, tree breakage occurs progressively, row by row, as the water level reaches the critical breaking threshold. Due to experimental constraints and limited facilities, trees were removed in groups of three rows simultaneously rather than individually. This simplification may alter the precise sequence of failure; however, it is unlikely to significantly affect the results, as the time required for bore propagation across a single row is extremely short at the experimental scale compared to actual tsunami durations.
Moreover, manual removal may not perfectly coincide with the moment of mechanical failure, potentially introducing minor inaccuracies in capturing the dynamic interaction between flow and vegetation. It may also fail to replicate the gradual or partial breakage seen in real vegetation. Despite these limitations, the method provides a consistent basis for comparison between different vegetation configurations and was carefully implemented to reduce variability across trials.
To determine the tree-breaking length for each vegetation case, water level variations within the vegetation field were analyzed using measurements from non-breaking scenarios (Cases RVXNB and FVXNB). Figure 5c shows representative plots of the bore profiles inside and around the vegetation under different tsunami intensities (HT = 0.30 and 0.45 m), highlighting the maximum incident water depth (hmax) recorded at key locations.
Given the susceptibility of Pandanus odoratissimus to bending or breaking under high flow conditions, the likelihood of failure was assessed using a critical water depth threshold (WH-critical). Based on vegetation characteristics reported by [30] and supported by field observations [38], this threshold was set at 80% of the tree height.
The corresponding tree-breaking lengths were then calculated for each vegetation configuration and flow condition, and the results are summarized in Table 6. Although slight differences in breaking lengths were observed between rigid and flexible vegetation, a single averaged value was used across configurations for consistency in comparison.
Table 6.
Tree-breaking lengths under tsunami conditions.
2.6. Data Assessment
The experimental time scale was established using tide gauge WG1, positioned within the upstream reservoir. The moment the water level at WG1 began to fall was defined as t = 0 s, marking the start of the bore generation. WG2 was used to confirm this timing. All subsequent measurements were synchronized to this reference point.
To assess the effect of vegetation on structural protection, cases with and without vegetation were compared. The relative reductions in inundation height and hydrodynamic force due to vegetation were quantified using the following expressions:
where and are the maximum water levels at the structure for bare and vegetation-protected conditions, respectively, and FBM and FV are the corresponding peak forces. These metrics were used to evaluate the mitigation performance of different vegetation configurations.
3. Results
3.1. Bore Profile and Behavior
3.1.1. Bore Characteristics in the Vegetation Zone
In the experimental model, tree breakage was assumed to occur when the tsunami-induced bending moment exceeded the threshold breaking moment of Pandanus odoratissimus. Based on this criterion, breakage was simulated when the water depth exceeded 80% of the tree height. During each test run-up, the designated rows meeting this condition were manually lifted to replicate structural failure, leaving only the aerial roots intact post-breakage. Figure 6 presents time-series profiles of water depth in front of and behind the vegetation for non-breaking (NB) and breaking (B) scenarios under both rigid (RV) and flexible (FV) vegetation conditions. Tree breakage led to a slight increase in water depth behind the vegetation due to reduced drag resistance, while the water depth in front decreased marginally due to diminished flow reflection. These findings are consistent with observations by [6], who also demonstrated that vegetation failure alters flow dynamics and reduces the efficacy of wave attenuation.
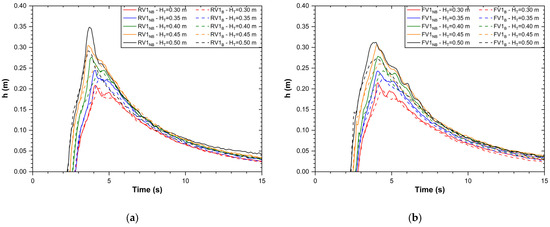
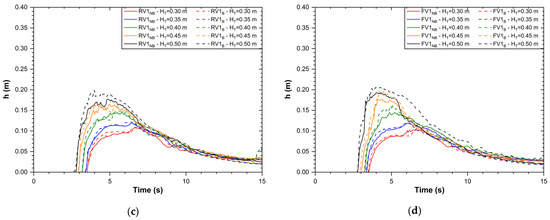
Figure 6.
Time profile of bore height at the vegetation for minimum vegetation length (Lv = 0.56 m) across varying impounded water depths (HT = 0.30–0.50 m): (a) Bore height at the front of rigid vegetation (RV1). (b) Bore height at the front of flexible vegetation (FV1). (c) Bore height at the back of rigid vegetation (RV1). (d) Bore height at the back of flexible vegetation (FV1). Here, RV1NB and FV1NB refer to the non-breaking cases of rigid and flexible vegetation, respectively, for vegetation length Lv = 0.56 m; RV1B and FV1B indicate the corresponding breaking conditions.
As tsunami intensity increased, the deviations in water levels measured before and after the vegetation zone became more pronounced, primarily due to the increased extent of tree breakage under higher flow conditions. The progressive structural failure of vegetation reduced the overall drag and reflection capacity, thereby altering the local hydrodynamics. This effect is reflected in the maximum inundation depths recorded within the vegetation region, as shown in Figure 7.
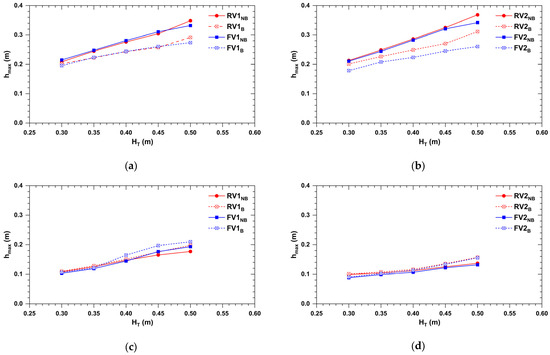
Figure 7.
Maximum bore height recorded at the vegetation zone for rigid and flexible vegetation across varying impounded water depths (HT = 0.30–0.50 m): (a) Vegetation front for the shortest patch (V1, Lv = 0.56 m). (b) Vegetation front for the longest patch (V2, Lv = 1.11 m). (c) Vegetation back for the shortest patch (V1, Lv = 0.56 m). (d) Vegetation back for the longest patch (V2, Lv = 1.11 m). Specifically, RV1NB and FV1NB refer to non-breaking rigid and flexible vegetation for the shortest patch (Lv = 0.56 m), while RV2NB and FV2NB correspond to non-breaking cases for the longest patch (Lv = 1.11 m). Similarly, RV1B and FV1B denote the breaking cases for the shortest patch, and RV2B and FV2B represent breaking cases for the longest patch.
Maximum inundation levels measured upstream of the vegetation remained highest under the non-breaking condition and lowest when tree breakage was incorporated, with the most pronounced reduction observed in the flexible vegetation breaking scenario. This trend highlights the influence of vegetation integrity and material flexibility on upstream water accumulation. At the back of the vegetation, breaking conditions consistently led to higher water levels for both rigid and flexible types, indicating reduced energy dissipation and increased flow transmission. The highest back-end inundation was observed for broken flexible vegetation (FV1B), where both deformation and structural failure allowed greater water passage. In contrast, flexible non-breaking vegetation (FV1NB) yielded the lowest downstream levels, effectively dissipating energy through drag and bending without loss of structural continuity. Rigid vegetation, with limited deformation capacity, was less effective in attenuating flow, resulting in higher downstream inundation even when unbroken. While overall trends indicated vegetation length had a minor influence compared to other factors (e.g., integrity or flexibility), longer patches still provided modestly better attenuation, particularly when vegetation was damaged.
It is noted that the potential secondary effects of broken tree segments, such as their role as debris impacting other trees or altering flow resistance, were not considered in this analysis.
3.1.2. Bore Variation at the Building
Figure 8 illustrates time histories of water depth at the structure for non-breaking (NB) and breaking (B) conditions across rigid (RV) and flexible (FV) vegetation types. The bore elevation at the structure initially increased due to wave reflection, peaked, and then declined. When vegetation breakage occurred, inundation at the structure increased compared to non-breaking cases, primarily due to the reduced drag and energy dissipation capacity of the compromised vegetation. Intact vegetation acts as a barrier, resisting flow and limiting water accumulation, whereas broken components permit greater flow transmission. As tsunami intensity increased from 0.30 m to 0.50 m, the difference in inundation levels between breaking and non-breaking conditions became increasingly pronounced. This was primarily attributed to the progressive damage sustained by the vegetation, with the extent of tree breakage (LB) ranging from 10% to 100%, leading to a substantial reduction in overall flow resistance. The diminished structural integrity of the vegetation under higher flow conditions significantly compromised its ability to attenuate incoming waves, thereby amplifying the inundation contrast between the two scenarios.
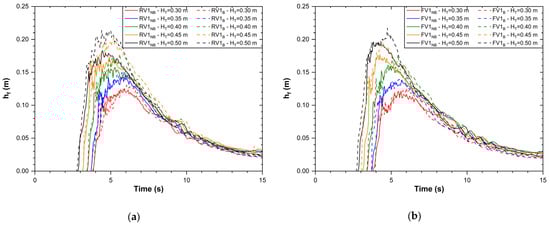
Figure 8.
Temporal evolution of bore height at the structure front for minimum vegetation length (Lv = 0.56 m) across varying impounded water depths (HT = 0.30–0.50 m). (a) Rigid vegetation condition. (b) Flexible vegetation condition. Here, hf represents the measured bore height at the structure for non-breaking (NB) and breaking (B) conditions of different vegetation setups. Specifically, RV1NB and FV1NB refer to the non-breaking cases of rigid and flexible vegetation, respectively, for Lv = 0.56 m, while RV1B and FV1B indicate the corresponding breaking conditions.
Figure 9 further illustrates the maximum water depths and percentage reductions compared to the bare model (BM). Vegetation significantly reduced inundation levels, with reduction rates ranging from ~18% to over 41%, depending on vegetation type, integrity, and patch length. Rigid non-breaking vegetation (VR2NB) achieved the highest reduction (>41%) due to its structural strength. Flexible non-breaking vegetation (VF2NB) also showed substantial attenuation (~35–38%) by deforming and dissipating energy. Vegetation breakage, however, reduced this capacity by ~10–11% in rigid and ~11–13% in flexible models due to the loss of structural resistance and increased flow penetration.
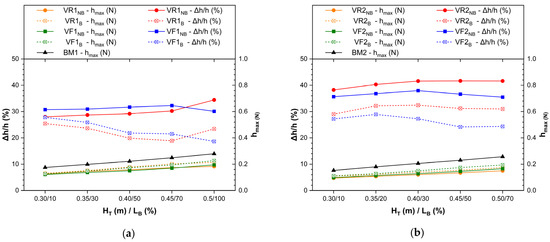
Figure 9.
Maximum water depths and corresponding percentage reductions at the structure for varying impounded water depths (HT = 0.30–0.50 m): (a) Short vegetation length (Lv = 0.56 m). (b) Long vegetation length (Lv = 1.11 m). Here, RV1NB and FV1NB refer to non-breaking rigid and flexible vegetation for the short patch (Lv = 0.56 m), and RV2NB and FV2NB correspond to the non-breaking cases for the long patch (Lv = 1.11 m). Similarly, RV1B and FV1B represent breaking cases for the short patch, and RV2B and FV2B denote breaking cases for the long patch. BM refers to the building model only case, without any vegetation.
For longer vegetation patches, rigid vegetation demonstrated a greater capacity to attenuate bore depth at the structure compared to flexible vegetation. This trend underscores the cumulative effects of increased drag and turbulence generation over extended rigid vegetation belts, which contribute more substantially to energy dissipation. In contrast, for the shortest vegetation length, flexible vegetation yielded more significant bore height reduction at the structure than rigid vegetation, under both breaking and non-breaking conditions. This behavior is primarily attributed to the flexible vegetation’s ability to bend and reconfigure in response to flow, thereby enhancing flow resistance. However, at the highest tested tsunami intensity (HT = 0.5 m), the bore height reduction achieved by the broken rigid vegetation surpassed that of the broken flexible vegetation. This indicates that under extreme conditions, the residual drag and blockage effect of broken rigid elements may offer greater resistance than the more compliant, deformed flexible structures.
Vegetation length demonstrated a significant influence on inundation reduction. Longer vegetation patches (Lv = 1.11 m) consistently outperformed shorter ones (Lv = 0.56 m) across all vegetation types, even under tree-breaking conditions. For instance, the flexible vegetation with breakage (FVB) reduced inundation by approximately 18.6–27.8% in the shorter configuration and 24.2–29.6% in the longer patch, while the rigid vegetation with breakage (RVB) achieved reductions of 18.8–25.4% and 29.0–32.5%, respectively. This improvement is attributed to the decrease in the proportional breaking length (LB) as vegetation length increases, resulting in a longer stretch of intact trees that continue to interact with the flow. The extended intact portion enhances flow–vegetation interaction, promoting greater energy dissipation and reducing both flow velocity and water depth. This effect was more pronounced under non-breaking conditions, whereas the presence of breakage diminished—but did not eliminate—the advantages provided by longer vegetation patches.
3.2. Tsunami-Induced Horizontal Force on the Building
Tsunami-induced forces exerted on the structure were measured using a load cell under both breaking and non-breaking vegetation conditions. Figure 10a,b illustrate the force time history on the structure for impounded water depths of 0.3 m and 0.45 m, respectively, while Figure 10c,d present the temporal force variation under non-breaking and breaking conditions for rigid and flexible vegetation with a shorter vegetation length (Lv = 0.56 m), across a range of inflow depths (HT = 0.30–0.50 m). All force measurements were synchronized to the moment of bore impact on the structure.
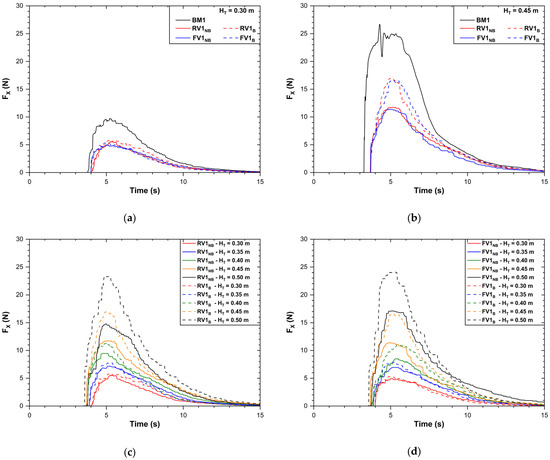
Figure 10.
The history of forces exerted on the structure under varying tsunami intensities and vegetation conditions: (a) Tsunami intensity, HT = 0.30 m. (b) Tsunami intensity, HT = 0.45 m. (c) Rigid vegetation with the shortest length (RV1, Lv = 0.56 m). (d) Flexible vegetation with the shortest length (FV1, Lv = 0.56 m). Here, RV1NB and FV1NB refer to non-breaking rigid and flexible vegetation cases for short vegetation length (Lv = 0.56 m), and RV1B and FV1B represent the corresponding breaking cases. BM denotes the case with only the building model and no vegetation.
In the unprotected case (BM), the force–time history followed four stages: impulsive, transient, quasi-steady, and recession [27]. The initial impulsive peak was caused by bore front turbulence and air entrainment, followed by secondary peaks from flow interactions. The quasi-steady phase reflected peak hydrodynamic loading, while the recession phase showed a gradual force decline. At higher tsunami intensities (HT > 0.30 m), the quasi-steady phase became less distinct due to limited water volume.
When vegetation was introduced, the overall pattern of the force–time history was preserved, but the magnitude of the peaks was significantly reduced. The impulsive and transient forces were notably attenuated due to the flow modulation provided by the vegetated zone. Vegetation obstructed the incoming bore, elevated upstream water levels, and redistributed flow through gaps, thereby dissipating a substantial portion of the wave energy before it reached the structure.
However, when vegetation breakage occurred, the force exerted on the structure increased significantly, particularly at higher tsunami intensities. This is attributed to the loss of drag resistance and energy dissipation capacity, which allowed greater volumes of water to impact the structure more forcefully. The effect of breakage thus became increasingly dominant with rising flow energy.
Figure 11 further illustrates the maximum tsunami force and percentage reductions compared to the bare model (BM). The measured maximum tsunami forces on the structure reveal significant attenuation due to vegetation presence, with performance varying by vegetation type, integrity, and patch length. Compared to the bare model (BM), all vegetated cases show notable force reduction. For short vegetation patches (Lv = 0.56 m), flexible vegetation under non-breaking conditions (FV1NB) consistently resulted in the lowest force values, reflecting its enhanced energy dissipation capacity due to bending and reconfiguration. This trend persisted under breaking conditions, although overall force magnitudes increased. However, at the highest tsunami intensity (HT = 0.5 m), the collapse of structural resistance in the broken flexible vegetation led to force magnitudes comparable to or exceeding those observed for the rigid vegetation, highlighting the critical role of vegetation integrity in maintaining force reduction performance under extreme conditions.
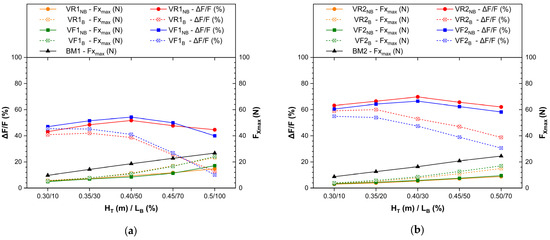
Figure 11.
Maximum horizontal forces and corresponding percentage reductions at the structure across varying impounded water depths (HT = 0.30–0.50 m): (a) Short vegetation length (Lv = 0.56 m) and (b) long vegetation length (Lv = 1.11 m). Here, RV1NB and FV1NB refer to non-breaking cases for short vegetation (Lv = 0.56 m), while RV2NB and FV2NB indicate non-breaking cases for long vegetation (Lv = 1.11 m). Similarly, RV1B and FV1B represent breaking conditions for short vegetation, as well as RV2B and FV2B for long vegetation. BM denotes the case with only the building model and no vegetation.
In contrast, long vegetation patches (Lv = 1.11 m) significantly enhanced performance across all cases. Rigid non-breaking vegetation (RV1NB) exhibited the greatest reduction, with tsunami forces reduced by up to 65–70% compared to BM. Flexible non-breaking vegetation (FV1NB) followed closely, suggesting that both flexibility and length contribute to effective wave energy dissipation. When vegetation breakage occurred, tsunami forces increased in both rigid and flexible cases, with the effect more pronounced at higher inflow intensities.
The percentage reduction in tsunami force on the structure confirms the significant protective role of vegetation, with performance strongly influenced by vegetation length, flexibility, and the presence of breakage. Non-breaking rigid vegetation (RVNB) consistently showed the highest reduction—up to ~70% at 0.4 m impounded water depth for longer vegetation, due to its capacity to resist flow without deformation or failure. Flexible vegetation under non-breaking conditions (FVNB) followed closely, benefiting from flow energy absorption through bending. However, the performance of both types sharply declined when breakage occurred. In breaking scenarios, reductions fell dramatically with increasing tsunami intensity: for example, in Lv = 0.56 m at 0.5 m tsunami intensity case, RV1B and FV1B dropped to ~13% and ~10%, respectively, highlighting the loss of protection due to structural failure.
Longer vegetation (Lv = 1.11 m) consistently outperformed shorter patches (Lv = 0.56 m), with reductions of 61.2–69.1% compared to 43.2–54.3% under non-breaking conditions. Even with breakage, longer patches reduced forces by 30.6–60.1%, while shorter ones achieved only 10.1–45.4%, highlighting the effectiveness of extended vegetation in mitigating tsunami impact. These findings emphasize the importance of vegetation length in sustaining force attenuation, even when structural failure occurs. This indicates that length compensates, to some extent, for breakage effects, likely by prolonging the vegetation–flow interaction zone.
Overall, the results underscore the importance of maintaining vegetation integrity and maximizing patch length to enhance tsunami force reduction. While both rigid and flexible vegetation are effective when intact, flexible vegetation is more sensitive to performance losses after breakage.
3.3. Tsunami-Induced Uplift Load on the Building
Uplift forces on structures are mainly influenced by buoyancy and pore-water pressure, which vary with foundation depth and soil properties. In this study, performed over a non-porous, rigid bed with a sealed structural model, the observed uplift was solely attributed to buoyant forces. This confirms that, under such conditions, buoyancy is the primary driver of uplift, aligning with findings by Yeh et al. [42] that structural failure can occur from buoyancy alone.
Figure 12 illustrates the variation of maximum uplift force and percentage reductions under impounded water depth (HT) and proportional breaking length (LB) compared to the bare model (BM). Across all cases, the force increased monotonically with HT, reflecting the same variation of horizontal force distribution.
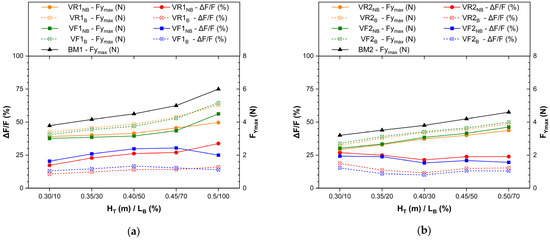
Figure 12.
Maximum uplift forces and corresponding percentage reductions at the structure across varying impounded water depths (HT = 0.30–0.50 m): (a) Short vegetation length (Lv = 0.56 m) and (b) long vegetation length (Lv = 1.11 m). Here, RV1NB and FV1NB represent non-breaking cases for short vegetation (Lv = 0.56 m); RV2NB and FV2NB for long vegetation (Lv = 1.11 m). RV1B and FV1B correspond to breaking cases for short vegetation, and RV2B and FV2B for long vegetation. BM denotes the structure-only case with no vegetation.
For short vegetation length (Lv = 0.56 m), uplift force reductions were more substantial under non-breaking conditions. Flexible vegetation (FV1NB) provided the highest reduction, especially at lower tsunami intensities (HT = 0.30–0.45 m), achieving peak reductions of up to 30.4%. However, when vegetation breakage occurred (FV1B), the reduction effect weakened, with uplift forces decreasing by approximately 30–45% compared to non-breaking conditions. Rigid vegetation (RV1) showed similar trends, with RV1NB achieving consistently lower reductions than FV1NB, but maintaining more stable performance under breaking (RV1B) scenarios at higher inflow depths.
For long vegetation length (Lv = 1.11 m), the uplift force reductions were more pronounced in all cases. Rigid vegetation under non-breaking conditions (RV1NB) achieved reductions up to 26.9%, while under breaking conditions (RV1B), uplift forces were reduced to as low as 6.9–14.6% across tsunami intensities. Notably, flexible vegetation with breakage (FV1B) exhibited the lowest overall uplift forces, with values ranging from 5.3% to 10.9%. Furthermore, longer vegetation patches resulted in greater energy dissipation and reduced vertical flow pressure on the structure, attributed to the extended length of intact vegetation remaining after breakage. As tsunami intensity increased, the proportion of vegetation subjected to structural failure (LB) was smaller in longer patches compared to shorter ones, thereby maintaining a more effective resistance zone and enhancing the overall reduction of uplift forces.
These findings underscore the importance of vegetation continuity and length in mitigating uplift forces. While non-breaking conditions offer the highest protection due to increased drag and upstream water accumulation, even broken vegetation maintains significant force reduction potential—particularly when the vegetated patch is long. The results also highlight that although flexible vegetation is more effective in intact conditions, its performance diminishes more rapidly than rigid vegetation when structural failure occurs, especially under high-intensity tsunami flows.
4. Discussion
Vegetation breakage, modeled based on the threshold bending moment of Pandanus odoratissimus, significantly influenced bore propagation by reducing flow resistance and increasing downstream inundation. These hydrodynamic changes underscore the importance of vegetation integrity during high-energy tsunami events. Tree failure modes are influenced by structural characteristics such as crown height, branching density, and trunk diameter [15,16], with failure typically occurring through either overturning or trunk breakage [43]. For example, during the 2011 JGET, approximately 81% of coastal black pines were uprooted, while 14% experienced trunk breakage [15,44]. In contrast, P. odoratissimus, due to its slender stem and aerial root system, predominantly fails through trunk breakage above the root zone [6]. This behavior is strongly influenced by substrate conditions, root anchorage, and the number of supporting roots [17,45].
Tree failure through trunk breakage significantly reduces tsunami resistance, as the upper portion is washed away and only the remaining stump interacts with the flow. This not only diminishes drag but also generates driftwood. In comparison, overturned trees, though less effective, can still contribute to drag due to their inclined posture. The loss of crown-induced resistance makes breakage more detrimental than bending [43]. However, P. odoratissimus exhibits a unique functional advantage: even after trunk failure, its dense aerial root system continues to provide substantial resistance to flow, helping to mitigate tsunami forces [6].
Breaking stress in vegetation may vary with growth stage, influencing failure patterns under extreme loading [43,46]. Flexible vegetation was effective when intact, dissipating wave energy through deformation; however, its performance deteriorated rapidly upon breakage, particularly under high-intensity tsunami flows. In contrast, rigid vegetation, despite its limited adaptability, maintained more stable protection after failure due to residual structural blockage. These contrasting responses highlight the trade-off between flexibility and structural robustness. As emphasized by [43], field observations revealed lower damage rates along the forest front, attributed to the high elasticity of certain species [15,44]. Nevertheless, such elasticity may not significantly reduce tsunami energy, as simulation results suggest limited attenuation in cases where structural integrity is compromised.
Vegetation length proved to be a key factor in enhancing protective performance. Longer vegetation patches consistently outperformed shorter ones across all metrics—reducing inundation depth, horizontal force, and uplift load—primarily due to the greater proportion of intact vegetation that remained functional even after partial breakage. This extended interaction zone allowed for increased energy dissipation and delayed flow transmission. Numerical simulations by [43] support this trend, showing complete tree failure in Shiranuka, Japan, where the coastal forest was only 100 m wide and the ground elevation was low. In contrast, minimal damage was predicted in the landward portions of the 700 m-wide forest in Taiki, except in areas where the forest narrowed. Thuy et al. [6] also noted that the threshold water depth required to initiate trunk breakage increases with forest width, illustrating the reduced vulnerability of longer vegetation belts.
This study did not account for the effects of broken tree parts—dislodged by tsunami forces—on the remaining vegetation or downstream structures. In reality, damaged trees can become mobile debris, potentially impacting standing vegetation, increasing loads on downstream structures, or altering local flow dynamics by becoming trapped within vegetation patches. Moreover, the accumulation of such debris in front of or around structures may modify flow patterns and influence force distribution. On the landward side, debris may also contribute to secondary damage to build infrastructure or further obstruct evacuation routes [4,25,43]. These interactions represent an important and complex aspect of tsunami–vegetation dynamics. Effective forest planning and debris management are therefore essential. As noted by [2,16], strategically designed coastal forests can play a dual role—not only in attenuating wave energy but also in trapping debris—thereby enhancing the resilience of coastal communities. Future studies should aim to incorporate vegetation-derived debris in physical or numerical models to better assess its hydrodynamic influence and implications for structural safety and disaster mitigation.
Overall, the findings highlight that both vegetation type and configuration critically influence tsunami mitigation capacity. Designing coastal greenbelts with sufficient length and structural resilience—either through species selection or engineered analogs—can substantially reduce tsunami-induced forces and inundation, even under conditions of partial failure.
5. Conclusions
This study experimentally examined the influence of vegetation integrity, type, flexibility, and patch length on tsunami bore attenuation and structural force reduction, using Pandanus odoratissimus as a model species. A key feature of the experimental design was the simulation of vegetation breakage, defined as occurring when the tsunami water depth exceeded 80% of the tree height, representing the critical threshold for structural failure.
- Vegetation under non-breaking conditions significantly attenuated both water levels and hydrodynamic forces on coastal structures. In these cases, vegetation acted as a stable physical barrier, dissipating wave energy through drag and (in flexible types) bending deformation. Maximum tsunami force reductions reached up to ~70% with rigid non-breaking vegetation and ~62–68% with flexible non-breaking vegetation, particularly in longer patch configurations.
- In contrast, vegetation breaking led to a substantial loss of protective function. When tree breakage occurred, the vegetation’s ability to resist flow diminished sharply, resulting in higher water transmission, elevated inundation behind the vegetation, and significantly increased force on the structure. In short vegetation patches, horizontal force reduction declined to 10.1–12.9%, while uplift force reduction ranged from 10.7% to 16.7% under breaking conditions for both rigid and flexible vegetation. Flexible vegetation exhibited the most substantial performance degradation, primarily due to the collapse of structural integrity and loss of drag resistance.
- Vegetation patch length played a compensatory role, as longer patches maintained better performance even under breaking conditions. At the highest tsunami intensity, horizontal force reductions reached up to 38.8% for rigid and 30.6% for flexible vegetation, while uplift force reductions were 15.3% and 13.1% for rigid and flexible vegetation, respectively. This suggests that extended vegetation zones can partially mitigate the adverse effects of localized breakage by prolonging the vegetation–flow interaction.
- The contrast between non-breaking and breaking scenarios was particularly evident in bore behavior and force time histories. Non-breaking vegetation increased upstream water levels and reduced downstream inundation by resisting flow, while breaking allowed greater water penetration and led to earlier, higher force peaks at the structure.
These findings underscore the critical importance of maintaining vegetation integrity in tsunami-prone coastal zones. Non-breaking vegetation, whether rigid or flexible, provides robust energy dissipation and structural protection, especially when deployed in longer patches. However, once breakage occurs, the protective benefits diminish rapidly, particularly for flexible vegetation. Future work should explore the dynamic behavior of broken tree segments, their interaction with surviving vegetation, and potential debris loading effects, which were not addressed in the present study
Author Contributions
Conceptualization, R.N.U. and N.T.; methodology, R.N.U.; formal analysis, R.N.U.; investigation, R.N.U.; resources, N.T.; data curation, R.N.U.; writing—original draft preparation, R.N.U.; writing—review and editing, N.T.; visualization, R.N.U.; supervision, N.T.; project administration, N.T.; funding acquisition, N.T. All authors have read and agreed to the published version of the manuscript.
Funding
This research received no external funding.
Data Availability Statement
The original contributions presented in this study are included in the article. Further inquiries can be directed to the corresponding author.
Acknowledgments
The author gratefully acknowledges the financial support received from the MEXT Scholarship from the Japanese Ministry of Education, Culture, Sports, Science, and Technology. Special thanks are also extended to Yoshiya Igarashi and Sai Suiriken for their assistance throughout the experimental process.
Conflicts of Interest
The authors declare no conflicts of interest.
Abbreviations
The following abbreviations are used in this manuscript:
| WG | Wave gauge |
| LDV | Laser Doppler Velocimetry |
| EVA | Ethylene-vinyl acetate |
| LDPE | Low-Density Polyethylene |
| IOT | Indian Ocean tsunami |
| JGET | Great East Japan Earthquake and Tsunami |
| RV | Rigid vegetation |
| FV | Flexible vegetation |
Appendix A
Vertical Profile of α(z)β(z) for Pandanus odoratissimus
The Pandanus odoratissimus species was represented using its overall drag behavior, factoring in the contributions from aerial roots, the main stem, and branching elements. The vertically integrated, depth-averaged drag coefficient (Cd-all), which reflects the tree’s structural profile along the water column, was defined by [6] as follows.
b(z) and Cd(z) denote the projected width of the tree and drag coefficient at a specific height, z, above the ground level. In contrast, bref and Cd-ref represent the reference trunk diameter and the corresponding drag coefficient measured at breast height.
The equivalent drag coefficient at height z, Cd-all(z), can be derived as follows:
The vertical distribution of for P. odoratissimus is depicted in Figure A1.
Considering the variation of , three drag coefficient values, averaged over the designated height, were chosen to reflect the impacts of the roots, trunk, and crown, corresponding to Cd-ref (see Figure A1). The root and crown components were represented as bundles of cylinders. The required cylinder count was determined based on these drag coefficient values along the vertical stand structure, incorporating aerial roots, trunks, and branches.

Figure A1.
The vertical distribution of α(z)β(z) for Pandanus odoratissimus [38].
Figure A1.
The vertical distribution of α(z)β(z) for Pandanus odoratissimus [38].

References
- Sriram, V.; Stoesser, T.; Yan, S.; Murali, K. (Eds.) Hydrodynamics of Wave-Vegetation Interactions; World Scientific: Singapore, 2023; ISBN 978-981-12-8413-7. [Google Scholar]
- Chang, C.-W.; Mori, N. Green Infrastructure for the Reduction of Coastal Disasters: A Review of the Protective Role of Coastal Forests against Tsunami, Storm Surge, and Wind Waves. Coast. Eng. J. 2021, 63, 370–385. [Google Scholar] [CrossRef]
- Hu, Z.; Temmerman, S.; Zhu, Q.; Wang, X.; Wu, J.; Xu, T.; Schoutens, K.; Suzuki, T.; Yang, Z.; Bouma, T.J. Predicting Nature-Based Coastal Protection by Mangroves under Extreme Waves. Proc. Natl. Acad. Sci. USA 2025, 122, e2410883122. [Google Scholar] [CrossRef]
- Shuto, N. The Effectiveness and Limit of Tsunami Control Forests. Coast. Eng. Jpn. 1987, 30, 143–153. [Google Scholar] [CrossRef]
- Wu, W.-C.; Ma, G.; Cox, D.T. Modeling Wave Attenuation Induced by the Vertical Density Variations of Vegetation. Coast. Eng. 2016, 112, 17–27. [Google Scholar] [CrossRef]
- Thuy, N.B.; Tanaka, N.; Tanimoto, K. Tsunami Mitigation by Coastal Vegetation Considering the Effect of Tree Breaking. J. Coast. Conserv. 2012, 16, 111–121. [Google Scholar] [CrossRef]
- Maza, M.; Lara, J.L.; Losada, I.J. Predicting the Evolution of Coastal Protection Service with Mangrove Forest Age. Coast. Eng. 2021, 168, 103922. [Google Scholar] [CrossRef]
- Cochard, R.; Ranamukhaarachchi, S.L.; Shivakoti, G.P.; Shipin, O.V.; Edwards, P.J.; Seeland, K.T. The 2004 Tsunami in Aceh and Southern Thailand: A Review on Coastal Ecosystems, Wave Hazards and Vulnerability. Perspect. Plant Ecol. Evol. Syst. 2008, 10, 3–40. [Google Scholar] [CrossRef]
- Wibisono, T.I.C.; Nyoman, S. Study of Lessons Learned from Mangrove/Coastal Ecosystem Restoration Efforts in Aceh since the Tsunami 2006, Xiii–83. Available online: https://www.miteco.gob.es/content/dam/miteco/es/parques-nacionales-oapn/proyectos-de-cooperacion/retauracion-manglares_tcm30-287428.pdf (accessed on 15 July 2025).
- United Nations Environment Programme. Post Tsunami “Green” Environmental Data Assessment in the Province of Nanggroe Aceh Darussalam; Technical Report; Data Collecting and Assessment Consultants (DCAC): London, UK, 2006. [Google Scholar]
- Inagaki, K.; Nakaza, E.; Iribe, T.; Watanabe, Y. Distribution of the Pine Trees Drowned by Tohoku Tsunami along Sendai Coastal Area. J. Jpn. Soc. Civ. Eng. 2012, 68, 120–125. [Google Scholar]
- Matsumoto, D.; Sawai, Y.; Tanigawa, K.; Namegaya, Y.; Shishikura, M.; Kagohara, K.; Fujiwara, O.; Shinozaki, T. Sedimentary Diversity of the 2011 Tohoku-Oki Tsunami Deposits on the Sendai Coastal Plain and the Northern Coast of Fukushima Prefecture, Japan. Prog. Earth Planet. Sci. 2023, 10, 23. [Google Scholar] [CrossRef]
- Kathiresan, K.; Rajendran, N. Coastal Mangrove Forests Mitigated Tsunami. Estuar. Coast. Shelf Sci. 2005, 65, 601–606. [Google Scholar] [CrossRef]
- Chang, C.; Mori, N.; Tsuruta, N.; Suzuki, K.; Yanagisawa, H. An Experimental Study of Mangrove-Induced Resistance on Water Waves Considering the Impacts of Typical Rhizophora Roots. J. Geophys. Res. Oceans 2022, 127, e2022JC018653. [Google Scholar] [CrossRef]
- Nanko, K.; Suzuki, S.; Noguchi, H.; Ishida, Y.; Levia, D.F.; Ogura, A.; Hagino, H.; Matsumoto, H.; Takimoto, H.; Sakamoto, T. Mechanical Properties of Japanese Black Pine (Pinus thunbergii Parl.) Planted on Coastal Sand Dunes: Resistance to Uprooting and Stem Breakage by Tsunamis. Wood Sci. Technol. 2019, 53, 469–489. [Google Scholar] [CrossRef]
- Benazir; Triatmadja, R.; Syamsidik; Nizam; Warniyati. Vegetation-Based Approached for Tsunami Risk Reduction: Insights and Challenges. Prog. Disaster Sci. 2024, 23, 100352. [Google Scholar] [CrossRef]
- Nicoll, B.C.; Gardiner, B.A.; Rayner, B.; Peace, A.J. Anchorage of Coniferous Trees in Relation to Species, Soil Type, and Rooting Depth. Can. J. For. Res. 2006, 36, 1871–1883. [Google Scholar] [CrossRef]
- Thomsan, L.A.J.; Englberger, L.; Guarino, L.; Thaman, R.R.; Elevitch, C.R. Pandanus tectorius (Pandanus): Species Profiles for Pacific Island Agroforestry | PDF | Plants | Botany. In Traditional Trees of Pacific Islands: Their Culture, Environment, and Use; Elevitch, C.R., Ed.; Permanent Agriculture Resources: Holualoa, HI, USA, 2006; ISBN 0970254458. [Google Scholar]
- Nandasena, N.A.K.; Tanaka, N.; Tanimoto, K. Perspective of Coastal Vegetation Patches with Topography Variations for Tsunami Protection in 2D - Numerical Modeling. Proc. Hydraul. Eng. 2008, 52, 133–138. [Google Scholar] [CrossRef][Green Version]
- Koshimura, S.; Oie, T.; Yanagisawa, H.; Imamura, F. Developing Fragility Functions for Tsunami Damage Estimation Using Numerical Model and Post-Tsunami Data from Banda Aceh, Indonesia. Coast. Eng. J. 2009, 51, 243–273. [Google Scholar] [CrossRef]
- Huang, Z.; Wu, T.-R.; Chen, T.-Y.; Sim, S.Y. A Possible Mechanism of Destruction of Coastal Trees by Tsunamis: A Hydrodynamic Study on Effects of Coastal Steep Hills. J. Hydro-Environ. Res. 2013, 7, 113–123. [Google Scholar] [CrossRef]
- Suppasri, A.; Muhari, A.; Ranasinghe, P.; Mas, E.; Shuto, N.; Imamura, F.; Koshimura, S. Damage and Reconstruction after the 2004 Indian Ocean Tsunami and the 2011 Great East Japan Tsunami. J. Nat. Disaster Sci. 2012, 34, 19–39. [Google Scholar] [CrossRef]
- Rossetto, T.; Peiris, N.; Pomonis, A.; Wilkinson, S.M.; Del Re, D.; Koo, R.; Gallocher, S. The Indian Ocean Tsunami of December 26, 2004: Observations in Sri Lanka and Thailand. Nat. Hazards 2007, 42, 105–124. [Google Scholar] [CrossRef]
- Stolle, J.; Takabatake, T.; Mikami, T.; Shibayama, T.; Goseberg, N.; Nistor, I.; Petriu, E. Experimental Investigation of Debris-Induced Loading in Tsunami-Like Flood Events. Geosciences 2017, 7, 74. [Google Scholar] [CrossRef]
- Kaida, H.; Tomita, T.; Yoshimura, S.; Kihara, N. Review of Evaluation of Tsunami-Induced Debris Collision Force. Coast. Eng. J. 2024, 66, 492–518. [Google Scholar] [CrossRef]
- Yeh, H. Tsunami Bore Runup. In Tsunami Hazard; Springer: Berlin/Heidelberg, Germany, 1991; pp. 209–220. [Google Scholar] [CrossRef]
- Asadollahi, N.; Nistor, I.; Mohammadian, A. Numerical Investigation of Tsunami Bore Effects on Structures, Part I: Drag Coefficients. Nat. Hazards 2018, 96, 285–309. [Google Scholar] [CrossRef]
- Hudson, R.Y.; Herrmann, F.A.; Sager, R.A.; Whalin, R.W.; Robert, W.; Keulegan, G.H.; Garbis, H.; Chatham, C.E.; Claude, E.; Hales, L.Z. Coastal Hydraulic Models. 1979. Available online: https://www.pwri.go.jp/icharm/publication/pdf/2010/4177_tsunami-mitigative_coastal_vegetation_belt.pdf (accessed on 15 July 2025).
- Tanaka, S.; Istiyanto, D.C.; Kuribayashi, D. Planning and Design of Tsunami-Mitigative Coastal Vegetation Belts; Technical Note of PWRI No.4177; ICHARM: Tsukuba, Japan, 2010. [Google Scholar]
- Thuy, N.B.; Tanimoto, K.; Tanaka, N.; Harada, K.; Iimura, K. Bending Moment on a Tree (Pandanus odoratissimus) Due to Tsunami Flow around Edge of Coastal Forest. J. Jpn. Soc. Civ. Eng. 2010, 66, 276–280, (In Japanese with English Abstract). [Google Scholar] [CrossRef]
- Tanaka, N.; Takemura, T.; Sasaki, Y.; Mowjood, M.I.M. Differences in Destruction Conditions and Tsunami Arrival Delay Times Depending on Tree Species in Sri Lankan Coastal Forests (Japanese). Proc. Jpn. Conf. Coast. Eng. 2006, 53, 281–285. [Google Scholar] [CrossRef]
- Abral, H.; Andriyanto, H.; Samera, R.; Sapuan, S.M.; Ishak, M.R. Mechanical Properties of Screw Pine (Pandanus odoratissimus) Fibers—Unsaturated Polyester Composites. Polym-Plast Technol. Eng. 2012, 51, 500–506. [Google Scholar] [CrossRef]
- Lakshmanan, N.; Kantharaj, M.; Sundar, V. The Effects of Flexible Vegetation on Forces with a Keulegan-Carpenter Number in Relation to Structures Due to Long Waves. J. Mar. Sci. Appl. 2012, 11, 24–33. [Google Scholar] [CrossRef]
- Reis, R.A.; Fortes, C.J.E.M.; Rodrigues, J.A.; Hu, Z.; Suzuki, T. Experimental Study on Drag Coefficient of Flexible Vegetation under Non-Breaking Waves. Ocean Eng. 2024, 296, 117002. [Google Scholar] [CrossRef]
- Gong, S.; Chen, J.; Jiang, C.; Xu, S.; He, F.; Wu, Z. Prediction of Solitary Wave Attenuation by Emergent Vegetation Using Genetic Programming and Artificial Neural Networks. Ocean Eng. 2021, 234, 109250. [Google Scholar] [CrossRef]
- He, F.; Chen, J.; Jiang, C. Surface Wave Attenuation by Vegetation with the Stem, Root and Canopy. Coast. Eng. 2019, 152, 103509. [Google Scholar] [CrossRef]
- Kalloe, S.A.; Hofland, B.; Antolínez, J.A.A.; van Wesenbeeck, B.K. Quantifying Frontal-Surface Area of Woody Vegetation: A Crucial Parameter for Wave Attenuation. Front. Mar. Sci. 2022, 9, 820846. [Google Scholar] [CrossRef]
- Tanaka, N.; Sasaki, Y. Role of Coastal Vegetation at 2006 Java Tsunami Disaster and Its Breaking or Bending Threshold. J. Jpn. Soc. Civ. Eng. 2007, 51, 1445–1450, (In Japanese with English Abstract). [Google Scholar] [CrossRef][Green Version]
- Udarika, R.N.; Tanaka, N. Force Reduction of Tsunami-like Waves on Coastal Structures by Varying Arrangements and Densities of Seaside Vegetation: A Physical Model Study. Ocean Eng. 2025, 318, 120103. [Google Scholar] [CrossRef]
- Goff, J.; Liu, P.L.-F.; Higman, B.; Morton, R.; Jaffe, B.E.; Fernando, H.; Lynett, P.; Fritz, H.; Synolakis, C.; Fernando, S. Sri Lanka Field Survey after the December 2004 Indian Ocean Tsunami. Earthq. Spectra 2006, 22, 155–172. [Google Scholar] [CrossRef]
- Fritz, H.M.; Borrero, J.C.; Synolakis, C.E.; Yoo, J. 2004 Indian Ocean Tsunami Flow Velocity Measurements from Survivor Videos. Geophys. Res. Lett. 2006, 33, L24605. [Google Scholar] [CrossRef]
- Yeh, H.; Barbosa, A.R.; Ko, H.; Cawley, J.G. Tsunami Loadings on Structures: Review and Analysis. Coast. Eng. Proc. 2014, 1, 4. [Google Scholar] [CrossRef]
- Tanaka, N.; Sato, H.; Igarashi, Y.; Kimiwada, Y.; Torita, H. Effective Tree Distribution and Stand Structures in a Forest for Tsunami Mitigation Considering the Different Tree-Breaking Patterns of Tree Species. J. Environ. Manag. 2018, 223, 925–935. [Google Scholar] [CrossRef]
- Sato, H.; Torita, H.; Masaka, K.; Abe, T.; Noguchi, H.; Kimura, K.; Sakamoto, T. Relationship between Treefall Damage and Forest Structure of Pinus Thunbergii Coastal Forest by the 2011 Tohoku Earthquake Tsunami Disaster: An Example of Misawa City of Aomori Prefecture. J. Jpn. Soc. Coast. For. 2012, 11, 41–45, (In Japanese with English Abstract). [Google Scholar] [CrossRef]
- Nicoll, B.C.; Achim, A.; Mochan, S.; Gardiner, B.A. Does Steep Terrain Influence Tree Stability? A Field Investigation. Can. J. For. Res. 2005, 35, 2360–2367. [Google Scholar] [CrossRef]
- Pretzsch, H.; Rais, A. Wood Quality in Complex Forests versus Even-Aged Monocultures: Review and Perspectives. Wood Sci. Technol. 2016, 50, 845–880. [Google Scholar] [CrossRef]


Disclaimer/Publisher’s Note: The statements, opinions and data contained in all publications are solely those of the individual author(s) and contributor(s) and not of MDPI and/or the editor(s). MDPI and/or the editor(s) disclaim responsibility for any injury to people or property resulting from any ideas, methods, instructions or products referred to in the content. |
© 2025 by the authors. Licensee MDPI, Basel, Switzerland. This article is an open access article distributed under the terms and conditions of the Creative Commons Attribution (CC BY) license (https://creativecommons.org/licenses/by/4.0/).