Article

Integrated Geophysical Techniques to Investigate Water Resources in Self-Sustained Carbon-Farming Agroforestry

by
John D. Alexopoulos
1,
Vasileios Gkosios
1,*,
Ioannis-Konstantinos Giannopoulos
1,
Spyridon Dilalos
1,
Antonios Eleftheriou
2 and
Simos Malamis
2
1
Laboratory of Geophysics, Department of Geology and Geoenvironment, National and Kapodistrian University of Athens, Panepistimioupoli Zografou, 15784 Athens, Greece
2
Sanitary Engineering Laboratory, Department of Water Resources and Environmental Engineering, School of Civil Engineering, National Technical University of Athens, Iroon Politechniou Zografou, 15780 Athens, Greece
*
Author to whom correspondence should be addressed.
Geosciences 2025, 15(8), 317; https://doi.org/10.3390/geosciences15080317
Submission received: 17 July 2025 / Revised: 9 August 2025 / Accepted: 11 August 2025 / Published: 13 August 2025

Abstract

The present paper deals with the combined application of near-surface geophysical techniques in a sustainable agriculture project. Their application is focused on the identification of any subsurface water in the context of sustainable water management for the selected living hub, located in the semi-arid area of Agios Georgios-Mandra Attiki. The objective of the multidisciplinary geophysical study was to determine the depth of the bedrock and the thickness of the post-Alpine deposits. In addition, the subsurface karstification and the possible aquifer presence were examined. For that reason, the following techniques were implemented: Electrical Resistivity Tomography, Seismic Refraction Tomography, Ground-Penetrating Radar, and Very-Low Frequency electromagnetic technique. The study was also supported by drone LiDAR usage. The investigation revealed several hydrogeological characteristics of the area. The thickness of the post-Alpine sediments is almost 3 m. However, no shallow aquiferous systems have been developed in this formation, as indicated by their relatively high resistivity values (100–1000 Ohm.m). Furthermore, the alpine bedrock exhibits extensive karstification, facilitated by the development of fracture zones. The absence of an underlying impermeable layer prevented the development of aquiferous zones, at least up to a depth of 100 m.
Keywords:
ERT; SRT; GPR; VLF; drone LiDAR

1. Introduction

Sustainable subsurface water storage is an increasingly critical requirement in the successful implementation of agricultural and carbon farming projects, particularly in arid and semi-arid regions [1,2]. Ensuring sufficient water availability is essential to support experimental planting installations, which are expected to contribute to enhanced carbon sequestration, dryland and soil restoration. The presented study area was selected for the establishment of an experimental agroforestry system consisting of olive trees, cypress trees, arbutus, lavender, rosemary, and vetch within the framework of the INNO4CFIs project. The aim of the project is to improve carbon farming initiatives whilst ensuring the preservation of biodiversity, water security, and soil health. Therefore, the specific living hub encourages sustainable land management, with the objective of optimizing carbon storage by establishing a semi-self-sustained agroforestry system, which exhibits sustainable production and carbon farming potential [3].
A fundamental prerequisite for the success of such nature-based solutions is the identification and assessment of available subsurface water resources capable of sustaining plantation development. For that reason, it was necessary to ascertain the geological and hydrological conditions in order to determine whether they could adequately support the water demands of the long-term cultivations planned for this area. The area of interest (also referred to as the “living hub”), at Agios Georgios-Mandra Attiki, is located in the NW part of the Attika Prefecture, SE of Villia village, covering an area of ~44.000 m2 (Figure 1).
Previous geophysical investigations conducted in geologically similar environments, in the vicinity of the present study area, have identified the presence of several karstification structures [4,5]. These findings strongly suggest that the occurrence of similar karstic features is highly probable within the boundaries of the current study area as well. For this reason, assessing the extent to which the subsurface formations in the study area have undergone karstification was considered essential, as the presence of such features could significantly influence the subsurface water storage capacity and consequently the water management of the proposed carbon farming activities.
Based on the anticipated geological structure, the integrated geophysical study focused on (i) the investigation of the bedrock’s depth (thickness of the old alluvial deposits) by delineating its top boundary, (ii) the extent of bedrock karstification, and (iii) the investigation of possible existence of phreatic and/or subsurface aquifer along with the evaluation of the hydrogeological potential of the study area.
Integrated geophysical surveys offer valuable information about subsurface features by assessing the spatial variation of physical properties within different geological formations, valuable for investigating the hydrogeological subsurface regime of agricultural areas [6,7,8,9,10,11]. For this purpose, a near-surface, high-resolution geophysical investigation was conducted in the study area, with the combined application of the Electrical Resistivity Tomography (ERT), Seismic Refraction Tomography (SRT), Ground Penetrating Radar (GPR), and Very Low Frequency (VLF) techniques. Furthermore, the surface topography of the area was outlined in great detail by the application of UAV photogrammetry and Light Detection and Ranging (LiDAR) techniques, with the construction of high-resolution products such as orthophotomosaics and digital elevation models (DEMs).
The ERT is recognized as a highly efficient, non-invasive geophysical technique, capable of providing high-resolution imaging of subsurface heterogeneities. More specifically, in karst regions, the ERT technique is capable of discriminating the heterogeneity produced by the extensive dissolution of carbonate rocks. Refs. [12,13] have successfully identified the presence of sinkholes in carbonate rocks through the application of the ERT technique. Additionally, the ERT technique has been effectively implemented for karstic void identification [14,15,16], delineation of bedrock’s depth [17,18], and the geometrical characteristics of karstic aquifers [19,20]. Furthermore, the application of the ERT technique has proven to be highly effective in characterizing the structure of natural wetlands [21], delineating the geometry and dynamics of shallow aquifers in semi-arid and arid environments [22,23], and assessing their hydraulic properties, which control groundwater flow and storage potential [24,25].
Many authors have suggested the application of the SRT technique in cases where conventional refraction techniques fail to discriminate strong lateral and vertical variations of the subsurface seismic velocity [26,27,28]. These variations occur in areas of complex structure, often dominated by the presence of several fractures and/or karstification development, altering the homogeneity of the subsurface formations. Refs. [29,30,31] have successfully applied the SRT technique to investigate subsurface velocity anomalies induced by the presence of air-filled voids. Other studies have demonstrated the effectiveness of the SRT technique in the adumbration of fracture zones [32,33] and estimation of the bedrock’s depth [34].
GPR is an essential geophysical method in the study of karst environments and aquifers, primarily due to its ability to detect and delineate subsurface heterogeneities such as voids, fractures, and variations in lithology [35,36]. By sensing contrasts in dielectric properties and depending on the signal attenuation, GPR can effectively image the bedrock top boundary, determine the thickness of overlying deposits, and characterize features resulting from karstification processes. These features critically influence groundwater storage and flow pathways, making GPR invaluable for assessing the hydrogeological potential and structural complexity of karst aquifers.
The VLF method is an electromagnetic (EM) geophysical technique commonly applied in shallow subsurface investigations to identify conductive geological features, such as faults, playing an important role in the local hydrogeological conditions as the main water flow paths [37,38,39]. The method’s effectiveness is based on contrasts in electrical conductivity between different subsurface materials. Conductive structures, such as water-saturated fractures, generate distinctive secondary electromagnetic responses when exposed to VLF signals [40]. The VLF method has subsequently been applied to investigate possible conductive anomalies derived from groundwater-filled fractures or by highly resistive targets (potential air voids) in less resistive environments [16,41].
The integration of several geophysical techniques, such as ERT, SRT, GPR, and VLF, is a widely adopted approach, particularly in geologically complex environments. This multidisciplinary effort improves the reliability of interpretation by enabling the investigation of diverse geophysical parameters and facilitating cross-validation of the results. Several studies [42,43,44,45] conducted in complex geological environments, with the presence of fault zones and karstic fields, propose the combination of the aforementioned geophysical techniques for the identification of the subsurface heterogeneity.
Remote sensing techniques have emerged as essential tools for acquiring high-resolution geospatial data, particularly in photogrammetric and LiDAR applications. UAV-based photogrammetry delivers detailed, high-resolution visual data, while LiDAR excels at generating precise topographic models, including in areas obscured by dense vegetation [46,47,48]. Due to its exceptional accuracy, LiDAR is particularly sensitive to identifying minor elevation changes and subtle surface deformations.

2. Geological Setting

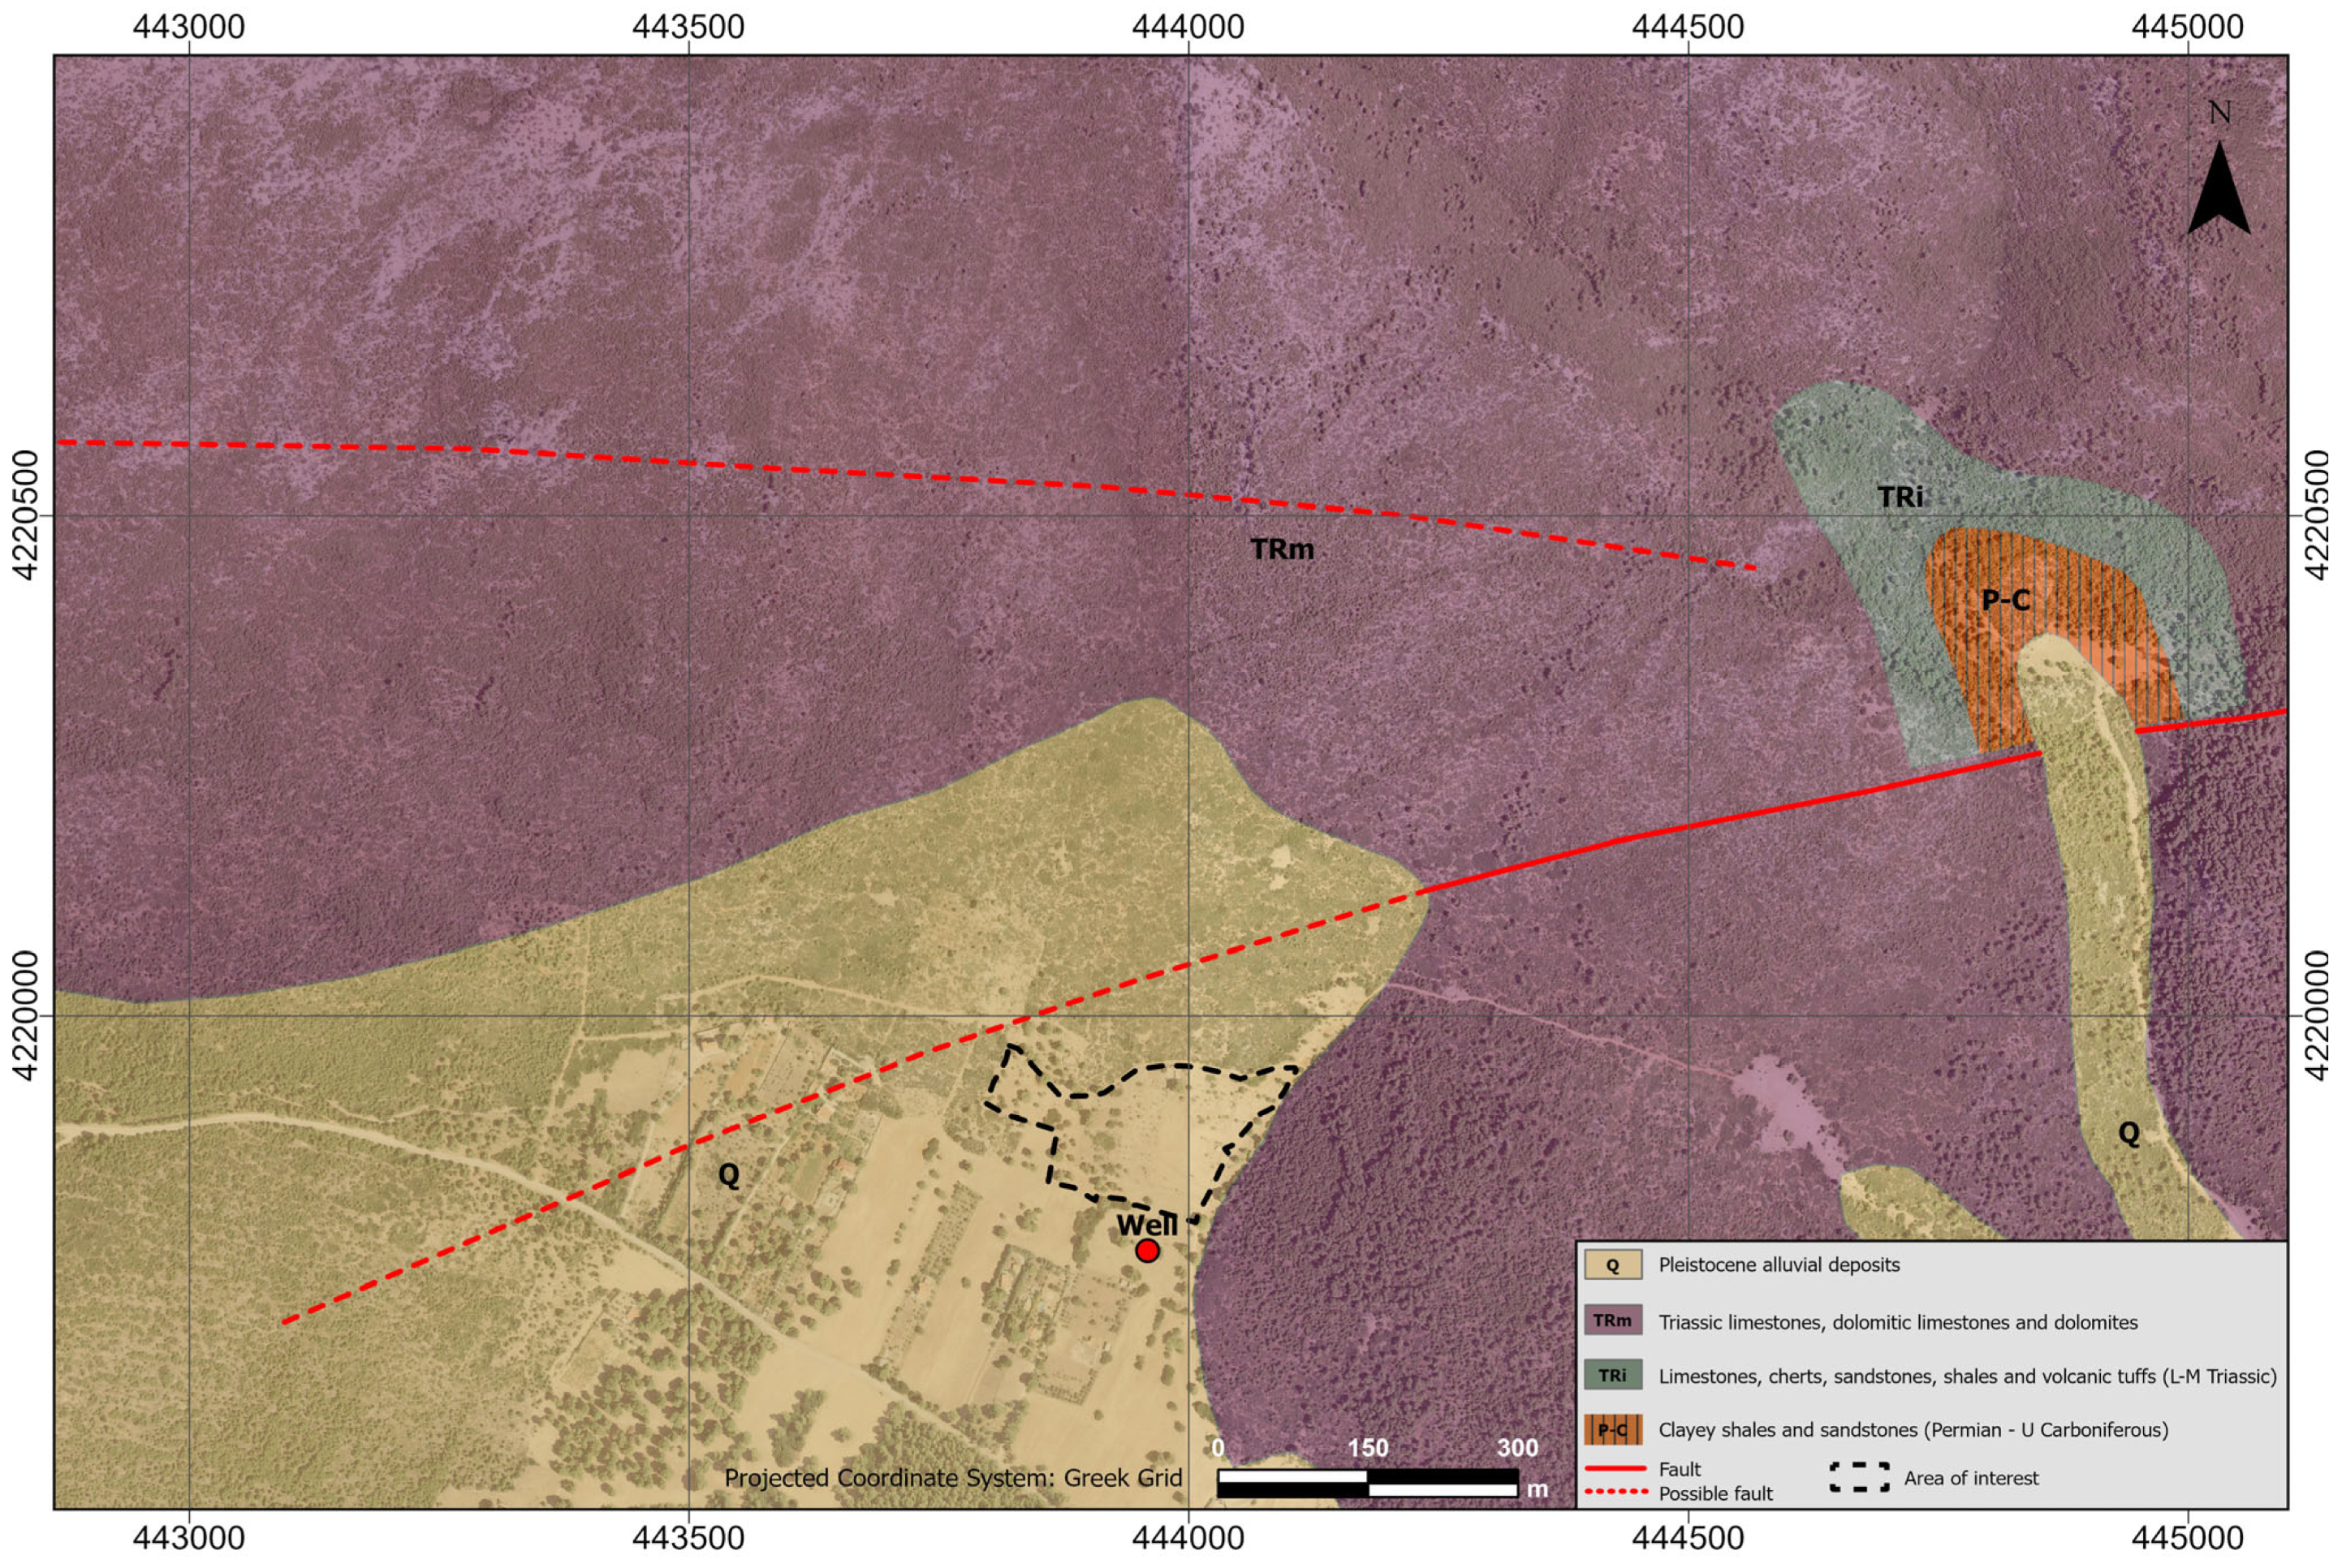
The greatest part of the study area (Figure 2) is dominated by the presence of Pleistocene alluvial deposits (Q) of fluvial and alluvial fans, which primarily consist of gravels, angular pebbles, and sands of various origin, usually of strong diagenesis. The development of these deposits has been favored by tectonic activity, leading to the formation of W–E normal faults.
These post-Alpine sediments overlie Alpine formations that belong to the Sub-Pelagonian zone of the Internal Hellenides. In the proximity of the study area, three distinct formations of the Sub-Pelagonian zone are observed. The oldest Alpine formation is located at the NE part of the map, approximately 1 km from the area of interest. This formation primarily consists of argillaceous shales and sandstones (P-C) of Permian to late Carboniferous age, alternating with graywackes, conglomerates, tuffites, and tuffs. They contain lenticular layers and lenses of limestone and also bodies of basic igneous rocks. This formation is overlain by thin-plated compact to marly limestones (TRi) of lower–middle Triassic age. The limestones alternate with banks of compact grey limestones, between which there are intercalated beds and layers of cherts, shales, sandstones, and occasional tuffs. Finally, the middle–upper Triassic limestone, dolomitic limestone, and dolomite formation (TRm) is observed overlying the previously mentioned formation. They are characterized as white to white-grey, at places reddish, massive to thick bedded, crystalline, strongly fractured, and karstified. This formation occupies the greatest part of the mountainous region of the study area, and it is considered to be the bedrock underlying the post-Alpine sediments beneath the investigated area.
Regarding the hydrogeological characteristics of the study area, the two primary geological formations (Pleistocene alluvial deposits—Q and middle–upper Triassic carbonates—TRm) that dominate in the proximity of the study area can be classified into two primary categories, according to the classification system established by the International Association of Hydrogeologists [50]. More specifically, the alluvial deposits (Q) are classified into the first category of aquifers, where groundwater flow occurs predominantly through intergranular pores. In contrast, the carbonate formation (TRm) is classified in the second category, comprising fissured aquifers, including karst aquifers. The carbonate unit is expected to exhibit high secondary permeability, primarily due to the extensive fracturing and karstification that it has undergone.
The absence of a dense hydrographic network suggests that most of the surface water in the area infiltrates into the subsurface rather than forming surface streams. This interpretation is further supported by the presence of a well in the southern part of the study area (Figure 2), which indicates that groundwater abstraction for irrigation purposes occurred in the past. At the time of the investigation, however, the well was completely dry, suggesting a significant reduction in groundwater recharge. This decline is likely related to decreased precipitation and prolonged drought periods associated with climate change, which have substantially diminished the amount of water available for infiltration.

3. Methodology

3.1. Remote Sensing Techniques

A comprehensive analysis of the study area was conducted through the combined application of UAV-based photogrammetry and LiDAR technology, aimed at producing high-resolution orthophotomosaics and DEMs capable of capturing the terrain morphology, even beneath dense vegetation.
UAV photogrammetry involves the systematic acquisition of overlapping aerial imagery using drone-mounted cameras. These datasets are processed using advanced photogrammetric algorithms, particularly Structure from Motion (SfM), which reconstructs georeferenced orthophotos, DEMs, and three-dimensional point clouds from two-dimensional imagery [51,52]. This technique yields highly detailed spatial information, rendering it particularly effective for geomorphological studies. In parallel, LiDAR (Light Detection and Ranging) employs laser pulses to generate precise 3D representations of the surface, with the distinct advantage of penetrating vegetative cover to expose hidden topographic features [53,54]. The synergy of UAV photogrammetry and LiDAR provides complementary datasets that significantly improve the resolution and reliability of terrain models.
For the purposes of this study, the DJI Matrice 350 RTK, by DJI Technology Co., Ltd., Shenzhen, China, unmanned aerial vehicle (UAV) was employed, featuring an integrated GNSS (Global Navigation Satellite System) receiver compatible with multiple satellite constellations. The UAV’s positional accuracy was ensured through real-time kinematic (RTK) corrections, achieved by connecting via GPRS mobile networks to a system of permanent reference stations. This configuration provided centimeter-level positional precision throughout the survey. The Matrice 350 RTK was equipped with the DJI Zenmuse L1 sensor, incorporating a LIVOX™ (Wanchai, Hong Kong) LiDAR module capable of recording up to three signal returns per laser pulse. Additionally, regarding the photogrammetry technique, the Zenmuse P1 45MP RGB camera with a 35 mm focal length lens was used to allow the acquisition of high-resolution visual imagery data.
The UAV was set to operate in follow-terrain mode, maintaining a consistent altitude of 100 m above ground level throughout the survey. Data acquisition flights were conducted in May 2024, with the onboard camera set at an angle of 60° from the horizon for photogrammetric missions and 45° for LiDAR surveys. The flight speed was maintained at a constant 5.0 m/s. To ensure adequate spatial coverage and image continuity, the front and side overlap of the captured imagery was configured at 80% and 70%, respectively, for the photogrammetry survey. Additionally, regarding the LiDAR mission, the front and side overlap was set to 70% and 50%, respectively.
Based on these parameters, the ground sampling distance (GSD) for the photogrammetry survey was calculated to be 1.38 cm/pixel. The total survey area encompassed 0.32 km2, and the resulting LiDAR point cloud attained a density of 1184 points/m2 (Figure 3).
The processing of both RGB photogrammetric images and LiDAR datasets was carried out using DJI Terra software v5.0.1. The photogrammetric workflow involved the spatial alignment of images using embedded metadata, followed by the generation of a dense point cloud and the final orthophotomosaic, which achieved a resolution of 1.2 cm. To further improve the positional accuracy of the outputs, 7 ground control points (GCPs) were established in the field and georeferenced using an RTK GNSS system.
In parallel, LiDAR data processing included the point cloud classification based on pulse return characteristics, enabling effective separation of ground features from vegetation.

3.2. Geophysical Investigation

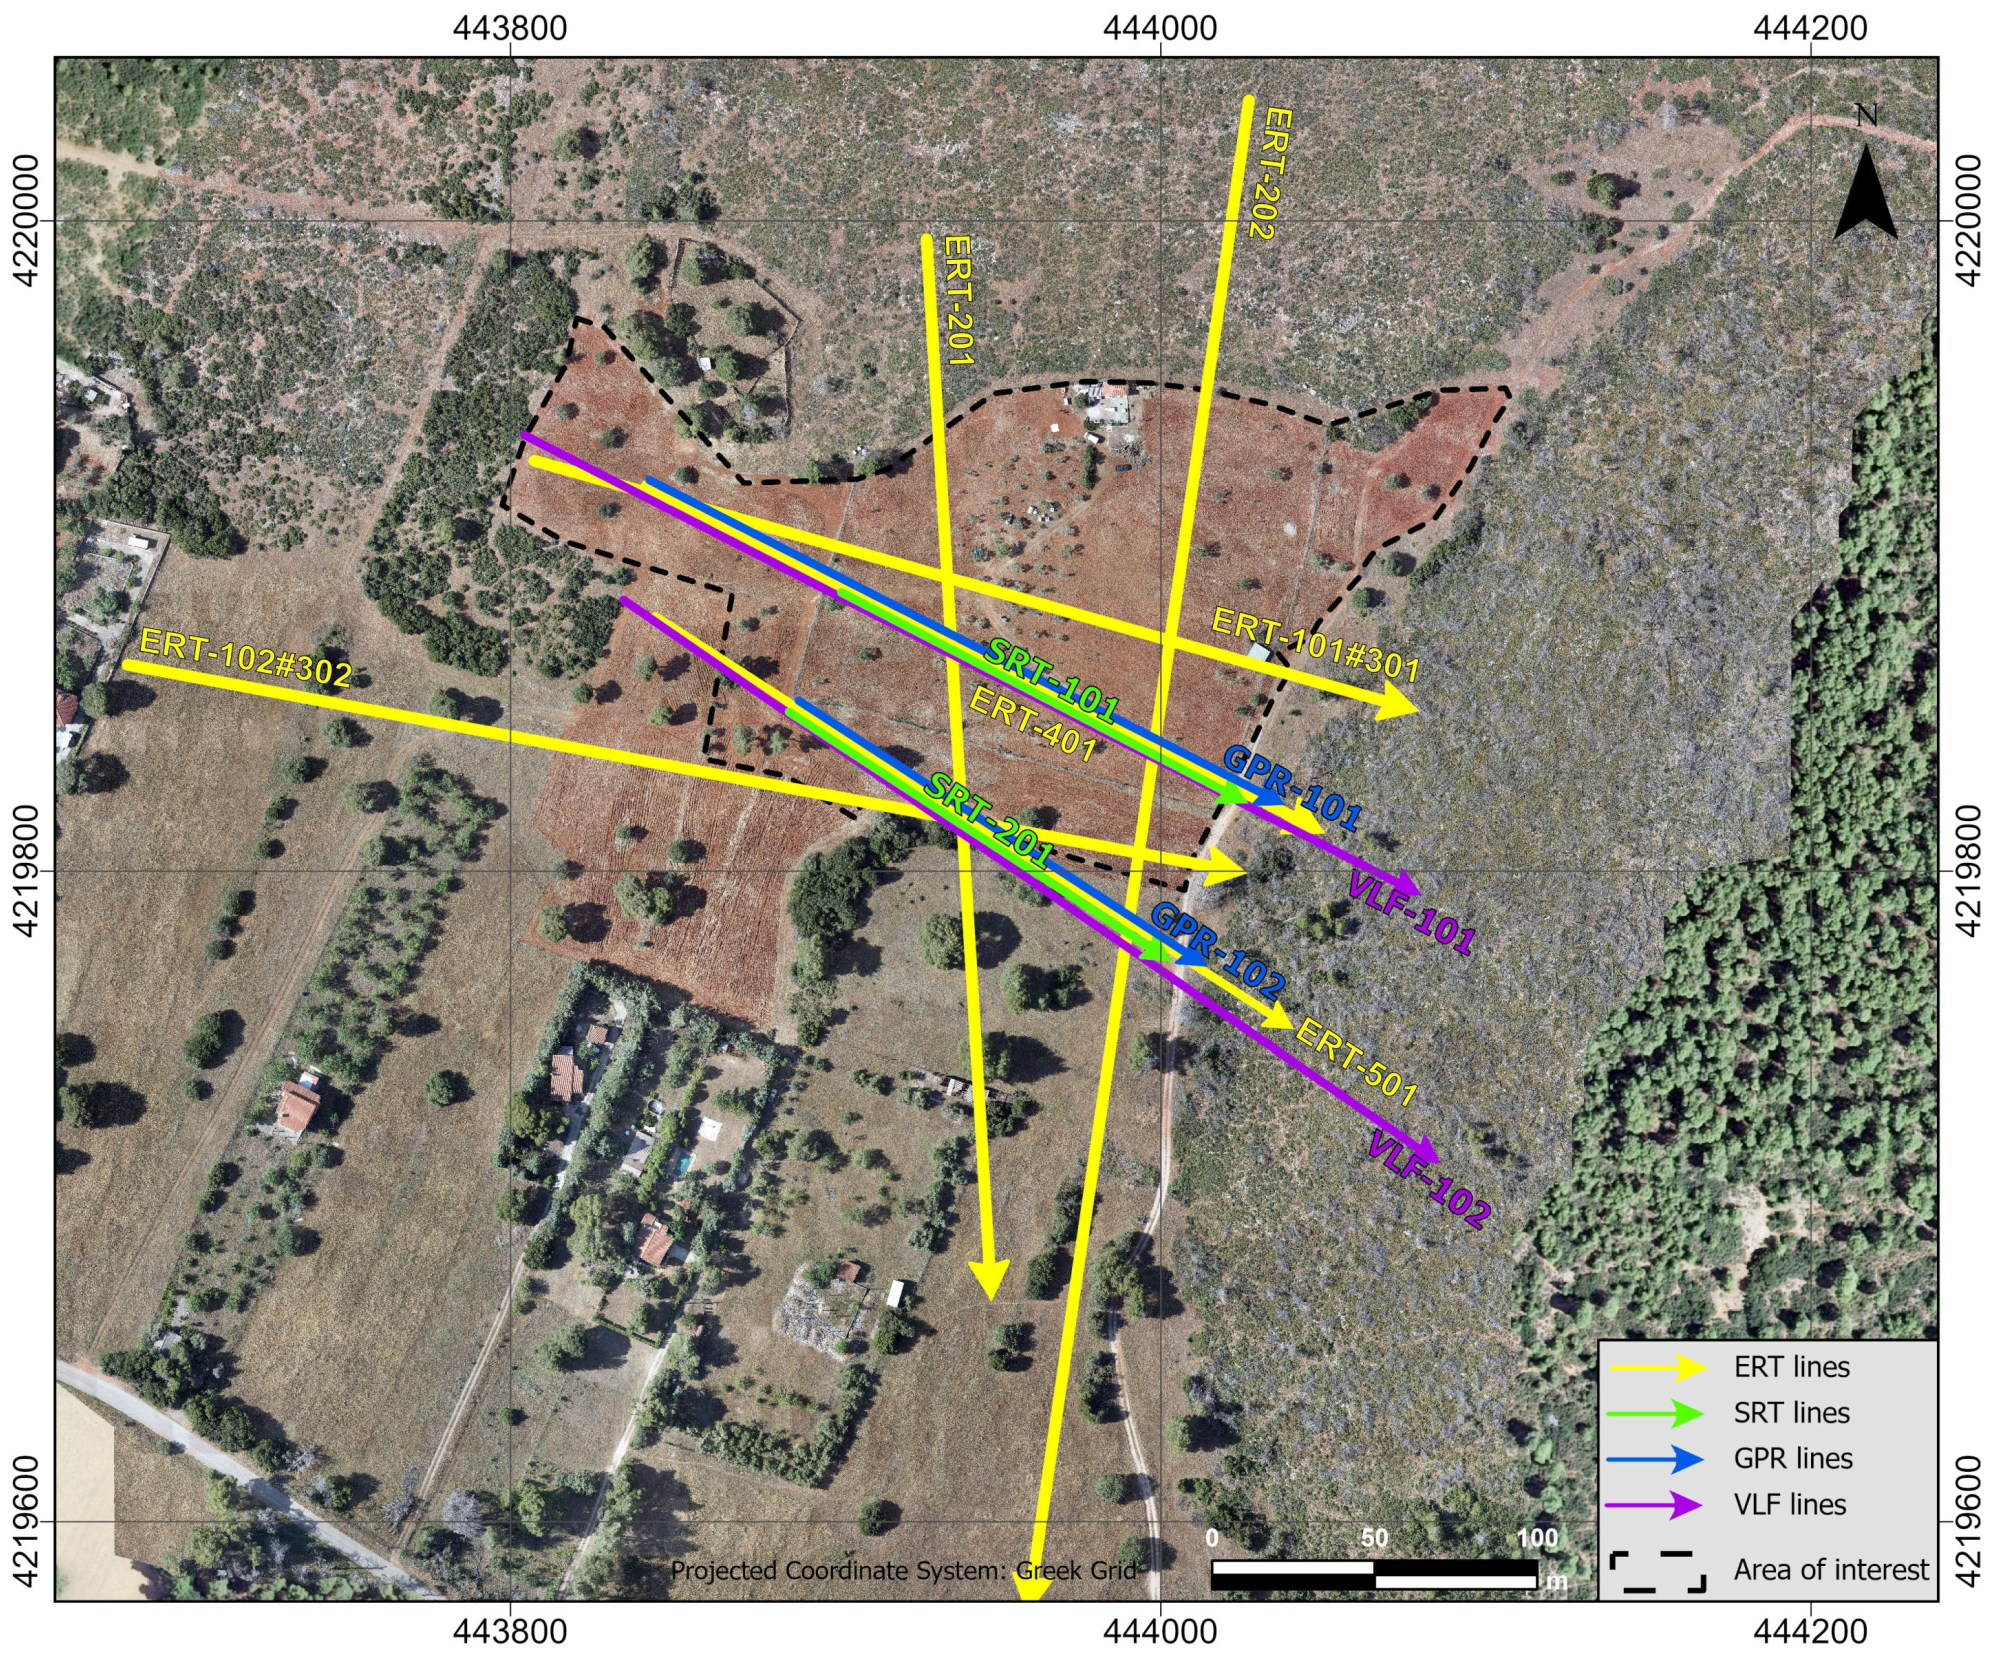
A multidisciplinary geophysical investigation was carried out in the study area to efficiently characterize the subsurface structure and the properties of the lithological formations present. The thickness of the alluvial deposits, the presence of karstic voids, and the subsurface water storage were the key points of this investigation. To accomplish these goals, four geophysical techniques were selected: the Electrical Resistivity Tomography (ERT), Seismic Refraction Tomography (SRT), Ground Penetrating Radar (GPR), and Very Low Frequency electromagnetic (VLF) techniques. Figure 4 illustrates the acquisition layout of all applied geophysical techniques. The integrated application of these techniques is expected to provide a comprehensive understanding of the geological and hydrological conditions of the area.
The design of the geophysical survey lines aimed to maximize spatial coverage of the study area in multiple orientations, while remaining constrained by site accessibility. For example, the abrupt change of the topographic relief to the eastern part of the study area prevented the extension of profiles in that direction. Moreover, the building located along the northern boundary of the area of interest restricted the placement of geophysical profiles in that sector, resulting in a denser concentration of survey lines towards the south. In addition, relatively long profile lengths were selected to achieve greater depths of investigation, in order to assess whether an impermeable formation might underlie the carbonate bedrock and potentially impede further groundwater infiltration. ERT was considered the most suitable technique for the objectives of this study and was therefore employed more extensively than the other techniques. In locations where ERT profiles revealed features of particular interest, complementary SRT, GPR, and VLF surveys were conducted to confirm, refine, and enhance the interpretation of the results. The acquisition parameters of all the applied geophysical techniques are presented in Table 1.
The subsurface configuration of unconsolidated alluvial deposits (Q) overlying the karstified carbonate bedrock (TRm) is expected to produce distinctive geophysical responses in the applied investigation techniques. More specifically, the ERT technique is anticipated to reveal a pronounced resistivity contrast between the alluvial deposits, which typically exhibit moderate resistivity values, and the underlying carbonate bedrock, expected to display very high resistivities due to the intense karstification and fracturing. On the other hand, in zones where groundwater is present, a decrease in the resistivity values is expected. Similarly, P-wave seismic velocities are likely to significantly differ, with lower values in the unconsolidated alluvium and significantly higher velocities in the competent carbonate substrate. Additionally, the GPR survey is also expected to detect a strong reflection at the interface between the alluvial cover and the carbonate basement, as well as from air-filled voids within the carbonate formation, attributable to the intense contrast of the dielectric constant between these materials.
All the necessary topographic measurements for mapping the points of interest and the topographic correction of all the geophysical measurements were carried out using the GNSS (Global Navigation Satellite System) receiver Kolida K5 UFO, via the application of RTK-NTRIP (Real Time Kinematics-Networked Transport of RTCM via Internet Protocol) technique.

3.2.1. Electrical Resistivity Tomography (ERT)

The ERT technique relies on the distribution of resistivity that characterizes the subsurface lithological formations. The fundamental parameters that govern the electrical resistivity values are the material properties, including its mineralogical composition, porosity percentage, and filling material (air, water, or soil). Consequently, it is possible to interpret the aforementioned parameters based on the variation of subsurface resistivity. The subsurface resistivity distribution can be determined through a series of measurements at several depths along the surface, by injecting current into the subsurface and measuring the potential difference that arises at specified points. These points are located between pre-positioned multiple electrodes along a designated line on the ground. The electrodes are evenly spaced at a constant value along the line, according to the desired resolution and investigation depth. Each measurement point is derived from the combination of four electrodes (quadripole), two for current injection and two for potential difference. The geoelectrical device acquires all possible combinations of quadripoles derived from the total number of pre-located electrodes.
The geoelectrical measurements were conducted across 6 sections (Figure 4), within variable electrode spacing intervals (3 to 10 m), depending on the area available for deployment. Two of the ERT profiles were acquired with different electrode spacing intervals (i.e., ERT 101#301–6 and 3 m and ERT 102#302–8 and 4 m) in order to achieve both greater investigation depth and high-resolution results. Data acquisition was performed using the IRIS Instruments (Orleans, France) Syscal Pro Switch 48 resistivity unit equipped with 48 electrodes. Across each profile, three different electrode configurations, Wenner, Wenner–Schlumberger, and Dipole–Dipole, were employed to evaluate their varying sensitivities to changes in subsurface electrical resistivity. The electrode sequences for each ERT profile were generated with Electre Pro software V02.09.01, customized based on the geometric features of each profile. These sequences were then uploaded to the resistivity unit to enable automated data collection.
The collected geoelectrical data were processed using Res2DInv software v.4.9.11 by Geotomo (Houston, TX, USA). Before the main processing, a comprehensive quality control check was performed to detect and eliminate noisy or inconsistent data points. For the inversion process, a modified form of the Gauss–Newton least-squares algorithm was used, incorporating a smoothness-constrained least-squares approach [55,56]. Additionally, the forward model calculations were carried out using the finite element method.

3.2.2. Seismic Refraction Tomography (SRT)

In this study, the P-wave subsurface velocity distribution was investigated through the implementation of the Seismic Refraction Tomography (SRT), a widely adopted geophysical technique for subsurface characterization and estimation of bedrock depth. The method is based on the accurate measurement of seismic wave travel times, which are generated by a controlled seismic source, typically a sledgehammer, at multiple shot points along the survey line. The first arrival times of the direct and refracted waves are subjected to detailed analysis to construct travel-time curves, from which an initial subsurface velocity model is derived. Subsequently, the initial model undergoes iterative refinement through the application of an inversion algorithm, designed to minimize the misfit between observed and computed travel times [57].
Seismic data were acquired along 2 seismic lines, SRT-101 and SRT-201, of 141 m total length, which coincide with the ERT-401 and ERT-501 lines, respectively (Figure 4). A total set of 48 geophones with a frequency of 4.5 Hz was implemented, evenly spaced at a 3 m distance. Seismic energy generation was accomplished utilizing a 6.5 kg seismic sledgehammer, deployed at 11 shotpoints along the survey profile. To increase the penetration depth, two outshots were performed at 30 m distance beyond each end of the seismic line. Unfortunately, the produced seismic energy was not sufficient to provide clear first arrival times for the entire length of the profile. The remaining 9 shotpoints were arranged within the active spread at regular intervals of 17.5 m, providing optimal ray path coverage through the subsurface medium and optimizing tomographic resolution. Data acquisition was carried out using a 48-channel Geometrics (San Jose, CA, USA) StrataView seismograph, operating with a sampling interval of 0.250 ms and a total recording duration of 512 ms.
Seismic data processing was performed using the DW Tomo module of the Geogiga Seismic Pro software v10.0 (Geogiga tech. Corp., Calgary, AB, Canada). Prior to inversion, Butterworth filtering and gain adjustment of the seismic traces were implemented on the acquired seismic records to enhance the clarity of the P-wave first arrivals. Subsequently, first arrival times were manually picked across all seismic records to facilitate the creation of travel-time curves. For the inversion process, an initial gradient velocity model was created based on the results of the intercept-time processing method [58], with P-wave velocity ranging between 600 and 3500 m/s from the surface to 15 m depth. The inversion procedure employed the smoothing-constrained regularized approach [59], with 15.00 and 3.75 m horizontal and vertical smoothing lengths, respectively. Additionally, forward modeling of travel times was conducted using the shortest path algorithm [60], with model discretization defined by horizontal and vertical cell dimensions of 1.50 and 0.75 m, respectively.

3.2.3. Ground Penetrating Radar (GPR)

Ground penetrating radar is a geophysical method that utilizes the ability of electromagnetic waves to propagate in the subsurface medium and reflect/refract in different materials, characterized by variations in a physical parameter called dielectric constant. The GPR system consists of a central frequency antenna that generates (transmitter) radio waves (~10–1000 MHz) and receives the reflected energy, measuring the time required for the signal to reach a subsurface target and reflect back to the surface (two-way travel-time). The propagation depth of the GPR is strongly dependent on the conductivity of the medium and the central frequency of the antenna.
The GPR equipment used for the present study consisted of a bistatic, shielded 100 MHz antenna provided by Sensors & Software (Noggin 100), along with an odometer wheel and a record control unit. The odometer wheel is responsible for measuring the distance coverage and for triggering the electromagnetic pulse transmission. GPR measurements were conducted along 2 lines (GPR-101 and GPR-102), which coincide with the “ERT-401 and ERT-501” and “SRT-101 and SRT-201” profiles (Figure 4). A step size of 5 cm was incorporated for the electromagnetic pulse transmission interval, in which several stacks were conducted utilizing a unique feature of the system (DynaQ), to automatically determine the required number of stacks depending on the reflection intensity of the received signal. Furthermore, the electromagnetic wave velocity of the subsurface medium was set to 0.12 m/ns, as indicated for limestone-structured environments.
GPR data were processed using the EKKO_Project 6 software provided by Sensors & Software, utilizing a typical filtering procedure with the application of dewow, background removal, bandpass, SEC gain, and migration filters.

3.2.4. Very Low Frequency Method (VLF)

The very low frequency electromagnetic geophysical method is based on the emission of a primary electromagnetic field, generated by globally distributed military VLF transmitters. This electromagnetic field is characterized by a vertical electric component and a horizontal magnetic component. The horizontal magnetic field component penetrates the ground and induces a secondary horizontal electric field within the subsurface. This induced electric field subsequently generates a secondary magnetic field with both horizontal and vertical components. The secondary field consists of two parts: the in-phase (real) and the out-of-phase (quadrature) ones. The strength and distribution of these secondary fields are governed by the conductivity properties of the subsurface materials.
The Very Low Frequency (VLF) survey was conducted along two profiles (VLF-101 and VLF-201) that coincide with previously established ERT, SRT, and GPR lines (Figure 4). Each VLF line extended to 300 m in length using a primary VLF source frequency of 23.4 kHz. Measurements were acquired at 5 m intervals using the ABEM WADI VLF system. The raw data were smoothed, and topographic corrections according to [61] were applied. Subsequent data processing was carried out using the KHFFILT 1.0 software package [62], which involved the application of the Frazer and Karous–Hjelt filtering techniques [63,64,65] to estimate the spatial distribution of subsurface current’s density distribution. To further enhance interpretability, a 2D inversion of the VLF data, incorporating topographic correction, was performed using the Inv2DVLF 1.0 software [66,67]. This inversion procedure enabled the transformation of current density distribution into resistivity models based on the scalar tipper originating from the relation of horizontal and vertical magnetic components. An initial resistivity of 1500 Ohm.m was attributed to the inversion according to the dominant resistivity of the area. This procedure provides comparable results with those of detailed ERT measurements [37,41,68,69].

4. Results and Discussion

4.1. Remote Sensing

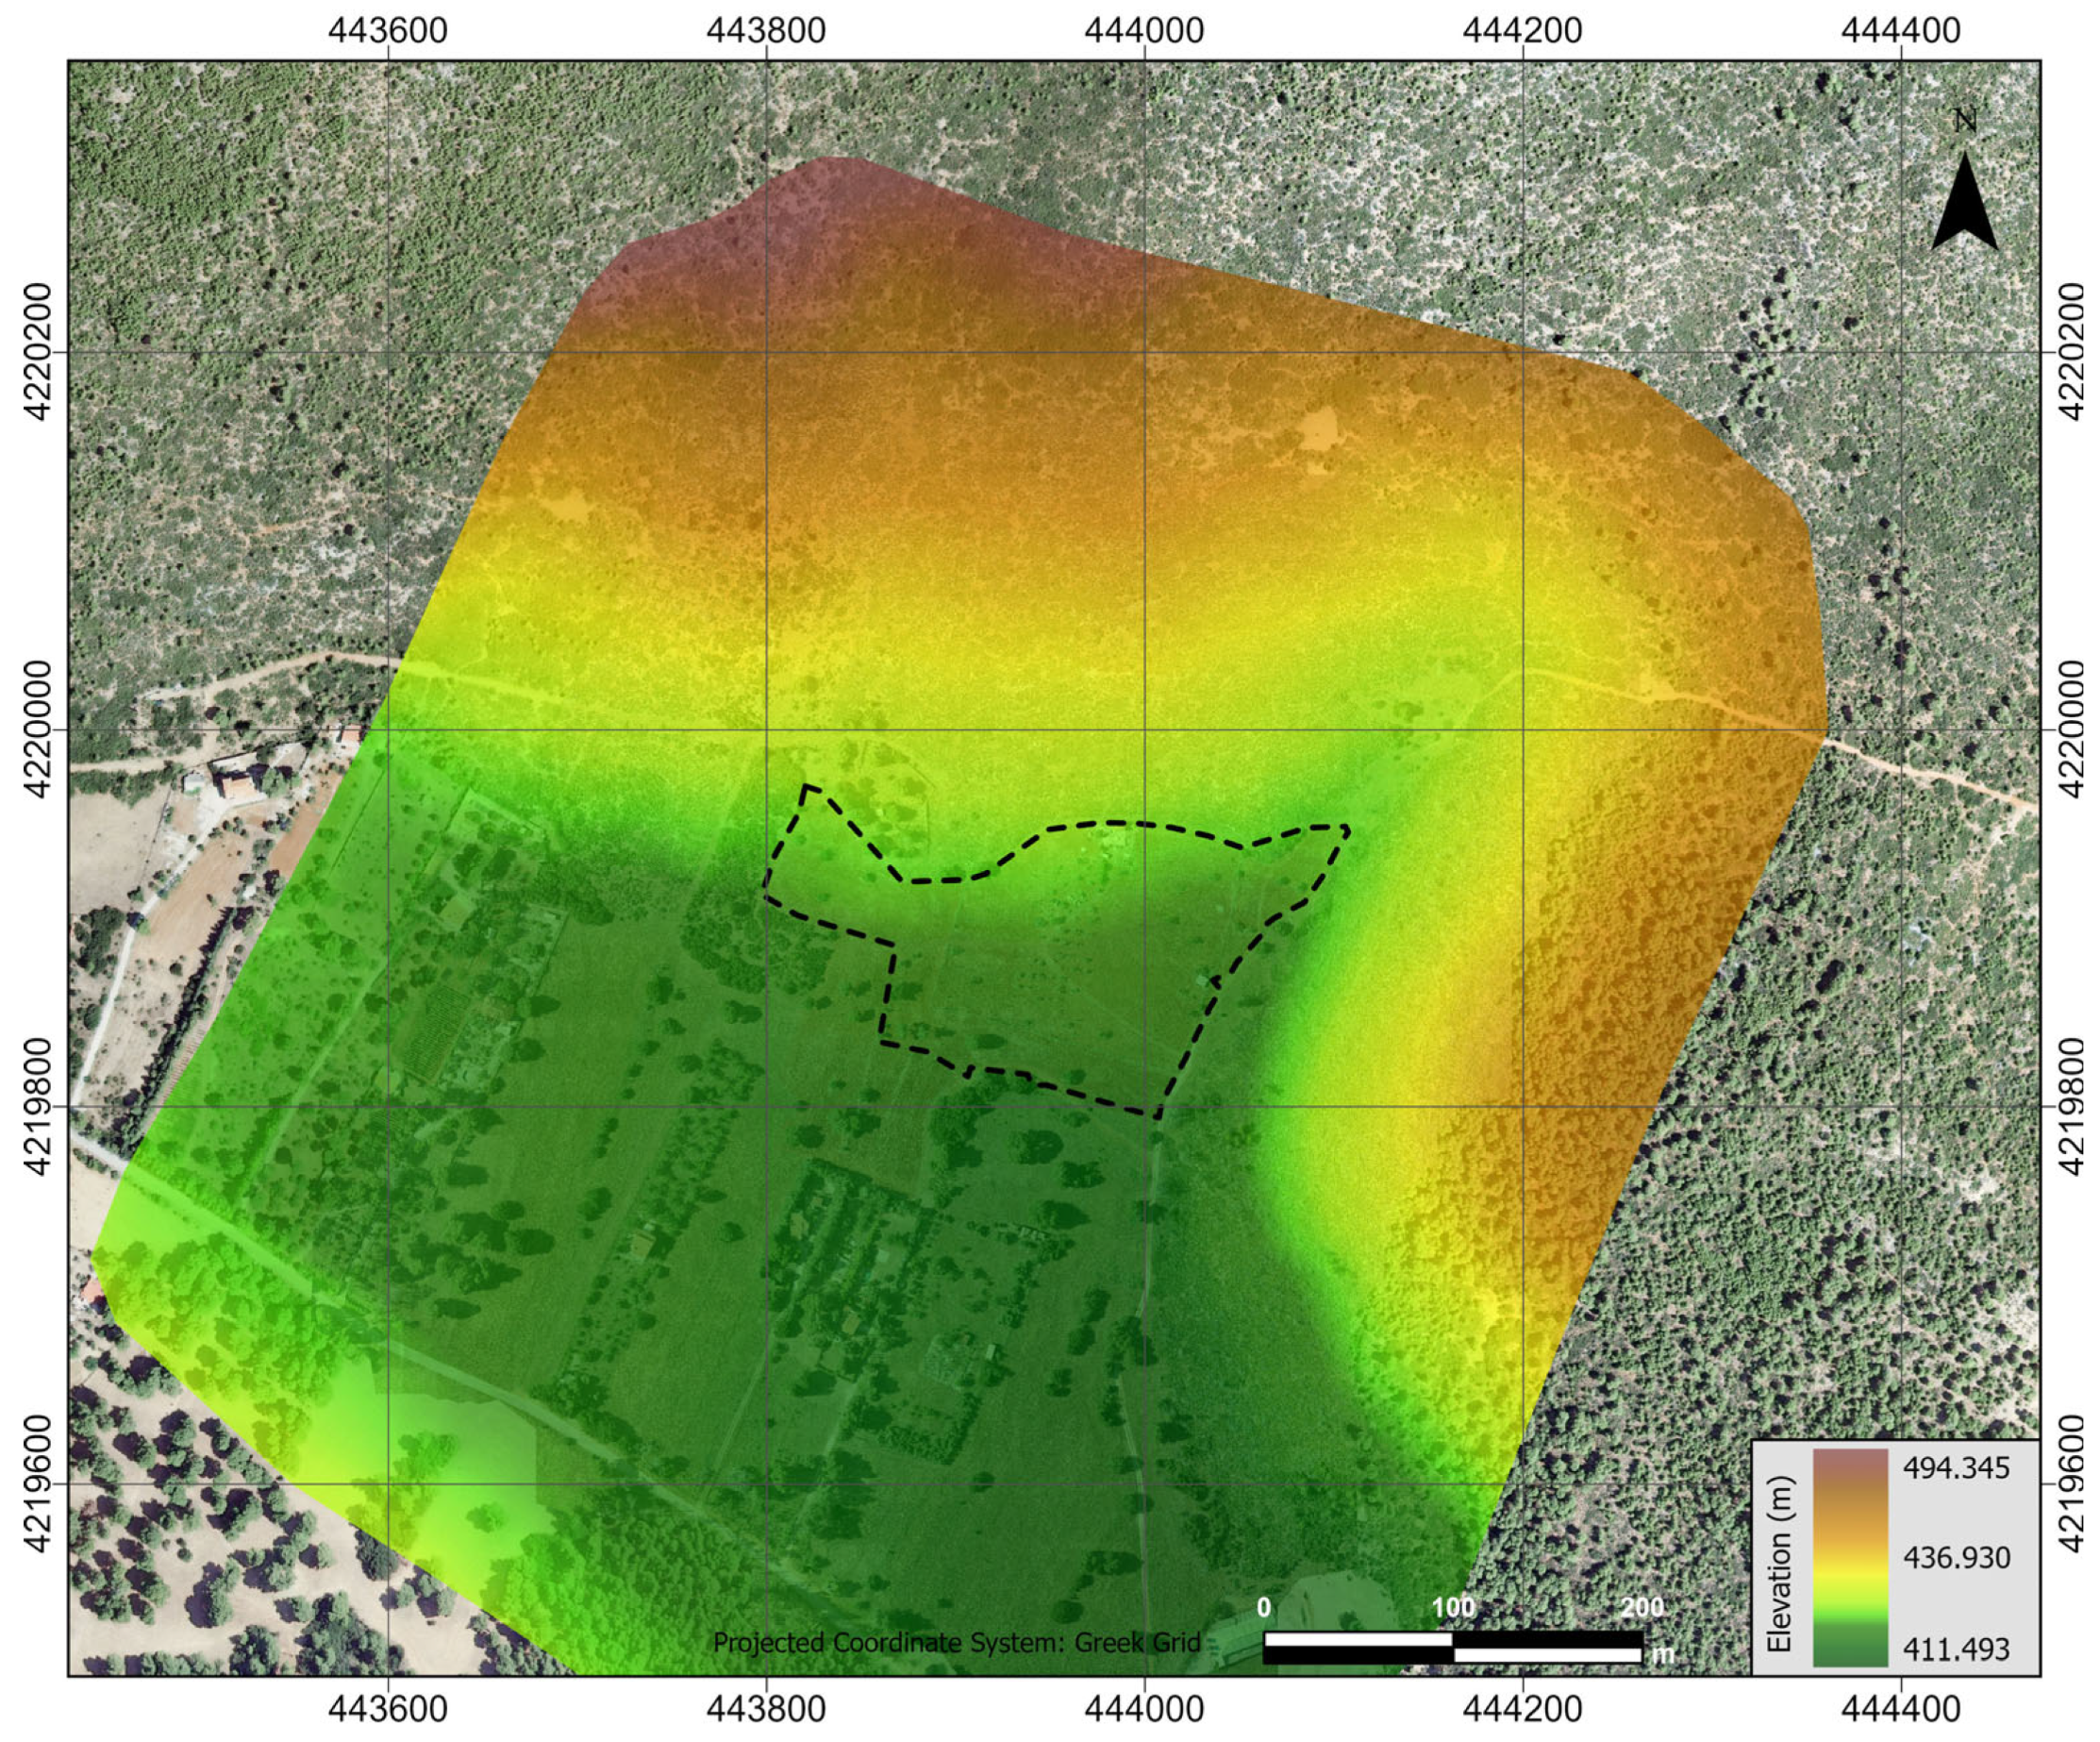
The detailed geomorphological mapping of the whole study area was achieved through the generation of high-resolution remote sensing products, by UAV photogrammetry and LiDAR techniques. More specifically, an orthophotomosaic of the area was generated (1.2 cm resolution) after processing the photogrammetry data, while a detailed Digital Elevation Model (DEM) of the area was constructed from the LiDAR data, after the classification of the acquired point cloud and the removal of vegetation (Figure 5).
Through this process, the geomorphological characteristics of the area were highlighted in great detail, enabling the interconnection of the surface geomorphology with the subsurface structure (detailed geophysical survey).
These remote sensing products were utilized in 3D representations of the geophysical results, offering the ability to visualize and understand the spatial development and geometric characteristics of the subsurface geological conditions, contributing to the interpretation of the geophysical results. Although the general slope of the area was obvious, the delineation of geomorphological details was crucial for understanding the hydrogeological conditions in detail.

4.2. Integrated Surface Geophysical Investigation

4.2.1. ERT Results

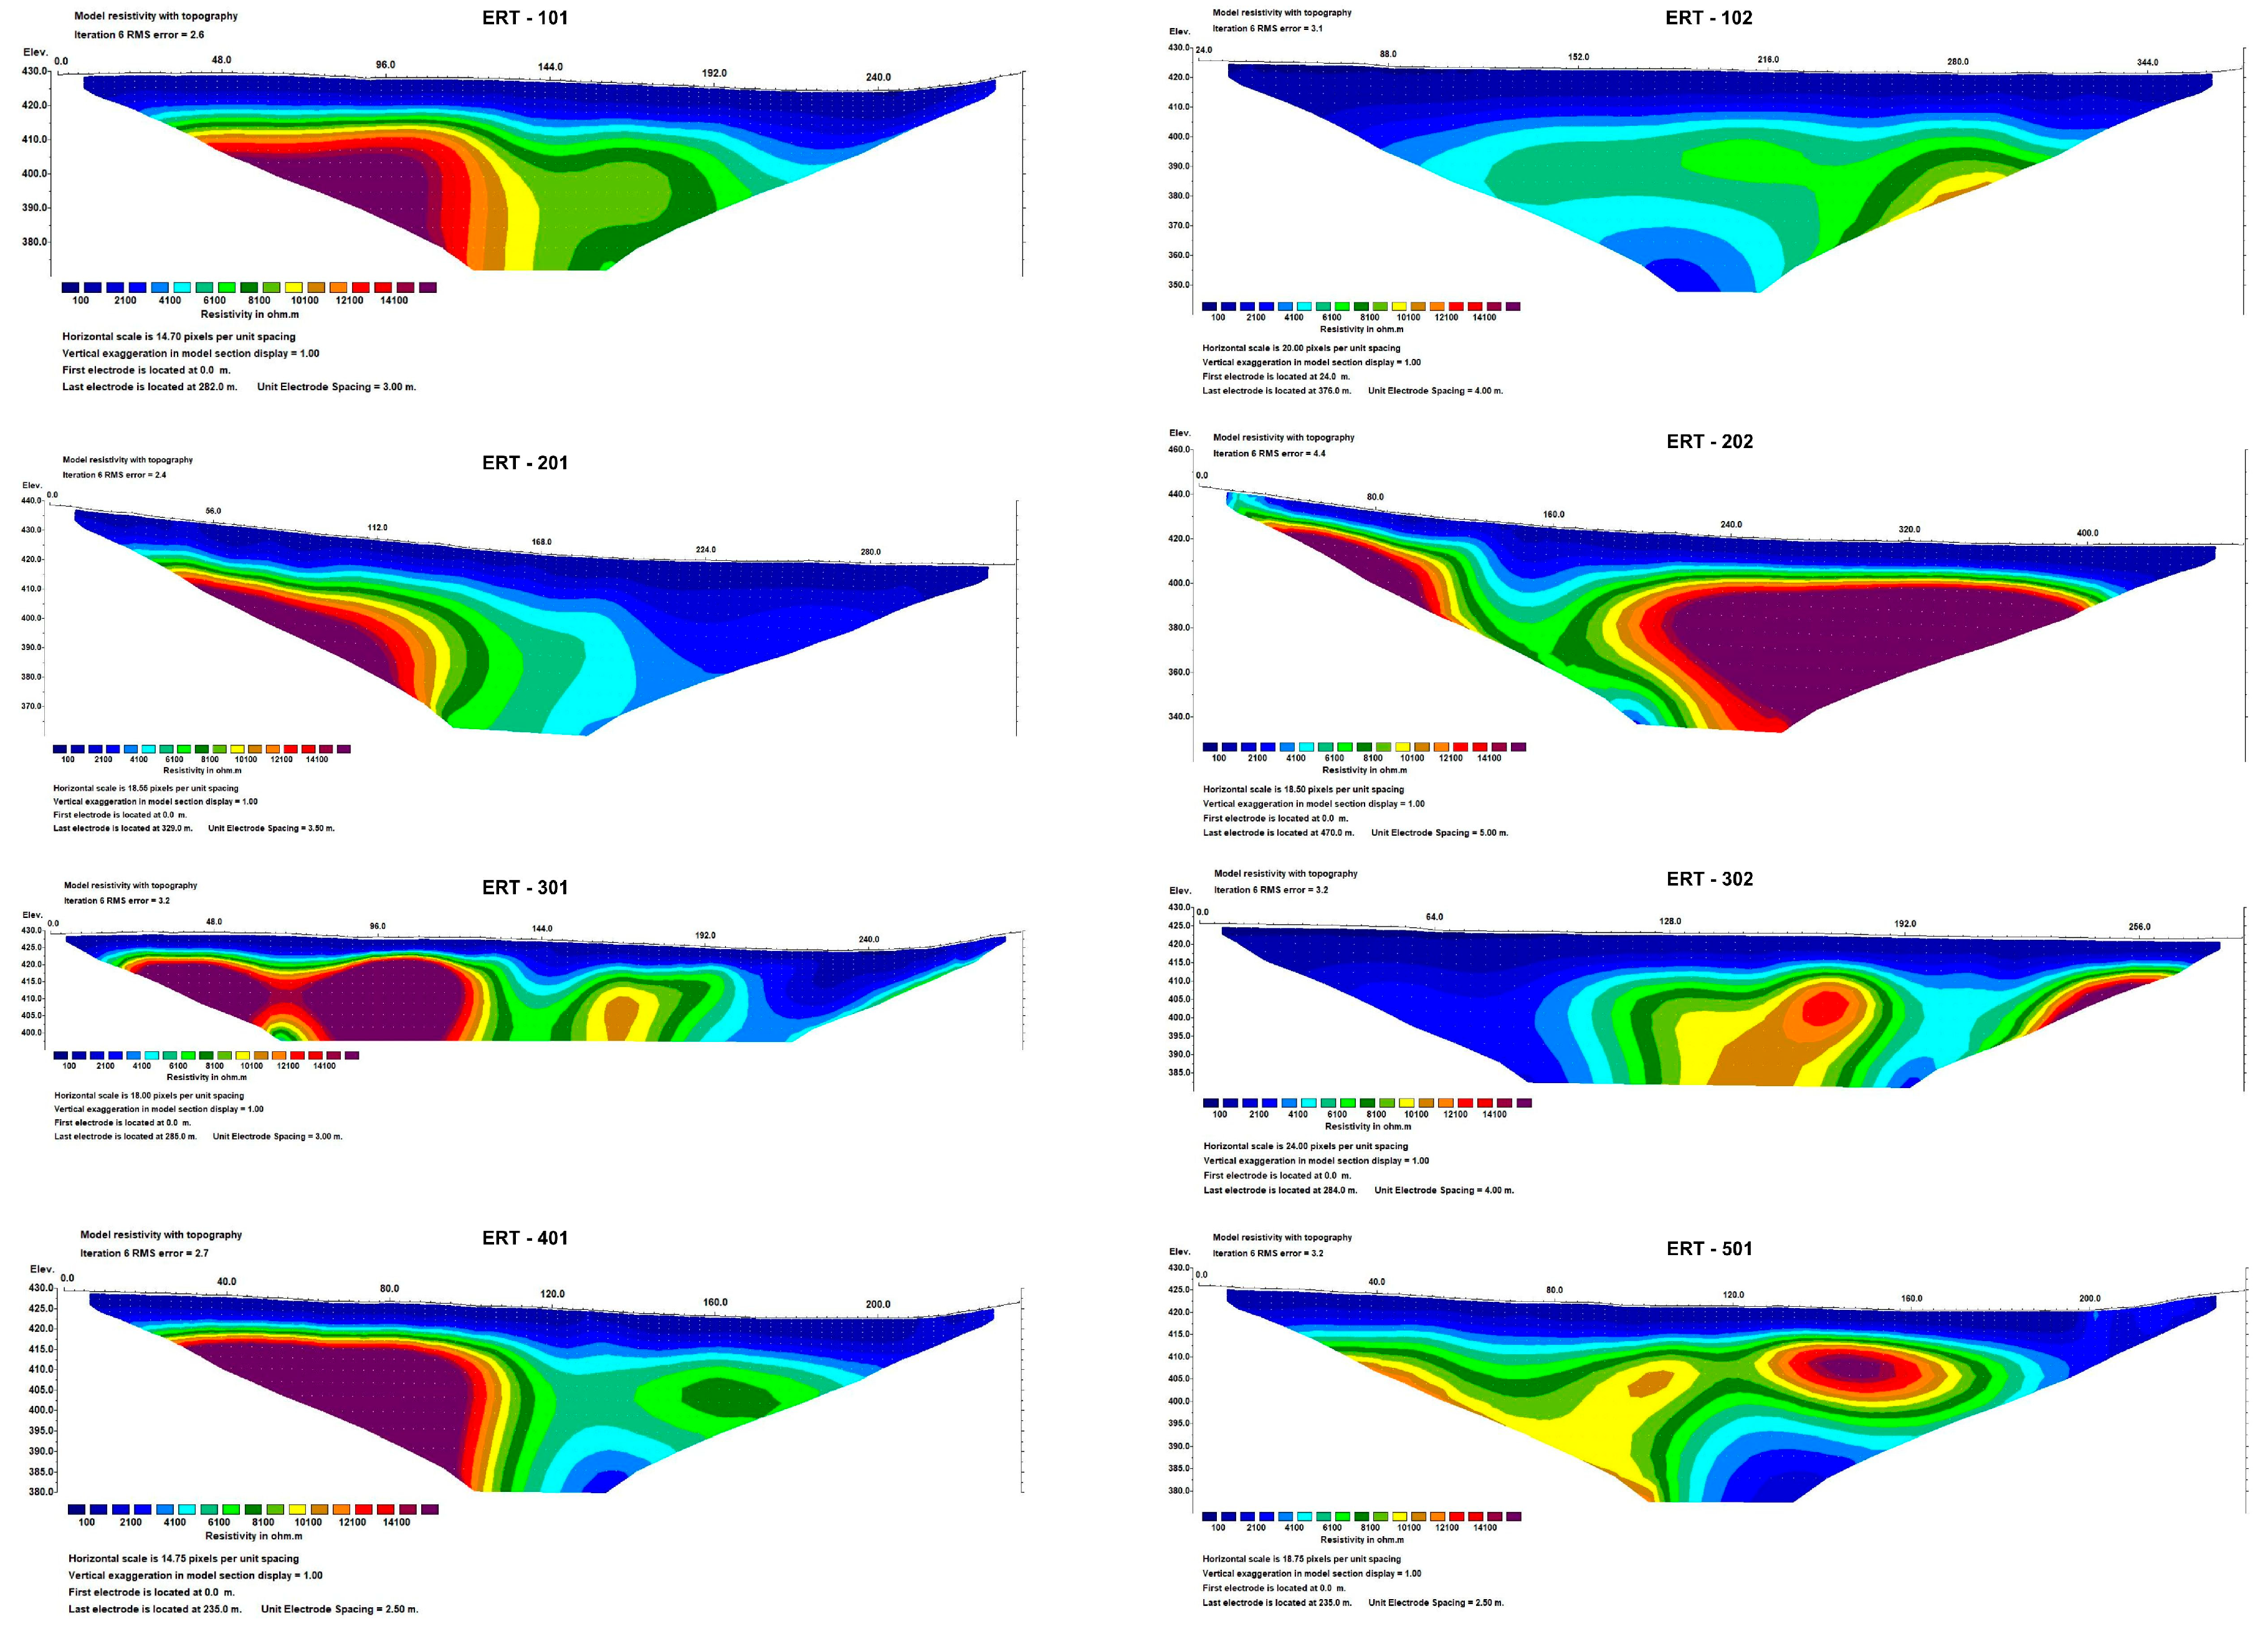
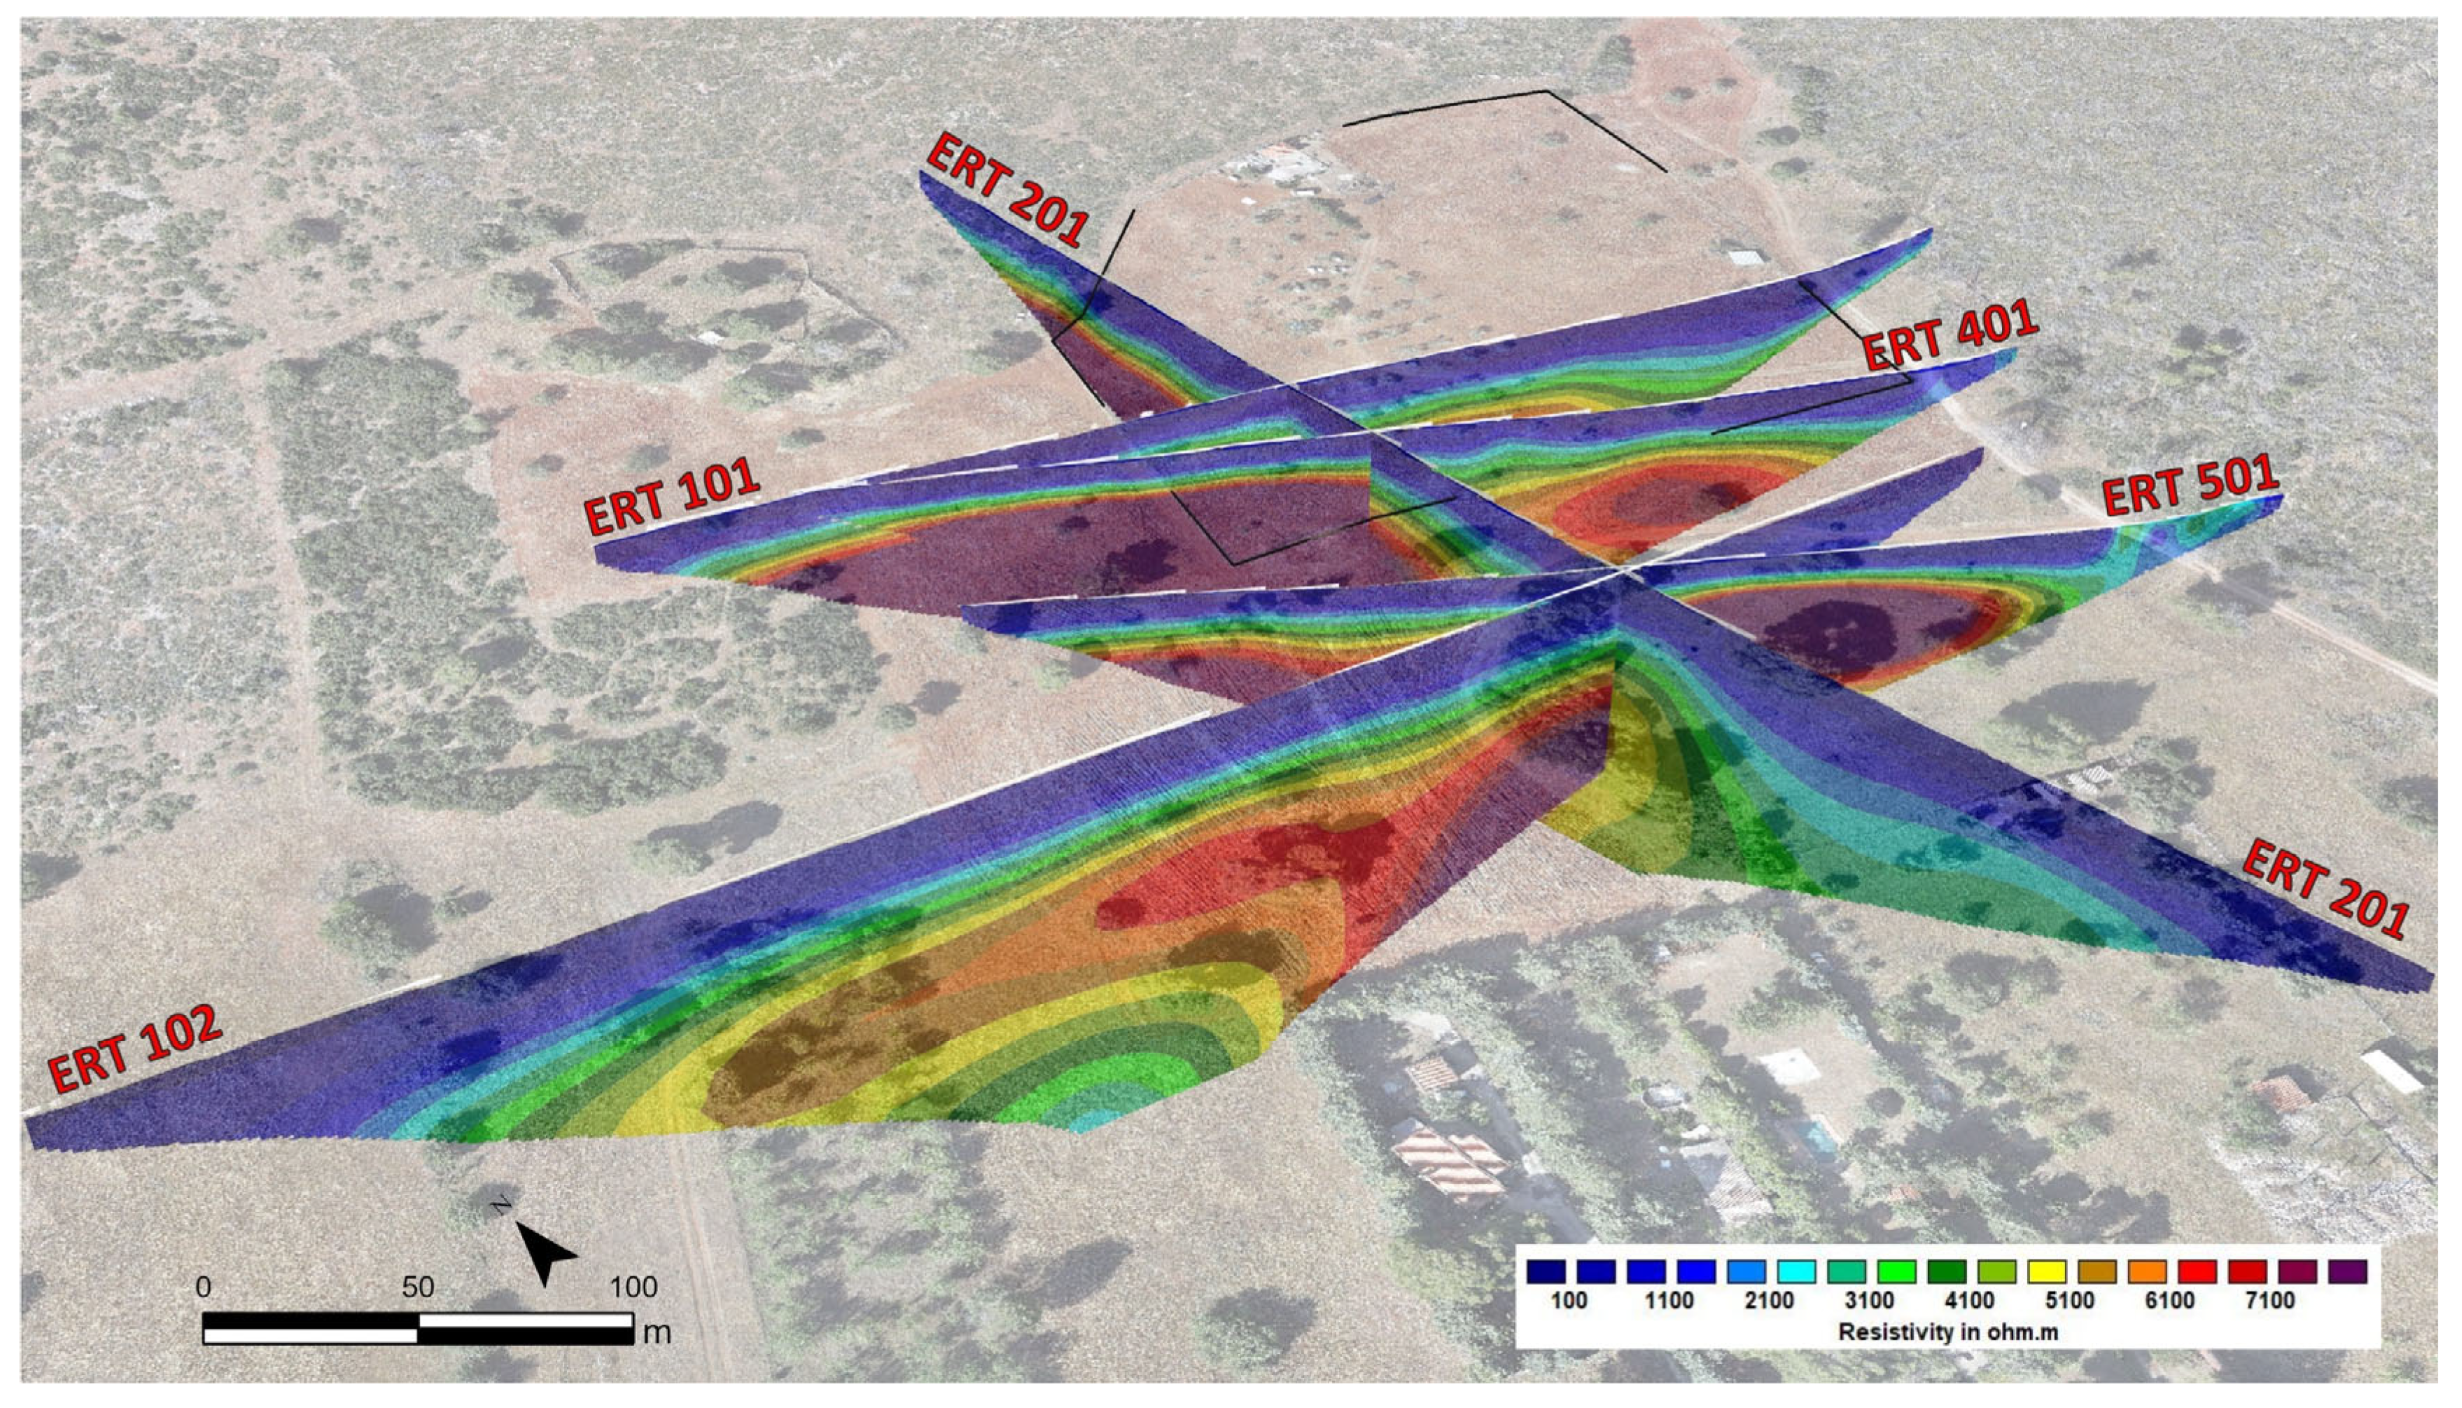
In Figure 6, the 3D representation of all the ERT profiles, except for profile ERT-202, is presented, highlighting an inhomogeneous subsurface structure, as inferred from the strong electrical resistivity variations. The results obtained using the Wenner–Schlumberger electrode configuration were considered the most representative for the study area, providing satisfactory resolution in both the vertical and lateral directions. The ERT-202 profile was excluded from the 3D representation because its large scale would have resulted in a significant loss of detail from the other profiles that are concentrated in the central part of the study area. Furthermore, ERT-202 did not reveal any noteworthy features that are not already depicted in the profiles displayed. All the ERT profiles are presented individually in Figure A1 of the Appendix A section.
The relatively low resistivity values of 100–1000 Ohm.m seem to be constrained in the shallow part of all the ERT profiles, up to 3 m depth. In greater depths, higher resistivity values (>2500 Ohm.m) are investigated, corresponding to the existence of a resistive geoelectrical formation which extends down to the maximum depth of investigation, close to one hundred meters (100 m).
This deeper resistive formation is interrupted by the occurrence of sub-vertical zones of lateral electrical resistivity inhomogeneity. Such zones are located mainly in the central and eastern part of the sections, as shown in Figure 6, with a general NE–SW and NE–SW direction respectively, demonstrating two sub-vertical geoelectric discontinuities.

4.2.2. SRT Results

The 3D representation of the SRT sections (Figure 7) highlights the existence of an upper geoseismic layer that is characterized by low P-wave velocity (600–1300 m/s) and a mean thickness of approximately 3 m. Furthermore, below that layer, a high velocity (>2500 m/s) formation dominates throughout the two SRT profiles, up to the maximum depth of investigation, which is almost 30 m. Within this lower formation, two sub-vertical zones of geoseismic discontinuity are identified in the central and eastern part of the sections, characterized by low velocities (1300–2000 m/s). These zones coincide with the geoelectrical discontinuities that are described above.

4.2.3. GPR Results

The results of the two GPR sections (Figure 8) adumbrate the existence of a strong reflection surface (white dashed line) that prevails throughout the profiles at a depth of almost 3 m and separates two media with different E/M wave propagation velocities. Additionally, in the GPR-102 profile, the results highlight the existence of high velocity (~0.3 m/ns) hyperbolas, at distances of 20, 60, 70, and 85 m (red arrows in Figure 8), which could be indicative of the presence of air voids due to karstification of the geological bedrock formation investigated.

4.2.4. VLF Results

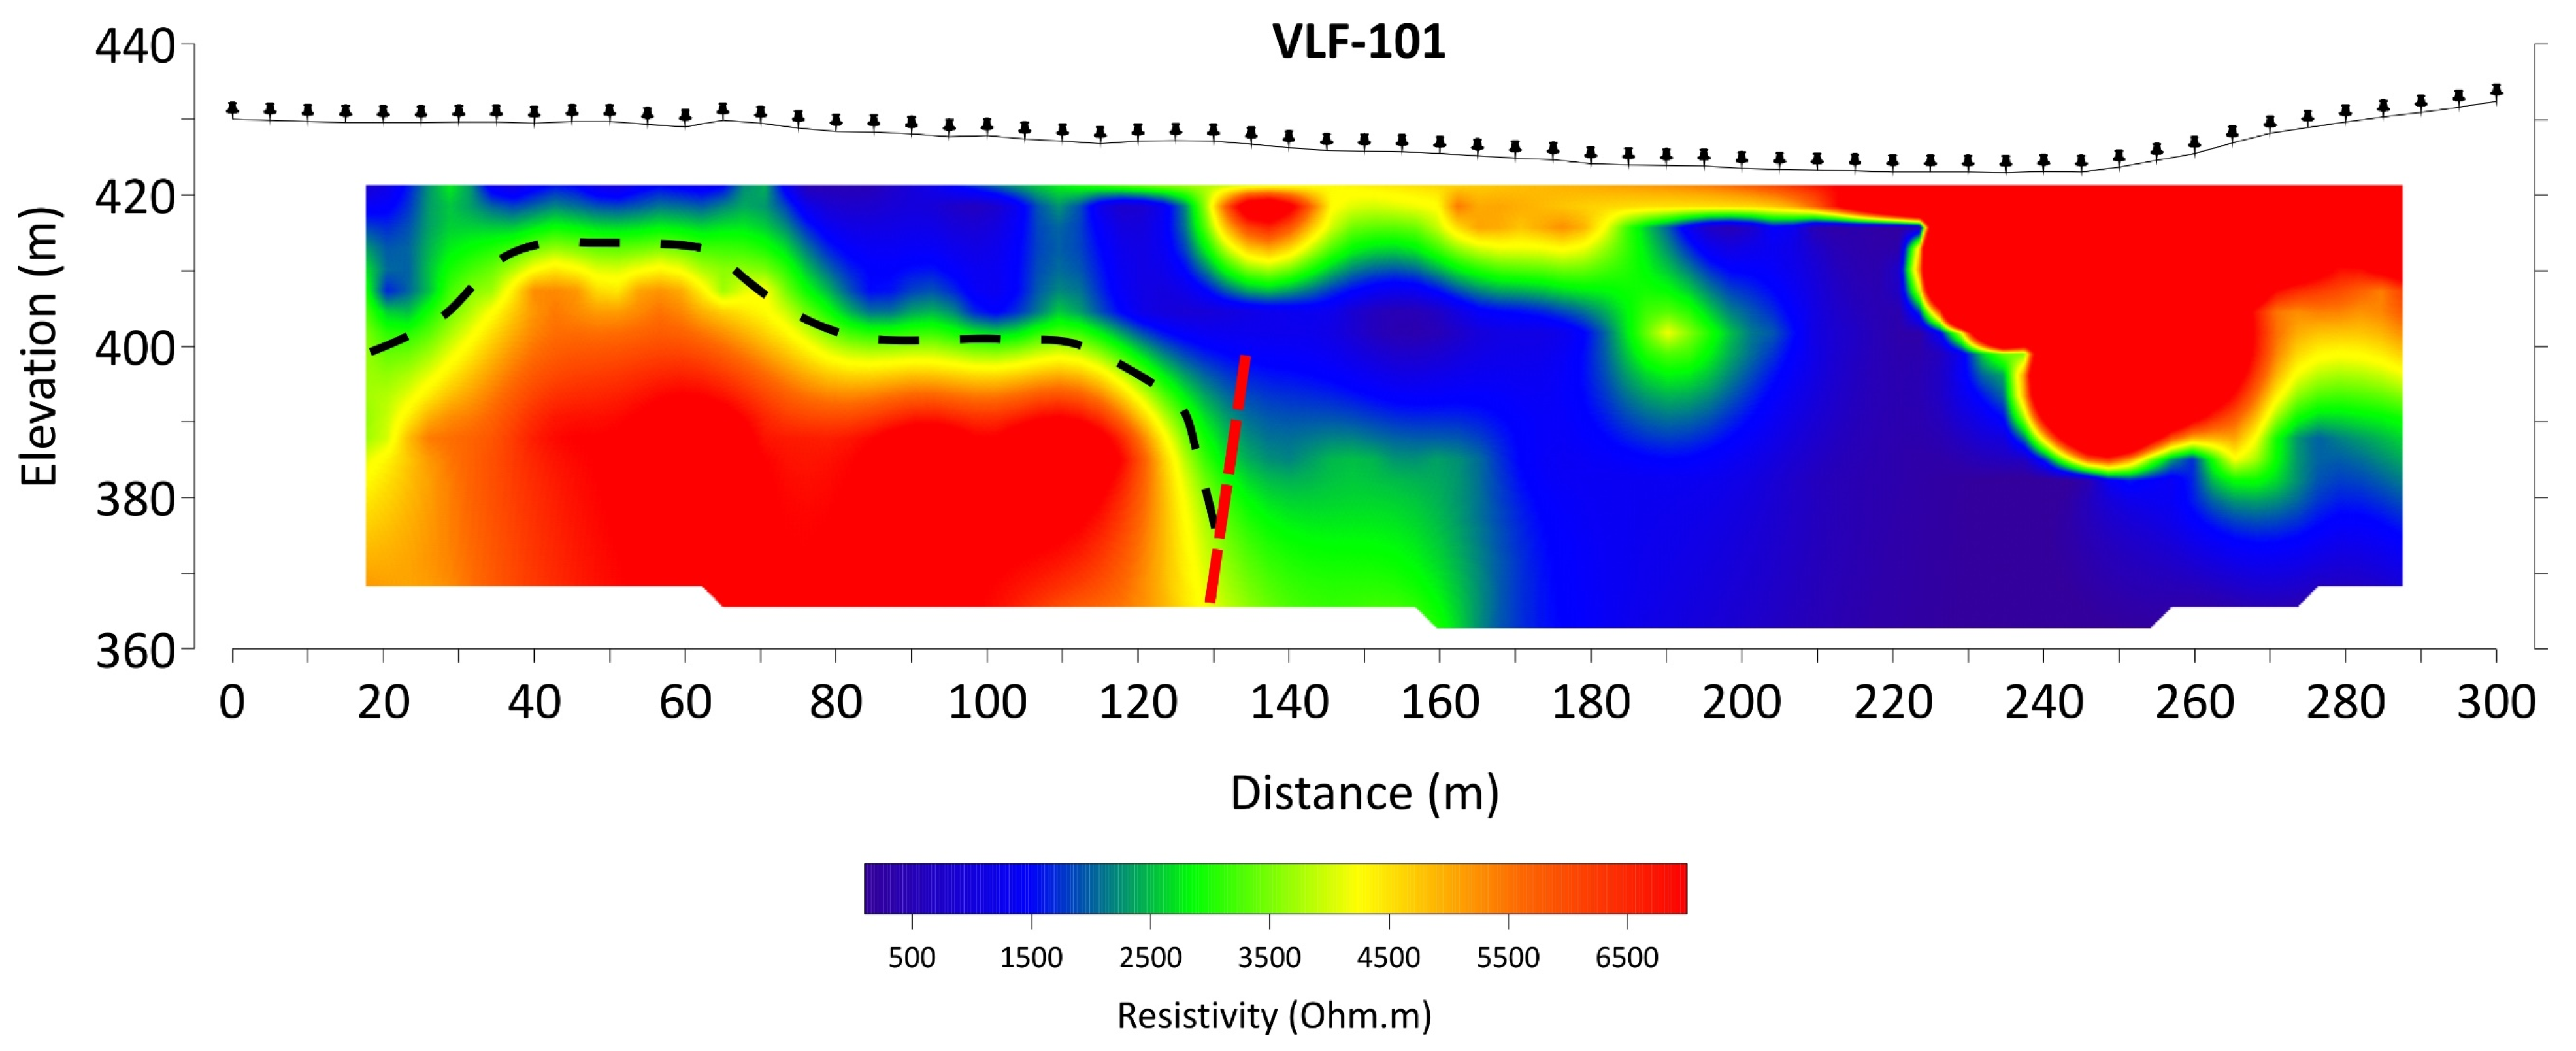
In Figure 9, the indicative results of the VLF-101 section are presented after the processing and 2D inversion of the data. In the first 130 m, the subsurface structure is dominated by the presence of a highly resistive target (>4000 Ohm.m), located at a depth ranging from 10 m to the maximum investigation depth of almost 70 m. The existence of strong resistivity variation can be observed almost 130 m from the start of the line, with values ranging from 6500 down to 500 Ohm.m. This resistive target is in agreement with the ERT results, which also highlight a geophysical target with similar geometric and physical characteristics.
Another resistive layer (up to 6500 Ohm.m) is located close to the surface, at the last 80 m of the section (220–290 m). Unfortunately, during the data acquisition of this part of the section, we faced some noisy data, even though the measurements were repeated multiple times.

4.2.5. Integrated Geophysical Interpretation

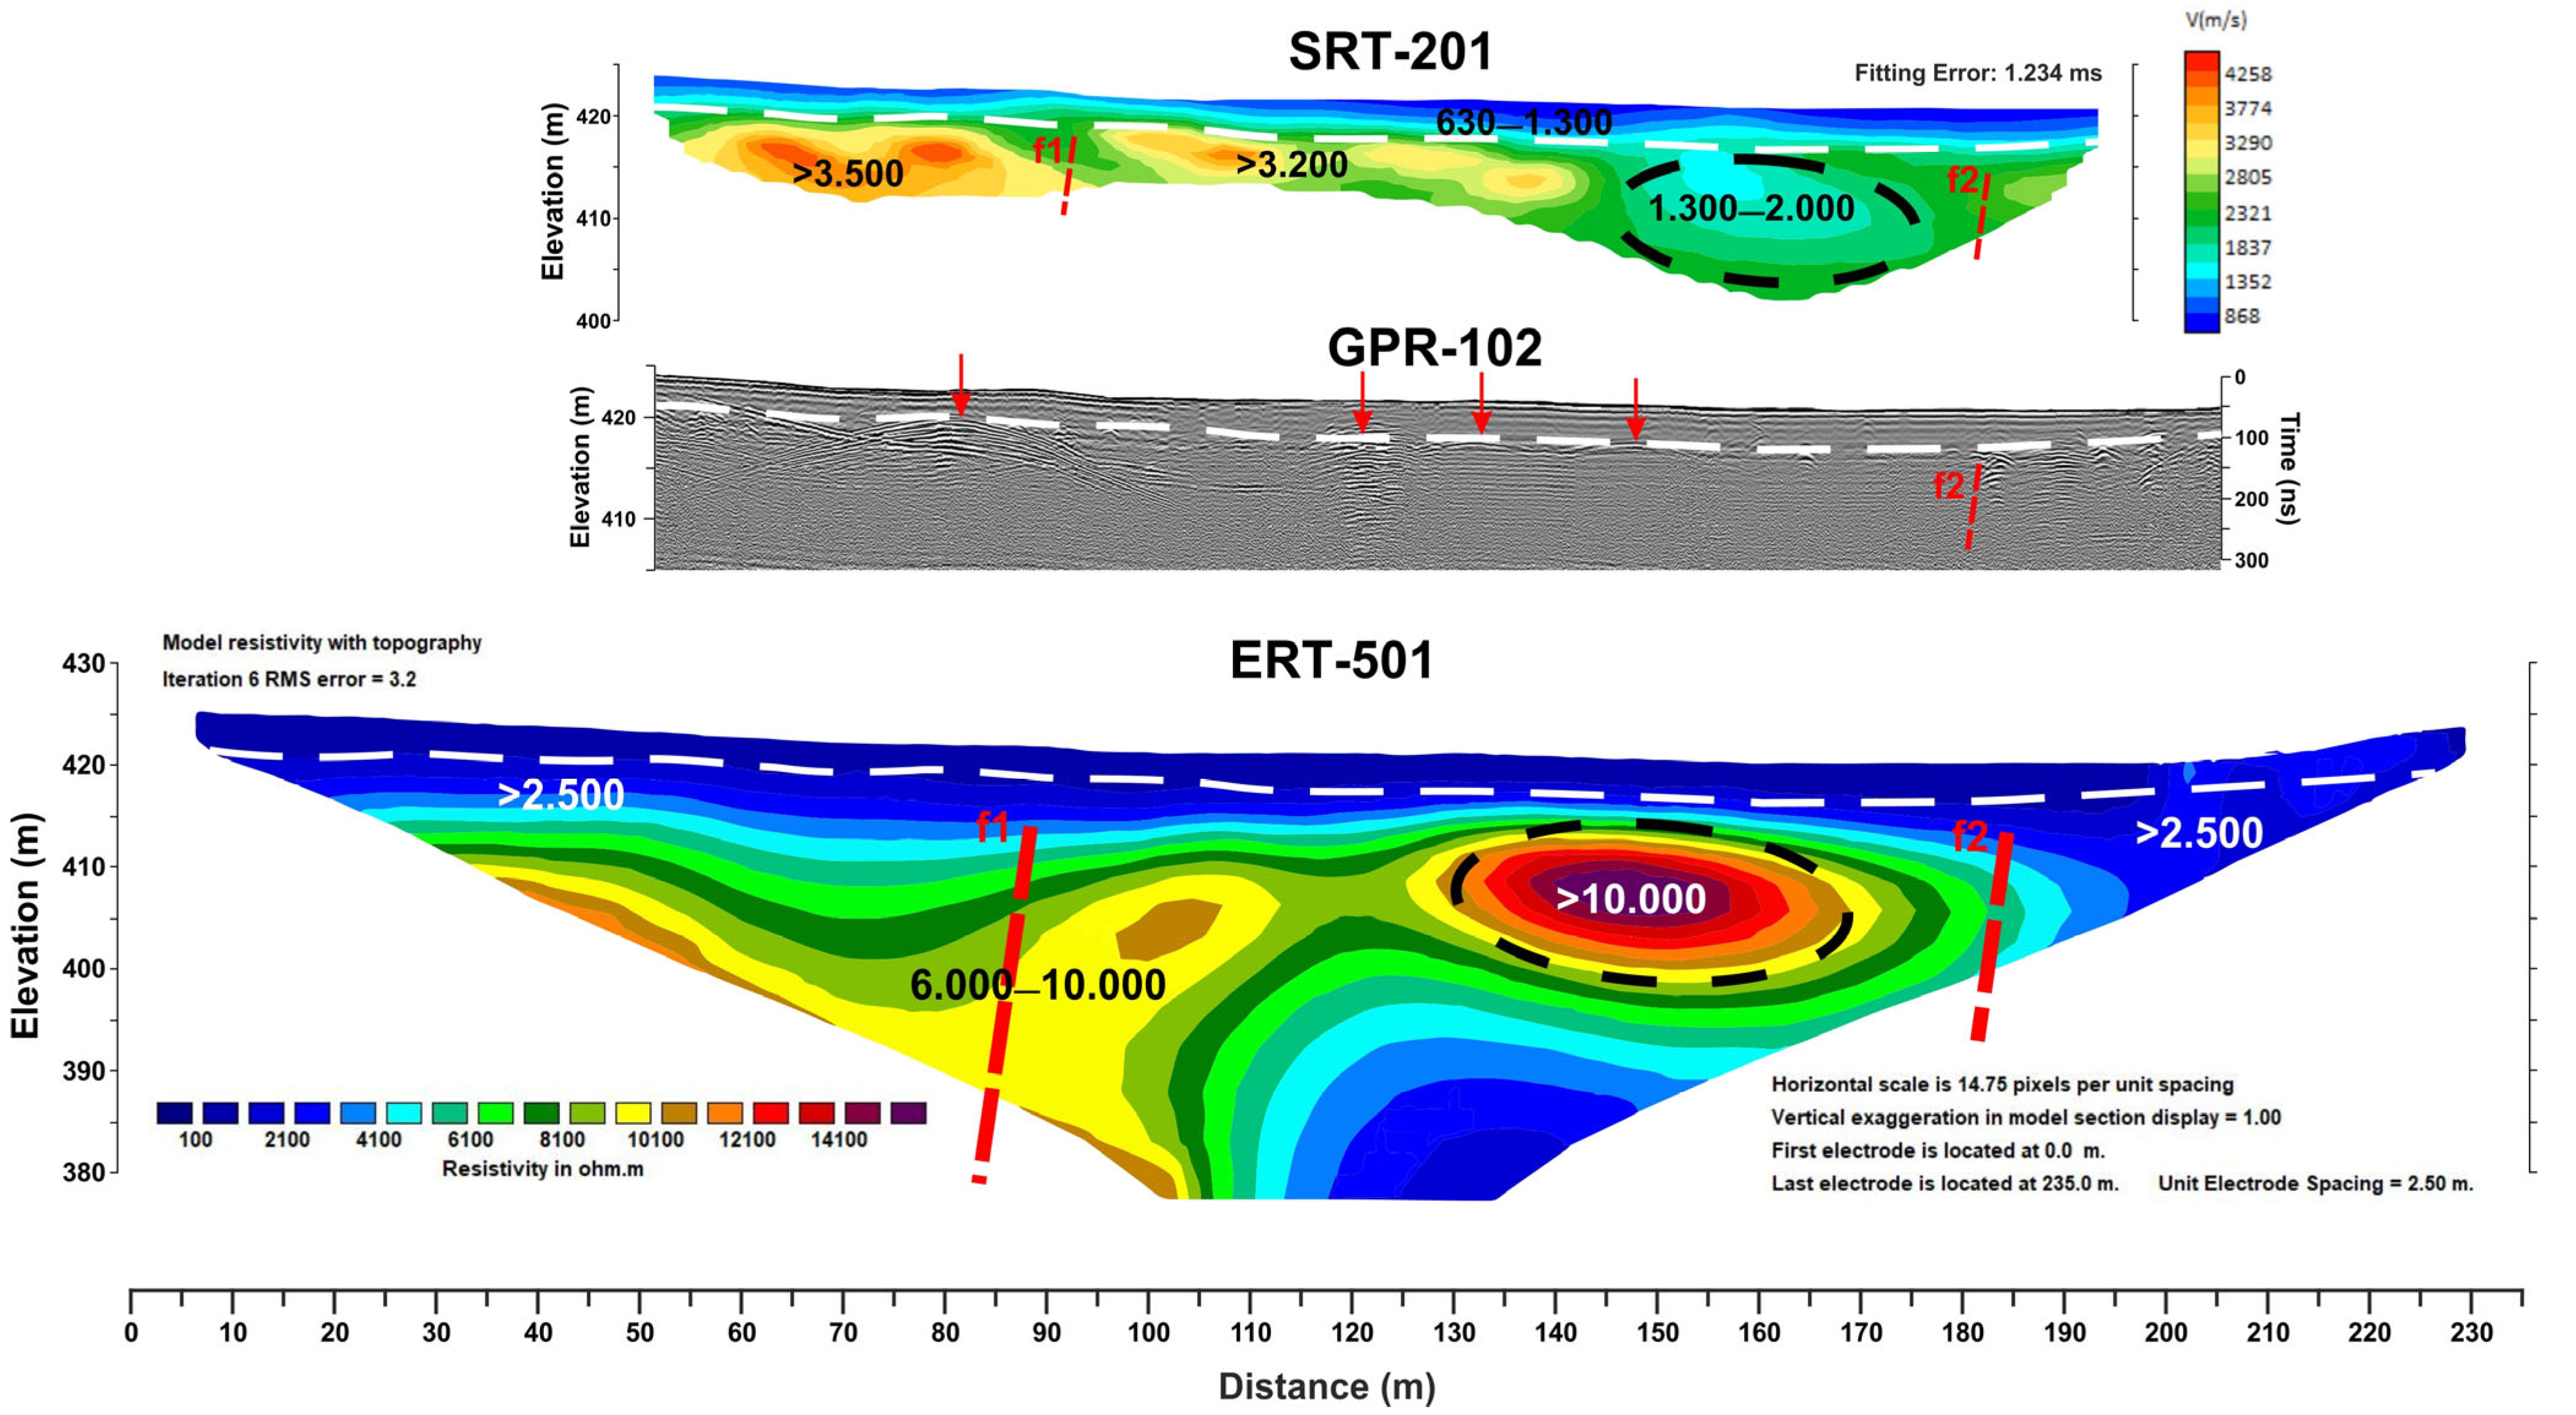
To evaluate the results of the multidisciplinary geophysical survey, two combined sections, presented in Figure 10 and Figure 11, were constructed. These sections were selected as the most representative examples to illustrate the survey results and to characterize the geophysical responses obtained. The four different geophysical techniques, ERT, SRT, GPR, and VLF, were conducted along the same alignment and are presented to scale, highlighting the zones of the aforementioned lateral inhomogeneity that characterizes the subsurface regime.
Based on the geological framework, field observations, and the multiparametric information derived from all applied geophysical techniques, the following interpretation has been adopted regarding the subsurface hydrogeological structure.
The shallowest geophysical formation investigated is characterized by relatively low resistivity (100–1000 Ohm.m) but also low P-wave velocities (600–1300 m/s) extending to an average depth of 3 m throughout the profiles (Figure 10 and Figure 11). This formation is interpreted as the post-Alpine loose, unconsolidated sediments, corresponding to the presence of the Pleistocene alluvial deposits (Q), which cover the majority of the immediate study area.
Underlying these deposits, the subsurface structure exhibits strong lateral variations in the investigated physical parameters, indicating the presence of a rather heterogeneous geological formation. Generally, this formation is characterized by higher resistivity (>2500 Ohm.m) values and increased P-wave velocities (>2500 m/s), which differentiates it from the overlying surficial deposits. This interpretation is further supported by the GPR results, where a typical reflection surface is observed throughout the whole GPR sections, indicating the transition from the surficial deposits to an underlying formation with different properties. These characteristic geophysical parameter values could be attributed to the Triassic carbonate formation of limestones, dolomitic limestones, and dolomites (TRm) dominating the surrounding area (Figure 2). This formation has been significantly affected by tectonic processes, resulting in the development of multiple fracture zones of varying scales. These fractures facilitate the infiltration of water to deeper levels, promoting the dissolution of calcium carbonate and the development of the karstification phenomenon. This accounts for the pronounced lateral variations in its physical parameters observed throughout the geophysical survey.
A very characteristic example of that is illustrated in the ERT-501 and SRT-201 profiles presented in Figure 11. At a distance between 130 and 170 m and a depth of 5 and 20 m, a strongly resistive (>10,000 Ohm.m) and generally low P-wave velocity (1300–2000 m/s) target is adumbrated (black dashed ellipse). These attributes suggest the presence of a possible air-filled, karstic void developed within the Triassic carbonate formation (TRm). This interpretation is corroborated by the GPR-102 profile results, which identify a high velocity hyperbolic reflector (~0.3 m/ns), as indicated with the red arrow, corresponding to the expected electromagnetic wave velocity in air.
Similarly, in the ERT-401 profile of Figure 10, high resistivity targets (>6000 Ohm.m) have been investigated at depths exceeding the maximum investigation depth of the corresponding SRT-101 profile. These anomalies are interpreted as possible regions affected by karstification. The large, lateral extension of one of the strongly resistive targets (>10,000 Ohm.m) observed between 22 and 110 m distance, suggests that it likely corresponds to multiple interconnected fractures and air-filled voids, rather than a single cavity. Due to resolution limitations of the ERT technique at such depths, these features appear as a single, continuous anomaly.
Comparable high resistive targets (>10,000 Ohm.m) have also been identified in almost all the other ERT profiles (Figure 6), verifying the intense degree of karstification affecting the Triassic carbonate formation (TRm). Furthermore, within the carbonate formation (TRm), two sub-vertical zones of strong lateral inhomogeneity are consistently identified, as indicated by the red dashed lines in the ERT, SRT, and GPR sections of Figure 10 and Figure 11. These zones correspond to the development of fracture zones (f1 and f2) within the formation as a result of the tectonic activity, further contributing to the heterogeneity of the subsurface and affecting the flow paths of the subsurface water.
It is worth mentioning that lateral discontinuities are not equally resolved by all the geophysical techniques. For instance, in Figure 10 and Figure 11, the f1 fracture zone is not visible in the GPR-101 and GPR-102 profiles, respectively, most likely due to high attenuation of the electromagnetic signal. Similarly, the f2 fracture zone in Figure 10 is not clearly delineated by the SRT-101 profile, probably as a result of the lower resolution at the section edges, caused by the reduced concentration of seismic rays in these areas. On the other hand, the f2 fracture zone is more clearly delineated by all the geophysical techniques in the southern part of the study area, as illustrated in Figure 11. The existence of this fracture zone is further supported by field observations and the remote sensing investigation (LiDAR DEM), which revealed an abrupt change in topographic relief in the eastern sector of the investigated area. This feature coincides with the surface exposure of the carbonate bedrock (TRm).
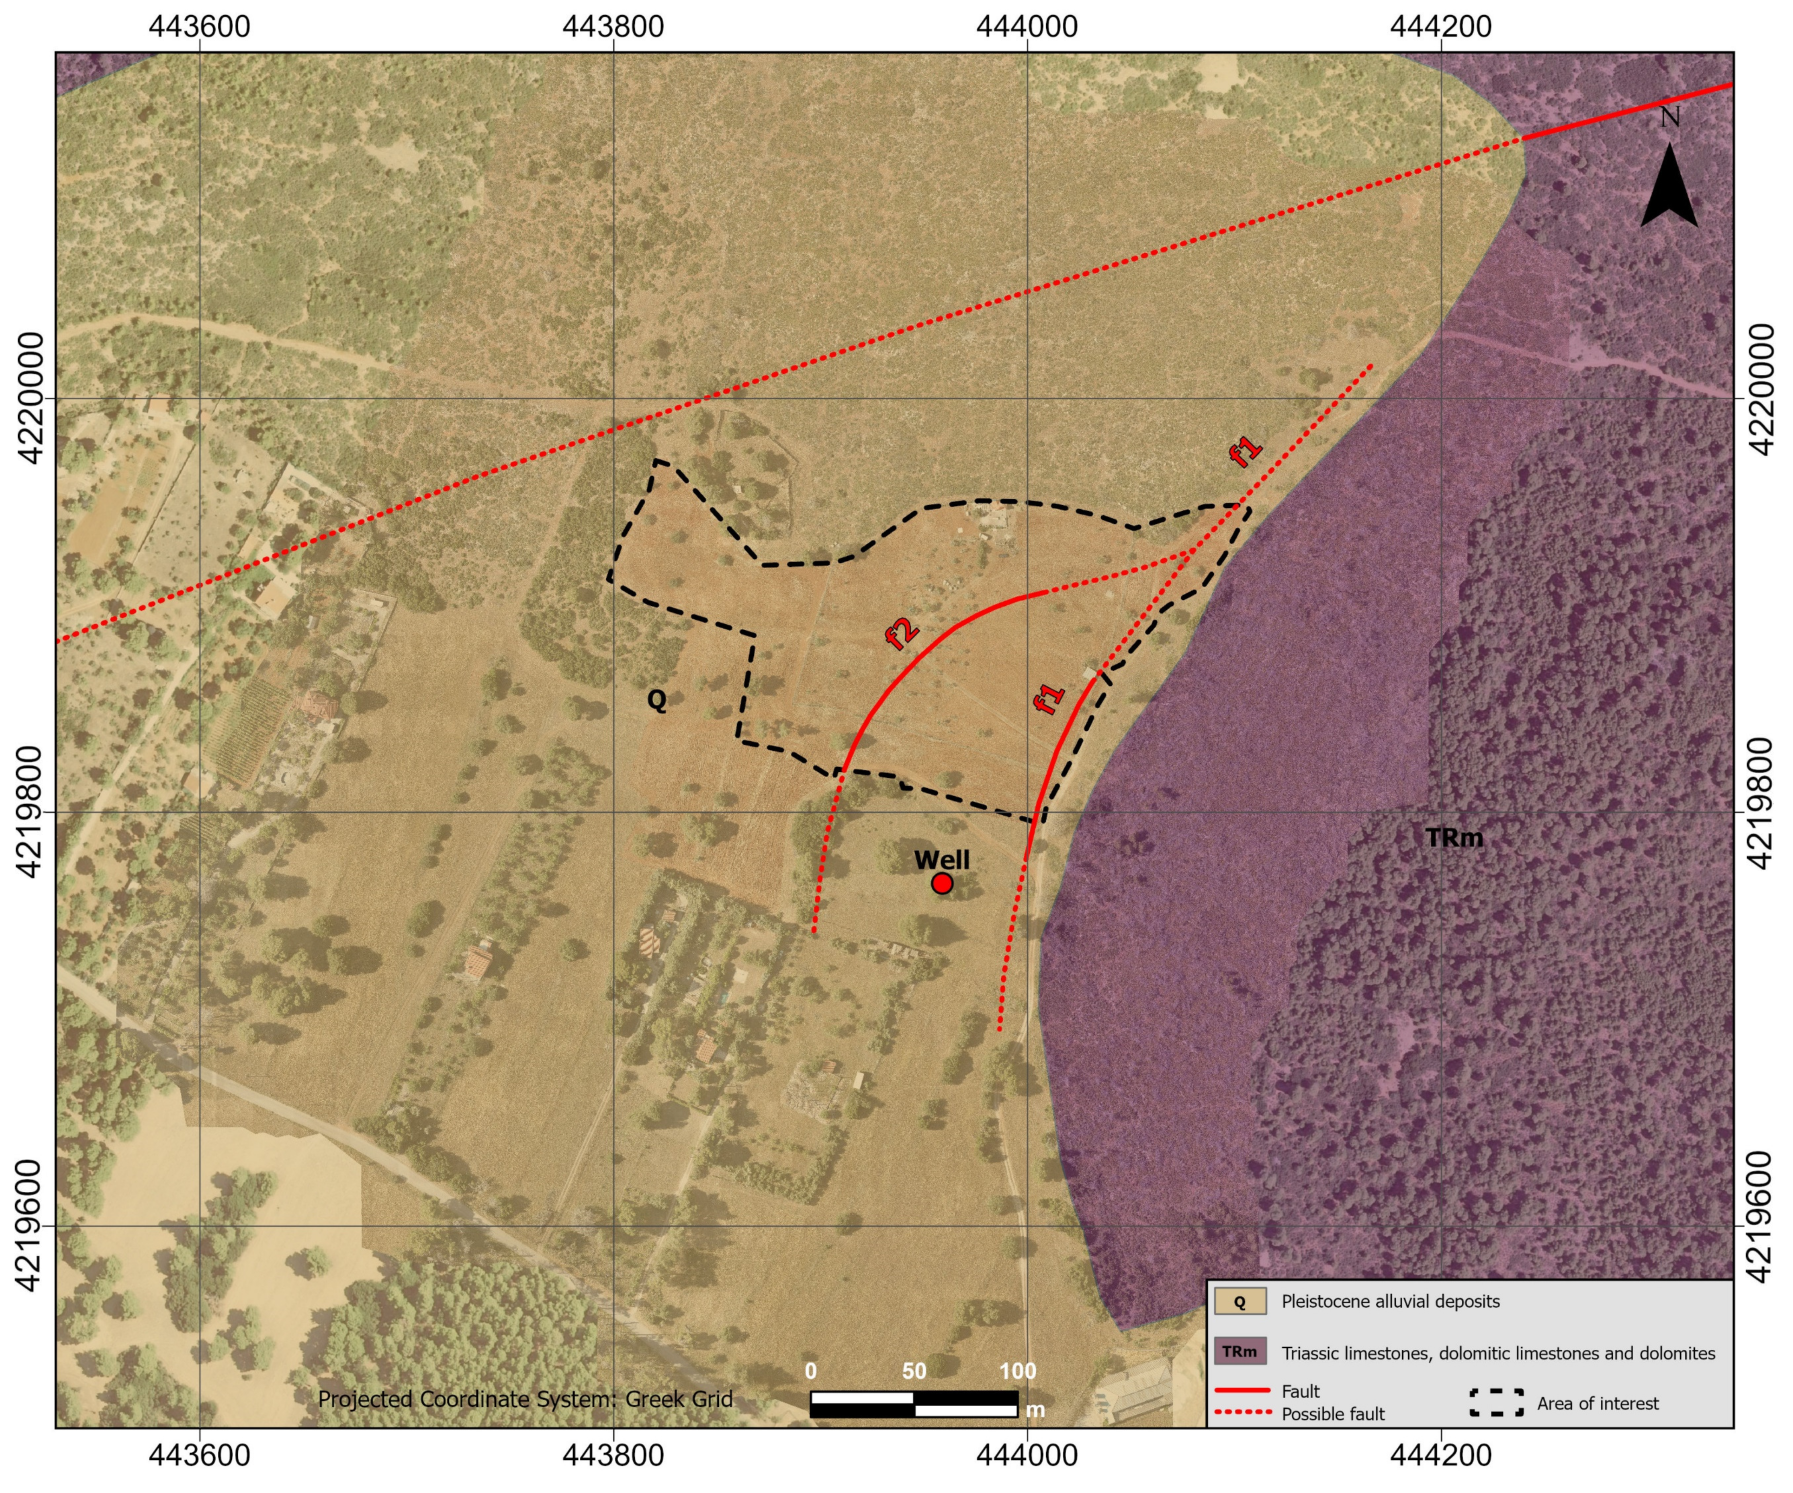
Based on the interpretation of the geophysical results, we were able to determine the thickness of the post-Alpine sediments to almost 3 m. Beyond that, the underlying Triassic limestone (TRm), serving as the bedrock, exhibits extensive karstification facilitated by the development of fracture zones, attributed to regional tectonic activity and successfully identified in detail by geophysical data. The strong lateral inhomogeneities revealed in the geophysical results are attributed to the presence of two fracture zones illustrated in Figure 12, as f1 and f2.

5. Conclusions

The comparative analysis of the applied geophysical survey, conducted in the selected study area in Agios Georgios-Mandra Attiki, provided a comprehensive understanding of the subsurface hydrological regime. This is essential for the establishment of the living hub and the development of sustainable agroforestry. Based on the hydrogeological characteristics of the area, crucial information for planning the local water management has been revealed.
Despite the fact that the karstification and tectonic events have hydrogeologically rendered the Triassic limestone (TRm) formation as a secondary permeable formation, the abundance of an underlying impermeable layer leads to the impossibility of the development of aquiferous zones, at least up to a depth of 100 m.
Moreover, the relatively high resistivity values (100–1000 Ohm.m) that have been investigated for the Pleistocene deposits indicate the absence of shallow aquiferous systems developed in this formation, at least during the data acquisition period. However, the presence of an anhydrous well (Figure 12) at a 2.5 m depth, located south of the study area, implies the potential existence of a phreatic aquifer in the past. The two investigated fracture zones may have historically contributed to the infiltration and storage of groundwater, thereby facilitating the development of a now-depleted phreatic water system.
It should be noted that the geophysical interpretation inherently involves a degree of uncertainty, particularly in the absence of direct ground-truth data such as borehole logs. To validate and refine the present findings, future investigations could include targeted drilling with detailed in situ hydrological testing to further enhance the integration and interpretation of the geophysical datasets.

Author Contributions

Conceptualization, J.D.A., I.-K.G., V.G., S.D., A.E. and S.M.; Methodology, J.D.A., I.-K.G., V.G. and S.D.; Software, V.G., I.-K.G. and S.D.; validation, J.D.A., I.-K.G., V.G., S.D., A.E. and S.M.; Formal analysis, J.D.A., I.-K.G., V.G. and S.D.; Investigation, J.D.A., I.-K.G., V.G., S.D., A.E. and S.M.; Resources, J.D.A., A.E. and S.M.; Data curation, J.D.A., I.-K.G., V.G. and S.D.; Writing—original draft preparation, J.D.A., I.-K.G., V.G. and S.D.; Writing—review and editing, S.D., A.E. and S.M.; Visualization, I.-K.G., V.G. and S.D.; Supervision, J.D.A., S.D., A.E. and S.M.; Project administration, J.D.A., A.E. and S.M.; Funding acquisition, A.E. and S.M. All authors have read and agreed to the published version of the manuscript.

Funding

This work has received funding from the European Union’s Interregional Innovation Investments (I3) Instrument under grant agreement No 101115156 within the framework of the INNO4CFIs project.

Data Availability Statement

Data available upon request.

Acknowledgments

The authors would like to thank all the undergraduate students of the Department of Geology and Geoenvironment for their contribution during the field measurements.

Conflicts of Interest

The authors declare no conflicts of interest.

Appendix A

Figure A1. ERT profiles of the study area.
Geosciences 15 00317 g0a1

References

  1. Begizew, G. Agricultural production system in arid and semi-arid regions. Int. J. Agric. Sci. Food Technol. 2021, 7, 234–244. [Google Scholar] [CrossRef]
  2. Heyns, P. Water conservation in arid and semi-arid regions. In Water Resources Management; Savenijie, H.H.G., Hoekstra, A.Y., Eds.; EOLSS Publications: Oxford, UK, 2009; Volume I, pp. 113–149. [Google Scholar]
  3. Conti, N.; Scatena, L.; Lombardi, E.; Roscani, V.; Meconcelli, E.; Franciamore, F.; Valdeolmillos, D.; Marra, E.; Manzini, J.; Paris, P.; et al. Living Hubs in the INNO4CFIs Project. From Ground to Satellites to AI Applications: Integrating Advanced Technologies for Carbon Farming in Agroforestry. In Distributed Computing and Artificial Intelligence, Special Sessions I, 21st International Conference; Springer Nature: Cham, Switzerland, 2025; Volume 1198, p. 399. [Google Scholar] [CrossRef]
  4. Giannopoulos, I.K.; Alexopoulos, J.D.; Dilalos, S.; Gkosios, V.; Mitsika, G.S.; Stamatakis, M.; Voulgaris, N. The geophysical identification of lateritic bauxite formation at Mandra area, Attiki (Greece). Bulletin of the Geological Society of Greece, Special Publication No 10, GSG2022-026. In Proceedings of the 16th International Congress of the Geological Society of Greece, Patras, Greece, 17–19 October 2022. [Google Scholar]
  5. Alexopoulos, J.D.; Dilalos, S.; Voulgaris, N.; Gkosios, V.; Giannopoulos, I.K.; Kapetanidis, V.; Kaviris, G. The contribution of near-surface geophysics for the site characterization of seismological stations. Appl. Sci. 2023, 13, 4932. [Google Scholar] [CrossRef]
  6. Allred, B.J.; Freeland, R.S.; Farahani, H.J.; Collins, M.E. Agricultural geophysics: Past, present, and future. In Proceedings of the 23rd EEGS Symposium on the Application of Geophysics to Engineering and Environmental Problems, Keystone, CO, Canada, 11–15 April 2010; European Association of Geoscientists & Engineers: Utrecht, The Netherlands, 2010; p. cp-175-00023. [Google Scholar] [CrossRef]
  7. Liu, X.; Dong, X.; Leskovar, D.I. Ground penetrating radar for underground sensing in agriculture: A review. Int. Agrophys. 2016, 30, 533–543. [Google Scholar] [CrossRef]
  8. Mitsika, G.S.; Alexopoulos, J.D.; Vassilakis, E.; Dilalos, S.; Poulos, S.E. Investigation of the physical-geographical characteristics of river delta with geophysical and satellite data. The case study of Pineios River, Greece. MethodsX 2023, 10, 102033. [Google Scholar] [CrossRef] [PubMed]
  9. Mastrocicco, M.; Vignoli, G.; Colombani, N.; Zeid, N.A. Surface electrical resistivity tomography and hydrogeological characterization to constrain groundwater flow modeling in an agricultural field site near Ferrara (Italy). Environ. Earth Sci. 2010, 61, 311–322. [Google Scholar] [CrossRef]
  10. Olufemi, F.O.; Akinola, B.E.; Oladipupo, B.A. Geophysical Survey for Groundwater Resource Appraissal in a Basement Complex Terrain for Agricultural Purposes; Case Study of ABUAD Teaching and Research Farm, Ado Ekiti, Southwest Nigeria. Glob. J. Sci. Front. Res. H Environ. Earth Sci. 2014, 14, 1–14. Available online: http://eprints.abuad.edu.ng/id/eprint/3 (accessed on 8 March 2019).
  11. Pathirana, S.; Lambot, S.; Krishnapillai, M.; Cheema, M.; Smeaton, C.; Galagedara, L. Ground-penetrating radar and electromagnetic induction: Challenges and opportunities in agriculture. Remote Sens. 2023, 15, 2932. [Google Scholar] [CrossRef]
  12. Billi, A.; De Filippis, L.; Poncia, P.P.; Sella, P.; Faccenna, C. Hidden Sinkholes and Karst Cavities in the Travertine Plateau of a Highly-Populated Geothermal Seismic Territory (Tivoli, Central Italy). Geomorphology 2016, 255, 63–80. [Google Scholar] [CrossRef]
  13. Cueto, M.; Olona, J.; Fernández-Viejo, G.; Pando, L.; López-Fernández, C. Karst-Induced Sinkhole Detection Using an Integrated Geophysical Survey: A Case Study along the Riyadh Metro Line 3 (Saudi Arabia). Near Surf. Geophys. 2018, 16, 270–281. [Google Scholar] [CrossRef]
  14. Chávez, R.E.; Tejero-Andrade, A.; Cifuentes, G.; Argote-Espino, D.L.; Hernández-Quintero, E. Karst Detection beneath the Pyramid of El Castillo, Chichen Itza, Mexico, by Non-Invasive ERT-3D Methods. Sci. Rep. 2018, 8, 15391. [Google Scholar] [CrossRef]
  15. Prins, C.; Kurosch, T.; Krautblatter, M.; Schulz, R. Testing the Effectiveness of an Inverse Wenner-Schlumberger Array for Geoelectrical Karst Void Reconnaissance, on the Swabian Alb High Plain, New Line Wendlingen–Ulm, Southwestern Germany. Eng. Geol. 2018, 249, 71–76. [Google Scholar] [CrossRef]
  16. Giannopoulos, I.K.; Alexopoulos, J.D.; Mitsika, G.S.; Konsolaki, A.; Dilalos, S.; Vassilakis, E.; Voulgaris, N. A preliminary geophysical investigation regarding the possible extension of Alistrati cave in Serres Greece. In Proceedings of the NSG2023 29th European Meeting of Environmental and Engineering Geophysics, Edinburgh, UK, 3–7 September 2023; European Association of Geoscientists & Engineers: Utrecht, The Netherlands, 2023; Volume 1, pp. 1–5. [Google Scholar] [CrossRef]
  17. Bermejo, L.; Ortega, A.I.; Guérin, R.; Benito-Calvo, A.; Pérez-González, A.; Parés, J.M.; Aracil, E.; Bermúdez de Castro, J.M.; Carbonell, E. 2D and 3D ERT Imaging for Identifying Karst Morphologies in the Archaeological Sites of Gran Dolina and Galería Complex (Sierra de Atapuerca, Burgos, Spain). Quat. Int. 2017, 433, 393–401. [Google Scholar] [CrossRef]
  18. Cheng, Q.; Tao, M.; Chen, X.; Binley, A. Evaluation of Electrical Resistivity Tomography (ERT) for Mapping the Soil–Rock Interface in Karstic Environments. Environ. Earth Sci. 2019, 78, 439. [Google Scholar] [CrossRef]
  19. Xu, S.; Sirieix, C.; Riss, J.; Malaurent, P. A Clustering Approach Applied to Time-Lapse ERT Interpretation—Case Study of Lascaux Cave. J. Appl. Geophys. 2017, 144, 115–124. [Google Scholar] [CrossRef]
  20. Cheng, Q.; Chen, X.; Tao, M.; Binley, A. Characterization of Karst Structures Using Quasi-3D Electrical Resistivity Tomography. Environ. Earth Sci. 2019, 78, 285. [Google Scholar] [CrossRef]
  21. Sonkamble, S.; Sahya, A.; Jampani, M.; Ahmed, S.; Amerasinghe, P. Hydro-Geophysical Characterization and Performance Evaluation of Natural Wetlands in a Semi-Arid Wastewater Irrigated Landscape. Water Res. 2025, 148, 176–187. [Google Scholar] [CrossRef] [PubMed]
  22. Drahor, M.G.; Berge, M.A.; Göktürkler, G.; Kurtulmuş, T.Ö. Mapping Aquifer Geometry Using Electrical Resistivity Tomography: A Case Study from Şanlıurfa, South-Eastern Turkey. Near Surf. Geophys. 2010, 9, 55–66. [Google Scholar] [CrossRef]
  23. Benabdelouahab, S.; Salhi, A.; Himi, M.; Stitou El Messari, J.E. Albert Casas Ponsati Geoelectrical Investigations for Aquifer Characterization and Geoenvironmental Assessment in Northern Morocco. Environ. Earth Sci. 2019, 78, 209. [Google Scholar] [CrossRef]
  24. Sendrós, A.; Himi, M.; Lovera, R.; Rivero, L.; Garcia-Artigas, R.; Urruela, A.; Casas, A. Geophysical Characterization of Hydraulic Properties around a Managed Aquifer Recharge System over the Llobregat River Alluvial Aquifer (Barcelona Metropolitan Area). Water 2020, 12, 3455. [Google Scholar] [CrossRef]
  25. Ali, N.; Chappuies, J.; Sloan, G.; Rouland, G.; Rai, A.; Dong, Y. A Global Perspective on Electrical Resistivity Tomography, Electromagnetic and Ground Penetration Radar Methods for Estimating Groundwater Recharge Zones. Front. Water 2025, 7, 1636613. [Google Scholar] [CrossRef]
  26. Azwin, I.N.; Saad, R.; Nordiana, M. Applying the Seismic Refraction Tomography for Site Characterization. APCBEE Procedia 2013, 5, 227–231. [Google Scholar] [CrossRef]
  27. Bery, A.A. High Resolution in Seismic Refraction Tomography for Environmental Study. Int. J. Geosci. 2013, 4, 792–796. [Google Scholar] [CrossRef]
  28. Gkosios, V.; Alexopoulos, J.D.; Soukis, K.; Giannopoulos, I.K.; Dilalos, S.; Michelioudakis, D.; Voulgaris, N.; Sphicopoulos, T. Application of Experimental Configurations of Seismic and Electric Tomographic Techniques to the Investigation of Complex Geological Structures. Geosciences 2024, 14, 258. [Google Scholar] [CrossRef]
  29. Grandjean, G.; Leparoux, D. The Potential of Seismic Methods for Detecting Cavities and Buried Objects: Experimentation at a Test Site. J. Appl. Geophys. 2004, 56, 93–106. [Google Scholar] [CrossRef]
  30. Jabrane, O.; Martínez-Pagán, P.; Martínez-Segura, M.A.; Alcalá, F.J.; El Azzab, D.; Vásconez-Maza, M.D.; Charroud, M. Integration of Electrical Resistivity Tomography and Seismic Refraction Tomography to Investigate Subsiding Sinkholes in Karst Areas. Water 2023, 15, 2192. [Google Scholar] [CrossRef]
  31. Martínez-Segura, M.A.; García-Nieto, M.C.; Navarro, M.; Vásconez-Maza, M.D.; Oda, Y.; García-Jerez, A.; Enomoto, T. Seismic Characterisation of the Subsoil under a Historic Building: Cathedral Church of Saint Mary in Murcia Case Study. Eng. Geol. 2024, 335, 107529. [Google Scholar] [CrossRef]
  32. Metwally, A.; Hanafy, S.; Guo, B.; Kosmicki, M. Imaging of Subsurface Faults Using Refraction Migration with Fault Flooding. J. Appl. Geophys. 2017, 143, 103–115. [Google Scholar] [CrossRef]
  33. Akingboye, A.S.; Ogunyele, A.C. Insight into Seismic Refraction and Electrical Resistivity Tomography Techniques in Subsurface Investigations. Rud.-Geološko-Naft. Zb. 2019, 34, 93–111. [Google Scholar] [CrossRef]
  34. Herlambang, N.; Riyanto, A. Determination of Bedrock Depth in Universitas Indonesia Using the Seismic Refraction Method. IOP Conf. Ser. Earth Environ. Sci. 2021, 846, 012016. [Google Scholar] [CrossRef]
  35. Čeru, T.; Šegina, E.; Knez, M.; Benac, Č.; Gosar, A. Detecting and characterizing unroofed caves by ground penetrating radar. Geomorphology 2018, 303, 524–539. [Google Scholar] [CrossRef]
  36. Bermejo, L.; Ortega, A.I.; Parés, J.M.; Campaña, I.; Bermúdez de Castro, J.M.; Carbonell, E.; Conyers, L.B. Karst Features Interpretation Using Ground-Penetrating Radar: A Case Study from the Sierra de Atapuerca, Spain. Geomorphology 2020, 367, 107311. [Google Scholar] [CrossRef]
  37. Alexopoulos, J.D.; Dilalos, S.; Vassilakis, E. Adumbration of Amvrakia’s spring water pathways, based on detailed geophysical data (Kastraki-Meteora). In Advances in the Research of Aquatic Environment; Lambrakis, N., Stournaras, G., Katsanou, K., Eds.; Springer: Berlin/Heidelberg, Germany, 2011; Volume 2, pp. 105–112. [Google Scholar] [CrossRef]
  38. Jamal, N.; Singh, N.P. Identification of fracture zones for groundwater exploration using very low frequency electromagnetic (VLF-EM) and electrical resistivity (ER) methods in hard rock area of Sangod Block, Kota District, Rajasthan, India. Groundw. Sustain. Dev. 2018, 7, 195–203. [Google Scholar] [CrossRef]
  39. Papadopoulos, T.D.; Alexopoulos, J.D.; Dilalos, S. Combined Geoelectrical and Geoelectromagnetic Survey for Contributing to Local Hydrogeological Regime—The Case Study of Delfini Basin (Chios Isl.—Greece). Geol. Geophys. Russ. South 2020, 10, 68–80. [Google Scholar] [CrossRef]
  40. Bosch, F.P.; Muller, I. Continuous Gradient VLF Measurements: A New Possibility for High Resolution Mapping of Karst Structures. First Break. 2001, 19, 343–350. [Google Scholar] [CrossRef]
  41. Alexopoulos, J.; Vassilakis, E.; Dilalos, S. Combined geophysical techniques for detailed groundwater flow investigation in tectonically deformed fractured rocks. Ann. Geophys. 2013, 56, S0669. [Google Scholar] [CrossRef]
  42. Sevil, J.; Gutiérrez, F.; Zarroca, M.; Desir, G.; Carbonel, D.; Guerrero, J.; Linares, R.; Roqué, C.; Fabregat, I. Sinkhole Investigation in an Urban Area by Trenching in Combination with GPR, ERT and High-Precision Leveling. Mantled Evaporite Karst of Zaragoza City, NE Spain. Eng. Geol. 2017, 231, 9–20. [Google Scholar] [CrossRef]
  43. Robinson, T.; Rodgers, B.; Oliver-Cabrera, T.; Downs, C.; Kruse, S.; Wdowinski, S.; Zhang, B.; Jazayeri, S.; Esmaeili, S.; Kiflu, H. Complex Relationships between Surface Topography, Ground Motion, and Cover Sediments in Covered Karst, West-Central Florida, USA. Geomorphology 2021, 392, 107927. [Google Scholar] [CrossRef]
  44. Hussain, Y.; Uagoda, R.; Borges, W.; Prado, R.; Hamza, O.; Cárdenas-Soto, M.; Havenith, H.-B.; Dou, J. Detection of Cover Collapse Doline and Other Epikarst Features by Multiple Geophysical Techniques, Case Study of Tarimba Cave, Brazil. Water 2020, 12, 2835. [Google Scholar] [CrossRef]
  45. Rahimi, M.; Wood, C.M.; Kallivokas, L.F. A Comparative Study of Using Geophysical Methods for Imaging Subsurface Voids of Various Sizes and at Different Depths. Eng. Geol. 2024, 341, 107711. [Google Scholar] [CrossRef]
  46. Turner, D.; Lucieer, A.; Watson, C. An automated technique for generating georectified mosaics from ultra-high resolution unmanned aerial vehicle (UAV) imagery, based on structure from motion (SfM) point clouds. Remote Sens. 2012, 4, 1392–1410. [Google Scholar] [CrossRef]
  47. Gomez, C.; Purdie, H. UAV-based photogrammetry and geocomputing for hazards and disaster risk monitoring—A review. Geoenviron. Disasters 2016, 3, 23. [Google Scholar] [CrossRef]
  48. Luo, D.; Lin, H.; Jin, Z.; Zheng, H.; Song, Y.; Feng, L.; Guo, Q. Applications of UAV digital aerial photogrammetry and LiDAR in geomorphology and land cover research. Earth Environ. 2019, 10, 213–226. [Google Scholar] [CrossRef]
  49. Dounas, A. Geological Map of Greece, Sheet Erythrai, Scale 1:50.000; Institute of Geological and Mineralogical of Greece: Athens, Greece, 1971. [Google Scholar]
  50. Struckmeier, W.F.; Margat, J. Hydrogeological Maps: A Guide and a Standard Legend in International Contributions to Hydrogeology; Heise: Hannover, Germany, 1995; Volume 17, ISBN 3922705987. [Google Scholar]
  51. Bi, R.; Gan, S.; Yuan, X.; Li, K.; Li, R.; Luo, W.; Chen, C.; Gao, S.; Hu, L.; Zhu, Z. Detection and Analysis of Landslide Geomorphology Based on UAV Vertical Photogrammetry. J. Mt. Sci. 2024, 21, 1190–1214. [Google Scholar] [CrossRef]
  52. Galve, J.P.; Pérez-García, J.L.; Ruano, P.; Gómez-López, J.M.; Reyes-Carmona, C.; Moreno-Sánchez, M.; Jerez-Longres, P.S.; Ghadimi, M.; Barra, A.; Mateos, R.M.; et al. Applications of UAV Digital Photogrammetry in landslide emergency response and recovery activities: The case study of a slope failure in the A-7 highway (S Spain). Landslides 2025, 22, 1383–1396. [Google Scholar] [CrossRef]
  53. Jaboyedoff, M.; Oppikofer, T.; Abellán, A.; Derron, M.H.; Loye, A.; Metzger, R.; Pedrazzini, A. Use of LIDAR in landslide investigations: A review. Nat. Hazards 2012, 61, 5–28. [Google Scholar] [CrossRef]
  54. Fang, C.; Fan, X.; Zhong, H.; Lombardo, L.; Tanyas, H.; Wang, X. A novel historical landslide detection approach based on LiDAR and lightweight attention U-Net. Remote Sens. 2022, 14, 4357. [Google Scholar] [CrossRef]
  55. Loke, M.H.; Dahlin, T.A. Comparison of the Gauss–Newton and Quasi-Newton methods in resistivity imaging inversion. J. Appl. Geophys. 2002, 49, 149–162. [Google Scholar] [CrossRef]
  56. Loke, M.H. Tutorial: 2-D and 3-D Electrical Imaging Surveys. Geotomo Software. 2004. Available online: https://sites.ualberta.ca/~unsworth/UA-classes/223/loke_course_notes.pdf (accessed on 5 May 2025).
  57. Zhang, J.; ten Brink, U.S.; Toksöz, M.N. Nonlinear refraction and reflection travel time tomography. J. Geophys. Res. Solid Earth 1998, 103, 29743–29757. [Google Scholar] [CrossRef]
  58. Redpath, B.B. Seismic Refraction Exploration for Engineering Site Investigations; Army Engineer Waterways Experiment Station: Livermore, CA, USA; Explosive Excavation Research Lab: Livermore, CA, USA, 1973. [Google Scholar]
  59. McCaughey, M.; Singh, S.C. Simultaneous velocity and interface tomography of normal-incidence and wide-aperture seismic traveltime data. Geophys. J. Int. 1997, 131, 87–99. [Google Scholar] [CrossRef]
  60. Moser, T.J. Shortest path calculation of seismic rays. Geophysics 1991, 56, 59–67. [Google Scholar] [CrossRef]
  61. Eberle, D. A method of reducing terrain relief effects from VLF-EM data. Geoexploration 1981, 19, 103–114. [Google Scholar] [CrossRef]
  62. Pirttijarvi, M. Manual of the KHFFILT Program; Karous-Hjelt and Fraser Filtering of VLF Measurements, Version 1.1a; University of Oulu: Oulu, Finland, 2004; p. 6.
  63. Fraser, D.C. Contouring of VLF-EM data. Geophysics 1969, 34, 958–967. [Google Scholar] [CrossRef]
  64. Karous, M. Effect of relief in EM methods with very distant source. Geoexploration 1979, 17, 33–42. [Google Scholar] [CrossRef]
  65. Karous, M.; Hjelt, S.E. Linear filtering of VLF dip-angle measurements. Geophys. Prospect. 1983, 31, 782–794. [Google Scholar] [CrossRef]
  66. Monteiro Santos, F.A. Instructions for Running PrepVLF and Inv2DVLF; 2-D Inversion of VLF-EM Single Frequency Programs, Version 1.0; Centro de Geofisica da Universidade de Lisboa: Lisboa, Portugal, 2006.
  67. Monteiro Santos, F.A. New Features PrepVLF and Inv2DVLF, Version 1.1; Centro de Geofisica da Universidade de Lisboa: Lisboa, Portugal, 2007.
  68. Monteiro Santos, F.A.; Almeida, E.P.; Gomes, M.; Pina, A. Hydrogeological investigation in Santiago Island (Cabo Verde) using magnetotellurics and VLF methods. J. Afr. Earth Sci. 2006, 45, 421–430. [Google Scholar] [CrossRef]
  69. Monteiro Santos, F.A.; Mateus, A.; Figueiras, J.; Concalves, M.A. Mapping groundwater contamination around a landfill facility using the VLF-EM method—A case study. J. Appl. Geophys. 2006, 60, 115–125. [Google Scholar] [CrossRef]
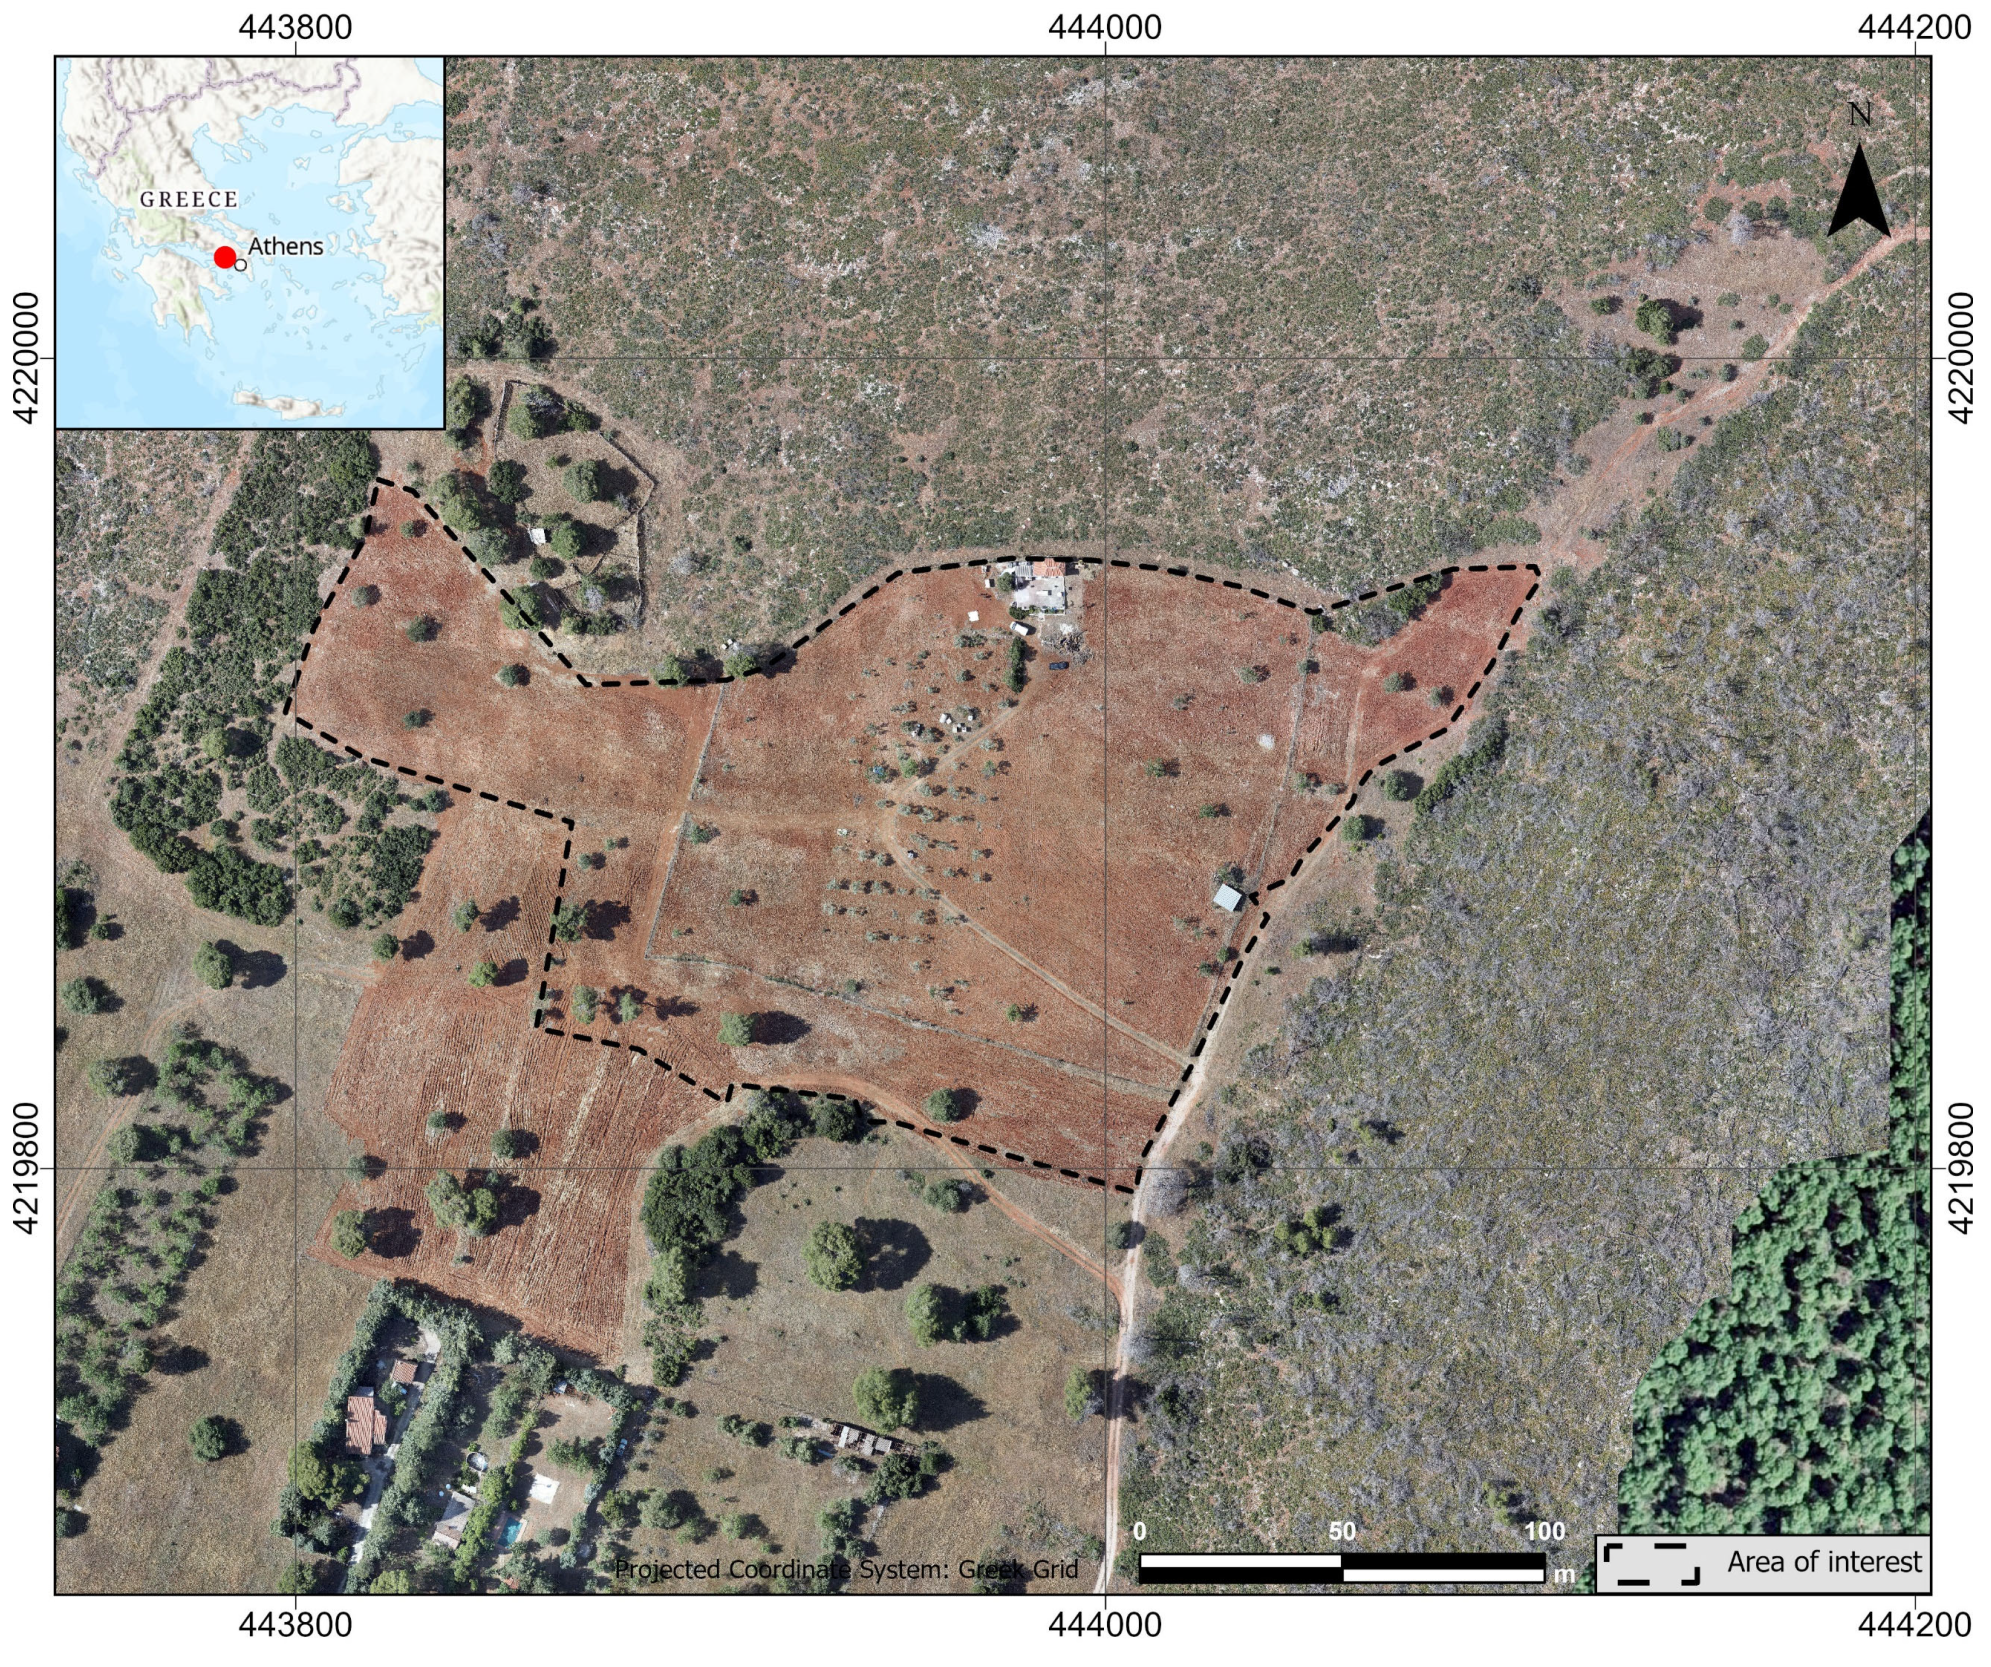
Figure 1. Orthophotomosaic of the study area (black dashed line), via UAV photogrammetry.
Geosciences 15 00317 g001
Figure 2. Modified geological map [49] of the study area.
Geosciences 15 00317 g002
Figure 3. UAV LiDAR-based point-cloud map of the broader study area.
Geosciences 15 00317 g003
Figure 4. Orthophotomosaic of the study area, along with the geophysical acquisition layout.
Geosciences 15 00317 g004
Figure 5. Digital Elevation Model (DEM) and orthophotomosaic of the area constructed from the LiDAR and photogrammetric data, respectively.
Geosciences 15 00317 g005
Figure 6. Three-dimensional representation (fence diagram) of the ERT results.
Geosciences 15 00317 g006
Figure 7. Three-dimensional representation (fence diagram) of the SRT results.
Geosciences 15 00317 g007
Figure 8. (a) GPR-101 and (b) GPR-102 profiles, with topographic correction. White dashed line: bedrock ceiling. Red arrows: high velocity (~0.3 m/ns) reflection hyperbolas, indicative of possible air voids.
Geosciences 15 00317 g008
Figure 9. Resistivity distribution across VLF-101 originated from the 2D inversion with Inv2DVLF. Red dashed lines: sub-vertical zones of lateral inhomogeneity (fractures). Black dashed line: regions possibly affected by karstification.
Geosciences 15 00317 g009
Figure 10. Combined representation of SRT-101, GPR-101, and ERT-401. White dashed line: bedrock ceiling. Red dashed lines: sub-vertical zones of lateral inhomogeneity (fractures f1 and f2). Black dashed lines: regions possibly affected by karstification.
Geosciences 15 00317 g010
Figure 11. Combined representation of SRT-201, GPR-102, and ERT-501. White dashed line: bedrock ceiling. Red dashed lines: sub-vertical zones of lateral inhomogeneity (fractures f1 and f2). Black dashed lines: regions possibly affected by karstification.
Geosciences 15 00317 g011
Figure 12. Modified geological map (geophysically informed) of the study area with the two (f1 and f2) possible fault zones (red lines).
Geosciences 15 00317 g012
Table 1. Acquisition parameters of geophysical techniques.
Code NameReceiver Spacing/
Step Size (m)
Total Length (m)
ERT-1016.00282
ERT-1028.00376
ERT-2017.00329
ERT-20210.00470
ERT-3013.00285 (2 roll-along)
ERT-3024.00284 (1 roll-along)
ERT-4015.00235
ERT-5015.00235
SRT-1013.00141
SRT-1023.00141
GPR-1010.05222
GPR-1020.05155
VLF-1015.00300
VLF-1025.00300
Disclaimer/Publisher’s Note: The statements, opinions and data contained in all publications are solely those of the individual author(s) and contributor(s) and not of MDPI and/or the editor(s). MDPI and/or the editor(s) disclaim responsibility for any injury to people or property resulting from any ideas, methods, instructions or products referred to in the content.