Article

Statistical Physics of Fissure Swarms and Dike Swarms

by
Agust Gudmundsson
Department of Earth Sciences, Royal Holloway University of London, Queen’s Building, Egham TW20 0EX, UK
Geosciences 2025, 15(8), 301; https://doi.org/10.3390/geosciences15080301
Submission received: 7 May 2025 / Revised: 22 July 2025 / Accepted: 23 July 2025 / Published: 4 August 2025

Abstract

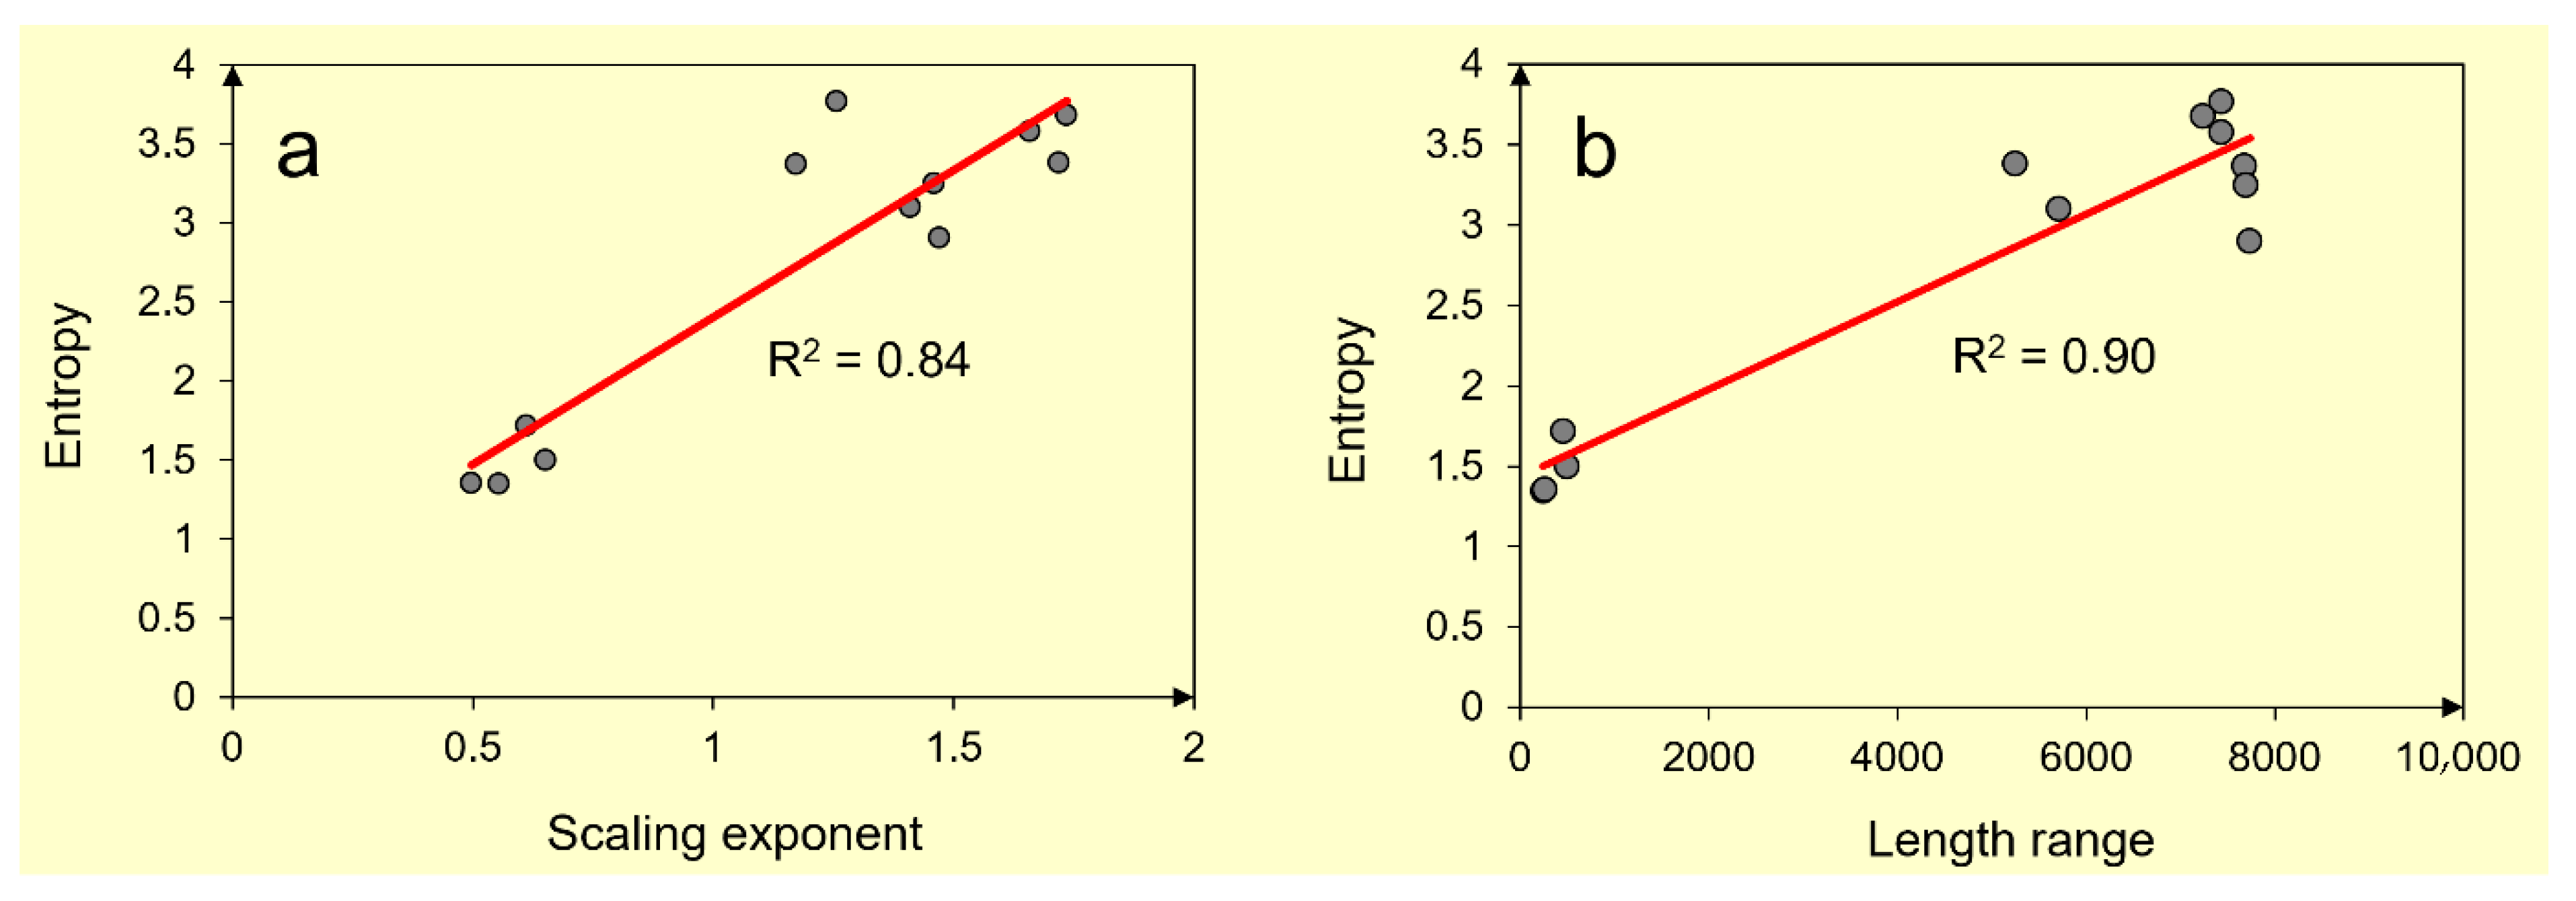
Fissure swarms and dike swarms in Iceland constitute the main parts of volcanic systems that are 40–150 km long, 5–20 km wide, extend to depths of 10–20 km, and contain 2 × 10¹⁴ outcrop-scale (≥0.1 m) and 1022–23 down to grain-scale (≥1 mm) fractures, suggesting that statistical physics is an appropriate method of analysis. Length-size distributions of 565 outcrop-scale Holocene fissures (tension fractures and normal faults) and 1041 Neogene dikes show good to excellent fits with negative power laws and exponential laws. Here, the Helmholtz free energy is used to represent the energy supplied to the swarms and to derive the Gibbs–Shannon entropy formula. The calculated entropies of 12 sets and subsets of fissures and 3 sets and subsets of dikes all show strong positive correlations with sets/subsets length ranges and scaling exponents. Statistical physics considerations suggest that, at a given time, the probability of the overall state of stress in a crustal segment being heterogeneous is much greater than the state of stress being homogeneous and favourable to the propagation of a fissure or a dike. In a heterogeneous stress field, most fissures/dikes become arrested after a short propagation—which is a formal explanation of the observed statistical size-length distributions. As the size of the stress-homogenised rock volume increases larger fissures/dikes can form, increasing the length range of the distribution (and its entropy) which may, potentially, transform from an exponential distribution into a power-law distribution.

1. Introduction

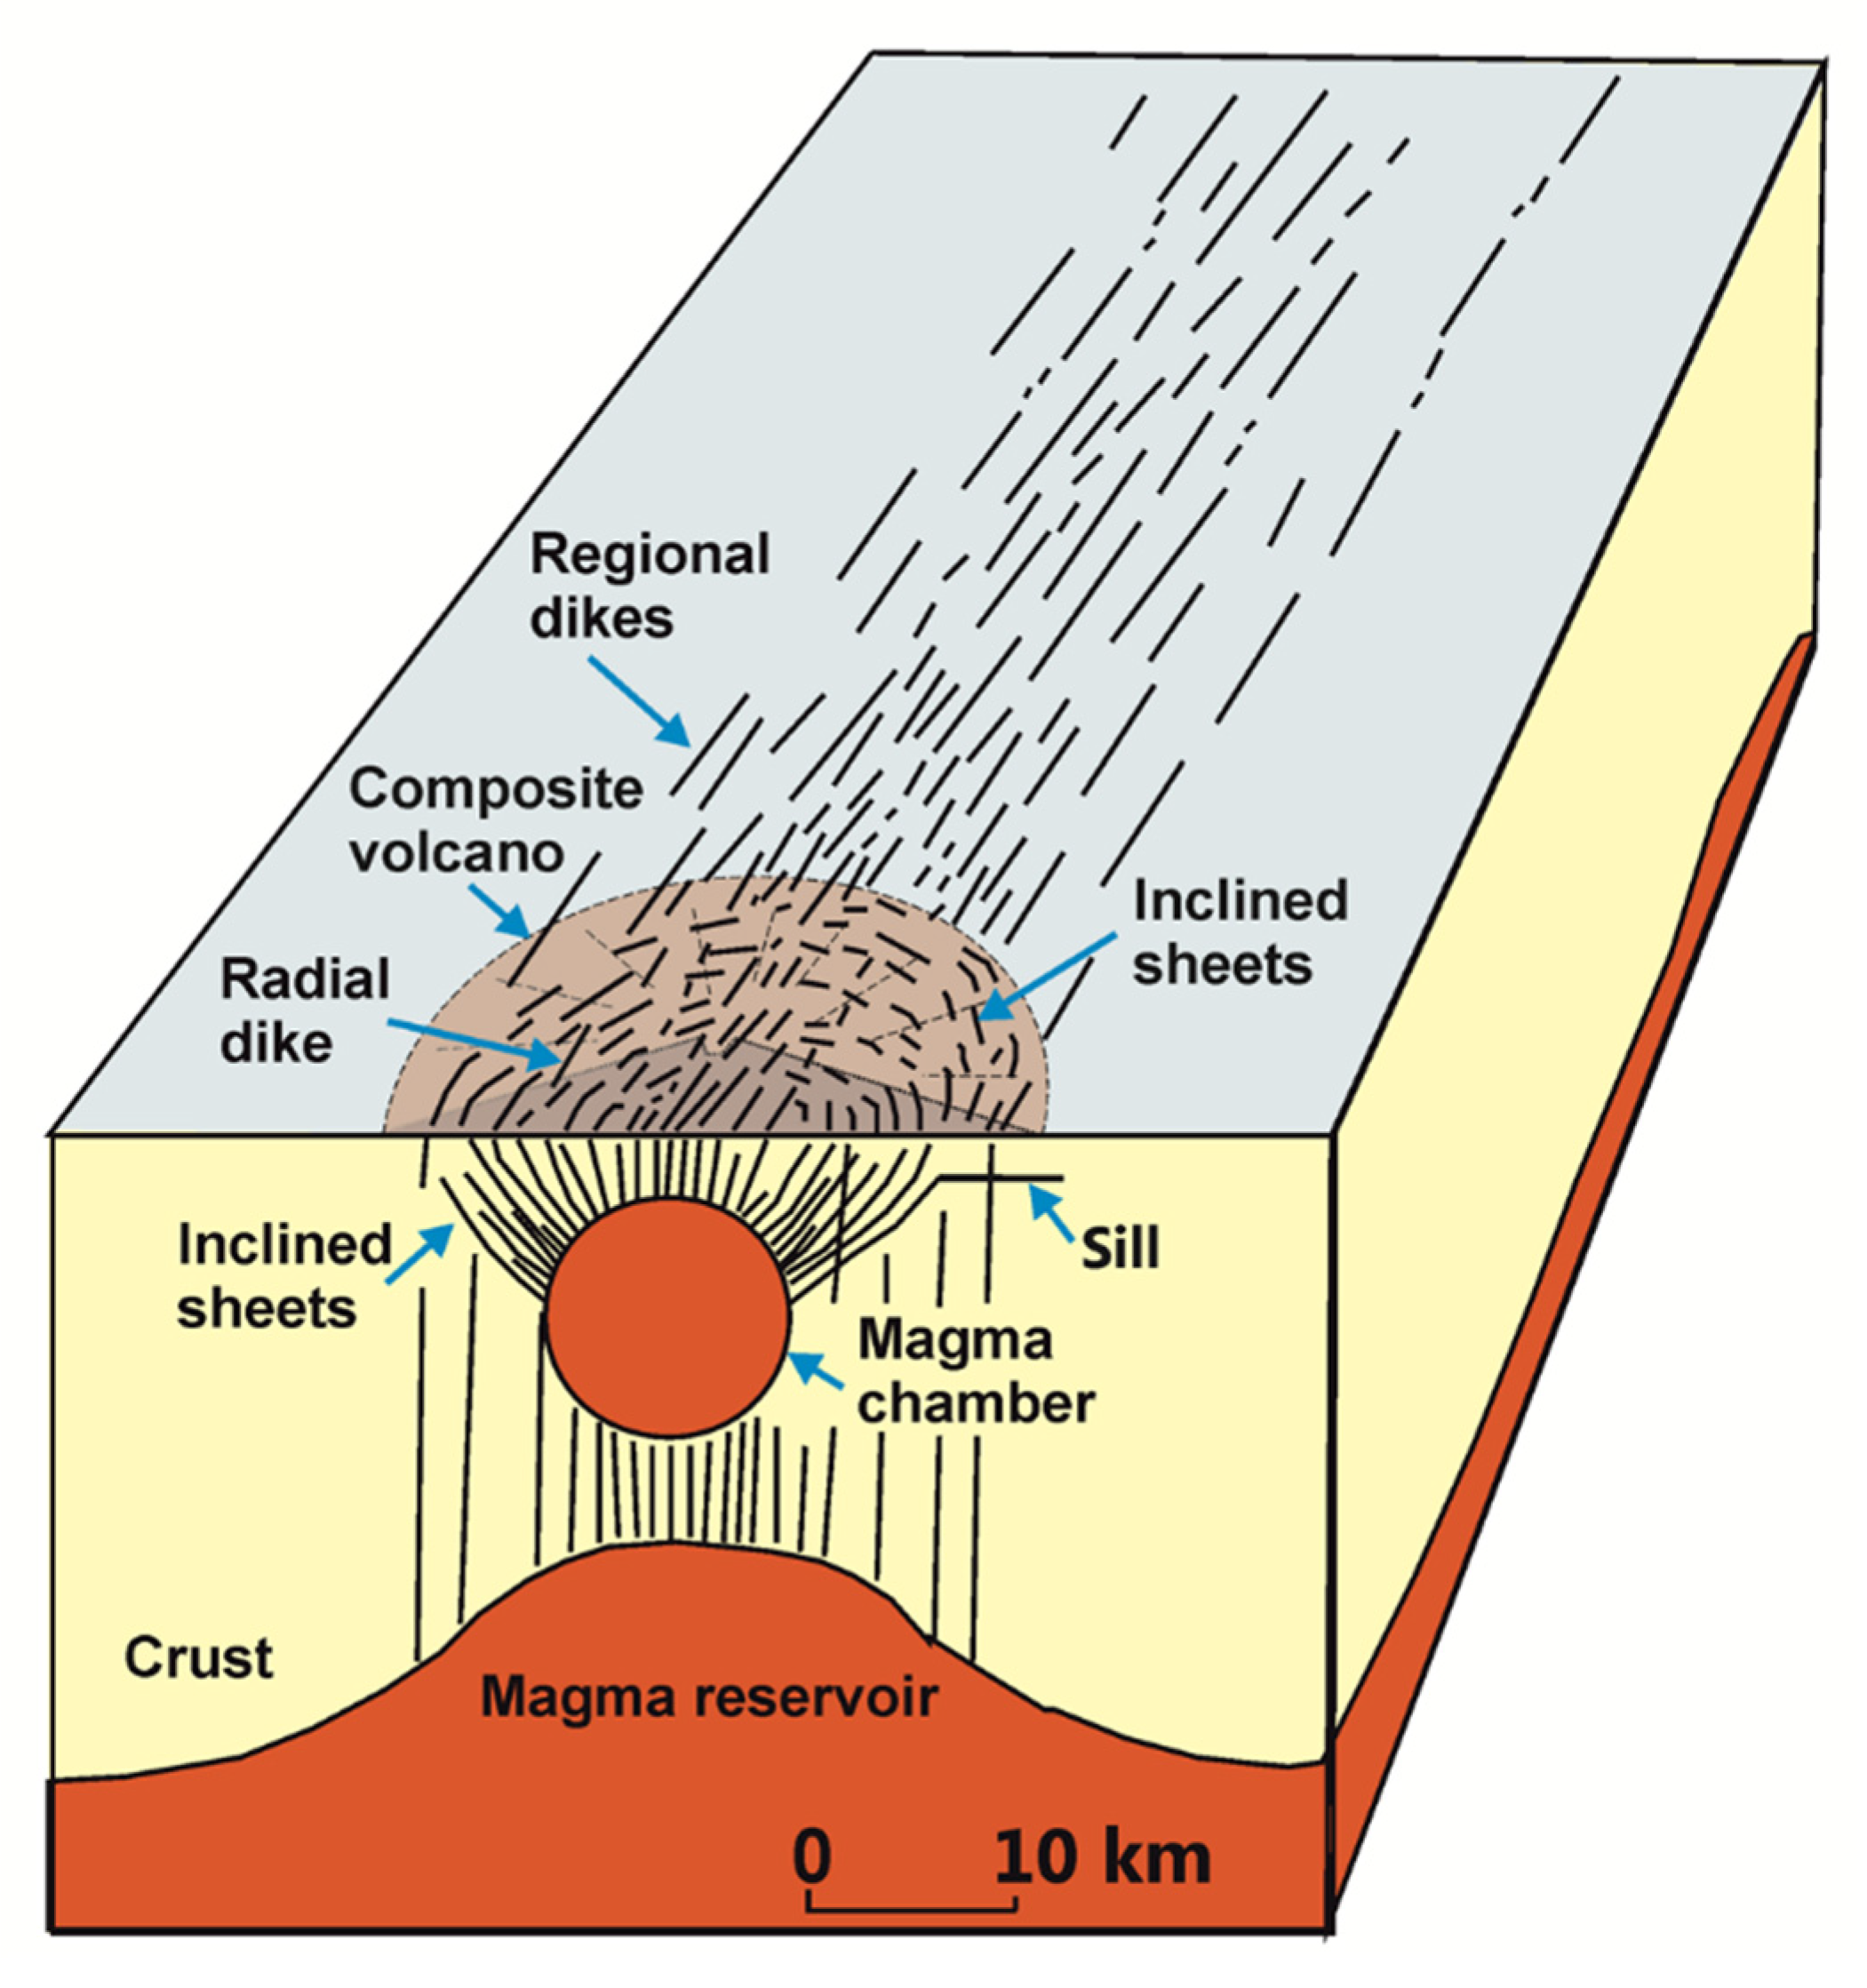
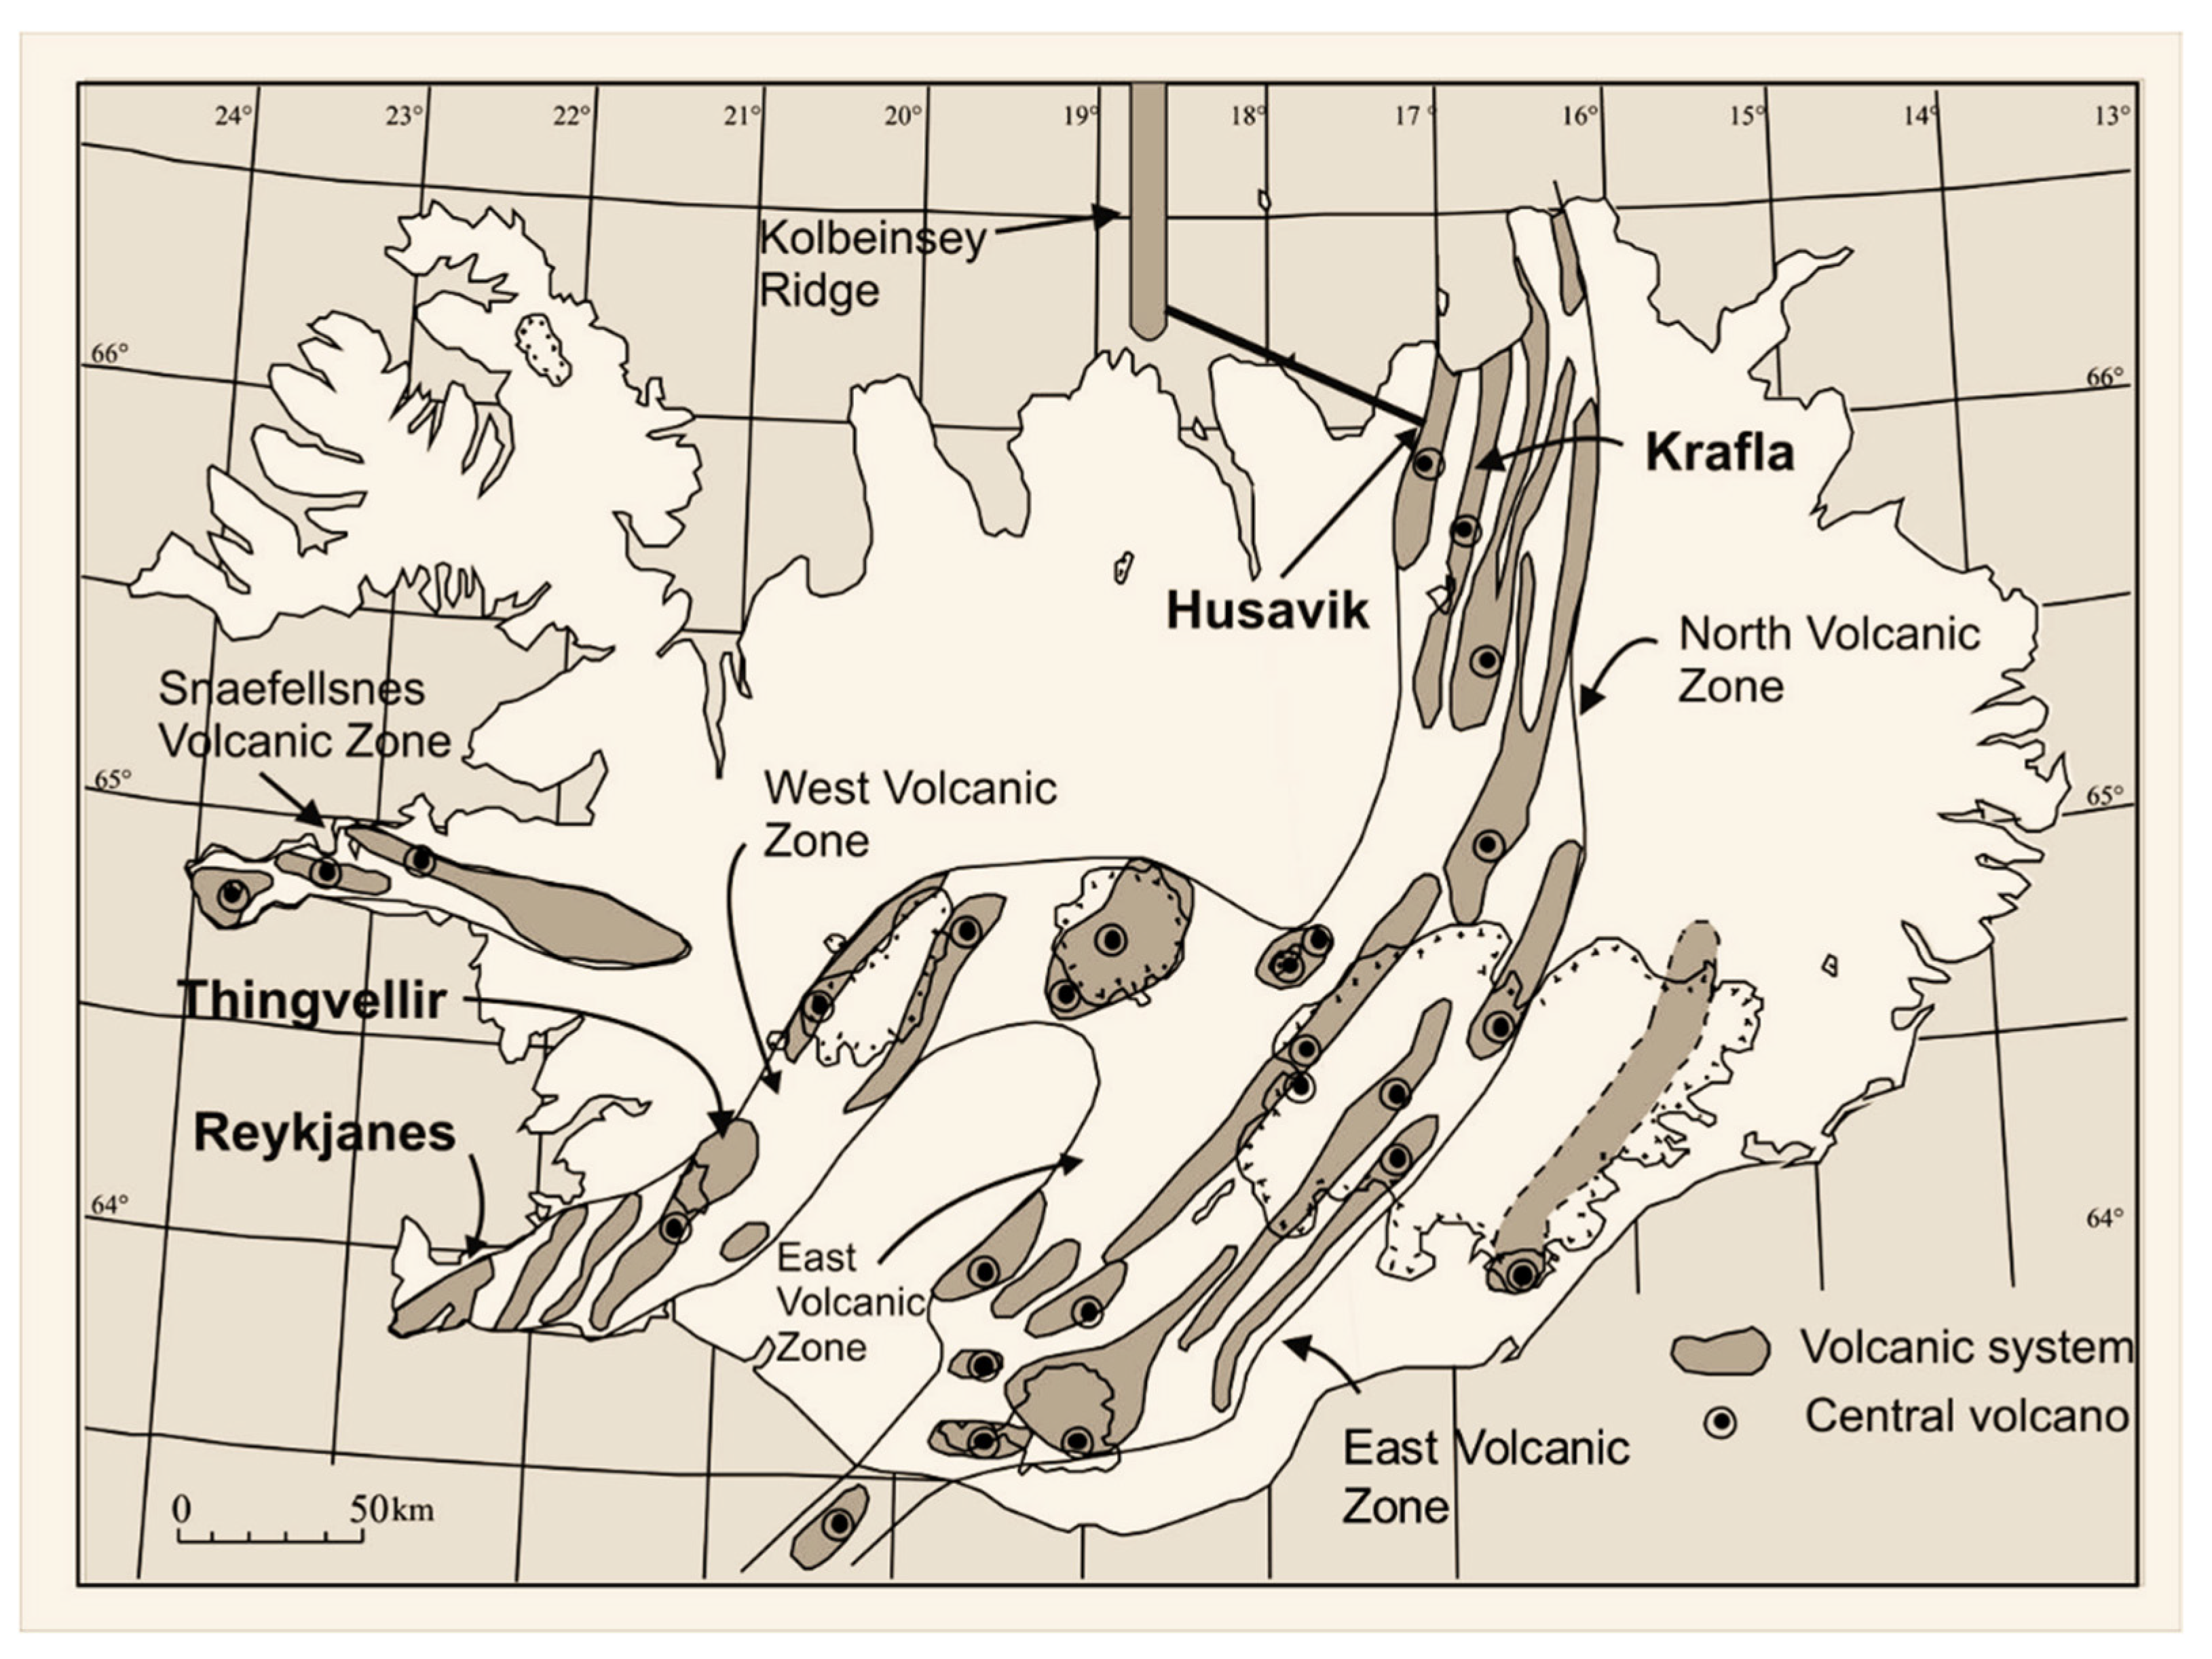
In volcanic rift zones, such as in Iceland, fissure swarms are the common surface expression of dike swarms at greater crustal depths. Fissure swarms and dike swarms together constitute parts of volcanic systems (Figure 1). In addition to the fissure swarms and dike swarms, such systems normally have a deep-seated magma reservoir and (many but not all) a shallow crustal magma chamber (Figure 2). Volcanic systems are thermodynamic systems. They receive energy, primarily due to work done on them by plate-tectonic forces but also through volcanotectonic processes and associated received heat. The heat received is partly related to the general heat flow through the Earth’s crust, but primarily through hot fluids, mainly magma but also geothermal fluids, which are transported inside the dike swarms and fissure swarms.
Thermodynamics systems are normally divided into three main classes based on their interaction with their surroundings, namely isolated, closed, and open. An isolated system allows no transfer of matter, work, or heat across its boundaries. Isolated systems are idealisations that can sometimes be approximated under laboratory conditions. However, they do not really exist in nature because gravity, for instance, affects any system in the universe, although the universe itself as a whole may perhaps be regarded as an isolated system. Neither fissure swarms nor dike swarms are remotely similar to isolated systems.
A closed system does exchange heat and/or work with its surroundings, that is, there is energy transfer across its boundaries but no transfer of matter. An active dike swarm is repeatedly injected by dikes. Since fissure swarms are commonly the surface expression of dike swarms, it follows that both receive not only energy but also matter (magma and geothermal fluids) and thus cannot be regarded as a closed system. Approximately closed systems exist in nature. An example is the Earth itself which receives great amount of solar energy per unit time but only a tiny amount of matter (mainly as cosmic dust) when compared with its own mass.
An open system does exchange both energy and matter across its boundaries and with its surroundings. All active dike and fissure swarms receive both energy (heat and work) and matter and are, therefore, open thermodynamic systems.
Large fissure swarms and dike swarms contain a great number of fractures, ranging in sizes from grain-scale fractures (~10−3 m), through outcrop-scale fractures (≥10−1 m to ≤103 m), to regional-scale fractures (≥103 m). Many of the outcrop-scale fractures in such swarms are not of tectonic origin but rather joints formed through cooling (columnar joints in igneous rocks) or shrinkage (in sedimentary rocks) and related processes. These joints are very important for tectonic fracture development because dikes, faults, and tectonic tension fractures use them when developing their propagation paths [1,2]. Given the enormous number of available joints for tectonic fracture development in dike swarms and fissure swarms, appropriate tools for understanding various aspects of the formation and development of such swarms are thermodynamics and statistical physics.
The purpose of this paper is to use certain principles from thermodynamics and statistical physics to explore the effects of variation in the energy budget of volcanic systems on the development of dike swarms and fissure swarms. The main data are from well-exposed dike swarms and fissure swarms in Iceland, but the results are completely general and apply to such swarms everywhere. Thermodynamic and statistical physics principles are used to show how the Gibbs–Shannon formula follows from the Helmholtz free energy. The Gibbs–Shannon formula is then applied to explain the size distributions of tectonic fractures in the selected fissure swarms and dike swarms. A particular focus is on explaining how the statistical size distributions of tectonic fractures (here tension fractures, normal faults, and dikes) can the accounted for in terms of the probability of various crustal stress states—by analogy with microstates in statistical physics—and the related concept of stress-field homogenisation.

2. Basic Characteristics of Fissure Swarms and Dike Swarms

Here I provide a brief summary of some of the main characteristics of fissure swarms and dike swarms. No attempt is made to cover the extensive literature on these topics since recent overviews of the literature are available [1,3]. The focus is rather on those aspects of fissure swarms and dike swarms that are most relevant to the present study. The specific data in relation to thermodynamics and statistical physics is provided in later sections.

2.1. Fissure Swarms

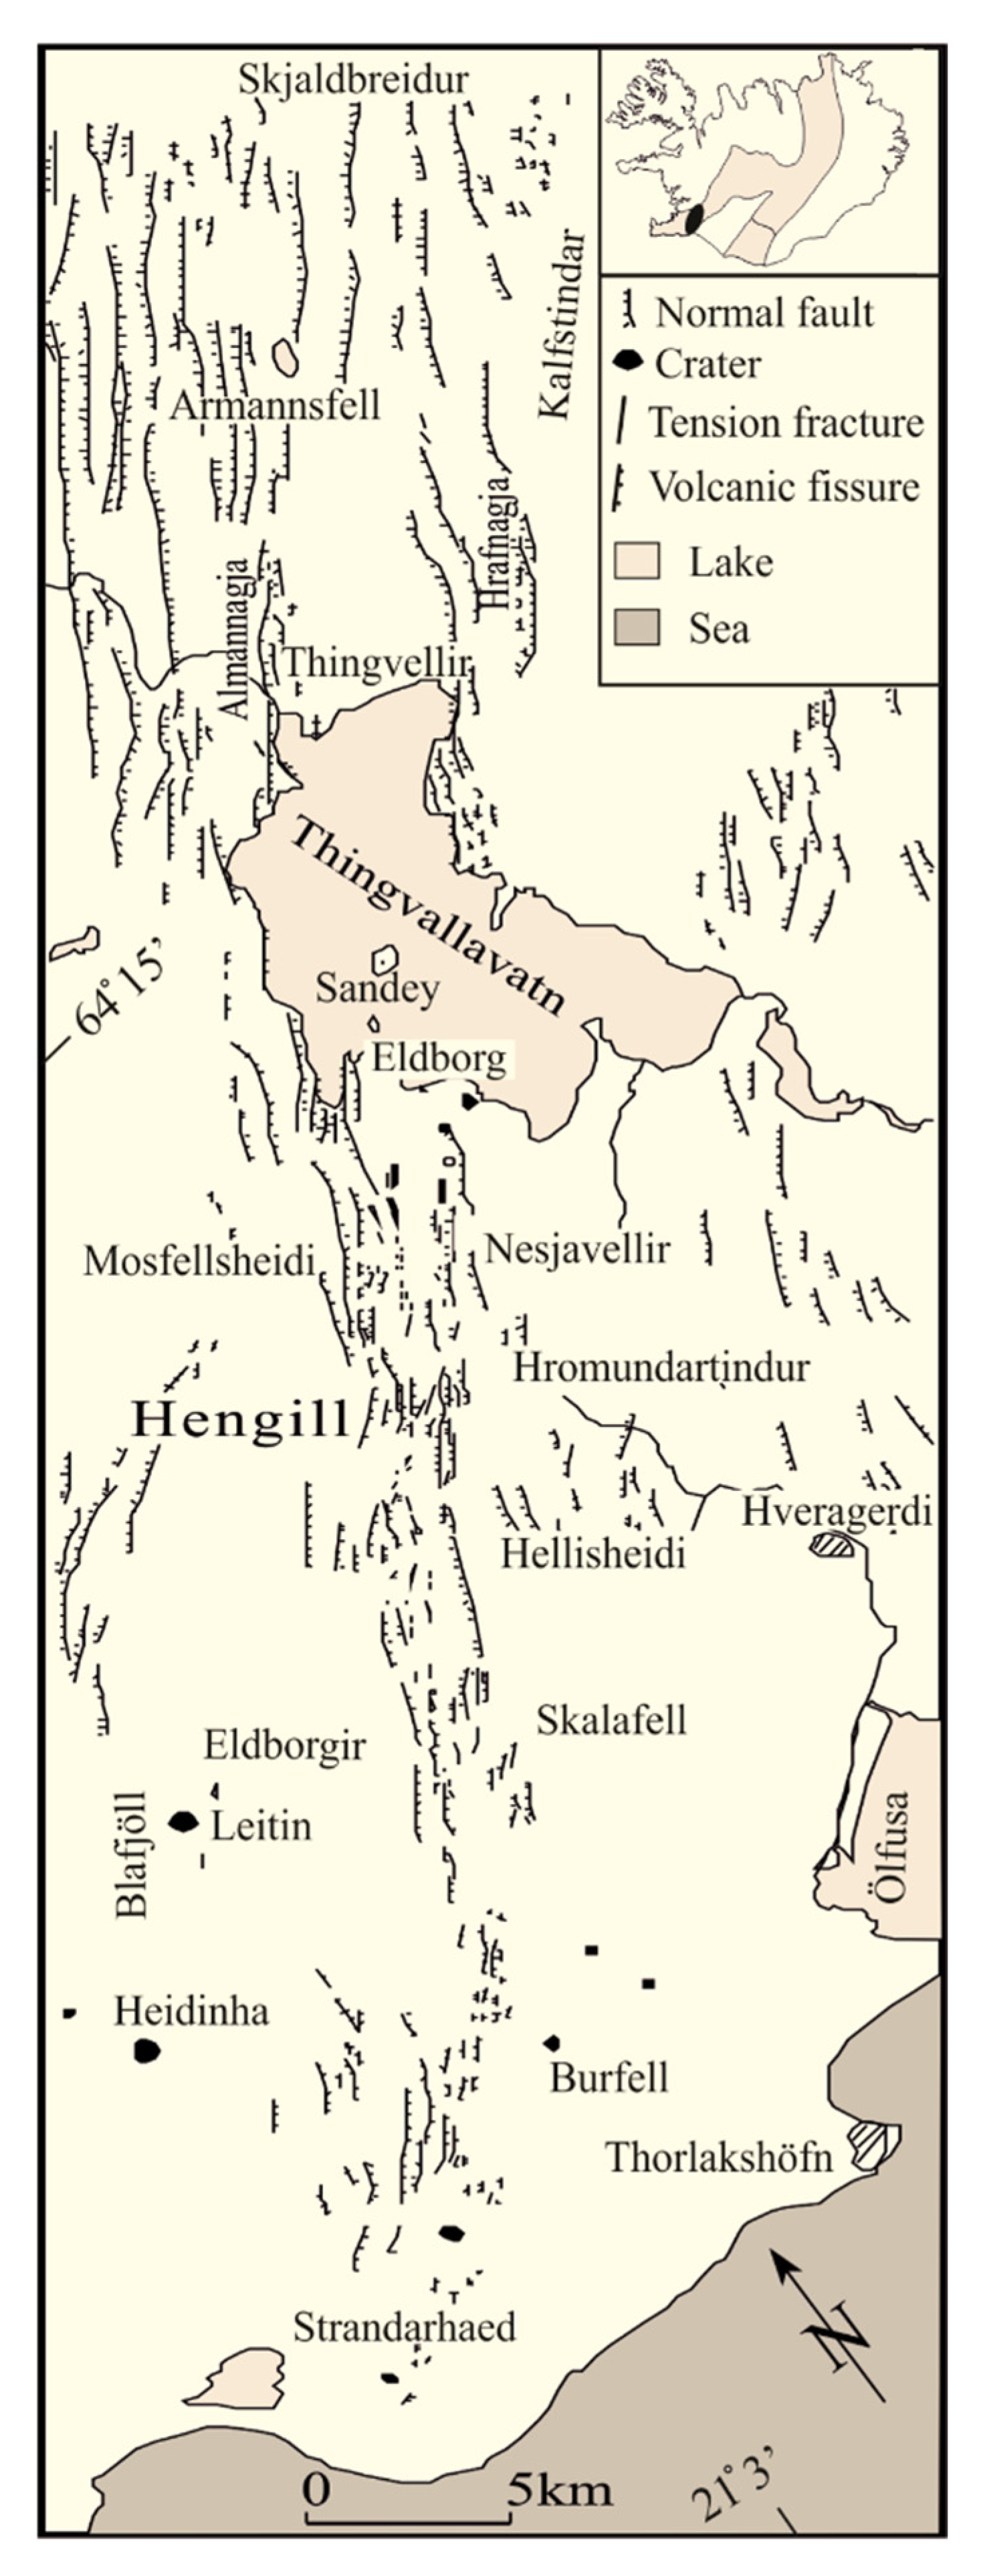
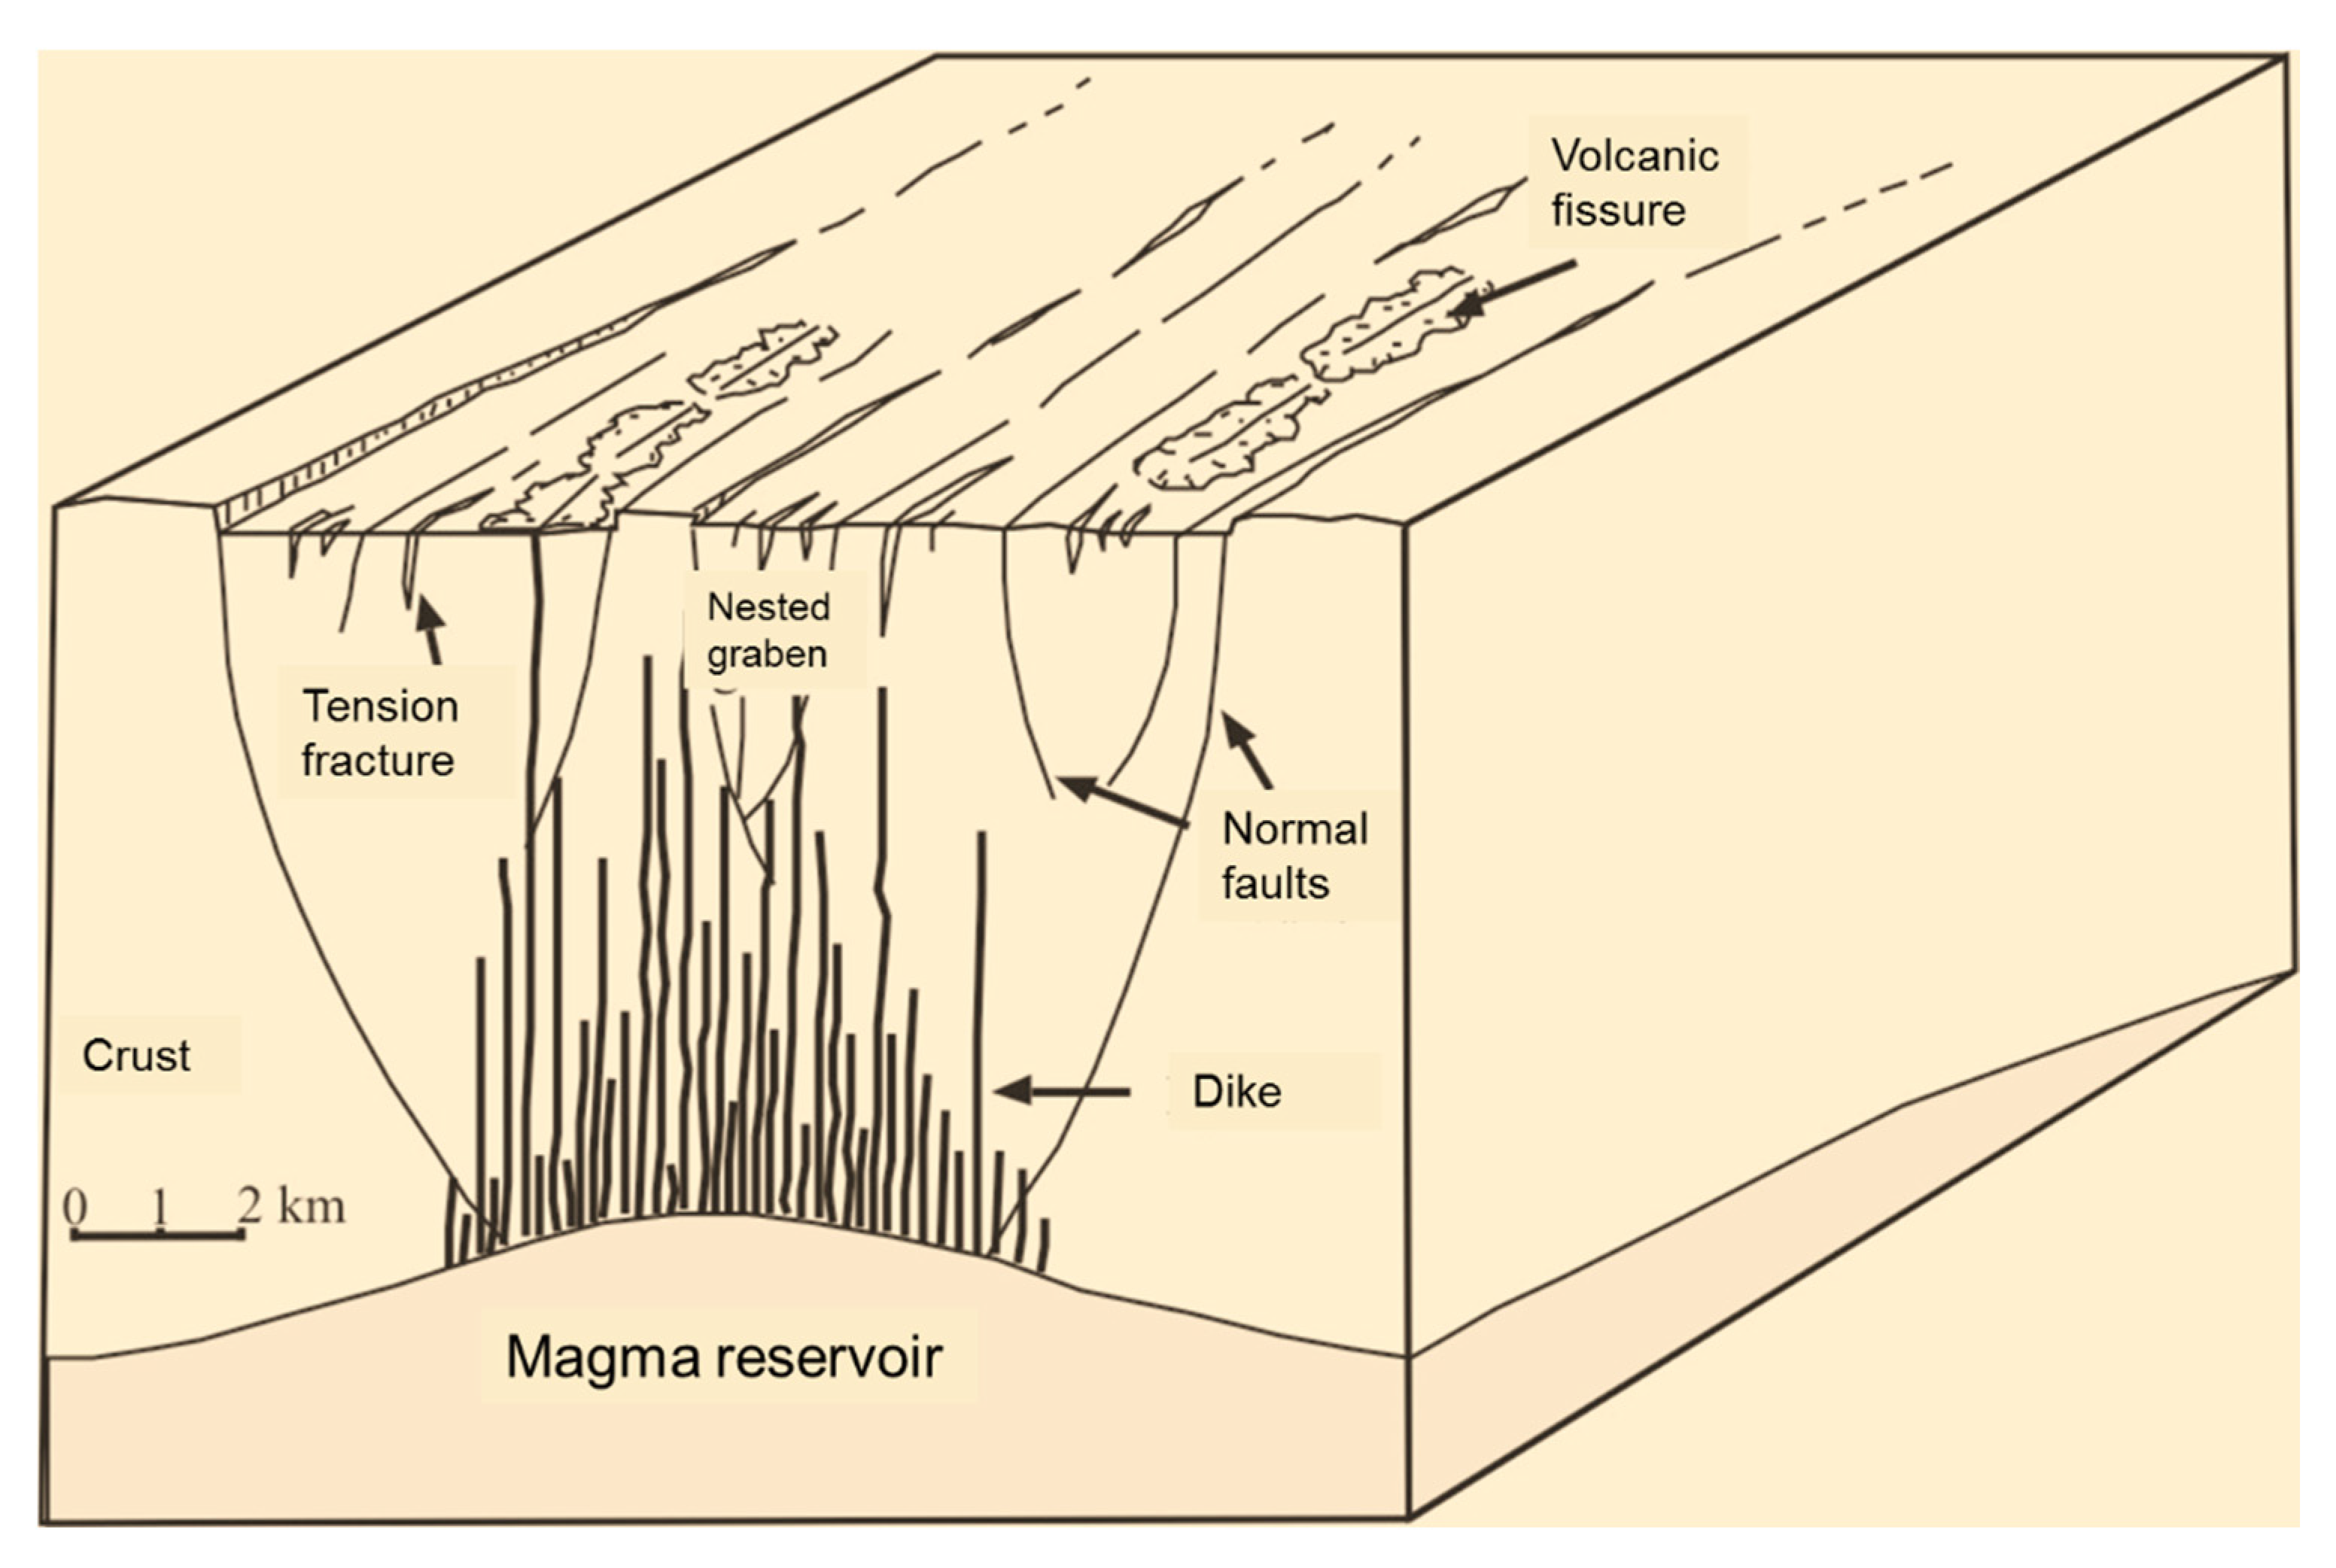
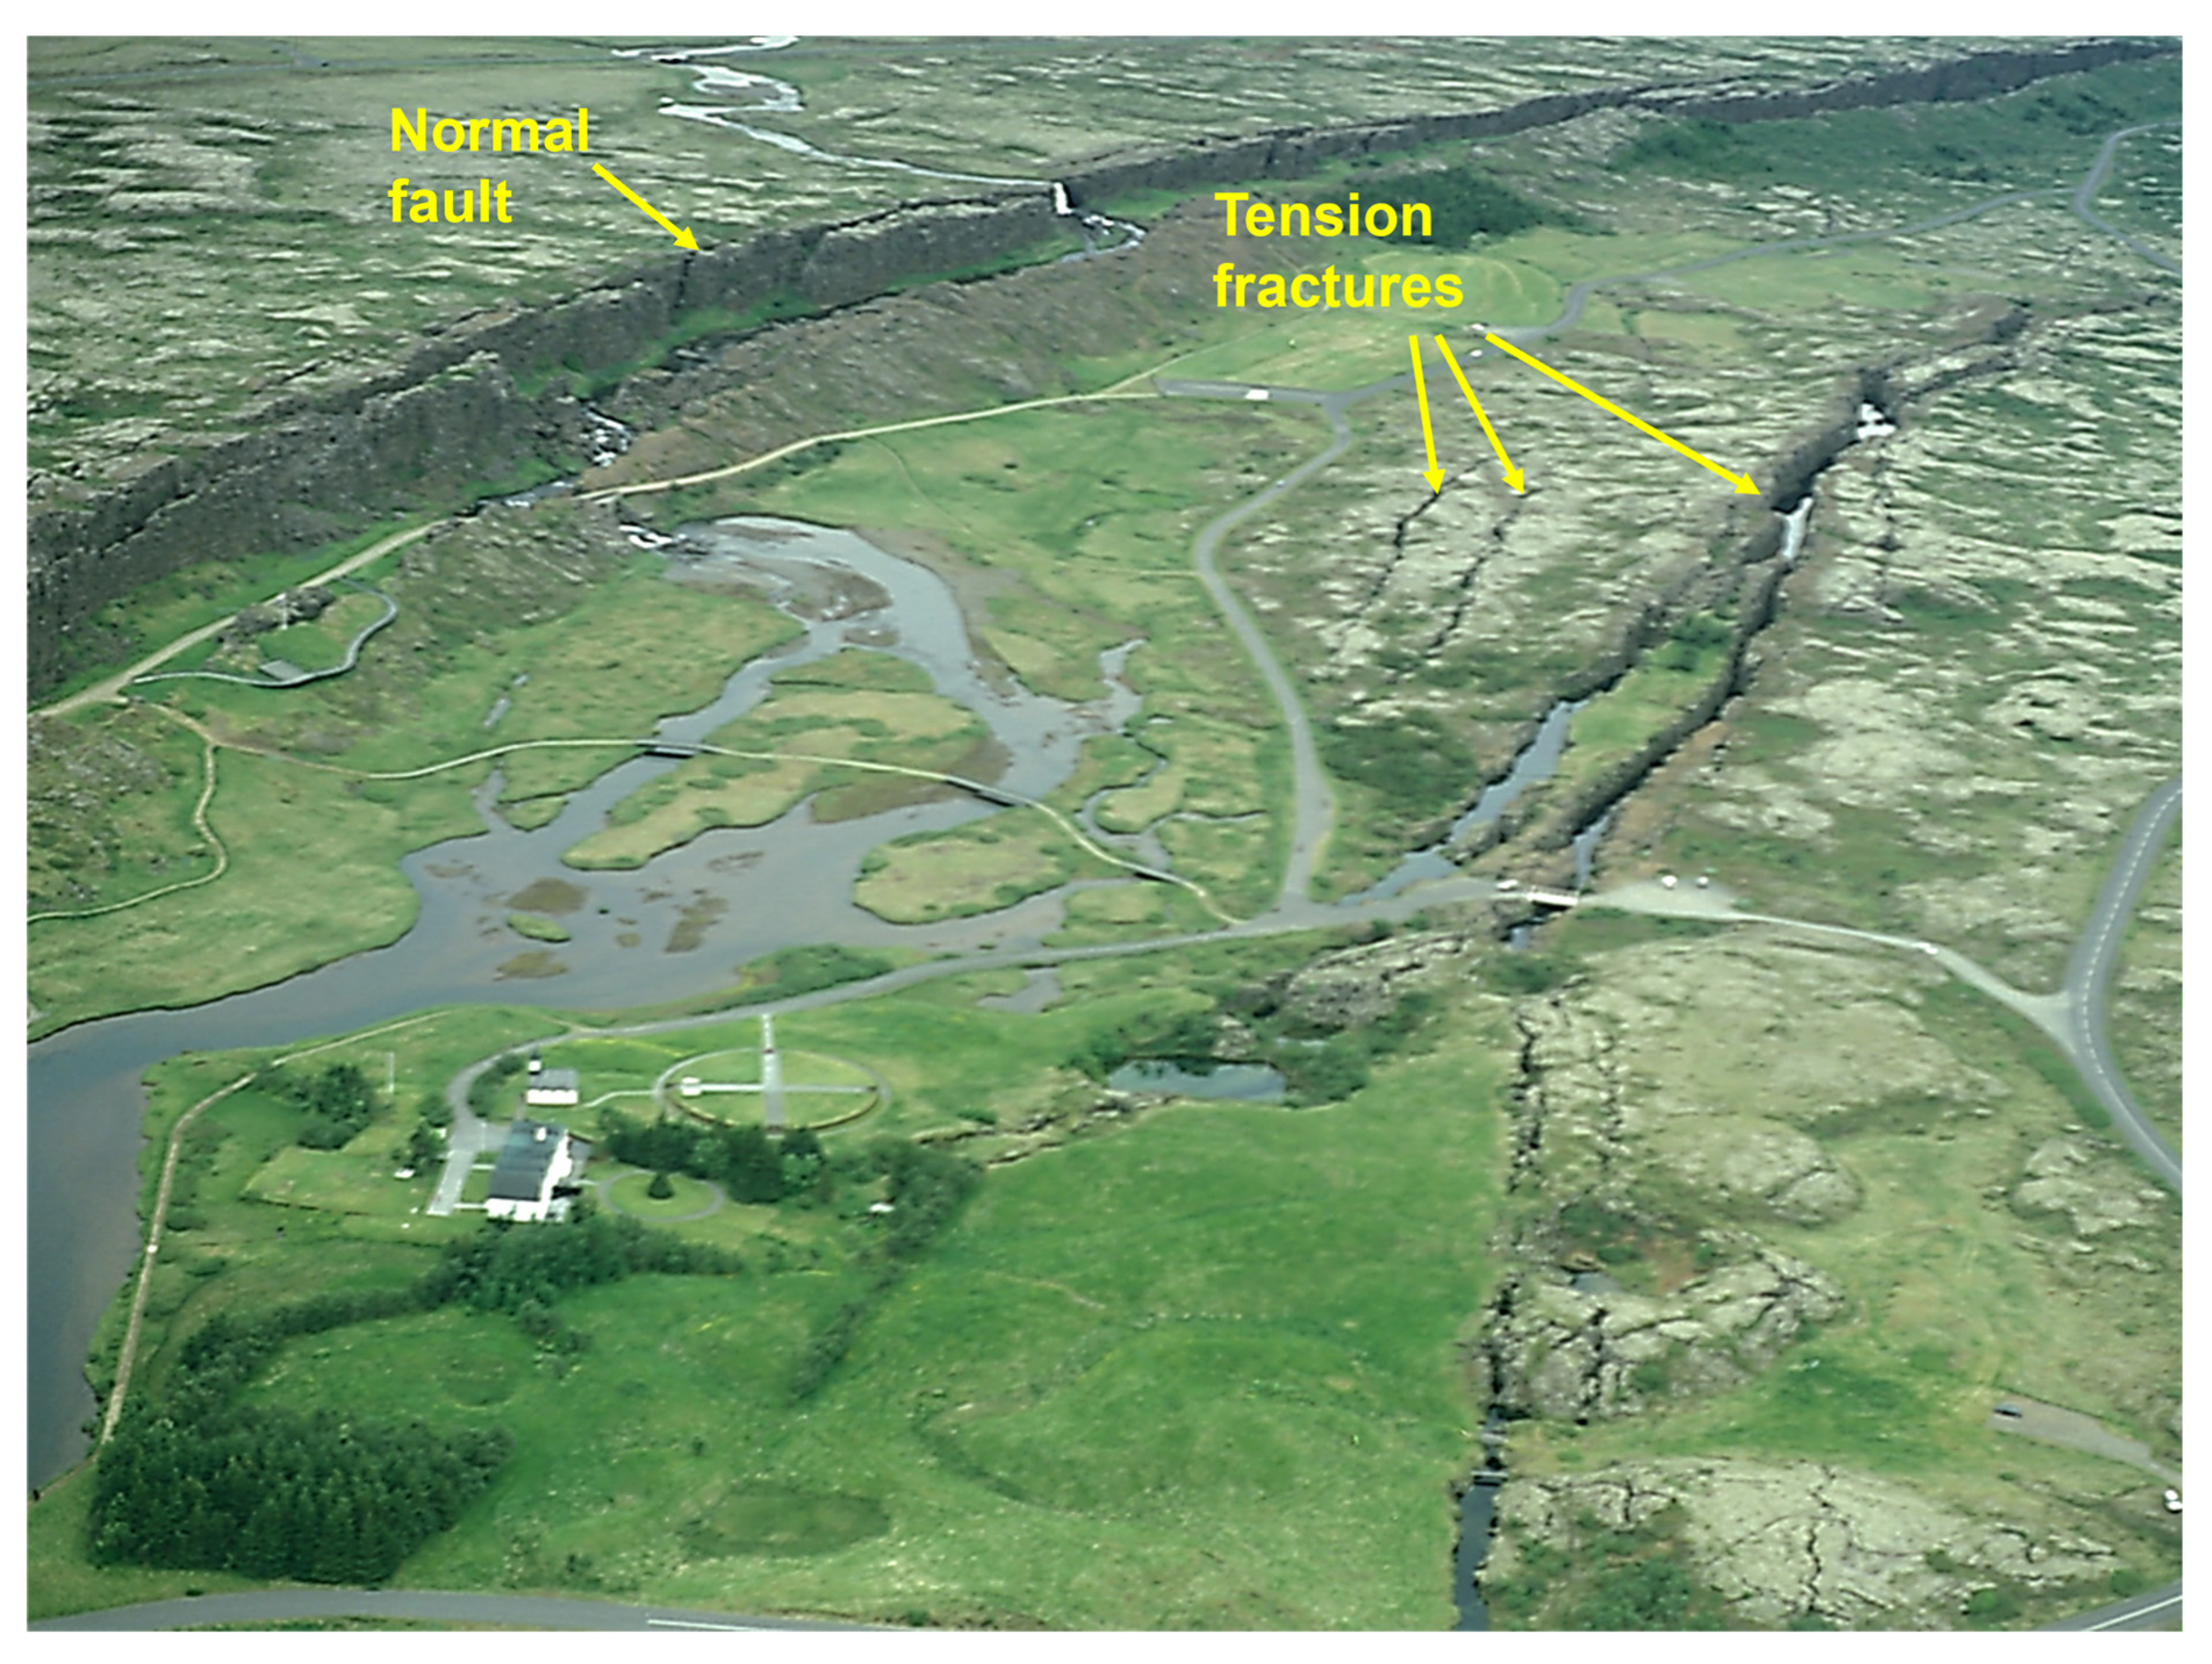
These swarms are of Holocene age and characterise divergent plate boundaries in general and rift-zone volcanic systems in particular (Figure 1). A typical fissure swarm in Iceland has a length of many tens of kilometres and a width of five to ten kilometres (Figure 3). At the surface, a fissure swarm may contain a few hundred large-scale tension fractures and normal faults, as well as many volcanic fissures (Figure 3). The volcanic fissures are the surface expressions of feeder-dikes. In addition, there are many more dikes that become arrested, that is, do not erupt (Figure 4). These dikes are not Holocene feeders and thus not presented by volcanic fissures at the surface (Figure 2 and Figure 3). Additionally, there are numerous small-scale joints, particularly cooling or columnar joints in the rocks that constitute the fissure swarms. Since the swarms receive both energy and matter, they are, as indicated, open thermodynamic systems.
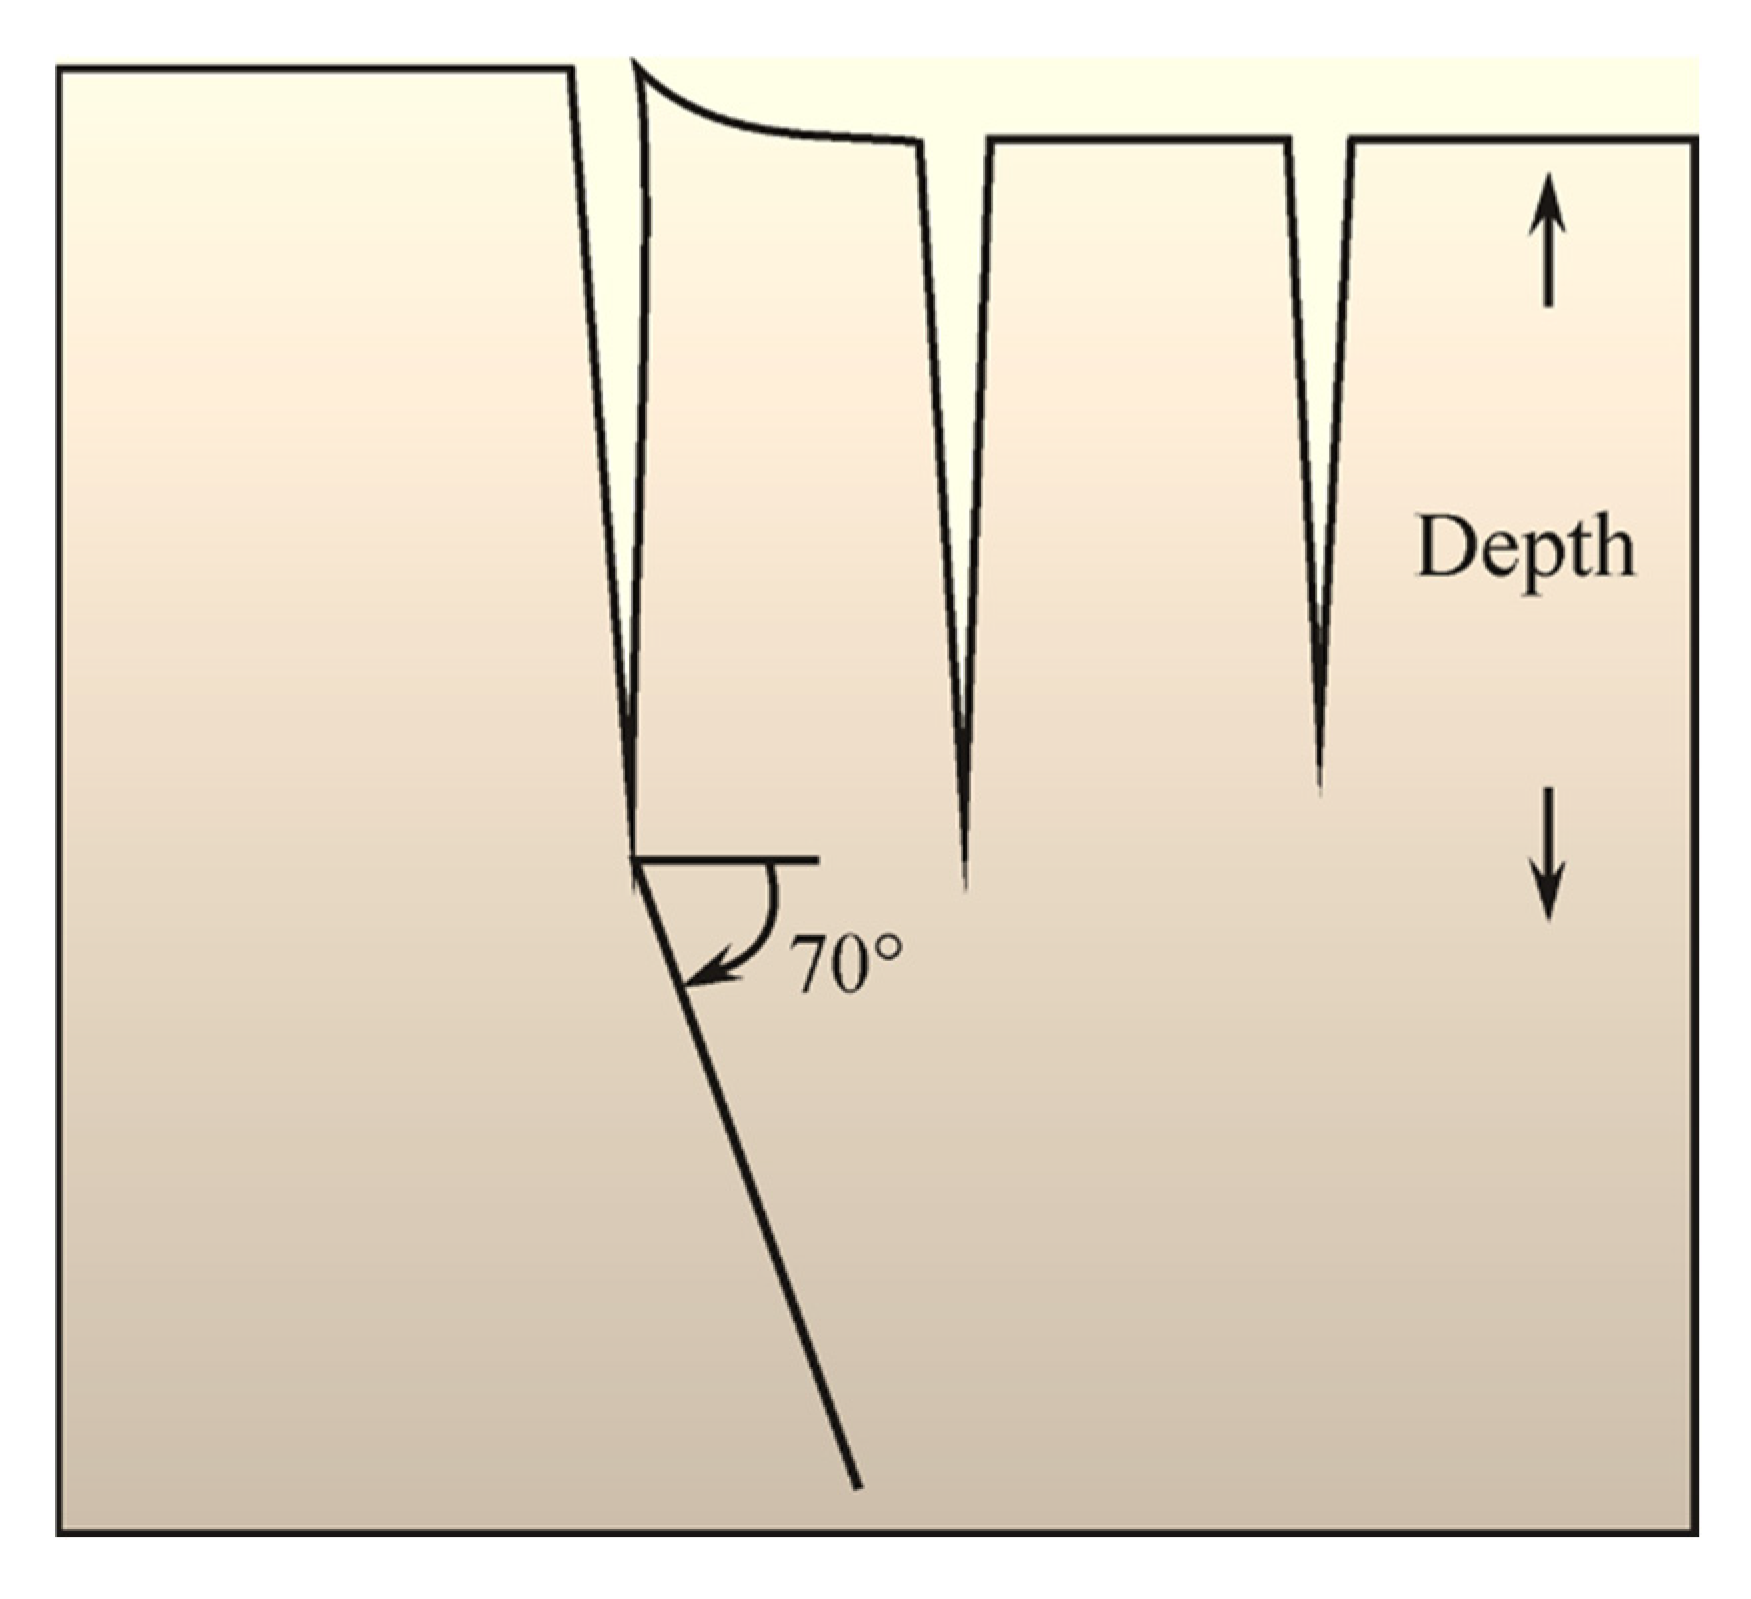
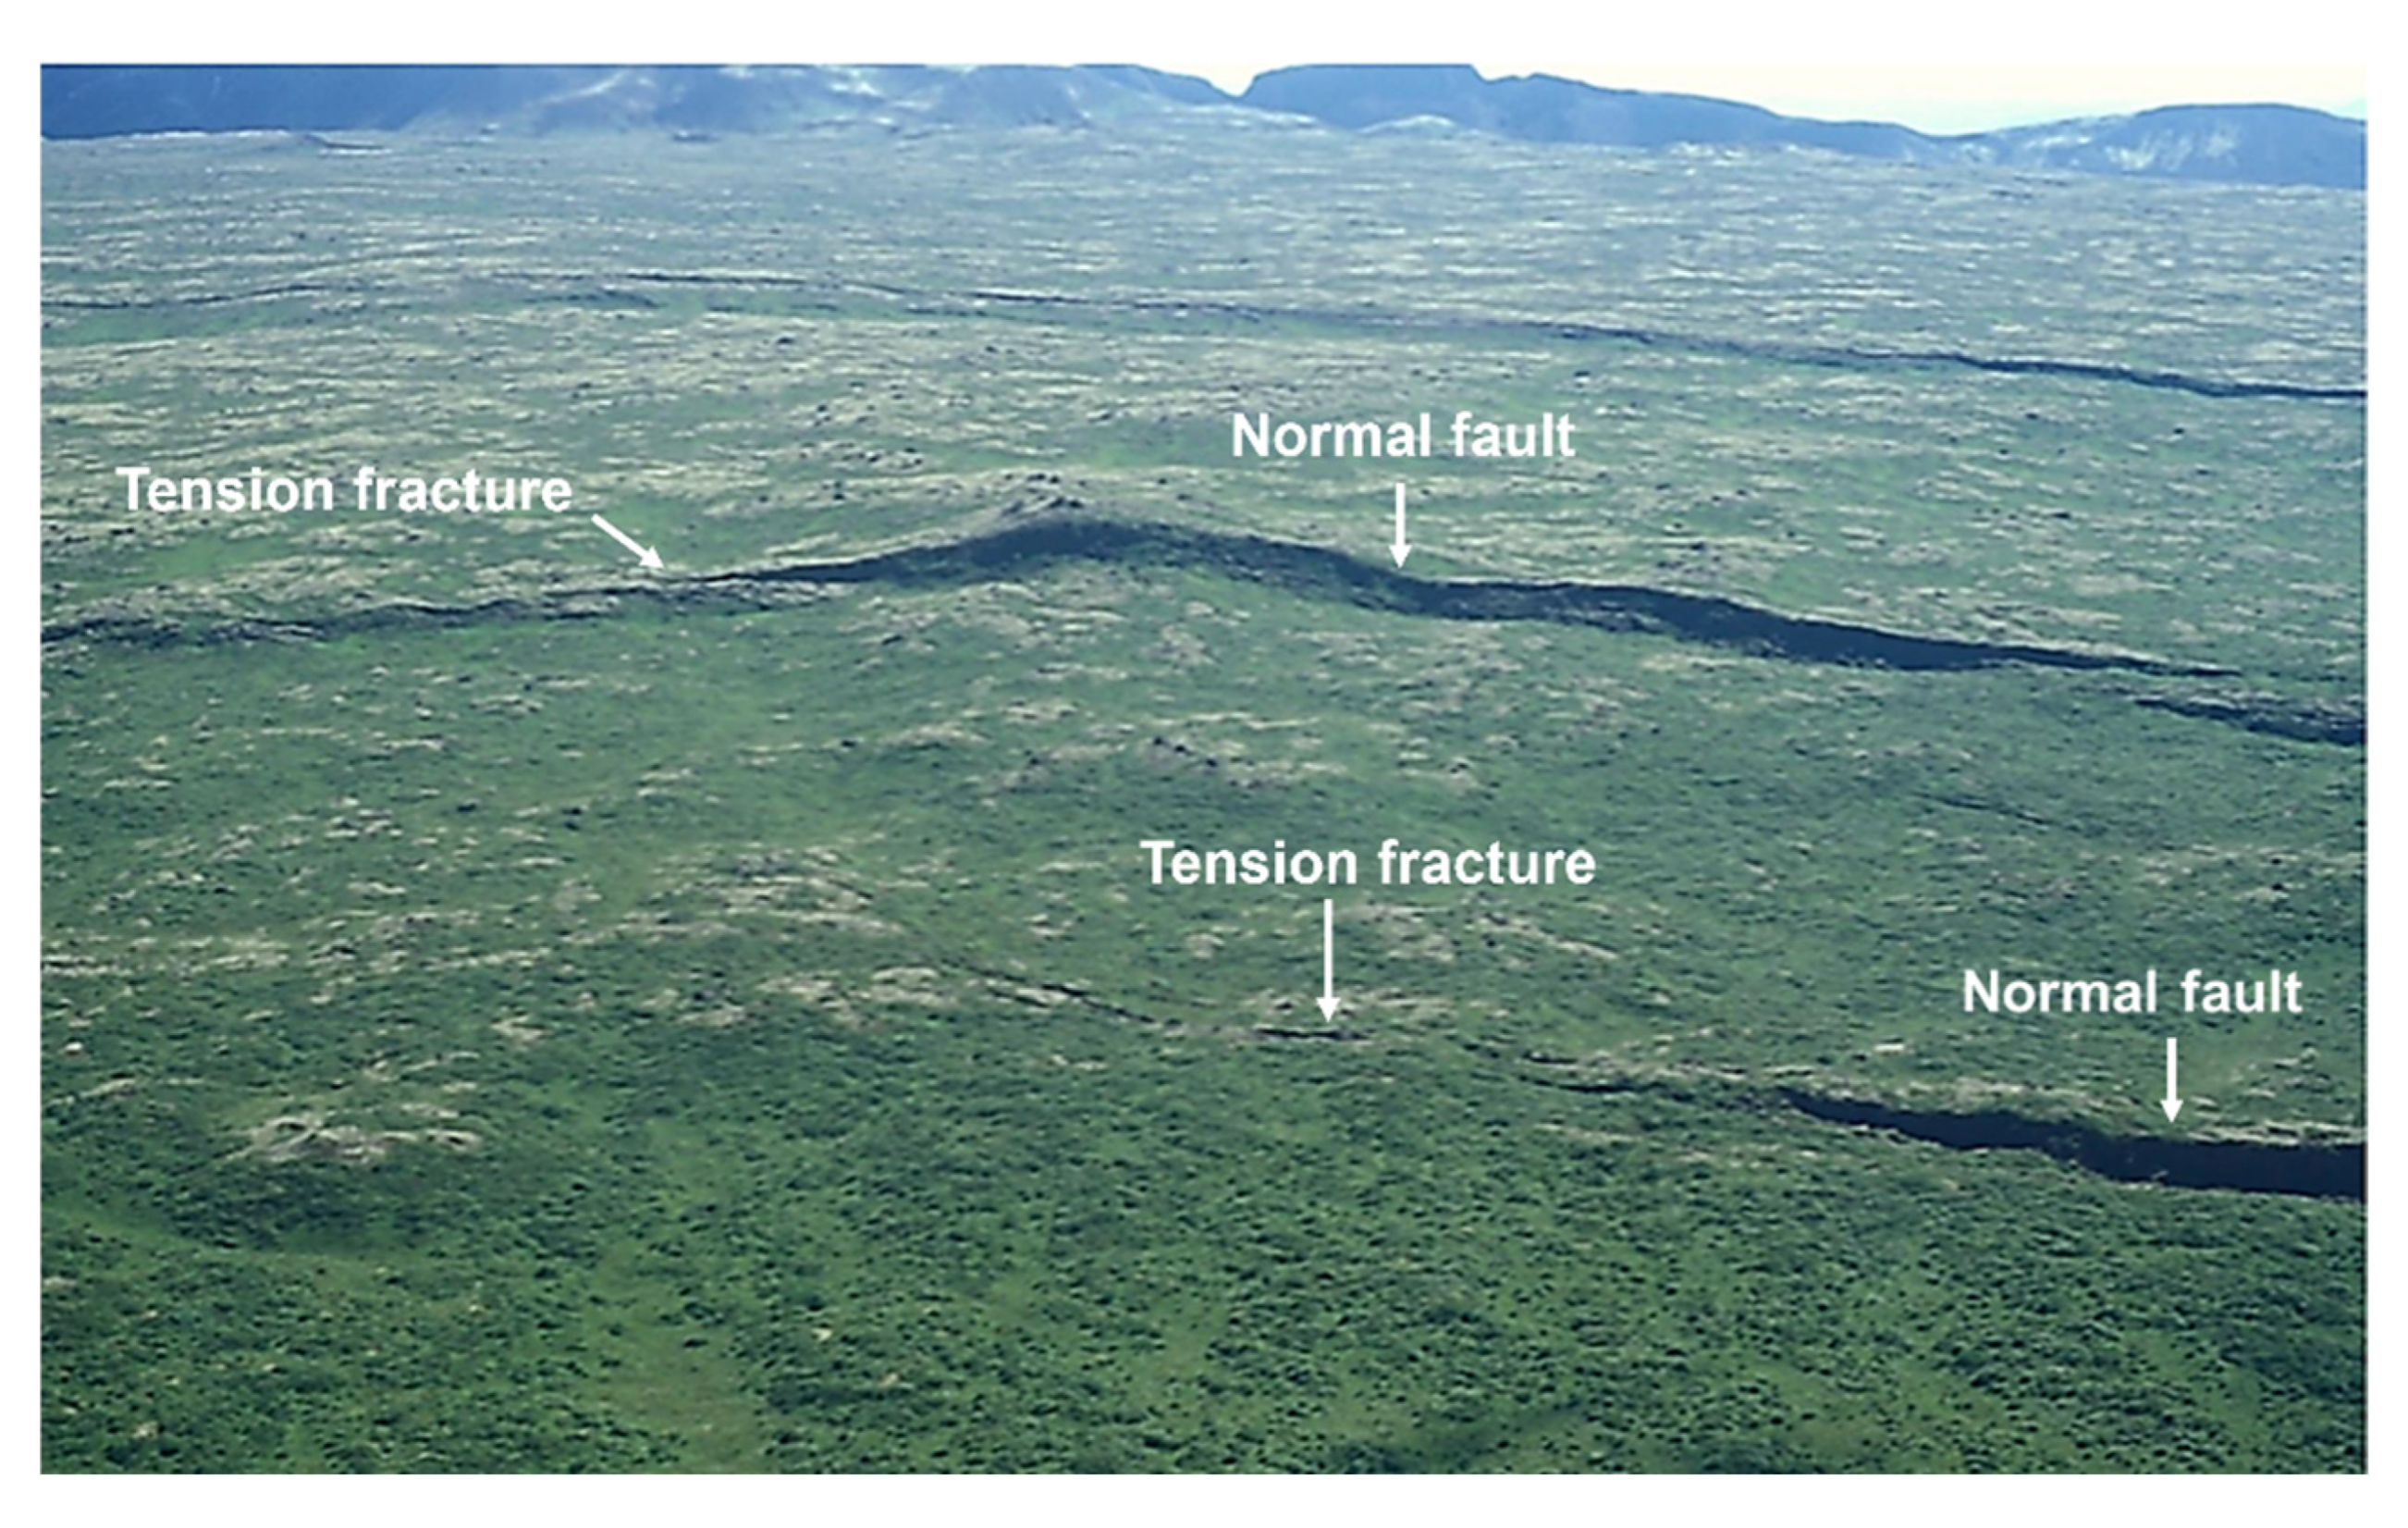
The typical surface fractures of a fissure swarm are tension fractures and normal faults (Figure 4 and Figure 5). The maximum depth of tension fractures dmax is several hundred metres, as follows from the Griffith crack theory [4] through the following equation [3,5]:
d max = 3 T 0 ρ r g
where T0 is the in-situ tensile strength of the rock, ρr its average density, and g the acceleration due to gravity. For a typical in-situ tensile strength of 3 MPa and near-surface density of 2500 kg m−3, dmax is 367 m [3]. For thick pahoehoe lava flows with numerous columnar joints, the tensile strength may be only 1–2 MPa, in which case dmax is between 122 m and 245 m. Thus, once large-scale tension fractures reach the depths of the order of a few to several hundred metres, they would usually change into normal faults (Figure 6).
This means that all the impressive tension fractures of fissure swarms (Figure 4 and Figure 5) are really shallow (Figure 6). When during rifting episodes the tension fractures attempt to reach depths of many hundred metres, they must, by Equation (1), change into normal faults. Because many normal faults reaching the surface have semi-circular or semi-elliptical geometries, as seen in vertical sections—that is, they are typical part-through-cracks (with the shape of a penny cut in half)—they become gradually shallower on approaching their lateral surface tips [3]. Consequently, normal faults are seen to change into tension fractures at their tips (Figure 7), namely tension fractures that have not reached the critical depth of Equation (1) so as to change into normal faults.
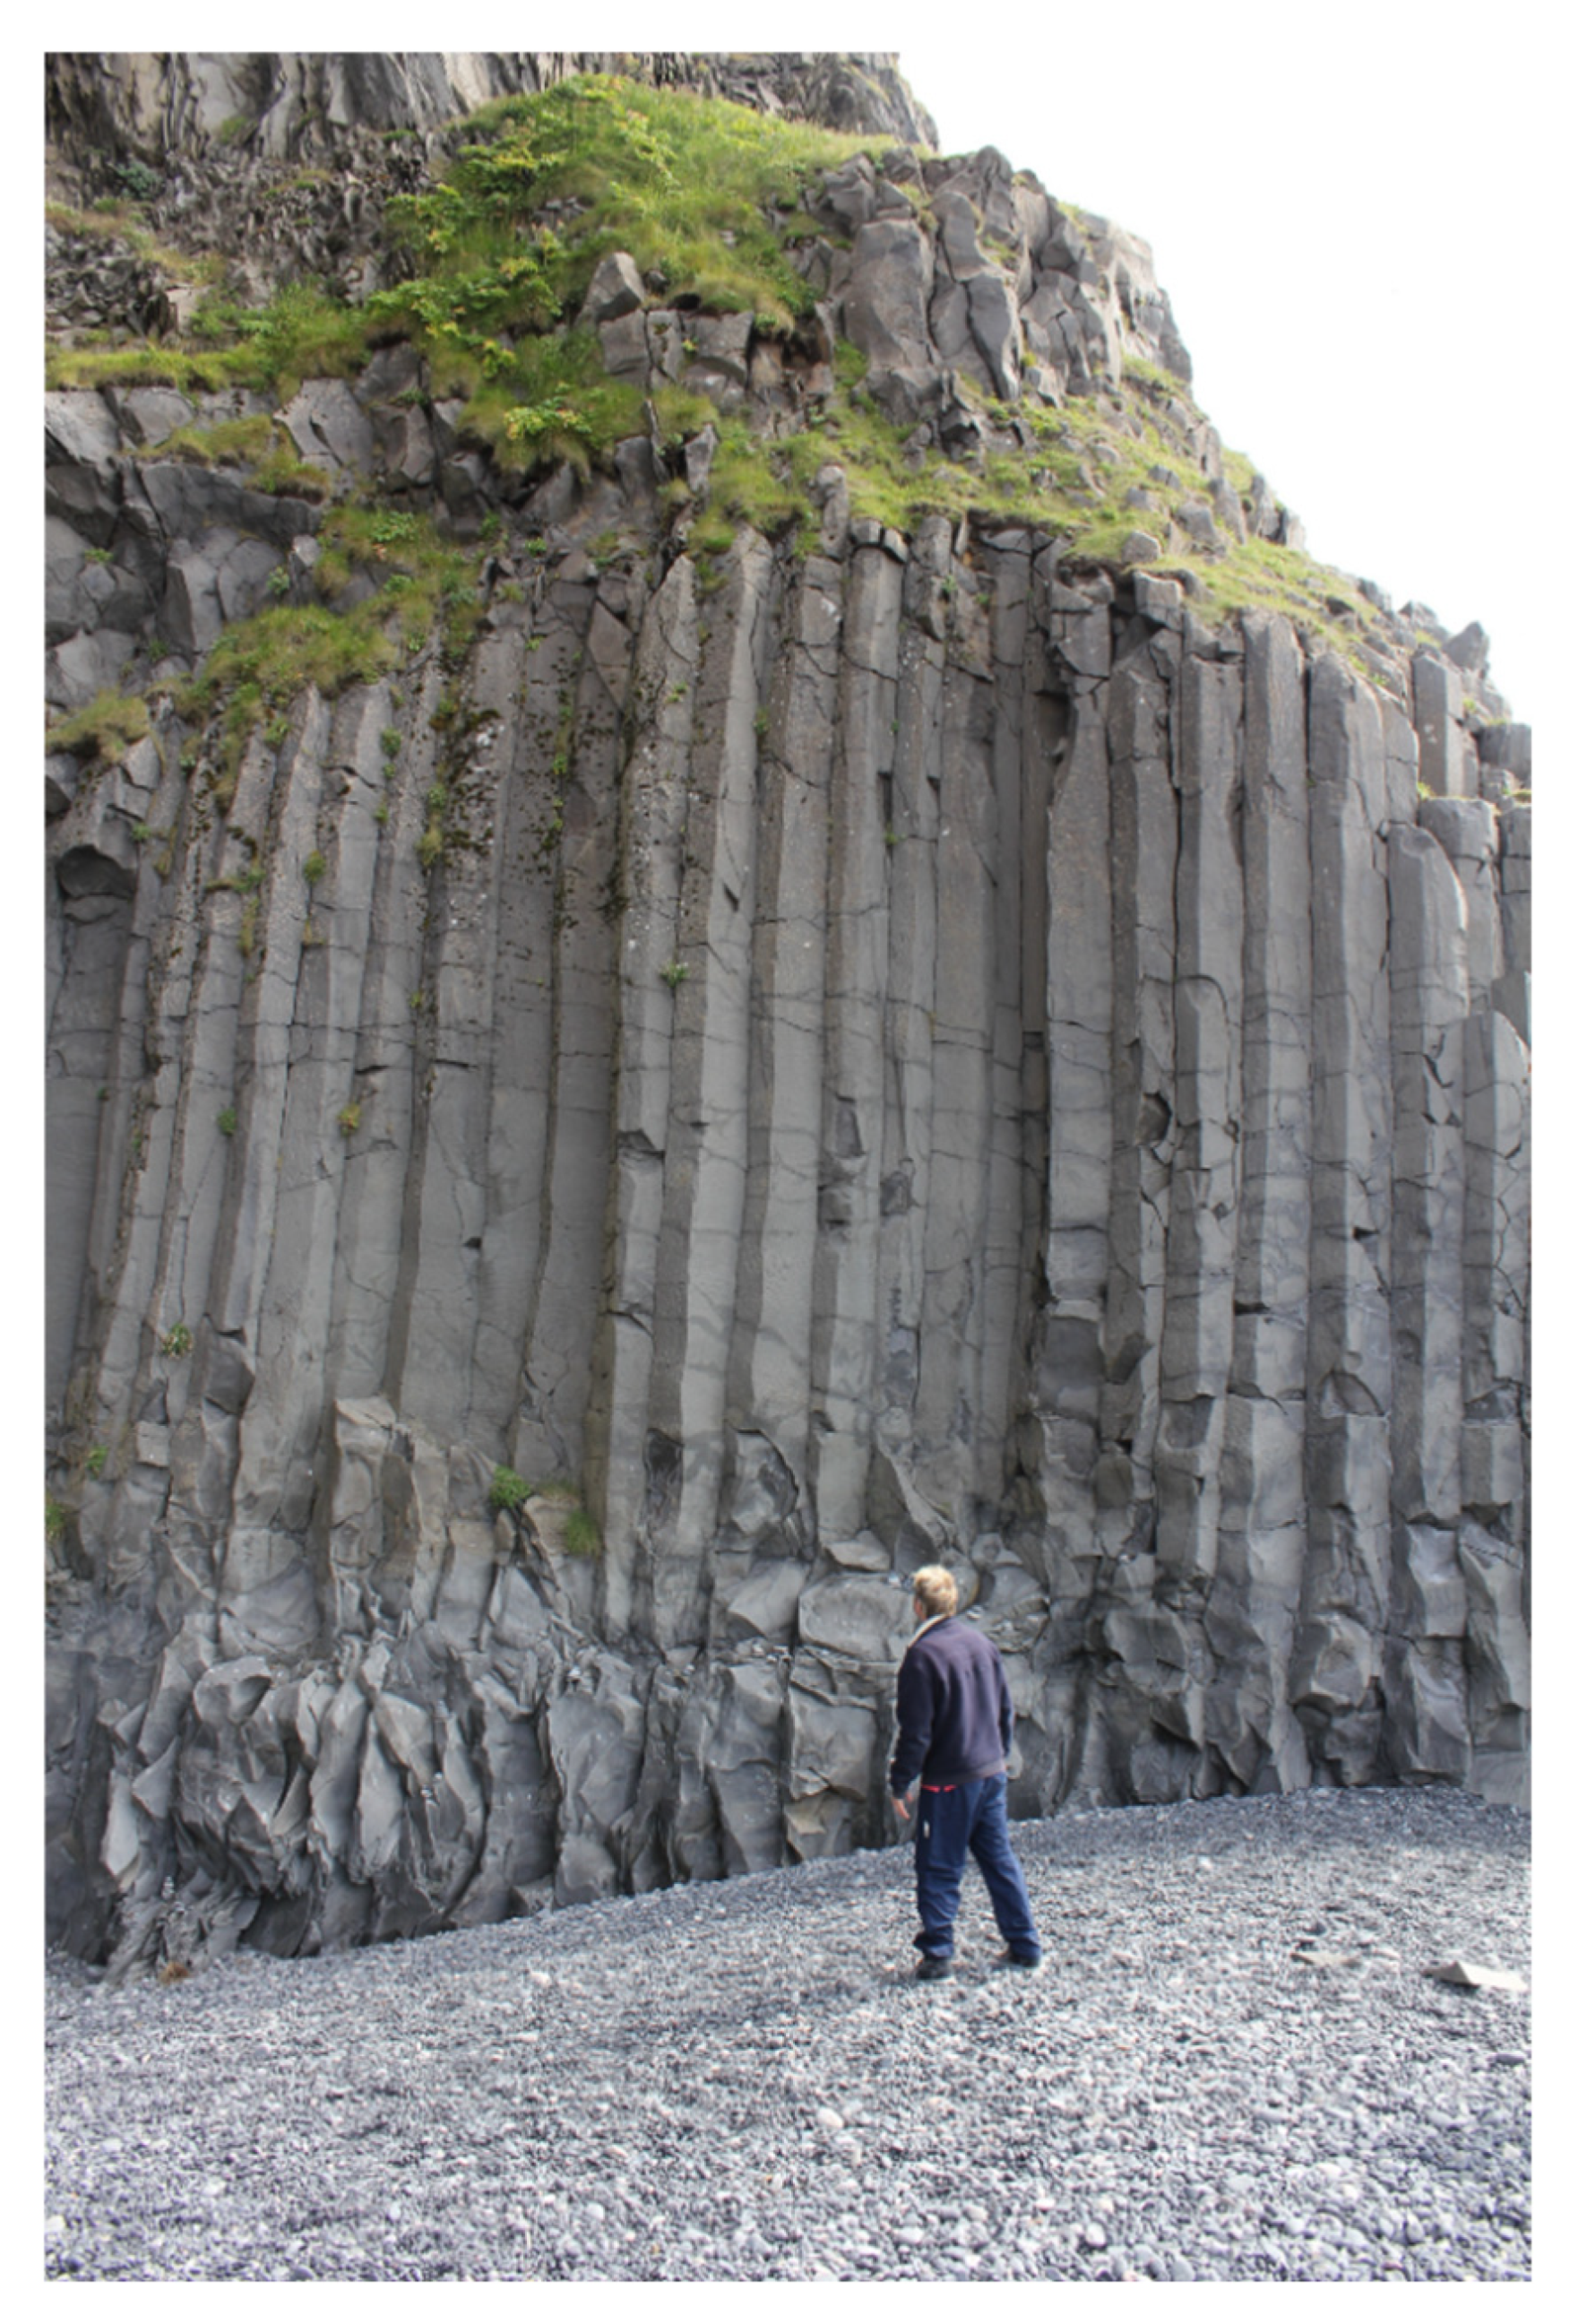
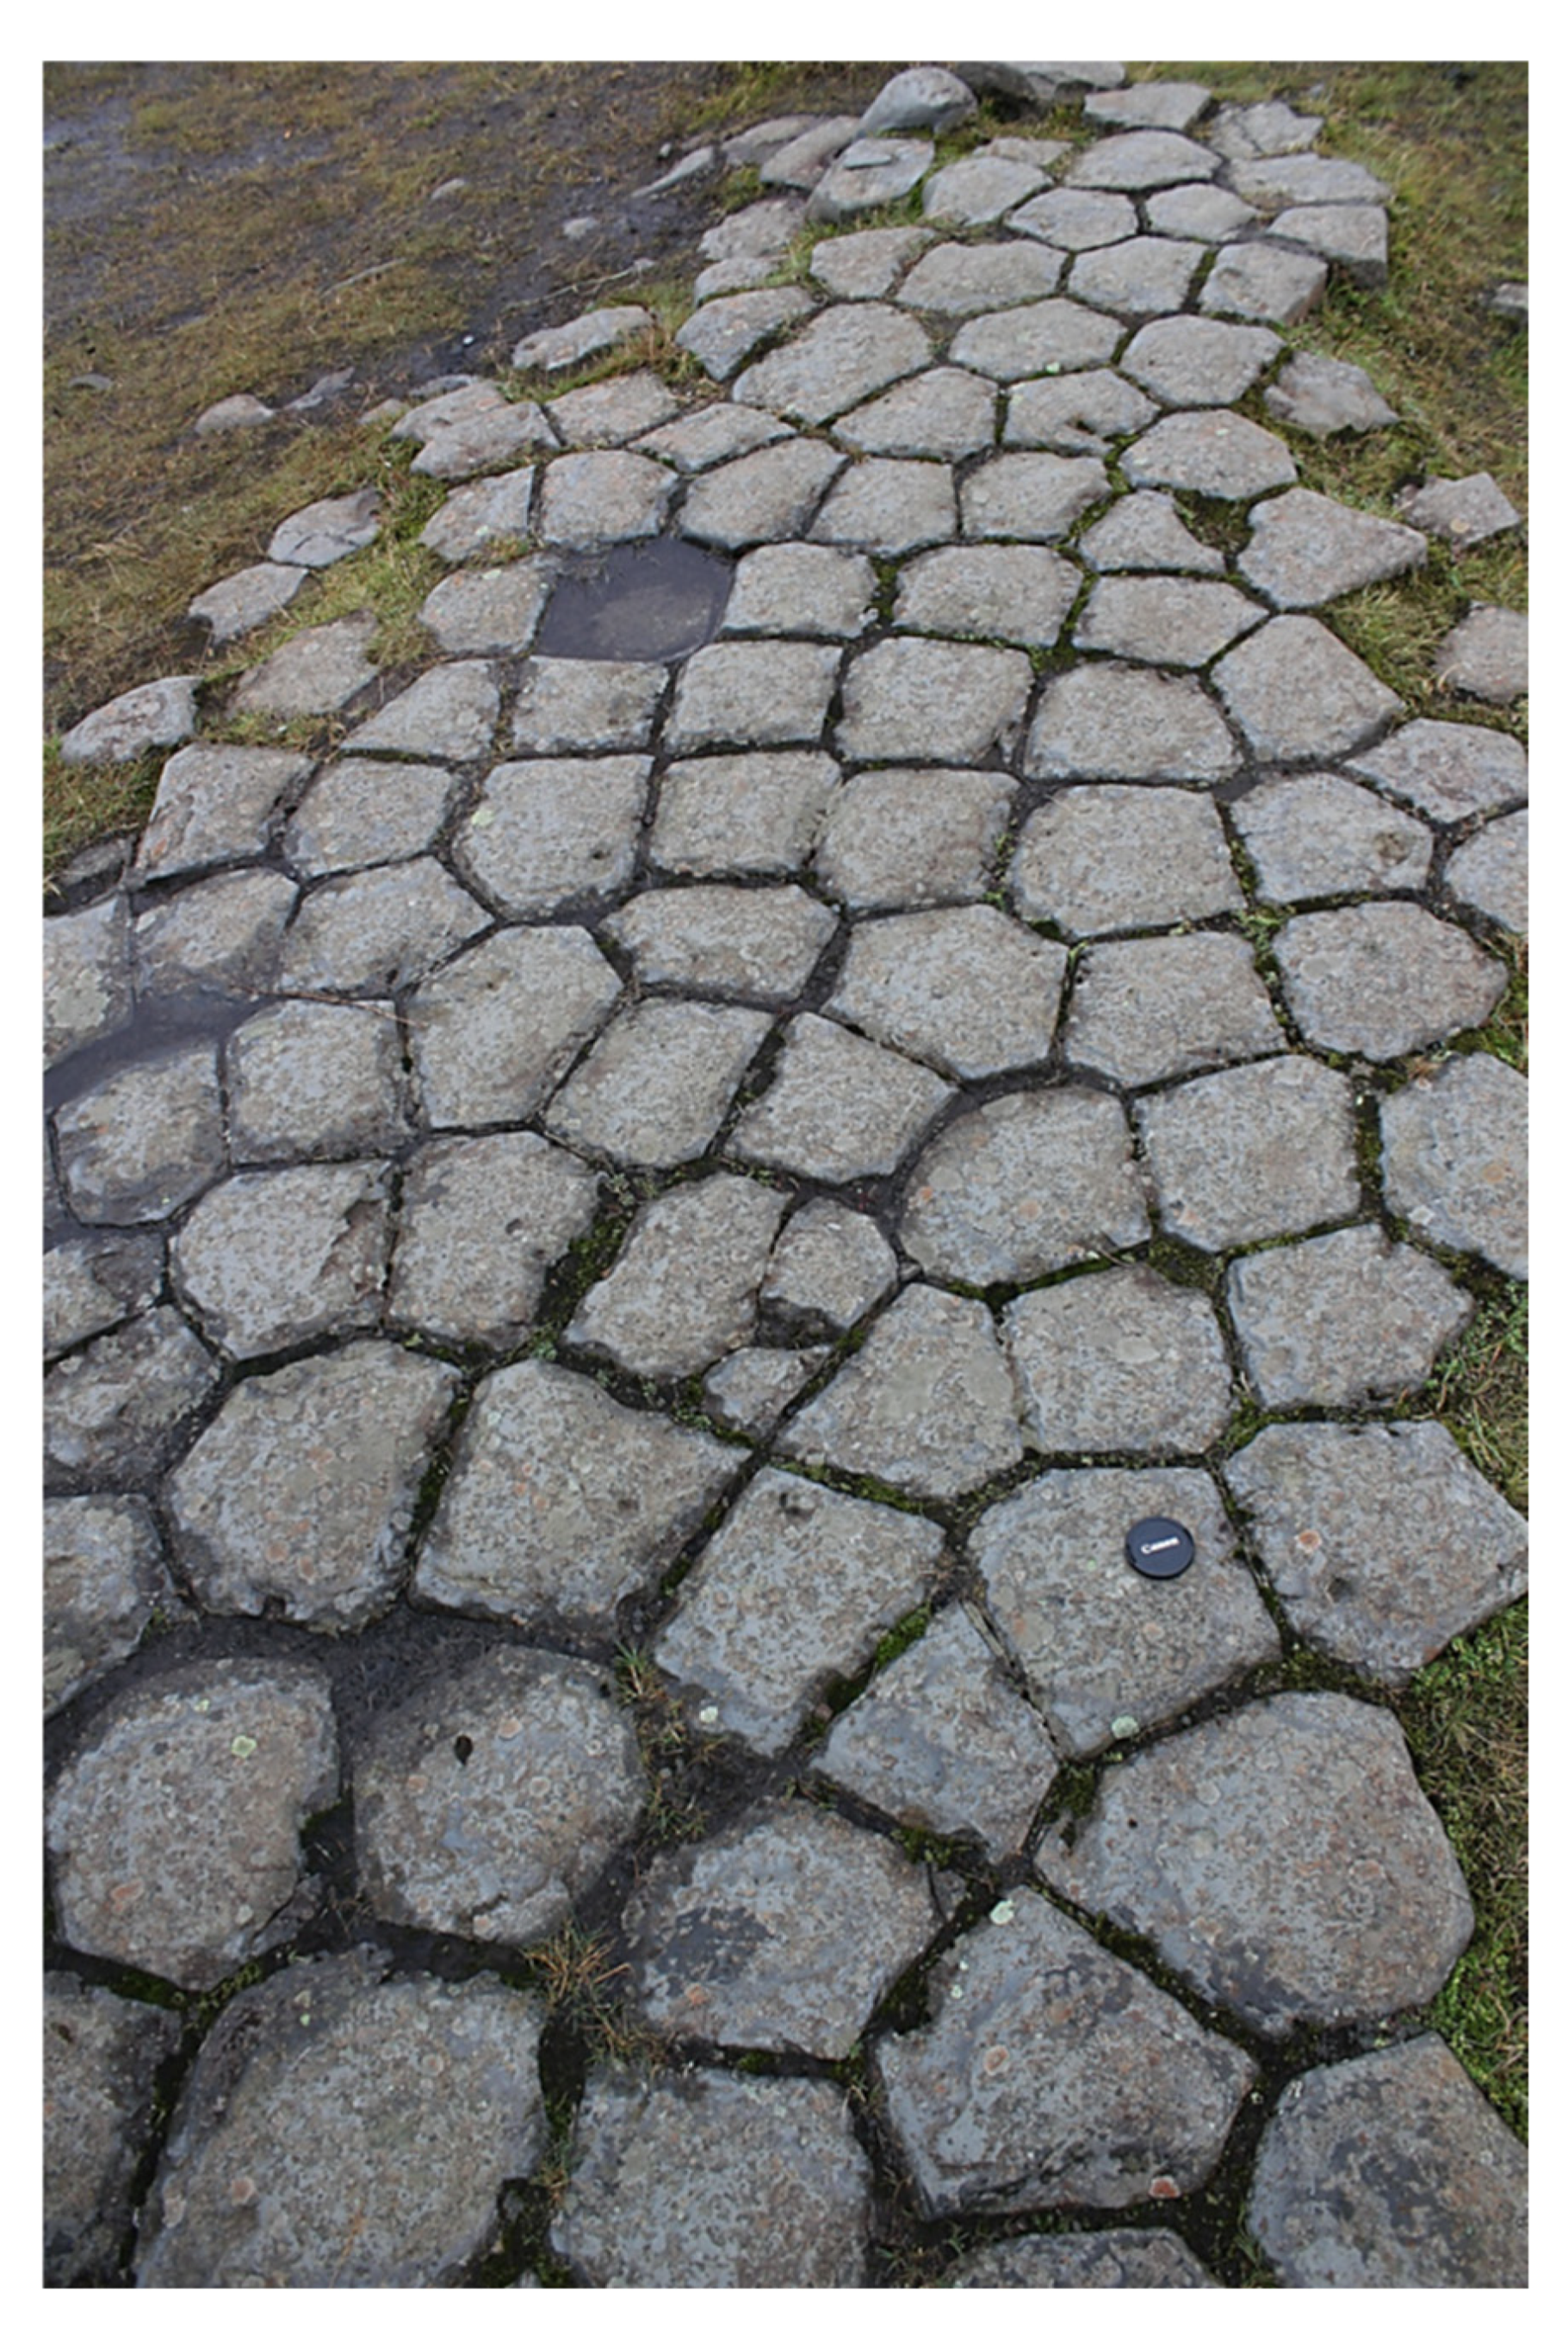
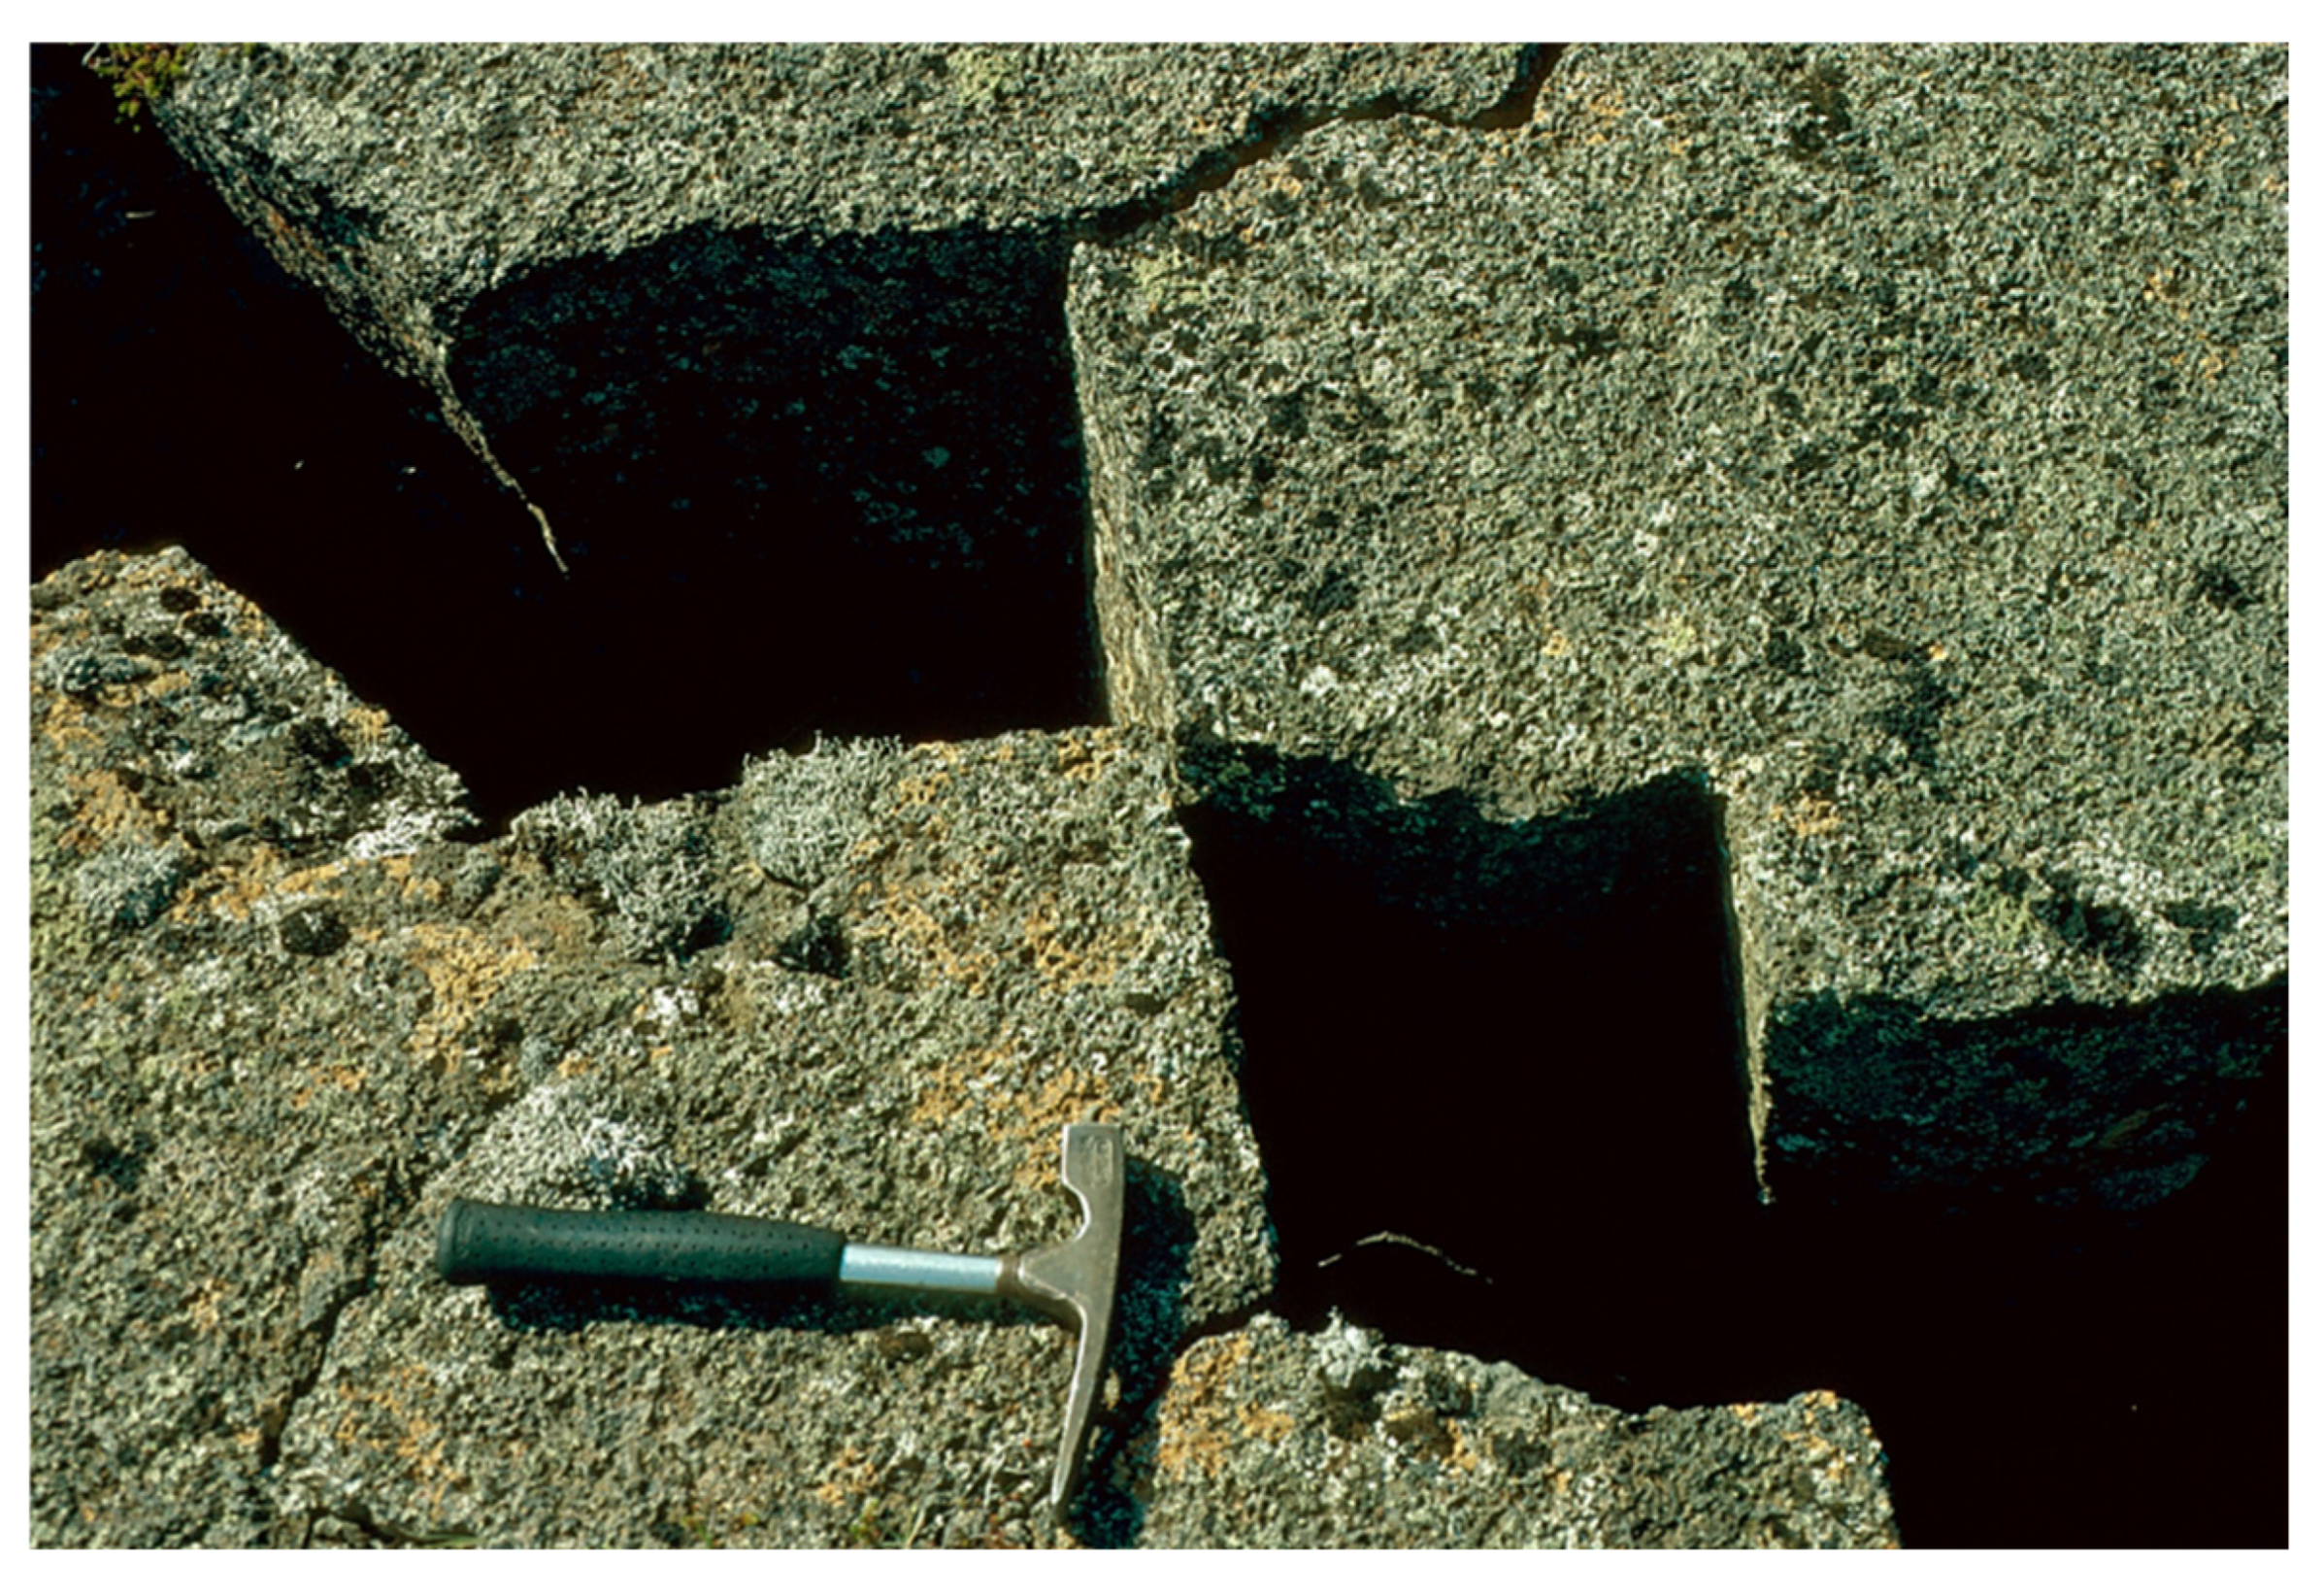
In addition to the large-scale (~101–4 m long) tension fractures and normal faults that characterise the surfaces of fissure swarms, the swarms contain numerous smaller fractures. These are partly fractures that range in sizes down to grain boundaries, that is, on the order of 10−3 m (1 mm). In the field, however, the most noticeable smaller fractures are joints; for the lava flows, these are cooling or columnar joints. These have lengths or strike-dimensions of the order of 10−1 m, although their dip-dimensions or heights may reach many metres (Figure 8 and Figure 9).
A large fissure swarm has a length of perhaps 100 km and a width of up to 10 km, and thus an area of the order of 1000 km2. The thickness of the crustal segments hosting fissure swarms vary from a few kilometres at fast-spreading divergent plate boundaries, such as at the East Pacific Rise, to as much as 20–30 km in continental rift zones and parts of the rift zone of Iceland (Figure 2 and Figure 4). Using the measured cooling-joint frequency of about 20 joints in a cubic metre (Figure 8 and Figure 9) for some basaltic lava flows and sills in Iceland, then, for a fissure swarm with an area of 1000 km2 (109 m2) we get 2 × 10¹⁴ joints if the crustal segment hosting the swarm is 10 km thick and composed primarily of lava flows and sills with the above joint frequency. Similarly, if the hosting crustal segment is 20 km thick, the joint number is 4 × 10¹⁴, and similarly for thicker segments.
When fractures down to the sizes of grain boundaries are considered, then clearly the total number goes up. For cracks with dimensions of the order of 10−3 m (1 mm), then in a fissure swarm with an area of 1000 km2 and thickness from 10 to 20 km, the swarm may contain of the order of 1022–23 cracks and fractures of all sizes. We are therefore dealing with an enormous number of fractures, whose analysis is best handled through statistical physics.

2.2. Dike Swarms

Dikes occur primarily in two main types of swarms: regional swarms and local swarms (Figure 2 and Figure 4). Together these swarms constitute a large part of the internal structure of volcanic systems such as in Iceland (Figure 1, Figure 2, Figure 3 and Figure 4). Here the focus is on the characteristics of dike swarms using well-studied examples from Iceland. It should be noted, however, that the same general structure of dike swarms is found worldwide [1,6].
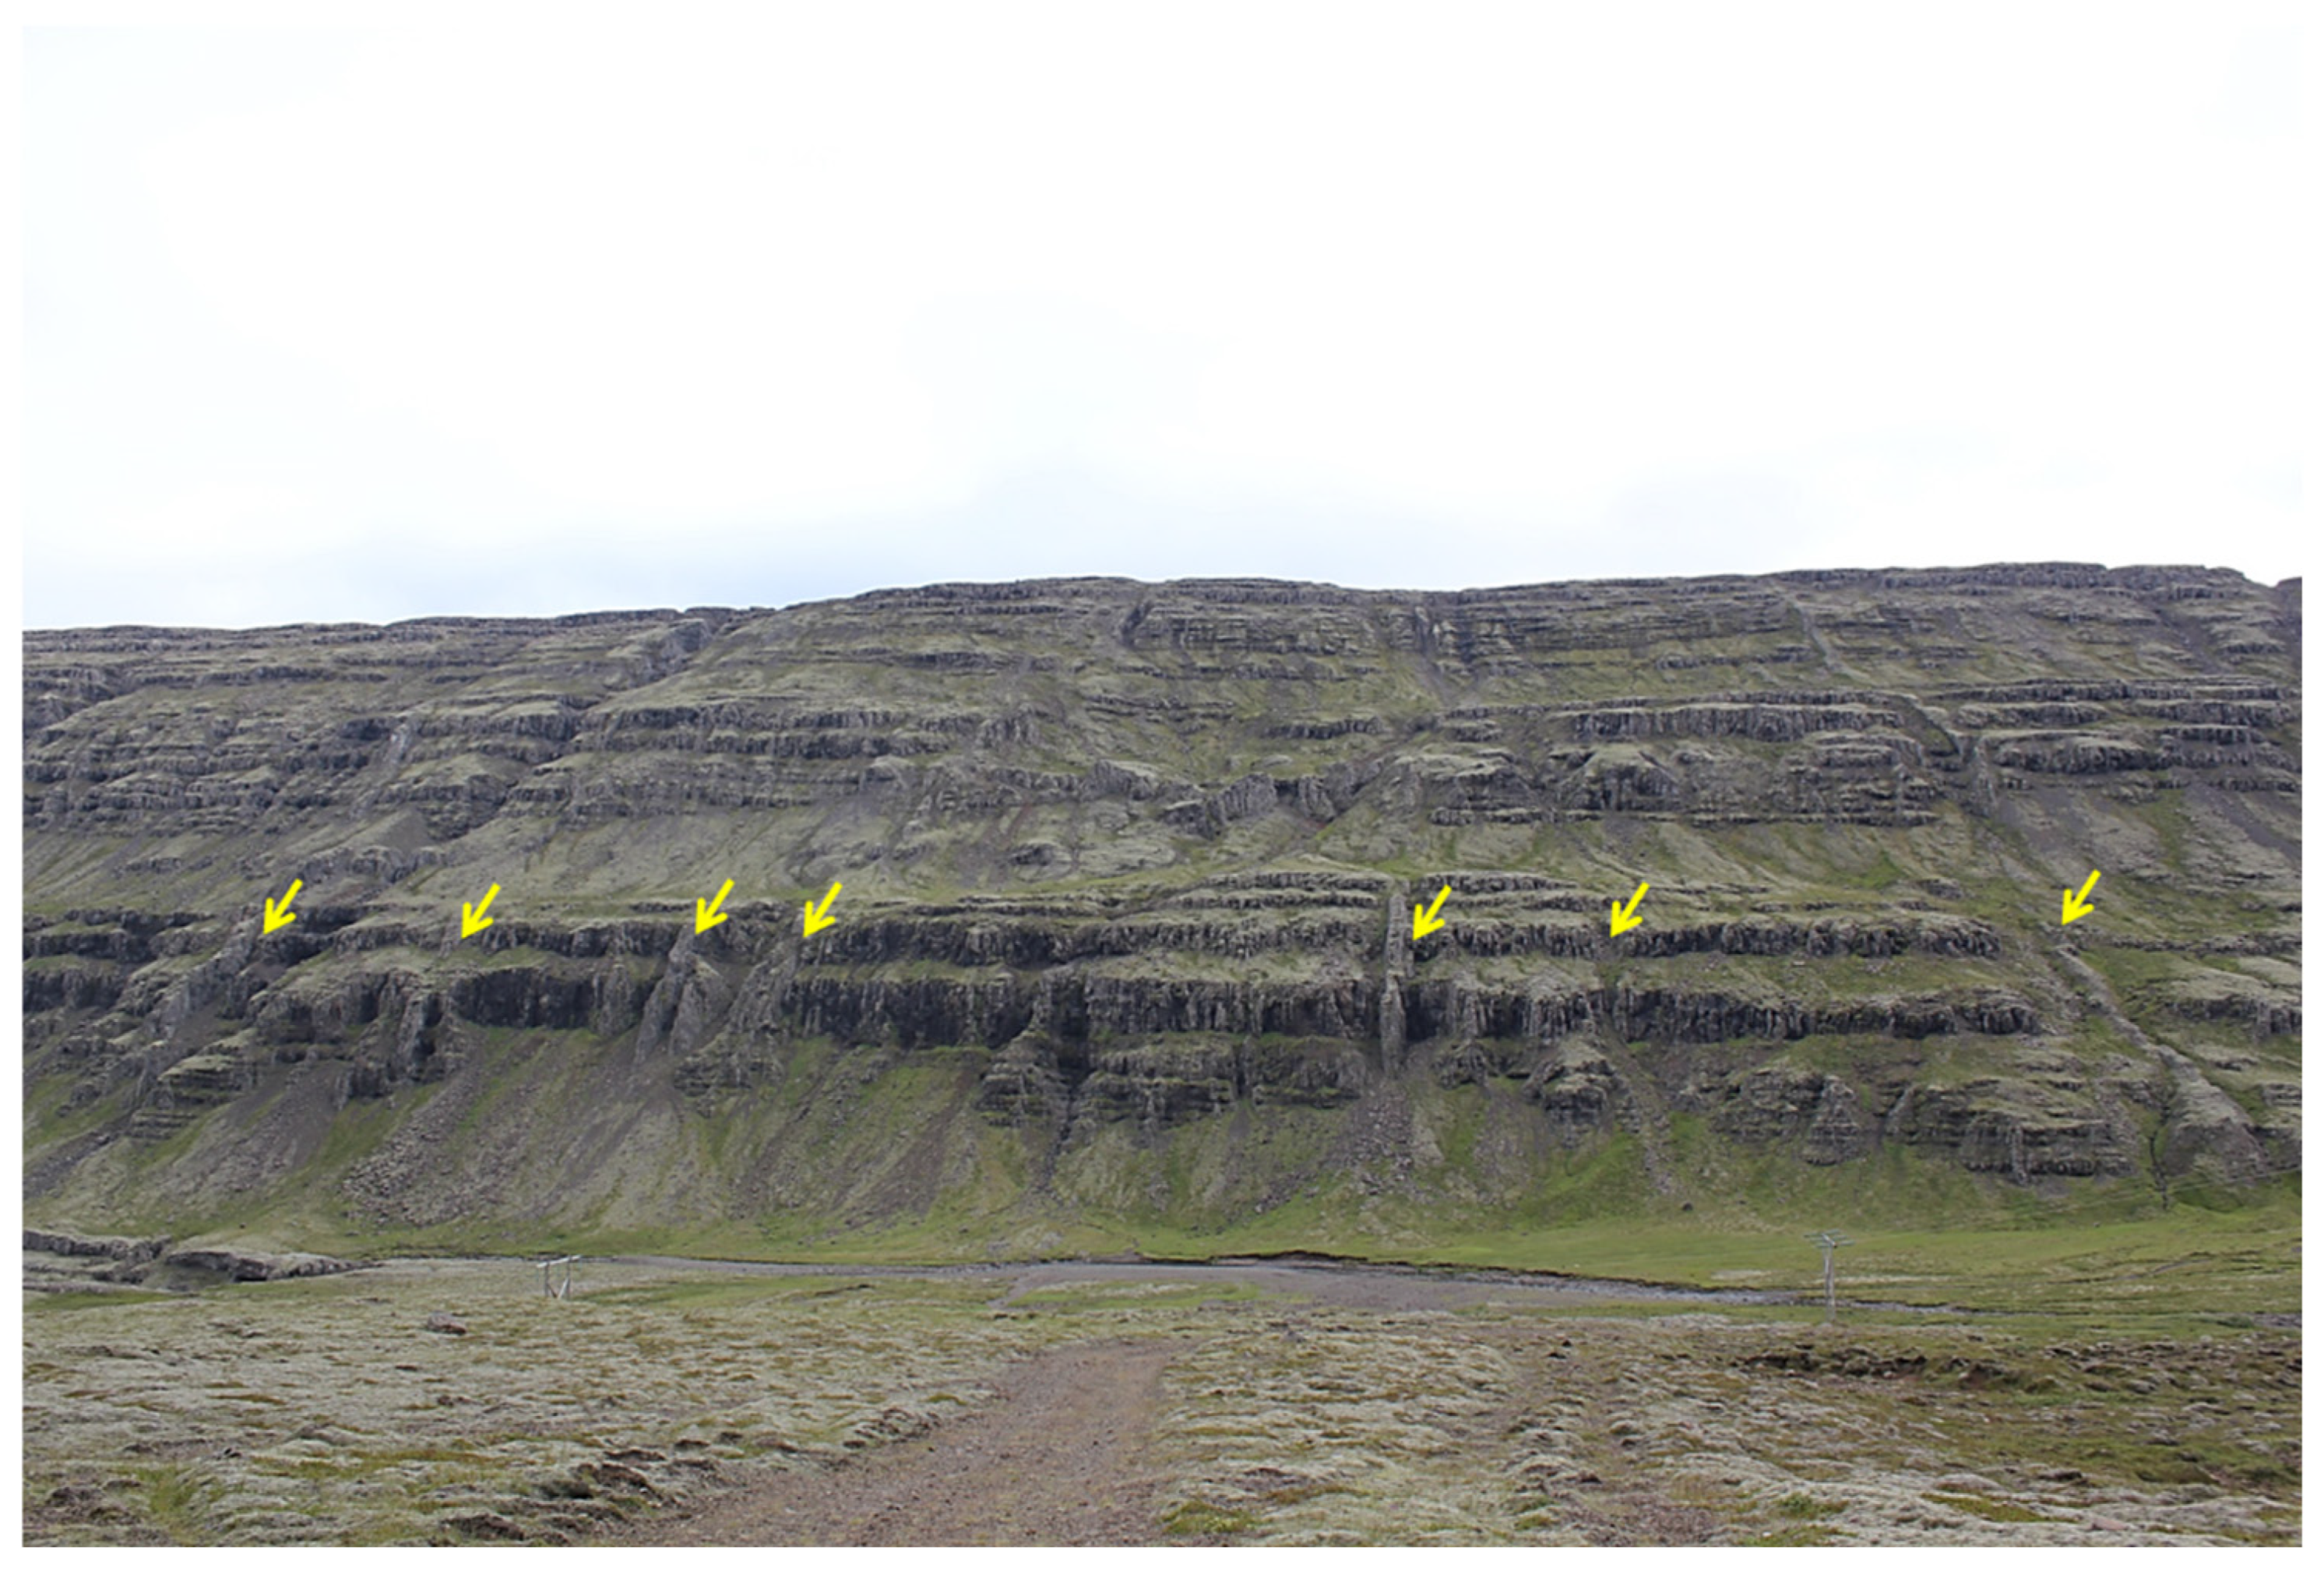
Regional swarms are characterised by subparallel, subvertical, thick, basaltic (mafic) dikes (Figure 2, Figure 4 and Figure 10). Most of the dikes are presumably injected from deep-seated reservoirs (Figure 2 and Figure 4), although some such dikes, particularly close to central volcanoes, may be injected from shallow chambers as radial dikes. These latter, however, would normally be regarded as part of a local swarm, as discussed below. The exposed regional dike swarms (Figure 11) are, as expected, similar in dimensions to typical Holocene volcanic systems, namely with common lengths of tens of kilometres and widths of 5–10 km.
Regional dikes range in thicknesses up to many tens, and occasionally, hundreds of metres. In the Icelandic swarms they are as thick as 60 m, but the average thickness in individual swarms is from 4–6 m down to 1–2 m. The crustal dilation or extension attributable to the dikes in sections or profiles that are 5–10 long and perpendicular to the general strike of the dikes in a swarm (Figure 11) is commonly 5–6%, but, in shorter sections, it can be as great as 28% [7].
Some regional dikes have been traced for tens to hundreds of kilometres [8,9]. In Iceland, exposed dikes have been traced for more than 20 km [7], and some volcanic fissures/crater rows (fed by dikes) reach lengths of many tens of kilometres. For example, the Holocene Sveinar-Randarholar crater row in North Iceland is 65–70 km long [7,10].
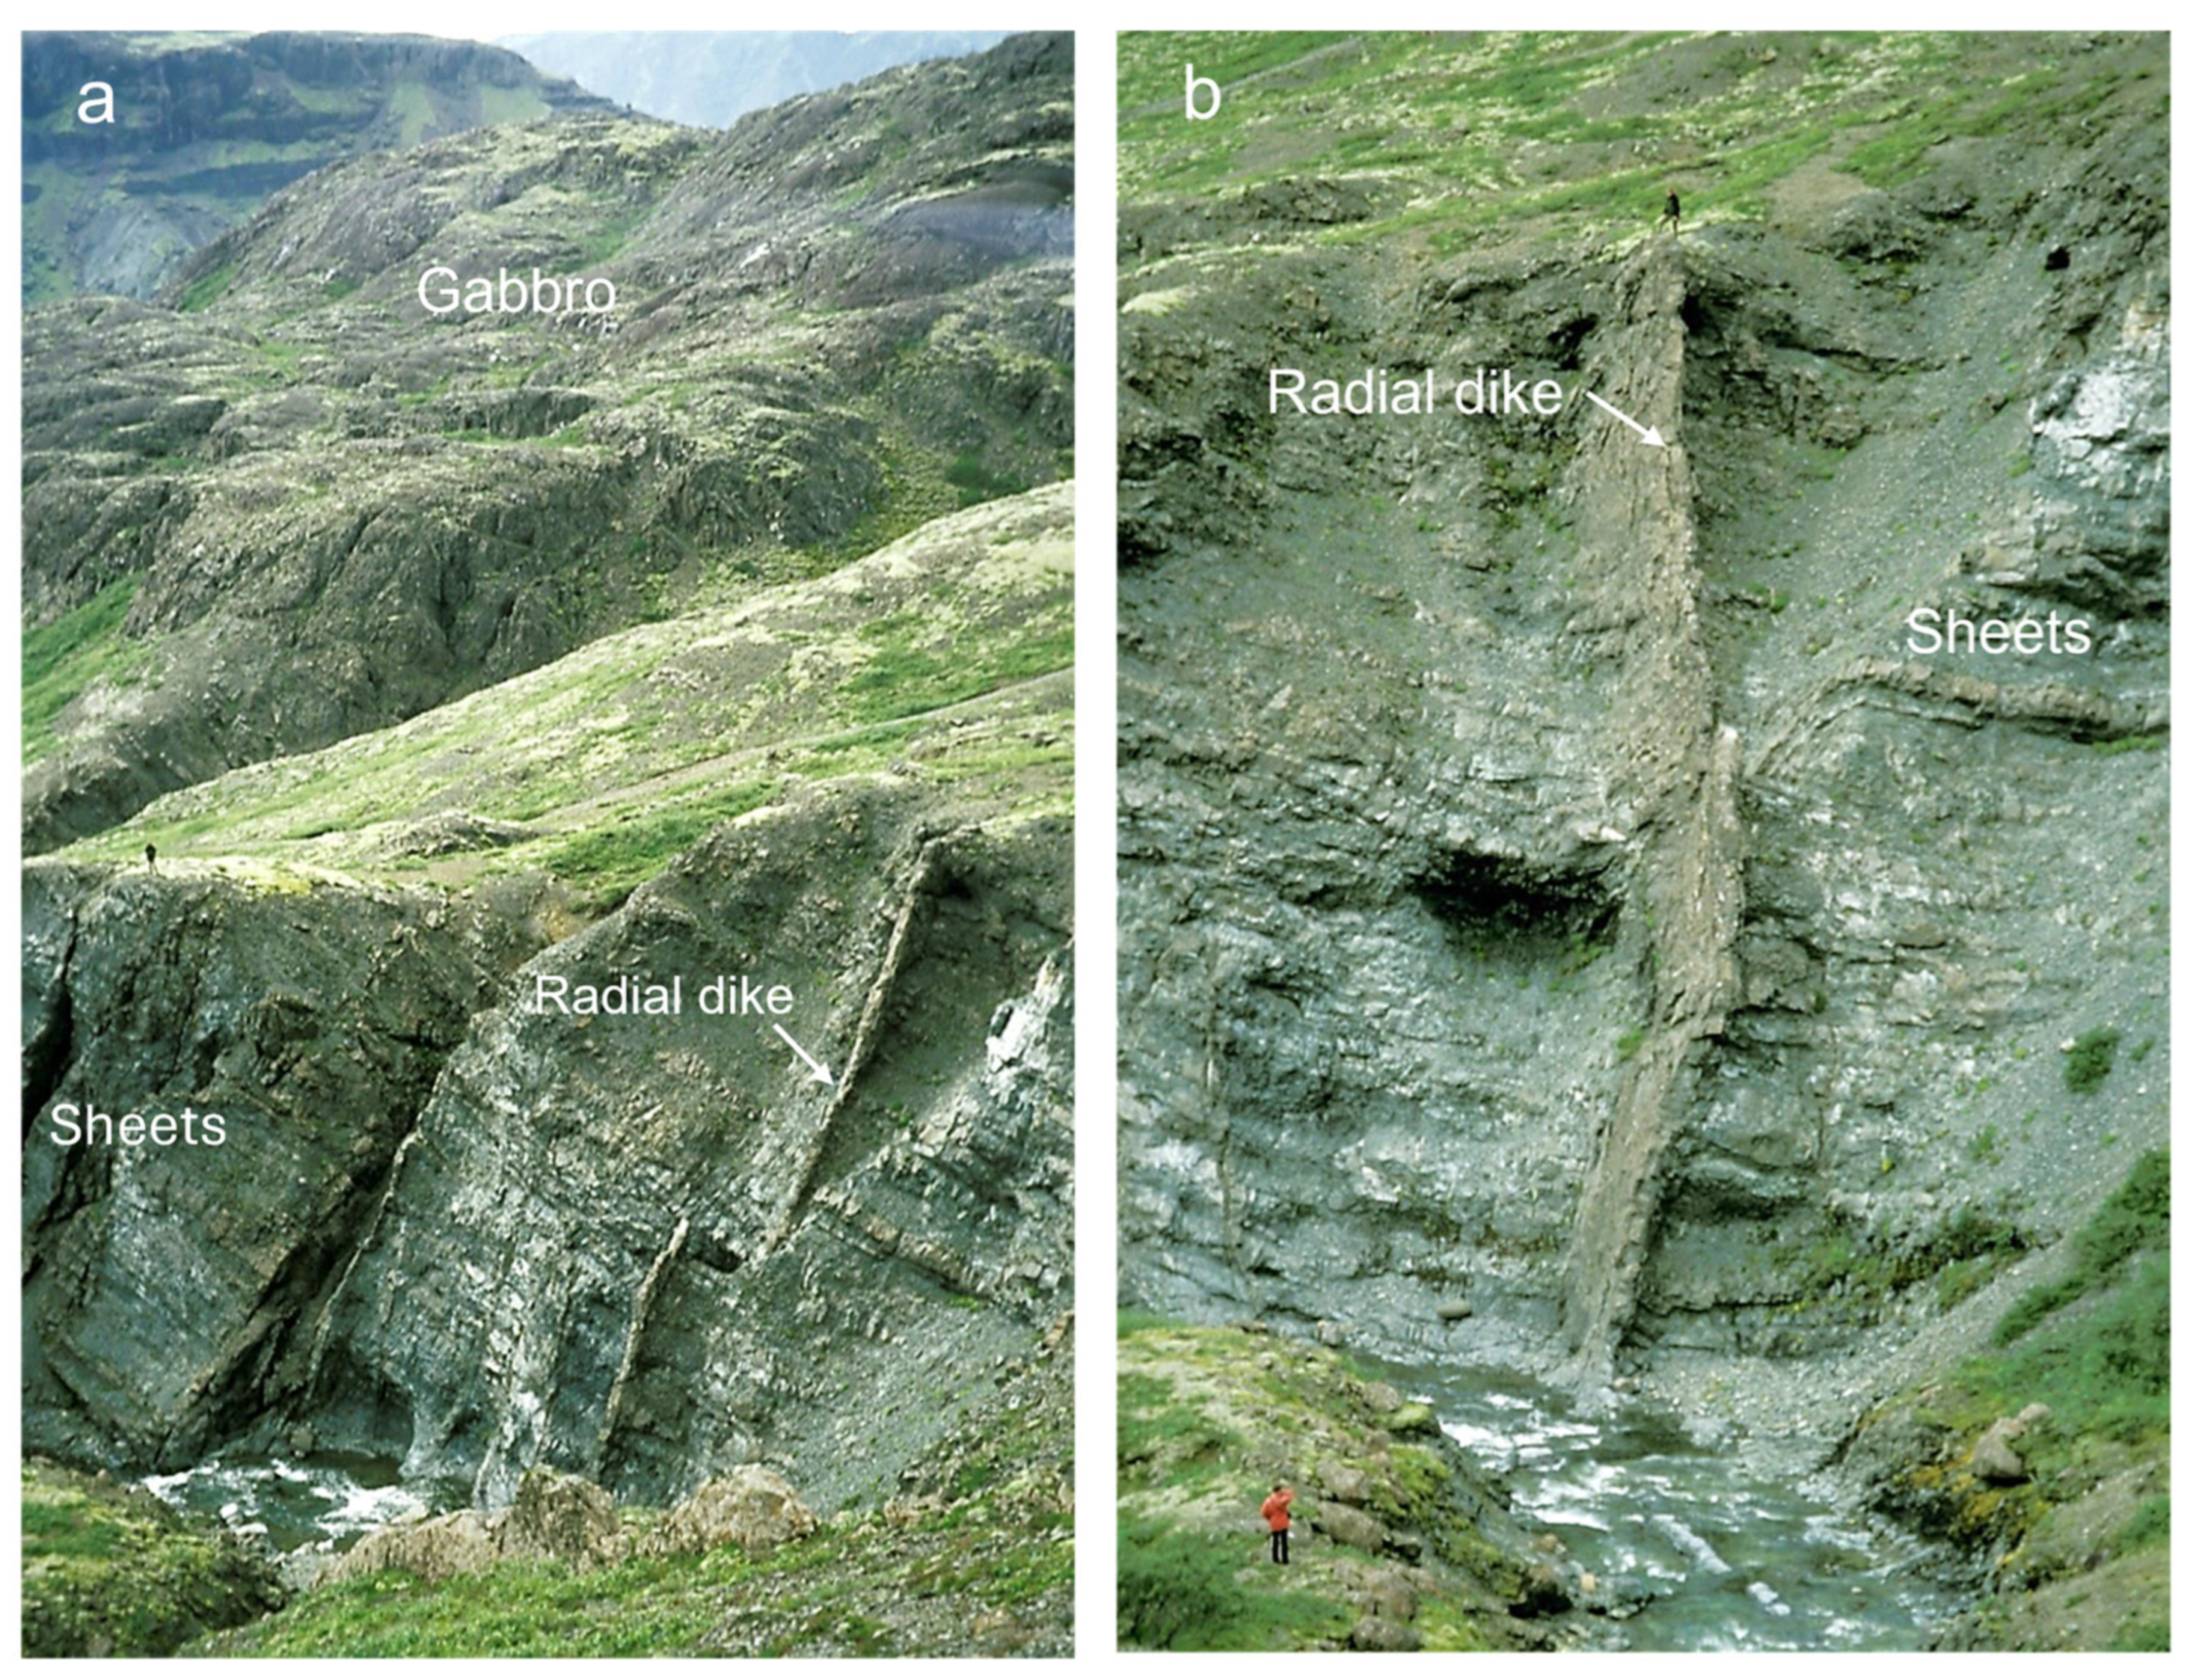
A different type of dikes, referred to as radial dikes, occur in local swarms associated with central (polygenetic) volcanoes (Figure 2 and Figure 12; [1,6]). The local swarms have a much greater density than the regional dike swarms so that the sheet intrusions may constitute 60–100% of the rock in short traverses close to their source shallow crustal magma chambers—presently partly exposed as plutons. The density, however, falls off rapidly with distance from the source chamber, and is commonly 6–8% in kilometre-long traverses. A local swarm may contain many thousand sheets (Figure 12). In plan view, the swarm is normally circular or slightly elliptical and with a radius of many kilometres—the largest in Iceland having a radius of about 9 km.
The dip distribution of sheets in the local swarms has normally two peaks: one subvertical and the other gently dipping. For example, in Iceland the subvertical sheets tend to be in the central part of the swarm and with common dips of 75–90°. By contrast the gently dipping sheets, with common dips of 20–50°, tend to be more frequent in the marginal parts of the swarm. The average dip of sheets in several studied local swarms in Iceland is 34° [11]. The subvertical sheets in the central parts are what we refer to as radial dikes (Figure 2 and Figure 12). Like the other sheets, they are injected from a shallow crustal magma chamber but into the roof above its central part where the stress field often favours subvertical dikes [1]. The inclined sheets and radial dikes range in thickness form a few centimetres to about ten metres, and occasionally more, but the thickness of most is between 0.1 and 1 m. The radial dikes (and inclined sheets) are thus much thinner (and commonly of a somewhat more evolved composition) than the regional dikes. The local swarms of inclined sheets and radial dikes are, as regards density and thickness of sheets, very similar to the sheeted dike complexes in ophiolites [12,13].
Figure 10. View south: basaltic regional dikes dissecting the basaltic lava pile of the mountain Fossarfell in East Iceland. These dikes occur close to the south end of the Breiddalur Dike Swarm (Figure 11). The arithmetic average thickness of dikes in this part of East Iceland is about 4 m, while most of the dikes are thinner than the average. Some of the thicker dikes seen here are indicated by a yellow arrow.
Geosciences 15 00301 g010
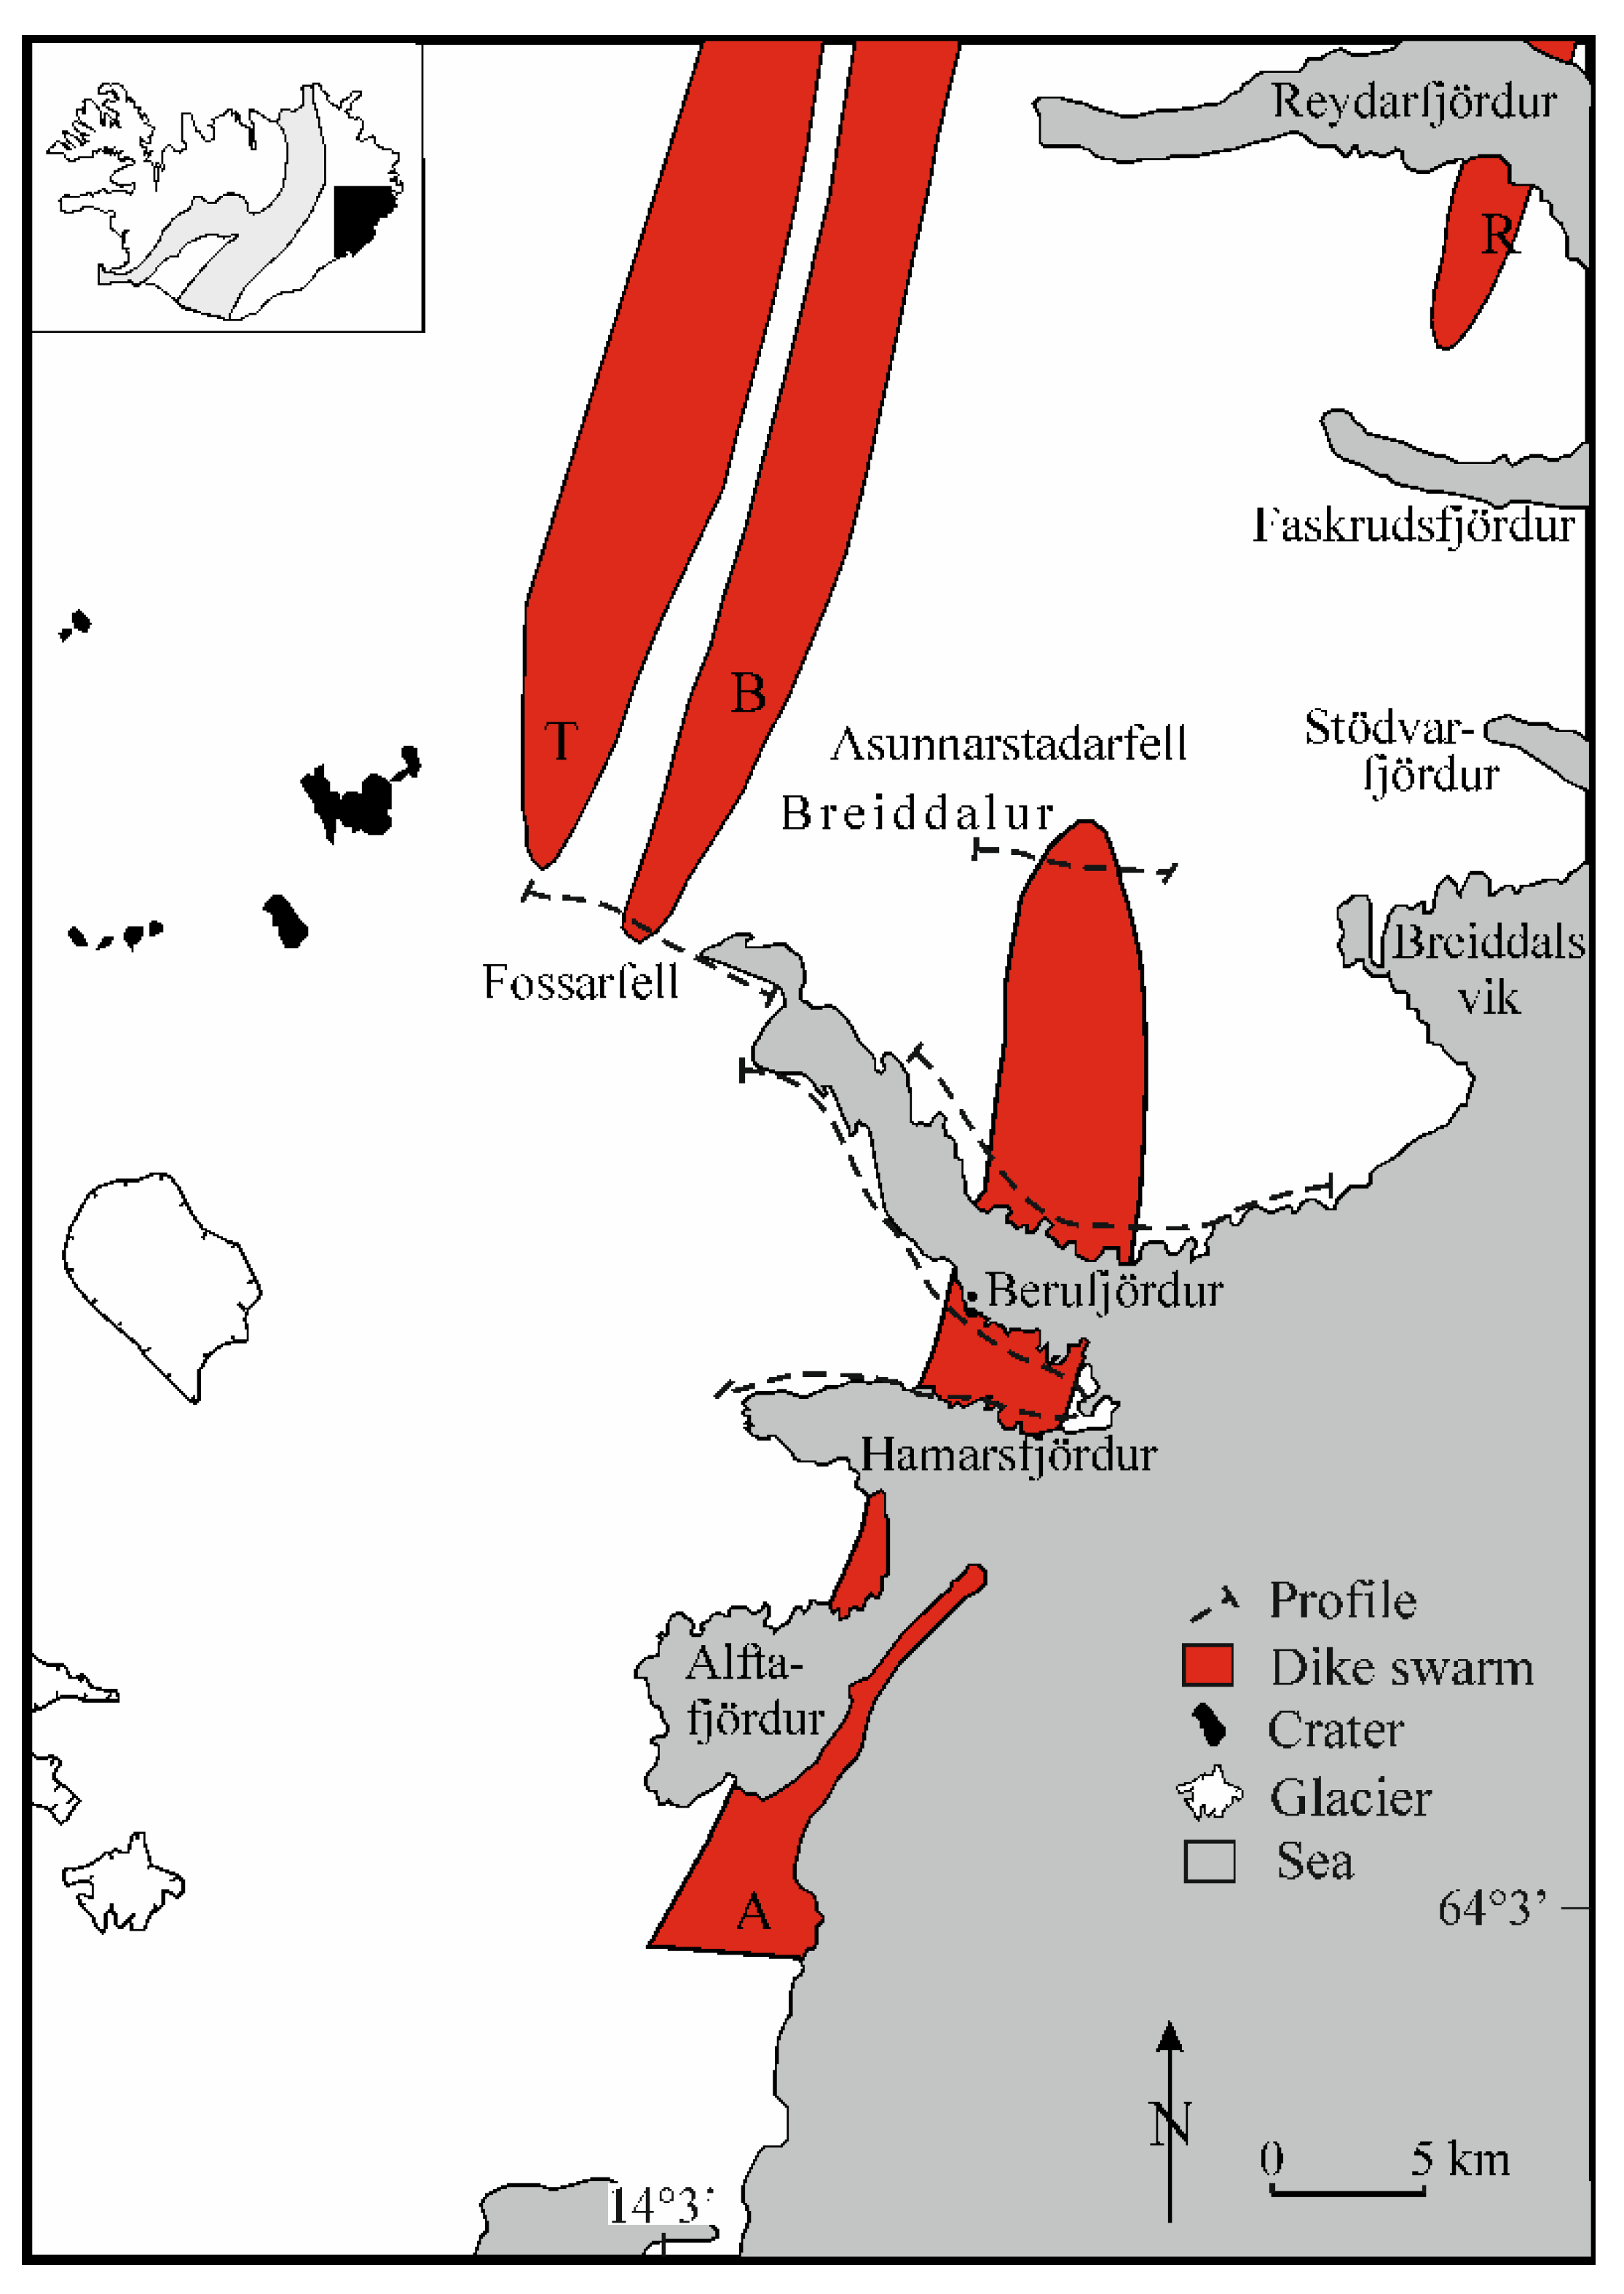
Figure 11. Schematic illustration of the main regional dike swarms in part of East Iceland. In plan view each swarm has roughly the shape of an ellipse with a length of 40–50 km and a maximum width of around 5 km. The regional swarms contain hundreds of dikes at the level of exposure and correspond to the parts of the volcanic systems outside the central/composite volcanoes (Figure 2 and Figure 3).
Geosciences 15 00301 g011
The emplacement of regional dikes is controlled by the regional stress field, which at divergent plate boundaries, as in Iceland, is such that the maximum compressive principal stress σ1 is vertical and the minimum compressive (maximum tensile) stress σ3 is horizontal. Since the dikes (and sheet-intrusions in general) propagate along paths that are normally parallel with σ1 and perpendicular to σ3 [2], with the intermediate principal stress σ2 being parallel with the strike of the dike, it follows that sheets controlled by the regional stress field become subvertical dikes. The local stress field around shallow crustal magma chambers is often very different from the regional field. The local field depends partly on the loading and partly on the geometry of the chamber and its depth below the surface of the associated volcano. As for the loading, the local stress field tends to favour subvertical radial dikes when the main loading is tensile stress, such as generated by plate-tectonic forces in rift zones and divergent plate boundaries in general [1,14]. When the only loading is internal excess pressure in the shallow chamber, however, then the local stress field favours inclined sheets above the lateral margins of the chamber and subvertical radial dikes above its centre. This conclusion applies both to a chamber with a circular vertical cross-section as well as to a sill-like (modelled as a ‘tunnel-crack’) magma chamber [14]. The results are thus in harmony with the field observations which show that gently dipping inclined sheets are particularly common at and beyond the lateral margins of the source magma chamber.
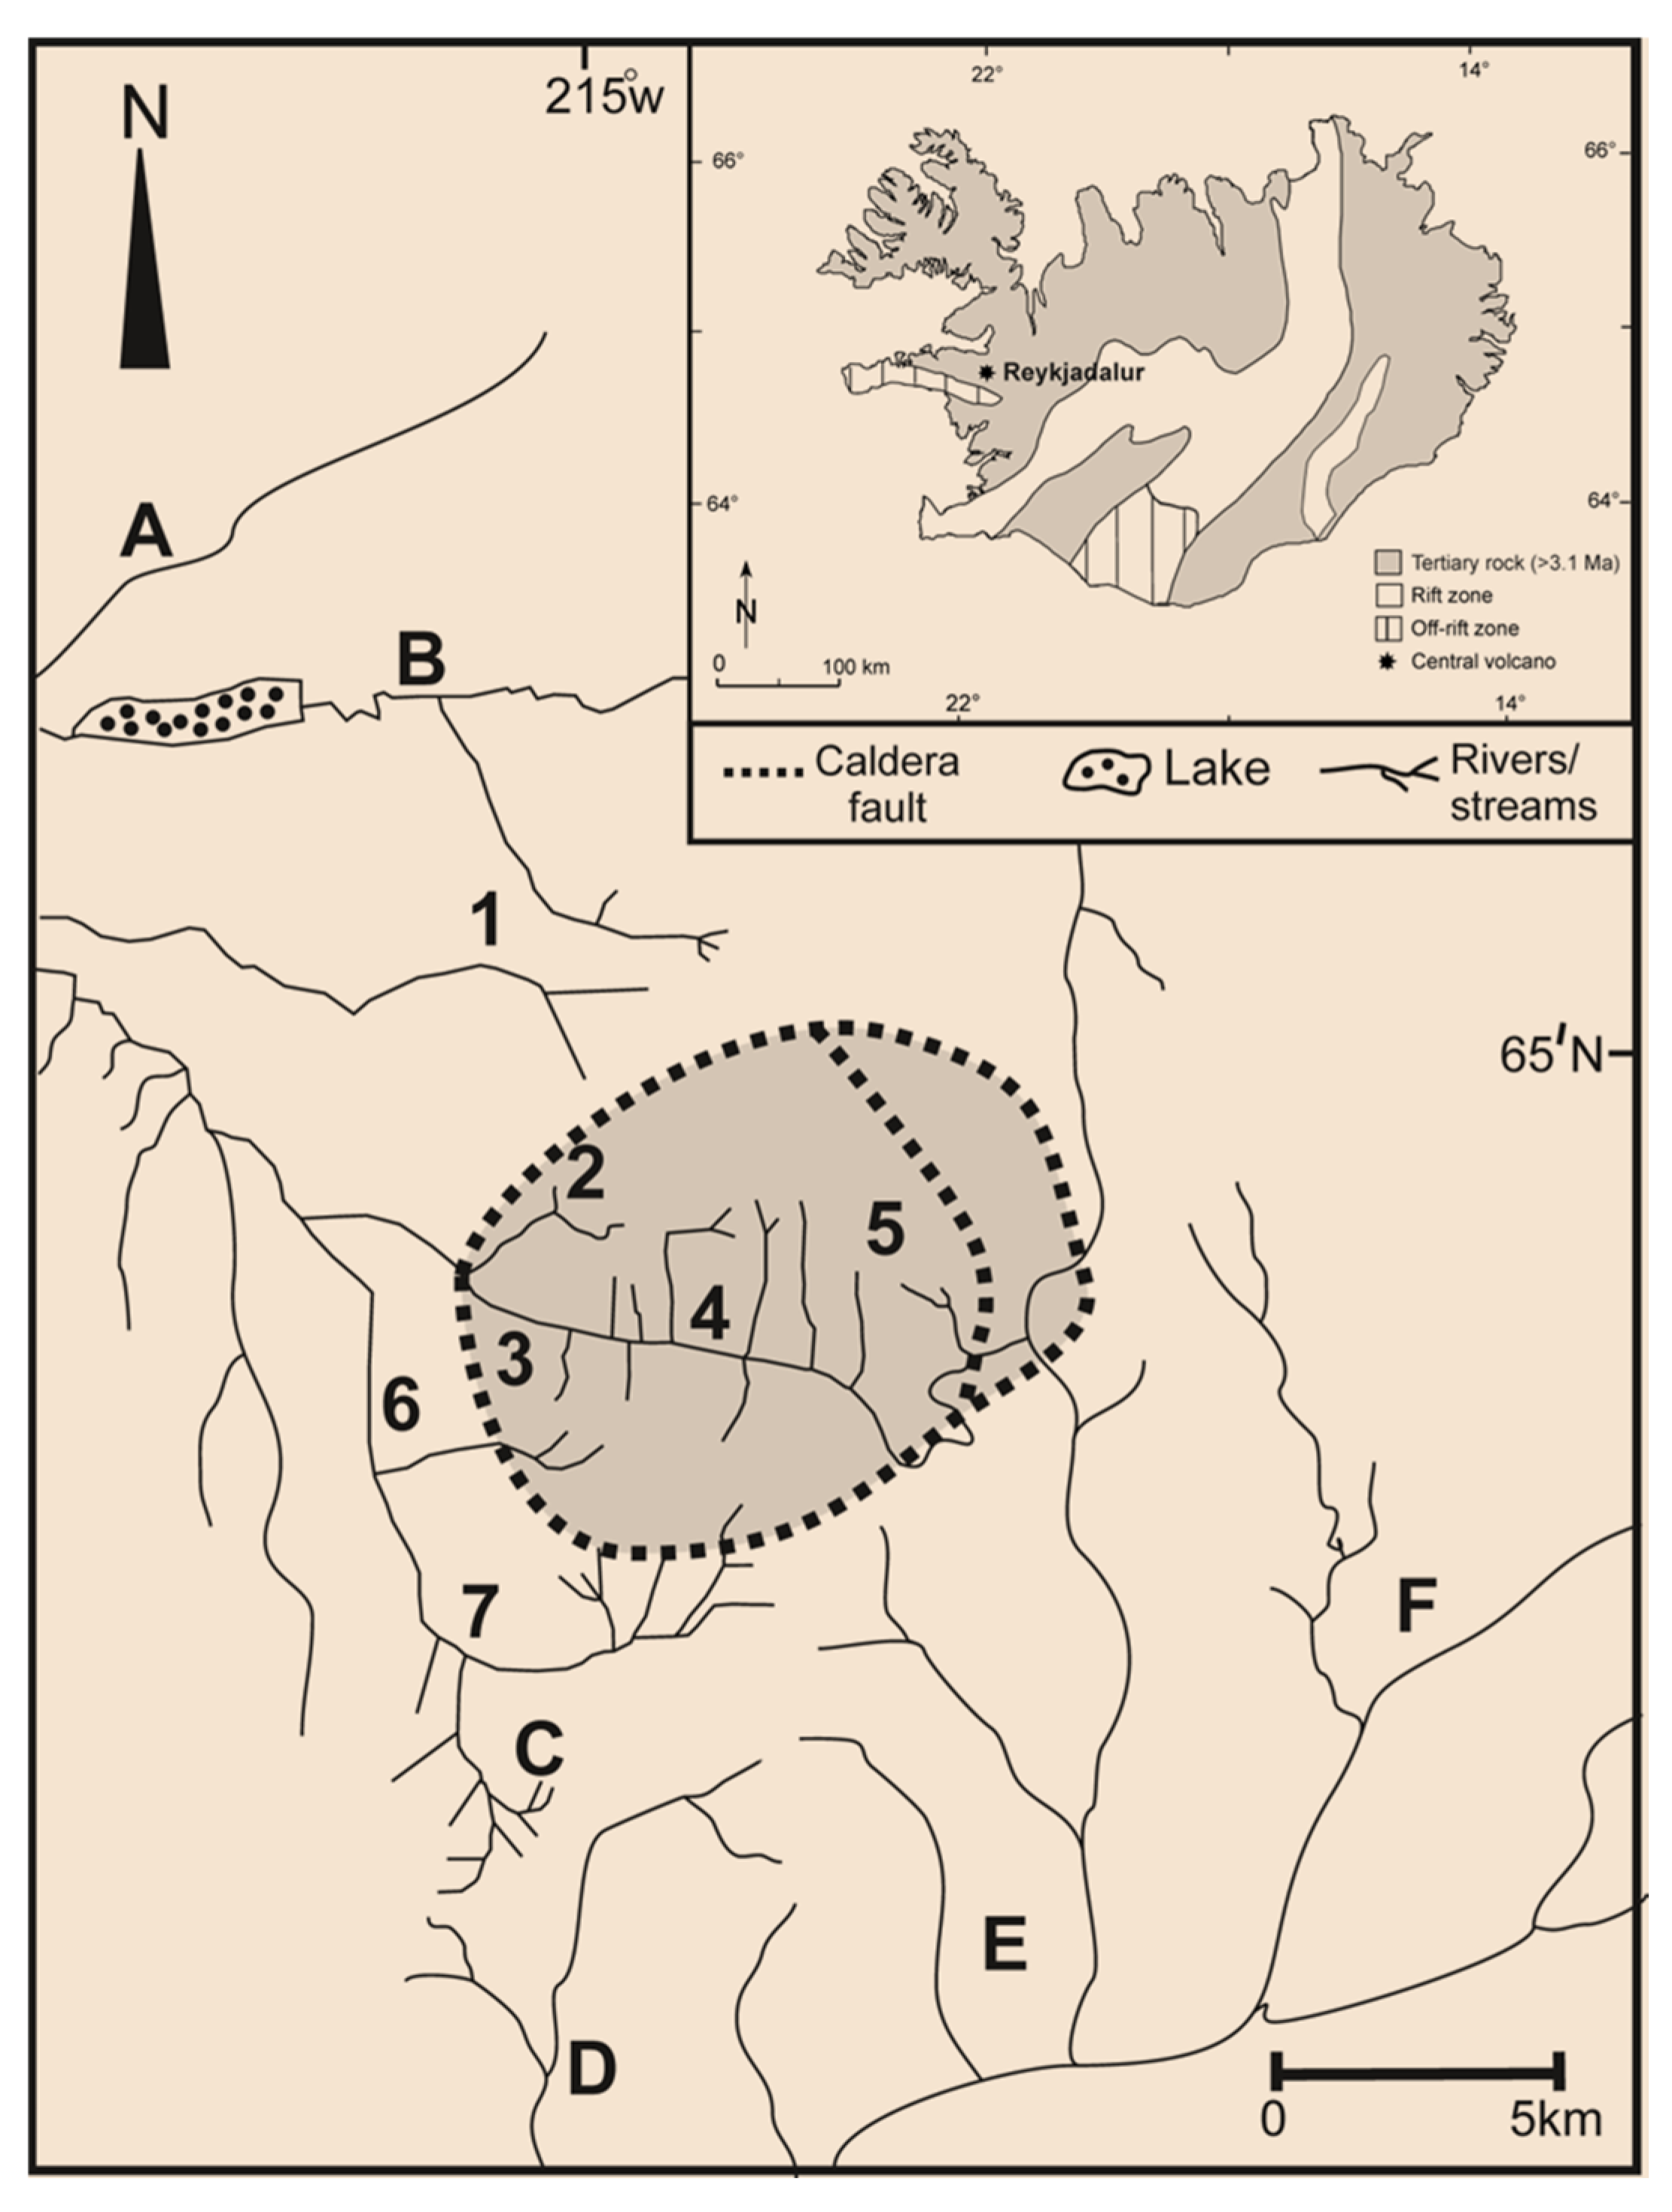
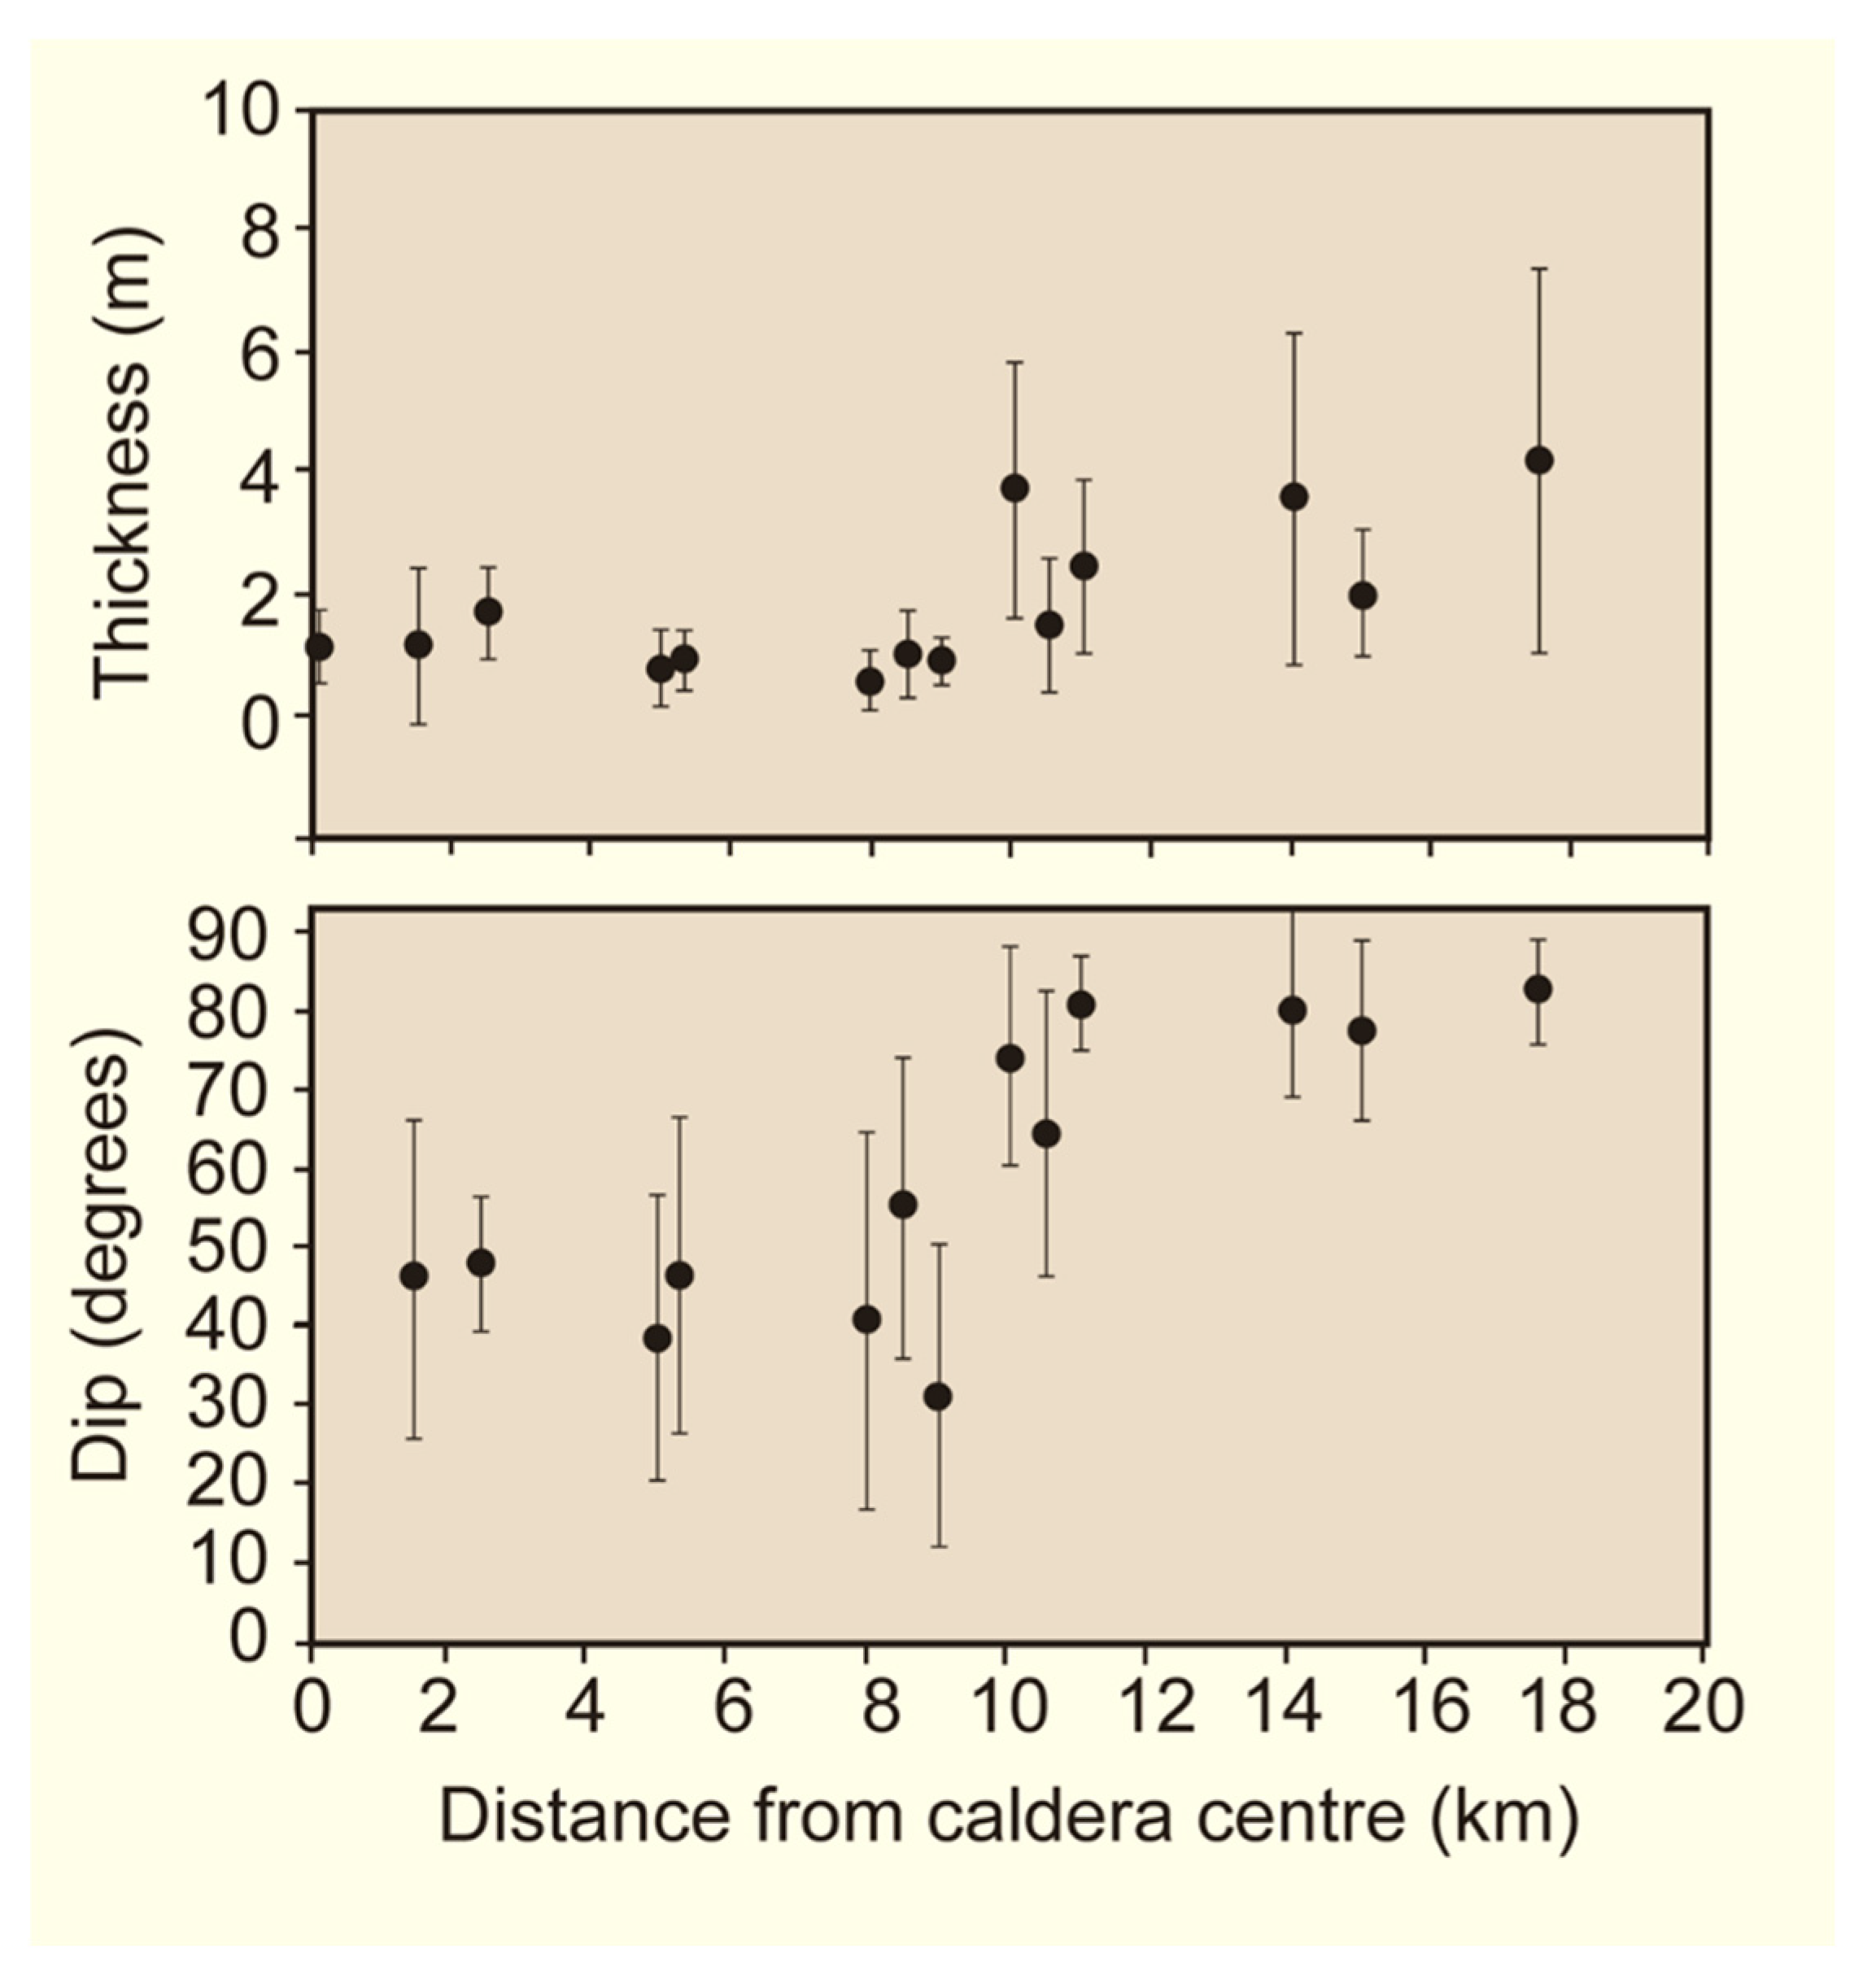
The effects of the regional and local stress field on the geometry and attitude of sheet-like intrusions is demonstrated through field observations of the fossil volcanic system of Reykjadalur in West Iceland (Figure 13 and Figure 14). Inside and close to the polygenetic volcano itself, a collapse caldera, there is a dense local swarm of inclined sheets and radial dikes, whereas at a distance exceeding about 10–11 km from the centre of the volcano/collapse caldera the volcanic system is characterised by regional dikes [15]. The change is abrupt, both as regards average thickness and dip of the sheet-like intrusions. At distances of less than 10 km from the centre of the caldera (and the associated fossil shallow magma chamber) the arithmetic average dip of the sheets of the local swarm as measured at 7 localities varies from 31° to 56°, with an overall average for all the localities of 45°. The overall average thickness of the sheets at these 7 stations is 1 m, with a mode at 0.75 m and a range from 0.1 m to 3.9 m. The general average dip of sheets at 6 localities at distances greater than 10 km from the centre of the caldera (Figure 13) is 81° while the average thickness is about 3.1 m, with a mode at 2 m and a maximum of about 11 m.
Figure 12. Local sheet swarms occur within and in the vicinity of central/composite volcanoes and are primarily supplied with magma from shallow magma chambers (Figure 2). Here is part of the local sheet swarm associated with the central volcano of Geitafell in Southeast Iceland [14,16]. (a) The swarm of inclined sheets is cut by radial dikes, all of which are much thinner (and generally more evolved petrologically) than typical regional dikes (Figure 10). Also seen is part of the gabbro pluton that forms the uppermost exposed part of a fossil shallow magma chamber (Figure 2). The depression between the gabbro pluton and the main sheet swarm marks the boundary between the chamber, when active, and the injected sheets. See the person (on the edge above the word ‘sheets’) for scale. (b) Close-up of a radial dike (with a person standing on its exposed top) and inclined sheets in Geitafell. The sheets are generally dipping into the wall, that is, towards the gabbro body, the fossil magma chamber seen in part (a). Similarly, the radial dikes ‘radiate’ away from the gabbro body, indicating that the gabbro body acted as source for the inclined sheets and the radial dikes (Figure 2).
Geosciences 15 00301 g012
These results indicate that the sheet intrusions within 10 km from the centre of the Reykjadalur Volcano/collapse caldera constitute a local sheet swarm, whereas the sheet intrusions at greater distances from the centre constitute a regional dike swarm. The range in dip within the local sheet swarm is much greater than within the regional dike swarm (Figure 14), so that many of the sheets in the local swarm are steeply dipping radial dikes (Figure 2). By contrast, the range in thickness in the local sheet swarm is much smaller than that in the regional dike swarm, primarily because the regional dikes reach greater maximum thicknesses than the local sheets. This is in harmony with results obtained in other dike swarms in Iceland [16]. The Reykjadalur Volcano is located at a junction where the orientation of the volcanic zones is changing (from a NE-strike south of the volcano to a N-strike north of the volcano), with additional effects of the E-W–striking Snæfellsnes Volcanic Zone. The strike of the regional dikes at different locations reflects the different trends of the volcanic zones.
Figure 13. Reykjadalur Central Volcano, a collapse caldera, is a fossil and deeply eroded volcano in West Iceland. The localities where sheet intrusions were measured are indicated by the numbers 1–7, inside and close to the volcano, and the letters A–F, far outside the volcano. The results show that at localities 1–7, there are primarily inclined sheets and radial dikes (as in Figure 12), whereas at localities A-F, there are primarily regional dikes (as in Figure 10). Modified from [15].
Geosciences 15 00301 g013
Figure 14. At the Reykjadalur Central Volcano and associated volcanic system there is an abrupt increase in sheet thickness (upper diagram) and dip (lower diagram) at a distance of 10–11 km from the centre of the caldera/volcano. The range in values at each locality is indicated by the vertical error bars. Thus, at the distance of 10–11 km from the centre of the caldera (and the underlying but unexposed shallow magma chamber/pluton) the regional dike swarm takes over from the local sheet swarm (Figure 2). Modified from [15].
Geosciences 15 00301 g014

3. Size Distributions of Fissures and Dikes

3.1. Overview

For a reasonably large set of data points, there is theoretically an infinite number of functions that can be fitted to the data. For example, for a set containing N data points then a polynomial of degree N-1 can be fitted through all the points [17]. But while such a polynomial fit may be statistically perfect, the drawback is that the fit rarely has much physical meaning. This is because the connection between a polynomial fit and the underlying physics of the processes that are supposed to produce the data is often unclear or entirely absent. For a function that fits certain data points to be a plausible explanation of the data, it is preferable that there exists a theoretical framework of which the function can be seen as a logical consequence.
Before we discuss the main functions regarded as plausible for statistical size-distributions of fissure and dikes, it should be made clear what measurement data are available for analysis. The tectonic fractures of the fissure swarms comprise tension fractures (Figure 3, Figure 4, Figure 5, Figure 6 and Figure 7), normal faults (Figure 3, Figure 4, Figure 5, Figure 6 and Figure 7), and volcanic fissures (Figure 3 and Figure 4). The measurements include fracture lengths (strike-dimensions), fracture openings (apertures), and fault displacements (throws). As for the dike swarms, the common measurements are on thicknesses and, to a lesser extent, lengths (strike-dimensions) of the dikes (Figure 2, Figure 4, Figure 10, Figure 11, Figure 12, Figure 13 and Figure 14).
Several functions have been suggested as appropriate fits for size distributions of various parameters related to tectonic fractures in general. For example, many have proposed power functions or laws for the length-size distributions of tectonic fractures [18,19,20,21,22,23,24,25,26,27,28]. Similarly, power laws have suggested as good fits for displacements (throws) on faults [29] and opening (apertures) of tension fractures [21].
As for dikes, many length-size distributions have been published. The suggested fits vary from power-laws [30,31,32] to log-normal distributions [33]. There have also been extensive dike-length studies where the focus has been on length/thickness ratios [34], some with the view of inferring the magmatic overpressure associated with dike emplacement and possible depths to source magma reservoirs [35,36,37,38]. Because of their focus, these publications do not provide length-size distributions of the studied dikes. In addition to direct dike-length studies, several studies have been made of the length-size distributions of volcanic fissures (Figure 15)—corresponding to the strike-dimensions of the associated feeder dikes at the surface. These studies generally infer power-law fits for the volcanic fissure/feeder dike lengths [39,40].
There are many published studies on dike-thickness size distributions. Some suggest power-law fits [33,41,42,43] whereas other studies indicate either log-normal fits [44,45,46] or negative exponential fits [32,47,48]. In particular, Klausen [47] analysed 21 datasets on dike thicknesses and tested them for normal, log-normal, power-law, and negative exponential fits. His conclusion is that of these 21 data sets, negative exponential laws provide the best fit for 17 sets [47].
There are several general observations that should be made about fitting functions to empirical data such as fracture/dike lengths, fracture openings (apertures), and dike thicknesses. First, measurements of fracture openings/dike thicknesses are generally more accurate than measurements of fracture/dike lengths. This applies particularly to longer fractures/dikes, all of which are segmented. When measuring lengths of tectonic fractures and dikes, some authors provide two sets of data. One set is of the lengths of all the fracture/dike lineaments—normally as measured from aerial photographs or satellite images. The other set takes into account the fact that nearby segments of a fracture/dike may function mechanically as a single segment provided the distance between the nearby ends is small in relation to the segment length [3]. Thus, Babiker and Gudmundsson [33] analysed first 2089 lineaments identified as unconnected dike segments. Subsequently, they used the fracture-mechanics principle [3,49,50] that when the nearby ends of extension fractures (such as dike segments) are separated by less than 10% of the segment lengths, they function mechanically as a single fracture. Applying this principle to the 2089 segments, the number of dikes composed of connected segments reduced to 1419. However, both dike populations show log-normal length-size distributions.
Second, all empirical fits of the kind discussed here have a limited range, that is, they have upper and lower limits. The maximum upper limits for length depend on the volumes within the crust that can be stress-homogenised. Tectonic fractures of a given type, as well as dikes, can only propagate within those parts of crustal segments, such as those hosting fissure swarms or dike swarms, where the stress field is favourable to that type of fracture/dike propagation. This means that the maximum strike-dimension or length (and maximum dip-dimension or height) of a fracture/dike depend on the size of that part of the hosting rock of a fissure/dike swarm which has a favourable stress field at that moment, namely is stress-homogenised [51]. The stress-homogenised rock volume during a given fracture/dike propagation event is normally a small fraction of the total volume of the rock hosting a fissure/dike swarm.
As for the lower limits of fracture-size distributions (and associated empirical fits), these depend on the scale of the observations. Most length measurements of fractures/dikes are made from aerial photographs and satellite images. Normally, these have a resolution of the order of metres or, occasionally, tens of centimetres (Figure 5, Figure 7 and Figure 9). All shorter fractures/dike-lets would thus normally be excluded from the dataset. Even when fractures/dikes are studied in the field (in traverses/sections), cm-scale fractures and dike-lets would rarely been recorded. This is because usually such small structures would not be noticed, even though the outcrops are continuous—because exposures are also commonly rugged (Figure 10 and Figure 12). The upper limits which faults and dikes may reach to are of the order of hundreds of kilometres, of which large transform faults [52] and regional dikes [8,9] are well-known examples.
Similar limits apply to measurements of apertures of fractures and thicknesses of dikes. The upper limits relate to the length limits since individual ruptures of fractures—such as slips on faults and openings (thicknesses) of individual dike injections—are linearly related to the controlling dimension, particularly the smaller of the strike-dimension and the dip-dimension [3]. Thus, the largest openings or slips on fractures during individual events depend on the other dimensions of the fracture/dike. As for the lower limits, while mm-scale thicknesses of dike-lets can theoretically be measured, they would often not been recognised as the dike-let itself would be too short. Similarly, for tectonic fractures: apertures of mm-scale can be recognised and measured, but unless the study focuses on mineral veins and other similar small-scale structures [53,54], they would often not be observed and recorded, even in a detailed field study.
Third, the proposed fits, and thus the suggested functions, depend to a degree on how the data are obtained and treated or transformed. For the reasons discussed above, very short and thin (small aperture) dikes and fractures are commonly missing from the datasets. Also, while large fractures/dikes have a high probability of dissecting profiles/section in proportion to their actual number in the study area, individual small fractures/dikes have much less chance of dissecting given profiles due to their shortness. This means that for a given profile/section many of the small fractures/dikes are simply inside the rock body and do not meet the profile/section that are commonly along a cliff at the edge of a given rock body.
These are presumably partly the reasons why, on an ordinary bin plot, log-normal distributions for these types of data are common. The smallest fractures/dikes are then rarely recorded, so that the first bin or bins have lower frequency than the adjacent bins of fractures/dikes. The small fractures/dikes are thus underrepresented. For this reason log-normal distributions are sometimes referred to as negative exponential or power-law distributions in disguise. Here we will not consider log-normal distributions but rather assume that they occur primarily because the small fractures/dikes are underrepresented. Instead the focus is on negative power-law and exponential size distributions. I regard these as most representative for the true size distributions of the lengths and apertures/thicknesses of tectonic fractures and dikes.
As for the data treatment, it is clear that when the data are transformed, either on a bi-logarithmic (log–log) plot or a semi-logarithmic plot, the apparent correlation between the plotted variables changes. There are certain assumptions made in linear regression, such as that the errors are normally distributed, and these may not always be satisfied. Also, the coefficient of determination (R2) calculated after the data transformation can be misleading. There are rigorous statistical tests available for the goodness-of-fit and other aspects [55,56]; these are discussed further below. While a straight line on a log–log plot is often regarded as indicating a power-law relationship, and a straight line on a semi-log plot is similarly indicating an exponential-law relationship, these are not strict statistical tests but rather indications as to the possible relationships. Here the focus is more on the physical processes generating the data, rather than the statistical correlations as such, so that the resulting plots are taken as indications as to these processes. Notice also that in transforming the data, the minimum value used for the first ‘bin’ is that of the shortest lineament. For the tectonic fractures, the shortest one is 0.1 m, so that the first ‘bin’ includes all fractures longer than or equal in length to 0.1 m (thus all the tectonic fractures). For the dikes, the shortest one is 26 m, so that the first ‘bin’ includes all dikes longer or equal in length to 26 m (thus all the dikes).

3.2. Power Laws

A power function y = P ( x ) is on the general form:
y = P ( x ) = C x b
this function means that the dependent variable y is directly proportional to the power b (a constant) of the independent variable x, and C is a constant. In the case of C = 1, two special cases of the power (exponent, index) should be mentioned, namely b = 0 and b = 1. Both these cases give rise to linear functions. When b = 0, then y = 1, a horizontal line through the point (1, 1). When b = 1, then y = x, a straight line with a slope of 1 through the origin of the Cartesian coordinate system. As we shall see, neither of these special cases are appropriate for the datasets under consideration here, where the power functions are with a power b that is negative and the function y = P(x) in an ordinary plot (a plot where the axes are linear) is non-linear.
In network studies, such as here, the power functions are commonly referred to as power laws and cumulative distributions are used. In a cumulative distribution when the objects are plotted or grouped into bins (classes) of a given width (class limits), then all the objects in a given bin exceed (or are equal to) size (e.g., length) x. For example, for fracture length plots that use a bin width (class limits) of, say, 50 m, then all the fractures longer than 0 m (but here we do not use 0 but the shortest fracture length as a minimum) would fall into the first bin, all fractures longer than or equal to 50 m would fall into the second bin, and all fractures longer than or equal to 100 m would fall into the third bin, and so on. Furthermore, because longer fractures are fewer than shorter fractures, the power or exponent (index) becomes negative. Thus, for a cumulative power-law size distribution of fracture lengths, the following formula is appropriate [55]:
P ( x ) = C x γ
where P(x) is the number or frequency of fractures with strike-dimensions (lengths) greater than x, C is a constant of proportionality, and γ is the scaling exponent (the slope), which is here, in contrast with b is Equation (2), negative for the reasons given above. The scaling exponent γ is, however, defined as the negative of the slope so that the exponent is a positive number. Equation (3) applies not only as a model for the lengths of tectonic fractures (tension fractures, faults, and dikes), but also to the openings (of tension fractures), thicknesses (of dikes), and wall-parallel displacements (on faults).
Power-law size distributions are commonly presented on bi-logarithmic (log–log) plots where they yield a straight line, the slope being γ (Equation (3)). This follows from taking the logarithms on both sides of Equation (3), which then becomes:
log P ( x ) = log C γ log x
the fact that power-laws are the only functions of the commonly tested modelling functions (such as exponential, logarithmic, and log-normal functions) that provide straight lines on bi-logarithmic or log–log plots is often used as a crude test for a power-law fit to data sets (with the limitations discussed above)—but there are also other tests available [56].
There are two ways to provide log–log plots. One is a scale plot where both the axes (here x and y) are logarithmic. Then the spacing between numbers along the axes changes logarithmically, but the integer powers of the base of the logarithm become evenly spaced along the axes. The second method is to compute the logarithms of the inputs (of the x values) and outputs (of the y values) and then graph the resulting log–log plot using standard (linear) xy-coordinates.

3.2.1. Tension Fractures and Normal Faults

The fissure swarms at divergent plate boundaries such as in Iceland are composed primarily of tension fractures and normal faults (Figure 3, Figure 4, Figure 5, Figure 6 and Figure 7). Additionally, there are volcanic fissures (crater rows; Figure 3, Figure 4 and Figure 15), but since they are the surface expressions of feeder-dikes, they belong to the sets of dikes.
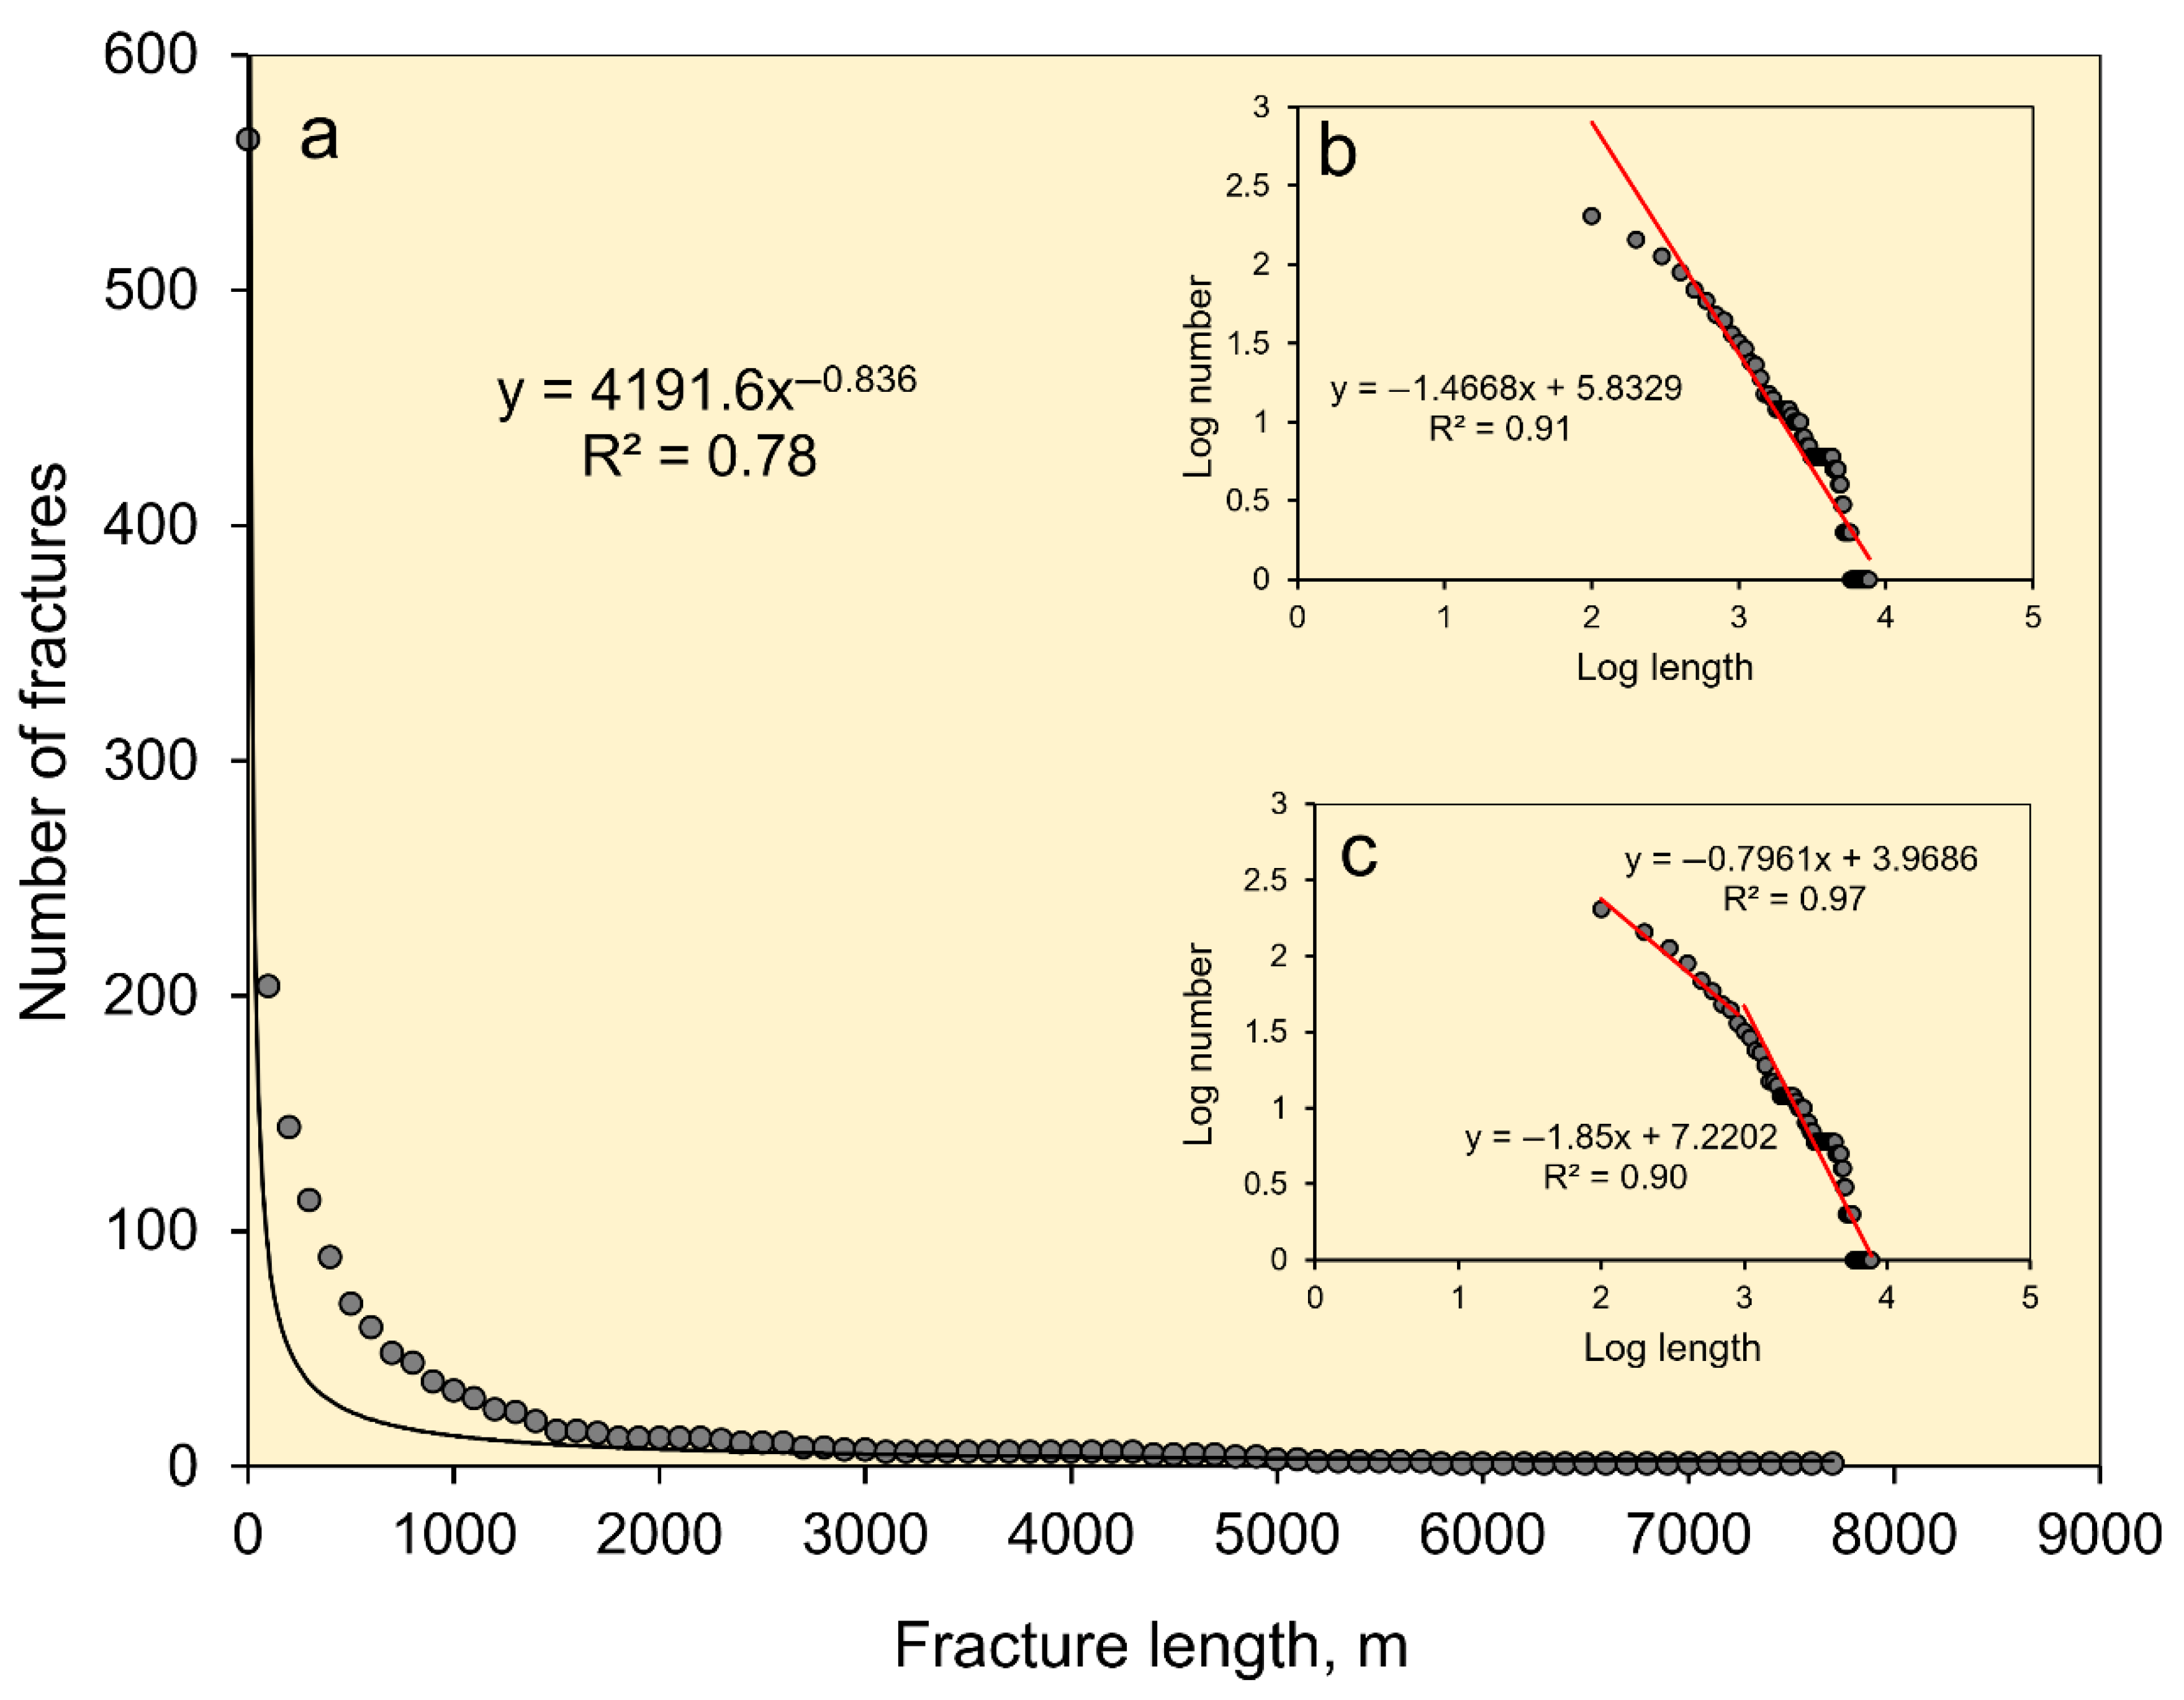
Consider first the distributions of the lengths of tension fractures and normal faults in several Holocene fissure swarms in Iceland (Figure 16). The fractures range in lengths or strike dimensions from 0.1 m (10 cm) to about 7.7 km (Figure 17), that is, by nearly five orders of magnitude. The shortest fractures are tension fractures, formed partly through reopening of columnar joints (Figure 8, Figure 9 and Figure 18), and the longest ones are normal faults formed through the linkage of many shorter segments.
A log–log plot of the fracture lengths (Figure 17) yields a straight-line relationship (Equation (4)). In a log–log plot such as here, the common (decimal) logarithms of the input (independent, x-axis) data and output (dependent, y-axis) data are computed and then plotted using ordinary x and y axes. (The other method, indicated above, whereby the axes themselves are logarithmic, so as to generate a logarithmic scale plot, is not used here.) It is often observed for log–log plots of geological (and other) data that a single straight-line relationship applies only to a certain restricted length (Figure 17b). Commonly, the distribution is better approximated by two (or even three) straight lines, as has, for example, been found in other studies of the size distributions of fractures (Figure 17c; [21,28]).
In Figure 17c the break in the straight-line slope occurs at the fracture length of about 500 m. For the individual fissure swarms (Figure 16), the breaks in the straight-line slopes occur at lengths of 300 m to 500 m. The breaks in the straight-line slope for the fractures can be largely explained in terms of a ‘phase change’, that is, change in the type of fracture formed as a function of length. More specifically, it follows from the Griffith crack theory through Equation (1) that on reaching a certain depth (Figure 6), tension fractures experience a ‘phase change’, that is, they change into normal faults [57].
The tension fractures (Figure 3, Figure 4, Figure 5, Figure 7 and Figure 18) are all part-through fractures, whereby they extend from the free surface of the rift zone and partly into the crustal segment hosting them.
In comparatively homogeneous rocks, such as the thick pahoehoe lava flows hosting the fissure swarms in Figure 16, subject to essentially constant loading (as is common for tension-fracture formation given the limited range of the in-situ tensile strength), the fractures may become approximately semi-circular in a vertical section [3]. The depth dmax at which a semi-circular fracture changes into a normal fault (Equation (1); Figure 6) is equal to half the strike-dimension (surface length) of the fracture. For fractures of length 300–500 m, namely at which the break in the straight-line slope occurs (Figure 17), the half-length is 150–250 m. This length is very similar to the estimated depth at which many of the tension fractures change into normal faults which, from Equation (1), is commonly between 122 m and 245 m. Thus, the fractures shorter than about 500 m—and the ends of many normal faults (Figure 7)—are mostly tension fractures whereas the fractures longer than about 500 m are mostly normal faults.
Furthermore, the depth of a few hundred metres, at which tension fractures change into normal faults, is similar to the estimated thicknesses of typical lava shields in Iceland, both Holocene shields, such as those hosting the fissure swarms in Figure 16 [58,59,60], as well as Quaternary and Tertiary shields [61]. The lava shields are composed of pahoehoe lava flows. At the lower contacts of the Holocene lava shields, there are abrupt changes in stiffness, particularly because many shields rest on hyaloclastites (basaltic breccias) and Pleistocene sediments. Thus, mechanically weak or, occasionally, open contacts are likely between the shields and the on which they rest, resulting in ‘phase change’ or change in the crack mode. More specifically, fractures confined to the Holocene flows, in particular the tension fractures, may be modelled as through-cracks [3,62], with many of the larger ones becoming arrested at the contacts between the lava shields and the underlying hyaloclastites and sediments. By contrast, most fractures that penetrate into the deeper layers, not only the hyaloclastites and sediments but also into the deeper pile of (mostly basaltic) lava flows and dike swarms, should be modelled as part-through cracks [3,62]. As discussed above, the latter are primarily normal faults.
It is known that on a log–log plot (Figure 17) a power-law distribution provides a straight line. Several tests can be used to analyse further the goodness-of-fit between the calculated power-law curves and the actual data [56]. For example, one test analyses the residuals of the curve-fitting procedure; the vertical distances of all the points from the regression line [55]. Another test uses the maximum likelihood method to compare the power-law fits with log-normal, exponential, and stretched exponential fits. Such tests suggest that power-law models fit the data from some of the fissure swarms in Figure 17 rather well, whereas for different fracture populations other models such as exponential models might possibly be provide better fits than power laws [28,55]—as we discuss further below.
The present fracture size distributions follow power laws but with different scaling exponents for the different fracture (sub)populations that constitute the total fracture set (Figure 16). The populations determined in this way have different strike-dimension or length ranges as well as entropies (Section 9) which, in turn, offer information on their mechanics of formation and, in particular, their relation to certain principles of thermodynamics and statistical physics.

3.2.2. Dikes

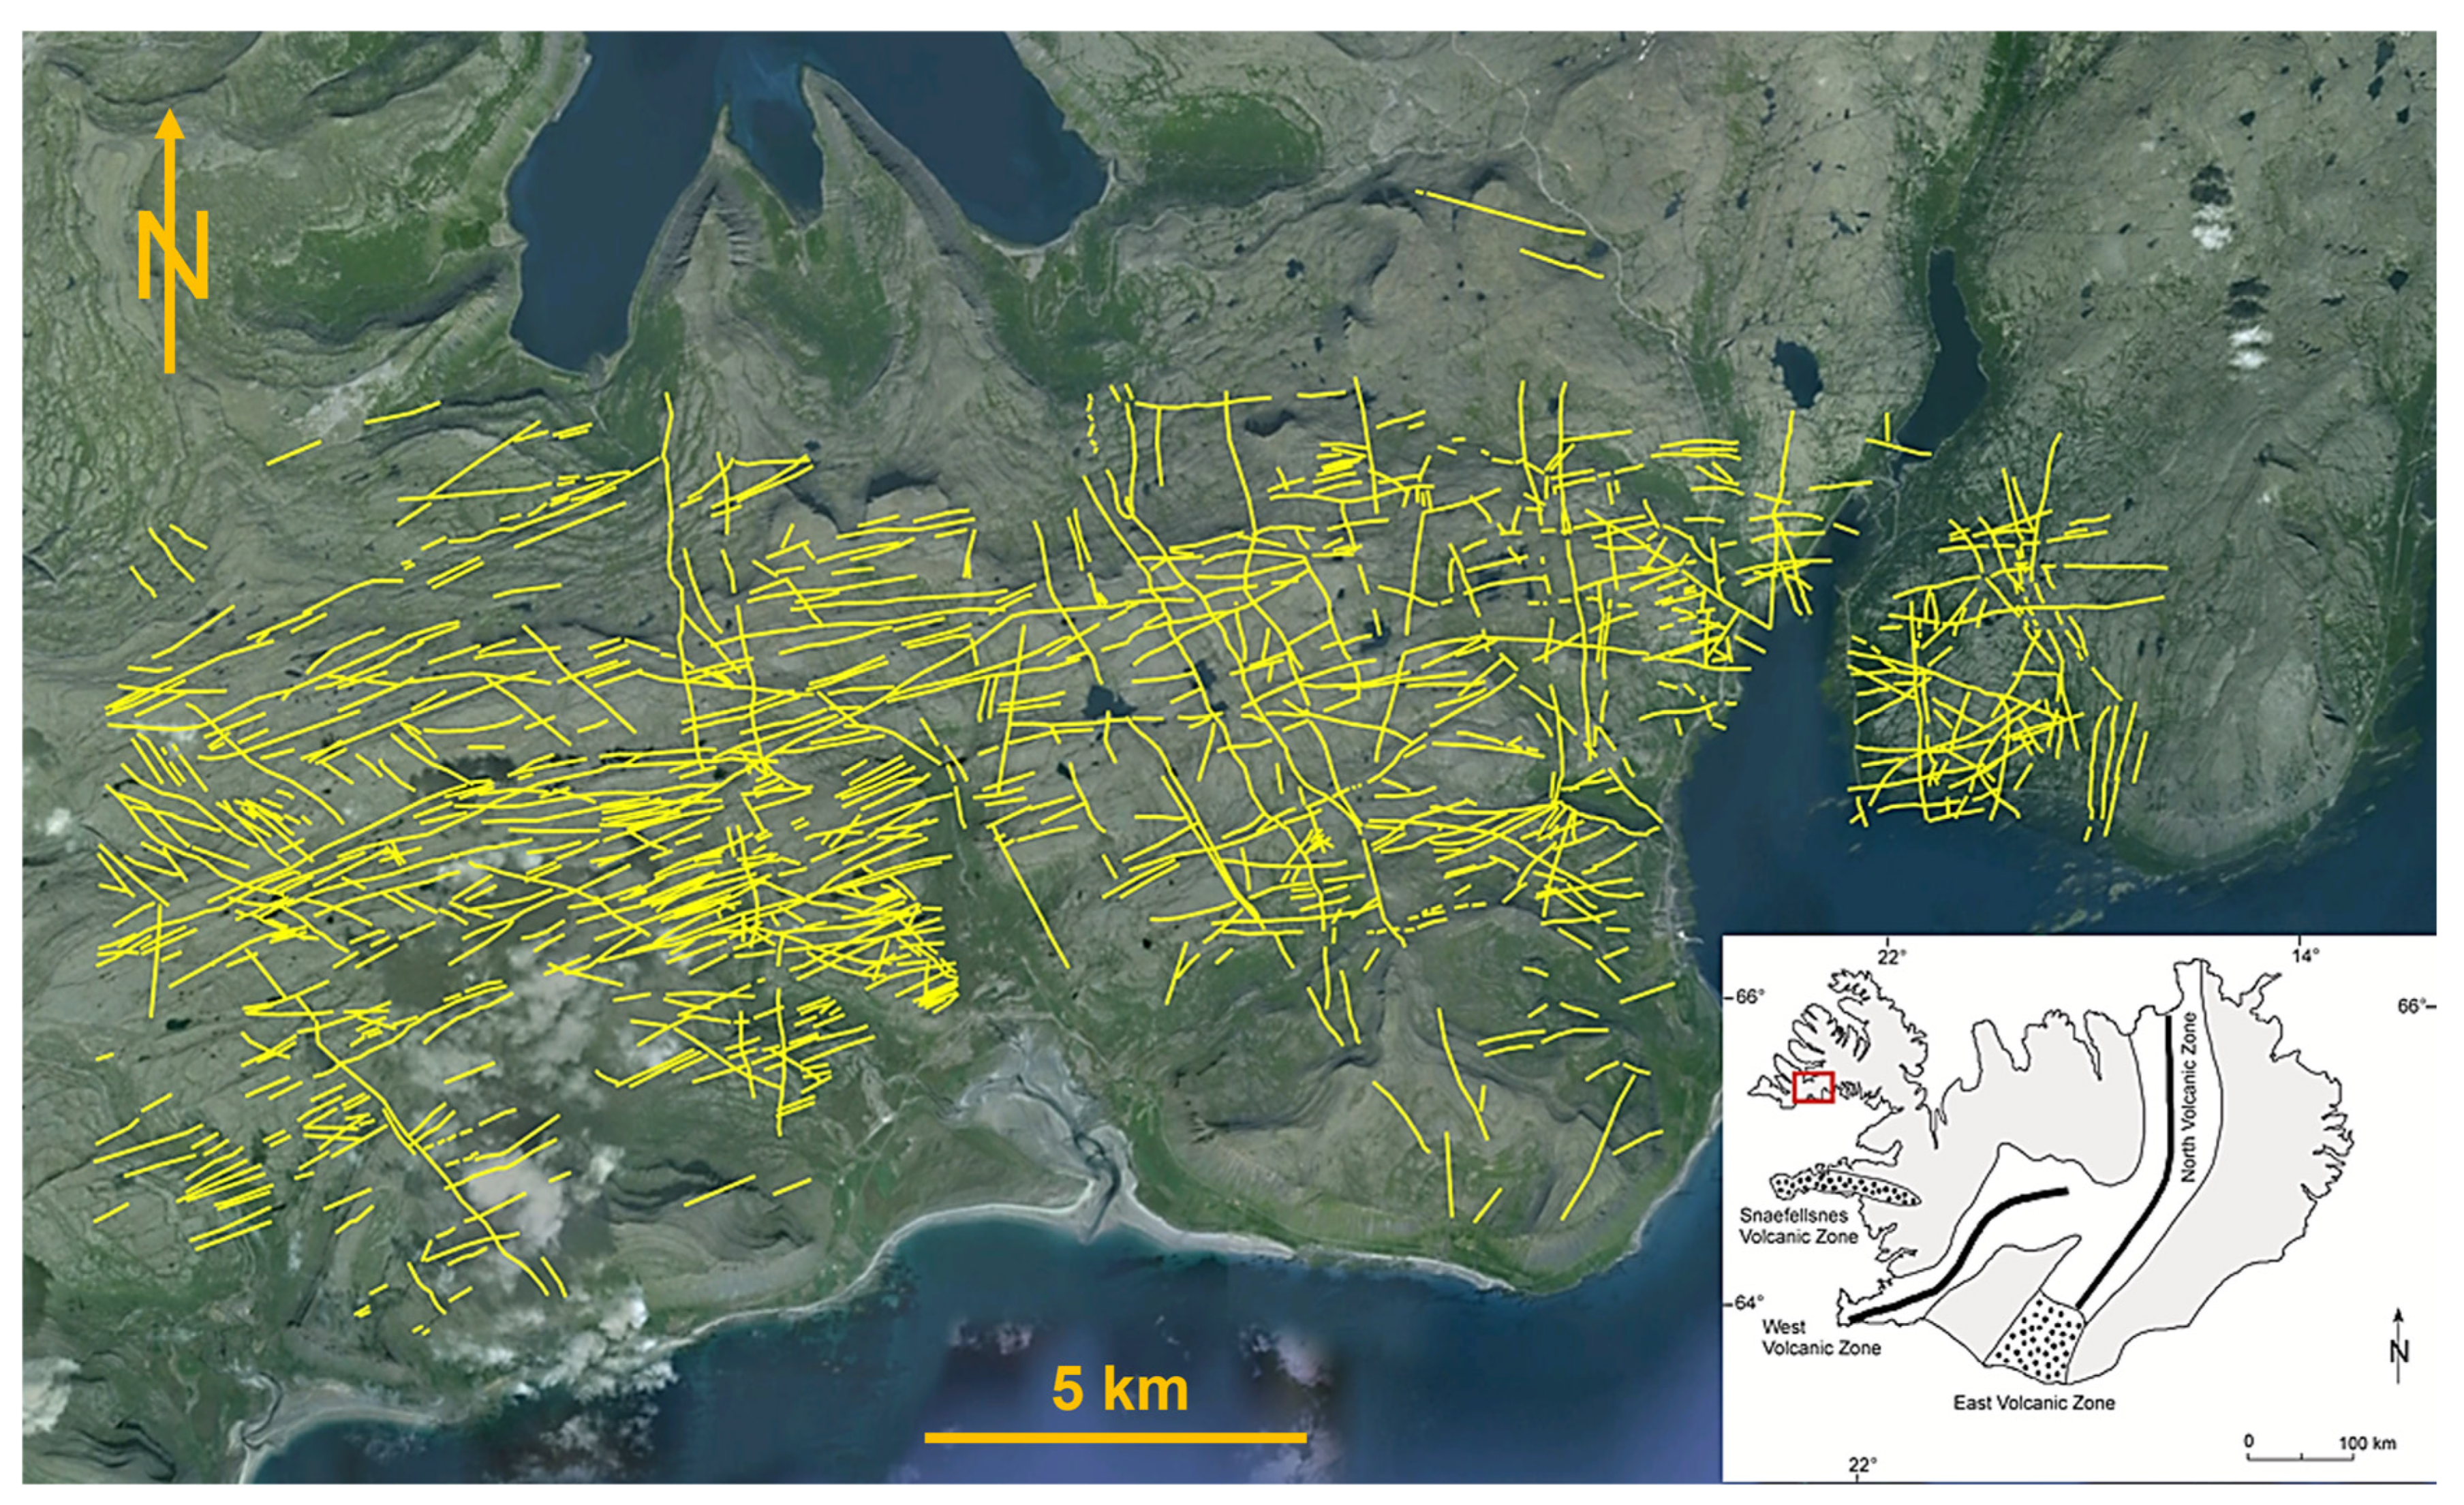
The length-size distribution of dikes is normally obtained from aerial photographs or satellite images. While some dikes have been followed on foot along their entire length [35], in order to obtain significant statistical data on dike lengths or strike-dimensions, images are used for exceptionally well-exposed swarms. Among the best-exposed dike swarms in Iceland are those in Northwest Iceland (the Vestfirdir area), on which the focus is here.
The mapped area is shown in Figure 19. All of the dikes are basaltic and dissect a 12–14 Ma old lava pile. The lava pile is predominantly basaltic lava flows, both aa and pahoehoe, but there are also scoria, soil, and sedimentary layers (including some lignite layers) in-between the lava flows. This means that the mechanical properties (particularly Young’s modulus) of the layers vary, which affects dike thickness as well as the potential for dike arrest. The geology of the area and the dikes are described in [63,64].
Since the lengths are estimated from aerial images, they are strictly the lengths of lineaments. Field observations and other criteria, however, indicate that the great majority of these lineaments are actually basaltic dikes. This conclusion rests on the following points. First, some 470 fractures (dikes and faults) were measured in the field. Of these only 68 or about 14% are faults (all being normal faults), whereas about 86% are basaltic dikes. Second, many of the lineaments seen in Figure 19 and used in the length measurements have been identified as dikes in the field. Third, the trace (strike) of normal faults, with an average dip of 69°, should be curved because of the uneven topography whereas the trace or strike of dikes (being close to vertical) should be nearly straight. As is seen in Figure 19 most of the lineaments are nearly straight, suggesting that they are dikes.
When deciding on the length or strike-dimension the rule used here is to regard as a single lineament/dike one that can be traced as a single line, though in places it may be somewhat offset or discontinuous. This rule follows from the fracture mechanics results that when the distances between the nearby ends of segmented extension fractures are small in comparison with the segment length (say, 10% or less of the segment length), then the fracture functions mechanically as a single fracture [3,49,50].
Using this rule, Figure 20 shows the length-size (strike-dimension size) distribution of the lineaments/dikes in Figure 19. The total number of measured lineaments/dikes is 1041. They range in length or strike-dimension from 26 m to 8948 m, that is, by a factor of about 340 and thus by more than two orders of magnitude. While the arithmetic average length is 826 m, it should be noted that such an average is not a good measure of the shape of the length-size distribution.
I tested the length-size distribution for a power law. The results (Figure 20) show that a power law does not provide a very good fit (R2 = 0.25; Figure 20a). When the data are transformed onto a log–log plot (Figure 20 inset), however, a single line gives a rather good fit (Figure 20b) but two straight lines give the best fit (Figure 20c). For these regression lines, the coefficients of determinations are R2 = 0.89 for the upper line and R2 = 0.97 for the lower line. The results suggest that variation in lineament/dike length may explain about 89% in the variation in number or frequency of short lineaments/dikes and nearly 97% in the variation in number of longer long lineaments/dikes.
The break between the two straight lines occurs at about L = 103 = 1000 m. In this estimate we assume that the break is where the two lines would cross. One interpretation of the break in the slope of straight lines on log–log plots of power laws is that there is a ‘phase change’ at the location of the break. As indicated above for the change of tension fractures into normal faults, such a phase change as regards rock fractures normally means a change in the mechanics of fracture development [28].
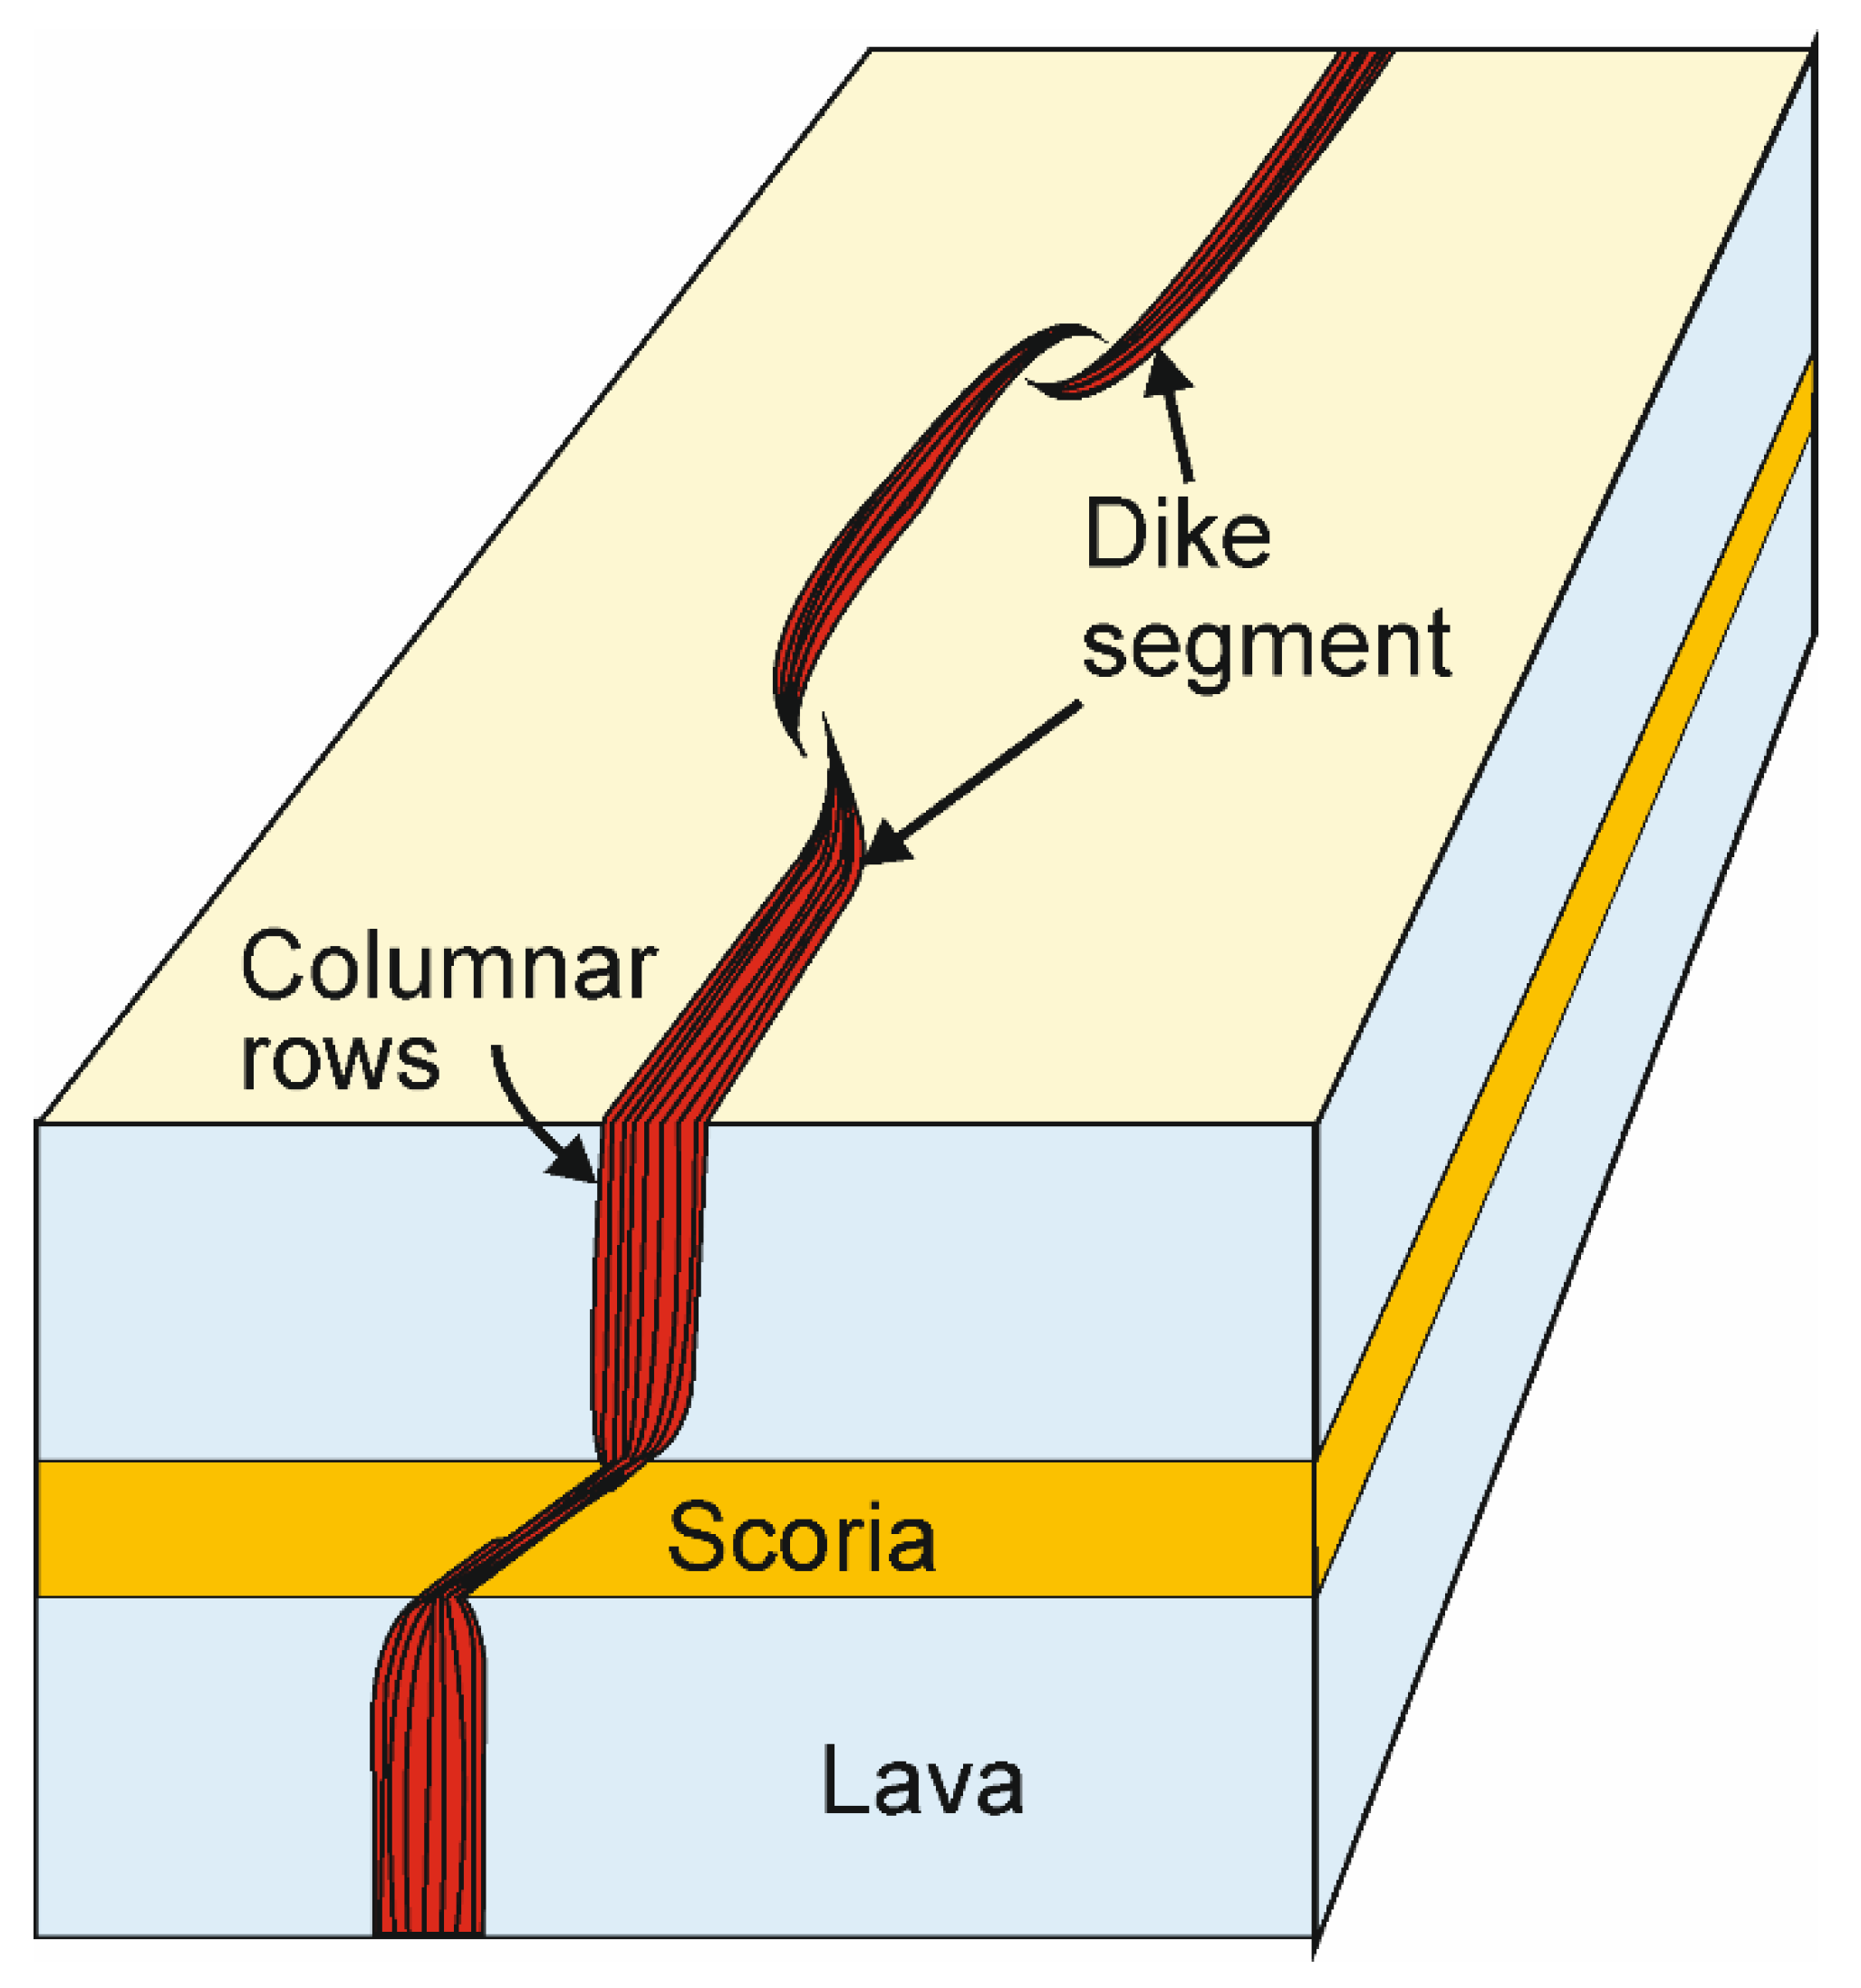
So, what change in the mechanics of dike emplacement could occur at a length or strike-dimension of about 1 km? I suggest that the change at that length is primarily the one from the emplacement of short single dikes to the emplacement of longer, commonly multiple, dikes. Fracture-mechanics results suggest that there is a linear correlation between the controlling dimension (the shorter of the strike-dimension and dip-dimensions) of an extension fracture (mode I crack) and the opening displacement or aperture of the fracture [3,49]. This applies particularly to all fluid-driven extension fractures (hydrofractures) such as dikes. The ratio of the strike-dimension/length to the thickness of a dike, which depends on various factors, is referred to as aspect ratio. For a given composition of dikes (here basaltic), crustal depth (here the depth of erosion varies but is mostly about 300 m), and elastic properties of the crust (here a basaltic lava pile), the range in aspect ratio is not very great. For 12 dikes (of those seen in Figure 20) whose thickness was measured accurately in the field and who could be identified with lineaments with a measured length, the aspect ratios range from 316 to 1532, with an average of 803. Some 34% of the dikes measured in the field (a total of 402 dikes) are less than 2 m thick, and 17% with a thickness of less than 1 m [63,64]. Based on the aspect ratios, most of the dikes with a strike-dimension/length of less than 1000 m would be with a thickness of around 1 m or less. These dikes are seen in the field to be composed of a single columnar row, that is, normally generated by a single magmatic injection.
By contrast, most dikes thicker than about 1 m, and thus with an average length of close to 1 km or more, are multiple [63]. This means that the thicker and longer dikes are mostly multiple and therefore formed by a somewhat different mechanism than the single dikes. Multiple dikes form when the same path is used repeatedly for dike injection. The process is described in detail in [65], but may be briefly summarised as follows.
When a dike forms it generates a (vertical) rock layer that everywhere has essentially the same mechanical properties. This normally means that the stress field along the dike becomes essentially homogenised—with the same orientation of the principal stresses everywhere along the dike [65]. When the dike forms, its magmatic overpressure (driving pressure) may generate temporary high horizontal compressive stress (sometimes resulting in the maximum principal compressive stress σ1 becoming horizontal for a while) in some layers that the dike dissects. Whether this happens depends on the state of stress in the crustal segment before dike injection as well as on the overpressure in the dike. If σ1 becomes temporarily horizontal, this may result in subsequent dikes becoming deflected into sills [1]. In rift zones, such as at the divergent plate boundaries in general, and in Iceland in particular (the main focus here), the high dike-induced horizontal compressive stress gradually becomes relaxed and σ1 becomes vertical again, as is its normal orientation at divergent plate boundaries. It follows that the injected, solidified dike is then stress- homogenised so as to be favourable (with σ1 vertical) to later dike injections along the same path, resulting in a multiple dike [65].
As regards the duration of their formation, there are two endpoints to be considered. First, some multiple dikes form in rapid succession over a year or a few years during the same volcanotectonic episode (when dike-fed eruptions occur, these are named ‘fires’ in Iceland). Second, other multiple dikes form over a long period of time, so that there may be hundreds or thousands of years between successive magma injections. The current Sundhnukur eruptions on the Reykjanes Peninsula, Iceland, are an excellent example of both endpoints. From November 2023 to April 2025 there were 9 dike injections along partly the same path, resulting in a multiple dike [65]. Of these 9 injections 8 reached the surface to feed a fissure eruption. So this is an example of the first endpoint. However, all these injections have occurred at or very close to a 2350-year-old crater row, named Sundhnukur. Thus the 9 dike injections have largely followed a 2300-year-old feeder-dike of the Sundhnukur crater row, thereby offering also an example of the second endpoint. For exposed multiple dikes in deeply eroded fossil volcanic systems, it is normally not possible to decide on the time between successive magma injections [65].
The mechanism by which the dike is emplaced, however, is different between single dikes and multiple dikes—and this difference is likely to be reflected in the different slopes on the bi-logarithmic plot (Figure 20). When a single dike forms, the magmatic pressure has to rupture the host rock at every point along the dike path. Additionally, the dike has to be able to overcome the mechanical difficulties associated with its propagating through contacts between mechanically dissimilar layers. The latter is a common reason for dike arrest [1,2,3]. Thus, much energy is normally needed for a single dike to propagate, particularly when propagating to the surface to erupt. By contrast, once a dike is formed, subsequent dike injections may follow its contacts with the host rock (particularly if the existing dike is formed much earlier, that is, not in the same volcanotectonic episode—and thus belonging to the second endpoint above). Alternatively, the subsequent dike injections may follow the solid, but still very hot, centre of the earlier dike (particularly if all the dike injections occur in the same volcanotectonic episode—and thus belong to the first endpoint above). Since the path for the magma is already established, much less energy is needed for the propagation of later dikes in a multiple dike than for the propagation of a single dike [65].
If the multiple dike grows in a self-affine manner, as is probably common, then the change in its dimensions during subsequent magma injections may be similar to that shown in Figure 21. As the initial dike then subsequently receives more new dike injections, it becomes thicker but also longer, that is, with a larger strike-dimension. This is in harmony with the observations in the Norwest Iceland (Figure 19) that most of the thicker dikes are multiple (Figure 22) and long. Thus, the change in slope can be explained by change in the mechanics of dike emplacement, and associated changes in the energy budget associated with dike emplacement.

3.3. Exponential Laws

A general exponential function y may be written as:
y = P ( x ) = C a k x
where C is the point where the curve of the function intercepts or crosses the vertical y-axis, (C 0 ) , a is the real number (a > 1) that is the base (a is also the growth factor of the function, how it grows or decays), k is a constant (k 0 ) , and x is a variable. Clearly, the main difference between an exponential function (Equation (5)) and a general power function (Equation (2)) is that in an exponential function the base is a constant and the exponent (power) a variable whereas in a power function the base is a variable and the exponent (power) a constant.
The number of possible exponential functions is infinite. Here, however, we use the one referred to as the natural exponential function, namely the following:
y = P ( x ) = C e k x
where the base e is Euler’s number (e = 2.71828182…), an irrational and a transcendental number, and all the other symbols have the same meaning as in Equation (5). Further observations as to Equations (5) and (6) are as follows. The parameter C is the vertical intercept of the function, that is, the y-intercept of its graph—so that the function crosses or passes through the y-axis at the point (0, C). The parameter k determines the relative steepness or flatness of the graph. This means that the larger the value of k the steeper is the function (and its graph). Also, Equations (5) and (6) are never zero. They approach the line y = 0 as a horizontal asymptote (the horizontal x-axis), but never reach it; that is, the curve never crosses the x-axis. We will be dealing with decreasing exponential functions. These are obtained when either C is negative or k is negative (but not both).
For testing the linear fit of exponential functions to datasets, we do not use bi-logarithmic or log–log plots (as for power functions), but rather semi-logarithmic plots (semi-logarithmic coordinates). This means that only the y-axis is logarithmic (logarithmic scale) whereas the x-axis remains linear (linear scale). If we first take the natural logarithm (ln) of Equation (6) we obtain
ln y = ln P ( x ) = ln C e k x = ln C + k x
Below we explore how well the size distributions of populations of fractures and dikes in Iceland can be modelled with exponential functions or laws. In all cases the exponential functions are negative, that is, decreasing, so that he number or frequency of fractures/dikes decreases with increasing size of fractures/dikes (as was the case for the power function modelling of fractures/dikes above).

3.3.1. Tension Fractures and Normal Faults

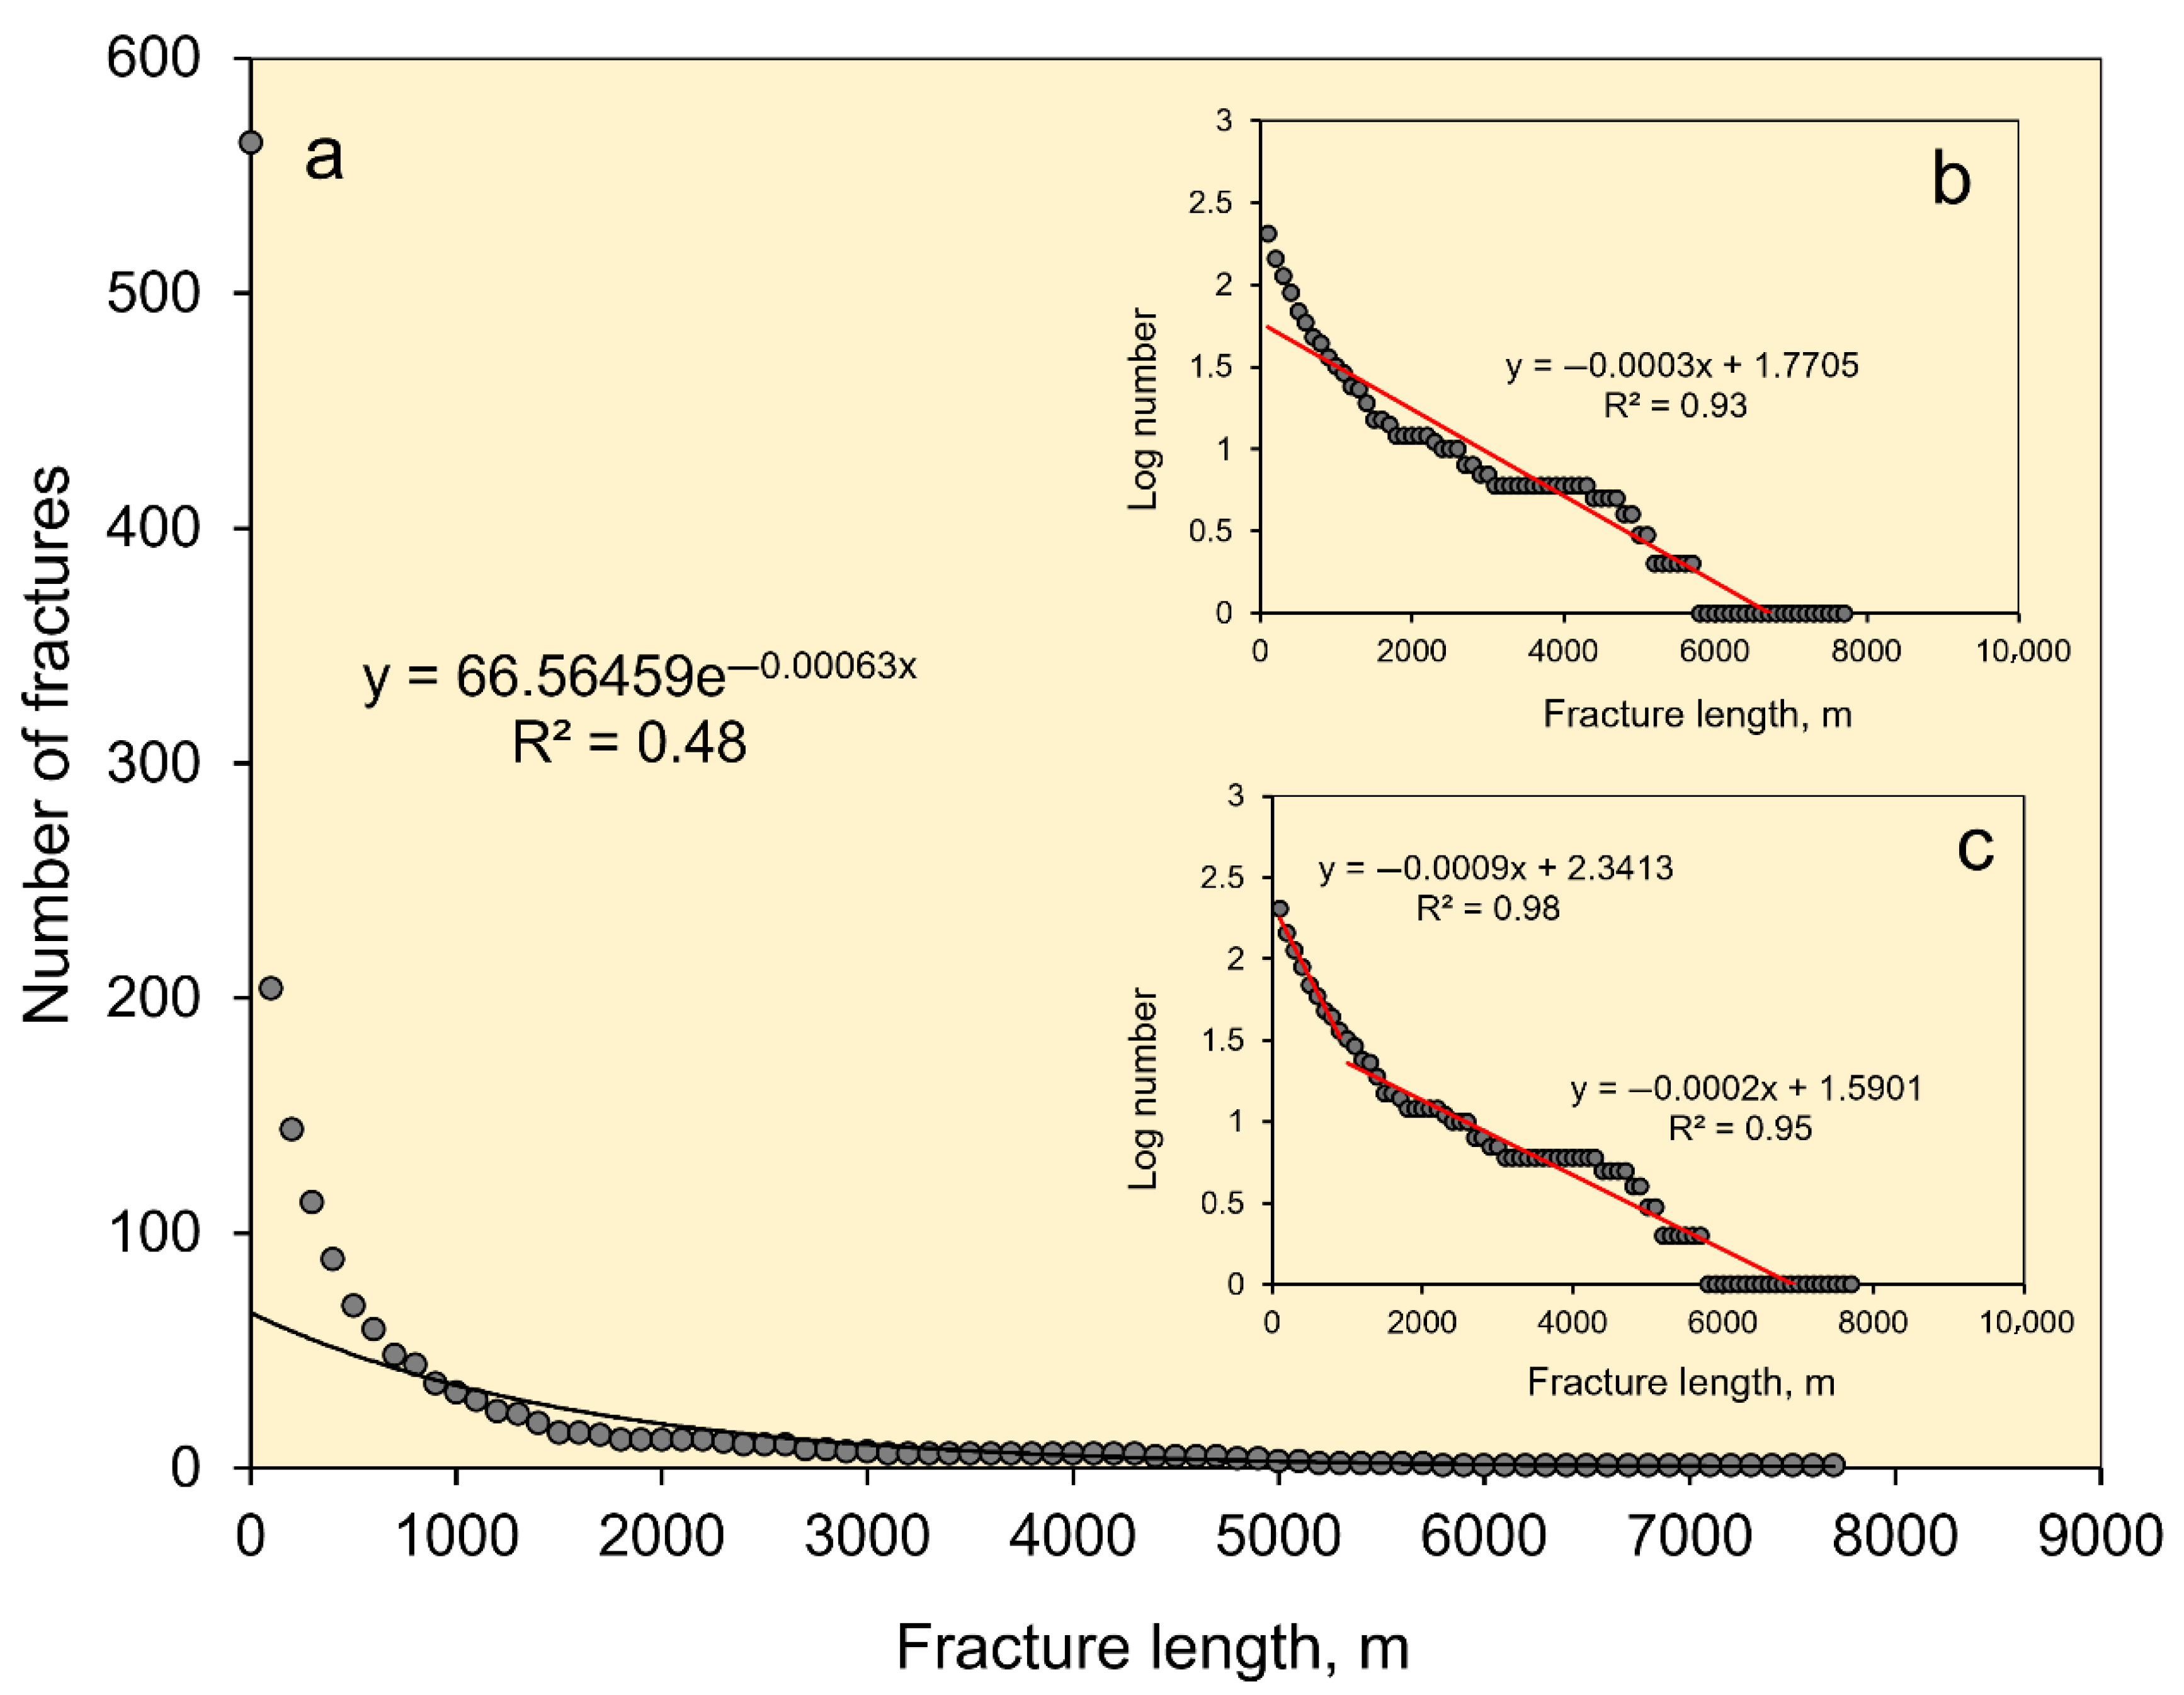
We use the same bin size as for the power laws, namely 100, and a cumulative plot for all the 565 fractures (tension fractures and normal faults) in the fissure swarms. The results (Figure 23) show that, in general, a negative exponential function provides only a reasonable fit to the fracture-length size distribution (R2 = 0.48; Figure 23a). When the data are semi-log-transformed, the fit becomes much better, however. Even a single-line regression provides a good fit, with R2 = 0.93 (Figure 23b), while a double-line regression provides an even better fit, with R2 = 0.95 for the lower straight line and R2 = 0.98 for the upper straight line (Figure 23c).
Comparison with the power-law fits, however, shows that they are similar to those of the exponential-law fits. Thus, while the fit of the non-transformed data is better to the power law than to the exponential law based on a straightforward interpretation of R2 (which is 0.78 for the power law and 0.48 for the exponential law), when the data are transformed on a semi-logarithmic plot, the results are more similar. Thus, for a single-line plot R2 is 0.91 for the power-law fit (Figure 17b) but 0.93 for the exponential-law fit. Similarly, for a double-line fit to the power law R2 is 0.90 for the lower line and 0.97 for the upper line (Figure 17c), whereas for a double-line fit to the exponential law R2 is 0.95 for the lower line and 0.98 for the upper line. Thus, based on straightforward interpretation of the coefficients of determination, and bearing in mind the uncertainties and changes introduced as the original data are transformed, the tectonic-fracture length data fit about equally well to a power law as they do to an exponential law.

3.3.2. Dikes

Again, using the same bin size as for the power laws, the results (Figure 24) suggest that, in general, an exponential function provides a good fit to the dike-length size distribution (R2 = 0.91; Figure 24a). When the data are semi-log transformed the fit becomes even better. Thus, a single-line regression provides a very good fit with R2 = 0.96 (Figure 24b). Similarly, a double-line regression provides an excellent fit, with R2 = 0.98 for the lower straight line and R2 = 0.99 for the upper straight line (Figure 24c).
The negative exponential-law fit to the dike lengths is considerably better than the power-law fit (Figure 20). Thus, the fit of the non-transformed dike-length data is much better to the exponential law than to the power law based on a straightforward interpretation of R2 (which is 0.25 for the power law and 0.91 for the exponential law). The transformed data also show a better fit to the exponential law than to the power law. Thus, for a single-line plot R2 is 0.92 for the power-law fit (Figure 20b) but 0.96 for the exponential-law fit (Figure 24b). Similarly, for a double-line fit to the power law R2 is 0.97 for the lower line and 0.89 for the upper line (Figure 20c). For comparison, for the a double-line fit to the exponential law R2 is 0.98 for the lower line and 0.99 for the upper line. Thus, based on straightforward interpretation of the coefficients of determination, the dike-length data fit a negative exponential law better than a negative power law.

4. Theoretical Framework

Griffith’s theory of fracture, which forms the basis for understanding formation and development of fractures in fissure swarms and dike swarms, derives from thermodynamic considerations. In particular, the theory considers the global balance of energy in a solid body—here a rock body or a crustal segment—with existing flaws or micro-cracks [4,62,66,67,68]. More specifically, Griffith’s theory explores and analyses (a) the elastic energy stored as potential (including strain) energy in the solid, (b) the energy needed to generate a new crack surface, that is, the surface energy, and (c) the work performed during the crack growth by the loads on the body. Thermodynamics is a phenomenological macroscopic theory whose microscopic basis is statistical physics (also referred to as statistical mechanics and, occasionally, as statistical thermodynamics). Statistical physics provides a microscopic and probabilistic treatment of all forms of matter so as to explain their bulk behaviour. A further development of the field connects it with information theory which is widely regarded as offering a deeper foundation of statistical physics. Here I provide the basic theoretical results of thermodynamics and statistical physics that are relevant for understanding the development of fissure swarms and dike swarms.
Both fields use the concept of entropy. Entropy, the basic concept of the second law of thermodynamics, was introduced by Clausius in 1865 as a measure of the input of heat at a given temperature to a thermodynamic system. The unit of entropy is joule per kelvin, that is, JK−1. Later in the 19th century when Boltzmann and Gibbs gave the entropy concept a probabilistic interpretation, the original unit of JK−1 was maintained by multiplying the logarithm of probability by the Boltzmann constant kB = 1.38 × 10⁻²³ JK−1. The entropy introduced by Shannon during the development of information theory, that is, the Shannon entropy, does not have a specific physical unit. The Shannon-entropy unit depends on the base of the logarithm used. At present there are many entropy measures in use—not only in physical sciences, but also in life and social sciences. Many of these entropy measures have arbitrary units. The units can, however, normally be connected to the original thermodynamic/statistical physics entropy concepts and units after suitable manipulation.
A thermodynamic system may be defined as the part of the universe that is of main interest in any particular thermodynamic study, the rest being referred to as the surroundings. For tension fractures and most normal faults in fissure swarms in Iceland (Figure 3, Figure 4, Figure 5, Figure 6, Figure 7 and Figure 18), the system is the fracture itself while the surroundings of the system may be regarded as the fissure swarm. For larger faults in a rift zone, with dimensions of the order of 101 km, the system includes the fault core and damage zone [3] while the surroundings may be regarded as the entire volcanic zone hosting the fault. In Iceland the volcanic zones are mostly 30–80 km wide and about 150 km long (Figure 1 and Figure 16; [69]). For the largest fault zones on Earth, reaching lengths of 1000–2000 km or more [70,71,72], the entire hosting plate (or plates, for faults located at plate boundaries) may be regarded as the thermodynamic surroundings. Similarly for regional dikes: the system is the dike itself and the surroundings the volcanic zone within which the dike becomes emplaced. For small inclined sheets, the system may be regarded as the volcanic system, including the central volcano and its magma chamber, within which the sheet is emplaced. Generally, the surroundings should here be regarded as that part of the Earth’s lithosphere which exchanges matter and elastic energy (through stress, fluid pressure, and work) with the fissure swarm/dike swarm (Figure 1 and Figure 16).
The internal energy of a thermodynamic system such as fissure/dike swarm is denoted by U. The internal energy is the sum of the potential energy of inter-particle forces and the kinetic energy associated with the random motion of the particles (atoms, molecules). A distinction is made between two types of energy transfer, namely work and heat. Both concepts relate to energy being transferred, that is, energy in transit. However, work is an orderly transfer of energy through coordinated motion of particles and normally involves forces. For example, when plate-tectonic forces generate movement of fault walls, fault slip, or opening of a tension fracture, the movements of all the particles that constitute the rock on either side of the fracture/fault rupture plane are in harmony and the slip/opening times the force constitutes the associated work. By contrast, heat is transfer of energy, because of temperature difference, in a disorderly manner, that is, through uncoordinated motion and collision of particles. Thus, general heat flow in a dike swarm and an associated fissure swarm—or through a large fault zone—both result in disorderly transfer of energy through the rocks. While work and heat are thus related—both have the unit of energy, joule, and heat may also be regarded as work that is randomly or disorderly distributed among particles—the disorderly energy transfer means that heat is a low-quality energy. More specifically, whereas work can be completely converted or transformed into heat, the reverse does not hold; only a fraction of heat can be converted into work. Work comes in many forms, but heat comes in only one form, that is, as heat.
The first law of thermodynamics, the law of conservation of energy, may be expressed as:
d U = d Q + d W
where dU is an infinitesimal change in the internal energy of the thermodynamic system. The change in internal energy is then the result of heat dQ being added to the system and work dW being done on the system. Notice that in this definition work done on the system (by the surroundings) is regarded as positive, as is common in physics, whereas in some definitions, particularly in engineering, work done by the system (on its surroundings) is regarded as positive. The term dU is a proper state function, that is, independent of the path taken, and therefore an exact (or proper) differential. By contrast, the terms dQ and dW are both inexact (or imperfect) differentials. This follows because these terms are not state functions but rather path functions, that is, they depend on the path taken from the initial to the final value. Since the path dependence of heat and work is well known [73], I use no special symbols for these.
The second law of thermodynamics introduces the concept of entropy and may be formulated in many ways. One statement is that for an isolated system the entropy must increase during any spontaneous or natural process within that system. It follows that the second law allows us to forecast which processes take place spontaneously or naturally, in the absence of any external driving forces or energy inputs. Another statement of the law is that during any process the total entropy change of the universe (or the system and its surroundings) must be greater than or equal to zero. Entropy is commonly interpreted as a measure of disorder in a system. This interpretation is helpful in some ways, but it is often better to think of entropy as a measure of ‘spreading’, particularly when analysing the entropy of statistical size distributions of processes or objects, such as fracture lengths (Figure 17).
Consider a reversible process in a closed system, that is, a process that allows the system to return to its initial state. During such a process at a specific temperature T, the differential or infinitesimal change in entropy dS is given by:
d S = d Q r e v T
where d Q r e v is the infinitesimal amount of heat received by the system. Equation (9) shows that when heat is transferred from the surroundings to a system the entropy increase of the system is directly proportional to the received heat and inversely proportional to the absolute temperature at which the heat is received. Equation (9) may also be regarded as a definition of entropy, S. Because entropy is a state function, and thus path-independent, the integral of S when the initial and final stages are identical, in which case the integral is around a closed loop or a complete cycle, is zero. When the process is irreversible, Equation (9) becomes the Clausius inequality, namely:
d Q T 0
More generally, change is entropy can then be given as:
d S = d Q r e v T d Q T
here the equality applies if the process represented by the term on the right-hand side of the equality sign is reversible, denoted by dQrev. As discussed for Equation (8), dQ itself is an inexact (or imperfect) differential. However, when dQ is multiplied by T−1, as in Equation (11), the resulting term dQ/T becomes an exact differential. It therefore follows that dS is an exact differential (path independent).
From Equation (11) we have, for a reversible process:
d Q r e v = T d S
in case of a gas container of initial volume V and gas pressure p, the infinitesimal work dW in compressing the gas is given by:
d W = p d V
combining Equation (13) and Equations (8) and (12) we obtain the following equation for a closed system:
d U = T d S p d V
Equation (14) combines the first and second laws for closed systems and is regarded as the fundamental equation of thermodynamics. When Equation (14) is applied to an open system, a term allowing material exchange between the system and its surroundings must be added. All the quantities in Equation (14), that is, the internal energy U, the temperature T, the entropy S, the pressure p, and the volume V, are state functions. It follows that Equation (14) can also be used for irreversible processes and is, in fact, valid for any process in a closed system.
The physical meaning of Equation (14) is that when either the entropy S or the volume V change then the internal energy of the system U also changes. V and S are both extensive variables, meaning that they depend on the size or extent of the thermodynamic system. More specifically, V and S change depending on the quantity of material present in the system. By contrast, p and T are intensive variables, meaning that they do not depend on the size of the system or the quantity of material in the system. S and V are also referred to as natural variables of the thermodynamic potential U.
A potential is a variable that, when subject to certain constraints, is minimised or maximised at equilibrium. A thermodynamic potential is a measure of the energy stored in a system and how that energy is transformed or converted when the system—subject to given constraints—evolves towards equilibrium. Thus, thermodynamic potentials determine the direction that spontaneous or natural processes in a system are likely to follow. In addition to entropy and internal energy, the thermodynamic potentials are primarily Helmholtz free energy F, Gibbs free energy G, and enthalpy H. The focus here is on Helmholtz free energy.

5. Free Energy

Energy that is free or available to do work rather than being dissipated out of the thermodynamic system as heat is referred to as free energy. Helmholtz free energy is a measure of the energy available to do useful work in a system that has constant (fixed) temperature and volume. Similarly, Gibbs free energy is a measure of the energy available to do useful work in a system that has constant temperature and pressure. The variables that are held constant (fixed)—for example, temperature and volume for Helmholtz free energy—are called the natural variables of that potential. One main benefit of the potentials is that the thermodynamic calculations can then focus exclusively on the system, rather than the system and its surroundings. All thermodynamic potentials are extremum principles. This means that they are minimised or maximised when the system has reached equilibrium. Also, all the potentials have the units of energy, joule.
The Helmholtz free energy, also known as the Helmholtz function or the work function, is a state function and denoted by F. It gives the maximum useful work that can be done by a system, as well as the spontaneous direction of a process (or reaction), under the condition of constant temperature and volume and is defined as:
F = U T S
where U is internal energy, T is temperature, and S is entropy. The Helmholtz free energy F is thus a measure of the maximum work that can be obtained from a system during a process. More specifically, it is the difference between the internal energy of the system and the energy (TS) taken up by the entropy term as unavailable energy. It follows that F represents the energy in the system available to do work and thus the maximum work the system can do. Differentiating Equation (10), the infinitesimal change in F is:
d F = d U T d S S d T
Substituting Equation (9) for dU in Equation (16), we get:
d F = S d T p d V
For constant temperature dT = 0 such that:
d F = p d V
For the change in F to be positive, the surroundings must do reversible work on the system. Conversely, for the change in F to be negative, the system itself must do reversible work on the surroundings. For constant temperature (no heat being added to the system), an infinitesimal change in work is, from Equation (8), dW = pdV, so that, from Equation (13), we obtain:
d F = d W
which implies that a positive change in the Helmholtz free energy of a system is equal to the reversible work done on that system by the surroundings. Conversely, a negative change in Helmholtz free energy of a system implies reversible work done by the system on its surroundings. If, in addition, the volume is constant (fixed grip in solid and fracture mechanics), then dV = 0 and, from Equation (18), we get:
d F = 0
Thus, the Helmholtz free energy F has an extreme or stationary value at constant temperature and volume. It can be shown that the second derivative is positive, in which case the extreme value is a minimum. More specifically, in a process that results in the temperature of a thermodynamic system becoming the same as that of the surroundings, the maximum work that can be obtained from the system is equal to its decrease in the Helmholtz free energy F.

6. Frequency Distributions

In statistical physics, the frequency distribution of the microstates of a thermodynamic system is a function of temperature. When the system is not subject to any constraints, the maximum-entropy principle predicts a flat frequency distribution. As discussed in connection with the general Gibbs–Shannon entropy formula below, the implication is that for a discrete frequency distribution, the highest entropy is provided by a uniform distribution, while for a continuous frequency distribution the highest entropy is provided by a very flat Gaussian or normal distribution.
The thermodynamic system is commonly subject to constraints, however. For example, common constraints are that the energy as well as the number of objects (particles/atoms in statistical physics) in the system are constant (fixed). In that case the frequency distribution becomes negative exponential and is referred to as the Boltzmann distribution. Let us denote the energy associated with a certain condition or state of a thermodynamic system by ε. Then the frequency of occurrence of that state, that is, its probability of occurrence P(ε), is presented by the Boltzmann distribution:
P ( ε ) e ε / k B T
As indicated above, kB is the Boltzmann constant and T is the temperature. In addition, the specific term:
e ε / k B T
is known as the Boltzmann factor.
We can now consider the frequency or probability of occurrence of states i, which have total mechanical energy Ei, where the states are either quantum states or, in classical statistical physics, microstates. For a macroscopic thermodynamic system in equilibrium at temperature T it follows from Equation (22) that the probability Pi of finding the system in the given (micro) state i is:
P i = e E i / k B T i e E i / k B T
which is one version of the Boltzmann distribution. Here the denominator, representing the sum over all the states i, is a normalising factor that assures that the sum of all the probabilities equals one, so that:
i P i = 1
more specifically, the dominator is known as the partition function, denoted by Z, and given by:
Z = i e E i k B T
Using Equation (25), Equation (23) can written as:
P i = Z 1 e E i / k B T
which is another version of the Boltzmann distribution. The Boltzmann distribution may be regarded as a law that provides a key connection between the microscopic and macroscopic worlds. More precisely, the law connects microscopic particles (atoms, molecules) and energy, on one hand, and the macroscopic everyday world of measured averages such as volumes, pressures, and temperatures, on the other hand. Furthermore, the exponential energy term in the Boltzmann distribution can be connected directly with probability theory or, in particular, to the product law of probability [74].
From Equation (26) it follows that the probability of a particle (atom, molecule) occupying a given energy level is directly proportional to the exponential of the negative of its energy divided by the product of the Boltzmann constant and the absolute temperature. The Boltzmann distribution thus indicates with what frequency the microstates of the thermodynamic system occur for a given temperature. For a reasonably large and fixed number of particles the Boltzmann factor—denoted as Equation (22) here, although not an equation—and the Boltzmann distribution, Equations (23) and (26), apply to any thermodynamic system in a thermal equilibrium. At low temperatures all the particles will be in the lowest possible state whereas at very high temperatures the distribution over the energy states will be more approximately uniform. It is strictly only for theoretically infinitely high temperatures that all the probabilities of occupation will be the same, so that the distribution becomes truly uniform.
The Boltzmann distribution law is effectively a generalisation of two other well-known frequency distributions. One is the Maxwell velocity distribution of molecules, which applies to the velocity distribution in an ideal gas. The other is the barometric distribution—also known as the barometric equation—which yields (approximately) the atmospheric pressure as a function of altitude above the Earth’s surface.

7. Relation Between Frequency Distribution, Free Energy, and Entropy

Using the Helmholtz free energy (Equation (15)), the partition function (Equation (25)), and the Boltzmann distribution (Equation (26)), we can derive a general formula for entropy that is directly applicable to frequency distributions such as the ones in Figure 17, Figure 20, Figure 23 and Figure 24. Using the symbol β for the term (kBT)−1 the partition function, Equation (25), may be written as:
Z = i e β E i
the average of the energies of the microstates, based on the frequency of visits, that is, the mean energy of the microsystem E , equals the probabilities Pi times the energies Ei, thus:
E = i P i E i
Using Equations (22), (26) and (27) becomes:
E = 1 Z i E i e β E i = 1 Z Z β = ln Z β
here the partial derivative is used so as to indicate that the energy levels are held constant during the differentiation. Recalling from Equation (27) that β = ( k B T ) 1 , Equation (29) may be rewritten in terms of temperature T thus:
E = k B T 2 ln Z T
We now identify the average energy with the internal energy of the thermodynamic system so that E = U , in which case Equation (15) becomes:
E = U = F + T S
Then, from Equation (17), we have:
S = F T V
this is one of the Maxwell relations, the partial derivative being used because the volume V is assumed constant (the subscript V is implied but omitted in the equations below). Using Equation (32) for the entropy S in Equation (31) we get:
U = F T F T = T 2 F T 2 1 T F T
Applying the quotient rule from calculus, we rewrite Equation (33) on the form:
U = T 2 T F T
using the identity E = U (Equation (31)) and Equation (30) Helmholtz free energy F may be written in the form
F = k B T ln Z
recalling again from Equation (26) that β = ( k B T ) 1 , Equation (35) may also be recast as:
Z = e β F
If we know the partition function Z of a thermodynamic system then Equation (36) contains all we need to know about the thermal behaviour of the system. In particular, Equations (35) and (36) provide a link between the microscopic material world, as specified through the microstates, and the macroscopic material world, as specified through the Helmholtz free energy.
Using the relation between S and F provided by Equation (32) and differentiating Equation (35) we obtain
S = F T = ( k B T ln Z ) T = k B ln Z + T ln Z T
here the volume V is constant (fixed). In case of systems with variable number of particles N, their number is also assumed constant. Equation (37) then establishes a clear relationship between entropy S and free energy F.
From Equation (37) the most useful form of the entropy formula can be obtained as follows. Using Equation (27) for Z, we complete the differentiation of the logarithm of Z with respect to T (Equation (37)), in which case we obtain:
ln Z T = 1 Z Z T = 1 Z i e E i / k B T T = 1 Z i e E i / k B T × E i k B T 2
Then we combine Equations (37) and (38) and obtain the entropy S thus:
S = k B ln Z + k B 1 Z i e E i / k B T × E i k B T
Taking the natural logarithm on both sides of Equation (26) yields:
ln P i = E i k B T ln Z
Rearranging the terms in Equation (39) and using the correct sign for kB we obtain
S = k B i 1 Z e E i / k B T × E i k B T + ln Z
It then follows from Equations (26) and (35) that Equation (41) reduces to:
S = k B i p i ln p i
Here we use lower-case p for probability so as to follow the standard practice in statistical physics and information theory.
Equation (42), referred to as the Gibbs–Shannon entropy formula, is completely general and applies to any probability distribution. This means that Equation (42) can, for example, be used to calculate the entropy of length-size distributions of tectonic fractures and dikes (Figure 2, Figure 3, Figure 10 and Figure 11), as is done in later sections. This is, in fact, a widely used entropy formula in fields outside physics and chemistry. In particular, it is the basis for information theory.
For a discrete, binned, probability distribution, then if all the bins are of equal height, the distribution is uniform and yields the Boltzmann entropy formula. Thus, if W is the number of microstates (or, here, bins), so that p i = 1 / W , then from Equation (42) we get for a uniform distribution:
S = k B i p i ln p i = k B i = 1 W 1 W ln 1 W = k B ln 1 W = k B ln W
This is the Boltzmann entropy formula which applies to systems in equilibrium. Equation (38) shows perhaps even more clearly than Equation (42) that entropy is basically the logarithm of probability multiplied by the Boltzmann constant kB.
As indicated above, the Gibbs–Shannon entropy formula (Equation (42)) is totally general. It is, for example, also valid for thermodynamic systems that are not in equilibrium, such as systems that are not with constant (fixed) volume (V), constant energy (U), or constant number of particles (N) [75].

8. Energy Needed for Fracture Propagation

The size distributions of the fissure (tectonic fracture) populations and dike populations (Figure 17, Figure 20, Figure 23 and Figure 24) can be explained in terms of Griffith’s theory of fracture in solids which derives from thermodynamic considerations of the global balance of energy in a solid body with existing flaws or micro-cracks [4,62,66,67,68]. The theory examines and explores (1) the stored as potential energy in the solid, (2) the energy needed to generate a new fracture (here including dike-fracture) surfaces, and (3) the work performed during the fracture propagation by the loads on the solid body.
All rock fractures, including fissures (tectonic fractures) and dikes, need energy to form. This energy is primarily needed to rupture the rock and form two surfaces (surface energy)—namely the fracture walls (Figure 5, Figure 7, Figure 10, Figure 12, Figure 15, Figure 18 and Figure 22). The energy for initiating and propagating the tectonic fractures of a fissure swarm (Figure 3) and a dike swarm (Figure 11 and Figure 19) is, for plate boundaries, provided primarily by the plate-tectonic forces (Figure 1 and Figure 16). In detail, there are two possible sources of the potential energy: (1) the internal strain energy Uo stored in the plate-boundary segment prior to fracture propagation, and (2) the work WL done through the generalised plate-tectonic forces operating on the boundary while the fracture propagates. The available energy for the fracture formation at any particular instant depends on how much of the energy is dissipated as heat (partly through friction). The available energy is normally equal to the Helmholtz free energy (Equation (15)).
In order for a fracture to initiate and propagate, the total available energy Ut in the solid rock hosting the facture must be large enough to overcome the surface energy Ws that is needed to form the two new fracture surfaces. Here, the total energy is basically the Helmholtz free energy (Equation (15)) of the thermodynamic system. As indicated above, for a fracture to propagate in the rock, Ut must either remain constant or decrease during the propagation. For a thermodynamic system such as a swarm of fissures and/or dikes (Figure 4) the total energy Ut of the system is:
U t = Π + W s
where Π is here the potential energy of the that part of the plate-boundary segment (Figure 2, Figure 3 and Figure 4) which hosts the fracture network, and Ws is the surface energy or work needed to generate two new fracture surfaces during a particular fracture propagation. For fracture propagation under equilibrium conditions, in which case Ut = constant, Equation (44) can be differentiated with respect to the total new fracture surface area dA to obtain
d U t d A = d Π d A + d W s d A = 0
so that:
d Π d A = d W s d A
Equation (46) can then be used to define the energy release rate G:
G = d Π d A
this is the energy available to drive the fracture propagation, which occurs if G reaches:
G c = d W s d A
thus, Equation (48), which is the right-hand side of Equation (46), represents the critical energy release rate for a fracture to propagate, Gc, and is known as the material toughness of the solid (here the hosting rock body). For a rock fracture to propagate at a plate boundary such as in Iceland (Figure 1 and Figure 16), the plate-boundary segment hosting the fissure swarm/dike swarm must receive enough energy (primarily from plate-tectonic forces) so that the surface energy Ws can be overcome.
In Equations (47) and (48) the differentiation is with respect to the total fracture surface area A. The energy release rate can, however, also be rewritten in terms of fracture length a—which denotes the total length for an edge fracture (such as the height or dip-dimension of a non-feeder dike extending from the top of a magma chamber and into its roof) and the half-length for a central fracture (such as half of the total surface length or strike-dimension of a tectonic tension fracture or a dike). As an example, the plane-strain energy release rate of a tension fracture (modelled as mode I crack) when subject to an applied tensile stress σ is given by [3,76]:
G I = σ 2 ( 1 ν 2 ) π a E
Here, E is Young’s modulus and ν is Poisson’s ratio of the host rock. For a normal fault modelled as mode II crack—as is a suitable model for a comparatively short ‘part-through’ normal fault [3]—the driving shear stress τd is substituted for σ in Equation (49). A longer normal fault that extends from the surface of the rift zone to a magma reservoir (Figure 4), such may apply to some of the large normal faults studied here (Figure 5 and Figure 7), a mode III through-crack model is appropriate. Then the energy release rate is given by:
G I I I = τ d 2 ( 1 + ν 2 ) π a E
where all the symbols are as defined above. To obtain the energy release rate for a dike modelled as a through-crack and with half strike-dimension (half surface length) a, we substitute the magmatic overpressure, p0, for the applied tensile stress, σ, so as to obtain
G I = p 0 2 ( 1 ν 2 ) π a E
where all the other symbols have already been defined. These equations can also be written in terms of the openings (apertures) of the tension fractures and the displacements on the faults [3].

9. Entropy Results

9.1. Fissure Swarms

Using Equation (42) the entropy of the studied fissure swarms (Figure 16) have been calculated and are also shown in Table 1. Here I calculate the entropy (Equation (42)) as well as the scaling exponents for 12 fracture populations. The populations are identified by the following place names (Figure 16). In Southwest Iceland: (a) Reykjanes, where the fracture data is from the Vogar Fissure Swarm and (b) Thingvellir, where the fracture data is from the Thingvellir Fissure Swarm. In North Iceland: (c) Krafla, where the fracture data is from the Krafla Fissure Swarm, and (d) Husavik, where the fracture data is from that part of the Theistareykir Fissure Swarm that is close to the Husavik-Flatey Fault. The host rock in all the swarms are basaltic lava flows of Holocene age; more specifically, 9–12-thousand-year-old pahoehoe lava flows.
The total number of tension fractures and normal faults analysed in these fracture sets is 565. Two of the sets are further divided into subsets, namely the one from the Vogar Fissure Swarm and the one from the Thingvellir Fissure Swarm. The reason that the other sets are not further divided into subsets, namely that of the Krafla Fissure Swarm (Krafla) and the one from the Theistareykir Fissure Swarm (Husavik), is that these focus on very small (mostly tension) fractures and do not include the whole swarms. More specifically, the fracture lengths (strike-dimensions) in the Vogar Swarm range from 40 m to 5750 m and those of the Thingvellir Swarm from 57 m to 7736 m (Table 1). By contrast, the fracture lengths in the (small-fracture) part of the Krafla Swarm range from 0.12 m to 200 m and in the analysed (Husavik) part of the Theistareykir Swarm from 0.1 m to 270 m, with the great majority of fractures in both these sets being of lengths of less than 10 m. The bin width (class limits in the bin plot) used for the fractures of the swarms of Vogar and Thingvellir is 100 m, which is far too large to be used for the fracture sets of the swarms of Krafla and Theistareykir (Husavik)—for realistic comparison of entropy the bin width should be the same [28]. Thus, the 344 small fractures that form the sets from the swarms of Krafla and Theistareykir (Husavik) are included in the general set of fractures from all the swarms (Figure 17, Table 1), but are not used when analysing subsets from the swarms, where only fractures from the swarms of Vogar and Thingvellir are used (Table 1).
In Table 1 the statistical results for following sets and subsets are presented. (a) The Reykjanes (Vogar Swarm) population: (1) all fractures, (2) subset on fractures shorter than 500 m (where there is a break in the power-law log–log slope of lines), and (3) fractures longer than 500 m. (b) The Thingvellir Swarm population: (4) all fractures, (5) subset of fractures shorter than 300 m (where there is a break in the power-law log–log slope of lines), and (6) fractures longer than 300 m. (c) The combined Reykjanes-Thingvellir population: (7) all fractures, (8) fractures shorter than 300 m (where the break is), and (9) fractures longer than 300 m. (d) The whole fracture set, including the short fractures from the swarms of Krafla and Theistareykir (Husavik): (10) all fractures, (11) fractures shorter than 500 m (where the break is for the entire population, Figure 17), and (12) fractures longer than 500 m.
In addition to calculating the entropies for these 12 sets and subsets, the scaling exponents (the slopes of the straight lines on the log–log plot), denoted by γ in Equation (3), for each of them were calculated. Table 1 also lists for each of the 12 sets the fracture length range (the difference between the maximum and the minimum length in a given fracture-length distribution). These parameters, namely scaling exponent and fracture length range, were then plotted against entropy so as to test the correlation.
The results (Figure 25) show strong statistical correlation between entropy and the two parameters. The coefficient of determination, R2, between entropy and scaling exponent is 0.828, that between entropy and fracture length range is 0.8961. The coefficient of determination is a measure of how much variation in the dependent variable (when two are related) can be explained (or predicted) in terms of variation in the other independent variable. Thus, here, 89.6% of the variation in entropy can be explained in terms of fracture-length range, whereas 82.8% can be explained in terms of scaling exponent.
The correlation between entropy and length range shows that the highest coefficient of determination in that length range can account for nearly 90% of the entropy variation. This is understandable since entropy is not only a measure of disorder, as commonly presented, but also a measure of spreading. For a statistical distributions of the types discussed here, spreading relates to how dispersed the distribution is. And, normally, the longer the tail, and therefore the range, the more dispersed is the distribution. Furthermore, as the tail becomes longer and flatter the distribution more and more approaches the shape of a uniform distribution. Uniform distributions, where for a discrete distribution such as here all the bins have the same height, have the highest entropy. The high correlation between entropy and length range is therefore to be expected and are, indeed, observed (Figure 25).
The entropy and scaling factor also show a very high correlation, that is, some 83% of the variation in entropy can be explained or predicted in terms of variation in scaling exponent. This correlation can be understood as follows. As a fracture network (such as a fissure swarm) grows, the associated material damage increases. Rock-physics experiments indicate that as the damage grows in specimens under loading (before a through-going failure), the scaling exponent increases. For example, Xie [20] showed that as the fracture networks in marble and sandstone specimens expand during loading before specimen failure the scaling exponents increase from 1.7 to 2.5 (marble) and 2.7 to 2.9 (sandstone). Other experimental results that as the material damage increases, the entropy increases [77,78].

9.2. Dike Swarm

Using Equation (42) the entropy of the studied dike swarm (Figure 19) was calculated. In contrast with the fissures/tectonic fractures, where the date came from 4 swarms, all the dike data is from a single swarm. It follows that the dike data, in contrast with the fissure data, cannot be separated into many subsets for which the entropies can be calculated. Based on the break in the slope on the bi-logarithmic plot of the dike-length data (Figure 20), 3 sets/subsets can be recognised. The sets are: (1) all the dikes, where the length range is from 26 m to 8948 m, (2) dikes in the length range from 26 m to 1000 m, and (3) dikes in the length range from 1000 m to 8948 m.
The results as to entropy, scaling exponent, and length range are given in Table 1. They show that the entropy and scaling exponents are comparatively high for all the dikes as well as for dikes longer than 1000 m, but much lower for dikes of less than 1000 m in length. These results are in harmony with the results obtained for the fissure swarms (Table 1). This means that the entropy of the dike populations increases with scaling exponent and length range, although at a somewhat different rate from that of the fissure populations. This is as expected because the mechanics of dike emplacement is different from the mechanics of tension fracture formation and, in particular, different from the mechanics of fault formation [1,3,65].
More specifically, faults are generated by shear stresses whereas dikes are the result of normal stresses and these, in turn, relate to the magmatic overpressure that drives the dike propagation. Even if tension fractures are formed by (negative) normal stresses, there is a difference between the mechanics of formation and development of tension fractures and the mechanics of formation of dikes. First, the potential overpressure during dike propagation is commonly much higher than the tensile stress generating tension fractures. This follows because the overpressure depends on buoyancy which, when positive, can generate overpressure and therefore stress that is higher (in part of the dike) than the tensile strength of the rock. By contrast, the tensile stress that generates tectonic tension fractures is often generated directly by plate-tectonic forces (the spreading vector, Figure 1), commonly builds up slowly, and then cannot exceed the tensile strength of the rock. Second, many dikes in the studied swarm are multiple, that is, formed through many magma injections into the same dike-fracture [65]. During each injection, the overpressure in a large part of the dike (but not at the dike tips) may be well above the tensile strength [3]. While existing tension fractures may grow (expand) during rifting episodes, their existence means that they grow at applied tensile stress that is normally lower than the tensile strength of the rock. This is because high tensile stress concentrations at the tips of an existing tension fracture implies that it can grow even when the applied tensile stress is much lower than the tensile strength [3].
An additional factor that implies different relationships between entropy and the other studied parameters for fissure swarms and dike swarms is the location of the outcrops. Here the dike swarm is located in basaltic lava flows of age 12–14 Ma. By contrast, the fissure swarms are located in Holocene lava flows mostly of age 9–12 thousand years. Furthermore, the dikes are exposed in an eroded lava pile, so that they are mostly at 300–800 m below the original surface of the lava pile (Figure 19). The fissure swarms, however, are exposed at the surface of the Holocene lava flows. Thus, while both types of swarms are hosted by basaltic lava flows, those that host the Holocene fissure swarms are at the surface of the active volcanic zones (Figure 16) and thus with different elastic properties from those that host the dikes. In particular, the lava flows hosting the dikes, being located at 300–800 m depth, are likely to have had a somewhat higher average Young’s modulus (be stiffer) than the surface lava flows hosting the fissures.

9.3. Explanation of the Entropies

The results show that entropy increases with increasing scaling exponent and length range of the fissures and dikes (Figure 25; Table 1). When we look further into the relationships (Figure 25), the following aspects are noticeable and can be explained, partly at least, as follow.
  • The scaling exponent of the longer fissures/dikes in each swarm is always much larger than the scaling exponent of the shorter fissures/dikes and somewhat larger than that of all the fissures/dikes in that swarm. I suggest that this is primarily because the logarithm-transformation compresses the data. For example, the distance between 1 and 10 (0 and 1 on the logarithmic scale) is the same as the distance between 10 and 100 (1 and 2 on the logarithmic scale), or the distance been 100 and 1000 (2 and 3 on the logarithmic scale). Thus, the long-fissure/dike part (the tail) of the size distribution becomes compressed resulting in a steeper slope of that part than of the short-fissure/dike part. The steeper the slope, the higher is the scaling exponent.
  • The calculated entropies of the long-fissure/dike parts of the sets are also much higher than those of the short-fissure/dike parts of the sets and, in fact, somewhat higher than those of the all the fissure/dikes in each particular swarm. I suggest that this is primarily because the long-fissure/dike parts—the tail parts of the size distributions—are those that are closest to being uniform distributions. Uniform statistical distributions, which for discrete data mean that all the bins with equal class limits (widths) are of the same height, have the highest entropy. By contrast, the bins of the short-fissure/dike parts of the distributions have widely different bin heights, that is, are peaked, and thus with low entropy. The size distributions of all the fissures/dikes in a swarm include both the peaked part (the short-fissure/dike part) of the distribution as well as the more uniform tail part (the long-fissure/dike part) and therefore have an entropy that is somewhat lower than that of the more uniform long-fissure/dike parts.

10. Application

We have now seen that the tension fractures, normal faults, and dikes in the studied fissure swarms and dike swarm in Iceland show statistical size distributions where small elements are much more common than the large ones. In particular, all the distributions show long tails into the part of the distribution presenting the large (long) fissures/dikes (Figure 17, Figure 20, Figure 23 and Figure 24). The data can be modelled both by power functions/laws (Figure 17 and Figure 20) and exponential functions/laws (Figure 23 and Figure 24). Power-law distributions belong to the class of heavy-tailed statistical distributions whereas exponential-law distributions do not. However, when applied to fissures and dikes, both fit with distributions where the number of short fissures/dikes is many times greater than that of long fissures/dikes. There are various ways to test in detail which functions provide a better fit [55,56]. Here, however, the focus is on explaining the geology and the physics that can led to such size distributions. This will be done, first, by using aspects of statistical physics in connection with microstates and states of stress; second, by applying the concept of stress-homogenisation; and, third, through considerations of the energy input received by fissure swarms and dike swarms.

10.1. Stress States as Microstates

When considering the statistical size distribution of fissures and dikes, we considered the bins (whose central tops are marked as points in Figure 17, Figure 20, Figure 23 and Figure 24) as microstates. Since microstates refer to specific configuration of a thermodynamic system, we can here extend the use of the concept of a microstate to stress states in the crustal segment hosting a fissure swarm or a dike swarm (or both).
Consider a crustal segment in an active area such as the rift zone of Iceland (Figure 1 and Figure 16). The segment is subject to loading (plate-tectonic forces, magma accumulation in shallow chambers and deep-seated reservoirs and slight doming, Figure 1, Figure 2 and Figure 4). What is the most likely state of stress in the crustal segment? Given the heterogeneity and anisotropy of the rocks constituting a crustal segment, including various layers and contacts between layers with different mechanical properties, the most likely state of stress is heterogeneous. For a large fracture to develop, the stress field in the hosting body must everywhere be basically the same, that is, homogeneous and favour the propagation of that mechanical type of fractures. However, the probability that the state of stress in such a body at a given instant is heterogeneous is much higher than that the state of stress is homogeneous and favourable to the propagation to the type of fracture under consideration. This is because there is an enormous number of possible heterogeneous stress states in a given rock body at a given time, while there is basically only one stress state that is homogeneous and favourable to the propagation of a given fracture type.
This observation can now be related to the microstates of a thermodynamic system. From Equations (21)–(26) we know that the probability of occurrence P ( ε ) of a given microstate depends on energy ε associated with that state. We see from Equations (21), (23) and (26) that the probability or frequency of microstates is a negative exponential function, known as the Boltzmann distribution. In terms of stress states, we may regard the size distribution of a stress-homogenised rock volume as initially following Boltzmann distribution, so as to be a negative exponential function. This means that in an overall heterogeneous stress field of the crustal segment comprises numerous fields of various sizes within each of which the stress field is locally homogeneous but different from the adjacent fields.
Based on the negative exponential distribution (Equations (21), (23) and (26)), we would expect that the size distribution of the homogenised rock volumes to follow such a distribution. This would mean that the great majority of rock volumes (forming parts of the rock body/crustal segment under consideration) would be very small. So if fractures were initiated or existing ones reached the condition for extension in one or several such volumes (constituting a part of the considered rock body) then the fractures would soon enter rock volumes with unfavourable stress states and become arrested—and thereby remain confined to the small volume and thus remain short. Formally, this may be regarded as an explanation as to why short fractures in a given fracture system (here a fissure/dike swarm) are so very common and long fractures so comparatively rare.

10.2. Stress-Homogenisation

How are large fractures then generated? The primary answer is: through stress-homogenisation within large rock volumes. For a rock fracture to propagate through a rock body, the stress-homogenised body must be in a state of stress that is everywhere favourable to that mechanical type of rock fracture. This means that the orientation of the principal stresses must be favourable to that particular type of fracture. Stress-homogenisation of a large rock volume located in a tectonically active area normally takes some time, but the exact time depends on the rate of loading or energy input into the rock body and the mechanical properties of the body. If the rate of loading is high and the mechanical properties of the body comparatively similar, then the stress-homogenisation can take (geologically speaking) short time. But at normal geological loading rates, such as associated with plate movements, the stress-homogenisation may take years, decades, or centuries.
The process of stress-homogenisation is commonly reflected in slip on or opening of small fractures. While part of the fracture slip is aseismic, there is normally seismic activity associated with the process of stress-homogenisation [51]. More precisely, aseismic and seismic slip on existing and new fractures gradually decreases stress differences in larger and larger volumes, thereby making these volumes stress-homogenised. This is in harmony with the well-known observation that low-magnitude seismicity in an area commonly precedes large earthquakes. Furthermore, rock-physics experiments show that acoustic (seismic) microcracking precedes the zone that eventually develops into a larger fault [3]. In the case of a large existing fault, the core and the damage zone (Figure 26) become stress-homogenised before a large-scale failure and a large earthquake.
Similar observations have been made in volcanoes. Commonly, there is seismicity in a volcano during an unrest period prior to dike injection and propagation [79]. This seismicity helps stress-homogenise a potential path for a dike towards the surface [80,81]. In the case of multiple dikes, however, the potential path is already largely stress-homogenised [65].
The normal stress-state heterogeneity and the need for stress-homogenisation prior to large events, such as large fault slips and dike-fed eruptions, are partly the reasons for the statistical size distribution of fractures. Equations (21), (23), and (26), however, predict negative exponential size distributions. While these may fit many size distributions (Figure 23 and Figure 24), power laws fit some distributions equally well, or better (Figure 17 and Figure 20). While power laws are generally not well understood in terms of the underlying physics [28,56] and presumably originate through many different mechanisms, it is worth looking briefly at the possibility of negative exponential distributions of fractures evolving into a heavy-tailed distribution such as a power law.
As large faults develop, their cores and damage zones expand (Figure 26; [3]). The damage zone, especially close to the core, contains numerous fractures. The core is mainly composed of particulate materials, that is, porous materials such as breccia, gouge, and clay. Both the highly fractured innermost damage zone and the core are, because of their numerous small fractures and (for the core) cavities, more easily stress-homogenised than the hosting crustal segment in general. It follows that once one or several major faults have formed, it is easier to generate larger slips, which results in still further growth of the faults [82]. This means that an exponential length-size distribution (Figure 23) shifts to the right, thereby becoming heavy-tailed and, perhaps commonly, a power law (Figure 17).
Multiple dikes have similar mechanical effects to those of fault zones. When a dike path is used again and again, forming a multiple dike [65], the increasing dike thickness commonly results in increasing dike length as well (Figure 21). This means that as a dike swarm evolves, then if it contains many multiple dikes, as is the case of the present dike swarm (Figure 19), the length-size frequency distribution of the dikes may shift to the right, generating a heavy-tailed distribution and, as in the case of fissures, perhaps commonly a power law (Figure 20).
These considerations regarding the shift to the right so that an initial negative exponential law of length-size distribution, as is proposed here for fissures and dikes through the development of larger fault zones with thick cores and damage zones and the formation of multiple dikes, do not constitute a formal explanation for the generation of power-law fracture size distributions. As indicated above, there are presently no generally accepted formal explanations for the generation of power-law size distributions. But, for the fissure swarms and dike swarms analysed here, the consideration above may, when formalised in terms of a proper physical theory, offer a plausible explanation.
The present concept of stress-homogenisation implies that the state of stress along a potential fracture propagation path—or a renewed rupture along an existing fracture—must be everywhere essentially the same and favourable to the given type of fracture. The numerous new small-scale fracture ruptures, or slips or openings on existing fractures, which are necessary to homogenise the stress field prior to large-fracture propagation or slip imply that considerable energy must be used before the state of stress is favourable for the large-fracture propagation. While part of the energy that is used for small-scale fracturing and slip does work, some of the energy is dissipated through heat (primarily due to friction) and that part of the available energy may be regarded as entering the TS term in Equation (15). Since the Helmholtz free energy, F, available to do work is the internal energy U minus the TS term, the larger the energy that is dissipated though the TS term, the greater will be the need for further energy input into the system to provide the work necessary for the large-scale fracture propagation.

10.3. Energy for Large-Scale Fracture Propagation

From the first law of thermodynamics (Equation (8)) it follows that the change in internal energy dU of a thermodynamic system is due to heat dQ being added to the system and work dW being done on the system. When the thermodynamic system is a fissure swarm or a dike swarm, both of which are located within a volcanic rift zone, the heat added to the system is primarily that due to magma chambers or reservoirs and brought closer to the surface through dikes. The work done is mainly due to plate tectonic forces, although doming may play a role.
For reversible and irreversible processes in a closed system, Equation (14) gives the infinitesimal change in internal energy dU as a function of temperature T, pressure p, and infinitesimal changes in volume dV and entropy dS. When applied to an open system, a term allowing material exchange between the system and its surroundings is added so that Equation (14) becomes:
d U = T d S p d V + μ d N
where N is the number of particles (constituting the material, here the rock) added to the open system and μ is the associated amount of change in the internal energy of the system—referred to as the chemical potential [75,83,84]. Fissure swarms and dike swarms are open thermodynamic systems in that they exchange both energy and materials with their surroundings. For the present analysis of the energy budget, however, the addition of material to the system during fissure swarm/dike swarm development is not considered. Rather, the focus is on the heat added to, and particularly the work done on, the system.
While heat added to system contributes to the internal energy, most of the heat is lost through the TdS term (Equations (14) and (52)), that is, is dissipated as entropy. The added internal energy, which is the main energy input, is the term pdV (Equations (14) and (52)). Recall from Equation (13) that –pdV = dW, so that the infinitesimal reduction in volume (hence the negative sign) times the pressure (here of a gas) is equal to the infinitesimal work dW done on the system (in compressing the gas). Even if this is derived for gas, the results are general and, as indicated for Equations (14) and (52), applicable to both reversible and irreversible processes. And the work done on the system can be related to the energy available to do work, here to develop rock fractures in fissure and dike swarms, through free energy.
Based on this, Equation (15) gives a crude indication of the energy available to drive fracture propagation during the evolution of dike swarms and fissure swarms. Equation (15) presents the Helmholtz free energy, given by F = U T S . But we have already concluded that the TdS term in Equations (14) and (52) makes negligible contribution to the energy available to drive fracture propagation, so that with constant temperature, the main energy available to do work and thus to drive fracture initiation and propagation is the Helmholtz free energy as given by Equation (19), namely dF = dW.
What are then the main sources of free energy to drive fracture development in fissure swarms and dike swarms at divergent plate boundaries such as in Iceland (Figure 1 and Figure 16)? The main continuous source is the force represented by the spreading vector. The spreading rate in Iceland varies from about 1.79 cm yr−1 at the intersection with the Husavik-Flatey Fault to 1.85 cm yr−1 at the location of the South Iceland Seismic Zone, with an average spreading rate of 1.8 cm yr−1 [69]. Another source is slight doming of parts of volcanic systems due to magmatic pressure changes in the associated reservoirs. The third source, which is directly related to the combined effects of the plate-tectonic spreading vector and magmatic pressure changes in a reservoir, is regional dike injection and induced stress and strain changes.
All these processes result in crustal extension. For the doming, the extension is confined to the upper half of the crustal segment (the roof) above the reservoir [19], but for the plate-tectonic force and regional dike injection, the extension is from the surface and down to the magma reservoir (Figure 2 and Figure 4). The long-term combined overall effects are due to the above spreading or extension rates. However, the volcanic systems in Iceland overlap to a certain degree—much in some part of the rift zone and less in other parts (Figure 1 and Figure 16). In many parts of the rift zone the amount of spreading taken up by a single volcanic system is about half the average spreading, so that the rate is about 1 cm yr−1.
The total strain energy that accumulates in a rock volume around a potential or existing fracture before its initiation/propagation is given as stress × strain × volume and has the unit of joule (J). Consider first the strain energy per unit volume U0, which may be presented as [1,3]:
U 0 = V σ i j ε i j 2 d V
here σ is stress and ε is strain (their components are indicated by the subscripts ij), and dV is the unit volume of the strained part of the rock hosting the fissure/dike swarm. In the interest of simplicity, we now drop the subscripts ij and then use Hooke’s law, σ = E ε , where E is Young’s modulus, to recast Equation (53) in a form that gives the total strain energy U, namely:
U = σ ε V 2 = E ε 2 V 2 = σ 2 2 E V
where V is the strained and stresses rock volume hosting the particular fissure/dike propagation under consideration. This strain energy is partly used to form the two new fracture surfaces (surface energy) during fracture propagation. Partly, however, the strain energy is used for microcracking and plastic deformation in the process zone at the tip of the propagating tectonic fracture or dike [1,3].
Let us now make a crude estimate of the strain energy released during tension-fracture propagation in a fissure swarm using Equations (47)–(49). At the time of fracture initiation and subsequent propagation, the tensile stress at the site of fracture initiation must reach the in-situ tensile strength of the rock. While the in-situ tensile strength of rocks ranges from about 0.5 to 9 MPa, it is commonly in the range of 2–4 MPa [3]. We therefore use the value of 3 MPa for the tensile stress σ (we omit the minus sign, considering only the magnitude of the stress).
Consider first the strain energy density per unit thickness U1 released during the formation of a tectonic tension fracture (mode I crack) of half-length a. For plane-stress conditions (the fractured unit or layer is then thin in comparison with its lateral dimensions), then Griffith’s analysis yields the following result [3]:
U 1 = σ 2 2 E π a 2
for plane-strain conditions (the thickness of the fractured unit or layer being similar to or greater than its lateral dimensions), then we have:
U 1 = σ 2 ( 1 ν 2 ) 2 E π a 2
here ν is Poisson’s ratio and all the other symbols are as defined above. Since we are dealing with slow (spreading-rate) accumulation of stress (and strain) before fracture initiation and propagation, we use the static Young’s modulus (rather than the dynamic one). For the uppermost 0.5 km of the active rift zone in Iceland, the static Young’s modulus is about 7 GPa and Poisson’s ratio about 0.25 [1,3]. For a tectonic tension fracture the length (strike-dimension) is generally shorter than 500 m. This follows from the ‘break’ in the slopes on the log–log plots being between 300 m and 500 m (Figure 17). Using the average value for the breaks, the common maximum length of tectonic tension fractures would be 400 m, so that the half-length (half strike-dimension) a is then 200 m.
Substituting the above values into Equations (55) and (56) we get the released strain energy per unit thickness of a fracture-hosting layer as 8.1 × 10⁷ J (for plane stress) and 7.6 × 10⁷ J (for plane strain). This is the strain energy release per unit thickness; in the SI system used here the unit thickness is 1 m. Since tension fractures rarely reach depths greater than several hundred metres, and a maximum depth of around one kilometre, we can take 1000 m as the maximum dip-dimension (height) of the fracture. Then the maximum total strain energy U released during the fracture formation becomes 8.1 × 10¹⁰ J for plane stress and 7.6 × 10¹⁰ J for plane strain. These results compare well with those obtained from Equation (49) for the energy release rate for propagating tension fractures [1,3].
For calculating the strain energy released during the propagation of a regional dike, there are several parameters that are somewhat different from those used for the tectonic tension fracture above. First, for a dike the driving pressure or overpressure po should be used instead of the tectonic tensile stress. Second, a regional dike has commonly much larger dimensions than a tension fracture; in particular, the dike extends down to its source reservoir which may be at the depth of 10–20 km. It follows, that the average Young’s modulus to be used is higher than the comparatively low Young’s modulus at the surface of an active rift zone—which was used for the tectonic tension fracture above.
A long (strike-dimension) dike in the data set from Northwest Iceland is 8 km. There are dikes in Iceland that are much longer—several tens of kilometres [16,35]—but here we focus on the present data set (Figure 19 and Figure 20). Such a dike is likely to have a dip-dimension (height) of at least 10 km, but it may be 20 km or possibly more. As an example, we here assume the dike to be 8 km long (strike-dimension) and 10 km tall (dip-dimension), very similar in dimensions to the dike emplaced during the 2021–2023 Fagradalsfjall eruptions in Iceland [65,85]. Then the average static Young’s modulus of the crust is about 30 GPa and Poisson’s ratio 0.25 [1,3] and the magmatic overpressure around 10 MPa (it varies along the dike, but this would be a reasonable ‘average’ value based on typical regional dike aspect ratios in Iceland and other considerations). Because the dip-dimension exceeds the strike-dimension, the plain-strain equation is the most appropriate to use. Substituting the overpressure for the tensile stress, Equation (56) may be recast as:
U 1 = p o 2 ( 1 ν 2 ) 2 E π a 2
where all the symbols have been defined above. Substituting the above values into Equation (57) yields the strain energy release per unit thickness of 7.8 × 10¹⁰ J. Since the dike is assumed 10 km tall (dip-dimension), the total strain energy release during the dike emplacement becomes U = 7.8 × 10¹⁴ J.
How do these strain energy release values compare with estimates of the accumulated strain energy in the part of the fissure/dike swarm hosting the fracture? We can estimate the accumulated strain energy available using Equation (54) as follows. For a tension fracture the stress relaxation is out to a distance similar to its length [3]. So we take the width of the part of the fissure swarm contributing strain energy to the formation of a 400-m-long tension fracture as 800 m. Using the estimated maximum depth of the tension fracture as an indication of the thickness of the unit hosting the fracture as 1000 m, then only the lateral dimension along the length of the fissure swarm that contributes strain energy to the fracture development needs to be estimated. As a reasonable length we use the same value as the width, so that the surface area around the fracture that accumulates strain energy for the fracture propagation is a square of length and width of 800 m. This follows also from the stress effects induced by a fracture in that large stress effects extend to about the half length of the crack from its tips [3]. The volume of the crustal segment accumulating strain energy before fracture formation is then V = 6.4 × 10⁸ m3 or 0.64 km3.
Substituting these values into Equation (54) yields the accumulated total strain energy in the crustal segment hosting the fracture and contributing strain energy to its development as U = 4.1 × 10¹¹ J. This is about 5-times greater strain energy than that needed to form the tectonic tension fracture (assuming it reaches its maximum possible depth)—and thus sufficiently great energy to develop the fracture. The volume considered could be regarded as being somewhat larger. For example, there are significant fracture-induced stress changes out to a distance of at least the length of the fracture from each of its lateral tips, in which case the distance would be 400 m (rather than 200 m as used here) and the volume would then be V = 9.6 × 10⁸ m3 or 0.96 km3. However, the main purpose of these calculations is to show that enough strain energy would be expected to accumulate in a conservatively estimated rock volume around the fracture so as to make the fracture development possible. Therefore we use the lower volume estimate.
To calculate the strain energy accumulation for the reginal dike, we use a similar approach as for the tectonic tension fracture. Dikes are known to affect crustal stress and strain (or displacement) out to a distance of up to several times the length of the dike [81,86,87,88]. Here we use the same conservative estimate as for the tectonic tension fracture above and assume that the lateral area around the dike available to contribute strain energy during its formation is a square of width and length 16 km. Given the dip-dimension of the dike, 10 km, the volume of crustal segment accumulating strain energy before dike emplacement is estimated at 2.6 × 10¹² m3 or 2560 km3. Using the values above for Young’s modulus and overpressure, Equation (55)—where po is now substituted for σ—then yields the total accumulated strain energy in the crustal segment hosting the dike and available for dike propagation as U = 4.3 × 10¹⁵ J. Thus, the conservatively estimated accumulated strain energy is again about 5-times greater than that needed to propagate the dike, so clearly large enough for the dike propagation.

11. Discussion and Conclusions

One fundamental question in geology that has still not been properly answered is this one: what factors determine the size of a rock fracture? A correct answer to that question would automatically allow us to explain the size distribution of rock fractures of any kind. One main reason why this question is of fundamental importance is that rock fractures control so many important processes in the Earth’s crust. These processes include the transport of all types of crustal fluids, such as groundwater, geothermal water, hydrocarbon fluids, and magma. Additionally, rock fractures largely control many of the dynamic processes on Earth, including volcanic eruptions, tectonic earthquakes, and plate-boundary formation and development [3].
Here I use examples from fissure swarms and dike swarms in Iceland to analyse the size distributions of rock fractures. The results indicate that the statistical distributions of fracture sizes fit reasonably well with both exponential laws and power laws. This is in agreement with many other results as regards length-size distributions of tectonic fractures [20,21,22,23,24,25,26,27]. Similar fits to size-distribution laws have also been obtained for displacements (throws) on faults [29] as well as openings (apertures) of tension fractures [21].
Similarly, the suggested fits for dike-length size distributions are commonly power-laws [30,31,32]. Several studies have also been made of the length-size distributions of volcanic fissures, which may be regarded as equal to the strike-dimensions of the associated feeder-dikes at the surface. These studies generally suggest power-law fits for the fissure/feeder-dike lengths [29,39]. Many dike-thickness size distributions fit power laws [16,33,41,42,43] or negative exponential laws [32,47]. In particular, Klausen [47] concluded that for 17 of 21 studied dike-thickness data sets negative exponential laws provided the best fits—in agreement with the present results.
While the results here are thus in general agreement with those obtained in earlier studies, there has not been, so far, any plausible physical theory provided to explain the size distributions. In this paper I show that provided the length-size distribution of fissures and dikes can be explained, then the other distributions (of openings, throws, dike thicknesses) follow. This derives from the well-established fact that fracture displacement, such as opening-displacement of tectonic tension fractures, slip on faults, and thickness of dikes, is linearly related to the controlling dimension of the fracture. The controlling dimension is the smaller one of the dip-dimension and the strike-dimension [3,49]. Thus, if the length-size distribution can be explained in terms of a physical theory then the other distributions discussed here would follow from the same explanation.
The physical theory offered here to explain the length distribution of tectonic fractures and dikes is based on two main concepts, namely stress heterogeneity and stress-homogenisation. For a tectonic fracture or a dike to propagate for a considerable distance, the stress field in a large rock body, or a large crustal segment (for very large fractures/dikes), must everywhere have essentially the same local stress field. Additionally, that stress field must be favourable to the propagation of the mechanical type of fracture under consideration. This means that the local stress field within which a tectonic fracture is supposed to propagate must be homogenised [51,65,81].
Given the heterogeneity and anisotropy of outcrop-scale rock bodies, and even more so crustal segments, the most likely state of stress in such a body/segment is not homogeneous but rather heterogeneous. More specifically, at any given instant when such a body/segment is subject to loading, the probability that the state of stress is heterogeneous is much higher than that the state of stress is homogeneous. When fractures develop in a heterogeneous stress field, they tend to be small. Thus, for large fractures to develop, homogenisation to a state of stress that favours the type of fracture under consideration is needed over large rock bodies or crustal segments [81].
Here, I apply the statistical-physics concept of a microstate to two aspects the fissure swarms and dike swarms, namely their statistical size-distributions and the stress states in the hosting rock bodies/crustal segments. For the size-distribution, the bins are supposed to correspond to microstates. This allows for the description of the spreading of the bins, and thus the shape of the size-distributions (frequency distributions), in terms of statistical physics. In particular, using Equation (42) I have calculated the entropies of the fissure swarms and the dike swarm and their various subsets (Table 1). The results show strong correlation between the calculated entropies of the sets and subsets, on one hand, and the following parameters that characterise the sets/subsets: scaling exponent and range in fracture length. More specifically, the coefficient of determination between entropy and scaling exponent is about 0.84, and that between entropy and range in fracture length about 0.90. The results indicate thus indicate that between about 84% (scaling exponent) and about 90% (range in fracture length) of the variation in entropy can be explained in terms of these parameters.
For microstates as stress states, the distribution of such states is here suggested as an explanation of the size-distribution of tectonic rock fractures (including dikes). The general probability or frequency distribution of microstates is a negative exponential function (Equations (21), (23) and (26)), named the Boltzmann distribution. I propose that the size-distribution of stress-homogenised rock volumes also follows the Boltzmann distribution. If so, then that distribution would be a formal explanation for the size-distribution of the tectonic fractures that form or propagate within the rock body/crustal segment in a given period. This follows because if a fracture initiates or is reactivated within a given homogenised volume, then that fracture would soon enter volumes with different local stresses that could commonly be unfavourable to the propagation to that type of fracture, which would thereby become arrested. This means that the fracture size would be limited by the size of the homogenised volume within which the fracture forms.
The size distribution of fractures would therefore also follow the Boltzmann distribution. Fracture displacement, either opening displacement on extension fractures (such as tectonic tension fractures and dikes) or shear displacement on shear fractures (such as slip or throw on faults) is proportional to the dimensions of the fractures on which the displacement occurs. Given that earthquake magnitudes are a function of both fault dimensions and slips, it follows that once the fracture-size distribution is explained, then so is the size distribution of the earthquake magnitudes.
For a large tectonic fracture to form or propagate, stress-homogenisation over a large rock volume is needed. This can happen as small-scale fault slips and earthquakes gradually stress-homogenise larger parts of a rock body or a crustal segment, such as a fault zone or a large part of a fissure/dike swarm. In a fault zone, gradual migration of small earthquakes along the zone indicates that it is being stress-homogenised [51,81]. Similarly, in volcanic systems and polygenetic volcanoes there is commonly considerable seismicity prior to dike injection, suggesting that part of the volcano is being stress-homogenised so as to favour subsequent dike propagation. The earthquake activity and stress-homogenisation can occur through loading external to the crustal segment, such as by activity in the roof of a magma chamber during inflation driven by increase in excess pressure in the chamber and/or changes in external load such as sea-level [1,80]. One common process of stress-homogenisation for dikes is the formation of multiple dikes [65,81]. One or several earlier dike injections then homogenise the mechanical properties, and thus commonly the local stress field, along their paths, encouraging subsequent dike injections to follow the same path.
Stress-homogenisation may occur in zones or rock bodies that function as elastic inclusions [81,89]. An elastic inclusions that has significantly different mechanical properties from the surrounding matrix—here the host rock—is commonly referred to as an inhomogeneity [90,91]. But in geological context it is often unclear when the difference in mechanical properties (mainly Young’s modulus) become significant (say between a cooling basaltic intrusion and the hosting basaltic lava pile), so here we use the term elastic inclusion irrespective of the difference in mechanical properties between the inclusion and the host rock.
Even when parts of the host rock ‘matrix’ surrounding a major elastic inclusion, such as a stratovolcano, a collapse calderas, or an intrusion (including large plutons), may itself have become stress-homogenised, as seen in numerical models [81,89], the local stress field inside the hosted large inclusion may not be homogenised with the stress field of the matrix/host rock. Whether inclusion stress-homogenisation is in harmony with that of the matrix/host rock depends on the difference in the mechanical properties of the inclusion and the matrix/host rock. For example, the local stress fields of polygenetic shield volcanoes (basaltic edifices) and lava shields (monogenetic basaltic volcanoes) are easily brought into harmony with a host rock stress field if the latter is primarily composed of basaltic lava flows—as is common. The same need not happen, however, if a stratovolcano or a table mountain is surrounded by a basaltic lava field.
Stress-homogenisation may also have other statistical consequences. When larger rock bodies or crustal segments become stress-homogenised so as to favour larger tectonic fractures, the frequency distributions tend to shift to the right (Figure 17, Figure 20, Figure 23 and Figure 24). While the shifts simply extend the tails of power laws (Figure 17 and Figure 20), there is a possibility that such shifts may transform exponential laws into power laws. This follows because as longer fractures become proportionally more common (when larger rock bodies become stress-homogenised), then, for a negative exponential law, the tail becomes longer and more similar to that of a power law. There is still a difference between distributions that follow these laws. For example, in an exponential law (Equation (5)) the base is a constant (here the Euler number e) and the exponent is a variable. By contrast, in a power law (Equation (2)) the base is a variable and the exponent (power) a constant. This suggestion is thus not a formal demonstration that exponential laws can be transformed into power laws. But for the particular power laws related to rock fractures, exponential laws transformed and extended to the right (Figure 20 and Figure 24) during increasing stress-homogenisation of rock bodies/crustal segments may be one way by which related power laws form.
A statistical-physics approach has been used to further our understanding of the dynamics of active earthquake-generating fault systems, with a focus on forest-fire, percolation, and slider-block models [92]. Similarly, a statistical-physics approach has been applied when using composite physical models to simulate the formation of, or slip on existing, seismogenic faults [93]. While statistical physics is used in these papers [92,93], the theoretical framework is very different from that in the present paper. In particular, both these papers emphasise self-organised criticality, which is not considered here. Also, neither approach [92,93] pays much attention to crustal heterogeneities and their effects on fault-size (and related earthquake-magnitude) distributions. By contrast, crustal heterogeneities are regarded as being of fundamental importance in the present study.
There have been several recent works on crustal heterogeneities and earthquakes. While these works use very different approach to that used in the present paper, their focusing on the effect of crustal heterogeneities on local stresses and earthquakes—and thereby faulting—is relevant. Morad et al. [94] focus on the effects of geometric irregularities in fault zones in producing heterogeneous stress fields which, thereby, affect fault slip and earthquakes. Lio et al. [95] provide numerical models on the effect of stress heterogeneities on the earthquake cycle in the Hikurangi-Kermadec subduction zone that extends north-northeast (into the Pacific) from the North Island of New Zealand—where the subduction zone transforms into the Alpine Fault (a transform fault). Schoenball and Davatzes [96] analyse the stress-field heterogeneities using borehole data. They conclude that while such heterogeneities are well known and may follow self-similar scaling, for a detailed analysis sample volumes of the order of 1 km are needed to characterise the details of the stress-field heterogeneities. Huang et al. [97] found evidence of mechanical and stress heterogeneities in the Japan subduction zone. In particular, their results suggest volumes of near-zero Poisson’s ratios surrounding 1–2-km-sized clusters of earthquakes, resulting in local stress heterogeneities. Li et al. [98] analysed numerically the effects of stress heterogeneities in a fault zone on the resulting size of the fault slip and earthquake magnitude. In particular, they studied the effects the wavelength on the variations in the normal stress on a fault plane and the sizes of the nucleation patch on how and where earthquakes nucleate and slip. They conclude that when the normal stress variation is totally random, larger earthquakes occur than when the variation in normal stress is smooth. All these works, while with a different focus from the present one, indicate that heterogeneous rock properties and local stresses have great effects on faulting and earthquakes, in harmony with the results presented here.
In conclusion, the main results of this study may be summarised as follows.
  • Length-size distributions of 565 tectonic tension fractures and normal faults—referred together as fissures—located in Holocene fissure swarms in Iceland show reasonable to good fits both with negative power laws and negative exponential laws. Length-size distributions of basaltic dikes in regional swarms of Neogene (Tertiary) age in Iceland also show fits with negative power laws and negative exponential laws.
  • Based on the calculated coefficient of determination (R2), the non-transformed fissure-length data show better fit with a power law (R2 = 0.78) than with an exponential law (R2 = 0.48). The single-line and double-line (regression) fits with the log-transformed (power law) and semi-log-transformed (exponential law) fissure-length data, however, are similar: for the various sets R2 ranges from 0.90 to 0.97 for the power laws and from 0.93 to 0.98 for the exponential laws.
  • The non-transformed dike-length data show a much better fit with an exponential law (R2 = 0.91) than with a power law (R2 = 0.25). The single-line and double-line fits with the log-transformed (power law) and semi-log transformed (exponential law) dike-length data, while more similar than for the non-transformed data, also show differences. Thus, for the various sets R2 ranges from 0.89 to 0.97 for the power laws but from 0.96 to 0.99 for the exponential laws. Thus, the dike-length data generally fit a negative exponential law somewhat better than a negative power law.
  • Using the thermodynamic concept of Helmholtz free energy and the statistical concept of a microstate as basis, the general equation for entropy, known as the Gibbs–Shannon entropy formula, is derived (Equation (42)). This formula is completely general and applies to any probability or statistical frequency distribution, including the length-size distributions of tension fractures, normal faults, and dikes.
  • Using the interpretation that Gibbs–Shannon entropy is a measure of spreading in statistical size-distributions of dike and tectonic fracture populations, the entropies were calculated for 12 sets and subsets of tension fractures and normal faults (the fissures of the fissure swarms) and 3 sets and subsets of dikes (in the studied dike swarm). The results show that for the sets and subsets of fissures and dikes entropy is positively correlated with the scaling exponent and the length range of the power laws. This means that much of the variation in the calculated entropy of these sets and subsets can be explained in terms of the variation in these two parameters, namely length range and scaling exponent.
  • The highest calculated entropies are those of the subsets of long fissures/dikes. It is proposed that these high entropies are because the long fissures/dikes constitute the tail parts of the length-size distributions. The tail parts are those where the size-distribution is closest to being uniform. Uniform distributions, which for discrete data such as here are characterised by all the bins (with the same class limits or widths) being of the same height, have the highest entropy.
  • The length-size distributions of fissures and dikes are explained in terms of microstates and stress-homogenisation. Microstates refer to specific configurations of thermodynamic systems. Here they refer, first, to the bins in the statistical size distribution of the fissures and dikes and, second, to stress-state distribution in a rock body or a crustal segment. The probability of the occurrence of a given microstate depends on the energy associated with that state and follows a negative exponential distribution–Boltzmann distribution (Equations (21), (23) and (26)). The size distribution of local stress states within which the stress field is homogeneous is here supposed to follow a Boltzmann distribution, so that most of the local stress states control small volumes. Then it follows that the overall state of stress in a large body/crustal segment is, with its numerous but mostly small local stress states, highly heterogeneous. Thus, at any given moment the most probably overall state of stress in a large rock body/crustal segment is highly heterogeneous, favouring short fissures/dike segments.
  • For a long fissure/dike to form, a large part of the hosting rock body/crustal segment must be stress-homogenised. This means that the state of stress within a large part of the rock body is everywhere favourable to a particular mechanical type of fracture, here either a fissure or a dike. Stress-homogenisation in a large rock volume located in a tectonically active area is reflected in slip on or opening of small fractures. Some fracture slip is aseismic, but there is generally considerable seismic activity associated with stress-homogenisation. Normally, the process takes considerable time, but the exact time depends on the rate of loading or energy input into the rock body and the mechanical properties of the body. If the rate is high and the mechanical properties of the body similar, then the stress-homogenisation may occur over a (geologically) short time. But at normal geological loading rates, such as associated with plate movements, the stress-homogenisation may take years, decades, or centuries.
  • When large rock bodies/crustal segments become stress-homogenised so as to favour larger fissures/dikes, the frequency distributions tend to shift to the right (Figure 17, Figure 20, Figure 23 and Figure 24). This means that the tail parts of the size distributions becomes extended, that is, proportionally longer. Here it is suggested that shifts of this kind may contribute to the transformation of exponential laws into power laws. This follows because as longer fissures/dikes become proportionally more common (when larger rock bodies/crustal segments become stress-homogenised), then, for a negative exponential law, the tail becomes gradually more similar to that of a power law.

Funding

The research reported here received no direct external funding.

Data Availability Statement

All the data are in the paper.

Acknowledgments

I thank the journal reviewers for very helpful comments. Some of the results presented here derive from work carried out over many years and supported by several funding agencies. These include the Icelandic Science Foundation, the Research Council of Norway, the Volkswagen Foundation in Germany, the Natural Environmental Research Council of the United Kingdom, and the European Research Council.

Conflicts of Interest

The author declares no conflict of interest.

References

  1. Gudmundsson, A. Volcanotectonics: Understanding the Structure, Deformation and Dynamics of Volcanoes; Cambridge University Press: Cambridge, UK, 2020. [Google Scholar]
  2. Gudmundsson, A. The propagation paths of fluid-driven fractures in layered and faulted rocks. Geol. Mag. 2022, 159, 1978–2001. [Google Scholar] [CrossRef]
  3. Gudmundsson, A. Rock Fractures in Geological Processes; Cambridge University Press: Cambridge, UK, 2011. [Google Scholar]
  4. Griffith, A.A. The phenomena of rupture and flow in solids. Phil. Trans. Roy. Soc. Lond. 1920, A221, 163–198. [Google Scholar]
  5. Jaeger, J.C.; Cook, N.G.W. Fundamentals of Rock Mechanics, 3rd ed.; Chapman and Hall: London, UK, 1979. [Google Scholar]
  6. Tibaldi, A. Structure of volcano plumbing systems: A review of multi-parametric effects. J. Volcanol. Geotherm. Res. 2015, 298, 85–135. [Google Scholar] [CrossRef]
  7. Gudmundsson, A. Dynamics of volcanic systems in Iceland: Example of tectonism and volcanism at juxtaposed hotspot and mid-ocean ridge systems. Annu. Rev. Earth Planet. Sci. 2000, 28, 107–140. [Google Scholar] [CrossRef]
  8. Rickwood, P.C. The anatomy of a dyke and the determination of propagation and flow directions. In Mafic Dykes and Emplacement Mechanisms; Parker, A.J., Rickwood, P.C., Tucker, D.H., Eds.; Balkema: Rotterdam, The Netherlands, 1990; pp. 81–100. [Google Scholar]
  9. Ernst, R.E.; Grosfils, E.B.; Mege, D. Giant dike swarms: Earth, Venus, and Mars. Annu. Rev. Earth Planet. Sci. 2001, 29, 489–534. [Google Scholar] [CrossRef]
  10. Gudmundsson, A.; Friese, N.; Galindo, I.; Philipp, S.L. Dike-induced reverse faulting in a graben. Geology 2008, 36, 123–126. [Google Scholar] [CrossRef]
  11. Gudmundsson, A.; Pasquare, F.A.; Tibaldi, A. Dykes, sills, laccoliths, and inclined sheets in Iceland. In Physical Geology of Shallow Magmatic Systems: Dykes, Sills and Laccoliths; Breitkreuz, C., Rocchi, S., Eds.; Springer: Berlin/Heidelberg, Germany, 2018; pp. 363–376. [Google Scholar]
  12. Coleman, R.G. Ophiolites. In Ancient Oceanic Lithosphere? Springer: Berlin/Heidelberg, Germany, 1977. [Google Scholar]
  13. Nicolas, A. Structures of Ophiolites and Dynamics of Oceanic Lithosphere; Springer: Berlin/Heidelberg, Germany, 1989. [Google Scholar]
  14. Gudmundsson, A. How local stresses control magma-chamber ruptures, dyke injections, and eruptions in composite volcanoes. Earth-Sci. Rev. 2006, 79, 1–31. [Google Scholar] [CrossRef]
  15. Gautneb, H.; Gudmundsson, A. Effect of local and regional stress fields on sheet emplacement in West Iceland. J. Volcanol. Geotherm. Res. 1992, 51, 339–356. [Google Scholar] [CrossRef]
  16. Gudmundsson, A. Infrastructure and mechanics of volcanic systems in Iceland. Tectonophysics 1995, 64, 1–22. [Google Scholar] [CrossRef]
  17. Huges, I.G.; Hase, T.P.A. Measurements and Their Uncertainties; Oxford University Press: Oxford, UK, 2010. [Google Scholar]
  18. Gudmundsson, A. Tectonics of the Thingvellir fissure swarm, SW Iceland. J. Struct. Geol. 1987, 9, 61–69. [Google Scholar] [CrossRef]
  19. Gudmundsson, A. Geometry, formation and development of tectonic fractures on the Reykjanes Peninsula, Southwest Iceland. Tectonophysics 1987, 139, 295–308. [Google Scholar] [CrossRef]
  20. Xie, H. Fractals in Rock Mechanics, 2nd ed.; CRC Press/Balkema: Rotterdam, The Netherlands, 2020. [Google Scholar]
  21. Hatton, C.G.; Main, I.G.; Meredith, P.G. Non-universal scaling of fracture length and opening displacement. Nature 1994, 367, 160–162. [Google Scholar] [CrossRef]
  22. Turcotte, D.L. Fractals and Chaos in Geology and Geophysics, 2nd ed.; Cambridge University Press: Cambridge, UK, 1997. [Google Scholar]
  23. Bour, O.; Davy, P. On the connectivity of three-dimensional fault networks. Water Resour. Res. 1998, 34, 2611–2622. [Google Scholar] [CrossRef]
  24. Berkowitz, B.; Bour, O.; Davi, P.; Odling, N. Scaling of fracture connectivity in geological formations. Geophys. Res. Lett. 2000, 27, 2061–2064. [Google Scholar] [CrossRef]
  25. Bonnet, E.; Bour, O.; Odling, N.E.; Davy, P.; Main, I.; Cowie, P.; Berkowitz, B. Scaling of fracture systems in geological media. Rev. Geophys. 2001, 39, 347–383. [Google Scholar] [CrossRef]
  26. Babiker, M.; Gudmundsson, A. The effects of dykes and faults on groundwater flow in an arid land: The Red Sea Hills, Sudan. J. Hydrol. 2004, 297, 256–273. [Google Scholar] [CrossRef]
  27. Nieto-Samaniego, A.F.; Alaniz-Alvarez, S.A.; Tolson, G.; Oleschko, K.; Korvin, G.; Xu, S.S.; Pérez-Venzor, J.A. Spatial distribution, scaling and self-similar behavior of fracture arrays in the Los Planes Fault, Baja California Sur, Mexico. Pure Appl. Geophys. 2005, 162, 805–826. [Google Scholar] [CrossRef]
  28. Gudmundsson, A.; Mohajeri, N. Relations between the scaling exponents, entropies, and energies of fracture networks. Bull. Geol. Soc. France 2013, 184, 377–387. [Google Scholar] [CrossRef]
  29. Gudmundsson, A.; De Guidi, G.; Scudero, S. Length–displacement scaling and fault growth. Tectonophysics 2013, 608, 1298–1309. [Google Scholar] [CrossRef]
  30. Mege, D.; Korme, T. Fissure eruption of flood basalts from statistical analysis of dyke fracture length. J. Volcanol. Geotherm. Res. 2004, 131, 77–92. [Google Scholar] [CrossRef]
  31. Ray, R.; Sheth, H.C.; Mallik, J. Structure and emplacement of the Nandurbar–Dhule mafic dyke swarm, Deccan Traps, and the tectonomagmatic evolution of flood basalts. Bull. Volcanol. 2007, 69, 537–551. [Google Scholar] [CrossRef]
  32. Patel, R.; Gadgil, R.; Sarma, D.S. Role of dyke geometry in understanding dyke-emplacement mechanisms and magma-chamber dynamics: A critical appraisal from the Chotanagpur Gneissic Complex, India. J. Volcanol. Geotherm. Res. 2021, 418, 107344. [Google Scholar] [CrossRef]
  33. Babiker, M.; Gudmundsson, A. Geometry, structure and emplacement of mafic dykes in the Red Sea Hills, Sudan. J. Afr. Earth. Sci. 2004, 38, 279–292. [Google Scholar] [CrossRef]
  34. Hollanda, M.H.B.M.; Archanjo, C.J.; Macêdo Filho, A.A.; Fossen, H. The Mesozoic Equatorial Atlantic Magmatic Province (EQUAMP): A New Large Igneous Province in South America. In Dyke Swarms of the World: A Modern Perspective; Srivastava, R.K., Ernst, R.E., Peng, P., Eds.; Springer: Berlin/Heidelberg, Germany, 2019; pp. 87–110. [Google Scholar]
  35. Gudmundsson, A. Form and dimensions of dykes in eastern Iceland. Tectonophysics 1983, 95, 295–307. [Google Scholar] [CrossRef]
  36. Becerril, L.; Galindo, I.; Gudmundsson, A.; Morales, J.M. Depth of origin of magma in eruptions. Sci. Rep. 2013, 3, 2762. [Google Scholar] [CrossRef]
  37. Masoud, A.A. Geometry and field relations disclose the emplacement dynamics of the SW Sinai Dyke Swarms (Egypt). J. Volcanol. Geotherm. Res. 2020, 395, 106831. [Google Scholar] [CrossRef]
  38. Biswas, S.K.; Saha, K.; Das, G.; Mondal, T.K. Estimation of magma overpressure from partially exposed dykes—A new approach. J. Struct. Geol. 2023, 168, 104822. [Google Scholar] [CrossRef]
  39. Gudmundsson, A. The geometry and growth of dykes. In Physics and Chemistry of Dykes; Baer, G., Heimann, A., Eds.; Balkema: Rotterdam, The Netherlands, 1995; pp. 23–34. [Google Scholar]
  40. Scudero, S.; De Guidi, G.; Gudmundsson, A. Size distributions of fractures, dykes, and eruptions on Etna, Italy: Implications for magma-chamber volume and eruption potential. Sci. Rep. 2019, 9, 4139. [Google Scholar] [CrossRef]
  41. Gudmundsson, A. Dyke emplacement at divergent plate boundaries. In Mafic Dykes and Emplacement Mechanisms; Parker, A.J., Rickwood, P.C., Tucker, D.H., Eds.; Balkema: Rotterdam, The Netherlands, 1990; pp. 47–62. [Google Scholar]
  42. Fjader, K.; Gudmundsson, A.; Forslund, T. Dikes, minor faults and mineral veins associated with a transform fault in North Iceland. J. Struct. Geol. 1994, 16, 109–119. [Google Scholar] [CrossRef]
  43. Villemin, T.; Bergerat, F.; Angelier, J.; Lacasse, C. Brittle deformation and fracture patterns on oceanic rift shoulders: The Esja peninsula, SW Iceland. J. Struct. Geol. 1994, 16, 1641–1654. [Google Scholar] [CrossRef]
  44. Jolly, R.J.H.; Sanderson, D.J. Variation in the form and distribution of dykes in the Mull swarm, Scotland. J. Struct. Geol. 1995, 17, 1543–1557. [Google Scholar] [CrossRef]
  45. Walker, G.P.L.; Eyre, P.R. Dike complexes in American Samoa. J. Volcanol. Geotherm. Res. 1995, 69, 241–254. [Google Scholar] [CrossRef]
  46. Walker, G.P.L.; Eyre, P.R.; Spengler, S.R.; Knight, M.D.; Kennedy, K. Congruent dyke-widths in large basaltic volcanoes. In Physics and Chemistry of Dykes; Baer, G., Heimann, A., Eds.; Balkema: Rotterdam, The Netherlands, 1995; pp. 35–40. [Google Scholar]
  47. Klausen, M.B. Similar dyke thickness variation across three volcanic rifts in the North Atlantic region: Implications for intrusion mechanisms. Lithos 2006, 92, 137–153. [Google Scholar] [CrossRef]
  48. Patel, R.; Shankar, R.; Sarma, D.S.; Panda, A. Geochemistry and petrogenesis of tholeiitic dykes from the Chotanagpur Gneissic Complex, Eastern India. J. Earth Sys. Sci. 2021, 130, 160. [Google Scholar] [CrossRef]
  49. Sneddon, I.N.; Lowengrub, M. Crack Problems in the Classical Theory of Elasticity; Wiley: New York, NY, USA, 1969. [Google Scholar]
  50. Gray, T.G.F. Handbook of Crack Opening Data; Abington Publishing: Cambridge, UK, 1992. [Google Scholar]
  51. Gudmundsson, A.; Homberg, C. Evolution of stress fields and faulting in seismic zones. Pure Appl. Geophys. 1999, 154, 257–280. [Google Scholar] [CrossRef]
  52. Ren, Y.; Geersen, J.; Grevemeyer, L. Impact of spreading rate and age-offset on oceanic transform fault morphology. Geophys. Res. Lett. 2022, 49, e2021GL096170. [Google Scholar] [CrossRef]
  53. Philipp, S.L. Geometry and formation of gypsum veins in mudstones at Watchet, Somerset, SW England. Geol. Mag. 2008, 145, 831–844. [Google Scholar] [CrossRef]
  54. Gudmundsson, A. Transport of geothermal fluids along dikes and fault zones. Energies 2022, 15, 7106. [Google Scholar] [CrossRef]
  55. Mohajeri, N.; Gudmundsson, A. Entropies and scaling exponents of street and fracture networks. Entropy 2012, 14, 800–833. [Google Scholar] [CrossRef]
  56. Clauset, A.; Chalizi, R.C.; Newman, M.E.J. Power-law distributions in empirical data. Soc. Industr. Appl. Math. 2009, 51, 661–703. [Google Scholar] [CrossRef]
  57. Gudmundsson, A. Formation and growth of normal faults at the divergent plate boundary in Iceland. Terra Nova 1992, 4, 464–471. [Google Scholar] [CrossRef]
  58. Rossi, M.J. Morphology and mechanism of eruption of postglacial lava shields in Iceland. Bull. Volcanol. 1996, 57, 530–540. [Google Scholar] [CrossRef]
  59. Andrew, R.E.B.; Gudmundsson, A. Distribution, structure, and formation of Holocene lava shields in Iceland. J. Volcanol. Geotherm. Res. 2007, 168, 137–154. [Google Scholar] [CrossRef]
  60. Thordarsson, T.; Hoskuldsson, A. Postglacial volcanism in Iceland. Jökull 2008, 58, 197–228. [Google Scholar] [CrossRef]
  61. Gudmundsson, A. The Glorious Geology of Iceland’s Golden Circle; Springer: Berlin/Heidelberg, Germany, 2017. [Google Scholar]
  62. Atkins, A.G.; Mai, Y.W. Elastic and Plastic Fracture; Horwood: Chichester, UK, 1985. [Google Scholar]
  63. Gudmundsson, A. Tectonic aspects of dykes in northwestern Iceland. Jökull 1984, 34, 81–96. [Google Scholar] [CrossRef]
  64. Gudmundsson, A.; Bergerat, F.; Angelier, J. Off-rift and rift-zone palaeostresses in Northwest Iceland. Tectonophysics 1996, 255, 211–228. [Google Scholar] [CrossRef]
  65. Gudmundsson, A. Multiple dikes make eruptions easy. J. Volcanol. Geotherm. Res. 2025, 460, 108284. [Google Scholar] [CrossRef]
  66. Rice, J.R. Thermodynamics of the quasi-static growth of Griffith cracks. J. Mech. Phys. Solids 1978, 26, 61–78. [Google Scholar] [CrossRef]
  67. Stevens, R.N.; Guiu, F. Energy balance concepts in the physics of fracture. Proc. R. Soc. Lond. 1991, A435, 169–184. [Google Scholar]
  68. Wei, R.P. Fracture Mechanics: Integration of Mechanics, Material Science and Chemistry; Cambridge University Press: Cambridge, UK, 2010. [Google Scholar]
  69. Gudmundsson, A.; Friese, N.; Andrew, R.; Philipp, S.L.; Ertl, G.; Letourneur, L. Effects of dyke emplacement and plate pull on mechanical interaction between volcanic systems and central volcanoes in Iceland. In Studies in Volcanology: The Legacy of George Walker; Thordarson, T., Self, S., Larsen, G., Rowland, S.K., Höskuldsson, A., Eds.; IAVCEI: Geneva, Switzerland, 2009; Volume 2, pp. 331–347. [Google Scholar]
  70. Fukuyama, E. (Ed.) Fault-Zone Properties and Earthquake Rupture Dynamics; Academic Press: Oxford, UK, 2009. [Google Scholar]
  71. Frisch, W.; Meschede, M.; Blakey, R. Plate Tectonics: Continental Drift and Mountain Building; Springer: Berlin/Heidelberg, Germany, 2011. [Google Scholar]
  72. Yeats, R.S.; Sieh, K.; Allen, C.R. The Geology of Earthquakes; Oxford University Press: Oxford, UK, 1997. [Google Scholar]
  73. Sommerfeld, A. Thermodynamics and Statistical Mechanics; Academic Press: New York, NY, USA, 1964. [Google Scholar]
  74. Widom, B. Statistical Mechanics; Cambridge University Press: New York, NY, USA, 2002. [Google Scholar]
  75. Panagiotopoulos, A.Z. Essential Thermodynamics; Drios Press: Princeton, NJ, USA, 2012. [Google Scholar]
  76. Anderson, T.L. Fracture Mechanics, 3rd ed.; Taylor and Francis: London, UK, 2005. [Google Scholar]
  77. Bao, T.F.; Peng, Y.; Cong, P.J.; Wang, J.L. Analysis of crack propagation in concrete structures with structural information entropy. Sci. China Technol. Sci. 2010, 53, 1943–1948. [Google Scholar] [CrossRef]
  78. Naderi, M.; Amiri, M.; Khonsari, M.M. On the thermodynamic entropy of fatigue fracture. Proc. Roy. Soc. Lond. 2010, A466, 423–438. [Google Scholar] [CrossRef]
  79. Kilburn, C.R.J. Forecasting volcanic eruptions: Beyond the failure forecast method. Front. Earth Sci. 2018, 6, 133. [Google Scholar] [CrossRef]
  80. Satow, C.; Gudmundsson, A.; Gertisser, R.; Ramsey, C.B.; Bazargan, M.; Pyle, D.M.; Wulf, S.; Miles, A.J.; Hardiman, M. Eruptive activity of the Santorini Volcano controlled by sea-level rise and fall. Nat. Geosci. 2021, 14, 586–592. [Google Scholar] [CrossRef]
  81. Gudmundsson, A. The effects of stress gradients on faulting and dike emplacement, with applications to Santorini and Iceland. In The Role of Tectonics on the Emergence and Evolution of Volcanic Features with Particular Reference to the to the Mediterranean Region; Papanikolaou, D., Ed.; Geological Society, London, Special Publications; The Geological Society of London: London, UK, 2025; in press. [Google Scholar]
  82. Gudmundsson, A.; Simmenes, T.H.; Larsen, B.; Philipp, S.L. Effects of internal structure and local stresses on fracture propagation, deflection, and arrest in fault zones. J. Struct. Geol. 2010, 32, 1643–1655. [Google Scholar] [CrossRef]
  83. Blundell, S.J.; Blundell, K.M. Concepts in Thermal Physics; Oxford University Press: Oxford, UK, 2006. [Google Scholar]
  84. Swendsen, R.H. An Introduction to Statistical Mechanics and Thermodynamics, 2nd ed.; Oxford University Press: Oxford, UK, 2019. [Google Scholar]
  85. Hobé, A.; Bazargan, M.; Selek, B.; Tryggvason, A.; Alofe, E.; Gudmundsson, A. Tomographic and volcanotectonic controls on the 2021–2023 Fagradalsfjall eruptions, Iceland. Sci. Rep. 2025, 15, 16455. [Google Scholar] [CrossRef]
  86. Bjornsson, A. Dynamics of crustal rifting in NE Iceland. J. Geophys. Res. 1985, 90, 10151–10162. [Google Scholar] [CrossRef]
  87. Sigmundsson, F.; Parks, M.; Hooper, A.; Geirsson, H.; Vogfjörd, K.S.; Drouin, V.; Ófeigsson, B.G.; Hreinsdóttir, S.; Hjaltadóttir, S.; Jónsdóttir, K.; et al. Deformation and seismicity decline before the 2021 Fagradalsfjall eruption. Nature 2022, 609, 523–528. [Google Scholar] [CrossRef]
  88. De Pascale, G.P.; Fischer, T.J.; Moreland, W.M.; Geirsson, H.; Hrubcová, P.; Drouin, V.; Forester, D.; Payet-Clerc, M.; da Silveira, D.B.; Vlček, J.; et al. On the move: 2023 observations on real time graben formation, Grindavik, Iceland. Geophys. Res. Lett. 2024, 51, e2024GL110150. [Google Scholar] [CrossRef]
  89. Rundle, J.B.; Turcotte, D.L.; Shcherbakov, R.; Klein, W.; Sammis, C. Statistical physics approach to understanding the multiscale dynamics of earthquake fault systems. Rev. Geophys. 2003, 41, 4. [Google Scholar] [CrossRef]
  90. Main, I. Statistical physics, seismogenesis, and seismic hazard. Rev. Geophys. 1996, 34, 433–462. [Google Scholar] [CrossRef]
  91. Andrew, R.E.B.; Gudmundsson, A. Volcanoes as elastic inclusions: Their effects on the propagation of dykes, volcanic fissures, and volcanic zones in Iceland. J. Volcanol. Geotherm. Res. 2008, 177, 1045–1054. [Google Scholar] [CrossRef]
  92. Qu, J.; Cherkaoui, M. Fundamentals of Micromechanics of Solids; Wiley: New York, NY, USA, 2006. [Google Scholar]
  93. Yin, H.; Zhao, Y. Introduction to the Micromechanics of Composite Materials; CRC Press: Boca Raton, FL, USA, 2016. [Google Scholar]
  94. Morad, D.; Lyakhovsky, V.; Hatzor, Y.H.; Sagy, A. Stress heterogeneity and the onset of faulting along geometrically irregular faults. Geophys. Res. Lett. 2022, 49, e2021GL097591. [Google Scholar] [CrossRef]
  95. Mika Liao, Y.W.; Fry, B.; Howell, A.; Williams, C.A.; Nicol, A.; Rollins, C. The role of heterogeneous stress in earthquake cycle models of the Hikurangi–Kermadec subduction zone. Geophys. J. Int. 2024, 239, 574–590. [Google Scholar] [CrossRef]
  96. Schoenball, M.; Davatzes, N.C. Quantifying the heterogeneity of the tectonic stress field using borehole data. J. Geophys. Res. 2017, 122, 6737–6756. [Google Scholar] [CrossRef]
  97. Huang, Y.; Ide, S.; Kato, A.; Yoshida, K.; Jiang, C.; Zhai, P. Fault material heterogeneity controls deep interplate earthquakes. Sci. Advan. 2025, 11, eadr9353. [Google Scholar] [CrossRef]
  98. Li, M.; Niemeijer, A.; van Dinther, Y. Earthquake nucleation and slip behavior altered by stochastic normal stress heterogeneity. J. Geophys. Res. 2024, 130, e2024JB029857. [Google Scholar] [CrossRef]
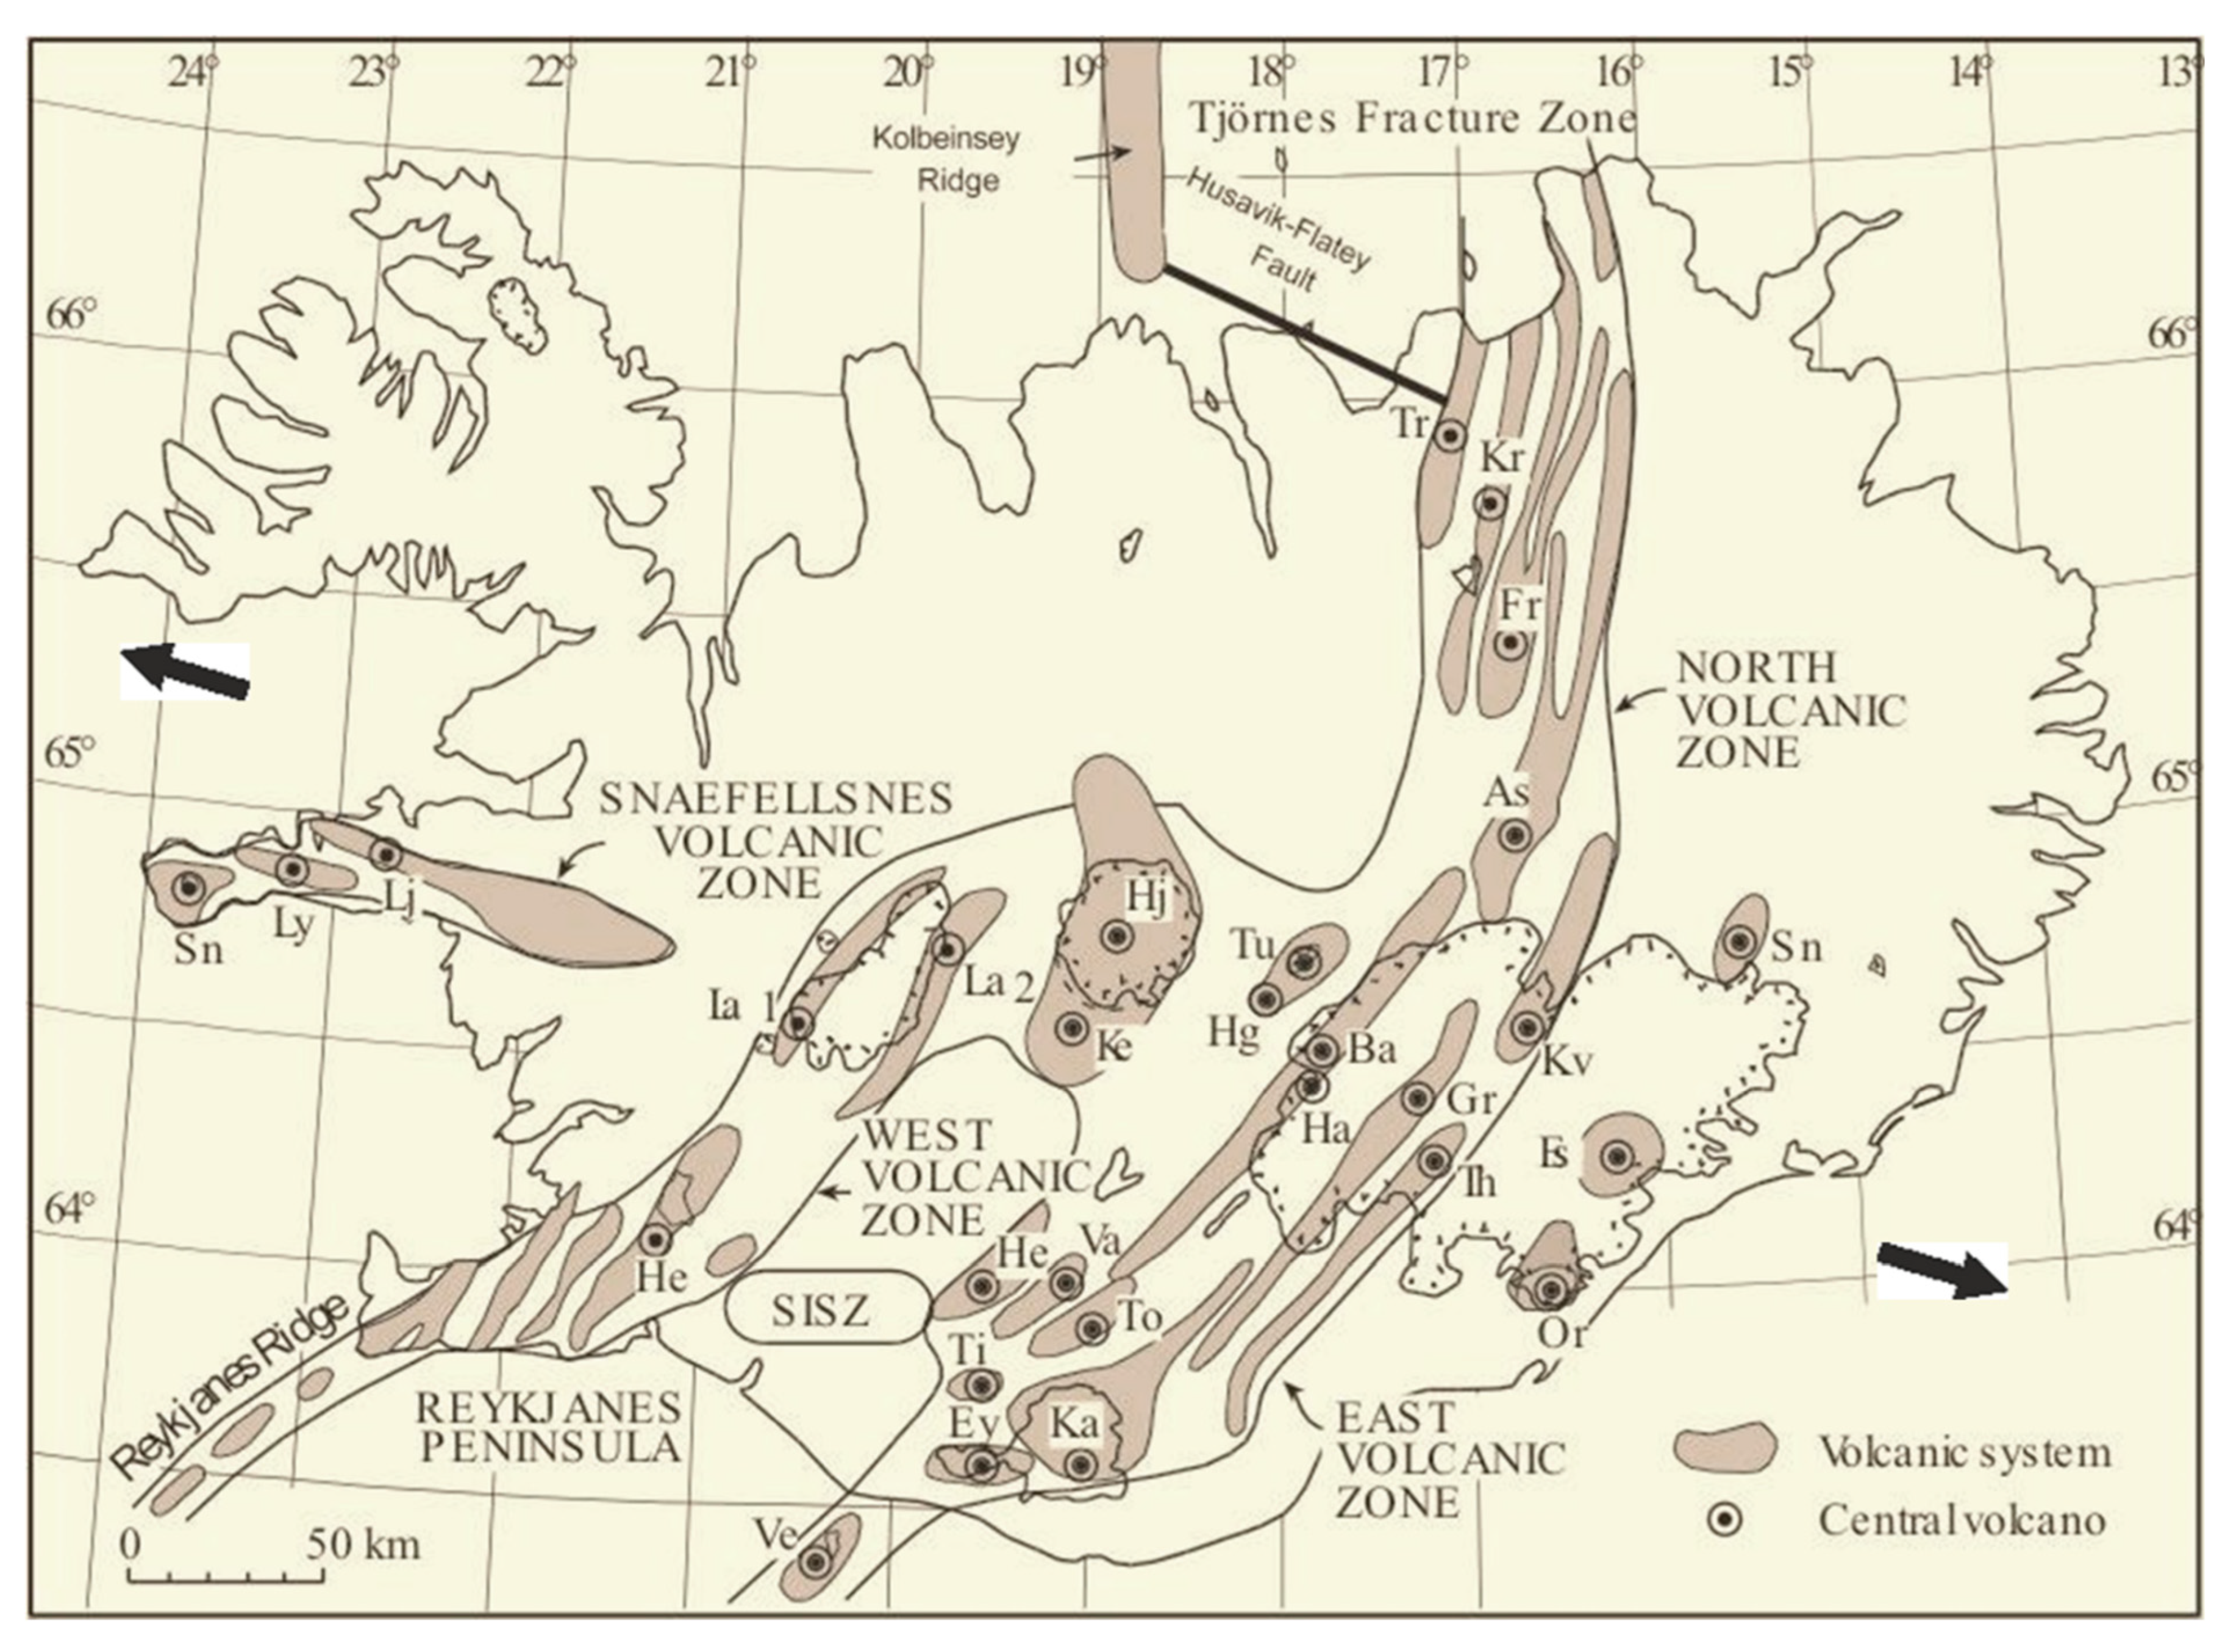
Figure 1. Rift-zone volcanic systems in Iceland are characterised by fissure swarms at and close to the surface and dike swarms at deeper crustal levels. The abbreviations Tr, Kr, Fr etc refer to the names of the associated central (composite) volcanoes. The seismically active transform zones are indicated, namely the Husavik-Flatey Fault in the north—a true transform fault—and the South Iceland Seismic Zone (SISZ), a complex zone of primarily strike-slip faulting in the south. Also indicated are the average directions of the spreading vectors (thick black arrows) at the location of Iceland. Compiled from numerous sources on the general geology and tectonics of Iceland (many of which are in the reference list).
Geosciences 15 00301 g001
Figure 2. Internal structure of a rift-zone volcanic system with a shallow magma chamber and an associated composite/central volcano. The illustration shows an extinct and slightly eroded volcanic system, so that the shallow tension fractures (Figure 3 and Figure 4) have been eroded away whereas the dike swarm is well exposed. Close to the shallow chamber there are also radial dikes, inclined sheets, and sills—modified from [1].
Geosciences 15 00301 g002
Figure 3. Hengill Fissure Swarm is a typical rift-zone fissure swarm in Iceland. It is about 80 km long and up to 5–7 km wide and contains hundreds of tension fractures and normal faults, and some volcanic fissures. The part of the swarm north of the lake Thingvallavatn is referred to as the Thingvellir Fissure Swarm, which is also a graben.
Geosciences 15 00301 g003
Figure 4. Detailed internal structure of a rift-zone fissure swarm and the associated dike swarm—here supplied with magma directly from a deep-seated magma reservoir. The typical structures shown here include open, shallow tension fractures, normal faults, nested grabens, and regional dikes, including some feeder-dikes and their volcanic fissures. The swarm is here mostly located within a major graben, such as the one north of the lake Thingvallavatn (Figure 3).
Geosciences 15 00301 g004
Figure 5. Aerial view north of tension fractures and normal faults in the Thingvellir Fissure Swarm (Figure 3). The normal fault, named Almannagja, is the western boundary fault of the Thingvellir Graben. At the head of the normal-fault yellow arrow, the total throw is about 40 m and the opening of the gaping fault about 60 m. The tension fractures (some filled with groundwater) reach an opening (aperture) of up to 15 m (cars are seen close to a bridge over one of the fissures). All the fractures are located in a thick 10,000-year-old pahoehoe lava flow.
Geosciences 15 00301 g005
Figure 6. Tectonic tension fractures, even those that reach large openings (apertures) at the surface (Figure 5), are generally shallow—rarely exceeding depths of several hundred metres. This follows from Griffith’s theory of fracture and the low tensile strength of crustal rocks [3,4]. When a tectonic tension fracture attempts to propagate to depths exceeding several hundred metres, it usually changes into a normal fault (commonly in Iceland with a dip of around 70°). These results are supported by direct field observations of eroded, fossil, volcanic systems in Iceland [1,3].
Geosciences 15 00301 g006
Figure 7. Many normal faults are roughly semi-circular or semi-elliptical as seen in vertical sections, that is, down-dip [3]. At the lateral ends of the faults, where the dip-dimension (depth) becomes shallower, the faults commonly change into tension fractures. This is seen here for two large faults in the Thingvellir Fissure Swarm. View east, the closer of the marked normal faults is Hrafnagja while the other is Gildruholtsgja. Hrafnagja and Gildruholtsgja mark the eastern boundary of the Thingvellir Graben (Figure 3).
Geosciences 15 00301 g007
Figure 8. Columnar (cooling) joints seen in a vertical cross-section on the beach of Reynisfjara in South Iceland. These columns, whose height (dip-dimension) here reaches about 10 m, are part of a basaltic sill. Most tectonic tension fractures, normal faults, and dike-fractures use columnar joints in sills and lava flows as weaknesses when developing their paths.
Geosciences 15 00301 g008
Figure 9. Columnar (cooling) joints seen from above. The camera lens cap provides a scale. Many of the columns are pentagons or squares, in addition to the theoretically ideal ones that are hexagons.
Geosciences 15 00301 g009
Figure 15. Aerial view of the Eldvörp Volcanic Fissure, formed some 800 years ago, on the Reykjanes Peninsula in Iceland. View southwest, only part of the 11-km-long and segmented fissure is seen here.
Geosciences 15 00301 g015
Figure 16. Location of the main fissure swarms from which the present data were obtained. In the southwest, on the Reykjanes Peninsula, the one denoted Reykjanes is the Vogar Fissure Swarm whereas the one denoted Thingvellir is the Thingvellir Fissure Swarm. In the north, the one denoted Krafla is the Krafla Fissure Swarm, whereas the one denoted Husavik is a part of the Theistareykir Fissure Swarm close to its intersection with the Husavik-Flatey Fault, a dextral strike-slip fault connecting the North Volcanic Zone with the mid-ocean Kolbeinsey Ridge.
Geosciences 15 00301 g016
Figure 17. Power-law cumulative plots of the lengths (strike-dimensions) of all the 565 tectonic fractures from the four fissure swarms. (a) An ordinary plot (a plot with linear axes) of the fracture lengths. The fractures range in length from 0.1 m to 6636 m, the arithmetic average being 249 m. Thus the first ‘bin’ in the cumulative plot is for all fracture lengths ≥ 0.1 m and, therefore, includes all the fracture. (b) A single power-law bi-logarithmic (log–log) plot of all the fractures. (c) A double power-law bi-logarithmic plot of all the fractures. The abrupt change/break in the slope of the straight lines indicates different fracture (sub)populations. The coefficients of determination (R2) of the all the fractures and the fracture subpopulations are given.
Geosciences 15 00301 g017
Figure 18. Open tension fracture at the surface of a basaltic lava flow of Holocene age in the Theistareykir Fissure Swarm close to the Husavik-Flatey Fault (Figure 16). The fracture opens up along the existing weaknesses in the lava flow, namely the columnar joints (Figure 9). This is the reason why the tension fracture has such an irregular shape. As the opening increases during further rifting episodes, the original irregularity becomes less noticeable (Figure 5). The hammer provides a scale.
Geosciences 15 00301 g018
Figure 19. Map of the studied lineaments, mostly basaltic dikes, in the basaltic lava pile of Northwest Iceland. Most of the dikes are regional dikes since there are no known suitably located central volcanoes nearby that could have injected them as radial dikes [63,64]. The inset map of Iceland provides the location of the area (marked in red). The background topography is from Google Earth.
Geosciences 15 00301 g019
Figure 20. Power-law cumulative plots of the lengths (strike-dimensions) of the 1041 lineaments (mostly regional dikes, Figure 19) studied in Northwest Iceland. The lineaments/dikes range in length from 26 m to 8949 m. Thus the first ‘bin’ in the cumulative plot is for all dike lengths ≥ 26 m and, therefore, includes all the dikes. (a) An ordinary plot (a plot with linear axes) of the dike lengths. (b) A single-line power-law bi-logarithmic (log–log) plot of the dike lengths. (c) A double power-law bi-logarithmic (log–log) plot of the dike lengths. The change/break in the slope of the straight lines indicates different dike subpopulations (here the change from single dikes to multiple dikes). The coefficients of determination (R2) for all the dikes and the dike subpopulations are given.
Geosciences 15 00301 g020
Figure 21. Schematic evolution of a multiple dike. Multiple dikes, like dikes (and fractures) in general, are segmented, as seen here both in lateral and vertical sections. The columnar rows show how the dike gradually increases its thickness, but also the lengths (strike-dimensions) of the segments that constitute the dike. Some of these segments may eventually combine laterally, and the ones seen in the vertical section are already connected (through thinner dike-lets or igneous veins). As the dike becomes thicker with more dike injections (only some of which are seen as separate columnar rows—whether they are seen as such depends on the time between injections) then it may also become longer and, thereby, grow in a self-affine manner.
Geosciences 15 00301 g021
Figure 22. Multiple dike in Northwest Iceland. The dike is basaltic and composed of at least 5 columnar rows (distinguishable magma injections) as indicated. The dike dip is close to vertical and its total thickness is many metres [65].
Geosciences 15 00301 g022
Figure 23. Negative exponential cumulative plots of the lengths (strike-dimensions) of all the 565 tectonic fractures from the four fissure swarms (Figure 16). (a) An ordinary plot (a plot with linear axes) of the fracture lengths. The fractures range in length from 0.1 m to 6636 m, the average being 249 m. The first ‘bin’ in the cumulative plot is for all fracture lengths ≥ 0.1 m and so includes all the fracture. (b) A single-line semi-logarithmic plot (the horizontal axis is linear, the vertical axis is logarithmic) of all the fractures. (c) A double-line semi-logarithmic plot of all the fractures. As for the power-law plot (Figure 17) the abrupt change/break in the slope of the straight lines indicates different fracture (sub)populations. The coefficients of determination (R2) of the all the fractures and the fracture subpopulations are given.
Geosciences 15 00301 g023
Figure 24. Negative exponential cumulative plots of the lengths (strike-dimensions) of the 1041 lineaments (mostly regional dikes, Figure 19) in Northwest Iceland. The length range is from 26 m to 8949 m. The first ‘bin’ in the cumulative plot is for all dike lengths ≥ 26 m and thus includes all the dikes. (a) An ordinary exponential plot (a plot with linear axes) of the dike lengths. (b) A single-line semi-logarithmic plot of the dike lengths. (c) A double-line semi-logarithmic plot of the dike lengths. As above, the change/break in the slope of the straight lines indicates different dike subpopulations (here the change from single dikes to multiple dikes). The coefficients of determination (R2) for all the dikes and the dike subpopulations are given.
Geosciences 15 00301 g024
Figure 25. Correlation between some of the data shown in Table 1. The focus is on the tectonic fractures for which many populations and subpopulations exist, namely those from Reykjanes (the Vogar Fissure Swarm) and Thingvellir (the Thingvellir Fissure Swarm), but for all fracture data the other fissure swarms (at the Krafla Fissure Swarm and the Theistareykir Fissure Swarm, denoted Husavik) are included, bringing the total number of tectonic fracture data sets to 12. The correlation indicates that entropy increases with (a) increasing scaling exponent and also (b) increasing range of fracture length. The 3 data sets of dike (Table 1) are not plotted—because they are so few—but they show a similar increase in entropy with increasing scaling exponent and length range. While the coefficients of determination (R2) are high, it should be taken into account that the data points group into three main clusters, with few datapoints in between them.
Geosciences 15 00301 g025
Figure 26. As a fault zone develops, from the initial stage (A), through stages (B) and (C) to stage (D), its core and damage zone generally increase in thickness. The example presented here is a sinistral strike-slip fault zone. Also shown are the internal structure of fault zone, the damage zone being characterised by fractures, whose frequency varies across the zone, whereas the core is characterised by breccia (and gouge and clay) and other particulate materials. The schematic associated variation in Young’s modulus is indicated. Modified from [3].
Geosciences 15 00301 g026
Table 1. Number of fractures/dikes in the various populations and subpopulations, as well as their length ranges, scaling exponents, and entropies (cf. Figure 25). Notice: in the calculations the dividing numbers—such as 500 and 1000—are always grouped with the higher class. Thus, for example, for the Reykjanes (Vogar Fissure Swarm) population the number 500 is calculated as a part of the class with the range 500–5750.
Fracture and Dike Data
PopulationNumberLength Range
(m)
P x = C x γ S = k B i p i l n p i
Reykjanes12040–5750γ = 1.4103.098
40–500γ = 0.6121.716
500–5750γ = 1.7203.38
Thingvellir10157–7736γ = 1.1733.369
57–300γ = 0.5541.347
300–7736γ = 1.2573.766
Reykjanes-
Thingvellir
22140–7736γ = 1.4603.246
40–300γ = 0.4971.353
300–7736γ = 1.6593.578
All fracture data5650.1–7736γ = 1.4712.902
0.1–500γ = 0.6521.497
500–7736γ = 1.7353.676
Dikes104126–8948γ = 1.7723.117
26–1000γ = 0.3392.225
1000–8948γ = 2.7203.397
Disclaimer/Publisher’s Note: The statements, opinions and data contained in all publications are solely those of the individual author(s) and contributor(s) and not of MDPI and/or the editor(s). MDPI and/or the editor(s) disclaim responsibility for any injury to people or property resulting from any ideas, methods, instructions or products referred to in the content.