Article

Real-Time Foreshock–Aftershock–Swarm Discrimination During the 2025 Seismic Crisis near Santorini Volcano, Greece: Earthquake Statistics and Complex Networks

by
Ioanna Triantafyllou
1,*,
Gerassimos A. Papadopoulos
2,
Constantinos Siettos
3 and
Konstantinos Spiliotis
4
1
Institute of Physics of the Earth’s Interior and Geohazards, Hellenic Mediterranean University Research Center, 73100 Chania, Greece
2
Board of Directors, Hellenic Mediterranean University, Estavromenos Campus, 71410 Heraklion, Greece
3
Dipartimento di Matematica e Applicazioni “Renato Caccioppoli,” Università degli Studi di Napoli “Federico II,” 80121 Naples, Italy
4
School of Civil Engineering, Democritus University of Thrace, 67100 Xanthi, Greece
*
Author to whom correspondence should be addressed.
Geosciences 2025, 15(8), 300; https://doi.org/10.3390/geosciences15080300
Submission received: 12 May 2025 / Revised: 22 July 2025 / Accepted: 23 July 2025 / Published: 4 August 2025
(This article belongs to the Special Issue Editorial Board Members' Collection Series: Natural Hazards)

Abstract

The advanced determination of the type (foreshock–aftershock–swarm) of an ongoing seismic cluster is quite challenging; only retrospective solutions have thus far been proposed. In the period of January–March 2025, a seismic cluster, recorded between Santorini volcano and Amorgos Island, South Aegean Sea, caused considerable social concern. A rapid increase in both the seismicity rate and the earthquake magnitudes was noted until the mainshock of ML = 5.3 on 10 February; afterwards, activity gradually diminished. Fault-plane solutions indicated SW-NE normal faulting. The epicenters moved with a mean velocity of ~0.72 km/day from SW to NE up to the mainshock area at a distance of ~25 km. Crucial questions publicly emerged during the cluster. Was it a foreshock–aftershock activity or a swarm of possibly volcanic origin? We performed real-time discrimination of the cluster type based on a daily re-evaluation of the space–time–magnitude changes and their significance relative to background seismicity using earthquake statistics and the topological metric betweenness centrality. Our findings were periodically documented during the ongoing cluster starting from the fourth cluster day (2 February 2025), at which point we determined that it was a foreshock and not a case of seismic swarm. The third day after the ML = 5.3 mainshock, a typical aftershock decay was detected. The observed foreshock properties favored a cascade mechanism, likely facilitated by non-volcanic material softening and the likely subdiffusion processes in a dense fault network. This mechanism was possibly combined with an aseismic nucleation process if transient geodetic deformation was present. No significant aftershock expansion towards the NE was noted, possibly due to the presence of a geometrical fault barrier east of the Anydros Ridge. The 2025 activity offered an excellent opportunity to investigate deciphering the type of ongoing seismicity cluster for real-time discrimination between foreshocks, aftershocks, and swarms.

1. Introduction

Deciphering the type of an ongoing spatiotemporal seismic cluster is a challenging issue, and scientists are called upon to respond to crucial questions in situations with many uncertainties. Is it a mainshock–aftershock, a foreshock–mainshock–aftershock, or a swarm sequence? Is a particular earthquake the mainshock, or is a stronger one expected to follow? How is it possible to diagnose the transition from foreshocks to aftershocks? Responses to such crucial questions during an ongoing seismic sequence are of great importance, not only from a scientific point of view but also from operational and social standpoints. However, determining the type of an ongoing earthquake cluster beforehand is an extremely difficult task, and only retrospective solutions have been proposed [1,2,3]. After the termination of a sequence, we can obtain complete knowledge of it, which enables its retrospective analysis. However, one of the main difficulties during an ongoing sequence relies precisely on such incomplete knowledge and the continuous additive data procedure. Several years ago, Papadopoulos et al. [1] proposed that, to improve our capabilities for analyzing ongoing seismic sequences under such unfavorable conditions, we should organize real-time experiments by incorporating sequential steps, including selection of target areas, regular updating of the earthquake catalog in the target areas, seismicity analysis and evaluation in real-time by comparing it with the background seismicity in the target area, production of forecasting statements, and finally, evaluation of the success or failure of the statements.
The Santorini–Amorgos Island complex in the South Aegean Sea (Figure 1 and Figure 2) attracts great scientific interest because it hosts important geodynamic phenomena, including large volcanic eruptions [4,5,6], tectonic earthquakes [7,8], and tsunamis [9].
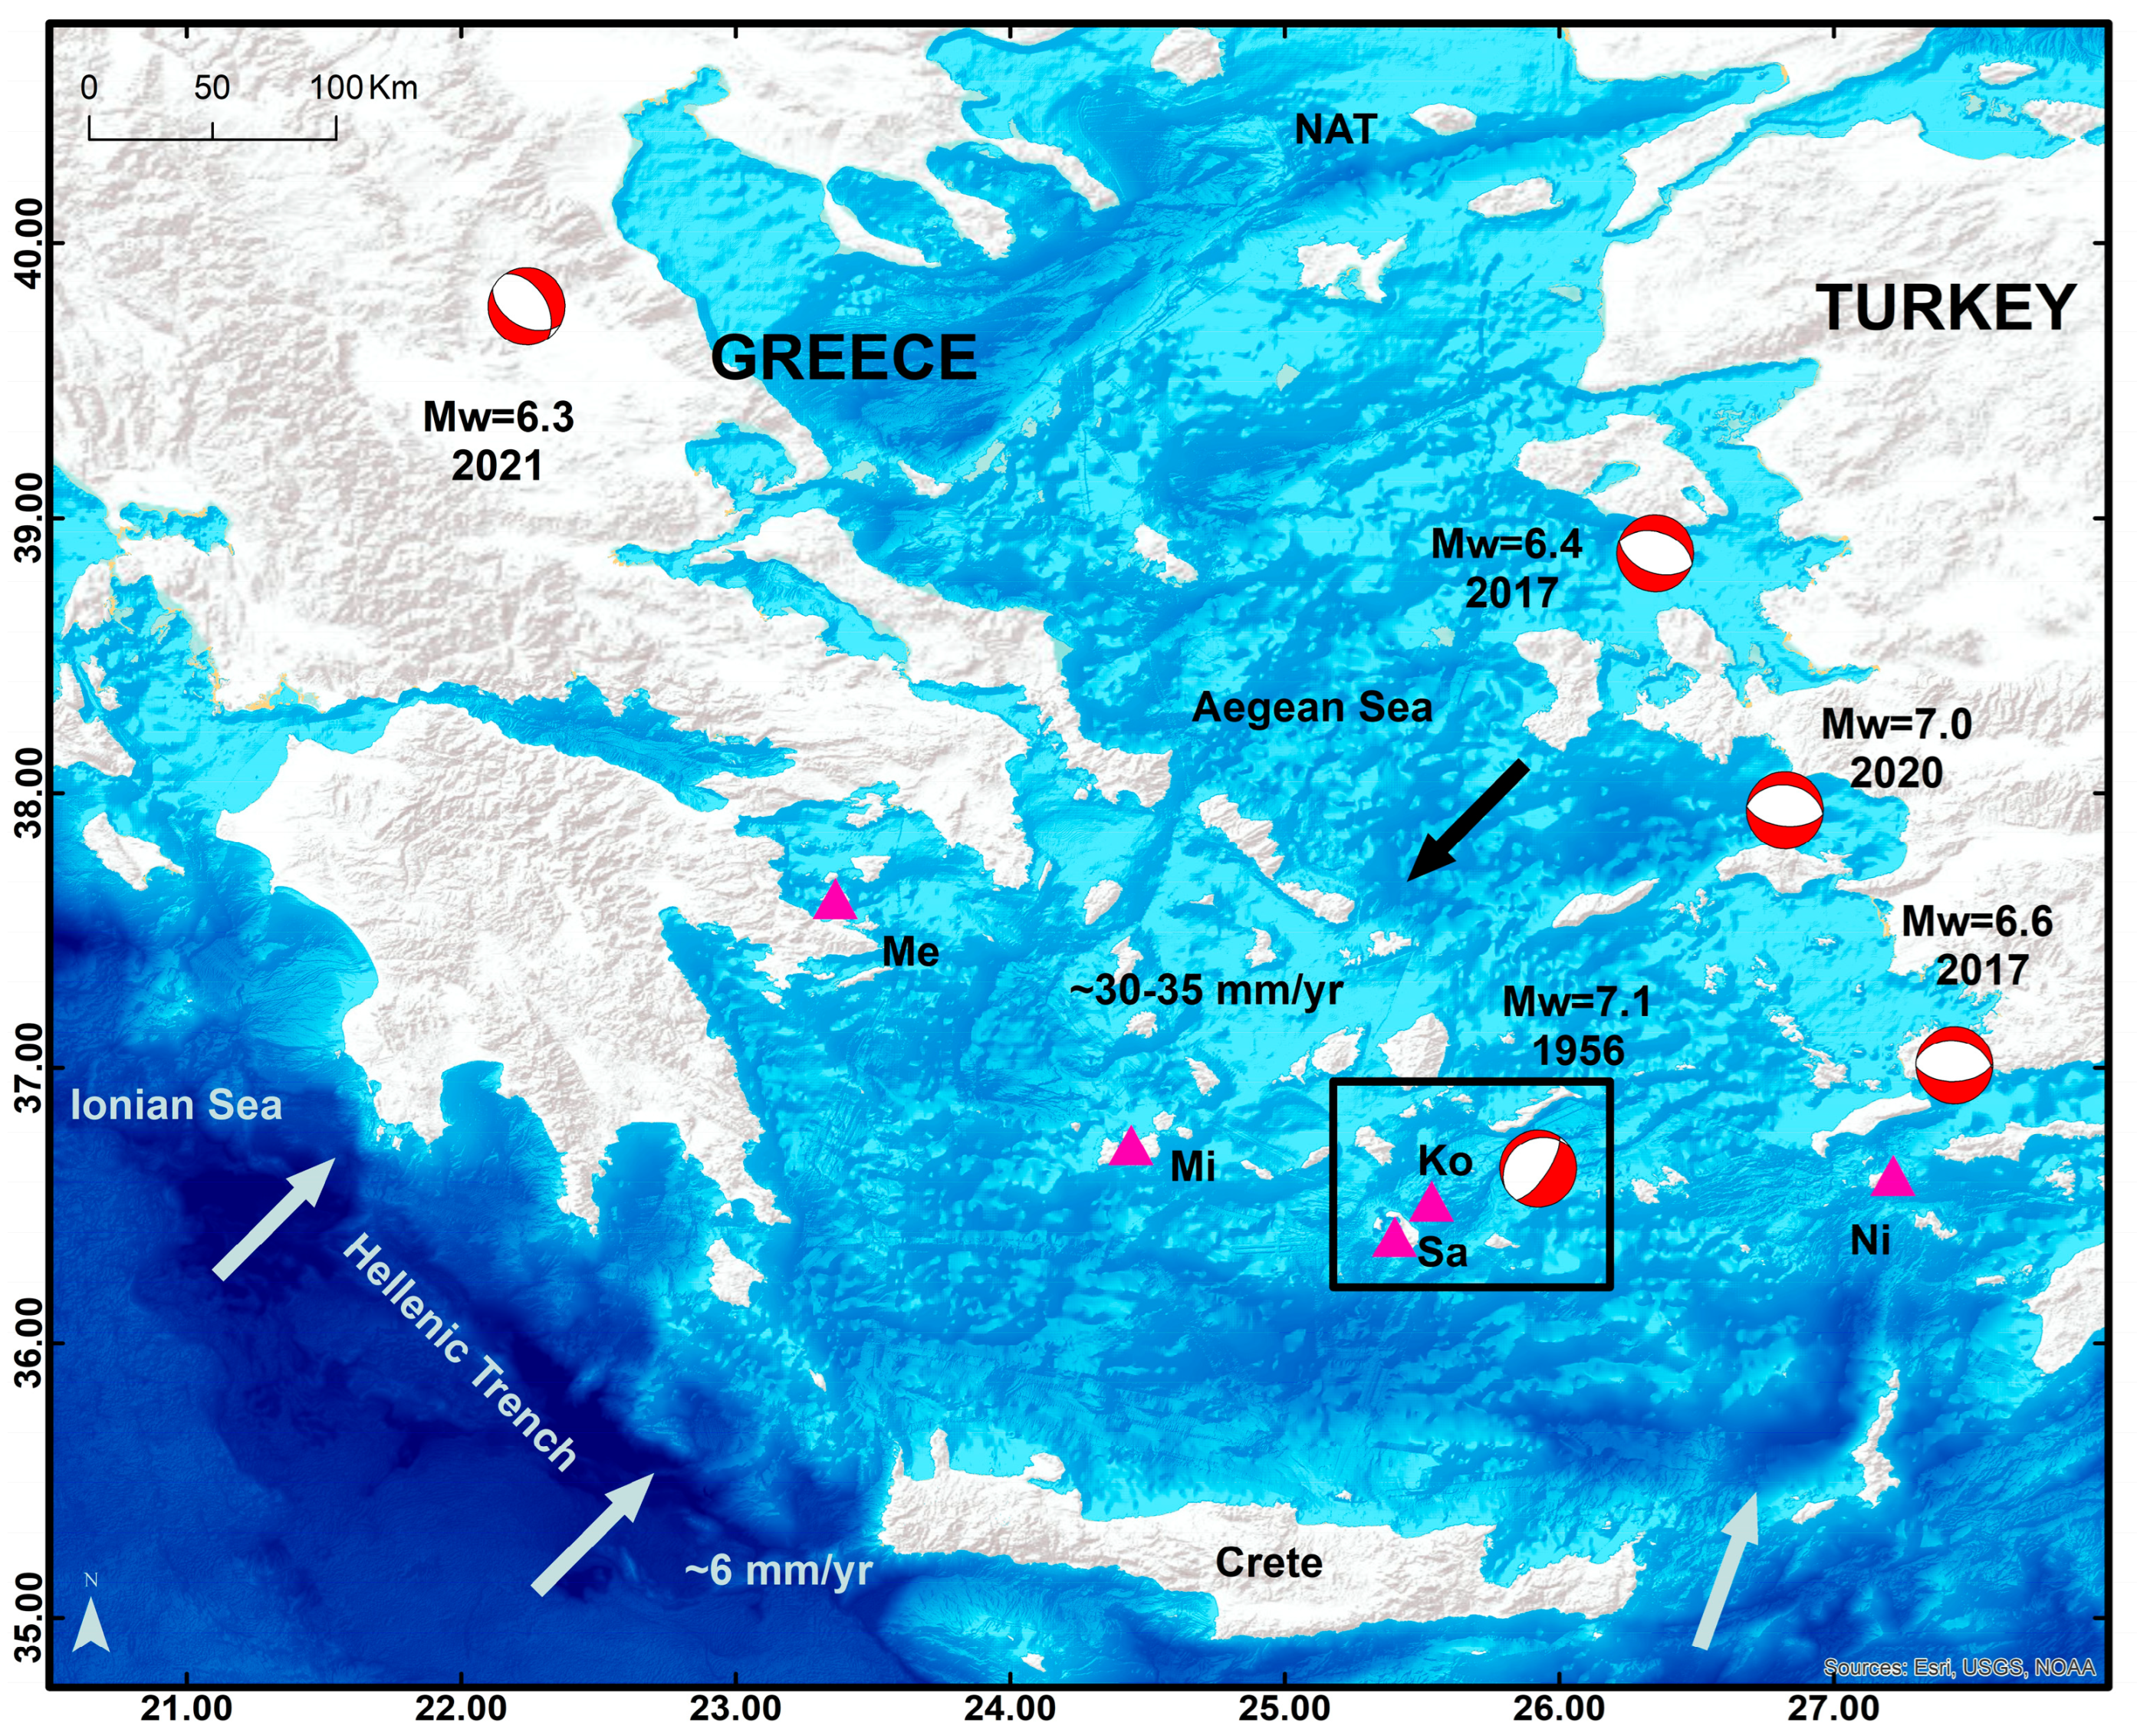
Figure 1. The seismotectonic setting of the broad Aegean Sea region. The Mediterranean lithosphere moves from roughly SW to NE and subducts underneath the Aegean Sea at the southern Eurasian plate margin along the Hellenic Trench (e.g., [10]). Arrows and nearby figures show the directions and velocities of lithospheric plate motions; the white and black arrows show the motion of the Mediterranean and the Aegean lithosphere, respectively. For more references, see [11]. NAT is the North Aegean Trough. Fault-plane solutions of strong earthquakes (beach balls) indicate that the Aegean Sea region is dominated by normal faulting; examples include the 9 July 1956 large tsunamigenic earthquake of Mw = 7.7 [12] or Mw = 7.1 [13] and the more recent strong earthquakes of Lesvos (Mw = 6.4) on 12 June 2017, Kos (Mw = 6.6) on 20 July 2017, Samos (Mw = 7.0) on 30 October 2020, and Tyrnavos (Mw = 6.3) on 3 March 2021; fault-plane solutions are adopted from the Global Centroid-Moment-Tensor (GCMT) Project [14], except for 1956, which is adopted from Reference [15]. The South Aegean Sea is characterized by the presence of the active volcanic arc, with the main volcanic centers (triangles) situated in Methana (Me), Milos (Mi), Santorini (Sa), Kolumbo (Ko), and Nisyros (Ni). The box illustrates the Santorini–Amorgos study area (Figure 2). Bathymetry adopted from Reference [16].
Geosciences 15 00300 g001
An intense spatiotemporal seismic cluster that was recorded from the end of January to March 2025 offshore of NE Santorini volcanic island (Figure 3) offered an excellent opportunity for testing methodologies aiming to discriminate the type of ongoing cluster in real time. The largest earthquake, of ML = 5.3 (MW = 5.2) occurred on 10 February 2025. The seismicity cluster caused considerable social concerns [17]. This mainly happened because of the different opinions publicly expressed by scientists, not only regarding the nature of the ongoing sequence, but also about the possible imminence of a strong earthquake of magnitude ~6 or more, combined with the scenario of volcanic unrest. It has been estimated that more than 11,000 people voluntarily left the island within a few days, leaving behind about 3000 residents according to press reports. The state civil protection authorities decided on emergency countermeasures for the protection of the population in Santorini, such as keeping schools closed and the transition and presence on the island of special rescue teams of the fire brigade for about one month. At the same time, the case attracted great international scientific interest, with many mass media outlets covering the story because Santorini is one of the top tourist destinations worldwide.
Figure 2. Epicenters (colored circles) of the background seismicity recorded in the area between Santorini (SA) and Amorgos (AM) islands from January 2015 to January 2025; the largest earthquake of moment-magnitude Mw = 4.6 (small yellow star) occurred on 27 November 2018 with beach ball showing the fault-plane solution (data adopted from the National Observatory of Athens (NOA), https://bbnet.gein.noa.gr/HL/databases/database accessed on 20 April 2025). The faults mapped in the area are illustrated by brown lines; fault data are adopted from the NOA database, which compiles data from various sources, Reference [18]. The epicenters of the two large earthquakes that ruptured the area on 9 July 1956 are also illustrated by yellow stars [13]. For the 1956 earthquake of Mw = 7.1 [13], the fault-plane solution (large beach ball) was adopted from [15]. No reliable solution is available for the fault plane of the Mw = 6.9 earthquake. Fault name key: AMF = Amorgos, ADF = Anydros, ANF = Anafi, ASF = Astypalea, IWF= west Ios, IEF = east Ios, SAF = Santorini–Amorgos. Bathymetry adopted from [16]. Other island names: AD = Anydros, ANA = Anafi, AST= Astypalea, IOS = Ios.
Geosciences 15 00300 g002
Figure 3. The cluster of earthquakes (ML ≥ 2.9, colored circles) recorded in the area between Santorini (SA) and Amorgos (AM) islands from 30 January to 12 March 2025. The two largest earthquakes (brown stars) occurred on 5 and 10 February 2025. Beach balls show fault-plane solutions. Earthquake and fault-plane data are from NOA (National Observatory of Athens, https://bbnet.gein.noa.gr/HL/databases/database accessed on 20 April 2025). The main faults mapped in the area are illustrated by brown lines; all known faults are illustrated in Figure 2. Fault data are taken from the database by NOA [18], which compiles data from various sources. Fault name key: AMF = Amorgos, ANF = Anafi, ASF = Astypalea, IWF= west Ios, IEF = east Ios, SAF = Santorini–Amorgos. Yellow stars illustrate the epicenters of the two large earthquakes that ruptured the area on 9 July 1956 [13]. NK and KO represent the positions (red triangles) of the Nea Kammeni and Kolumbo active volcanic centers. Bathymetry adopted from [16]. Other island names: ANA = Anafi, AST = Astypalea, IOS = Ios.
Geosciences 15 00300 g003
In this paper, we present the procedure followed to determine in real time the type of ongoing seismicity cluster in the Santorini–Amorgos area. Our approach was a day-by-day re-evaluation of the state of seismicity in the 3D space–time–magnitude domain using earthquake statistics and tools from the complex networks’ theory. The results of the daily evaluation procedure were periodically forwarded to the state civil protection authorities by one of the co-authors (G.P.), while short reports and summaries were communicated publicly through mass and social media. To our knowledge, the implementation of such a strategy in real-time conditions has been made possible for the first time.

2. Materials and Methods

2.1. Seismotectonic and Volcanic Setting

The Hellenic Subduction Zone (Figure 1) is one of the dominant geodynamic features in the eastern Mediterranean region. The Mediterranean lithosphere subducts beneath the back-arc area of the South Aegean Sea, the tectonics of which are mainly driven by a regional field of extension, e.g., [18,19,20] (Figure 1 and Figure 2). The study area (Figure 1 and Figure 2) falls within the back-arc regime and is geographically situated close to the Santorini volcanic complex, which is characterized by the presence of two main active volcanic centers (Figure 3). The first is the intra-caldera center of the Nea Kammeni islet, which was shaped by lava produced during small-to-moderate historical eruptions that followed the Plinian Late Bronze Age or Minoan (~1613 BCE) caldera-forming [5,6] and tsunamigenic [21] eruption. The second center is the submarine Kolumbo volcanic bank, situated about 7 km off northeastern Santorini [22]. The last eruptive episode in Kolumbo took place during 1650 CE and was associated with a series of strong earthquakes and a powerful tsunami, e.g., [23].
The area between the islands of Santorini and Amorgos is characterized by a dense network of active tectonic faults striking NE-SW (Figure 2) and was ruptured by the large tectonic earthquake of 9 July 1956 [7,8] measuring a moment-magnitude of Mw = 7.7 [12] or Mw = 7.1 [13]. The earthquake caused a very strong tsunami [24,25,26,27,28]. Field observations and aerial photograph analysis of the normal neotectonic master fault along the eastern coast of Amorgos Isl., combined with the macroseismic intensities distribution, indicated that the 1956 earthquake rupture zone very likely occupied the submarine tectonic trough delineated by the islands of Amorgos, Santorini, Anafi, and Astypalaea [8] (Figure 2). The submarine continuation of the neotectonic master fault striking roughly NE-SW, as documented by bathymetric data, shallow and intermediate penetration seismic profiles, and a series of gravity cores, was proposed as the 1956 Amorgos seismogenic structure [29]. From subsequent studies, recent escarpments were recognized, thus verifying that the Amorgos fault was activated with the 1956 earthquake [30,31]. The fault-plane solutions of the earthquake indicated either strike–slip faulting [32,33] or normal faulting with a strike–slip component [15,27,34]. The Amorgos neotectonic master fault and the 1956 seismic faulting very likely belong to the same tectonic phase with NE-SW strike and roughly SE dip [8]. However, the significant right-lateral strike–slip component involved in the focal mechanism implies that the Amorgos basin deviates from the simple pattern for pure extension in back-arc conditions [8]. Other authors did not rule out the connection of the earthquake with other fault(s) in the area if normal faulting is considered [35].
Microseismicity recorded in the early 2000s revealed that in Kolumbo the activity was concentrated in the uppermost 5–8 km and interpreted to be linked with the accumulation of magma below the volcano [36], although recent seismic tomography results showed that the upper crustal magma system beneath Santorini is imaged to at least 6 km depth and 12 km depth beneath Kolumbo [37]. The study by [36] noted distinct activity spots in the area that were again activated during 2025 (Figure 3), and proposed that they are likely locations for future volcanic activity in this zone of crustal weakness or may indicate fluid pathways. During 2011–2012, the detection of a seismicity cluster along with Mogi-type ground deformation indicated a possible volcanic unrest episode in the Santorini caldera, e.g., [38]. However, this episode was not detected in the Santorini–Amorgos area where the 2025 seismicity cluster occurred. No major earthquakes were recorded during the background seismicity time interval from 2015 to the onset of the seismicity cluster by the end of January 2025 (Figure 3). In that time interval, the largest earthquake measuring magnitude ML = 4.7 (Mw = 4.6) occurred on 27 November 2018 (Figure 2).
The January–March 2025 seismic cluster was spatially located at distances ranging from about 15 km to 40 km off northeastern Santorini Island (Figure 3). The two largest earthquakes, measuring magnitudes ML = 5.2 (MW = 5.0) and ML = 5.3 (MW = 5.2), occurred on 5 February and 10 February, respectively (Figure 3). The cumulative energy released during the entire cluster is equivalent to that of an earthquake of magnitude ~6.2.

2.2. Discrimination of Foreshocks from Other Earthquake Clusters

Foreshocks, aftershocks, and swarms are the most common types of space–time seismicity clusters [39,40]. The real-time discrimination between foreshocks and other cluster types during ongoing seismic activity is of great importance for operational earthquake forecasting and short-term hazard assessment. However, such an issue is quite challenging [1,2,3,41,42] since it depends on several factors, including the earthquake catalog’s completeness and the definitions adopted for foreshocks and swarms. On the other hand, space–time–magnitude distribution patterns characterizing each one of the different cluster types may support their discrimination, not only retrospectively, but also beforehand.
Of particular importance is the fundamental b-value, which is the slope of the straight line in the Frequency Magnitude Distribution (FMD), well-known as the G-R law expressed by (1) [43,44]:
log N = ab M
N is the discrete or cumulative number of events of magnitude ≥ M ± ΔΜ, and a, b are parameters determined by the data; ΔΜ is the magnitude error. The b-value is the exponent in the exponential law and indicates the ratio between small- and large-magnitude earthquakes. Therefore, Formula (1) implies that the drop in b is a direct consequence of the relative abundance of higher magnitudes in the earthquake catalog. For global seismicity, the b-value is ~1 [45,46]. However, in regional and local seismic zones, the parameter b is sensitive to many factors, the most important being the stress loading conditions [39,47,48] and crustal heterogeneity [49,50]. Consequently, the b-value has been considered as a stress meter within the crustal material [46]. From an analytical enrichment of a 2D Olami–Feder–Christensen (OFC) spring-block model [51], it was shown that the low b-value experimentally observed in foreshock sequences can be modeled by a process of material softening in the seismogenic volume [52].
Studies on natural foreshock sequences [1,2,3,50,53,54,55,56,57,58,59,60,61,62,63,64], laboratory material fracture experiments [39,47,65,66], numerical modeling in spring-block models [51,52,67], acoustic emission events [68,69], and analytical damage mechanics modeling [70,71,72] have shown that foreshock sequences are characterized by an accelerating increase in the number of earthquakes, a gradual increase in magnitude, and simultaneously by a significant drop in the b-value as the mainshock occurrence time approaches. A relative drop in the foreshock rate shortly before the mainshock has been predicted by modeling experiments [50], which was verified by seismological data [57,73,74]. In sequences with well-determined epicenters, it has also been observed that foreshock epicenters gradually move towards the mainshock area [75,76,77,78,79,80,81,82]; see [83] for a review.
Analysis of the aftershock decay rates reveals power-law time dependence, expressed by Formula (2), with scaling exponents p in the range between 0.6 and 2.5, with the median being 1.1 [84]:
n(t) = K (t + c)p
In Formula (2), K and c are constants, and t is time measured from the mainshock. Statistical models and laboratory experiments have shown that during an aftershock sequence, parameter b, as a rule, increases and the aftershock area gradually expands [64,85,86,87,88,89,90,91].
Swarms usually occur in volcanic areas (see review in [92]) and, less frequently, are of tectonic origin [93,94]. Also, swarms take place due to processes of induced seismicity. Laboratory material fracture experiments [39] and modeling results [50,95] have shown that swarms generally start and end gradually, and under certain conditions, no single event dominates the sequence. These studies also showed that the b parameter usually does not drop like in foreshock sequences, and this is consistent with seismological observations on natural earthquake swarms. For example, b ~ 1.1 was found for a southern Spain swarm [93]. A high b-value of about 1.2 or larger is, as a rule, associated with seismic swarms caused by fluid injection into geothermal systems [96] and in mining-induced earthquakes [97].
The above observations and results are mainly based on the fundamental assumption that earthquakes are caused by brittle fracturing of the Earth’s crustal material. The material structure along with the distribution of external stresses explains the three different seismicity patterns, which are summarized as follows, although the transition from one to another is continuous [39,40]: (1) Homogeneous materials under uniformly distributed external stresses favor the generation of mainshock–aftershock sequences; (2) in more heterogeneous materials under non-uniform external stresses, the generation of foreshocks and the pattern of mainshock–aftershock prevails; (3) the extremely heterogeneous material structure combined with very concentrated stresses favors the generation of swarms. This general framework explains why a high b is usually associated with aftershocks and swarms, while foreshock sequences are characterized by a low b.

2.3. Research Strategy

The real-time characterization of the type of ongoing seismic cluster near Santorini was based on the daily monitoring of the 3D seismicity changes, i.e., in the space–time–magnitude domains. Real-time is meant in the sense that the evaluation of a data set retrieved from the earthquake catalog up to time t was completed at time t + 1 days. The 3D changes detected during the 2025 seismicity cluster were compared with the 3D state of background seismicity (BS) in the same area. As BS, we considered the earthquake activity recorded in the 10-year time interval from 1 January 2015 up to the onset of the 2025 cluster on 30 January 2025 (Figure 2). We selected this time interval to secure a significant time distance from the unrest episode of 2011–2012. The significance of seismicity changes was tested with appropriate metrics and statistical tests, as described in Section 2.5.
Figure 4 illustrates the flow diagram of our research strategy, which so far has been retrospectively tested in the aftermath of several earthquake sequences in Greece, Italy, and Chile [1,73,79,98]. A similar strategy was adopted for the a posteriori foreshock–aftershock discrimination in other sequences [2,3]. With the study of the Santorini–Amorgos 2025 sequence, we advanced this strategy with its implementation in real-time conditions.
The date 30 January 2025 was considered as the onset of the seismicity cluster, and, therefore, that date was fixed as time t = 1 day of the sequence. The first 3D evaluation step of the ongoing cluster was completed and announced at time t = 4 days (2 February 2025). Daily seismicity monitoring was performed until 12 March 2025, since it was realized that the seismicity cluster had already drastically decreased. The outputs of the daily 3D seismicity evaluations were periodically transmitted by one of the co-authors (G.P.) to the competent state authorities, i.e., the Ministry of Climate Change and Civil Protection, including the Earthquake Planning and Protection Organization, Greece, starting at time t = 6 days on 4 February 2025. A short preliminary report was also delivered to EMSC on time t = 8 days on 6 February 2025 [99]. In parallel, our evaluations were publicly communicated with relevant statements by G.P. through mass and social media. More details regarding the documentation of our real-time evaluations can be found in Appendix A.

2.4. Earthquake Data

The implementation of our research strategy was possible thanks to the open availability of earthquake data by the Institute of Geodynamics of the National Observatory of Athens (NOA; https://bbnet.gein.noa.gr/HL/databases/database accessed daily from 30 January to 12 March 2025), which provides continuous updating of the national earthquake catalog. As soon as an earthquake occurs in Greece and the surrounding areas, the monitoring system automatically provides determination of the earthquake focal parameters within 2–3 min from the earthquake occurrence. The automatic procedure is followed up by the manual determination of the parameters within about 10–15 min. The daily monitoring of the 3D seismicity changes was performed by utilizing the manually organized NOA earthquake catalog. It has not been possible to use a relocated catalog since our interest was focused on the real-time investigation of seismicity changes. For the time interval from 30 January up to 12 March 2025, the total number of earthquakes listed in the NOA catalog in the study area was 4269. The minimum magnitude recorded was ML = 0.4, while 1621 earthquakes had magnitude ML ≥ 2.9.
Moment tensor solutions are also provided by NOA (https://bbnet.gein.noa.gr/HL/seismicity/mts accessed daily from 1 February to 12 March 2025) for earthquakes with moment magnitude of Mw~4.0 or larger, based on the Gisola high-performance computing application for real-time moment tensor inversion [100].

2.5. Research Methods

2.5.1. Catalog Completeness

An essential step in a statistical seismicity analysis is to determine the completeness magnitude threshold, Mc, below which the exponential G-R law is no longer valid. No difficulties were encountered for the Mc determination of BS. However, due to the very high seismicity rate, mainly during the first days of the 2025 cluster, many recorded earthquakes very likely escaped analysis and were not included in the earthquake catalog because their waveforms were masked by others. In addition, a few days after the onset of the cluster, several institutes installed six new seismograph stations in Santorini, Anydros, and other nearby islands, thus improving the earthquake detectability in the area and, at the same time, increasing the variability of Mc during the cluster. Several trials were executed for the Mc determination during the 2025 cluster. The methods tested included the Maximum Curvature (MAXC) and Fixed-Mc methods, both applicable with the use of the z-map toolbox [101].

2.5.2. Space–Time Seismicity Distribution Using Complex Networks

The spatial distribution of seismic activity in both the BS and the 2025 cluster has been analyzed by utilizing computational tools from the complex networks’ theory, which provides new insights into the analysis of seismicity patterns [102,103,104,105,106,107,108], including foreshocks [108]. In this sense, a set of earthquakes represents a network of events, and earthquake epicenters are nodes in the network. The connectivity is computed using the following rule: in the complete part of the earthquake catalog, two successive seismic events with epicenters x A , y A   a n d   ( x B , y B ) at times t A and t B , respectively, are connected with an edge { e A B } .
In this study, we measured the topological metric betweenness centrality (BC), which characterizes the importance of a node in the network (i.e., centrality). BC quantifies how frequently a node appears on the shortest paths between other nodes in a network. Nodes with a high BC function as crossroads for network pathways, and frequently, they serve as bridges connecting different parts of the network. Such nodes play a vital role in facilitating efficient communication and energy flow in the network. The BC metric is defined as the fraction of all shortest paths in the network that pass through a given node, e.g., [109,110] (pp. 185–191):
BC (i) = ∑ j≠i≠k (Gjk (i)/Gjk)
Gjk (i) is the number of paths passing from node i, and Gjk is the total number of shortest paths from node j to k. Higher values of BC (i) indicate that node i acts as a central node influencing most of the rest nodes in the network. This means that this node acts as a hub and implies persistent seismic activity around the point. The spatial distribution of the topological metric BC can be calculated in a certain time interval or in sequential time steps by keeping constant either the time length in each calculation step or the number, n, of seismic events, regardless of the time length required in each step. To avoid biased comparison of the BC spatial distribution, we selected the second calculation technique. After several trials, we found that stable results can be obtained for n ≈ 60. For both BS and the 2025 seismicity cluster, the topological metric BC was calculated in variable time frames that secured the inclusion of 60 earthquake events in each calculation step.
The first sizable earthquake (ML = 3.1) of the cluster under study occurred on 30 January 2025 about 10 km to the northeast of the submarine Kolumbo volcano (Figure 3). During the first days of the cluster, it was observed that the activity migrated from SW to NE following the strike of the main tectonic faults in the area (Figure 3). For the monitoring of the epicenters’ migration, we measured from a zero point the mean distance, D, of an ensemble of 100 earthquakes in each measurement step. The position of the Kolumbo volcano was conventionally considered as the zero point. In the domain of time, our daily cluster monitoring also considered the variation in the seismicity rate, r = n/T or R = N/T, where n = discrete number of earthquakes, N = cumulative number of earthquakes, and T is a constant time interval.

2.5.3. Frequency–Magnitude Distribution

In the magnitude domain, the monitoring of the seismicity state was performed by calculating changes in the critical parameter b. Τhe Maximum Curvature (MAXC) and the Fixed-Mc methods, both incorporated in the z-map toolbox [101], have been utilized to test the time variation in b during BS as well as during the 2025 cluster. However, the Mc and b obtained with the MAXC method during the first days of the 2025 cluster proved quite unstable. Under these conditions, we judged that the comparison of the b-values found for BS and for the 2025 cluster would not lead to reliable results. For this reason, we alternatively employed an indirect but stable estimation of b by considering that b depends on the inverse of the mean magnitude, Mm, as follows [111,112]:
b = log e/(Mm − Mc)
In Formula (3), log e = 0.4342944819. A moving window technique with a fixed number of events n = 100 and a step of 50 events was applied for the calculation of b. Since the magnitude bin used in the earthquake catalog is ΔΜ = 0.1, a more accurate b estimation can be obtained by introducing the correction ΔΜ/2, accounting for better magnitude accuracy:
Mc~[Mc − (ΔΜ/2)] = Μc − 0.05
The significance of the b-value changes was tested with the so-called Utsu-test, which provides the probability, P, that two earthquake samples 1 and 2 belong to the same mother earthquake population [113]:
P ≈ exp [−(dA/2) − 2]
where
dA = −2N ln N + 2 N1 ln [(N1 + N2) (b1/b2)] + 2N2 ln [N1 (b2/b1) + N2] − 2
N = N1 + N2
Earthquake samples 1 and 2 have a number of events N1 and N2 and b-values b1 and b2, respectively. P-values less than 0.05 indicate a highly significant difference between the b-values of the earthquake samples 1 and 2, implying that it is very likely that the two samples do not belong to the same mother earthquake population.

3. Results

3.1. Background Seismicity

As soon as we realized at time t = 3 days (1 February 2025) that the Santorini–Amorgos seismic cluster was growing, we ran a retrospective analysis of BS. Figure 5a shows that during the entire 10-year time interval, BS magnitudes as low as ML = 0.7 were determined, with the maximum magnitude of ML = 4.7 (Mw = 4.6) occurring on 27 November 2018 near the Anydros islet (Figure 2). The completeness magnitude threshold, Mc, varied around 2.2 and 2.3 (Figure 5b). The small variation in the seismicity rate (0.16 events/day for Mc = 2.2) indicates that the BS examined represented a nearly steady-state process, although a transient activity increase was noted during 2021 and 2022 (Figure 6a). The majority of focal depths were concentrated between 5 and 20 km but mainly within the layer from 5 to 15 km (Figure 6b), which is the usual seismogenic layer for crustal earthquakes in the back-arc area of Greece, e.g., [11]. For Mc = 2.2, the parameter b fluctuated between 0.8 and 1.2 (Figure 7a). As we will see in Section 3.2, for the 2025 ongoing seismic cluster, Mc = 2.9 was adopted at time t = 4 days (2 February 2025). To secure meaningful comparison between the b-values of the BS and the seismic sequence, we adopted 2.9 as a common Mc level. Utilizing the Fixed-Mc method for Mc = 2.9, we found b = 1.19 ± 0.11 for the entire background seismicity (Figure 7b).
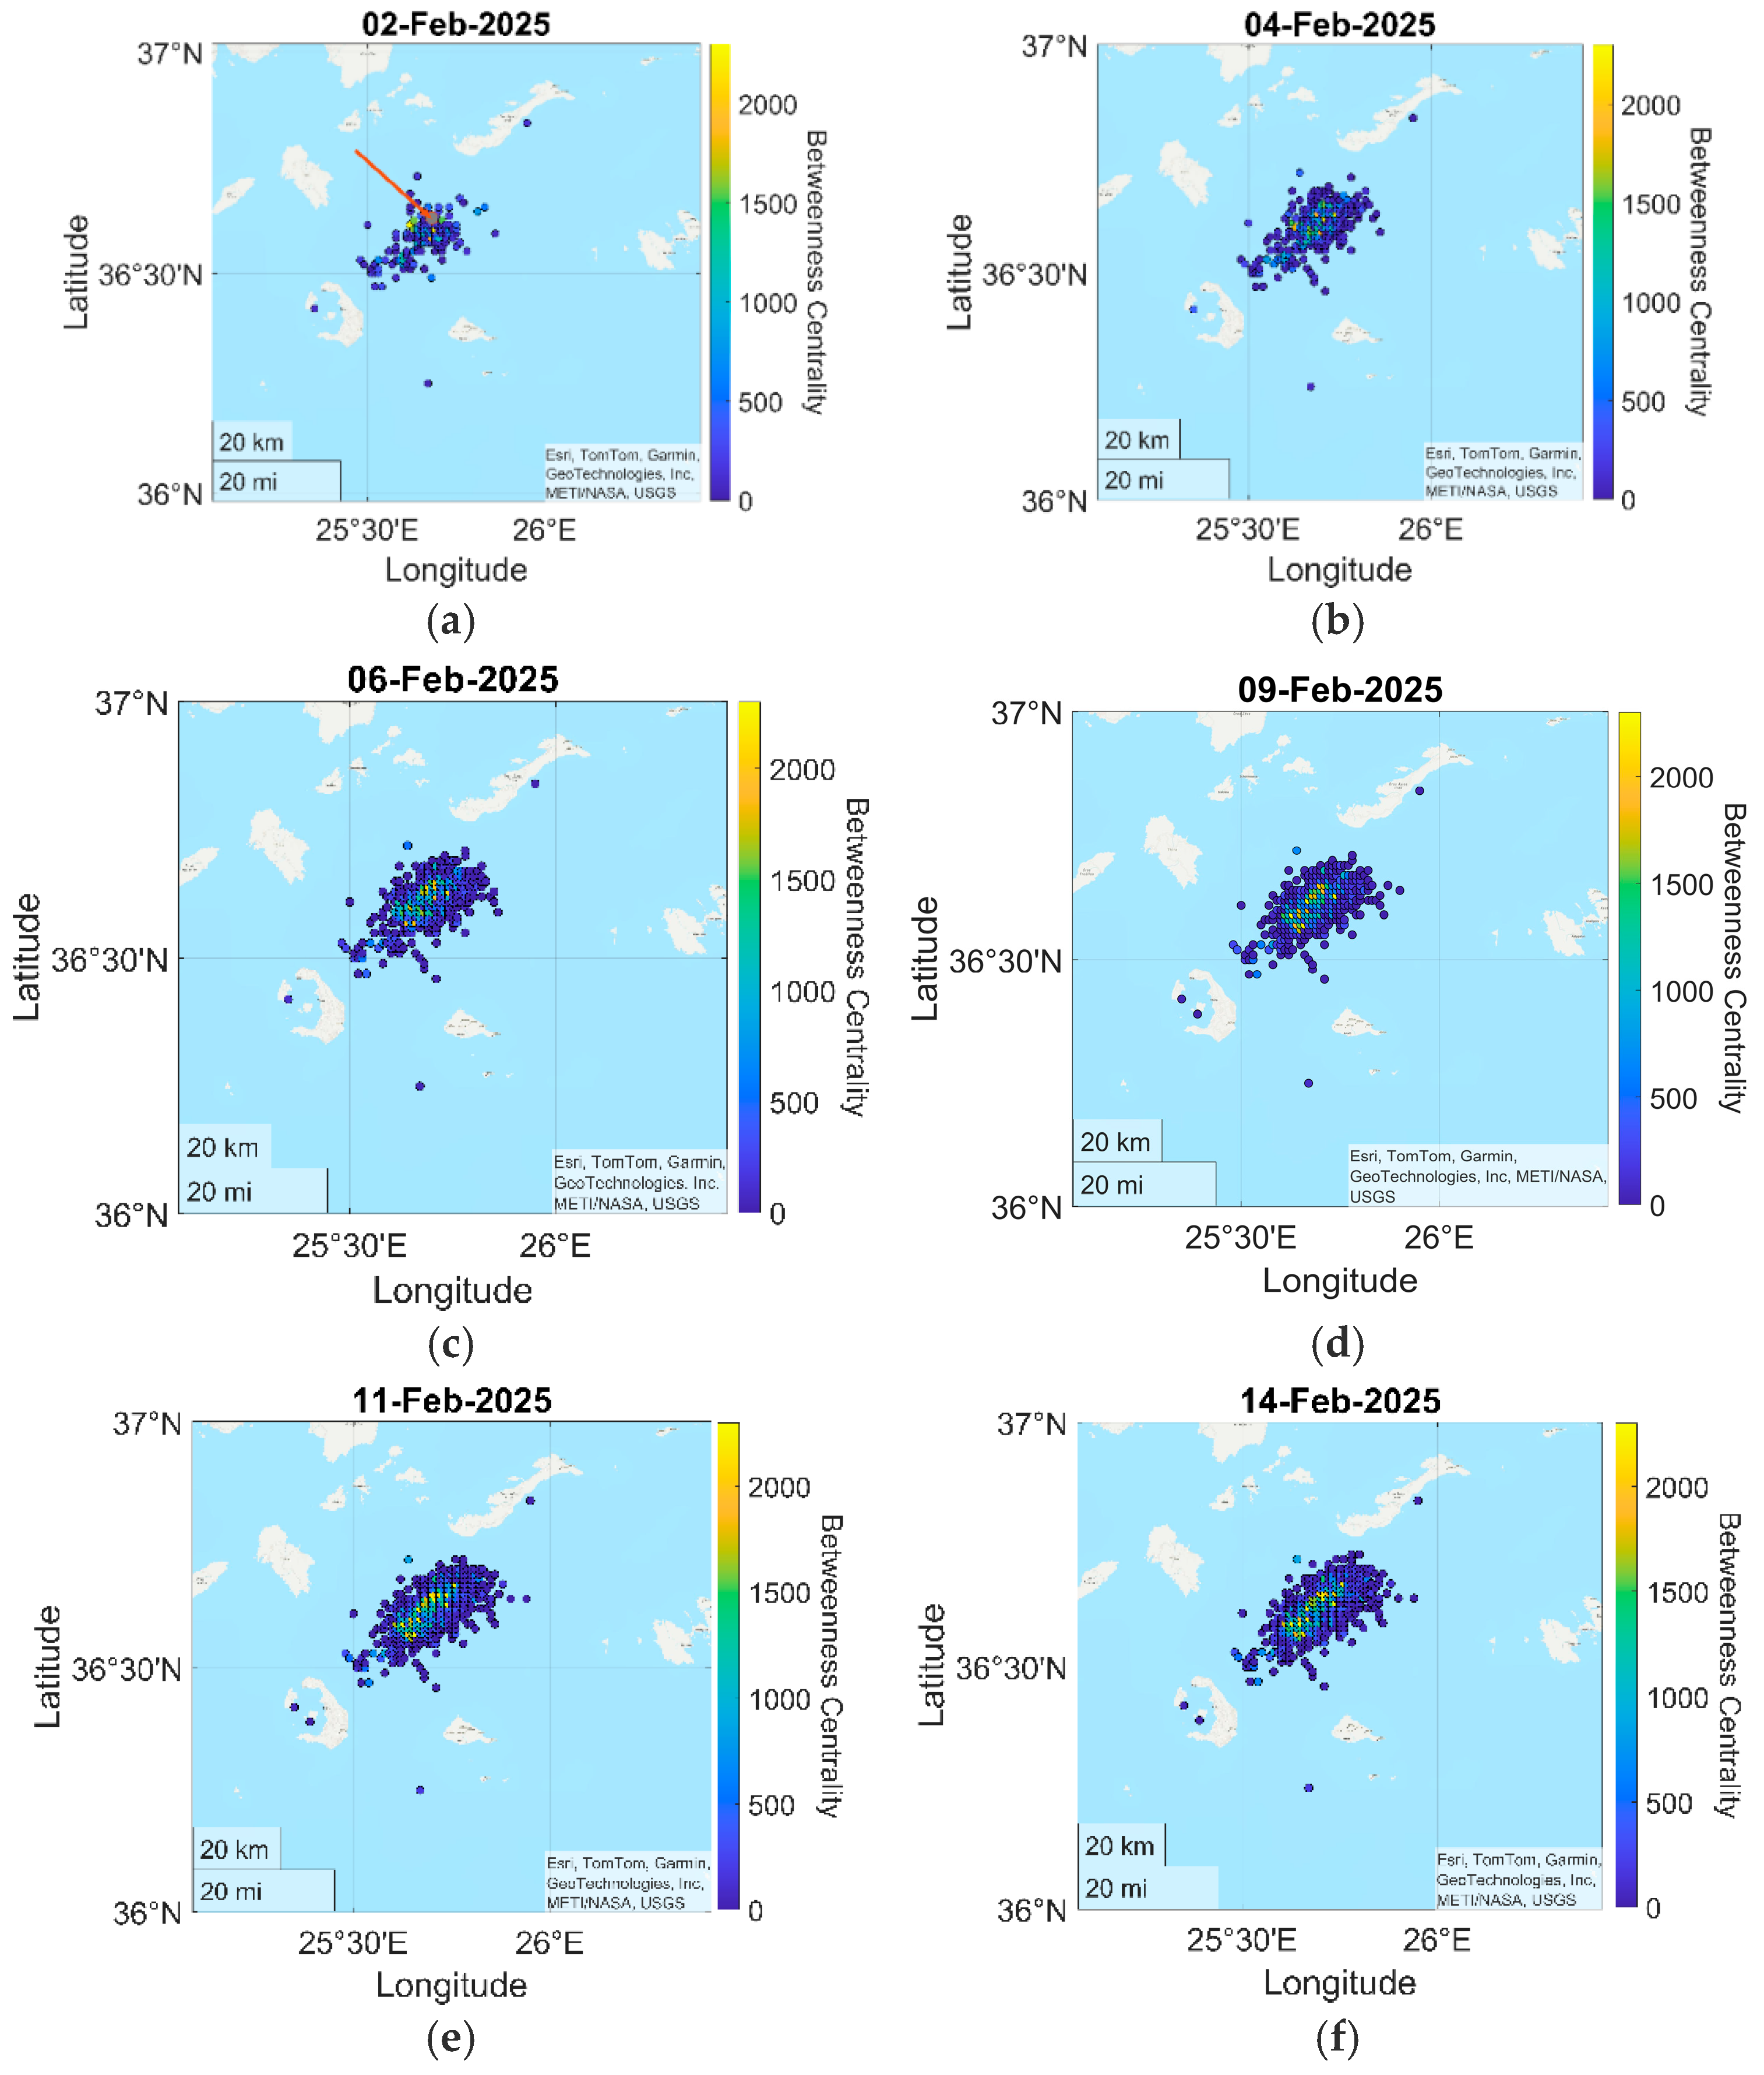
The geographical distribution of BC for ML ≥ 2.9 indicates that during the state of BS, the area between Santorini and Amorgos, where the 2025 cluster was developed, hosted the majority of seismicity hubs as compared to other areas of the region. For a more detailed illustration, we repeated calculations for ML ≥ 2.2 (Figure 8a–e).
The seismotectonic implication is that the dense fault network in the Santorini–Amorgos area (Figure 2 and Figure 3) acts as a continuous stress concentrator. A few isolated strong hubs appeared off northeast Santorini (Figure 8d) and off south Santorini (Figure 8e), away from the Santorini–Amorgos area. In this area, several hubs became stronger during the last months before the initiation of the 2025 seismic cluster, particularly at the central-northern side around the Anydros islet (Figure 8e). The island of Santorini, along with its caldera, did not act as a seismicity hub except for the last period before the 2025 seismic cluster, when a weak hub appeared there (Figure 8e).
It is noticeable that during the entire 10-year-long time interval of BS, the northeastwards extension of the seismicity hubs persistently stopped offshore south of Amorgos. In Aki’s (1979) [114] terminology, this feature may indicate the presence of a geometric or an inhomogeneous barrier that stops the earthquake rupture extension. The suggested barrier is likely of an NW-SE trend. Of particular interest is the absence of seismicity hubs in the submarine trough between the Amorgos and Astypalea islands, which was ruptured by the large 1956 earthquake. Perhaps the fault associated with the large 1956 earthquake remains at a healing stage.

3.2. Analysis of the 2025 Cluster

3.2.1. Earthquake Catalog Completeness

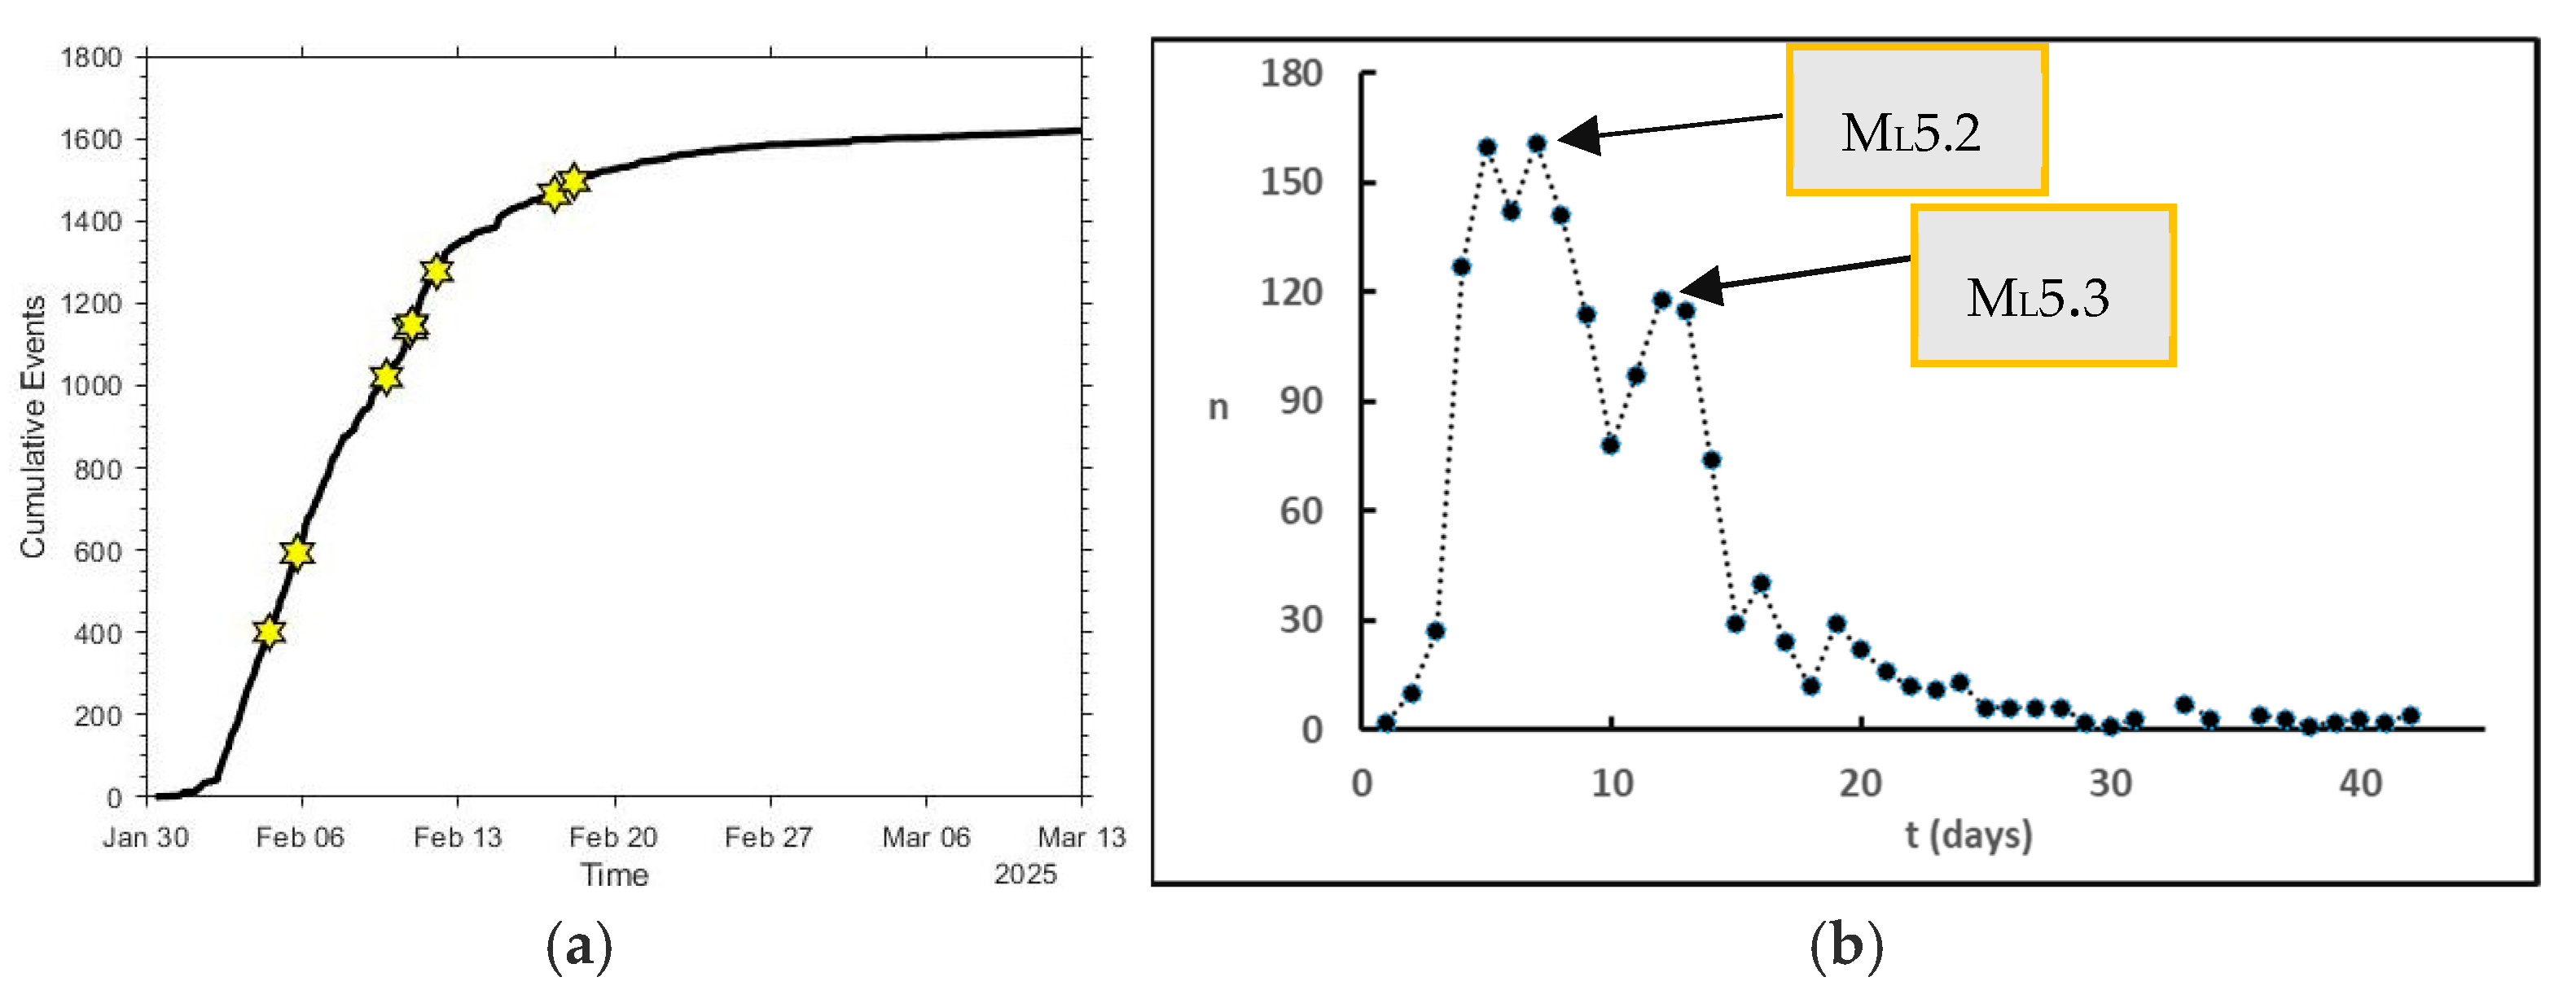
The completeness of the catalog was tested with the MAXC method on a daily basis during the entire duration of the cluster. Because of the rapid increase in both the number and magnitudes of earthquakes (Figure 9), the Mc was quite unstable during the first days of the cluster, ranging from 2.5 to 3.2, depending on the time interval considered (Figure 10a,b). However, because of the need to calculate the b-value from the beginning of the cluster, we adopted a working Mc = 2.9 for both the BS and the 2025 catalogs, but calculations were repeated with alternative Mc values of 2.5 and 3.2. The largest earthquake (ML = 5.3) of the sequence occurred at t = 12 days on 10 February, 20:16:28 UTC, while the second largest earthquake (ML = 5.2) occurred at time t = 7 days on 5 February, 19:09:38.46 UTC (Figure 9). The daily monitoring terminated on 13th March, taking into account data up to the 12th of March.

3.2.2. Temporal Variation

During the background seismicity, no significant variations in the activity rate were observed (see Section 3.1), the mean rate being as low as r~0.03 events/day for Mc = 2.9. However, from the beginning of the seismic cluster up to the occurrence of the largest earthquake (ML = 5.3, t = 12 days, 10 February), the temporal evolution of the activity was characterized by remarkable variations. The acceleration of the seismicity rate, r, detected by the daily monitoring for Mc = 2.9 (Figure 11a), was the first diagnostic at time t = 4 days (2 February 2025), indicating that a foreshock sequence likely was ongoing. At that time, the rate was as high as 120 events/day, but three days later, when the second largest earthquake occurred (ML = 5.2, t = 7 days, 5 February), the rate reached its peak of 161 events/day (Figure 11b).
Τhe earthquake number increased with the inverse of time up to the occurrence of the second largest earthquake at time t = 7 days (Figure 12a). The exponent 2.10 in the power-law underlines the very high rate, given that for another foreshock sequences this exponent was found equal to ~0.7 (e.g., [57,73]). However, in the entire time interval of the sequence up to the largest earthquake at t = 12 days, the earthquake number increase did not fit the power-law distribution well. This was due to the relative drop in the rate for about three days prior to the largest earthquake, which was reminiscent of the seismicity rate drop observed shortly before the mainshock in several foreshock cases [57,73,74]. It is noteworthy that a less important drop occurred before the second-largest earthquake as well (Figure 12a). The rate increased to r~118 events/day on the day of the largest earthquake occurrence (10 February) and on the next day (Figure 12a). Afterwards, the rate gradually dropped to the very low level of 1 to 4 events/day during the first days of March 2025.
The seismicity rate that followed the largest earthquake is modeled by a power-law decay (Figure 12b), which is consistent with the Omori–Utsu law for aftershock sequences according to Formula 2 [85,115]. The exponent 1.31 is larger than the median 1.1 found for aftershock sequences [85], implying a relatively rapid decrease in activity. The daily monitoring detected the aftershock-like seismicity drop at time t = 15 days, i.e., in less than three days after the occurrence of the largest earthquake on 10 February at 20:16:28 UTC.

3.2.3. Spatial Variation

The Santorini–Amorgos seismic cluster had of a total length of ~30 km along a SW-NE zone extending from the northeast of Anydros islet at the NE of the zone to the east of the Kolumbo volcano at the SW (Figure 13a–f). As early as 2 February 2025 (time t = 4 days), the entire zone was activated, but the strongest hubs of BC appeared in the central-northern part of the zone around the Anydros islet (Figure 13a), where the two largest shocks of 5 and 10 February 2025 occurred. The number of strong hubs gradually increased there in a restricted band with a length of 10–15 km. The band of strong seismicity hubs remained for several days after the occurrence of the largest earthquake on 10 February 2025, obviously because of the aftershock activity. During the entire seismic cluster, nearly all the BC hubs for earthquakes of ML ≥ 2.9 were concentrated in the cluster area. Practically no seismicity hubs were evident, neither in Santorini and its caldera, nor in Kolumbo, nor in other areas of the region (Figure 13a–f). It is noteworthy that the total surface area occupied by the seismicity hubs did not extend significantly towards the NE after the largest earthquake. This feature favors the suggestion for the presence of an NW-SE trending barrier that stops the earthquake rupture offshore south of Amorgos Island.
The band of strong seismicity hubs that appeared in the cluster zone, particularly since the time t = 6 days (4 February), indicated that the seismicity migrated towards the NE. To monitor the seismicity migration in real-time, the mean epicentral distance, D, was sequentially measured from the zero point, which was conventionally taken at the Kolumbo volcano. Each measurement step was performed for an ensemble of 100 earthquakes. The distance D gradually increased during the first days of the sequence and reached at D = 16 km at time t = 3 days and D = 20 km at time t = 7 days on 5 February 2025 (Figure 14a). This implies that the epicenters migrated towards the epicenter of the largest earthquake (ML = 5.3, 10 February), thus providing additional clues that the migrating earthquakes were likely to be foreshocks of the largest earthquake. Afterwards, the distance D varied between ~14 km and 20 km and reached its maximum value of 24 km at t = 13 days, i.e., one day after the largest earthquake. After the ML = 5.3 earthquake, the distance D varied between 17 km and 24 km, although the distance of some single epicenters reached ~35 km, indicating that the aftershock area expanded towards the NE but not significantly. The average migration velocity during the entire cluster was 24 − 16/11 = 0.72 km/day, although in the first days it reached up to D~1.3 km/day.
The distribution of the earthquakes’ focal depth, h, of the seismicity cluster followed a pattern similar to that found for the background seismicity, i.e., h ranged from 5 to 20 km but mainly between 5 and 15 km (Figure 14b). A decrease in the focal depth was noted after the mainshock of 10th February but this should be verified by seismicity relocation.

3.2.4. b-Value Variation

Since the first days of the Santorini–Amorgos seismicity cluster, we were able to calculate the mean magnitude Mm for Mc = 2.9 (Figure 15) with the moving window technique explained in Section 2.5.3. The b-value was estimated by utilizing Formula (4). Monitoring the b-value changes (Figure 16a) showed that this parameter dropped rapidly from the first days of the seismic cluster, thus providing further evidence for an ongoing foreshock sequence; b = 0.72 ± 0.02 was calculated with the MAXC method for the time interval from the initiation of the cluster up to the occurrence of the largest earthquake ML = 5.3, not including it in the calculation (Figure 16b). The low b-value remained up to t = 15 days (13 February). Then, b gradually recovered to about the value it had in the stage of BS.
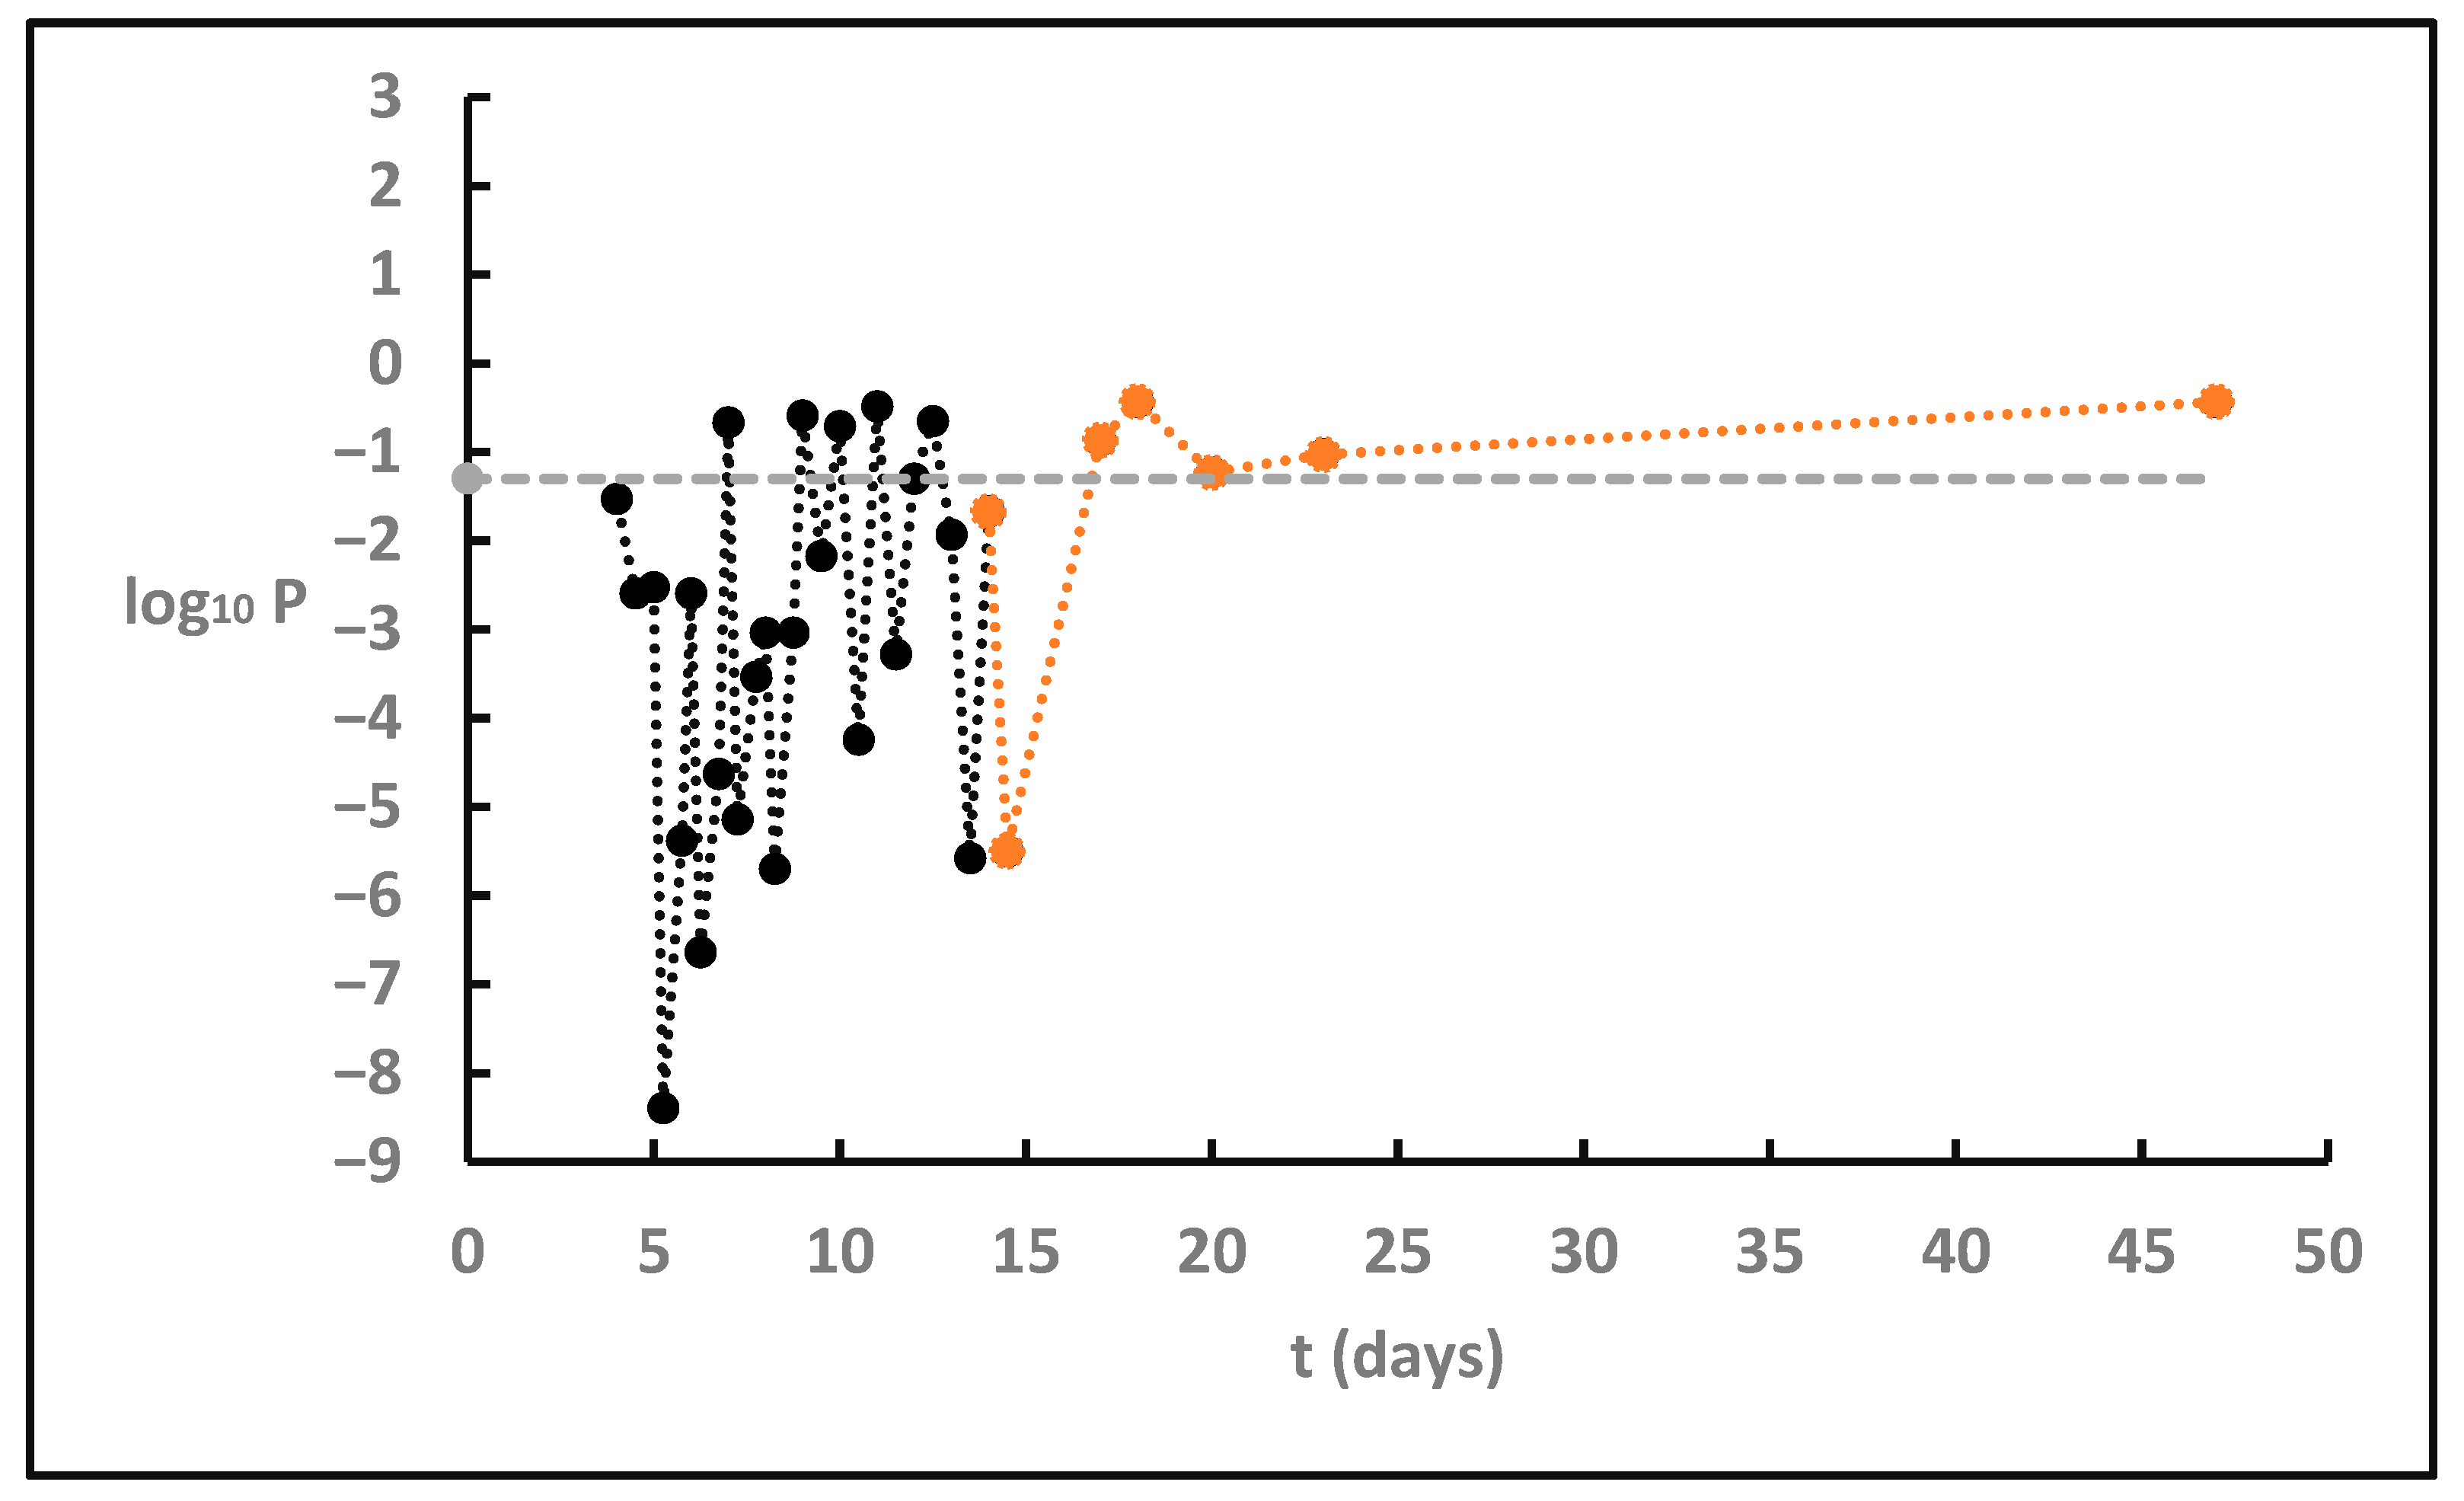
The significance of the b-value changes with respect to the b-value of 1.19 ± 0.11 found in BS was determined in terms of the probability P that two earthquake samples belong to the same mother earthquake population according to the Utsu test (Figure 17). In this comparison, the b-value found for the entire BS stage represented sample 1, while each one of the b-values obtained with the moving window technique for the 2025 cluster represented sample 2 in each of the calculation steps. Significant changes in b were evident during the time interval from t = 4 days to t = 15 days, given that the probability P remained below 0.05 (log10P = −1.3). Furthermore, for the majority of b-values, P values as low as 0.003 (log10P = −2.5) were found. After t = 15 days, values P~0.1 (log10P = −1) were calculated, which indicated no significant changes in b. The very significant drop in b from the time t = 4 days of the cluster was another strong piece of evidence that the ongoing cluster was a foreshock sequence.

4. Discussion

The effort to determine in real time the type of the ongoing 2025 Santorini–Amorgos seismicity cluster encountered several difficulties and was susceptible to a variety of uncertainties. A serious difficulty faced was that the international experience for real-time operational earthquake forecasting is still limited, although important lessons have been learned from the disastrous L’Aquila 2009 earthquake [116,117]. Another major issue was that the cluster developed very rapidly, with hundreds of earthquakes recorded daily. The consequence was that waveforms of many earthquakes were masked by others, thus making the earthquake catalog incomplete below the magnitude Mc = 2.9. A retrospective analysis showed that after the largest earthquake, the Mc gradually dropped (Figure 18), implying improvement in the catalog completeness. This very likely happened because of the reduced number of earthquakes and, at the same time, due to the increase in the seismograph stations installed in the area in the first ten days after the initiation of the seismicity cluster.
These difficulties were balanced by the large number of events inserted in the complete part of the catalog, thus facilitating statistical analysis from the first days of the ongoing cluster. The validity of the results obtained was verified by repeating the daily calculations with the alternative adoption of Mc = 2.7 or Mc = 3.1. Our results were obtained with the use of a non-relocated catalog since we were interested in receiving results in a real-time frame. However, the spatial distribution of the 2025 sequence practically does not change after relocation or after the catalog enrichment with small earthquakes matched by ML techniques performed by the NOA research team [118].
Since the beginning of the Santorini–Amorgos seismic activity, a fundamental issue was whether the spatiotemporal cluster was characterized by the properties of a foreshock sequence or of a swarm. The first results received at time t = 4 days (2 February 2025) favored the foreshock case. This was based on the simultaneous quasi-power-law increase in the seismicity rate, the significant drop in the b-value, and the systematic move of epicenters from SW to NE.
Nevertheless, we wondered whether the cluster would turn into a swarm if the epicenter migration was not due to a foreshock cascading mechanism but driven by a diffusion process. The reason was that the area is situated close to active volcanic centers and has been described as a zone of crustal weakness that could be a likely location for future volcanic activity or may indicate fluid pathways [36]. However, the continuously updated results were further supported by seismotectonic evidence. Namely, moment-tensor solutions for the Santorini–Amorgos earthquakes of about ML = 4.0 or larger were publicly available (https://bbnet.gein.noa.gr/HL/seismicity/mts last accessed on 20 April 2025) since time t = 3 days (1 February 2025). From the very first days of the cluster, the fault-plane solutions clearly indicated normal faulting predominantly striking NE-SW. This pattern (Figure 19) remained unchanged for the majority of earthquakes and was evidence of double-couple seismic sources, thus favoring their tectonic origin in association with the NE-SW striking active faults in the area (Figure 2 and Figure 3).
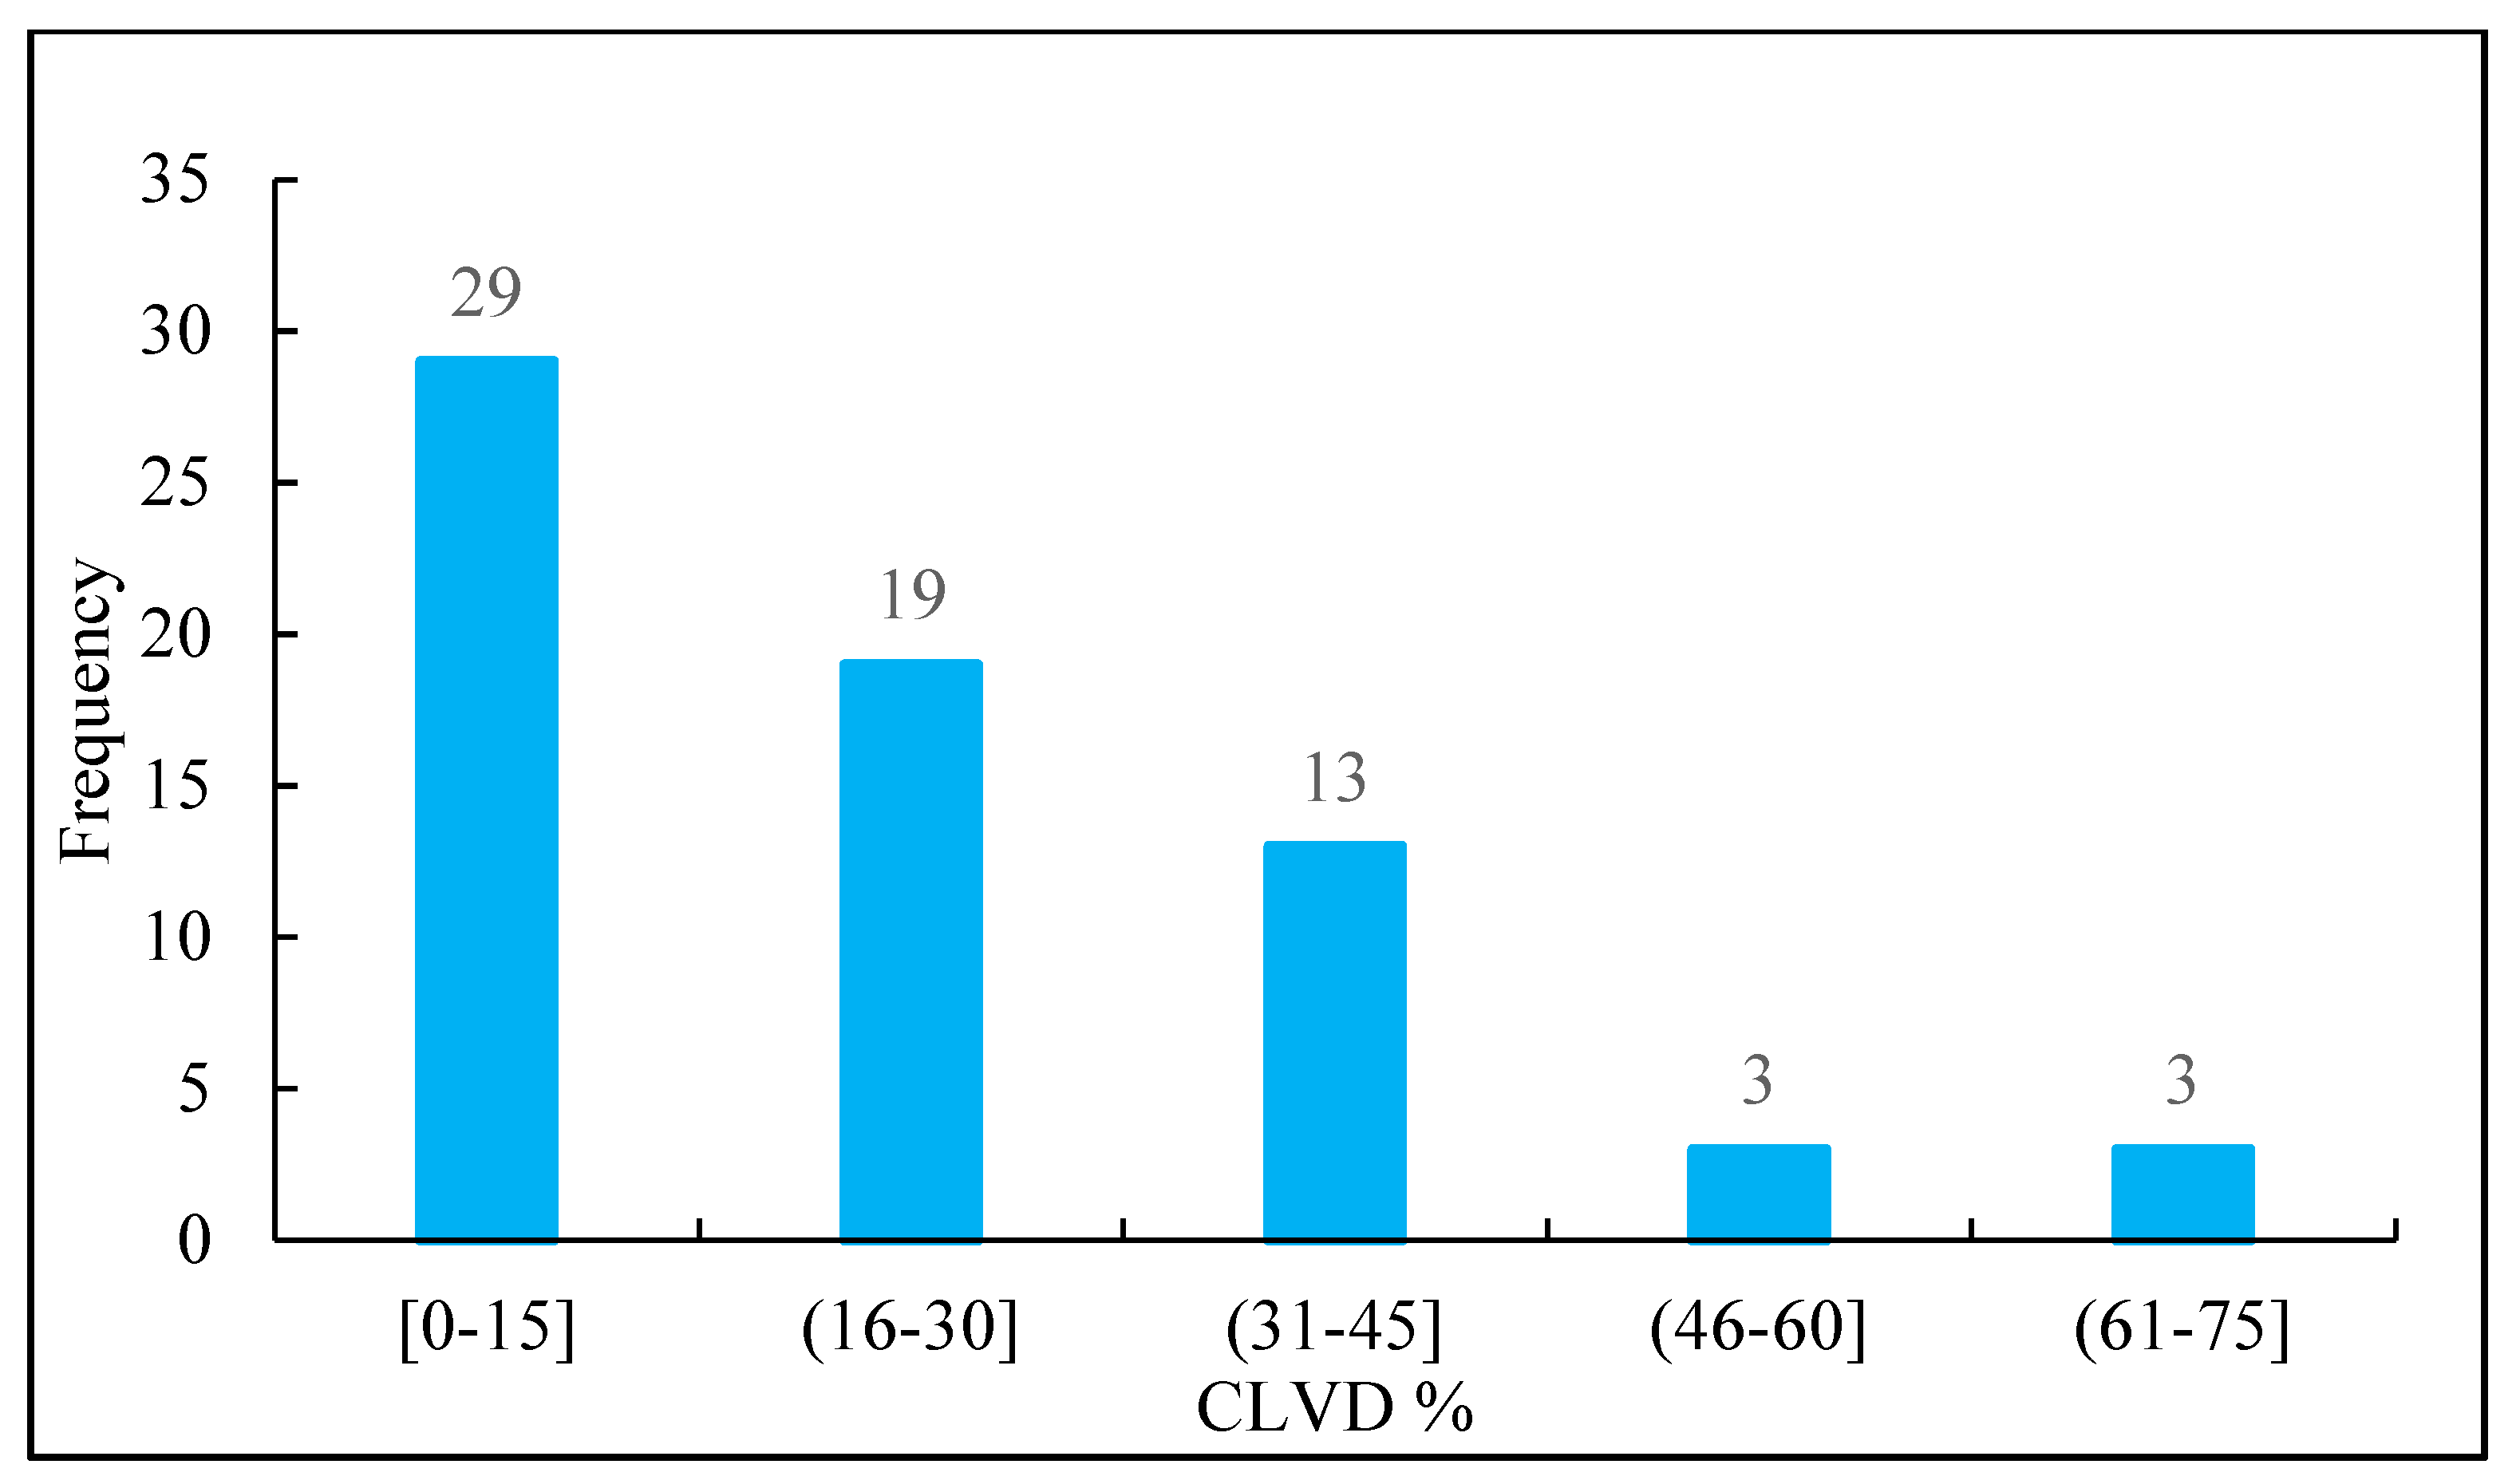
Evidence favoring the tectonic origin of the majority of earthquakes was also investigated through the statistics of the Compensated Linear Vector Dipoles (CLVDs), based on the same set of moment-tensor solutions. CLVDs are a class of non-double-couple seismic sources that in volcanic areas may indicate inflating magma dikes, which can be modeled as a crack opening under tension; see review in [119]. Alternatively, CLVDs could be due to near-simultaneous earthquakes on nearby faults of different geometries. The statistics showed that 43% and 72% of the solutions have CLVD components of less than 15% and less than 30%, respectively (Figure 20). This result disfavors the volcanic origin of the earthquakes. In addition, full-waveform analysis by the NOA team [118] showed that the CLVD component involved in some moment-tensor solutions is perhaps actually smaller.
Figure 19. Rose diagrams of the strikes of Nodal Planes 1 (a) and Nodal Planes 2 (b) resulting from 67 moment-tensor solutions produced by the NOA (https://bbnet.gein.noa.gr/HL/seismicity/mts accessed on 20 April 2025); diagrams constructed with the software developed by [120].
Geosciences 15 00300 g019
Figure 20. Histogram of the percentage of CLVD component in the moment tensor solutions produced by the NOA (https://bbnet.gein.noa.gr/HL/seismicity/mts accessed on 20 April 2025).
Geosciences 15 00300 g020
To examine if the migration of the 2025 Santorini–Amorgos epicenters could be explained by a diffusion process, we compared their migration velocity with the migration velocities observed in seismic swarms associated with volcanic or other processes. The Santorini–Amorgos average migration velocity was 0.72 km/d or ~0.008 m/s, while a maximum velocity of ~1.3 km/d or 0.015 m/s was found during the first days of the activity. A migration velocity of ~0.8 km/h (or 0.22 m/s) was found for earthquake swarms driven by aseismic creep in California [121]. An 11-day volcanic swarm consisting of more than 1000 earthquakes of Mw ≤ 4.9 laterally migrated for ~50 km from the summit caldera of Axial Volcano, central Juan de Fuca Ridge, along the south rift zone of the volcano at rates from 0.23 up to 0.92 m/s [122].
The fact that the migration velocity was by one order of magnitude smaller than the velocities reported for seismic swarms, along with the absence of volcanic mechanisms involved in the earthquake generation, favored the tectonic origin of the Santorini–Amorgos earthquakes. For this reason, in the documentation of our seismicity evaluation, we constantly included the statement that the level of volcanic risk did not increase during the ongoing seismic cluster.
Although the 2025 activity was characterized by typical foreshock features, one may argue that the epicenter’s migration velocity was unusually high for a foreshock mechanism. However, the foreshock migration velocity towards the mainshock observed in other sequences was of the same order [79,98]. In addition, a plausible explanation for the migration velocity observed might be that both the material softening [52] and the foreshock migration were facilitated by a subdiffusion process due to the presence of fluid pathways in the crustal material. This resulted in the unusually high foreshock rate during the first week of the activity and the simultaneous rapid drop in the b-value.
The relative drop in the foreshock activity for about 2–3 days prior to the ML = 5.3 mainshock (t = 12 days, 10 February 2025) is reminiscent of the relative quiescence that prevailed prior to the mainshock in several foreshock sequences [57,73,74] and has been predicted by simulation results [50]. This kind of activity drop has been attributed to the temporary arrest of rupture extension, due to an encounter with fault segments having locally high strengths [50].
Of particular interest is that the foreshock sequence culminated with the mainshock at the northeastern side of the seismic activity but did not expand significantly further during the aftershock period. We suggest that a barrier on the earthquake fault perhaps acted as a stopper of the activity. Aki [114] suggested that barriers that stop an earthquake rupture extension could be geometric or inhomogeneous barriers. A geometric barrier is due to the direction change of structural elements, while an inhomogeneous barrier refers to the stopping point of earthquake rupture where no obvious geometrical discontinuity exists and could be associated with an anomaly of seismic velocity. The concept of fault barrier is not restricted to strong earthquakes but applies to earthquakes even smaller than the ones involved in the Santorini–Amorgos sequence [123]. The 2025 sequence falls in the hanging-wall domain of the SW-NE trending Ios fault (Figure 3), which likely was the main seismogenic structure, although it is likely that segments of other nearby faults, e.g., of the Anydros one, likely activated during 2025. Τhe eastern tip of the Ios fault turns to a WNW-ESE direction, nearly parallel to the southern coast of Amorgos. This feature may indicate a geometrical discontinuity acting as a barrier stopper of the northeastward rupture extension. This is also evident in the distribution of the 10-year background seismicity epicenters (Figure 2), which at the eastern side of the Santorini–Amorgos area stopped at the margin of an aseismic area that hosted the rupture of the 1956 large earthquake.
An unusual feature of the Santorini–Amorgos foreshock–mainshock–aftershock sequence was that the number of foreshocks was at least twice as many as the number of aftershocks. Although it has been found that the number of foreshocks approaches that of aftershocks as the mainshock magnitude becomes smaller [124], the relatively small mainshock of ML = 5.3 does not fully account for the large foreshocks’ number. In terms of fault mechanics, a plausible model for the evolution of a foreshock sequence predicts [72] that the increased shear stresses on creeping (or velocity-strengthening) fault patches resulting from numerous foreshocks make creeping patches more susceptible to future coseismic slip. This process increases the likelihood of larger ruptures and leads to a smaller b-value with time.
Other model simulations [125] showed that more productive foreshock cascades can originate in complex fault zones, particularly if the fault network is dense. In such conditions, the foreshocks are enhanced if interactions among the faults are stronger, e.g., if the main fault is embedded in a complex fault zone with high-density faulting, which is exactly the case in Santorini–Amorgos. Then, earthquake productivity should not be considered identical for foreshocks and aftershocks [125]. Foreshock productivity in the Santorini–Amorgos was perhaps promoted not only by the cascading effects but also by a nucleation process due to aseismic slip related to possible transient geodetic deformation. However, relevant observations and results from GNSS and InSAR are still preliminary [118,126], although transient InSAR deformation was recorded on Amorgos from 2003 to 2019 [127]. A model combining cascading foreshocks with nucleation due to aseismic slip is plausible [128] and has been supported by laboratory experiments [129] and numerical simulations [130]. An important question is why the foreshock activity did not culminate in a large mainshock magnitude. Perhaps the mainshock magnitude was controlled by the relatively small length of the fault segments involved in the faulting process. This is a challenging issue that deserves future examination.

5. Conclusions

The Santorini–Amorgos January–March 2025 seismic sequence was developed several kilometers away from the Nea Kammeni and Kolumbo active volcanoes, but within a dense network of active faults mainly within the seismogenic layer extending from 5 to 15 km in depth. Thousands of shocks were recorded, the largest one (ML = 5.3, Mw = 5.2) occurring on 10 February 2025 near the Anydros islet. This sequence offered an excellent case to test our capabilities for discriminating in real-time between possible types of an ongoing seismic cluster using earthquake statistics supported by complex network tools. This case turned into a successful methodological experiment that involved not only daily re-evaluation of the seismicity state but also full public documentation of the results. The experiment was performed under a social situation highly charged not only by the extreme concern of the population and of the governmental authorities, but also because of the many different public statements expressed by scientists about forthcoming large earthquakes and volcanic eruptions.
We introduced a strategy based on two main pillars. The first is that foreshocks, aftershocks, and swarms are characterized by separate 3D space–time–magnitude patterns. The second pillar was a day-by-day monitoring of the 3D changes during the ongoing cluster, aiming to recognize patterns that fit the observational seismicity data. The 3D features of the background seismicity in the same area were used as the reference seismicity state for testing significant changes during the ongoing cluster.
As early as the third day of the cluster (1 February 2025), we recognized that the entire background seismicity represented a steady-state activity with a seismicity rate of ~0.03 events/day and parameter b = 1.19 ± 0.11 for completeness magnitude threshold Mc = 2.9.
On the fourth day of the cluster, we were able to detect that the ongoing sequence was characterized by typical foreshock patterns, i.e., by quasi-power-law acceleration of the seismicity rate that culminated with 120 and 161 events/day on the fourth and seventh days, respectively, and by a gradual drop in the b-value to the level of 0.72 ± 0.02. These changes were highly significant as compared to the respective values observed during the background seismicity. The high power-law exponent of 2.45 found in the first week of the foreshock sequence is indicative of the very rapid increase in the foreshock rate, which possibly was favored by the dense fault network in the area.
At the same time, we detected additional foreshock features such as the temporary drop in the seismicity rate in the last ~3 days before the largest shock. Another important feature detected during the ongoing cluster was the gradual migration of the activity from SW to NE, shaping a ~25 km long seismic zone with an average migration velocity of ~0.72 km/day. This feature favored the interpretation that the 2025 cluster was a cascading foreshock sequence with progressive stress transfer along a pre-stressed zone. The migration velocity was an order of magnitude smaller than the one needed for a swarm caused by diffusion processes, thus indicating rather a subdiffusion process which possibly was facilitated by fluid pathways.
Because of the above seismicity features, we constantly supported the foreshock case until the stronger shock occurred on 10 February and rejected the case of an evolving swarm, even when it was the most favored scenario in the public statements of other scientists.
Three days after the mainshock, we were able to recognize the Omori-type power-law decay of a typical aftershock sequence. We found a decay exponent of 1.31, which implies a relatively rapid activity decrease. The aftershock activity did not expand significantly eastwards, likely because of a barrier that stopped rupture propagation.
Our evaluations were additionally supported by the evidence for the tectonic, non-volcanic origin of the earthquakes based on (1) the similarity of their normal faulting striking SW-NE according to moment tensor solutions, (2) the relatively low CLDV component involved in the same solutions, and (3) the absence of volcanic earthquakes in the seismic records. For these reasons, during the ongoing cluster, we also evaluated that the level of the volcanic hazard did not elevate.
The successful 2025 methodological experiment with the Santorini–Amorgos sequence is a promising framework for improving our capabilities in real-time operational earthquake forecasting and short-term hazard assessment.

Author Contributions

Conceptualization, I.T.; methodology, all; software, I.T., C.S., and K.S.; data curation, G.A.P.; writing—original draft preparation, I.T.; writing—review and editing, all. All authors have read and agreed to the published version of the manuscript.

Funding

This research received no external funding.

Institutional Review Board Statement

Not applicable.

Informed Consent Statement

Not applicable.

Data Availability Statement

Links for seismological, fault, and bathymetry data used are provided in the main text and legends.

Acknowledgments

We are grateful for the editor’s careful handling of the manuscript. We are grateful to the four anonymous reviewers for their insightful comments and suggestions, which greatly improved the manuscript. Maps in Figure 1, Figure 2 and Figure 3 have been produced with the use of ArcMap 10.1. Figure 5, Figure 6, Figure 7, Figure 9, Figure 10, Figure 11a, Figure 14b, Figure 16b and Figure 18 were produced with the use of the z-map toolbox [101]. Figure 8 and Figure 13 were produced with in-house software. Figure 19 was produced with the use of Orient software, v 3.24.

Conflicts of Interest

The authors declare no conflicts of interest.

Appendix A

In the next lines, we shortly summarize the real-time evaluation of the Santorini–Amorgos January–March 2025 seismic cluster as documented in reports and mass media statements.
Day 4 (2 February 2025). Statement in mass media: “The earthquake activity has all the characteristic features of a foreshock sequence”, e.g., https://www.dnews.gr/eidhseis/ellada/510081/gerasimos-papadopoulos-ola-anoixta-anamenoume-ton-kyrio-seismo-metaksy-santorinis-amorgoy (accessed on 21 April 2025).
Day 5 (3 February 2025). Statement in mass media: “A clear foreshock sequence is ongoing”, e.g., https://www.tovima.gr/2025/02/03/society/papadopoulos-gia-seismous-vriskomaste-se-safi-proseismiki-akolouthia/ (accessed on 21 April 2025).
Day 6 (4 February 2025). Article in the Athens newspaper TA NEA: “We are at the state of foreshock sequence”, https://www.tanea.gr/2025/02/04/opinions/vriskomaste-se-proseismiki-akolouthia-online/ (accessed on 21 April 2025).
Day 6 (4 February 2025). Detailed report of three pages submitted via email to the Ministry of Climate Change and Civil Protection and to the Earthquake Planning and Protection Organization. The summary reads as follows: The ongoing seismic activity since 1 Febr. 2025 is characterized by (1) the high increase in the earthquake number, (2) the gradual magnitude increase, with the highest magnitude so far being 5.0, and (3) the epicenter’s migration from SW to NE. These features are typical for foreshock sequences and, therefore, we are facing a rapidly evolving foreshock sequence, which at a high probability level foreshadows the generation of an even stronger earthquake.
Day 8 (6 February 2025). Statement in mass media after the earthquake of ML = 5.2 on 5 Febr.: “The ongoing foreshock sequence has been verified”, e.g., https://www.real.gr/koinonia/arthro/gerasimos_papadopoulos_o_seismos_5_2_rixter_epalitheuse_tin_ektimisi_mou_briskomaste_se_proseismiki_akolouthia-1088738/ accessed on 21 April 2025).
Days 9 to 11 (7 to 10 February 2025). That was a crucial time interval until the occurrence of the mainshock of ML = 5.3 on the evening of 11 February. In our public statements (e.g., the previous one on Day 8), we remained quite skeptical, underlying that no conclusive result was obtained if the foreshock was still ongoing or the aftershock sequence had started.
Day 15 (13 February 2025). Statement in fb after the mainshock of ML = 5.3 on 10 Febr. 20:16 UTC and its strong aftershock of ML = 5.0 on 12 Febr. 03:14 UTC: “We observe significant drop in the earthquakes number and magnitudes”; https://www.facebook.com/permalink.php?story_fbid=pfbid02uWLYykJBszNWkzCbdaQhkyRrxra1Zo237ogVRoHBZ6LsPds8aP6oL9vFwWFYCvHgl& id=100014233710134 accessed on 21 April 2025).
Day 24 (22 February 2025). Report submitted via email to the Ministry of Climate Change and Civil Protection and to the Earthquake Planning and Protection Organization. The summary reads as follows: “After the largest earthquake of ML = 5.3 on 10 Febr. the recorded seismicity is characterized by systematic drop in the seismicity rate and significant increase in the b-value”.

References

  1. Papadopoulos, G.A.; Charalampakis, M.; Fokaefs, A.; Minadakis, G. Strong foreshock signal preceding the L’Aquila (Italy) earthquake (Mw6.3) of 6 April 2009. Nat. Hazards Earth Syst. Sci. 2010, 10, 19–24. [Google Scholar] [CrossRef]
  2. Gulia, L.; Wiemer, S. Real-time discrimination of earthquake foreshocks and aftershocks. Nature 2019, 574, 193–199. [Google Scholar] [CrossRef]
  3. Dascher-Cousineau, K.; Lay, T.; Brodsky, E.E. Two Foreshock Sequences Post Gulia and Wiemer. Seismol. Res. Lett. 2020, 91, 2843–2850. [Google Scholar] [CrossRef]
  4. Druitt, T.; Mellors, R.; Pyle, D.; Sparks, R. Explosive volcanism on Santorini, Greece. Geol. Mag. 1989, 126, 95–126. [Google Scholar] [CrossRef]
  5. Friedrich, W.L. Fire in the Sea; Cambridge University Press: Cambridge, UK, 2000; 258p. [Google Scholar]
  6. McCoy, F.W.; Heiken, G. (Eds.) The Late-Bronze Age explosive eruption of Thera (Santorini), Greece: Regional and local effects. In Volcanic Hazards and Disasters in Human Antiquity; Geological Society of America: Boulder, Colorado, 2000. [Google Scholar] [CrossRef]
  7. Galanopoulos, A. The damaging shocks and the earthquake potential of Greece. Ann. Geol. Pays Hellen. 1982, 30, 648–724, (In Greek with English Abstract). [Google Scholar]
  8. Papadopoulos, G.A.; Pavlides, S.B. The large 1956 earthquake in the South Aegean: Macroseismic field configuration, faulting, and neotectonics of Amorgos Island. Earth Planet. Sci. Lett. 1992, 113, 383–396. [Google Scholar] [CrossRef]
  9. Papadopoulos, G.A. Tsunamis in the European-Mediterranean Region-From Historical Record to Risk Mitigation; Elsevier: Amsterdam, The Netherlands, 2016; 271p. [Google Scholar]
  10. McClusky, S.; Balassanian, S.; Barka, A.; Demir, C.; Ergintav, S.; Georgiev, I.; Gurkan, O.; Hamburger, M.; Hurst, K.; Kahle, H.; et al. Global Positioning System constraints on plate kinematics and dynamics in the eastern Mediterranean and Caucasus. J. Geophys. Res. 2000, 105, 5695–5719. [Google Scholar] [CrossRef]
  11. Bocchini, G.M.; Brüstle, A.; Becker, D.; Meier, T.; van Keken, P.E.; Ruscic, M.; Papadopoulos, G.A.; Rische, M.; Friederich, W. Tearing, segmentation, and backstepping subduction in the Aegean: New insights from seismicity. Tectonophysics 2018, 734–735, 96–118. [Google Scholar] [CrossRef]
  12. International Seismological Centre. The ISC-GEM Global Instrumental Earthquake Catalogue, Version 11.0-Released on 2024-06-25. Available online: http://www.isc.ac.uk/iscgem/download.php (accessed on 6 May 2025).
  13. Makropoulos, K.; Kaviris, G.; Kouskouna, V. An updated and extended earthquake catalogue for Greece and adjacent areas since 1900. Nat. Hazards Earth Syst. Sci. 2012, 12, 1425–1430. [Google Scholar] [CrossRef]
  14. GCMT: Global CMT Catalog. Available online: https://www.globalcmt.org/CMTsearch.html (accessed on 6 May 2025).
  15. Brüstle, A.; Friederich, W.; Meier, T.; Gross, C. Focal mechanism and depth of the 1956 Amorgos twin earthquakes from waveform matching of analogue seismograms. Solid Earth 2014, 5, 1027–1044. [Google Scholar] [CrossRef]
  16. EMODnet Digital Bathymetry (DTM 2024). EMODnet Bathymetry Consortium. Available online: https://sextant.ifremer.fr/record/cf51df64-56f9-4a99-b1aa-36b8d7b743a1/ (accessed on 20 April 2025).
  17. Papathoma-Köhle, M. Letter to the Editor: Latest earthquakes in Santorini reveal the need for a multi-hazard and multi-vulnerability approach to disaster risk reduction. Nat. Hazards 2025, 121, 11215–11220. [Google Scholar] [CrossRef]
  18. Ganas, A. NOAFAULTS KMZ Layer Version 5.0 (V5.0) [Data Set]. Zenodo 2023. Available online: https://zenodo.org/records/8075517 (accessed on 20 April 2025).
  19. McKenzie, D. Active tectonics of the Alpine-Himalayan belt: The Aegean Sea and surrounding regions. Geophys. J. R. Astron. Soc. 1978, 55, 217–254. [Google Scholar] [CrossRef]
  20. Kapetanidis, V.; Kassaras, I. Contemporary crustal stress of the Greek region deduced from earthquake focal mechanisms. J. Geodyn. 2019, 123, 55–82. [Google Scholar] [CrossRef]
  21. Minoura, K.; Imamoura, F.; Kuran, U.; Nakamura, T.; Papadopoulos, G.A.; Takahashi, T.; Yalciner, A.C. Discovery of Minoan tsunami deposits. Geology 2000, 28, 59–62. [Google Scholar] [CrossRef]
  22. Vougioukalakis, G.; Sbrana, A.; Mitropoulos, D. The 1649–50 Kolumbo submarine volcano activity, Santorini, Greece. In The European Laboratory Volcanoes: Workshop Proceedings; Barberi, F., Casale, R., Fratta, M., Eds.; European Science Commission: Luxembourg, 1995; pp. 189–192. [Google Scholar]
  23. Dominey-Howes, D.T.M.; Papadopoulos, G.A.; Dawson, A.G. Geological and historical investigation of the 1650 Mt. Columbo (Thera Island) eruption and tsunami, Aegean Sea, Greece. Nat. Hazards 2000, 21, 83–96. [Google Scholar] [CrossRef]
  24. Galanopoulos, A.G. The seismic sea wave of 9 July 1956. Prakt. Akad. Athens 1957, 32, 90–101, (In Greek with English Abstract). [Google Scholar]
  25. Ambraseys, N.N. The seismic sea wave of 9 July 1956 in the Greek Archipelago. J. Geophys. Res. 1960, 65, 1257–1265. [Google Scholar] [CrossRef]
  26. Papadopoulos, G.A.; Imamura, F.; Minoura, K.; Takahashi, T.; Karakatsanis, S.; Fokaefs, A.; Orfanogiannaki, K.; Daskalaki, E.; Diakogianni, G. The 9 July 1956 large tsunami in the south Aegean Sea: Compilation of a data basis and re-evaluation. In Proceedings of the 22nd International IUGG Tsunami Symposium, Chania, Greece, 27–29 June 2005; pp. 173–180. [Google Scholar]
  27. Okal, E.A.; Synolakis, C.E.; Uslu, B.; Kalligeris, N.; Voukouvalas, E. The 1956 earthquake and tsunami in Amorgos, Greece. Geophys. J. Internat. 2009, 178, 1533–1554. [Google Scholar] [CrossRef]
  28. Papadopoulos, G.A.; Gràcia, E.; Urgeles, R.; Sallares, V.; De Martini, P.M.; Pantosti, D.; González, M.; Yalciner, A.C.; Mascle, J.; Sakellariou, D.; et al. Historical and pre-historical tsunamis in the Mediterranean and its connected seas: Geological signatures, generation mechanisms and coastal impacts. Mar. Geol. 2014, 354, 81–109. [Google Scholar] [CrossRef]
  29. Perissoratis, C.; Papadopoulos, G.A. Sediment instability and slumping in the southern Aegean Sea and the case history of the 1956 tsunami. Mar. Geol. 1999, 161, 287–305. [Google Scholar] [CrossRef]
  30. Nomikou, P.; Hübscher, C.; Papanikolaou, D.; Farangitakis, G.P.; Ruhnau, M.; Lampridou, D. Expanding extension, subsidence and lateral segmentation within the Santorini-Amorgos basins during Quaternary: Implications for the 1956 Amorgos events, central-south Aegean Sea, Greece. Tectonophysics 2017, 722, 138–153. [Google Scholar] [CrossRef]
  31. Leclerc, F.; Palagonia, S.; Feuillet, N.; Nomikou, P.; Lampridou, D.; Barrière, P.; Dano, A.; Ochoa, E.; Gracias, N.; Escartin, J. Large seafloor rupture caused by the 1956 Amorgos tsunamigenic earthquake, Greece. Commun. Earth Environ. 2024, 5, 663. [Google Scholar] [CrossRef]
  32. Papazachos, B.C.; Delibasis, N.D. Tectonic stress field and seismic faulting in the area of Greece. Tectonophysics 1969, 7, 231–255. [Google Scholar] [CrossRef]
  33. Ritsema, A.R. Earthquake mechanisms of the Balkan region. R. Neth. Meteorol. Inst. Sci. Rep. 1974, 74, 97. [Google Scholar]
  34. Shirokova, E.I. Stress pattern and probable motion in the earthquake loci of the Asia-Mediterranean seismic belt. In Elastic Strain Field of the Earth and Mechanisms of Earthquake Sources; Balakina, L.M., Misharina, L.A., Vvedenskaya, A.V., Eds.; Nauka: Moscow, Russia, 1972. [Google Scholar]
  35. Tsampouraki-Kraounaki, K.; Sakellariou, D.; Rousakis, G.; Morfis, I.; Panagiotopoulos, I.; Livanos, I.; Manta, K.; Paraschos, F.; Papatheodorou, G. The Santorini-Amorgos Shear Zone: Evidence for Dextral Transtension in the South Aegean Back-Arc Region, Greece. Geosciences 2021, 11, 216. [Google Scholar] [CrossRef]
  36. Bohnhoff, M.; Rische, M.; Meier, T.; Becker, D.; Stavrakakis, G.; Harjes, H.-P. Microseismic activity in the Hellenic Volcanic Arc, Greece, with emphasis on the seismotectonic setting of the Santorini-Amorgos zone. Tectonophysics 2006, 423, 17–33. [Google Scholar] [CrossRef]
  37. Hufstetler, R.S.; Hooft, E.E.E.; Toomey, D.R.; VanderBeek, B.P.; Papazachos, C.B.; Chatzis, N. Seismic structure of the mid to upper crust at the Santorini-Kolumbo magma system from joint earthquake and active source Vp-Vs tomography. Geochem. Geophys. Geosyst. 2025, 26, e2024GC012022. [Google Scholar] [CrossRef]
  38. Papadimitriou, P.; Kapetanidis, V.; Karakonstantis, A.; Kaviris, G.; Voulgaris, N.; Makropoulos, K. The Santorini Volcanic Complex: A detailed multi-parameter seismological approach with emphasis on the 2011–2012 unrest period. J. Geodyn. 2015, 85, 32–57. [Google Scholar] [CrossRef]
  39. Mogi, K. Some discussion on aftershocks, foreshocks and earthquake swarms—The fracture of a semi-infinite body caused by an inner stress origin and its relation to the earthquake phenomena (3rd paper). Bull. Earthq. Res. Inst. Univ. Tokyo 1963, 41, 615–658. [Google Scholar]
  40. Mogi, K. Earthquake Prediction, 1st ed.; Academic Press: Tokyo, Japan, 1985; 355p. [Google Scholar]
  41. Ogata, Y.; Utsu, T.; Katsura, K. Statistical discrimination of foreshocks from other earthquake clusters. Geophys. J. Int. 1996, 127, 17–30. [Google Scholar] [CrossRef]
  42. Van der Elst, N.J. b-positive: A robust estimator of aftershock magnitude distribution in transiently incomplete catalogs. J. Geophys. Res. 2021, 126, e2020JB021027. [Google Scholar] [CrossRef]
  43. Ishimoto, M.; Iida, K. Observations of earthquakes registered with the microseismograph constructed recently. Bull. Earthq. Res. Inst. Univ. Tokyo 1939, 17, 443–478. [Google Scholar]
  44. Gutenberg, B.; Richter, C. Frequency of earthquakes in California. Bull. Seism. Soc. Am. 1944, 34, 185–188. [Google Scholar] [CrossRef]
  45. Frohlich, C.; Davis, S.D. Teleseismic b values; or, much ado about 1.0. J. Geophys. Res. 1993, 98, 631–644. [Google Scholar] [CrossRef]
  46. Schorlemmer, D.; Wiemer, S.; Wyss, M. Variations in earthquake-size distribution across different stress regimes. Nature 2005, 437, 539–542. [Google Scholar] [CrossRef]
  47. Scholz, C.H. Microfractures, Aftershocks, and Seismicity. Bull. Seism. Soc. Am. 1968, 58, 1117–1130. [Google Scholar]
  48. Enescu, B.; Ito, K. The 1998 Hida Mountain, Central Honshu, Japan, earthquake swarm: Double-difference event relocation, frequency-magnitude distribution and Coulomb stress changes. Tectonophysics 2005, 409, 147–157. [Google Scholar] [CrossRef]
  49. Abercrombie, R.E.; Mori, J. Occurrence patterns of foreshocks to large earthquakes in the western United States. Nature 1996, 381, 303–307. [Google Scholar] [CrossRef]
  50. Yamashita, T. Simulation of seismicity due to fluid migration in a fault zone. Geophys. J. Int. 1998, 132, 674–686. [Google Scholar] [CrossRef]
  51. Olami, Z.; Feder, H.; Christensen, K. Self-organized criticality in a continuous, non-conservative cellular automaton modeling earthquakes. Phys. Rev. Lett. 1992, 68, 1244–1247. [Google Scholar] [CrossRef]
  52. Avlonitis, Μ.; Papadopoulos, G.A. Foreshocks and b-value: Bridging macroscopic observations to source mechanical considerations. Pure Appl. Geophys. 2014, 171, 2569–2580. [Google Scholar] [CrossRef]
  53. Suyehiro, S.; Sekiya, H. Foreshocks and earthquake prediction. Tectonophysics 1972, 14, 219–225. [Google Scholar] [CrossRef]
  54. Papazachos, B.C. Foreshocks and earthquake prediction. Tectonophysics 1975, 28, 213–226. [Google Scholar] [CrossRef]
  55. Ishida, M.; Kanamori, H. The foreshock activity of the 1971 San Fernando earthquake. California. Bull. Seism. Soc. Am. 1978, 68, 1265–1279. [Google Scholar] [CrossRef]
  56. Kagan, Y.; Knopoff, L. Statistical study of the occurrence of shallow earthquakes. Geophys. J. R. Astron. Soc. 1978, 55, 67–86. [Google Scholar] [CrossRef]
  57. Jones, L.M.; Molnar, P. Some characteristics of foreshocks and their possible relationship to earthquake prediction and premonitory slip on faults. J. Geophys. Res. 1979, 84, 3596–3608. [Google Scholar] [CrossRef]
  58. Maeda, K. Time distribution of immediate foreshocks obtained by a stacking method. Pure Appl. Geophys. 1999, 155, 381–394. [Google Scholar] [CrossRef]
  59. Yamaoka, K.; Ooida, T.; Ueda, Y. Detailed distribution of accelerating foreshocks before a M 5.1 earthquake in Japan. Pure Appl. Geophys. 1999, 155, 335–353. [Google Scholar] [CrossRef]
  60. Papadopoulos, G.A.; Drakatos, G.; Plessa, A. Foreshock activity as a precursor of strong earthquakes in Corinthos Gulf, Central Greece. Phys. Chem. Earth 2000, 25, 239–245. [Google Scholar] [CrossRef]
  61. Raykova, P.; Solakov, D.; Simeonova, S. A statistical study of the MW5.3 Valandovo (northern Macedonia) earthquake seismic sequence. Boll. Geofis. Teor. Appl. 2019, 60, 443–456. [Google Scholar]
  62. Matsumoto, S.; Iio, Y.; Sakai, S.; Kato, A. Strength dependency of frequency–magnitude distribution in earthquakes and implications for stress state criticality. Nat. Commun. 2024, 15, 4957. [Google Scholar] [CrossRef]
  63. Wetzler, N.; Lay, T.; Brodsky, E.E. Global Characteristics of Observable Foreshocks for Large Earthquakes. Seismol. Res. Lett. 2023, 94, 2313–2325. [Google Scholar] [CrossRef]
  64. Bressan, G.; Barnaba, C.; Peresan, A.; Rossi, G. Anatomy of seismicity clustering from parametric space-time analysis. Phys. Earth Planet. Inter. 2021, 320, 106787. [Google Scholar] [CrossRef]
  65. Mogi, K. The fracture of a semi-infinite body caused by an inner stress origin and its relation to the earthquake phenomena (2nd paper). Bull. Earthq. Res. Inst. Univ. Tokyo 1963, 41, 595–614. [Google Scholar]
  66. Yamashita, F.; Fukuyama, E.; Xu, S.; Kawakata, H.; Mizoguchi, K.; Takizawa, S. Two end-member earthquake preparations illuminated by foreshock activity on a meter-scale laboratory fault. Nat. Commun. 2021, 12, 4302. [Google Scholar] [CrossRef]
  67. Hainzl, S.; Zoller, G.; Kurths, J. Similar power laws for foreshock and aftershock sequences in a spring-block model for earthquakes. J. Geophys. Res. 1999, 104, 7243–7253. [Google Scholar] [CrossRef]
  68. Lei, X.; Li, S.; Liu, L. Seismic b-Value for Foreshock AE Events Preceding Repeated Stick-Slips of Pre-Cut Faults in Granite. Appl. Sci. 2018, 8, 2361. [Google Scholar] [CrossRef]
  69. Dong, L.; Zhang, L.; Liu, H.; Du, K.; Liu, X. Acoustic Emission b Value Characteristics of Granite under True Triaxial Stress. Mathematics 2022, 10, 451. [Google Scholar] [CrossRef]
  70. Main, I. Apparent breaks in scaling in the earthquake cumulative frequency-magnitude distribution: Fact or artifact? Bull. Seism. Soc. Am. 2000, 90, 86–97. [Google Scholar] [CrossRef]
  71. Yamashita, T.; Knopoff, L. A model of foreshock occurrence. Geophys. J. Int. 2007, 96, 389–399. [Google Scholar] [CrossRef]
  72. Ito, R.; Kaneko, Y. Physical mechanism for a temporal decrease of the Gutenberg-Richter b-value prior to a large earthquake. J. Geophys. Res. 2023, 128, e2023JB027413. [Google Scholar] [CrossRef]
  73. Papadopoulos, G.A.; Latoussakis, I.; Daskalaki, E.; Diakogianni, G.; Fokaefs, A.; Kolligri, M.; Liadopoulou, K.; Orfanogiannaki, K.; Pirentis, A. The East Aegean Sea strong earthquake sequence of October-November 2005: Lessons learned for earthquake prediction from foreshocks. Nat. Hazards Earth Syst. Sci. 2006, 6, 895–901. [Google Scholar] [CrossRef]
  74. Triantafyllou, I.; Karavias, A.; Koukouvelas, I.; Papadopoulos, G.A.; Parcharidis, I. The Crete Isl. (Greece) Mw6.0 Earthquake of 27 September 2021: Expecting the Unexpected. GeoHazards 2022, 3, 106–124. [Google Scholar] [CrossRef]
  75. Engdahl, E.R.; Kisslinger, C. Seismological Precursors to a Magnitude Earthquake in the Central Aleutian Islands. J. Phys. Earth 1977, 25, 243–250. [Google Scholar] [CrossRef]
  76. Chen, Y.; Liu, J.; Ge, H. Pattern Characteristics of Foreshock Sequences. Pure Appl. Geophys. 1999, 155, 395–408. [Google Scholar] [CrossRef]
  77. Kato, A.; Obara, K.; Igarashi, T.; Tsuruoka, H.; Nakagawa, S.; Hirata, N. Propagation of slow slip leading up to the 2011 Mw 9.0 Tohoku-Oki earthquake. Science 2012, 335, 705–708. [Google Scholar] [CrossRef]
  78. Lippiello, E.; Marzocchi, W.; De Arcangelis, L.; Godano, C. Spatial organization of foreshocks as a tool to forecast large earthquakes. Sci. Rep. 2012, 2, 846. [Google Scholar] [CrossRef] [PubMed]
  79. Papadopoulos, G.A.; Minadakis, G. Foreshock Patterns Preceding Great Earthquakes in the Subduction Zone of Chile. In Geodynamics of the Latin American Pacific Margin; Springer Nature: Berlin/Heidelberg, Germany, 2016. [Google Scholar] [CrossRef]
  80. Kato, A.; Fukuda, J.; Nakagawa, S.; Obara, K. Foreshock migration preceding the 2016 Mw7.0 Kumamoto earthquake, Japan. Geophys. Res. Lett. 2016, 43, 8945–8953. [Google Scholar] [CrossRef]
  81. Papadopoulos, G.A.; Agalos, A.; Minadakis, G.; Triantafyllou, I.; Krassakis, P. Short-Term Foreshocks as Key Information for Mainshock Timing and Rupture: The Mw6.8 25 October 2018 Zakynthos Earthquake, Hellenic Subduction Zone. Sensors 2020, 20, 5681. [Google Scholar] [CrossRef]
  82. Suzuki, T.; Matsukawa, H. Self-organized first-order transition from foreshock to mainshock in earthquake sequences induced by heat, fluid pressure, and porosity. Eur. Phys. J. 2025, 98, 67. [Google Scholar] [CrossRef]
  83. Peng, Z.; Lei, X. Physical mechanisms of earthquake nucleation and foreshocks: Cascade triggering, aseismic slip, or fluid flows? Earthq. Res. Adv. 2024, 5, 100349. [Google Scholar] [CrossRef]
  84. Utsu, T.; Ogata, Y.; Matsuura, R. The centenary of the Omori formula for a decay law of aftershocks activity. J. Phys. Earth 1995, 43, 1–33. [Google Scholar] [CrossRef]
  85. Ogata, Y.; Katsura, K. Comparing foreshock characteristics and foreshock forecasting in observed and simulated earthquake catalogs. J. Geophys. Res. 2014, 119, 8457–8477. [Google Scholar] [CrossRef]
  86. Tamaribuchi, K.; Yagi, Y.; Enescu, B.; Hirano, S. Characteristics of foreshock activity inferred from the JMA earthquake catalog. Earth Planets Space 2018, 70, 90. [Google Scholar] [CrossRef]
  87. Tormann, T.; Enescu, B.; Woessner, J.; Wiemer, S. Randomness of megathrust earthquakes implied by rapid stress recovery after the Japan earthquake. Nat. Geosci. 2015, 8, 152–158. [Google Scholar] [CrossRef]
  88. Tormann, T.; Wiemer, S.; Metzger, S.; Michael, A.; Hardebeck, J.L. Size distribution of Parkfield’s microearthquakes reflects changes in surface creep rate. Geophys. J. Int. 2013, 193, 1474–1478. [Google Scholar] [CrossRef]
  89. Tormann, T.; Wiemer, S.; Mignan, A. Systematic survey of high-resolution b value imaging along Californian faults: Inference on asperities. J. Geophys. Res. 2014, 119, 2029–2054. [Google Scholar] [CrossRef]
  90. Wiemer, S.; Wyss, M. Mapping spatial variability of the frequency-magnitude distribution of earthquakes. Adv. Geo-Phys. 2002, 45, 259–302. [Google Scholar] [CrossRef]
  91. Wiemer, S.; Katsumata, K. Spatial variability of seismicity parameters in aftershock zones. J. Geophys. Res. 1999, 104, 13135–13151. [Google Scholar] [CrossRef]
  92. McNutt, S.R. Seismic monitoring and eruption forecasting of volcanoes: A review of the state-of-the-art and case histories. In Monitoring and Mitigation of Volcano Hazards; Scarpa, R., Tilling, R.I., Eds.; Springer: Berlin/Heidelberg, Germany, 1996; pp. 99–146. [Google Scholar] [CrossRef]
  93. Hamdache, M.; Peláez, J.A.; Henares, J.; Damerdji, Y.; Sawires, R. Analysis of the 2012–2013 Torreperogil-Sabiote seismic swarm. Phys. Chem. Earth 2016, 95, 101–112. [Google Scholar] [CrossRef]
  94. Stankova, J.; Bilek, S.L.; Rowe, C.A.; Aster, R.C. Characteristics of the October 2005 Microearthquake Swarm and Reactivation of Similar Event Seismic Swarms over Decadal Time Periods near Socorro, New Mexico. Bull. Seismol. Soc. Am. 2008, 98, 93–105. [Google Scholar] [CrossRef]
  95. Yamashita, T. Pore Creation due to Fault Slip in a Fluid-permeated Fault Zone and its Effect on Seismicity: Generation Mechanism of Earthquake Swarm. Pure Appl. Geophys. 1999, 155, 625–647. [Google Scholar] [CrossRef]
  96. Shapiro, S.A.; Dinske, C. Scaling of seismicity induced by nonlinear fluid-rock interaction. J. Geophys. Res. 2009, 114, 1–14. [Google Scholar] [CrossRef]
  97. Naoi, M.; Nakatani, M.; Horiuchi, S.; Yabe, Y.; Philipp, J.; Kgarume, T.; Morema, G.; Khambule, S.; Masakale, T.; Ribeiro, L.; et al. Frequency-Magnitude Distribution of −3.7≤ Mw≤ 1 Mining-Induced Earthquakes Around a Mining Front and b Value In-variance with Post-Blast Time. Pure Appl. Geophys. 2014, 171, 2665–2684. [Google Scholar] [CrossRef]
  98. Papadopoulos, G.A.; Minadakis, G.; Orfanogiannaki, K. Short-Term Foreshocks and Earthquake Prediction. In Atmospheric and Ionospheric Electromagnetic Phenomena Associated with Earthquakes; Ouzounov, D., Pulinets, S., Hattori, K., Taylor, P., Freund, F., Eds.; AGU Geophysical Monograph Series, 1st ed.; John Wiley & Sons, Inc.: Hoboken, NJ, USA, 2018; pp. 127–147. [Google Scholar] [CrossRef]
  99. Triantafyllou, I.; Papadopoulos, G.A. A Unique Seismic Cluster near Santorini, Greece, very Likely a Foreshock Sequence. Report, European-Mediterranean Seismological Centre, Uploaded on 6 February 2025, 3p. Available online: https://www.emsc-csem.org/Special_reports/ (accessed on 20 April 2025).
  100. Triantafyllis, N.; Venetis, I.E.; Fountoulakis, I.; Pikoulis, E.-V.; Sokos, E.; Evangelidis, C.-P. Gisola: A High-Performance Computing Application for Real-Time Moment Tensor Inversion. Seismol. Res. Lett. 2021, 93, 957–966. [Google Scholar] [CrossRef]
  101. Wiemer, S. A software package to analyze seismicity: ZMAP. Seismol. Res. Lett. 2001, 72, 374–383. [Google Scholar] [CrossRef]
  102. Abe, S.; Suzuki, N. Scale-free network of earthquakes. Europhys. Lett. 2004, 65, 581–586. [Google Scholar] [CrossRef]
  103. Abe, S.; Suzuki, N. Dynamical evolution of clustering in complex network of earthquakes. Eur. Phys. J. B 2007, 59, 93–97. [Google Scholar] [CrossRef]
  104. Baiesi, M.; Paczuski, M. Scale-free networks of earthquakes and aftershocks. Phys. Rev. E 2004, 69, 066106. [Google Scholar] [CrossRef] [PubMed]
  105. Baiesi, M.; Paczuski, M. Complex networks of earthquakes and aftershocks. Nonlinear Process. Geophys. 2005, 12, 47–56. [Google Scholar] [CrossRef]
  106. Barrat, A.; Barthélemy, M.; Vespignani, A. Dynamical Processes on Complex Networks; Cambridge University Press: Cambridge, UK, 2008; 361p. [Google Scholar]
  107. Daskalaki, E.; Papadopoulos, G.A.; Spiliotis, K.; Siettos, C. Analysing the topology of seismicity in the Hellenic arc using complex networks. J. Seismol. 2014, 18, 37–46. [Google Scholar] [CrossRef]
  108. Chorozoglou, D.; Kugiumtzis, D.; Papadimitriou, E. Testing the structure of earthquake networks from multivariate time series of successive main shocks in Greece. Phys. A 2018, 499, 28–39. [Google Scholar] [CrossRef]
  109. Daskalaki, E.; Spiliotis, K.; Siettos, C.; Minadakis, G.; Papadopoulos, G.A. Foreshocks and short-term hazard assessment of large earthquakes using complex networks: The case of the 2009 L’Aquila earthquake. Nonlinear Process. Geophys. 2016, 23, 241–256. [Google Scholar] [CrossRef]
  110. Newman, M. Networks: An Introduction; Oxford University Press: Oxford, UK, 2010. [Google Scholar] [CrossRef]
  111. Aki, K. Maximum likelihood estimates of b in the formula log N = a − bM and its confidence limits. Bull. Earthq. Res. Inst. Univ. Tokyo 1965, 43, 237–239. [Google Scholar]
  112. Utsu, T. A method for determining the value of b in a formula log N = a − bM showing the magnitude-frequency relation for earthquakes. Geophys. Bull. Hokkaido Univ. 1965, 13, 99–103. (In Japanese) [Google Scholar]
  113. Utsu, T. Representation and analysis of the earthquake size distribution: A historical review and some new approaches. Pure Appl. Geophys. 1992, 155, 509–535. [Google Scholar] [CrossRef]
  114. Aki, K. Characterization of barriers on an earthquake fault. J. Geophys. Res. 1979, 84, 6140–6148. [Google Scholar] [CrossRef]
  115. Omori, F. On the aftershocks of earthquakes. J. Coll. Sci. Imp. Univ. Tokyo 1894, 7, 111–200. [Google Scholar]
  116. Jordan, T.H.; Chen, Y.-T.; Gasparini, P.; Madariaga, R.; Main, I.; Marzocchi, W.; Papadopoulos, G.; Sobolev, G.; Yamaoka, K.; Zschau, J. Operational earthquake forecasting—state of knowledge and guidelines for utilization. Ann. Geophys. 2011, 54, 315–391. [Google Scholar] [CrossRef]
  117. Demichelis, A.; Ongaro, M. Public understanding and scientific uncertainty: The communication of risk in the L’Aquila earthquake. AIMS Geosci. 2024, 10, 540–552. [Google Scholar] [CrossRef]
  118. Institute of Geodynamics, National Observatory of Athens. Observations and Preliminary Results on the Seismic Sequence Between Santorini and Amorgos; Updated Version 25 March 2025; 30p. Available online: https://www.emsc.eu/Special_reports/?id=351 (accessed on 20 April 2025).
  119. Stein, S.; Wysession, M. An Introduction to Seismology, Earthquakes, and Earth Structure; Blackwell Publishing: Malden, MA, USA, 2003; 498p. [Google Scholar]
  120. Vollmer, F.W. Orient: Directional Data Analysis Software. 2024. Available online: https://vollmerf.github.io/orient/ (accessed on 20 April 2025).
  121. Lohman, R.B.; McGuire, J.J. Earthquake swarms driven by aseismic creep in the Salton Trough, California. J. Geophys. Res. 2007, 112, B04405. [Google Scholar] [CrossRef]
  122. Dziak, R.P.; Fox, C.-G. The January 1998 earthquake swarm at Axial Volcano, Juan de Fuca Ridge: Hydroacoustic evidence of seafloor volcanic activity. Geophys. Res. Lett. 1999, 26, 3429–3432. [Google Scholar] [CrossRef]
  123. Madarieta-Txurruka, A.; González-Castillo, L.; Peláez, J.A.; Catalán, M.; Henares, J.; Gil, A.J.; Lamas-Fernández, F.; Galindo-Zaldívar, J. The role of faults as barriers in confined seismic sequences: 2021 seismicity in the Granada Basin (Betic Cordillera). Tectonics 2022, 41, e2022TC007481. [Google Scholar] [CrossRef]
  124. Shaw, B.E. Generalized Omori law for aftershocks and foreshocks from a simple dynamics. Geophys. Res. Lett. 1993, 20, 907–910. [Google Scholar] [CrossRef]
  125. Im, K.; Avouac, J.-P. Cascading foreshocks, aftershocks and earthquake swarms in a discrete fault network. Geophys. J. Int. 2023, 235, 831–852. [Google Scholar] [CrossRef]
  126. Briole, P.; Ganas, A.; Elias, P.; Sakkas, V. Santorini Seismo-Volcanic Event: GNSS Time Series and Preliminary Models; Updated Version 13 February 2025; 11p. Available online: https://www.emsc-csem.org/Files/event/1765158/20250209-santorini-gnss-time-series.pdf (accessed on 20 April 2025).
  127. Alatza, S.; Papoutsis, I.; Paradissis, D.; Kontoes, C.; Papadopoulos, G.A. Multi-temporal InSAR analysis for monitoring ground deformation in Amorgos Island, Greece. Sensors 2020, 20, 338. [Google Scholar] [CrossRef] [PubMed]
  128. Kato, A.; Ben-Zion, Y. The generation of large earthquakes. Nat. Rev. Earth Environ. 2021, 2, 26–39. [Google Scholar] [CrossRef]
  129. McLaskey, G.C. Earthquake initiation from laboratory observations and implications for foreshocks. J. Geophys. Res. 2019, 124, 2882–2904. [Google Scholar] [CrossRef]
  130. Cattania, C.; Segall, P. Precursory slow slip and foreshocks on rough faults. J. Geophys. Res. 2021, 126, e2020JB020430. [Google Scholar] [CrossRef]
Figure 4. Flow diagram showing the main steps (A to E) of the research strategy proposed to evaluate the type of an ongoing seismic cluster. In the case examined in this study, the evaluation was performed daily. The term 3D refers to space–time–magnitude domains. BS is background seismicity.
Geosciences 15 00300 g004
Figure 5. (a,b) Background seismicity: time variation in the earthquake magnitude ML (squares) (a) and of the completeness magnitude threshold Mc (b). The star in panel (a) indicates the earthquake of ML = 4.7 occurring on 27 November 2018.
Geosciences 15 00300 g005
Figure 6. (a,b). Background seismicity for ML ≥ 2.2: time variation in the cumulative number of earthquakes (black line) (a) and of the earthquakes’ focal depth (b). The star indicates the earthquake of ML = 4.7 occurring on 27 November 2018.
Geosciences 15 00300 g006
Figure 7. (a,b). Background seismicity: time variation in the b-value for Mc = 2.2 (a), and the b = 1.19 ± 0.11 found for fixed Mc = 2.9 (b).
Geosciences 15 00300 g007
Figure 8. (ae) Distribution of betweenness centrality during the background seismicity for ML ≥ 2.2. Arrow in (a) shows the position of the Anydros islet.
Geosciences 15 00300 g008
Figure 9. Time variation in the earthquake number and magnitudes (squares) during the seismicity cluster until the occurrence of the largest earthquake of ML = 5.3 on 10 February 2025. Stars illustrate magnitudes of ≥5.0.
Geosciences 15 00300 g009
Figure 10. Determination of Mc with the MAXC method for the time interval from time t = 2 days up to t = 4 days (a) and from t = 3 days up to t = 4 days (b).
Geosciences 15 00300 g010
Figure 11. (a,b). Cumulative (black line) (a) and discrete (blue dots) (b) daily number of earthquakes of ML ≥ 2.9 from the beginning of the seismic cluster on 30 January 2025 (t = 1 day) up to 12 March 2025 (t = 42 days). Stars illustrate magnitudes of ML ≥ 5.0. Arrows show two peaks of n = 161 and n = 118 events observed at times t = 7 days (5 February 2025) and t = 12 days (10 February 2025) when the earthquakes of ML = 5.2 and ML = 5.3 occurred, respectively. A relative drop in the activity was noted in the time interval between these two earthquakes (b).
Geosciences 15 00300 g011
Figure 12. (a,b) Variation in the number, n, of earthquakes of ML ≥ 2.9 from time t = 1 day (30 January 2025) up to t = 12 days (10 February 2025, 20:16:28 UTC), when the largest earthquake of ML = 5.3 occurred (a). Number n up to the second largest earthquake (ML = 5.2, t= 7 days, 5 February 2025) increases in power-law mode (orange symbols). A relative drop in n in the time interval between the two earthquakes (blue symbols) was observed, and, therefore, the entire data set (orange and blue) does not fit the power-law distribution well (blue). The decay of n for earthquakes (ML ≥ 2.9) recorded after the ML = 5.3 earthquake follows a clear Omori–Utsu power-law mode (b). In (b), the event count starts on 11 February 2025, but 19 events that occurred from the ML = 5.3 earthquake origin time up to 00:00:00 UTC of 11th February were added to the events counted on that day.
Geosciences 15 00300 g012
Figure 13. (af) Distribution of the betweenness centrality during the 2025 Santorini–Amorgos cluster for ML ≥ 2.9. Arrow in (a) shows the position of the Anydros islet.
Geosciences 15 00300 g013
Figure 14. (a,b) Variation in the average distance, D, of epicenters from the zero point in km (blue dots) (a). D was measured in an ensemble of n = 100 earthquakes of ML ≥ 2.9 in each sequential measurement step. Orange-colored dots illustrate the distance from the zero point of the epicenters of the two strongest earthquakes of 5 and 10 February 2025. The focal depth of earthquakes (open circles) was concentrated mainly at the seismogenic layer from 5 km to 15 km (b). Stars illustrate magnitudes of ML ≥ 5.0.
Geosciences 15 00300 g014
Figure 15. (a,b). Time variation in the mean magnitude Mm (a) and its standard deviation (b) during the Santorini–Amorgos seismicity cluster. Black and orange colors show before and after the mainshock of 10th February, respectively.
Geosciences 15 00300 g015
Figure 16. (a,b) Time variation in the b-value during the Santorini–Amorgos seismicity cluster (a) and b-value calculated with the MAXC method for the time interval from the initiation of the cluster up to the occurrence of the largest earthquake ML = 5.3 (b). In (a), the b-value of 1.19 found in the background seismicity is conventionally plotted at time t = 1 day; black and orange colors show values before and after the ML = 5.3 mainshock, respectively. In (b), the ML = 5.3 earthquake has not been included in the b-value calculation. All calculations were performed for Mc = 2.9.
Geosciences 15 00300 g016
Figure 17. Time variation in log10 P (dotted line); P is the probability that the earthquake samples of BS and the 2025 seismicity cluster belong to the same mother population according to the Utsu test. Time t = 1 day corresponds to the initiation date (30 January 2025) of the cluster. P for BS is conventionally plotted on day 1. Plots in black and orange are for dates before and after the mainshock of ML = 5.3 on 10 February 2025, respectively. The horizontal dashed grey line shows log10P = −1.3 (P = 0.05) value.
Geosciences 15 00300 g017
Figure 18. Temporal variation in the completeness magnitude threshold, Mc, during the 2025 seismic cluster.
Geosciences 15 00300 g018
Disclaimer/Publisher’s Note: The statements, opinions and data contained in all publications are solely those of the individual author(s) and contributor(s) and not of MDPI and/or the editor(s). MDPI and/or the editor(s) disclaim responsibility for any injury to people or property resulting from any ideas, methods, instructions or products referred to in the content.