Review

Geodynamic, Tectonophysical, and Structural Comparison of the South Caspian and Levant Basins: A Review

1
Department of Geophysics, Faculty of Exact Sciences, Tel Aviv University, Ramat Aviv, Tel Aviv 6997801, Israel
2
Azerbaijan State Oil and Industry University, 20 Azadlig Ave., Baku AZ1010, Azerbaijan
3
Steinhardt Museum of Natural Hist. & National Res. Center, Faculty of Life Sciences, Tel Aviv University, Tel Aviv 6997801, Israel
4
Oil and Gas Institute of the Ministry of Science and Education, 9 F. Amirov St., Baku AZ1029, Azerbaijan
5
Institute of Geology of the Ministry of Science and Education, 119 H. Javid Ave., Baku AZ1073, Azerbaijan
*
Author to whom correspondence should be addressed.
Geosciences 2025, 15(8), 281; https://doi.org/10.3390/geosciences15080281
Submission received: 3 June 2025 / Revised: 18 July 2025 / Accepted: 19 July 2025 / Published: 24 July 2025
(This article belongs to the Section Geophysics)

Abstract

The Paratethyan South Caspian and Mediterranean Levant basins relate to the significant hydrocarbon provinces of Eurasia. The giant hydrocarbon reserves of the SCB are well-known. Within the LB, so far, only a few commercial gas fields have been found. Both the LB and SCB contain some geological peculiarities. These basins are highly complex tectonically and structurally, requiring a careful, multi-component geological–geophysical analysis. These basins are primarily composed of oceanic crust. The oceanic crust of both the South Caspian and Levant basins formed within the complex Neotethys ocean structure. However, this crust is allochthonous in the Levant Basin (LB) and autochthonous in the South Caspian Basin (SCB). This study presents a comprehensive comparison of numerous tectonic, geodynamic, morphological, sedimentary, and geophysical aspects of these basins. The Levant Basin is located directly above the middle part of the massive, counterclockwise-rotating mantle structure and rotates accordingly in the same direction. To the north of this basin is located the critical latitude 35° of the Earth, with the vast Cyprus Bouguer gravity anomaly. The LB contains the most ancient block of oceanic crust on Earth, which is related to the Kiama paleomagnetic hyperzone. On the western boundary of the SCB, approximately 35% of the world’s mud volcanoes are located; the geological reasons for this are still unclear. The low heat flow values and thick sedimentary layers in both basins provide opportunities to discover commercial hydrocarbon deposits at great depths. The counterclockwise-rotating mantle structure creates an indirect geodynamic influence on the SCB. The lithospheric blocks situated above the eastern branch of the mantle structure trigger a north–northeastward movement of the western segment of the Iranian Plate, which exhibits a complex geometric configuration. Conversely, the movement of the Iranian Plate induced a clockwise rotation of the South Caspian Basin, which lies to the east of the plate. This geodynamic ensemble creates an unstable geodynamic situation in the region.

1. Introduction

The regional aspect of the tectonic–geodynamic content of the compared Levant Basin (LB) and South Caspian Basin (SCB) structures is shown in Figure 1. Here, the structures of the northern (Eurasian) and southern (Gondwana) planetary zones are indicated, which are the areas of meridional distortion of the Earth’s figure to the critical parallel of 35°. South of the critical parallel are the residual basins of the Neotethys Ocean—the Herodotus and Levant basins, related to the Eastern Mediterranean [1]. The LB, situated in the northern sector of the Sinai lithospheric plate, represents the easternmost oceanic feature of the Easternmost Mediterranean (EMM) [2]. The more western ocean basins of the Mediterranean are already outside the region under study and located north of the critical latitude of 35°. This region is crossed from northeast to southwest by the Ural–African geodynamic step.
In the same latitudinal space, but within the Eurasian Plate, there are relict basins with areas of oceanic crust development—the Black Sea and the Caspian Sea—that were once part of the vast Cenozoic ocean, Paratethys. In the southern part of the Caspian Sea, there is also a unique SCB depression, composed of a thick (up to 28.5 km) sedimentary layer, sometimes underlain by oceanic crust.
According to geophysical data [3], paleogeographic data, and plate tectonic reconstructions [4], the oceanic crusts of the SCB and LB have been formed within the complex structure of the Neotethys Ocean. Here, in contrast to the Pacific Ocean segment, both spreading and collisional geodynamics were widely manifested with widespread strike-slip faulting with elements of rotation of extensive terrane belts and island arcs [5,6,7,8].
Thus, two anomalous depressions of the Earth’s crust near the critical parallel 35° in the junction zone of Eurasia and Gondwana—LB and SCB—are tectonically and planetologically unambiguous. The difference is that the first of them departs directly to the south from the critical parallel in the zone of development of lithospheric plates and rift zones of Gondwana, and the second (SCB) is located 100 km to the north of the critical parallel in the vast continental space of the lithospheric plates of Eurasia.
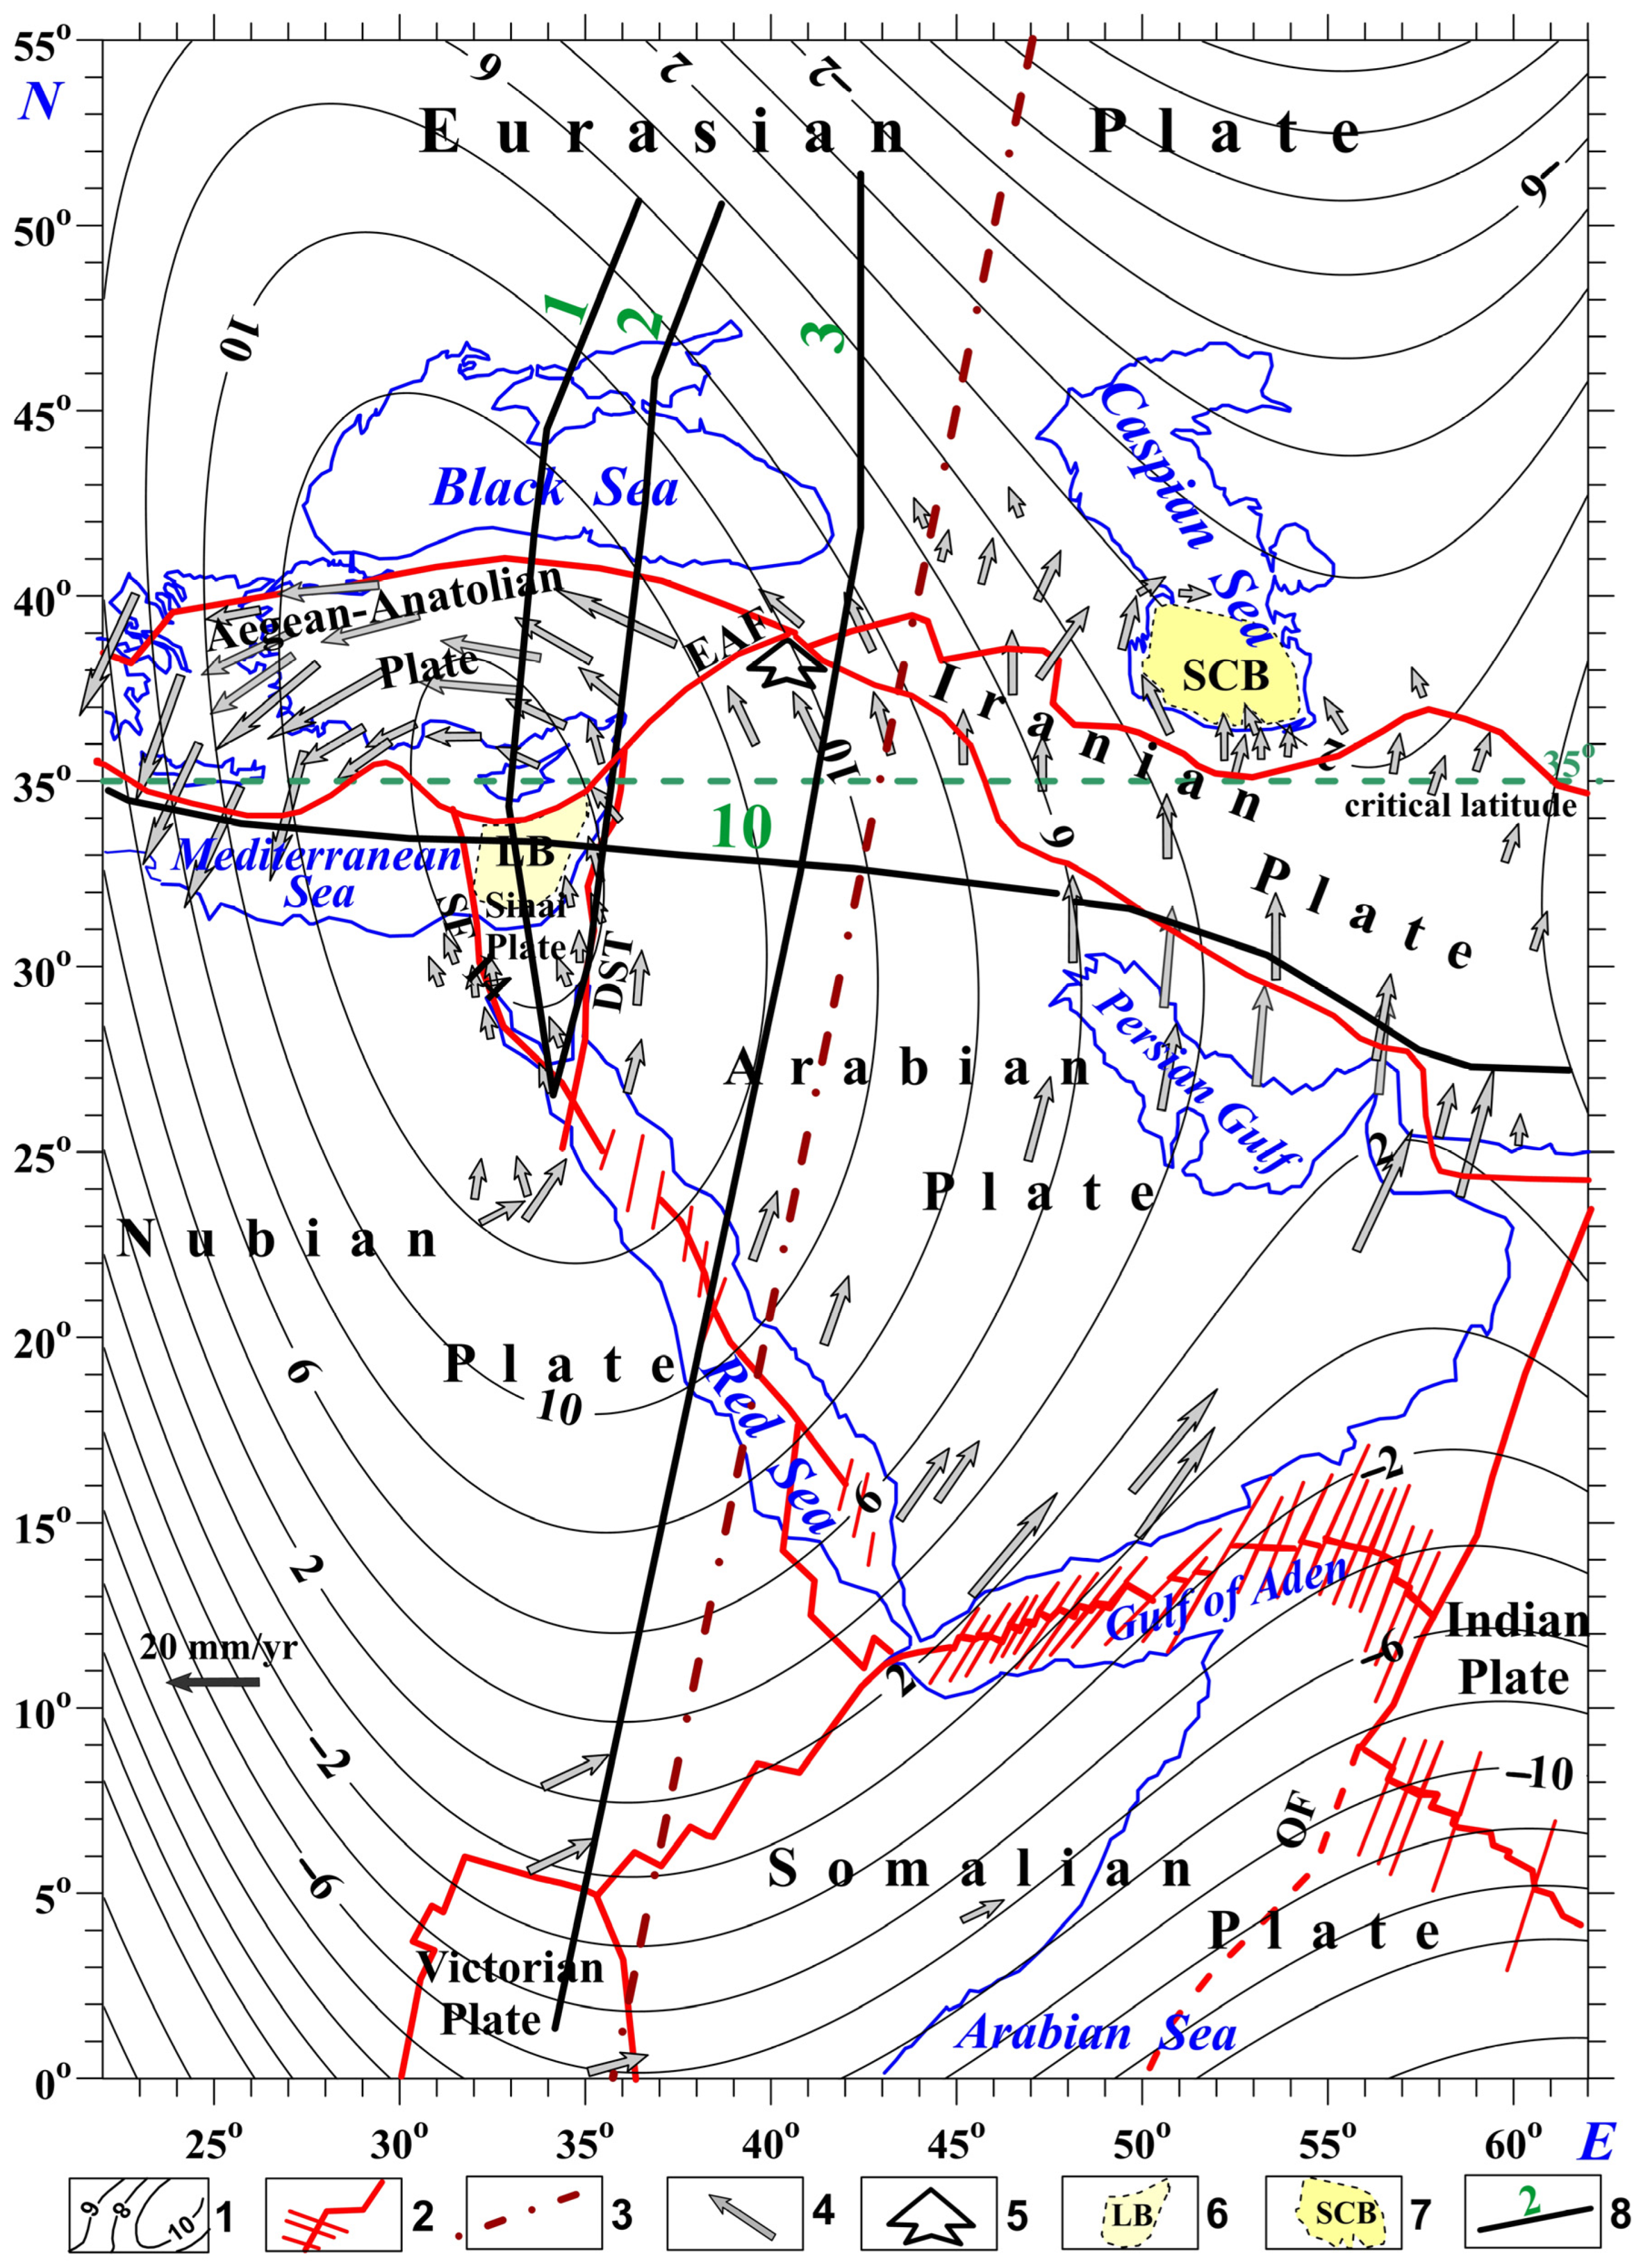
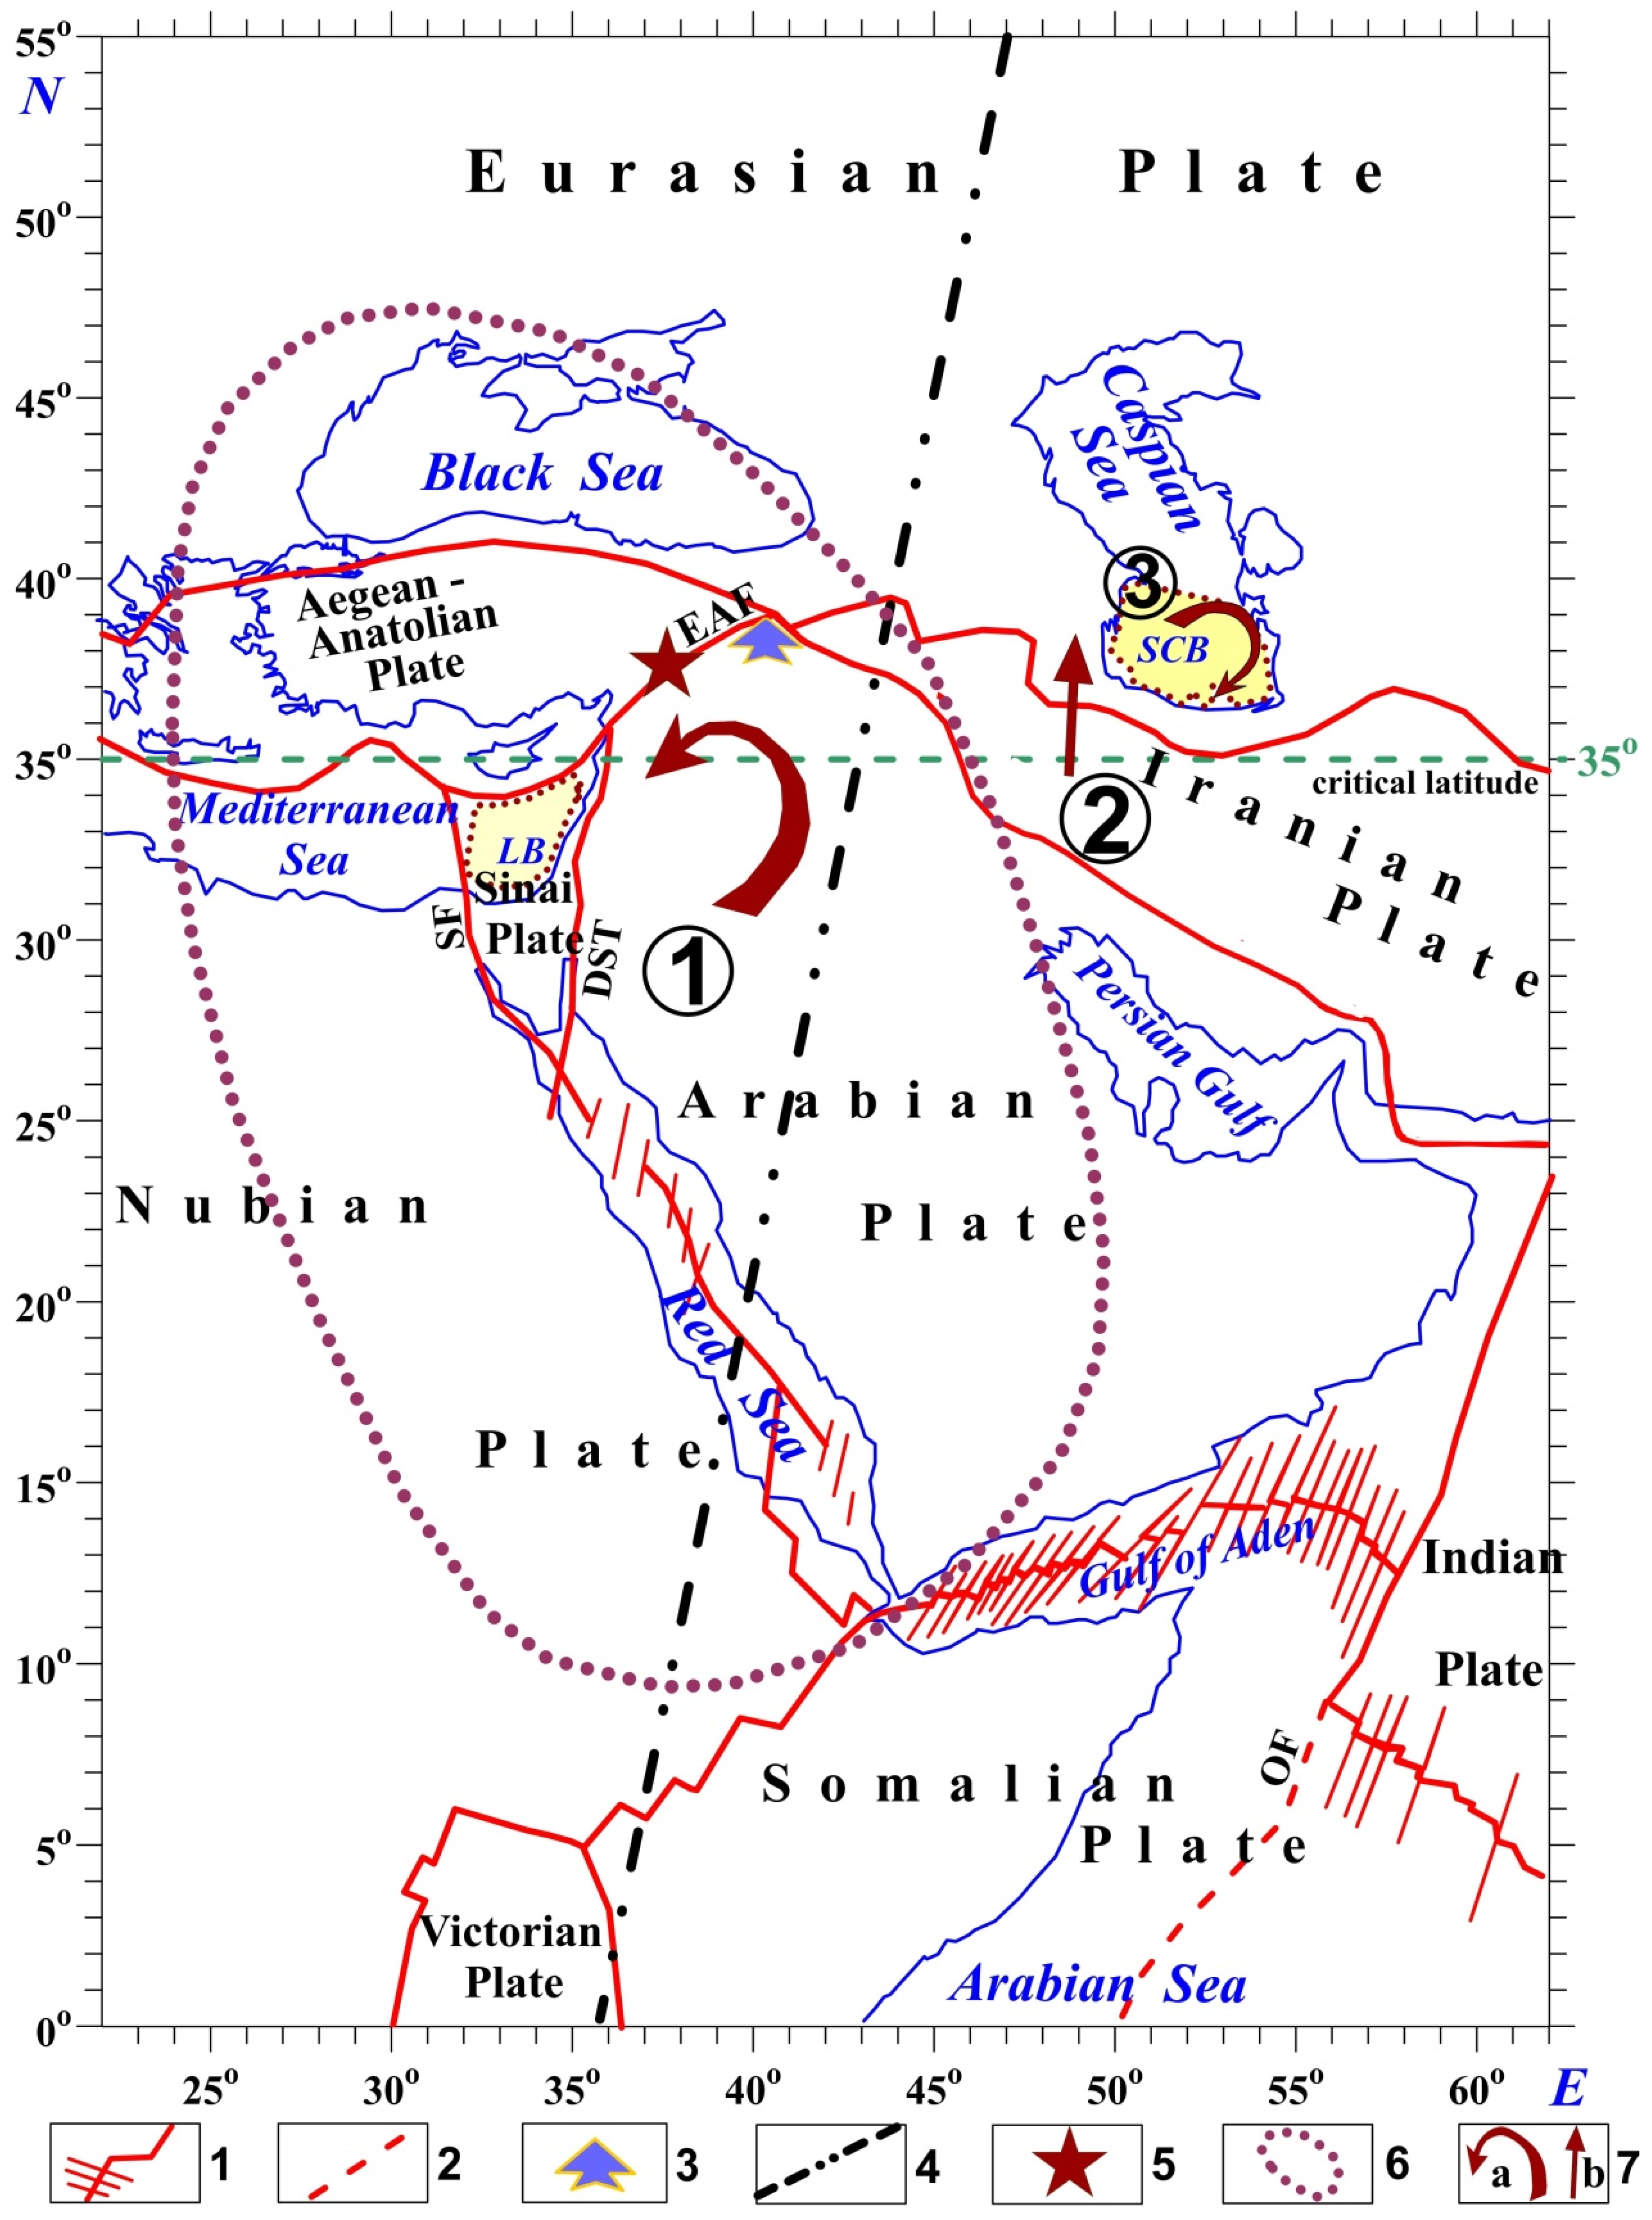
Geodynamically, the two basins under consideration, as indicated by the distribution of residual satellite-derived gravity field indicators, are situated adjacent to distinct segments of the projected deep mantle structure (Figure 2) [9,10]. The LB is confined to the most unstable section of this regional structure—its apical part. The SCB is located practically outside the influence of the mantle counterclockwise-rotating structure, above its periclinal zone.
The GPS data reveals a distinct difference between the two structures in terms of movement intensity, direction, and geodynamic typology. The tectonic blocks of the deflection and spatial limitation LB are subject to intensive movement in a counterclockwise direction [11]. In the SCB boundary zones, opposite movements are observed along the clockwise direction [12,13,14].
Two relatively closely occurring sizable basins, the South Caspian and the Levant, are significant hydrocarbon basins in Eurasia [15,16]. Eppelbaum [17] attempted to compare the South Caucasus and the Levant Basin using 3D gravity-magnetic models. However, this comparison was not multi-component. Abdullayev [16] examined the sedimentary thickness and volumes of several essential basins (including the Levant Basin and Eastern Mediterranean).
The present work aims to compare the basins mentioned using an integrated approach based on a multi-component geological–geophysical methodology and geodynamic mapping. At the same time, the authors of this paper consider this research an introduction to this very complex problem.

2. Materials and Methods

This investigation necessitates the integration of diverse geophysical and geological data. In this study, gravity and topographic (bathymetric) information derived from satellite observations were sourced from the World Gravity Database, utilizing retracked data from the Geosat and European Remote Sensing (ERS) missions [18].
Initial ΔZ magnetic data recalculated to one joint level of 2.5 km above mean sea level (MSL) were acquired from https://www.ngdc.noaa.gov/mgg/mag/EMAG2/ (accessed on 25 December 2024). The following sources were utilized for the conventional gravity [2,9,19,20,21,22,23,24,25] and magnetic [2,25,26,27,28,29] data analyses. For the GPS data analysis, several studies were examined [11,12,13,14,30,31]. Besides this, some seismic and seismotomographic (e.g., [2,10,24,32,33,34,35,36,37,38,39,40,41,42]), paleomagnetic (e.g., [8,9,10,28,43,44,45,46,47,48,49,50,51,52]), and thermal (e.g., [53,54,55,56,57,58,59,60,61]) data sources were analyzed. The following studies are among the key tectonic–structural sources analyzed in this work: Refs. [1,2,3,4,5,6,7,9,10,15,17,23,24,25,35,38,39,40,56,58,62,63,64,65,66,67,68,69,70,71,72,73,74,75,76,77,78,79,80,81,82,83,84,85,86,87,88,89,90,91,92,93,94,95].
The applied methods can be divided into geophysical and geological. Geophysical methods encompass the analysis of potential geophysical fields (gravity, magnetic, and thermal), paleomagnetic data, and the utilization of GPS, seismic, and seismological data. Geological methods encompass tectonic–paleogeographic analysis of structural stages (units), sedimentary facies analysis, thickness evaluation, analysis of interruptions and unconformities, paleobiogeographical analysis, structural–geodynamic investigations, tectonic reconstructions, and other related techniques.
The geological–geophysical constructions presented in this research, to a significant degree, are based on the discovery of the giant mantle rotating counterclockwise structure (MRCS) in the Eastern Mediterranean [9]. At the same time, the counterclockwise rotation of the Levant Basin and Arabian Plate, based solely on geological data, was previously demonstrated by Ref. [95]. The pinpoint of this structure lies beneath the island of Cyprus, at the critical latitude of the Earth (35°). The discovery of this structure has been proven on (1) GPS pattern behavior, (2) residual satellite-derived gravity anomaly recalculated to the sea/land surface (Figure 2), (3) Bouguer gravity anomalies observed in the region, (4) geoid anomalies generally agreeing with the gravity and GPS anomalies, (5) extensive paleomagnetic data which indicate that tectonic blocks within the surface projection of the deep structure have predominantly undergone counterclockwise rotation, (6) comprehensive examination of paleobiogeographic data, (7) assessment of data from seismic tomography, (8) examination of structural and tectonic frameworks, and (9) analysis of petrological and mineralogical properties. The quantitative analysis of the satellite residual gravity anomaly has been reinterpreted, indicating a depth of approximately 1250 km for the center of the horizontal circular cylinder (HCC) [10]. Further crucial evidence is offered by the circular distribution of anomalies in the regional magnetic field ΔZ, recalculated at an altitude of 2.5 km above mean sea level [25].
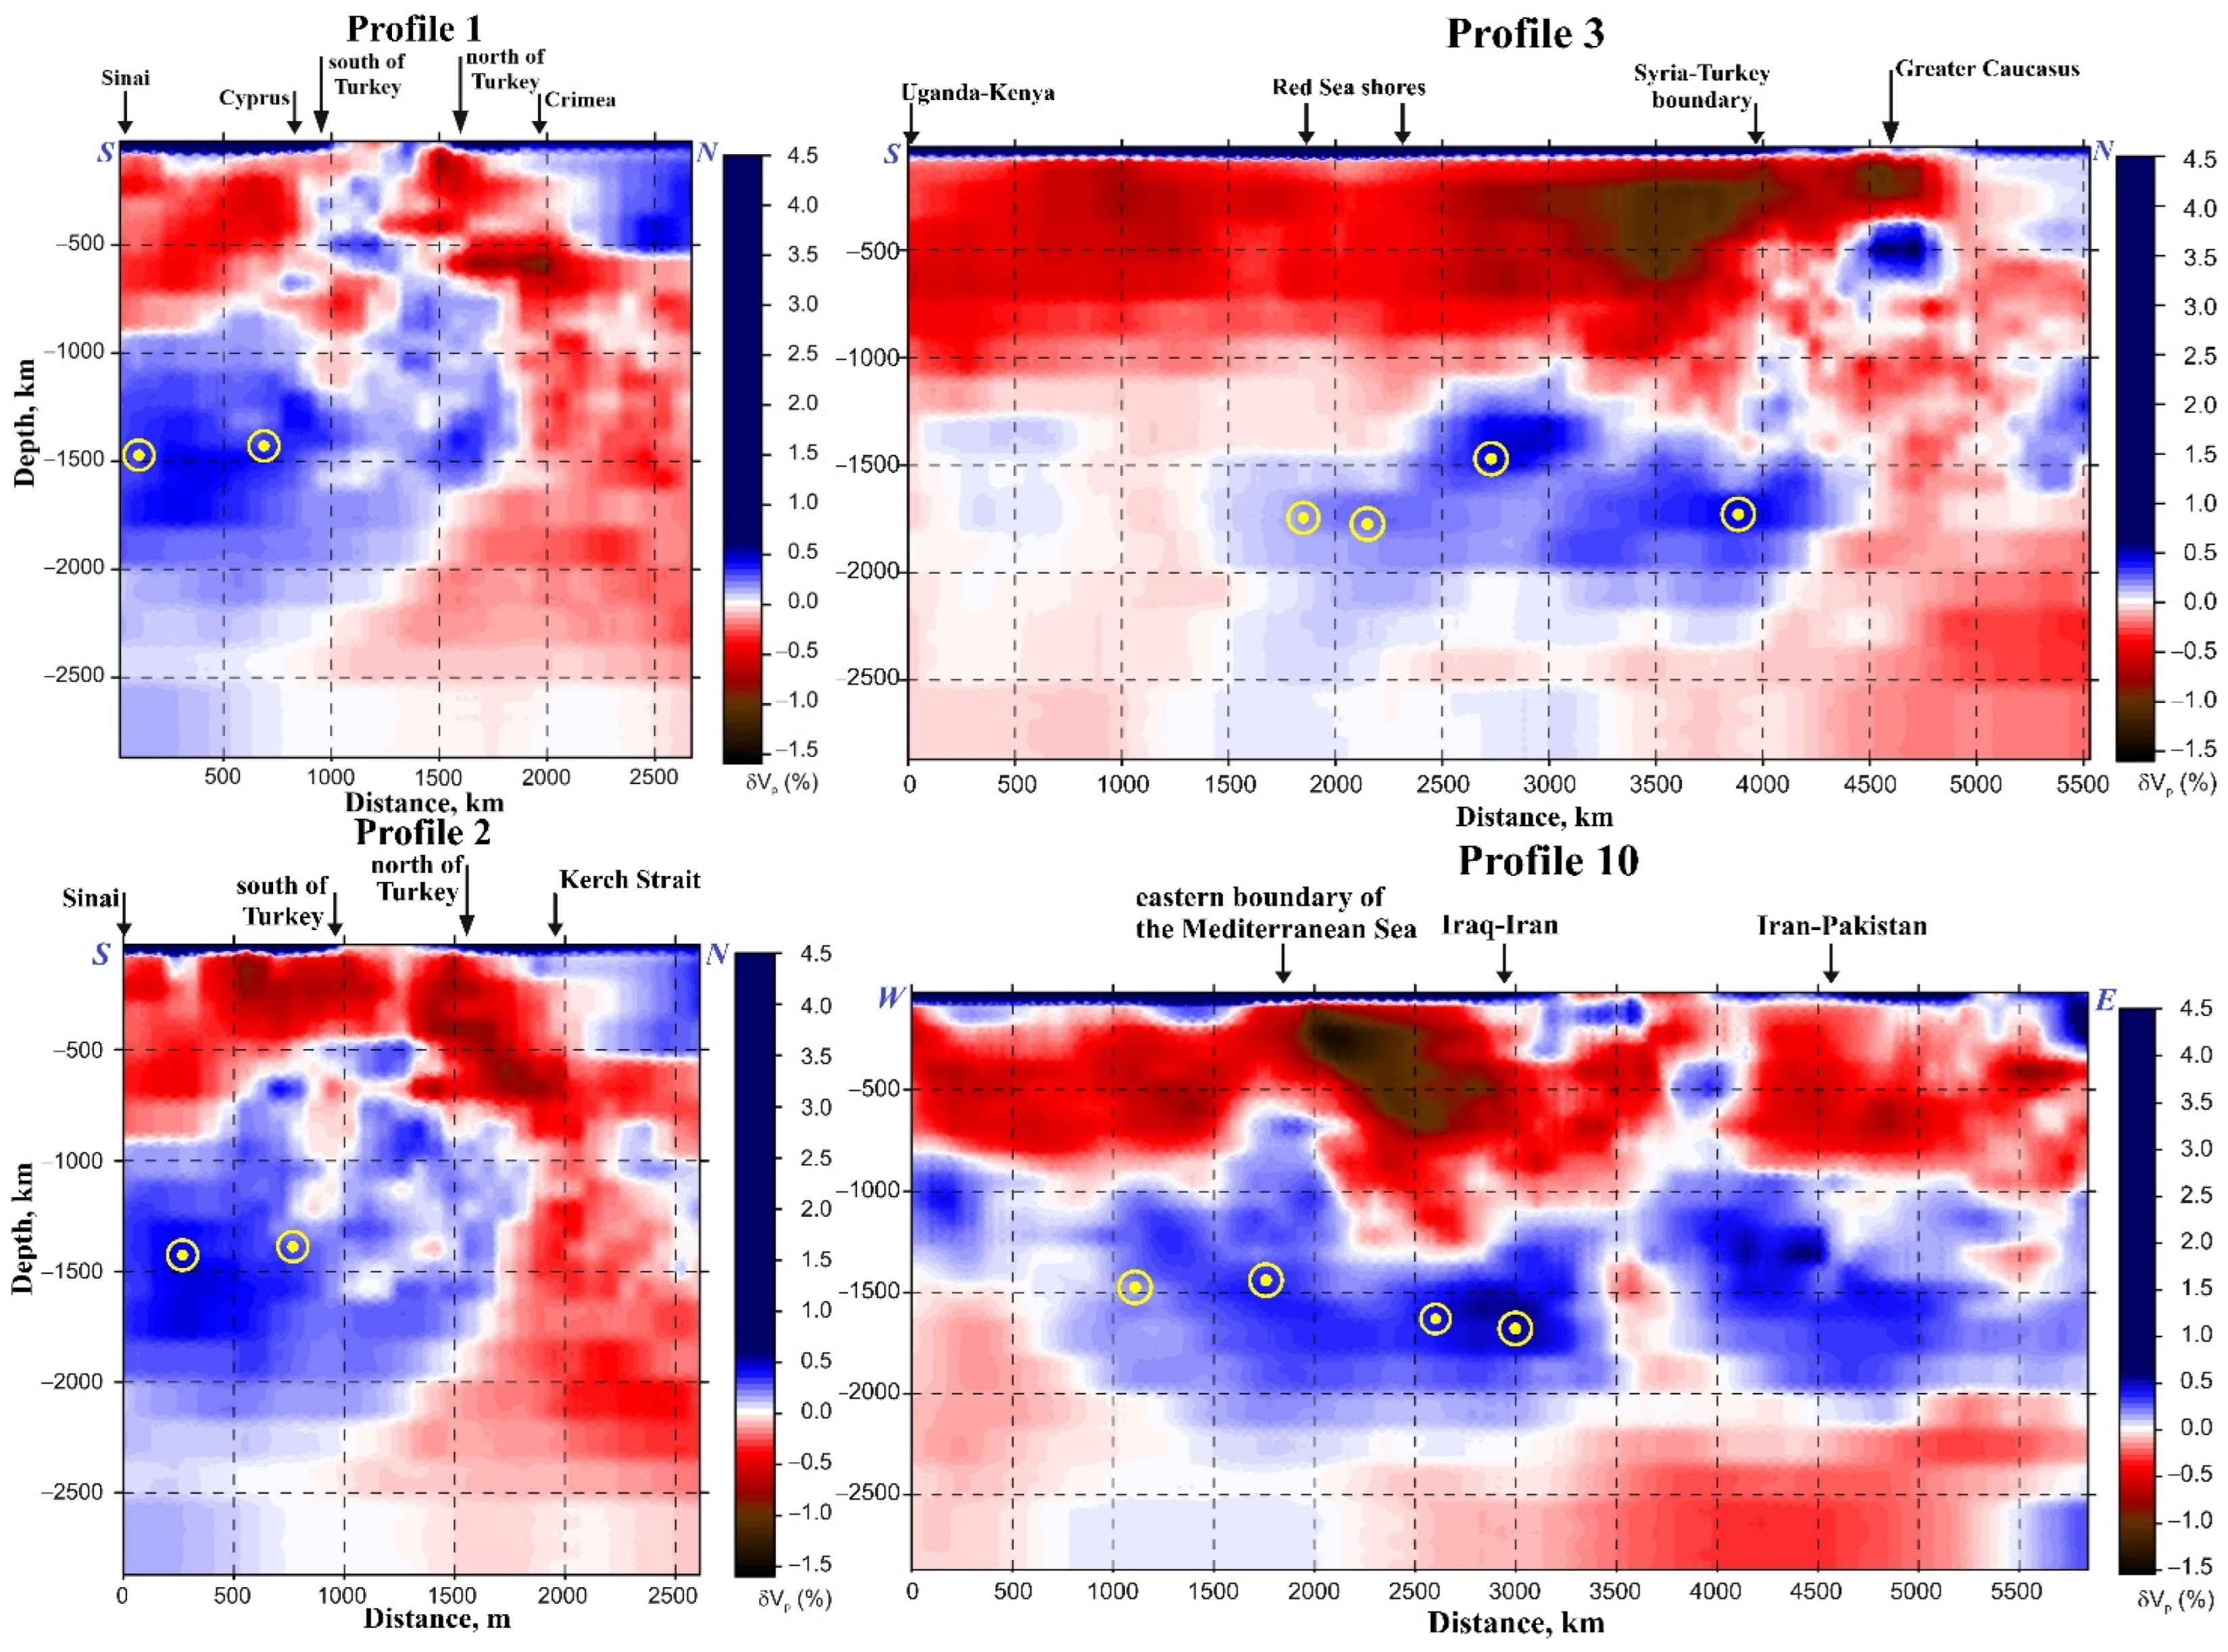
Figure 3 illustrates the seismotomographic confirmation of the giant counterclockwise-rotating mantle structure that has been revealed (the location of the seismotomographic profiles is shown in Figure 2). The integration of eight seismic tomography profiles from various authors facilitated the development of seismic tomographic models for identifying the deep structure, which corresponds well with findings from other geophysical techniques [10].
The combined integration of all these factors provides unequivocal evidence for the presence of an anomalous deep structure beneath the Eastern Mediterranean and its surrounding areas. The first paleobiogeographic map constructed distinctly illustrates the northwestward, counterclockwise displacement of the characteristic Ethiopian fauna [10]. The connection between the rotating deep structure and the buildup of rock stress preceding the catastrophic Turkish earthquakes (M = 7.9 and 7.8) on 6 February 2023, within the seismogenic zone—as depicted in Figure 2—lies at the convergence of several major tectonic and geodynamic elements [25]. Consequently, the MRCS stands out as the primary profound geodynamic driver in the region under investigation.

3. Results Obtained

3.1. South Caspian Basin (SCB)

Extensive seismic data indicate a significant compositional distinction between the crust of the South Caspian Basin (SCB) and its surrounding areas [96]. The SCB’s structural and geodynamic characteristics have been thoroughly investigated through drilling results; seismic surveys; gravity, thermal, magnetic, and paleomagnetic analyses; and remote sensing techniques (e.g., [12,13,24,31,39,43,48,58,59,60,90]).
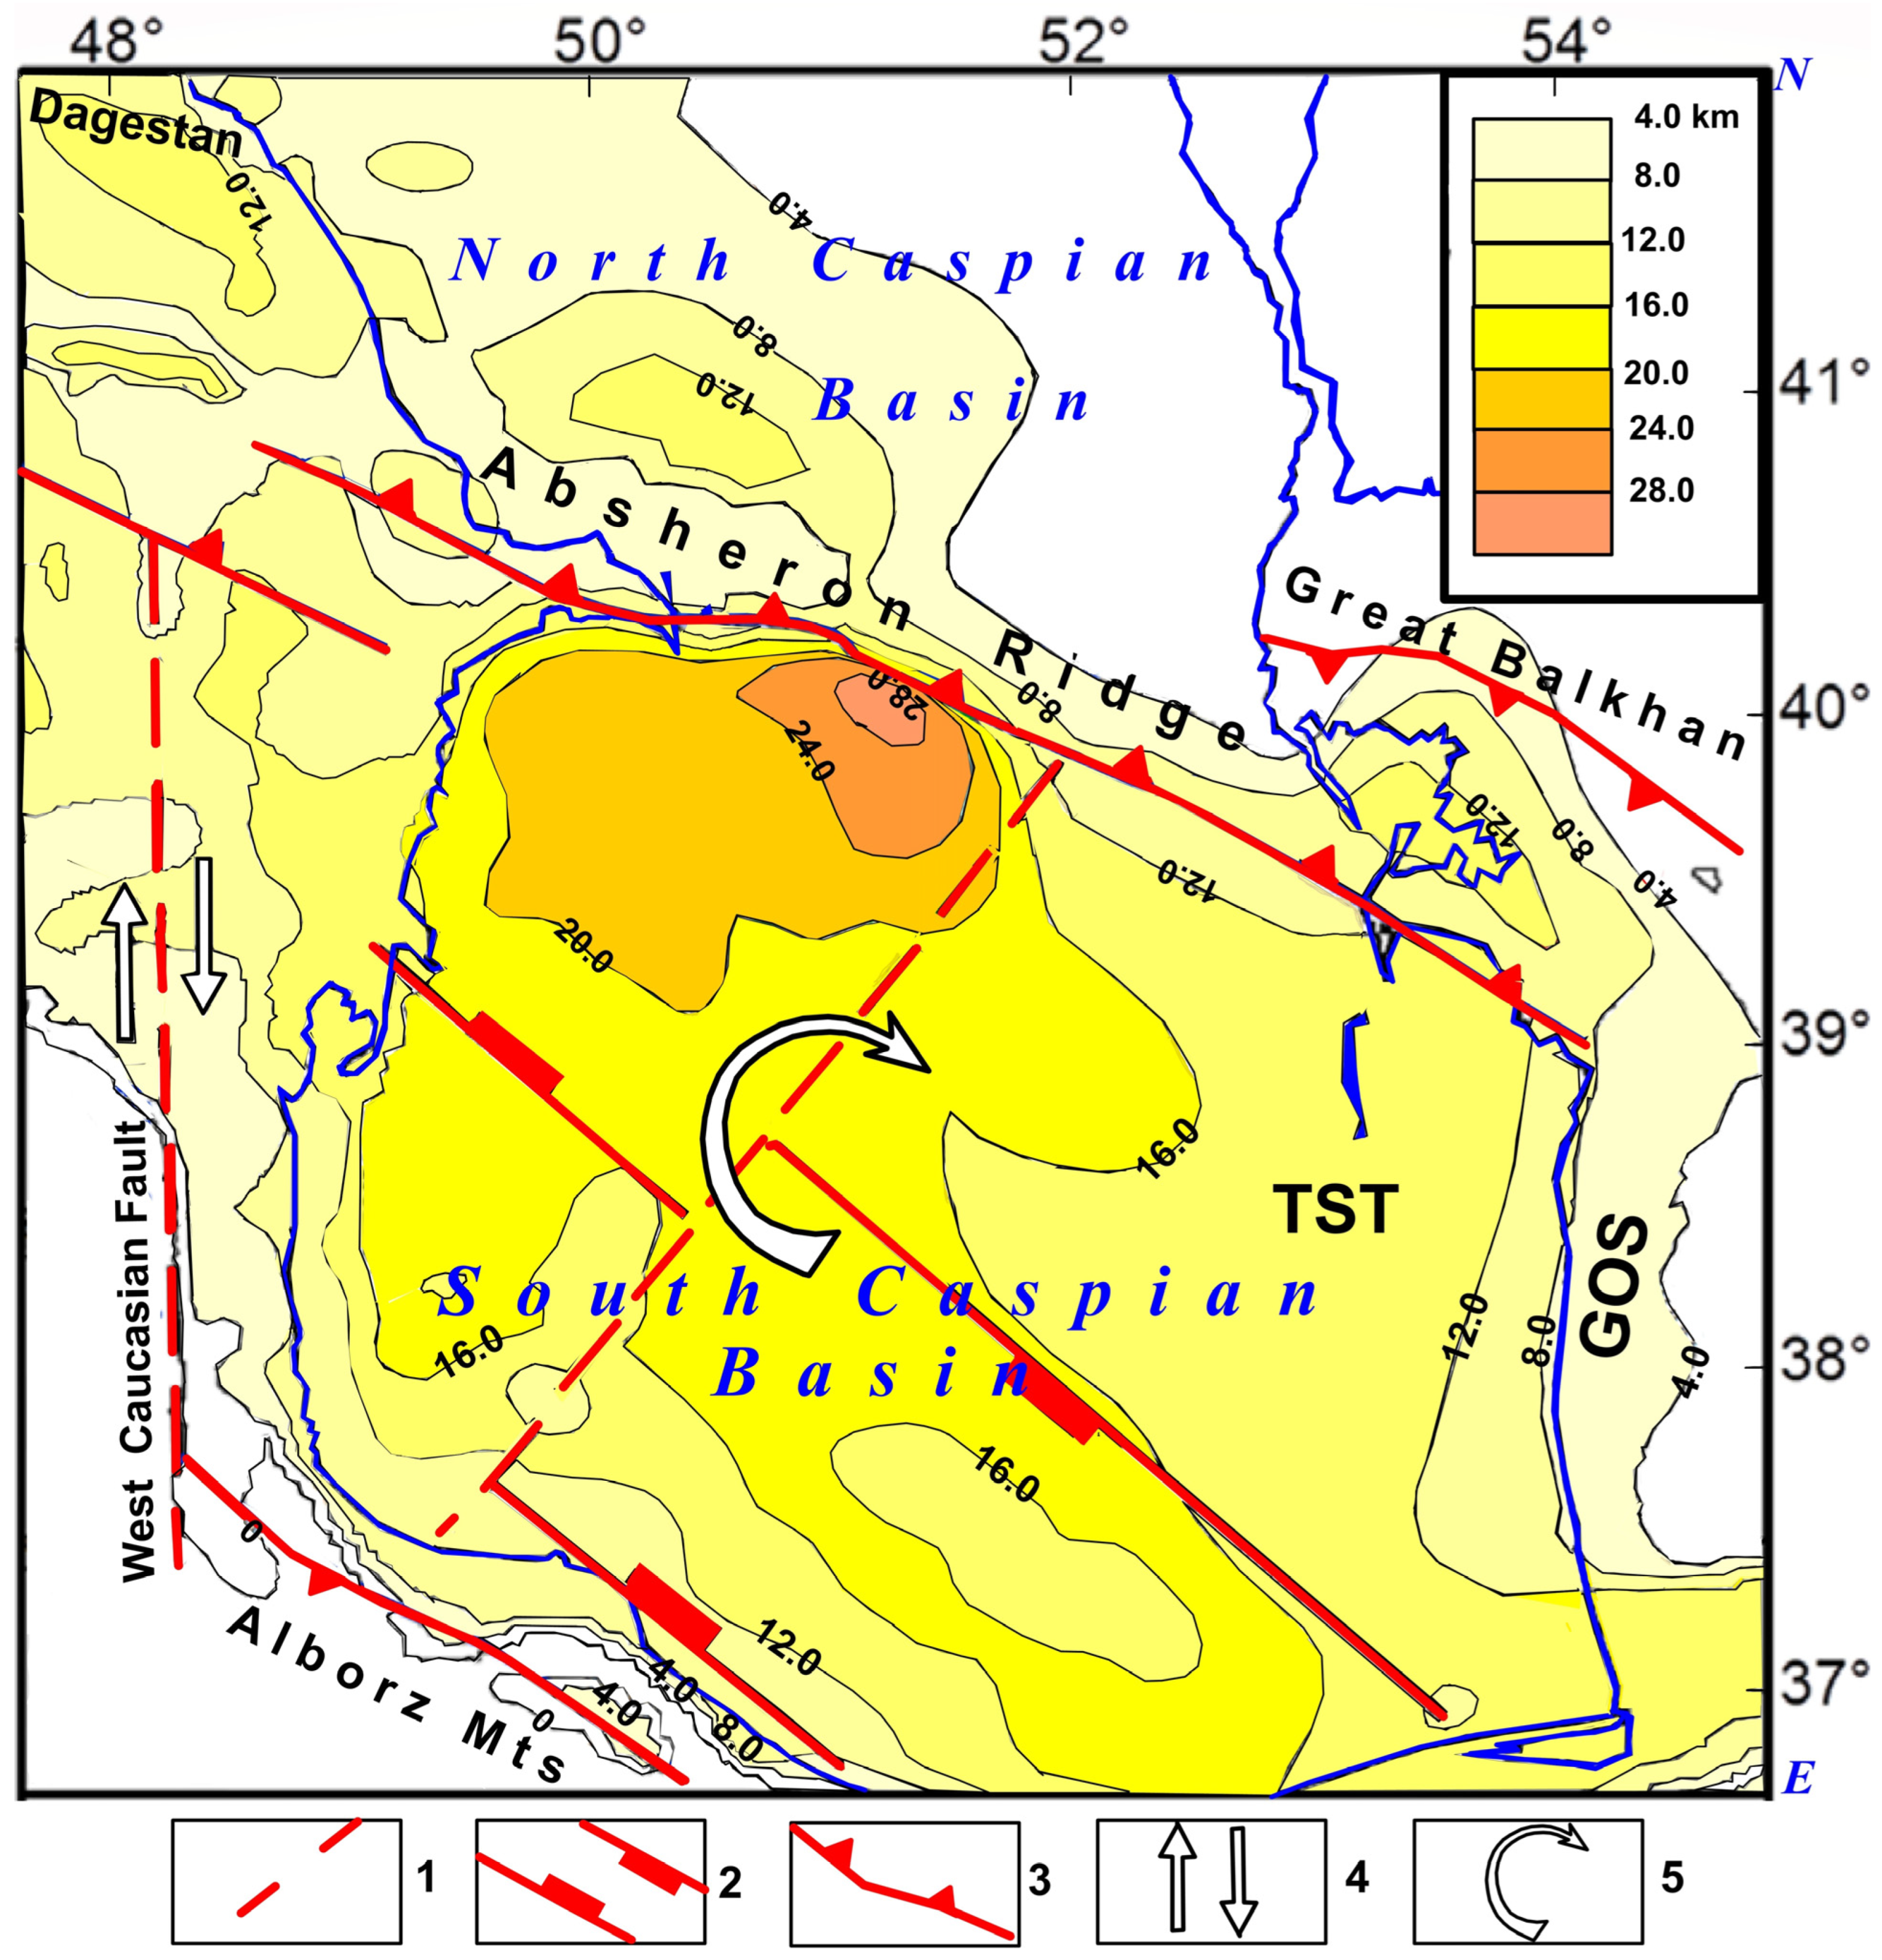
As a result, a structural–tectonic map was compiled [24], which clearly defined the age and geodynamic type of various SCB zones. In this paper, this map (Figure 4) has been generally used as a basis but slightly modified by incorporating data from adjacent areas of Turkmenistan and the eastern SCB zone [73,94] and the latest geodynamic constructions based on the GPS data [13]. The structural–tectonic map presented (Figure 4) provides an adequate representation of the deep structure of the South Caspian Basin (SCB) and its surrounding regions. The contrast in sedimentary cover thickness highlights the distinction between the SCB and the North Caspian Basin, which belong to tectonic zones of different geological ages (Figure 1 and Figure 5). The SCB forms part of the Alpine–Himalayan orogenic belt, while the North Caspian Basin lies within the epi-Hercynian Scythian-Turanian belt. A system of deep faults distinctly separates the SCB from both the Hercynides and adjacent Alpine structures. This tectonic differentiation is further emphasized by the exceptionally thick sedimentary layer in the SCB, reaching up to 28.5 km near the Absheron Ridge—a boundary structure between the Hercynides and the Alpines [68]. The structural map also reveals an arcuate zone of maximum sediment thickness, suggesting a thrusting of this high-thickness domain beneath the Absheron Ridge fault system. This tectonic–geodynamic interpretation is supported by the fault-offset Jurassic trough system [24]. In contrast, the southeastern segment of the trough displays a less pronounced geodynamic character, with the sedimentary cover thinning by approximately 8–10 km relative to the northern part.
The eastern portion of the SCB is characterized by a significant thinning of the sedimentary layer, with a thickness of around 8 km near the Caspian coast. Based on the isopach distribution, this part of the basin forms a structural plateau, referred to as the Turkmenian Structural Terrace (TST). Closer to the shoreline (Figure 4), the terrace transitions into the Gograndag-Okarem Step scarp (GOS) [73].
The pattern of sedimentary cover thickness and fault system distribution reflects the geodynamic processes responsible for the complex structure of the South Caspian Basin (SCB). The data indicates a clockwise rotation of the basin’s western segment. To further investigate this cartographically documented phenomenon, geophysical data—particularly seismic profiling and GPS analysis, which have been extensively studied in this region—are essential (e.g., [13,24]).
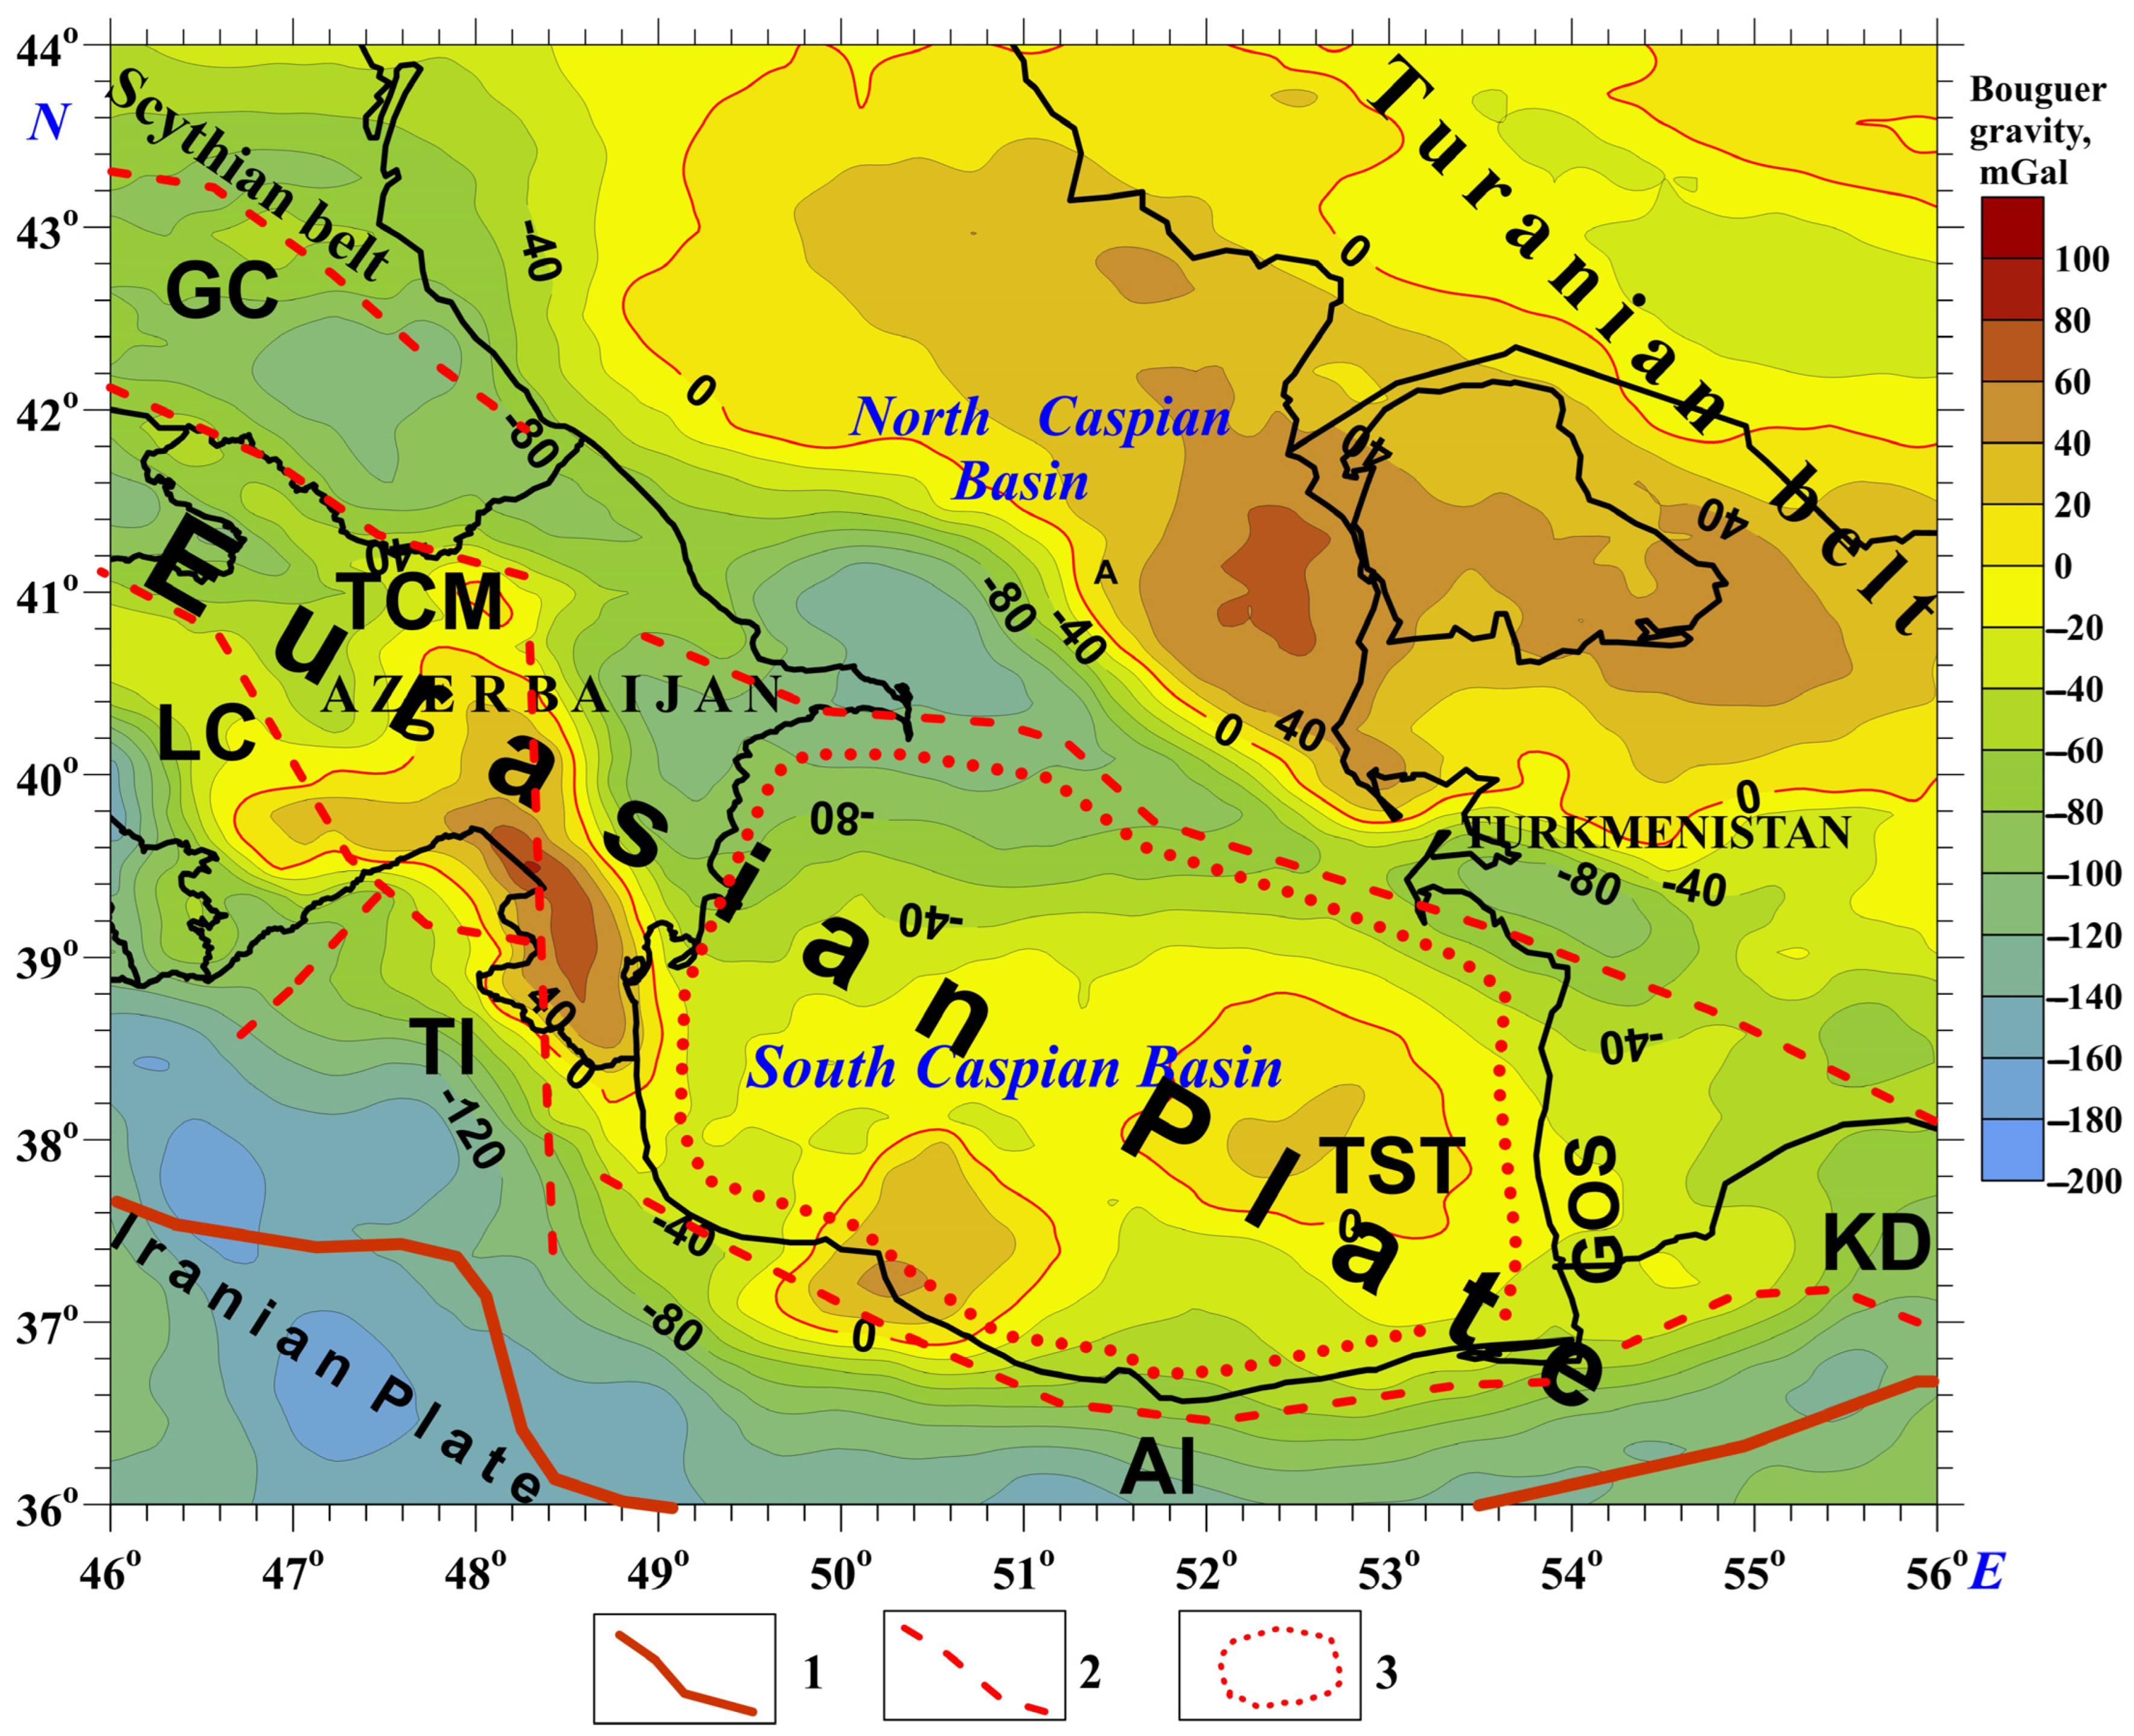
Gravity anomaly data served as the basis for the structural and geodynamic analysis of the SCB. The Bouguer gravity anomaly map (Figure 5) highlights the contrast between the SCB and the surrounding regions of the Alpine–Himalayan belt and the epi-Hercynian Turanian belt. Within the Alpine belt, the Bouguer anomalies are predominantly negative [20].
At the same time, strongly negative Bouguer anomaly values ranging from −120 to −200 mGal are concentrated along the boundary between the Eurasian and Iranian lithospheric plates. Slightly less negative values (−100 to −120 mGal) are observed along the boundary between the Alpine structures of the Absheron Ridge and the Hercynian formations of the Turanian belt. The highest Bouguer anomaly values, from approximately +40 to over +60 mGal, are prominently developed in the Kara-Bugaz arch within the Hercynian domain. In the Alpines, such positive anomalies are found only west of the SCB, near the fault zone bordering the Talysh uplift [20].
The South Caspian Basin is distinguished from its neighboring Alpine structures by transitional Bouguer anomaly values, which range from approximately −50 to +20 mGal. In contrast, the eastern segment—identified as the Turkmenian Structural Terrace (TST), where the sedimentary layer is thinner—exhibits a relatively stable Bouguer anomaly regime, with values hovering around zero. Further east, where the Caspian region transitions into the Kopet-Dagh Alpine system, the Bouguer anomalies distinctly outline the GOS tectonic scarp (see Figure 5).
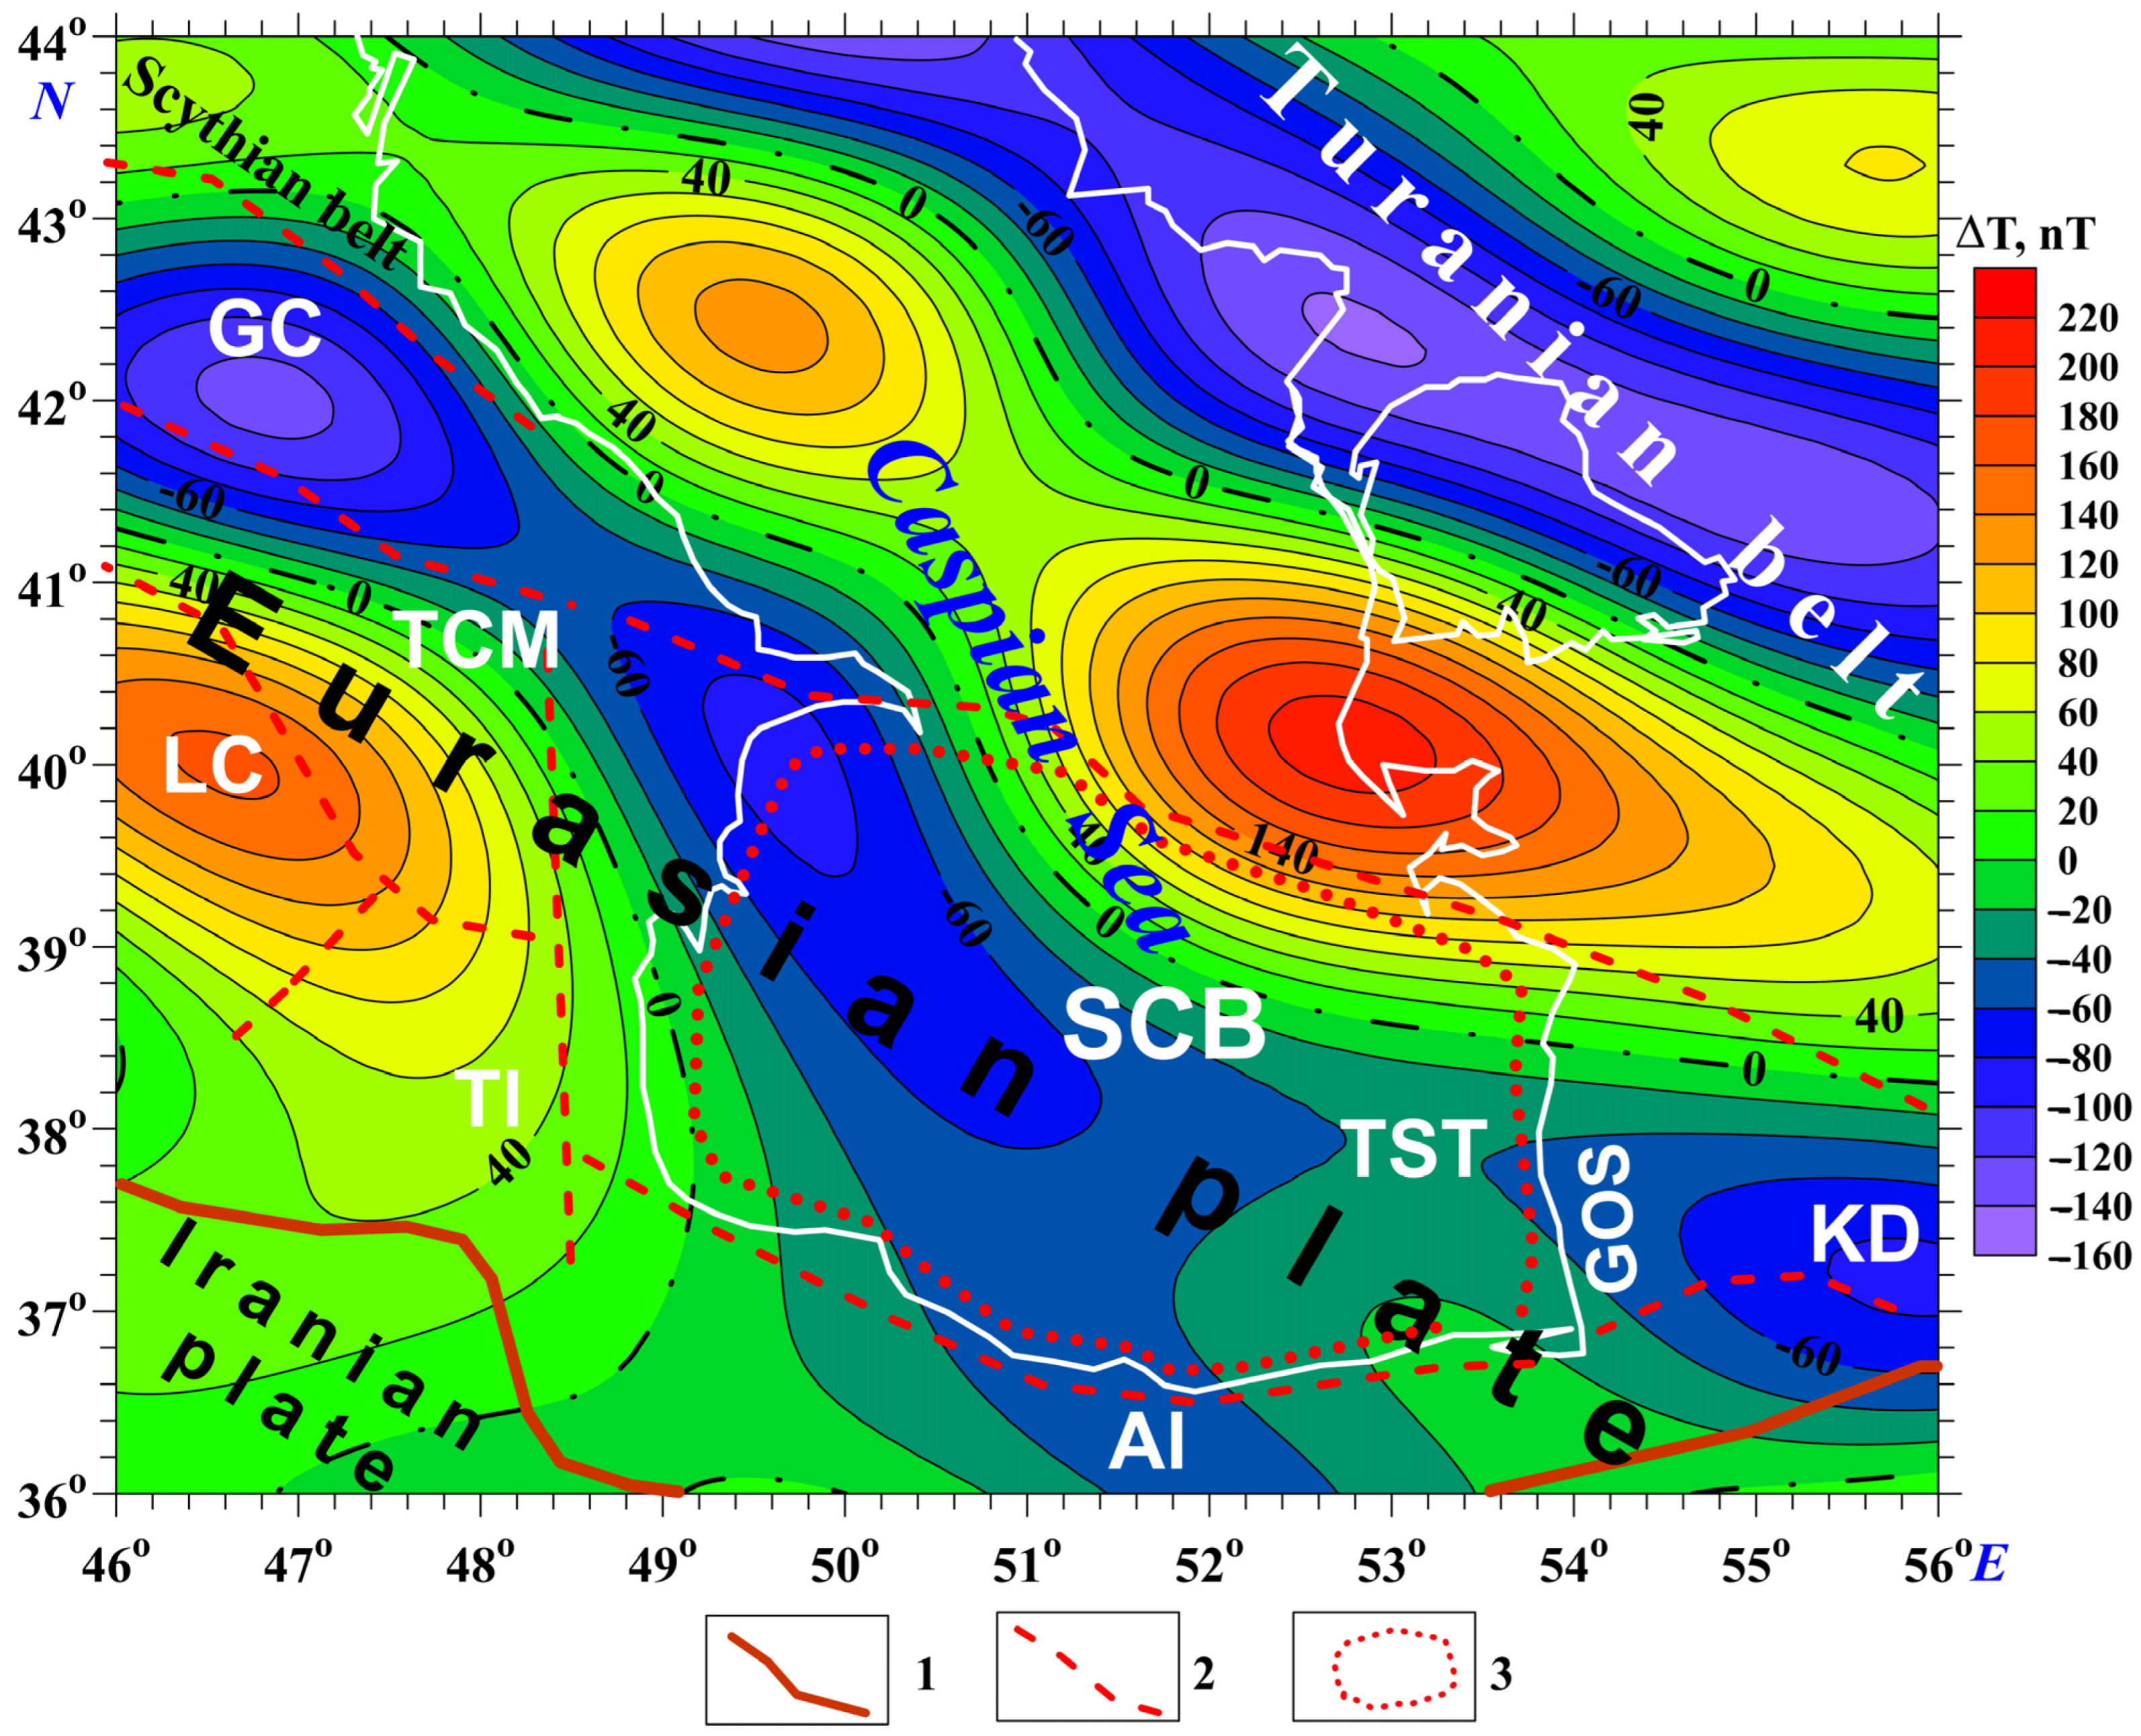
The use of materials on the magnetic characteristics of the SCB and surrounding (adjacent) structures indicates a close connection between this region’s tectonic and geophysical features (Figure 6). First, it is indicative that the transition zone from Alpines to Hercynides is expressed as a broad, diagonally elongated band with ΔZ positive values. At the same time, the highest values within 140–200 nT are confined to the Absheron-Balkhan uplift at the boundary between the SCB and the Turanian belt.
The SCB trough is an extensive area with negative values of the vertical component ΔZ of the total magnetic field, distinguishing it from the narrower troughs of the GC and KD (Figure 6). In comparing the structures and magnetic characteristics of the SCB, the difference in the topology of the ΔZ change in the western and eastern parts of the basin under consideration is quite significant. The western part, where Jurassic troughs are developed (Figure 4), is characterized by negative values of ΔZ up to –40 nT. The eastern part, where the TST (Turkmenian Structural Terrace) is present, is characterized by both positive and negative values of ΔZ. Further, through the GOS structural scarp, the ΔZ marks in the KD (Kopet-Dagh) zone decrease sharply (Figure 7).
Notably, negative magnetic anomalies observed in the Absheron Archipelago and surrounding areas of the South Caspian Basin coincide with the distribution of most of Azerbaijan’s mud volcanoes [29] (see Figure 6). Azerbaijan is home to approximately 35% of the world’s mud volcanoes [78,98]. This correlation highlights the structural heterogeneity of the SCB, as revealed by magnetic field characteristics, and underscores the need for further detailed investigation of this phenomenon.
Heat flow measurements in the SCB exhibit a high dispersion of observed values ranging from 9 to 209 mW/m2 (e.g., [57,59,60]). The averaged thermal flow value can be estimated to be 40–60 mW/m2. Kaz’min and Verzhbitskii [56], using an averaged value of 50 mW/m2 and corresponding thermal parameters for lithosphere and asthenosphere, have estimated the age of the South Caspian lithosphere as 200 Ma.
The presence of giant hydrocarbon reserves in the SCB is well known (e.g., [27,34,39,58]). The discovery of new commercial oil and gas deposits is often associated with the finding of deep-seated hydrocarbons at depths of 8–13 km (e.g., [90]).
GPS data patterns (e.g., [12,13,31]) and paleomagnetic data analyses (e.g., [8,43,48]) unambiguously indicate the SCB’s clockwise rotation. The SCB rotation also follows from the SCB bottom topography analysis and the satellite-derived gravity field transformations [40]. This rotation is primarily caused by the northward (NNE) movement of the Iranian Plate [30,61]. In turn, the movement of the Iranian Plate is caused by the counterclockwise rotation of a giant mantle structure centered under the island of Cyprus [9,10,25]; the eastern part of this structure exerts pressure on the Iranian Plate.
From a seismological perspective, the SCB is a region of heightened seismic activity (e.g., [12,31,58,63,99,100]). The greatest danger to the Absheron Peninsula is posed by the geodynamic events in the SCB [101].
Researchers generally tend to believe that the Earth’s crust in the South Caspian Basin is autochthonous (e.g., [4,24,69,72,78]).

3.2. Iranian Plate

A novel, comprehensive tectonic map of the Iranian lithospheric plate and its surrounding areas has been created (see Figure 7). This map illustrates the tectonic relationship between the Central Gondwana and southern Eurasian plates. A key feature highlighted is the boundary between the Iranian and Arabian lithospheric plates, representing the collision zone that once marked the extensive Neotethys Ocean in this region. This significant structural boundary is traditionally known as the Zagros zone [102]. Our regional tectonic research [80] indicates that the Zagros uplift (e.g., [62]) is simply the easternmost segment of the larger Mesozoic Terrane Belt.
North of the MTB—which formed in the middle of the Early Cretaceous and consists of a complex mix of continental and oceanic crust, including the ancient Kiama paleomagnetic zone [75]—lies the younger Alpine–Himalayan folded-block belt. This belt marks the transitional zone between Gondwana and Eurasia. The Iranian lithospheric plate is part of this extensive belt, occupying its southern and eastern sections on the map (Figure 7). The plate’s structure is asymmetric. Southeast of the Caspian Basin meridian, submeridional block structures and belts such as the Yazd, Tabas, Lut, and Afghanistan blocks develop (Figure 7). Along the Kopet-Dagh border, sublatitudinal structures—including the Central Iranian Massif and the Ala-Dagh and Binalud folded belts [82]—are concentrated to the north of these blocks. Narrow, elongated sublatitudinal structures also form in the southern part of the Iranian Plate, close to its boundary with the Arabian Plate (Figure 7). This area features the southern Iran plateau [6], which includes the Sanandaj–Sirjan (SS) zone. East of this subduction zone lies the Makran accretionary obduction zone, characterized by Mesozoic ophiolites. Geotectonically, these elongated belts represent the main zone of tectonic activity, corresponding to the once-extensive Neotethys Ocean that has since been subducted. The northern boundary of the Iranian lithospheric plate is less distinct [92], reflecting more subtle tectonic collision processes characteristic of terrane tectonics. In the west, the Iranian Plate’s elongated belts intersect discordantly with structures of the Caucasian belt (Figure 7).
The Iranian lithospheric plate is discordantly joined to the Eurasian Plate. Its narrow western section consists of the Sanandaj–Sirjan (SS) zone, which represents a collisional suture within the former Neotethys Ocean absorption zone. In contrast, the broader eastern part of the Iranian Plate is dominated by large massifs and blocks of continental crust. The Arabian lithospheric plate is distinctly separated from the Iranian Plate, as demonstrated by gravity field analyses both inside and outside the Mesozoic Terrane Belt [40]. To the southwest lies a stable area comprising the Arabian craton and Neoproterozoic belt (Figure 7). The rise in gravity field values at the far southwestern edge of the region is attributed to its proximity to the tectonically active Red Sea rift zone.
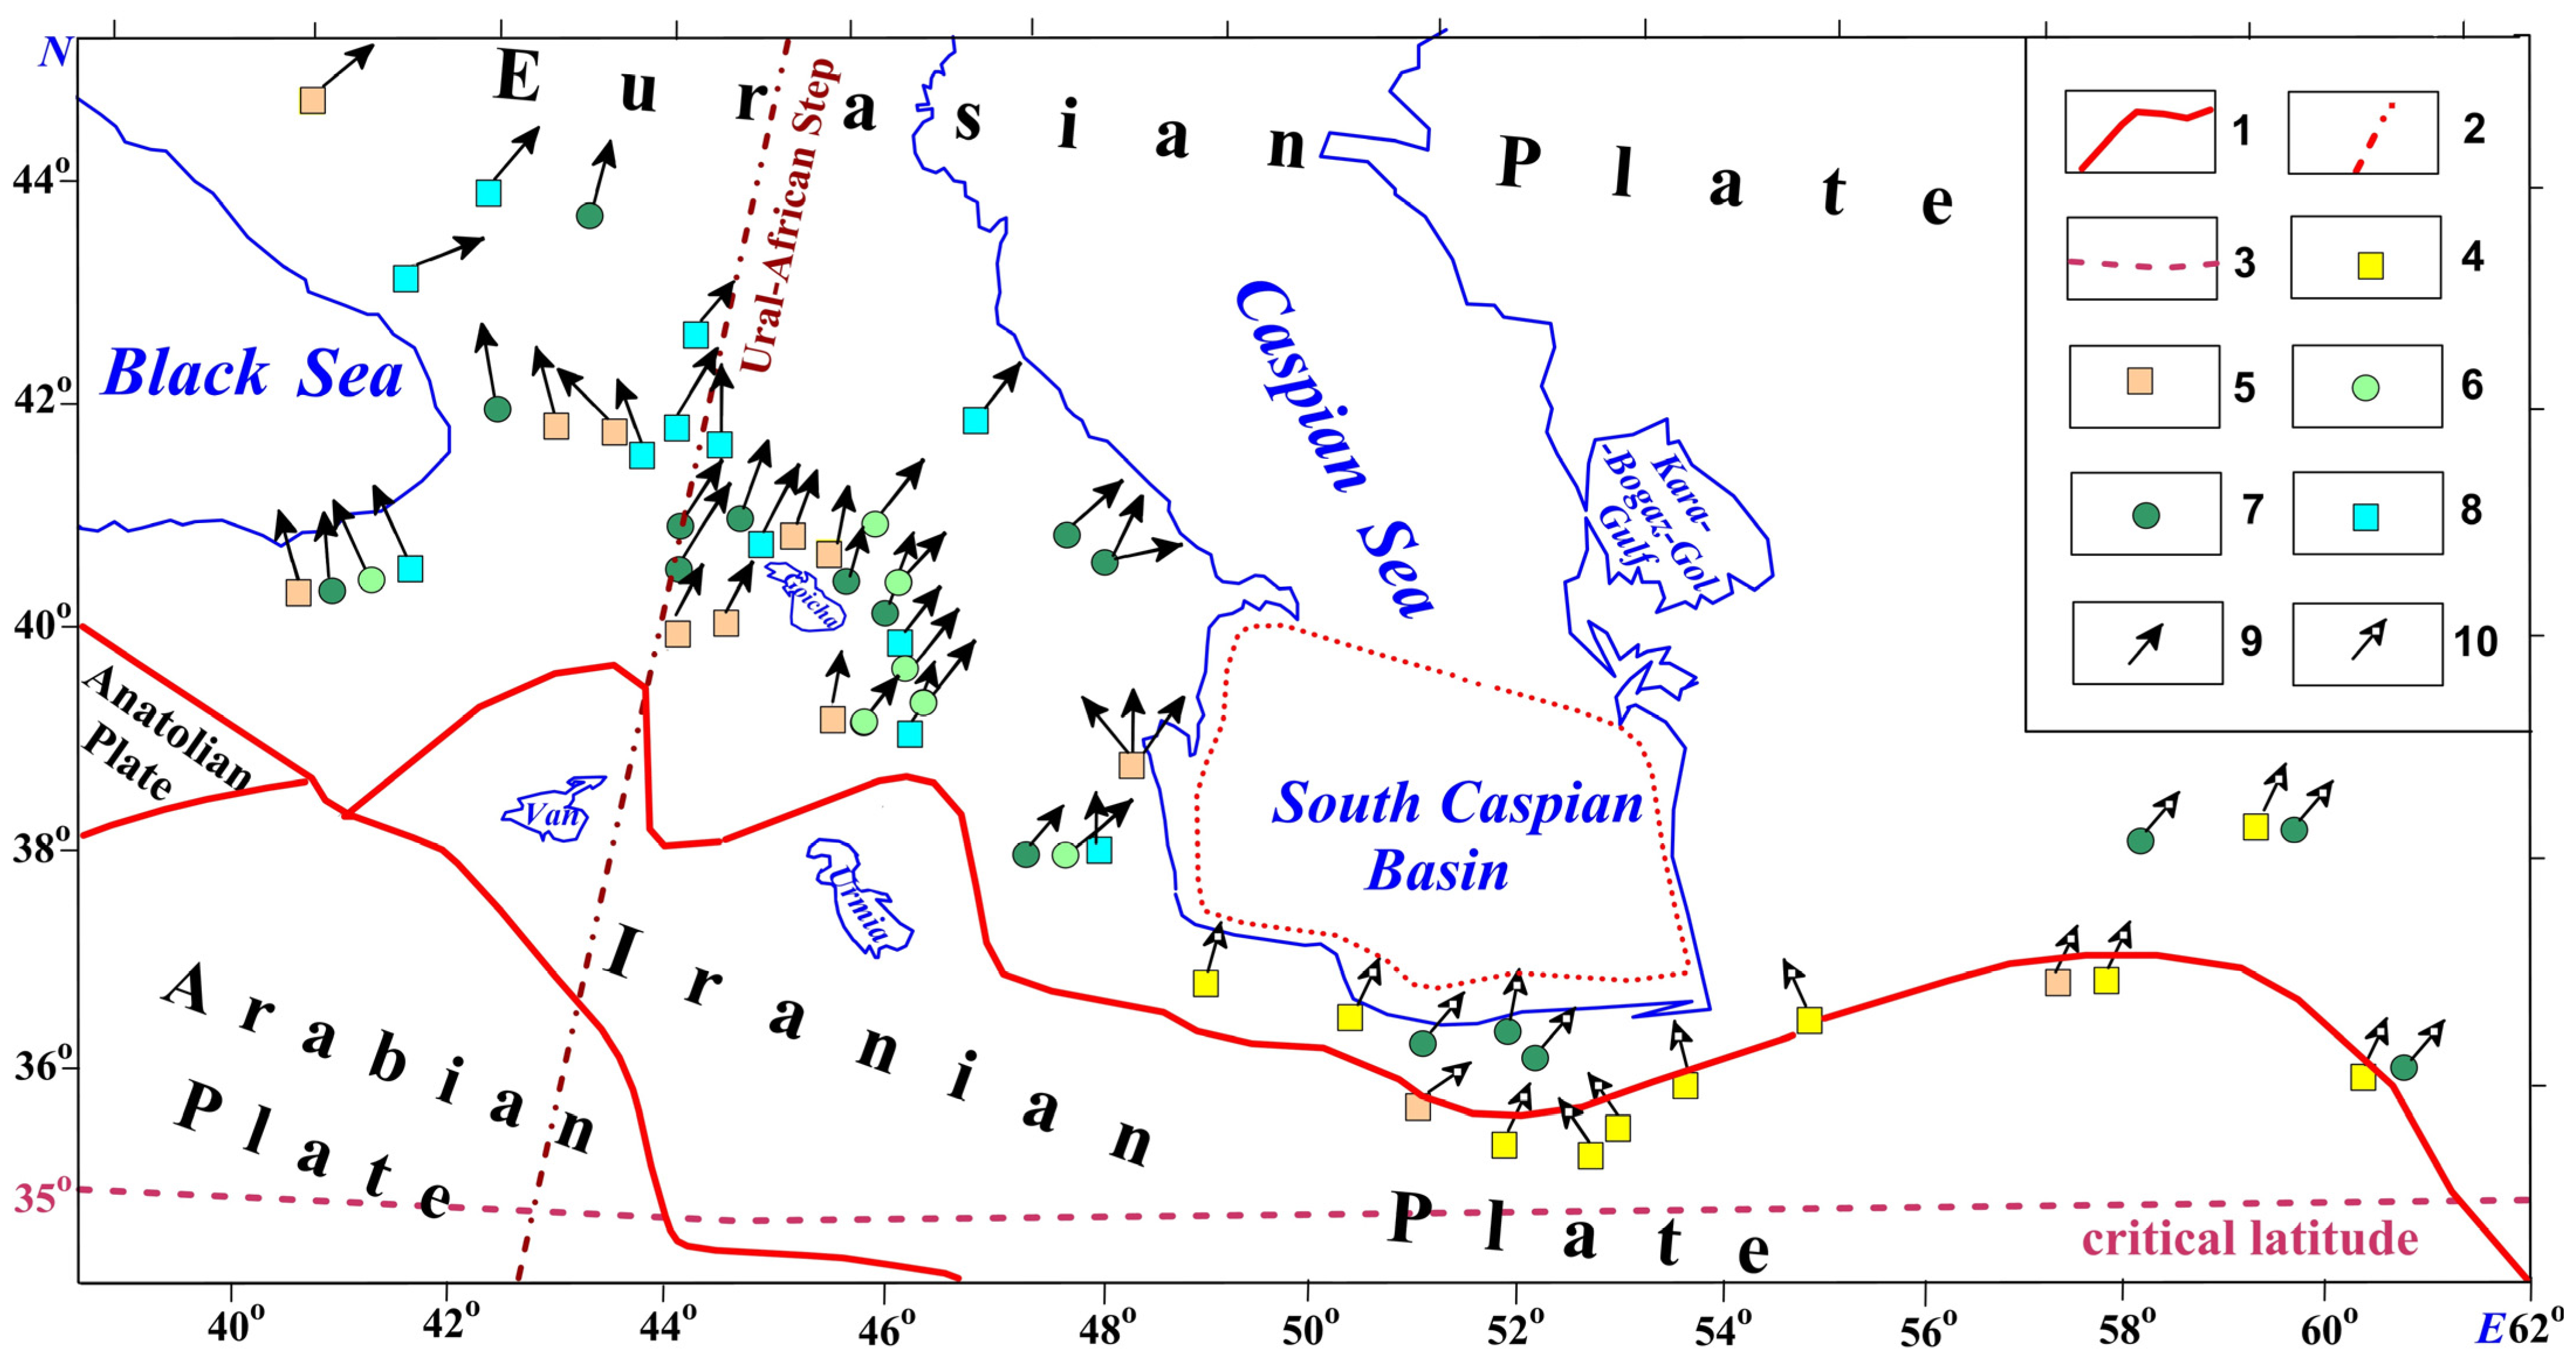
The overall distribution of paleomagnetic vectors within the MRCS contour primarily shows a counterclockwise rotation, whereas outside it exhibits clockwise and alternating rotations, as thoroughly described in Refs. [9,25]. A paleomagnetic direction map created for Azerbaijan and its surrounding regions (Figure 8) highlights the complex interaction between the MRCS, the Ural–African step, and the western segment of the Iranian Plate. The influence of the MRCS results in predominantly counterclockwise paleomagnetic declinations, the African–Arabian step serves as an approximate boundary, and the Iranian Plate causes the paleomagnetic vectors to rotate clockwise.

3.3. Levant Basin (LB)

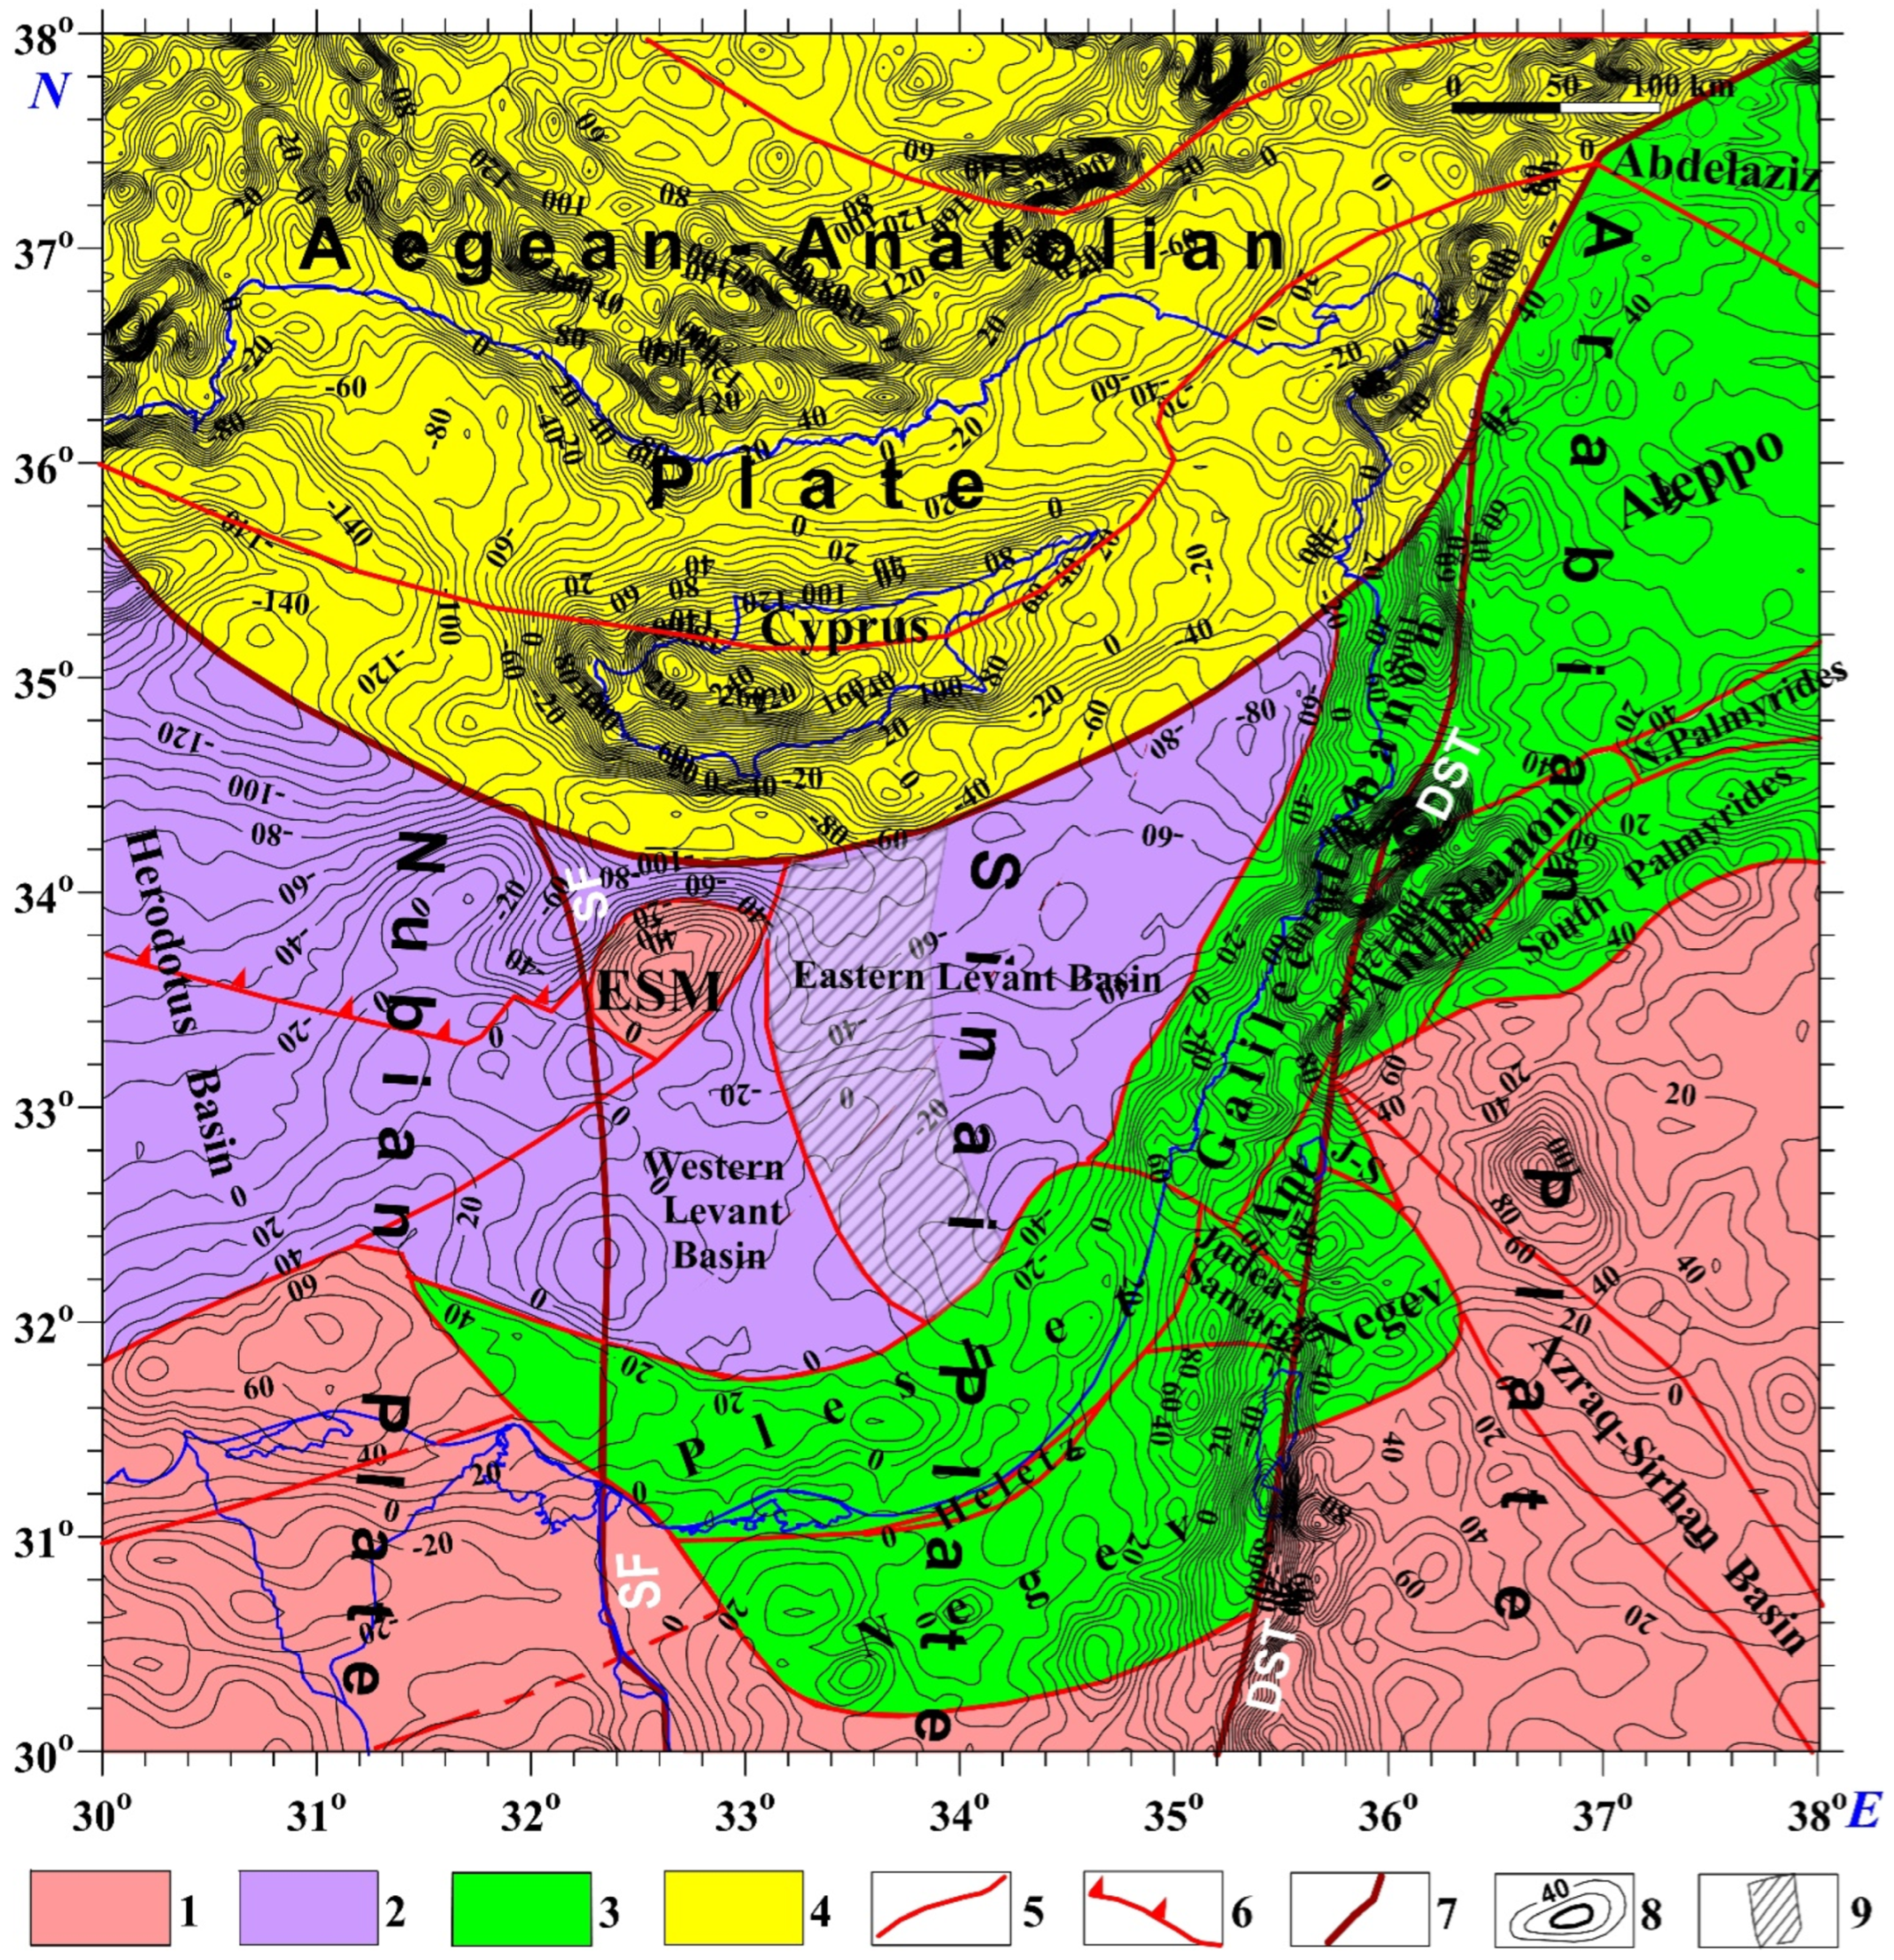
The Levantine Basin (LB) [1] is in the southerly direction between the island arc south of Cyprus and the northern part of the Sinai–Negev plateau. Furthermore, in the latitudinal direction, there are submarine rises stretching north of the Suez Canal to the Eratosthenes Rise (Figure 9). Immediately to the west of the Levant Basin (LB) is the rise corresponding to the underwater delta of the Nile, and even further west is the vast Herodotus Basin. From the east, the LB borders on the carbonate plateaus of the Galilee–Lebanon terrane. Bathymetrically, the LB is divided into two zones: eastern and western [1]. Within the first, extending east from the Eratosthenes Rise, depths from −1000 to −2500 m dominate (Figure 1). In the west part of the LB, to the south of the Eratosthenes Rise, the basin depths, on average, clearly exceed the marks from −800 to −500 m, reaching shelf values in the Pleshet terrane.
Based on the data shown in Figure 9, it is essential to note that the oceanic crust block of the eastern Levant Basin is distinctive, as it represents the oldest oceanic crust on Earth. This is evidenced by the presence of the Early-Late Permian Kiama paleomagnetic reversed polarity zone identified here [75]. We propose that this oceanic crust block originally formed north of the Persian Gulf and was later transported to the Levant Basin along transform faults.
Tectonically, the western and eastern LB zones were defined as independent structures separated by a deep reverse fault [2], which divides the western boundary of the oceanic block related to the Kiama paleomagnetic hyperzone (Figure 9) [75]. The geodynamic nature of the formation of the LB and its surrounding structures has been extensively explored in a series of works on deep geophysics, plate tectonics, and geodynamic geocartography, which have been theoretically synthesized in recent reviews [3,9,25].
The recent work [3] has shown that the LB block should be classified as an oceanic terrane. From the northeast and south, as seen in the considered tectonic scheme, the oceanic terrane is covered by the extensive Mesozoic Terrane Belt zone (Figure 9). To the north of the LB, there is the Eratosthenes Sea Mount (ESM) block and the Cyprus arc of the Alpides, which is part of the Aegean–Anatolian lithospheric plate.
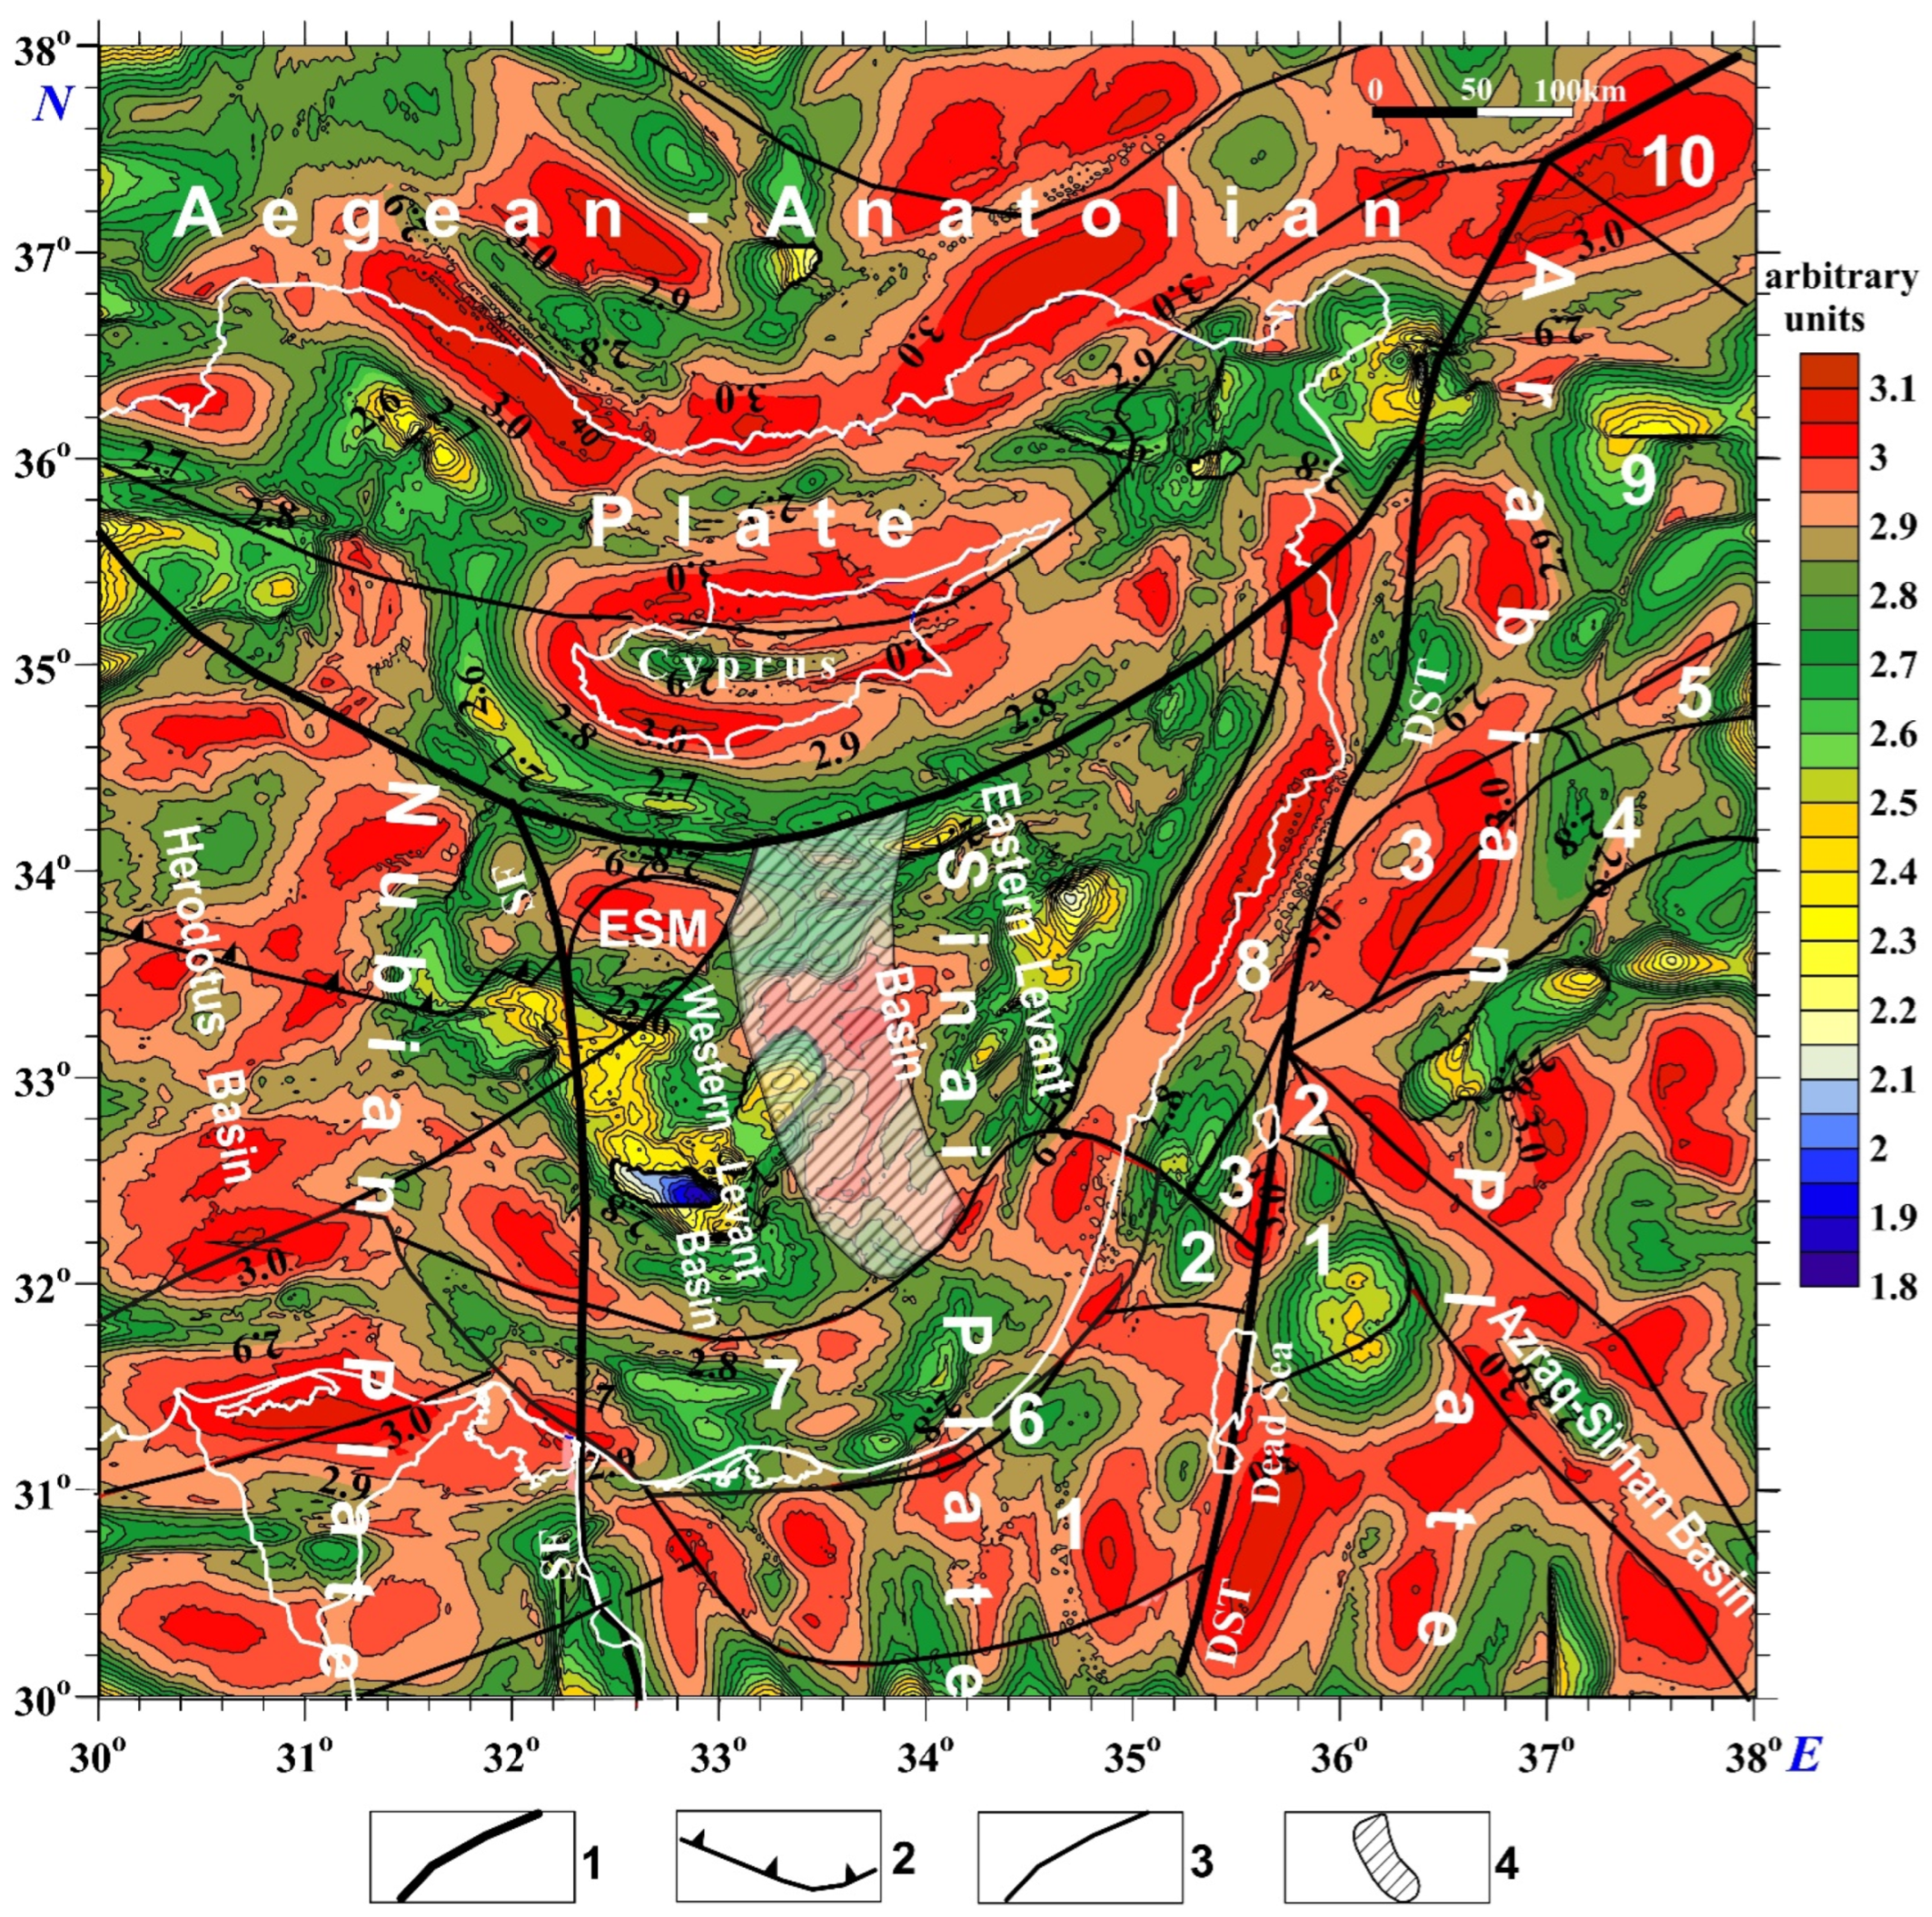
The isolines of the satellite-derived gravity map accurately reflect the differences in the region’s heterogeneous and different-aged tectonic structures under consideration (Figure 9). The most significant data is the difference in structures within the LB. Its western part is characterized by a predominance of positive gravity field values, while the eastern part has negative values.
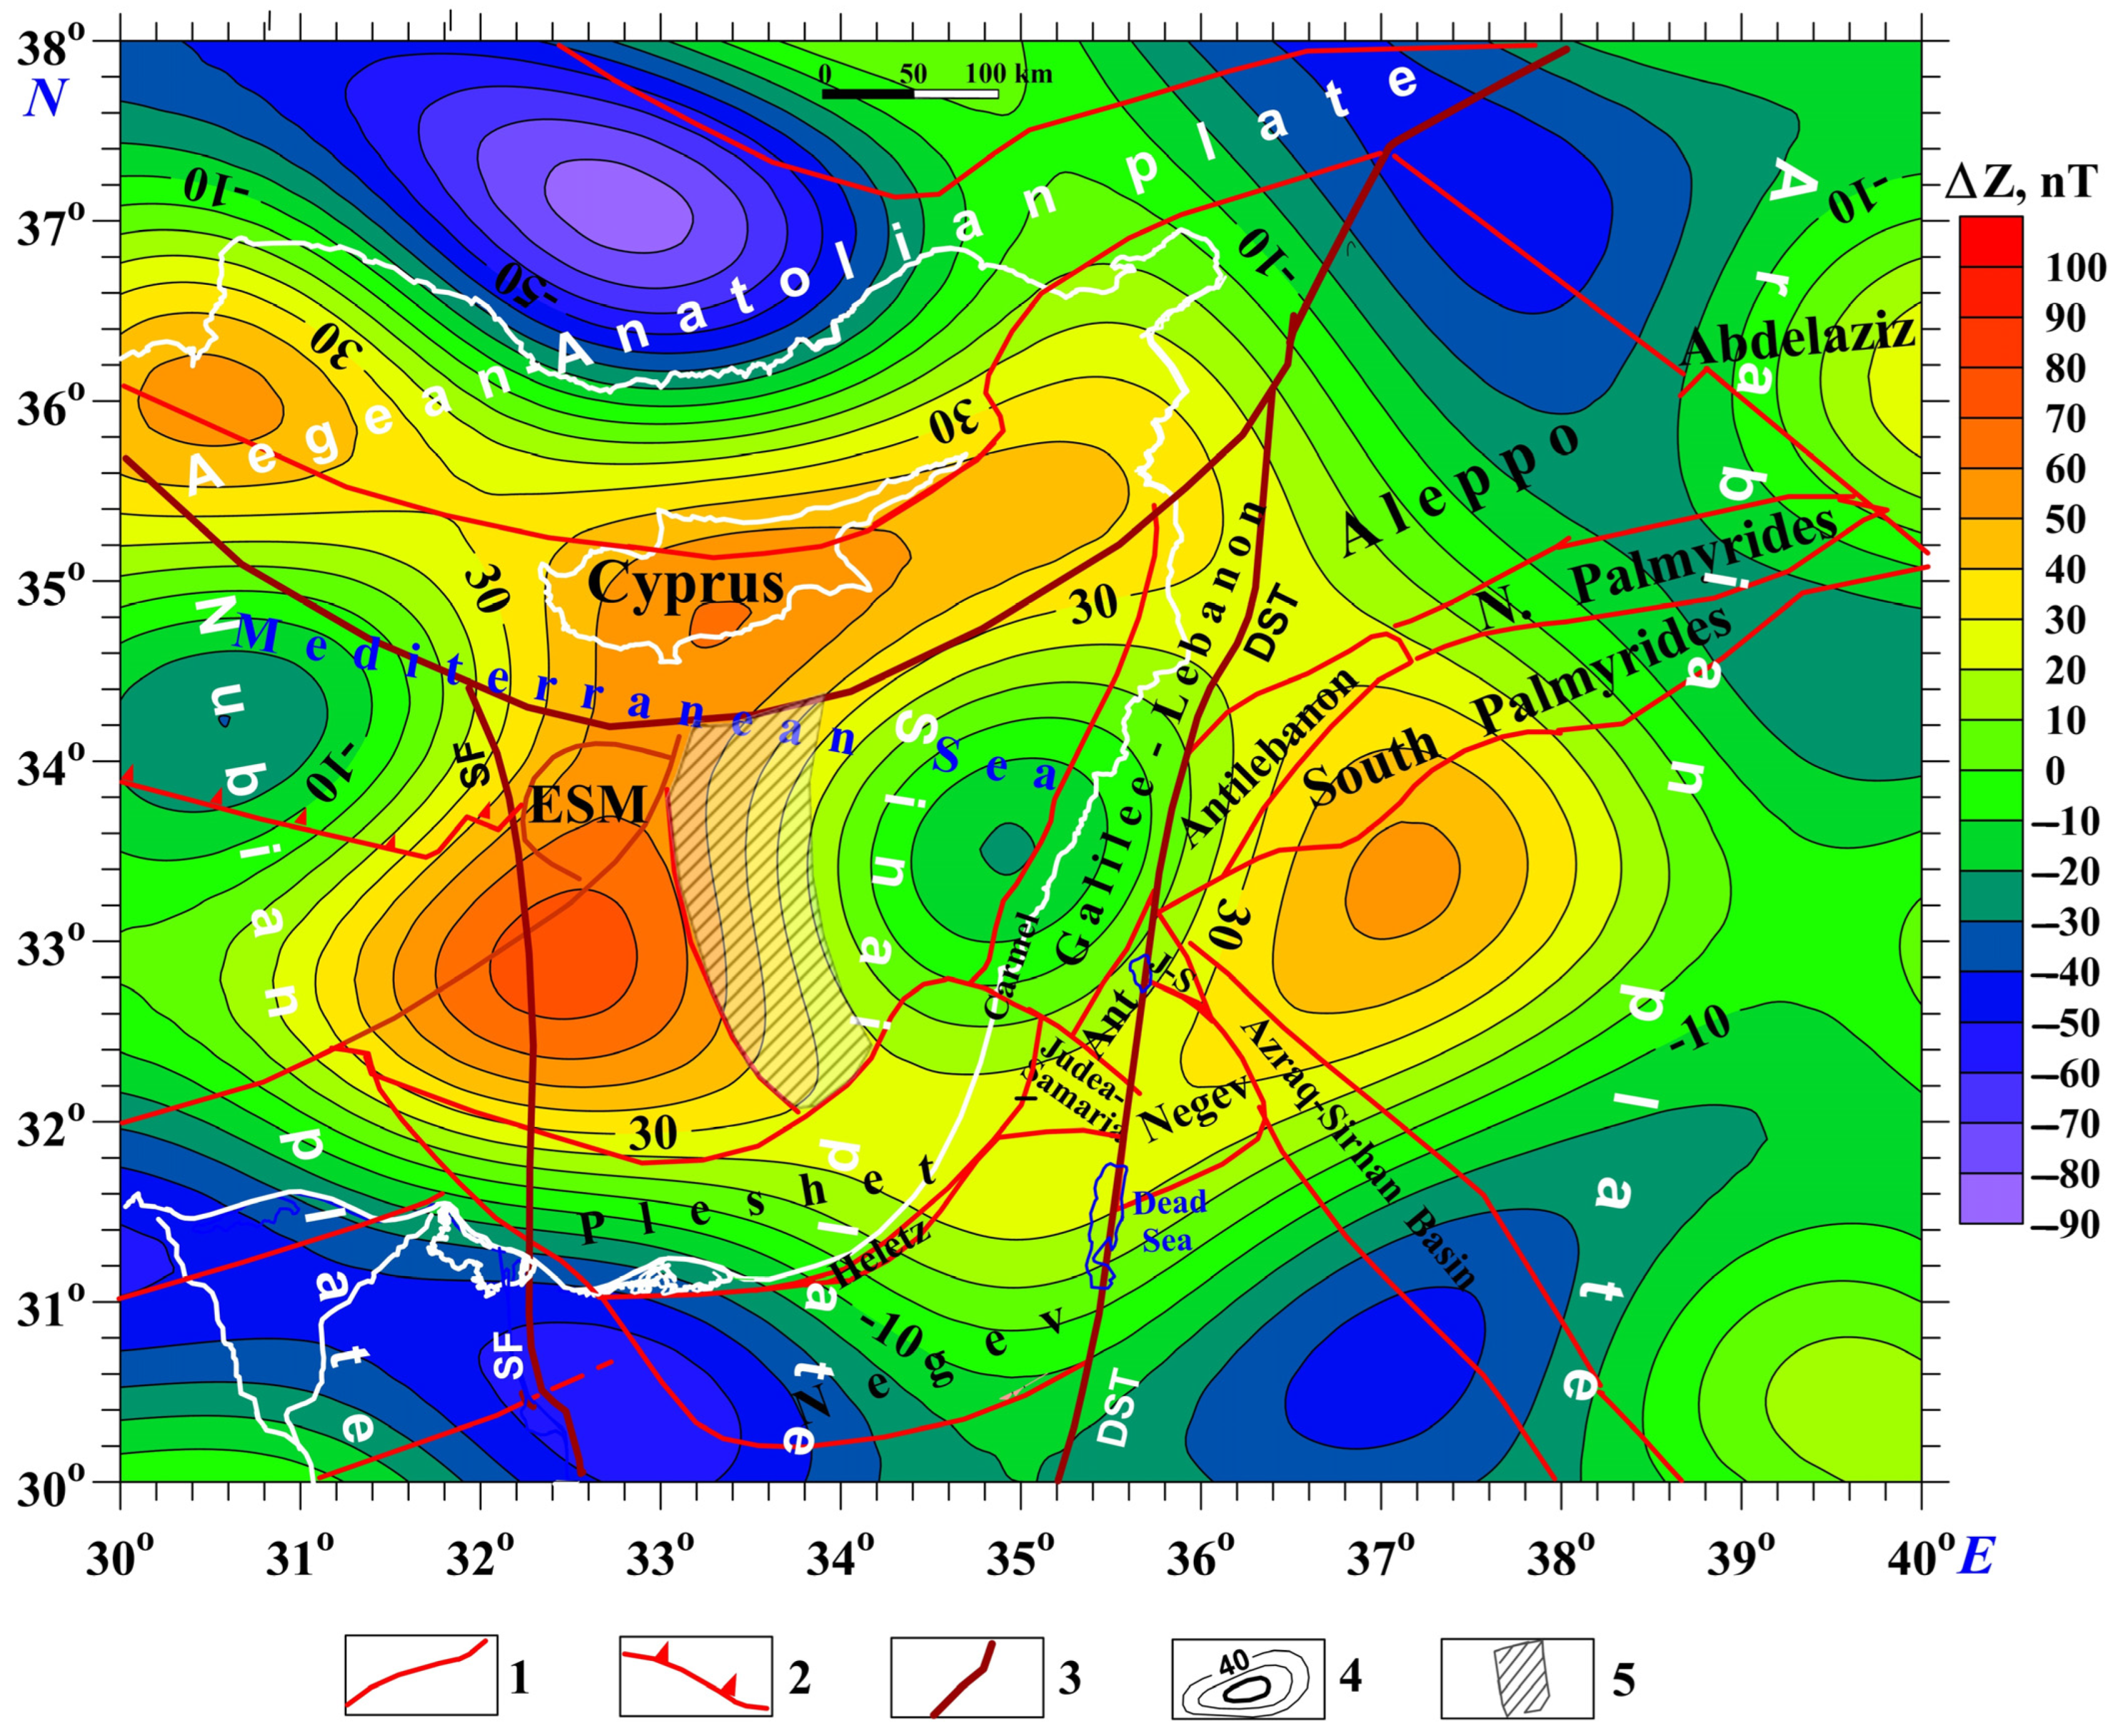
The magnetic ΔZ map (Figure 10) aligns well with bathymetry data, tectonic analysis, and a residual satellite-derived gravity map of the Levant Basin and its adjacent structural zones (Figure 9). Here, we can immediately see a topological paradox: the LB structure with the dominant positive ΔZ values surrounding negative values in the eastern LB block is, in turn, surrounded by a larger field with the negative ΔZ values up to −90 nT. This topological paradox, which suggests the development of rotational geodynamics in the LB region, was highlighted in Ref. [25].
The heat flow measurements in the Levant Basin yield low values, averaging 25–30 mW/m2 [53,54,77]. After adapting for the sedimentation rate, these values increase to 30–35 mW/m2. Unlike the SCB, mud volcanism in the Levant Basin is characterized by isolated manifestations (e.g., [36,103,104]).
Within the LB, several commercial gas deposits have been discovered (e.g., [77,105,106,107,108]). Some geologists suggest that oil deposits may lie beneath the gas deposits at significant depths (7–10 km).
The GPS patterns (e.g., [11,109]) indicate that the Levant Basin is at the center of a giant counterclockwise-rotating vortex. Eppelbaum et al. [9,25] have demonstrated that the influence of the vast rotating mantle structure is responsible for this geodynamic effect. Among other evidence, one can highlight the analysis of paleomagnetic data in the surrounding areas: dikes of the Sinai Peninsula, northern Egypt [45]; dikes of Makhtesh Ramon, southern Israel [77]; Galilee, northern Israel [44]; Baer–Bassit, Syria [46]; Cyprus Island [47,49]; the Anatolia region, Turkey [50,51]; and the Aegean region [52], Crete, Greece [110], showing the counterclockwise-rotating tectonic blocks.
Seismic activity inside the LB indicates an average moderate-heightened level (e.g., [111,112,113,114]). An analysis of the Earth’s crust origin suggests that it is an allochthonous one (at least in the central-southern part of the LB) [3,9,77,115].
We should emphasize that this research highlights the complex nature of the studied region and may serve as a catalyst for further comprehensive and combined research.

4. Discussion

4.1. Basics for the Multifactorial Comparison

For the first time, tectonophysical, geodynamic, structural, geophysical, sedimentation, and paleogeographical parameters for the South Caspian and Levant basins were coordinated with each other and with the corresponding references (Table 1). This allows a clear comparison of seventeen significant parameters. We assume that the data presented in Table 1 will be elaborated upon and extended by other authors.
Historically, the tectonic pattern has been distinguished in regional geological studies and geodynamics and has been considered part of the structural–tectonic analysis in the general geomapping procedure (e.g., [125,126]). Later, when they began to study the oceans, plate tectonics emerged; however, geodynamics as a distinct scientific discipline needed to be established (e.g., [127,128]). Later, as planetary–geophysical research became increasingly involved, geodynamic mapping emerged as a distinct direction from the topological principle that dominated classical geotectonics (e.g., [15]). The development of satellite research led to the need to build complex, reliable models of the environment (sometimes in 4D) (e.g., [11,18,129]). Therefore, the previous structural–tectonic analysis, employing a topologically dominant method, began to be supplemented by geodynamic cartography, which utilized a wide range of multi-level geophysical, structural–tectonic, petrographic, and other methods (e.g., [9,130,131]).
The analysis of several geophysical methods (with application of the known geological principles) allowed each technique to be assessed for its role in identifying the essential features of the SCB and LB’s structure and development.

4.2. Short Gravity Field Comparison

The Bouguer gravity map of the South Caspian Basin (Figure 8) displays anomalies of various shapes and amplitudes. Gravity anomalies in the northern part of the SCB reveal a zone of enhanced horizontal gradients that run roughly parallel to the Caucasus’ structural trend [23].
The northwestern part of the SCB features a significant gravity low, with values reaching −125 mGal. The Bouguer gravity minimum represents the central part of the basin, and an isometric maximum both in the southwest and southeast. The zone of elevated gravity gradients, stretching from the Alborz Mountains in the south to the deep-water region of the basin, is characteristic of the southern segment of the South Caspian Basin (SCB). The Central Alborz Mountains area exhibits a pronounced negative gravity anomaly reaching up to −120 mGal (Figure 5). The gravity modeling conducted in the LB [24] clearly demonstrates the subduction of oceanic crust beneath continental crust. In addition to the potential geophysical field data, seismic profiling data support the proposition of the SCB crust’s subduction under the Absheronian ridge’s continental crust [90]. However, this profile [24] does not strongly support the typical subduction model seen in large collisional zones at ocean–continent boundaries. It is more likely that the subduction effect of the SCB’s rift oceanic crust is driven by intense clockwise rotation. This rotation could contribute to the unusually thick sedimentary layer found in the northern tectonic contact zone and throughout the entire SCB. Together with the region’s unique geochemical characteristics [98], these factors may explain the formation of the numerous mud volcanoes observed in this area.
The Bouguer gravity maps for the Levant Basin are schematic (e.g., [1,21]), characterized by numerous white spots. Therefore, a satellite-derived map of sufficiently contrasting gravity was overlaid on the tectonic scheme (Figure 9). This map effectively describes the key tectonic characteristics of the region under study, namely, Precambrian plates composed of continental crust and oceanic crust blocks, as well as a Mesozoic Terrane Belt (MTB). The primary anomalous peculiarity of the gravity map is the giant Cyprus gravity anomaly (the amplitude of the Bouguer gravity anomaly is almost +200 mGal [19]). We propose that this anomaly may represent a small, narrow mantle plume separated from the main large mantle plume in the upper mantle beneath the island of Cyprus [25]. Additionally, a subtle gravity anomaly is detected over the Eratosthenes Sea Mount, which is a remnant of the continental crust [2].
To uncover concealed tectonic features in the LB, entropy transformation was applied to the satellite-derived gravity field using a 0.5 by 0.5 km sliding window (Figure 11). Entropy computation was realized using the equation
H = i = 1 n p i log 2 ( p i ) ,
where H is the entropy and pi is the probability function. Calculating entropy is a valuable method for analyzing tectonic–geophysical data in intricate physical and geological settings (e.g., [132]). Applying the adaptive form sliding window [133] enabled us to obtain the most reliable entropy estimations in conditions of complex gravity behavior resulting from the superimposed influence of targets of different orders. In other words, the entropy calculation shows a higher resolution compared to the initial maps.
The entropy transformation computation (Figure 11) is consistent with the tectonic elements and terrane locations; the Kiama paleomagnetic hyperzone is well highlighted. According to the distribution of the entropy values (in arbitrary units) in Figure 11, a phenomenon is observed where the difference between the Levant Basin and the surrounding heterogeneous structural elements is evident: the lowest and average values of this parameter predominate here. At the same time, according to the results obtained, the western and eastern parts of the LB are visibly distinguished, separated by increased entropy values in the boundary structure with the Kiama hyperzone.

4.3. Short Magnetic Field Comparison

The South Caspian Basin (SCB) exhibits a gently elevated magnetic field intensity, which gradually decreases toward the south, coinciding with a pronounced subsidence of the crustal basement and a sharp thickening of the Mesozoic–Cenozoic sedimentary sequences.
Analysis of detailed aeromagnetic ΔZ surveys at low altitudes [26] and marine total magnetic field ΔT anomalies [27] allows us to compile the following description. A mosaic magnetic association of negative and positive magnetic anomalies characterizes the central part of the Caspian Sea within the uplifted Kara–Bogaz–Middle Caspian block. This pattern is characteristic of the elevated Kara–Bogaz arch, where Permian–Triassic and Jurassic formations are absent, and low-magnetic terrigenous rocks rest directly on the pre-Permian basement.
In the western part of the SCB (the area of the Baku Archipelago), numerous local positive and negative anomalies of small intensity (up to 100 nT) are observed, reflecting the geological peculiarities of the sedimentary association structure. The geological origin of the regional magnetic maximum in the central part of the South Caspian Basin remains a subject of ongoing debate (see also Figure 6). Dzabayev [26] associated this anomaly with the effect of magmatic rocks occurring on the SCB’s crystalline basement. The magnetic field behavior supports this interpretation, as the characteristics of the magnetic maximum show minimal variation with upward continuation to levels of 4 and 10 km. However, detailed analysis reveals that this anomaly is composed of several distinct components [119]. It was identified through a combined interpretation of residual anomalies (from 0 to 10 km depth) and the regional magnetic field at a depth of 10 km. Notably, the magnetic maximum in the northern part of the area corresponds to a prominent gravity maximum observed in the western region of the SCB.
A correlation between the gravity and magnetic anomalies was observed in the Middle Kur Depression (many authors geodynamically link this depression with the SCB (e.g., [34])). This relationship is explained by a physical–geological model, which proposes that younger Mesozoic magmatic rocks intruded into a weakened zone along the periphery of the pre-Alpine basement uplift [119].
Sedimentary deposits in the South Caspian Basin span the Jurassic to the Pleistocene periods [34,39,64], with the Pliocene–Holocene strata being the most extensive in terms of thickness. The paleomagnetic characteristics of these strata are uniform across both the eastern and western margins of the SCB. This consistency allows for interpretation based on the principles of normal magnetization (e.g., Bakunian, parts of the Absheronian, and the lower Akchagylian) and reverse magnetization (e.g., Absheronian, upper Akchagylian, and the productive red beds in Western Turkmenistan) (Ref. [43]; unpublished reports by T.A. Ismailzadeh, 1972–1985). These findings highlight the importance of directly studying paleomagnetic parameters within the SCB.
The magnetic pattern in the LB is more intricate due to the combination of three significant anomalies: the Eratosthenes Sea Mount (EMS), Carmel, and an inversely magnetized oceanic block crust related to the Kiama paleomagnetic hyperzone (e.g., [28,75,77]). The block has a trapezoidal form, with an average depth of 10.5 km, a vertical thickness of approximately 10 km (see Figure 11), and a total volume of this zone exceeding 120,000 km3 [2,77]. A paleomagnetic map, developed using the detailed geophysical data analysis alongside a thorough review of structural, radiometric, petrological, facies, paleogeographical, and additional data, reveals that the Jalal hyperzone lies west of the Kiama paleomagnetic hyperzone, while to the east are the Illawarra, Omolon, and Gissar paleomagnetic hyperzones [77]. The identification of the Kiama paleomagnetic hyperzone, together with tectonic–geodynamic analysis and paleobiogeographical data evaluation [9], suggests that transform faults may have transported blocks of the Earth’s oceanic crust from the eastern Neotethys Ocean to their present location in the Levant Basin.

4.4. A Very Brief Thermal Field Comparison

The numerous heat flow measurements in the SCB estimate approximately 50 mW/m2 (e.g., [59,60]). This value exceeds the geothermal flow of the oceanic basins but is significantly less than the average heat flow calculated for the continental crust (e.g., [134]).
The average heat flow in the LB is 30–35 mW/m2 after applying the sedimentation correction [53,54,55,77]. This value is lower than the average geothermal heat flow of 40 mW/m2 estimated for the deep oceanic basins [134]. Undoubtedly, the above-mentioned low value supports the proposition that the oceanic crust of the Levant Basin is of an ancient age [77].

4.5. A Very Brief Description of Seismic and Seismotomographic Data

In both basins, numerous seismic surveys have been conducted (e.g., [1,2,21,34,35,36,38,39,58,64,66,79,81,87,90,96,117]). These seismic works enabled the identification of multiple peculiarities in the near-surface and intermediate deep structure (fault pattern, tectonic block location, sedimentary deposit thickness, position of the crystalline basement, and Moho discontinuity). At the same time, analysis of seismic data indicates the need to observe the extended profiles of deep seismic sounding (10–60 km) in both the SCB and LB basins.
For this study, seismotomographic data analysis (e.g., [10,33,37,40,41,42]), which enables us to compare the two studied basins under the influence of a deep rotating structure, is crucial.

4.6. Sedimentation in the SCB and LB: Short Sketch

The examination of the sedimentary thickness in the SCB and Eastern Mediterranean [16] was based on the previous studies by Khain et al. [135] and Ronov [136]. The South Caspian Basin ranks among the world’s deepest basins, with sedimentary layer thicknesses reaching up to 28.5 km [24]. The terrigenous–carbonate formations in the SCB range from the Jurassic to the Pleistocene [24,39,64]. Notably, no salt deposits have been identified in the SCB [34]. In the LB, the terrigenous–carbonate formations range from the Upper Permian to the Late Cenozoic [1,32,35]. The thickness of the sedimentary deposits in the LB is 2.0–2.5 times smaller than in the SCB [2,35,66]. The Upper Miocene (Messinian) salt deposits are widely presented here (e.g., [74,93]). The mud volcanoes in the LB are presented as several units only [36,103].
Considering the low thermal gradient values in both basins, there is some hope for discovering new industrial hydrocarbon deposits associated with greater depths, such as those found in the Gulf of Mexico (e.g., [137,138]).

4.7. Essential Tectonic-Geodynamic Highlights

The deep-mantle regional structure, as detected by approximately fifteen independent factors in this region [9,10,25], is crucial for understanding the complex geological and geophysical phenomena of the transition zone between Eurasia and Gondwana. Figure 2 plainly shows that the LB basin under consideration is located south of the critical latitude of 35°, and the Cyprus and Crete arcs adjacent to the north of it are located directly on the critical parallel dividing the Earth’s polar and equatorial segments. Therefore, the critical parallel does not explain the LB’s identified geological-geophysical phenomenon, and the main reason is a deep mantle rotating structure. The isolines of the residual satellite gravity field (Figure 2), along with the GPS vector behavior and the regional magnetic field patterns [25], clearly indicate that the Levant Basin (LB) lies directly above the apex of a deep mantle structure, highlighting its position within a geodynamically unstable zone.
Geophysical data analysis reveals a clear structural contrast between the Levant Basin, which is encircled by a network of deep faults associated with neighboring lithospheric plates, and the Mesozoic Terrane Belt. This disparity cannot be sufficiently explained by surface tectonic analysis alone and therefore requires interpretation from the perspective of deep geophysics and geodynamics.
The revealed giant mantle structure (centered below Cyprus Island), the Iranian Plate, and the SCB create a complex geodynamic ensemble. A regional geodynamic study (see, for instance, Figure 2) and the integrated analysis presented by Eppelbaum et al. [9,25] indicate that the counterclockwise rotation of the mantle structure is reflected in the rotation of the lithospheric blocks that occur above. The rotation of the lithospheric block in the eastern branch triggers a north–northeast (NNE) movement of the Iranian Plate (e.g., [30]). Conversely, this NNE displacement of the Iranian Plate results in the clockwise rotation of the South Caspian Basin (Figure 12).
As key geological structures, the Levant and South Caspian basins play a central role in shaping the current geodynamics of the Middle East and the Caucasus, while also having had a significant impact on geological processes throughout various periods of the Earth’s history [139]. The Akchagylian hydrospheric event (1.9–2.4 Ma) observed in both basins has been associated [140] with their location near the Earth’s critical latitude of 35°, which delineates the boundary between areas of conjugate deformation of the Earth’s rotational ellipsoid and the development of the extended estuaries of the Volga and Nile rivers.
Conversely, the Caspian and Levant regions (as previously noted and illustrated in Figure 12) were situated near distinct zones of the rotating deep mantle structure, whose active geodynamics influenced the troughs of the South Caspian, Levant, and related structures. According to our estimation, which is based on an integrated analysis of numerous geological and geophysical data [3], the counterclockwise rotation of the mantle structure began approximately 160–180 million years ago.

4.8. The Directions for Further Research

Further research in the LB and SCB basins, in our opinion, can be divided into three main stages. (1) In both basins, deep seismic sounding (profiling) must be conducted that will help us better understand the deep structure pattern; (2) the employment of modern-generation underwater remotely operated vehicles for geophysical field measurements; (3) drilling deep boreholes in both basins (in the SCB, to the depth of 10 km, and in the LB, to the depth of 8.5 km) and coordinating these data with the obtained geophysical results; and (4) a comprehensive integrated interpretation of all available data using modern mathematical support: borehole sections, sea bottom geophysical measurements, marine studies of different geophysical methods, and airborne and satellite geophysical observations.

5. Conclusions

The analysis presented above allows us to outline the following key conclusions:
(1)
For the first time, a comprehensive multi-component tectonic–geodynamic, sedimentary, and geophysical comparison of the South Caspian Basin and the Levant Basin has been conducted.
(2)
The Levant Basin lies above the projected center of a giant, counterclockwise-rotating deep mantle structure and undergoes rotation in the same direction.
(3)
The eastern segment of the counterclockwise-rotating deep mantle structure affects the western portion of the Iranian Plate, which has a complex configuration. This interaction drives the Iranian Plate’s movement toward the north and north–northeast, subsequently inducing the clockwise rotation of the South Caspian Basin.
(4)
Active geodynamics with the underthrust of the SCB’s thickest terrigenous sedimentary layer under the Absheron ridge, with the simultaneous clockwise rotation, could be one of the reasons for the high intensity of mud volcanism in the basin.
(5)
The tectonic–geodynamic analysis indicates that the Earth’s crust under the Levant Basin and South Caspian Basin is mainly allochthonous and autochthonous, respectively.
(6)
Low heat-flow values and thick sedimentary layers in both basins provide opportunities to explore commercial hydrocarbon deposits at great depths (8–13 km for the SCB and 7–10 km for the LB).

Author Contributions

L.E.: writing—review and editing, writing—original draft, software, methodology, investigation, supervision, project administration, conceptualization; Y.K.: writing—review and editing, writing—original draft, data curation, methodology, investigation; F.K.: data curation, resources, visualization, conceptualization; I.G.: data curation, resources, validation, visualization; Z.B.-A.: investigation, methodology, formal analysis, project administration, conceptualization. All authors have read and agreed to the published version of the manuscript.

Funding

This research received no external funding.

Data Availability Statement

Not applicable.

Acknowledgments

The authors would like to thank three anonymous reviewers and the Academic Editor for their thorough review of the manuscript. Their critical comments and valuable suggestions were highly constructive in the preparation of this paper.

Conflicts of Interest

The authors declare no conflicts of interest.

References

  1. Hall, J.K.; Krasheninnikov, V.A.; Hirsch, F.; Benjamini, C.; Flexer, A. (Eds.) Geological Framework of the Levant. The Levantine Basin and Israel; Historical Productions-Hall: Jerusalem, Israel, 2005; Volume II, 827p. [Google Scholar]
  2. Ben-Avraham, Z.; Ginzburg, A.; Makris, J.; Eppelbaum, L. Crustal structure of the Levant basin, Eastern Mediterranean. Tectonophysics 2002, 346, 23–43. [Google Scholar] [CrossRef]
  3. Eppelbaum, L.V.; Katz, Y.I.; Kadirov, F.A. The relationship between the paleobiogeography of the northern and southern sides of the Neotethys and the deep geodynamic processes. ANAS Trans. Earth Sci. 2024, No. 1, 57–76. [Google Scholar] [CrossRef]
  4. Stampfli, G.M.; Borel, G.D. A plate tectonic model for the Paleozoic and Mesozoic constrained by dynamic plate boundaries and restored synthetic oceanic isochrones. Earth Planet. Sci. Lett. 2002, 196, 17–33. [Google Scholar] [CrossRef]
  5. Ben-Avraham, Z.; Nur, A.; Jones, D.; Cox, A. Continental accretion and orogeny: From oceanic plateaus to allochthonous terranes. Science 1981, 213, 47–54. [Google Scholar] [CrossRef]
  6. Motaghi, K.; Tatar, M.; Priestley, K.; Romanelli, F.; Doglioni, C.; Panza, G.F. The deep structure of the Iranian Plateau. Gondwana 2015, 28, 407–418. [Google Scholar] [CrossRef]
  7. Le Pichon, X.; Şengör, A.M.C.; İmren, C. A new approach to the opening of the eastern Mediterranean Sea and the origin of the Hellenic Subduction Zone. Part 1: The eastern Mediterranean Sea. Can. J. Earth Sci. 2019, 56, 1119–1143. [Google Scholar] [CrossRef]
  8. Mattei, M.; Visconti, A.L.; Cifelli, F.; Nozaem, R.; Winkler, A.; Sagnotti, L. Clockwise paleomagnetic rotations in northeastern Iran: Major implications on recent geodynamic evolution of outer sectors of the Arabia-Eurasia collision zone. Gondwana Res. 2019, 71, 194–209. [Google Scholar] [CrossRef]
  9. Eppelbaum, L.V.; Ben-Avraham, Z.; Katz, Y.; Cloetingh, S.; Kaban, M. Giant quasi-ring mantle structure in the African-Arabian junction: Results derived from the geological-geophysical data integration. Geotectonics 2021, 55, 67–93. [Google Scholar] [CrossRef]
  10. Eppelbaum, L.V.; Katz, Y.I.; Ben-Avraham, Z. A giant quasi-ring mantle structure beneath the Eastern Mediterranean: Interpretation of new magnetic, paleobiogeographic, and seismic tomography data. Geotectonics 2025, 59, 3–31. [Google Scholar] [CrossRef]
  11. Reilinger, R.E.; McClusky, S.; Vernant, P.; Lawrence, S.; Ergintav, S.; Cakmak, R.; Ozener, H.; Kadirov, F.; Guliyev, I.; Stepanyan, R.; et al. GPS constraints on continental deformation in the Africa-Arabia-Eurasia continental collision zone and implications for the dynamics of plate interactions. J. Geophys. Res. 2006, 111, B05411. [Google Scholar] [CrossRef]
  12. Kadirov, F.A.; Guliyev, I.S.; Feyzullayev, A.A.; Safarov, P.T.; Mammadov, S.K.; Banayev, G.R.; Rashidov, T.M. Crustal deformations in Azerbaijan according to GPS data and their influence on seismicity and mud volcanism. Phys. Solid Earth 2014, 50, 814–823. [Google Scholar] [CrossRef]
  13. Kadirov, F.; Yetirmishli, G.; Safarov, R.; Mammadov, S.; Kazimov, I.; Floyd, M.; Reilinger, R.; King, R. Results from 25 years (1998–2022) of crustal deformation monitoring in Azerbaijan and adjacent territory using GPS. ANAS Trans. Earth Sci. 2024, No. 1, 28–43. [Google Scholar] [CrossRef]
  14. Khorrami, F.; Vernant, P.; Masson, F.; Nilfouroushan, F.; Mousavi, Z.; Nankali, H.; Saadat, S.A.; Walpersdorf, A.; Hosseini, S.; Tavakoli, P.; et al. An up-to-date crustal deformation map of Iran using integrated campaign-mode and permanent GPS velocities. Geophys. J. Int. 2024, 217, 832–843. [Google Scholar] [CrossRef]
  15. Khain, V.E. Tectonics of Continents and Oceans; Scientific World: Moscow, Russia, 2001; 606p. (In Russian) [Google Scholar]
  16. Abdullayev, N.R. Analysis of sedimentary thickness, volumes, and geographic extent of the world sedimentary basins. ANAS Trans. Earth Sci. 2020, No. 1, 28–36. [Google Scholar] [CrossRef]
  17. Eppelbaum, L.V. Comparison of 3D integrated geophysical modeling in the South Caucasian and Eastern Mediterranean segments of the Alpine-Himalayan tectonic belt. Izv. Acad. Sci. Azerb. Rep. Ser. Earth Sci. 2015, 3, 25–45. [Google Scholar]
  18. Sandwell, D.T.; Smith, W.H.F. Global marine gravity from retracked Geosat and ERS-1 altimetry: Ridge segmentation versus spreading rate. J. Geophys. Res. 2009, 114, B01411. [Google Scholar] [CrossRef]
  19. Gass, I.G.; Masson-Smith, D. The geology and gravity anomalies of the Troodos Massif, Cyprus. Philos. Trans. R. Soc. London. Ser. A 1963, 255, 417–466. [Google Scholar] [CrossRef]
  20. Kadirov, F.A. Gravity Field and Models of Azerbaijan’s Deep Structure. Inst. of Geology of the Azerbaijan Republic and Nafta Press: Baku, Azerbaijan, 2000; 112p. [Google Scholar]
  21. Ben-Avraham, Z.; Ginzburg, A. Displaced terranes and crustal evolution of the Levant and the Eastern Mediterranean. Tectonics 1990, 9, 613–622. [Google Scholar] [CrossRef]
  22. Granath, J.W.; Soofi, K.A.; Baganz, O.W.; Bagirov, E. Gravity Modeling and Its Implications to the Tectonics of the South Caspian Basin. In Oil and Gas of the Greater Caspian Area; Yilmaz, P.O., Isaksen, G.H., Eds.; AAPG Studies in Geology; American Association of Petroleum Geologists: Tulsa, OK, USA, 2007; Volume 55, pp. 43–46. [Google Scholar] [CrossRef]
  23. Kadirov, F.A.; Gadirov, A.H. A gravity model of the deep structure of South Caspian Basin along submeridional profile Alborz–Absheron Sill. Glob. Planet. Change 2014, 114, 66–74. [Google Scholar] [CrossRef]
  24. Abdullayev, N.R.; Kadirov, F.A.; Guliyev, I.S. Subsidence history and basin-fill evolution in the South Caspian Basin from geophysical mapping, flexural backstripping, forward lithospheric modelling and gravity modeling. In Geological Evolution of Central Asian Basins and the Western Tien Shan Range; Brunet, M.-F., McCann, T., Sobel, E.R., Eds.; Geological Society of London: London, UK, 2017; Volume 427, pp. 175–196. [Google Scholar] [CrossRef]
  25. Eppelbaum, L.V.; Katz, Y.I.; Ben-Avraham, Z. The reasons for enormous accumulation of the geodynamic tension in Eastern Turkey: A multidisciplinary study. Geol. Geophys. Earth Sci. 2024, 2, 1–28. [Google Scholar] [CrossRef]
  26. Dzabayev, A.A. Principles of the Searching and Study of Oil-and-Gas Bearing Structures by Aeromagnetic Method (South Caspian Basin); Statistics: Ashkhabad, Turkmenistan, 1969; 217p. (In Russian) [Google Scholar]
  27. Glumov, I.F.; Malovitsky, Y.P.; Novikov, A.A.; Senin, B.V. Regional Geology and Oil-and-Gas bearing of the Caspian Sea; Nedra: Moscow, Russia, 2004; 342p. (In Russian) [Google Scholar]
  28. Eppelbaum, L.V.; Katz, Y.I.; Ben-Avraham, Z. Geodynamic aspects of magnetic data analysis and tectonic-paleomagnetic mapping in the Easternmost Mediterranean: A review. Appl. Sci. 2023, 13, 10541. [Google Scholar] [CrossRef]
  29. Eppelbaum, L.V. Processing and interpreting magnetic data in the Caucasus Mountains and the Caspian Sea: A review. AIMS Geosci. 2024, 10, 333–370. [Google Scholar] [CrossRef]
  30. ArRajehi, A.; McClusky, S.; Reilinger, R.; Daoud, M.; Alchalbi, A.; Ergintav, S.; Gomez, F.; Sholan, J.; Bou-Rabee, F.; Ogubazghi, G.; et al. Geodetic constraints on the present-day motion of the Arabian Plate: Implications for Red Sea and Gulf of Aden rifting. Tectonics 2024, 29, TC3011. [Google Scholar] [CrossRef]
  31. Kadirov, F.; Floyd, M.; Alizadeh, A.; Guliev, I.; Reilinger, R.; Kuleli, S.; King, R.; Toksoz, M.N. Kinematics of the eastern Caucasus near Baku, Azerbaijan. Nat. Hazards 2012, 63, 997–1006. [Google Scholar] [CrossRef]
  32. Gardosh, M.A.; Druckman, Y. Seismic stratigraphy, structure, and tectonic evolution of the Levantine Basin, offshore Israel. Geol. Soc. Lond. Spec. Publ. 2006, 260, 201–227. [Google Scholar] [CrossRef]
  33. Li, C.; van der Hilst, R.D.; Engdahl, E.R.; Burdick, S. A new global model for P wave speed variations in Earth’s mantle. Geochem. Geophys. Geosystems 2008, 9, 1–21. [Google Scholar] [CrossRef]
  34. Guliyev, I.S.; Fyodorov, D.L.; Kulakov, S.L. Oil and Gas Potential of the Caspian Region; Nafta Press: Baku, Azerbaijan, 2009; 409p. (In Russian) [Google Scholar]
  35. Hawie, N.; Gorini, C.; Deschamps, R.; Nader, F.H.; Montadert, L.; Granjeon, D.; Baudin, F. Tectono-stratigraphic evolution of the northern Levant Basin (offshore Lebanon). Mar. Pet. Geol. 2013, 48, 392–410. [Google Scholar] [CrossRef]
  36. Kirkham, C.B. A 3D Seismic Interpretation of Mud Volcanoes Within the Western Slope of the Nile Cone. Ph.D. Thesis, Cardiff University, Cardiff, UK, 2015. [Google Scholar]
  37. Trifonov, V.G.; Sokolov, S.Y. Mantle structure and tectonic zoning of the central part of the Alpine-Himalayan belt. Geodyn. Tectonophys. 2018, 9, 1127–1145. (In Russian) [Google Scholar] [CrossRef]
  38. Pavlenkova, N.I.; Yegorova, T.P.; Baranova, E.P.; Pavlenkova, G.A. Deep Structure and Geodynamics of the Black Sea–Caspian Region. Geotectonics 2022, 56, 157–177. [Google Scholar] [CrossRef]
  39. Alizadeh, A.A.; Guliyev, I.S.; Mamedov, P.Z.; Aliyeva, E.G.-M.; Feyzullayev, A.A.; Huseynov, D.A.; Eppelbaum, L.V. Pliocene Hydrocarbon Sedimentary Series of Azerbaijan; Springer: Berlin/Heidelberg, Germany, 2024; 514p. [Google Scholar] [CrossRef]
  40. Eppelbaum, L.; Katz, Y.; Kadirov, F.; Guliyev, I.; Ben-Avraham, Z. Analysis of complex geodynamic interactions in the eastern part of Central Gondwana and Eurasia. ANAS Trans. Earth Sci. 2025, 1, 45–63. [Google Scholar] [CrossRef]
  41. Hafkenscheid, E.; Wortel, M.J.R.; Spakman, W. Subduction history of the Tethyan region derived from seismic tomography and tectonic reconstructions. J. Geophys. Res. 2006, 111, 1–26. [Google Scholar] [CrossRef]
  42. Van der Meer, D.G.D.; van Hinsbergen, J.J.; Spakman, W. Atlas of the underworld: Slab remnants in the mantle, their sinking history, and a new outlook on lower mantle viscosity. Tectonophysics 2018, 723, 309–448. [Google Scholar] [CrossRef]
  43. Ismail-Zadeh, T.A. Paleomagnetic investigations of the Meso-Cenozoic of Azerbaijan. Ph.D. Thesis, Institute of the Physics of the Earth, Moscow, Russia, 1983. (In Russian). [Google Scholar]
  44. Ron, H.; Freund, R.; Garfunkel, Z.; Nur, A. Block rotation by strike-slip faulting: Structural and paleomagnetic evidence. J. Geophys. Res. 1984, 89, 6256–6270. [Google Scholar] [CrossRef]
  45. Ibrahim, E.H.; Odah, H.H.; El Agami, H.L.; Abu El Enen, M. Paleomagnetic and geological investigation into southern Sinai volcanic rocks and the rifting of the Gulf of Suez. Tectonophysics 2000, 321, 343–358. [Google Scholar] [CrossRef]
  46. Morris, A.; Erson, M.W.; Robertson, A.H.; Al-Riyami, K. Extreme tectonic rotations within an eastern Mediterranean ophiolite (Baer–Bassit, Syria). Earth Planet. Sci. Lett. 2000, 202, 247–261. [Google Scholar] [CrossRef]
  47. Borradaile, G.J.; Lucas, K. Tectonics of the Akamas and Mamonia ophiolites, Western Cyprus: Magnetic petrofabrics and paleomagnetism. J. Struct. Geol. 2003, 25, 2053–2076. [Google Scholar] [CrossRef]
  48. Issayeva, M.I.; Khalafli, A.A. Paleomagnetic Studies of the Caucasian segment of the Alpine Fold Belt. In Proceedings of the Intern. Workshop on Recent Geodynamics, Georisk, and Sustainable Development in the Black Sea to Caspian Sea Region (Baku, 2005); Ismail-Zadeh, A., Ed.; American Institute of Physics: Melville, NY, USA, 2006; pp. 132–135. [Google Scholar] [CrossRef]
  49. Borradaile, G.J.; Lagroix, F.; Hamilton, T.D.; Trebilcock, D.A. Ophiolite tectonics, rock magnetism and paleomagnetism, Cyprus. Surv. Geophys. 2010, 31, 285–359. [Google Scholar] [CrossRef]
  50. Uzel, B.; Langereis, C.G.; Kaymakci, N.; Sözbilir, H.; Özkaymak, C.; Özkaptan, M. Paleomagnetic Evidence for an Inverse Rotation History of Western Anatolia during the Exhumation of Menderes Core Complex. Earth Planet. Sci. Lett. 2015, 414, 108–125. [Google Scholar] [CrossRef]
  51. Gürer, D.; van Hinsbergen, D.J.J.; Özkaptan, M.; Creton, I.; Koymans, M.R.; Cascella, A.; Langereis, C.G. Paleomagnetic constraints on the timing and distribution of Cenozoic rotations in Central and Eastern Anatolia. Solid Earth 2018, 9, 295–322. [Google Scholar] [CrossRef]
  52. Lazos, I.; Sboras, S.; Chousianitis, K.; Kondopoulou, D.; Pikridas, C.; Bitharis, S.; Pavlides, S. Temporal evolution of crustal rotation in the Aegean region based on primary geodetically-derived results and palaeomagnetism. Acta Geod. Geophys. 2022, 57, 317–334. [Google Scholar] [CrossRef]
  53. Erickson, A.J.; Simmons, G.; Ryan, W.B.F. Review of Heat Flow Data from the Mediterranean and Aegean Seas. In Proceedings of the International Symposium on the Structural History of the Mediterranean Basins, Split, Yugoslavia, 25–29 October 1976; Biju-Duval, B., Montadert, L., Eds.; pp. 263–280. [Google Scholar] [CrossRef]
  54. Verzhbitsky, E.V. The Geothermal Regime and Seafloor Tectonics of Marine Basins along the Alpine–Himalayan Belt; Nauka: Moscow, Russia, 1996; 130p. (In Russian) [Google Scholar]
  55. Eppelbaum, L.V.; Pilchin, A.N. Methodology of Curie discontinuity map development for regions with low thermal characteristics: An example from Israel. Earth Planet. Sci. Lett. 2006, 243, 536–551. [Google Scholar] [CrossRef]
  56. Kaz’min, V.G.; Verzhbitskii, E.V. Age and origin of the South Caspian Basin. Oceanology 2011, 51, 131–140. [Google Scholar] [CrossRef]
  57. Eppelbaum, L.V.; Kutasov, I.M.; Pilchin, A.N. Applied Geothermics; Springer: Berlin/Heidelberg, Germany, 2014; 751p. [Google Scholar]
  58. Alizadeh, A.A.; Guliyev, I.S.; Kadirov, F.A.; Eppelbaum, L.V. Geosciences in Azerbaijan. Vol. II: Economic Minerals and Applied Geophysics; Springer: Berlin/Heidelberg, Germany, 2017; 340p. [Google Scholar] [CrossRef]
  59. Mukhtarov, A.S. Shallow and deep temperatures in the South-Caspian Basin. Int. J. Terr. Heat Flow Appl. 2018, 1, 23–29. [Google Scholar] [CrossRef]
  60. Far, S.M.; Zui, V.I. Geothermal field and geology of the Caspian Sea region. J. Belarusian State Univ. Geogr. Geol. 2019, 1, 104–118. [Google Scholar] [CrossRef]
  61. Mousavi, N.; Fullea, J. 3-D thermochemical structure of lithospheric mantle beneath the Iranian plateau and surrounding areas from geophysical–petrological modelling. Geophys. J. Int. 2020, 222, 1295–1315. [Google Scholar] [CrossRef]
  62. Alavi, M. Tectonics of the Zagros orogenic belt of Iran: New data and interpretation. Tectonophysics 1994, 229, 211–238. [Google Scholar] [CrossRef]
  63. Ismail-Zadeh, A.T. Migration of Seismic Activity in the Caspian Sea; Selected Papers from Volumes 26 and 27 of Vychislitel’naya Seysmologiya; AGU Publication: Weinheim, Germany, 1996; Volume 3, pp. 125–129. [Google Scholar] [CrossRef]
  64. Brunet, M.-F.; Korotaev, M.V.; Ershov, A.V.; Nikishin, A.M. The South Caspian Basin: A review of its evolution from subsidence modelling. Sediment. Geol. 2003, 156, 119–148. [Google Scholar] [CrossRef]
  65. Knapp, C.C.; Knapp, J.H.; Connor, J.A. Crustal-scale structure of the South Caspian Basin revealed by deep seismic reflection profiling. Mar. Pet. Geol. 2004, 21, 1073–1081. [Google Scholar] [CrossRef]
  66. Ben-Avraham, Z.; Schattner, U.; Lazar, M.; Hall, J.K.; Ben-Gai, Y.; Neev, D.; Reshef, M. Segmentation of the Levant continental margin, eastern Mediterranean. Tectonics 2004, 25, TC5002. [Google Scholar] [CrossRef]
  67. Jackson, J.; Priestley, K.; Allen, M.; Berberian, M. Active tectonics of the South Caspian Basin. Geophys. J. Int. 2002, 148, 214–245. [Google Scholar] [CrossRef]
  68. Khain, V.E. The Problem of the Origin and the Age of the South Caspian Basin and Its Possible Solutions. Geotectonics 2005, 39, 34–38. [Google Scholar]
  69. Khain, V.E.; Bogdanov, N.A. (Eds.) International Tectonic Map of the Caspian Sea Region Scale 1:2,500,000. Explanatory Notes; Geological Institute of the Russian Academy of Sciences: Moscow, Russia, 2005; 140p. (In Russian) [Google Scholar]
  70. Artyushkov, E.V. Formation of the South Caspian Basin as a result of phase transitions in the lower continental crust. Dokl. Earth Sci. 2007, 417, 1141–1146. [Google Scholar] [CrossRef]
  71. Golonka, J. Geodynamic Evolution of the South Caspian Basin. In Oil and Gas of the Greater Caspian Area; Yilmaz, P.O., Isaksen, G.H., Eds.; AAPG Studies in Geology: Houston, TX, USA, 2007; Volume 55, pp. 17–41. [Google Scholar] [CrossRef]
  72. Green, T.; Abdullayev, N.; Hossack, J.; Riley, G.; Roberts, A.M. Sedimentation and subsidence in the South Caspian Basin, Azerbaijan. Geol. Soc. Lond. Spec. Publ. 2009, 312, 241–260. [Google Scholar] [CrossRef]
  73. Leonov, Y.G.; Volozh, Y.A.; Antipov, M.P.; Bykadorov, V.A.; Kheraskova, T.N. The Consolidated Crust of the Caspian Region: Experience of Zonation; GEOS: Moscow, Russia, 2010; 64p. (In Russian) [Google Scholar] [CrossRef]
  74. Gvirtzman, Z.; Reshef, M.; Buch-Leviatan, O.; Ben-Avraham, Z. Intense salt deformation in the Levant Basin in the middle of the Messinian Salinity Crisis. Earth Planet. Sci. Lett. 2013, 379, 108–119. [Google Scholar] [CrossRef]
  75. Eppelbaum, L.V.; Nikolayev, A.V.; Katz, Y.I. Space location of the Kiama paleomagnetic hyperzone of inverse polarity in the crust of the eastern Mediterranean. Dokl. Earth Sci. 2014, 457, 710–714. [Google Scholar] [CrossRef]
  76. Moghadam, H.S.; Stern, R.J. Ophiolites of Iran: Keys to understanding the tectonic evolution of SW Asia: (I) Paleozoic ophiolites. J. Asian Earth Sci. 2014, 91, 19–38. [Google Scholar] [CrossRef]
  77. Eppelbaum, L.V.; Katz, Y.I. Eastern Mediterranean: Combined geological-geophysical zonation and paleogeodynamics of the Mesozoic and Cenozoic structural-sedimentation stages. Mar. Pet. Geol. 2015, 65, 198–216. [Google Scholar] [CrossRef]
  78. Alizadeh, A.A.; Guliyev, I.S.; Kadirov, F.A.; Eppelbaum, L.V. Geosciences in Azerbaijan, Vol. I: Geology; Springer: Berlin/Heidelberg, Germany, 2016; 239p. [Google Scholar] [CrossRef]
  79. Feyzullayev, A.A.; Kadirov, F.A.; Kadyrov, A.G. Tectono-geophysical model of the Southern Caspian in the context of the presence of oil and gas. Izv. Phys. Solid Earth 2016, 52, 912–922. [Google Scholar] [CrossRef]
  80. Eppelbaum, L.V.; Katz, Y.I. A New Regard on the Tectonic Map of the Arabian-African Region Inferred from the Satellite Gravity Analysis. Acta Geophys. 2017, 65, 607–626. [Google Scholar] [CrossRef]
  81. Feld, C.; Mechie, J.; Hübscher, C.; Hall, J.; Nicolaides, S.; Gurbuz, C.; Bauer, K.; Louden, K.; Weber, M. Crustal structure of the Eratosthenes Seamount, Cyprus and S. Turkey from an amphibian wide-angle seismic profile. Tectonophysics 2017, 700–701, 32–59. [Google Scholar] [CrossRef]
  82. Mattei, M.; Cifelli, F.; Alimohammadian, H.; Rashid, H.; Winkler, A.; Sagnotti, L. Oroclinal bending in the Alborz Mountains (Northern Iran): New constraints on the age of South Caspian subduction and extrusion tectonics. Gondwana Res. 2017, 42, 13–28. [Google Scholar] [CrossRef]
  83. Malekzade, Z. Block rotation induced by the change from the collision to subduction: Implications for active deformations within the areas surrounding South Caspian Basin. Mar. Geol. 2018, 404, 111–129. [Google Scholar] [CrossRef]
  84. Manzi, V.; Gennari, R.; Lugli, S.; Persico, D.; Reghizzi, M.; Roveri, M.; Schreiber, B.C.; Calvo, R.; Gavrieli, I.; Gvirtzman, Z. The onset of the Messinian salinity crisis in the deep Eastern Mediterranean basin. Terra Nova 2018, 30, 189–198. [Google Scholar] [CrossRef]
  85. Rustamov, M.I. Geodynamics and Magmatism of the Caspian-Caucasian Segment of the Mediterranean Belt in the Phanerozoic; Nafta Press: Baku, Azerbaijan, 2019; 544p. (In Russian) [Google Scholar]
  86. Bagheri, S.; Gol, S.D. The eastern Iranian orocline. Earth-Sci. Rev. 2019, 210, 103322. [Google Scholar] [CrossRef]
  87. Trifonov, V.G.; Sokolov, S.Y.; Sokolov, S.A.; Hessami, K. Mesozoic–Cenozoic Structure of the Black Sea–Caucasus–Caspian Region and Its Relationships with the Upper Mantle Structure. Geotectonics 2020, 54, 331–355. [Google Scholar] [CrossRef]
  88. Schenk, C.J.; Mercier, T.J.; Finn, T.M.; Woodall, C.A.; Marra, K.R.; Leathers-Miller, H.M.; Le, P.A.; Drake, R.M., II. Assessment of undiscovered conventional oil and gas resources in the eastern Mediterranean area, 2020 (ver. 1.1). In U.S. Geological Survey Fact Sheet 2021−3032; U.S. Geological Survey: Washington, DC, USA, 2021; 4p. [Google Scholar] [CrossRef]
  89. Yilmaz, Y. Geological correlation between northern Cyprus and southern Anatolia. Can. J. Earth Sci. 2021, 58, 640–757. [Google Scholar] [CrossRef]
  90. Abdullayev, N.R.; Guliyev, I.S.; Kadirov, F.A.; Huseynova, S.M.; Javadova, A.S.; Maharramov, B.I.; Mukhtarov, A.S. Novel interpretation of the crustal structure and hydrocarbon evolution within the South Caspian and Kura sedimentary basins, Azerbaijan. Geophys. J. 2024, 46, 146–161. [Google Scholar] [CrossRef]
  91. Koshnaw, R.I.; Kley, J.; Schlunegger, F. The Miocene subsidence pattern of the NW Zagros foreland basin reflects the southeastward propagating tear of the Neotethys slab. Solid Earth 2024, 15, 1365–1383. [Google Scholar] [CrossRef]
  92. Mirahmadi, S.; Sadidkhouy, A.; Javan-Doloei, G.; Mohammadi, N. Crustal seismic anisotropy beneath the Zagros and Central Iran. Geotectonics 2024, 58, 134–147. [Google Scholar] [CrossRef]
  93. Moneron, J.; Gvirtzman, Z.; Karcz, Z.; Shitrit, O.; Sagy, Y.; Aharonov, E. Exploring the relationship between sedimentary transport systems and basin dynamics: A case study from the Levant Basin (Eastern Mediterranean Sea) before, during, and after the Messinian. GSA Bull. 2024, 137, 1423–1436. [Google Scholar] [CrossRef]
  94. Nouri, A.; Rahimi, B.; Vavryčuk, V.; Ghaemi, F. Tectonic stress around the South Caspian basin deduced from earthquake focal mechanisms. Int. Geol. Rev. 2024, 66, 3075–3092. [Google Scholar] [CrossRef]
  95. Le Pichon, X.; Gaulier, J.-M. The rotation of Arabia and the Levant fault system. Tectonophysics 1988, 153, 271–294. [Google Scholar] [CrossRef]
  96. Mangino, S.; Priestley, K. The crustal structure of the southern Caspian region. Geophys. J. Int. 1998, 133, 630–648. [Google Scholar] [CrossRef]
  97. Zakariadze, G.S.; Dilek, Y.; Adamia, S.A.; Oberhänsli, R.E.; Karpenko, S.F.; Bazylev, B.A.; Solov’eva, N. Geochemistry and geochronology of the Neoproterozoic Pan-African Transcaucasian Massif (Republic of Georgia) and implications for island arc evolution of the Late Precambrian Arabian-Nubian Shield. Gondwana Res. 2007, 11, 92–108. [Google Scholar] [CrossRef]
  98. Aliyev, A.A.; Guliyev, I.S.; Dadashov, F.H.; Rakhmanov, R.R. Atlas of the World Mud Volcanoes; Nafta Press: Baku, Azerbaijan, 2015; 321p. [Google Scholar]
  99. Leroy, S.A.G.; Gracheva, R.; Medvedev, A. Natural hazards and disasters around the Caspian Sea. Nat. Hazards 2022, 114, 2435–2478. [Google Scholar] [CrossRef]
  100. Yetirmishli, G.J.; Samedzade, A.V. A new approach to determine the impact of geodynamic stress on oil production in the South Caspian Basin. SOCAR Proc. 2025, 1, 9–16. [Google Scholar] [CrossRef]
  101. Babayev, G.; Ismail-Zadeh, A.; Le Mouël, J.-L. Scenario-based earthquake hazard and risk assessment for Baku (Azerbaijan). Nat. Hazards Earth Sys. Sci. 2010, 10, 2697–2712. [Google Scholar] [CrossRef]
  102. Vergés, J.; Saura, E.; Casciello, E.; Fernàndez, M.; Villaseñor, A.; Jiménez-Munt, I.; Garsía-Castellanos, D. Crustal-scale cross-sections across the NW Zagros belt: Implications for the Arabian margin reconstruction. Geol. Mag. 2011, 148, 739–761. [Google Scholar] [CrossRef]
  103. Derin, B.; Lipson, S.; Gerry, E. Microbiostratigraphy and Environments of Deposition of the Yam 2 Offshore Well. Isr. Inst. Petrol. Energy 1990, 5/90, 24. [Google Scholar]
  104. Cartwright, J.; Kirkham, C.; Espinoza, D.N.; James, D.; Hodgson, N. The evolution of depletion zones beneath mud volcanoes. Mar. Pet. Geol. 2023, 155, 106351. [Google Scholar] [CrossRef]
  105. Esestime, P.; Hewitt, A.; Hodgson, N. Zohr—A newborn carbonate play in the Levantine Basin, East-Mediterranean. First Break. 2023, 34, 87–93. [Google Scholar] [CrossRef]
  106. Gardosh, M.A. Levant Basin Hydrocarbon Potential and Future Development. In Proceedings of the Trans. of the IAA Conference on Digitalization and Automation in the O&G Industry, Tel Aviv, Israel, 18 June 2018. [Google Scholar]
  107. Konyukhov, A.I.; Sharafutdinov, V.F.; Kalabin, V. Geological structure, sedimentary environments, and oil and gas potential of Oligocene-Miocene and Pliocene-Pleistocene deposits in the Levant basin. Georesources 2019, 21, 80–93. (In Russian) [Google Scholar] [CrossRef]
  108. Tayber, Z.; Meilijson, A.; Ben-Avraham, Z.; Makovsky, Y. Methane Hydrate Stability and Potential Resource in the Levant Basin, Southeastern Mediterranean Sea. Geosciences 2019, 9, 306. [Google Scholar] [CrossRef]
  109. Doubre, C.; Deprez, A.; Masson, F.; Socquet, A.; Lewi, E.; Grandin, R.; Nercessian, A.; Ulrich, P.; De Chabalier, J.-B.; Saad, I.; et al. Current deformation in Central Afar and triple junction kinematics deduced from GPS and InSAR measurements. Geophys. J. Int. 2017, 208, 936–953. [Google Scholar] [CrossRef]
  110. Duermeijer, C.E.; Krijgsman, W.; Langereis, C.G.; Ten Veen, J.H. Post-early Messinian counterclockwise rotations on Crete: Implications for Late Miocene to Recent kinematics of the southern Hellenic arc. Tectonophysics 1998, 298, 177–189. [Google Scholar] [CrossRef]
  111. Ambraseys, N.N.; Jackson, J.A. Faulting associated with historical and recent earthquakes in the Eastern Mediterranean region. Geophys. J. Int. 1998, 133, 390–406. [Google Scholar] [CrossRef]
  112. Salamon, A.; Hofstetter, A.; Garfunkel, Z.; Ron, H. Seismotectonics of the Sinai subplate—The eastern Mediterranean region. Geophys. J. Int. 2003, 155, 149–173. [Google Scholar] [CrossRef]
  113. Katz, O.; Hamiel, Y. The nature of small to medium earthquakes along the Eastern Mediterranean passive continental margins, and their possible relationships to landslides and submarine salt-tectonic-related shallow faults. In Geological Society; Special Publications: London, UK, 2018; SP477.5; pp. 1–8. [Google Scholar] [CrossRef]
  114. Laor, M.; Gvirtzman, Z. Classifying marine faults for hazard assessment offshore Israel: A new approach based on fault size and vertical displacement. Nat. Hazards Earth Syst. Sci. 2023, 23, 139–158. [Google Scholar] [CrossRef]
  115. Smaily, L.I. Lithosphere Dynamics and Architecture of the Levant Basin Margins: Integrated Geophysical Approach. Ph.D. Thesis, Université Pierre et Marie Curie—Université Saint Joseph, Paris, France, 2017. [Google Scholar]
  116. Berra, F.; Angiolini, L. The evolution of the Tethys region throughout the Phanerozoic: A brief tectonic reconstruction. In Petroleum Systems of the Tethyan Region; Marlow, L., Kendall, C., Yose, L., Eds.; AAPG Memoir: Tulsa, OK, USA, 2014; Volume 106, pp. 1–27. [Google Scholar] [CrossRef]
  117. Steinberg, J.; Roberts, A.M.; Kusznir, N.J.; Schafer, K.; Karcz, Z. Crustal structure and post-rift evolution of the Levant Basin. Mar. Pet. Geol. 2018, 96, 522–543. [Google Scholar] [CrossRef]
  118. Monsef, I.; Zhang, Z.; Shabanian, E.; le Roux, P.; Rahgoshay, M. Tethyan subduction and Cretaceous rift magmatism at the southern margin of Eurasia: Evidence for crustal evolution of the South Caspian Basin. Earth-Sci. Rev. 2022, 228, 104012. [Google Scholar] [CrossRef]
  119. Eppelbaum, L.V.; Khesin, B.E. Geophysical Studies in the Caucasus; Springer: Berlin/Heidelberg, Germany, 2012; 411p. [Google Scholar]
  120. Gorodnitskiy, A.M.; Brusilovskiy, Y.V.; Ivanenko, A.N.; Filin, A.; Shishkina, N. New methods for processing and interpreting marine magnetic anomalies: Application to structure, oil and gas exploration, Kuril forearc, Barents and Caspian seas. Geosci. Front. 2013, 4, 73–85. [Google Scholar] [CrossRef]
  121. Ben-Avraham, Z.; Ginzburg, A. Magnetic anomalies over the central Levant continental margin. Mar. Pet. Geol. 1986, 3, 220–233. [Google Scholar] [CrossRef]
  122. Feyzullayev, A.A. Mud volcanoes in the South Caspian basin: Nature and estimated depth of its products. Nat. Sci. 2012, 4, 20770. [Google Scholar] [CrossRef]
  123. Mazzini, A.; Etiope, G. Mud volcanism: An updated review. Earth-Sci. Rev. 2017, 168, 81–112. [Google Scholar] [CrossRef]
  124. Buryakovsky, L.A.; Chilingar, G.V.; Aminzadeh, F. Petroleum Geology of the South Caspian Basin; Gulf Professional Publishing: Butterworth-Heinemann, UK, 2001; 442p. [Google Scholar]
  125. Holmes, A. Principles of Physical Geology; Ronald: New York, NY, USA, 1945; 628p. [Google Scholar]
  126. Heezen, B.C.; Tharp, M.; Ewing, M. The Floors of the Ocean. 1. The North Atlantic. Geol. Soc. Am. Spec. Pap. 1959, 65, 122. [Google Scholar] [CrossRef]
  127. McKenzie, D.; Parker, R.L. The North Pacific: An example of tectonics on a sphere. Nature 1967, 216, 1276–1280. [Google Scholar] [CrossRef]
  128. Le Pichon, X. Sea-floor spreading and continental drift. J. Geophys. Res. 1967, 73, 3661–3697. [Google Scholar] [CrossRef]
  129. Stampfli, G.M.; Hochard, C.; Vérard, C.; Wilhem, C.; von Raumer, J. The formation of Pangea. Tectonophysics 2013, 593, 1–19. [Google Scholar] [CrossRef]
  130. Turcotte, D.; Schubert, G. Geodynamics, 3rd ed.; Cambridge Univ. Press: Cambridge, UK, 2014; 636p. [Google Scholar] [CrossRef]
  131. Le Pichon, X. Fifty years of plate tectonics: Afterthoughts of a witness. Tectonics 2019, 38, 2919–2933. [Google Scholar] [CrossRef]
  132. Eppelbaum, L.V. Geophysical Potential Fields: Geological and Environmental Applications; Elsevier: Amsterdam, The Netherlands, 2019; 467p. [Google Scholar]
  133. Petrov, A.V.; Zinovkin, S.V.; Osipenkov, D.Y.; Yudin, D.B. Computer technology of statistical and spectrum-correlation data analysis KOSKAD 3D 2011. Geoinformatics 2019, 4, 7–13. (In Russian) [Google Scholar]
  134. Sclater, J.G.; Jaupart, C.; Galson, D. The heat flow through oceanic and continental crust and the heat loss of the Earth. Rev. Geophys. 1980, 18, 269–311. [Google Scholar] [CrossRef]
  135. Khain, V.E.; Levin, L.E.; Tuliani, L.I. Some physical parameters of the Earth’s global structure. Geotectonics 1982, 16, 443–453. (In Russian) [Google Scholar]
  136. Ronov, A.B. Stratisphere, or the Earth’s Sedimentary Shell (Quantitative Study); Nauka: Moscow, Russia, 1993; 143p. (In Russian) [Google Scholar]
  137. Kerimov, V.Y.; Mustaev, R.N.; Osipov, A.V. Peculiarities of hydrocarbon generation at great depths in the crust. Dokl. Earth Sci. 2018, 483 Pt 1, 1413–1417. [Google Scholar] [CrossRef]
  138. Khafizov, S.F.; Osipov, A.V.; Dantsova, K.; Barshin, A.V.; Monakova, A.S. Accumulations of Liquid Hydrocarbons at Great Depths—The Phenomenon of the Gulf of Mexico. In Proceedings of the Trans. of the Europ. Assoc. of Geosci. and Engin., “Geosciences: Converting Knowledge into Resources”, Saint Petersburg, Russia, 1–5 November 2020. [Google Scholar] [CrossRef]
  139. Eppelbaum, L.V.; Katz, Y.I. African-Levantine Areal of Ancient Hominin Dispersal: A New Look Derived from Comprehensive Geological-Geophysical Integration. In Emerging Issues in Environment, Geography and Earth Science; Yousef, A.F., Ed.; BP International: London, UK, 2024; Volume 7, pp. 151–222. [Google Scholar] [CrossRef]
  140. Eppelbaum, L.; Katz, Y. Akchagylian Hydrospheric Phenomenon in Aspects of Deep Geodynamics. Stratigr. Sediment. Oil-Gas Basins 2021, 2021, 9–26. [Google Scholar]
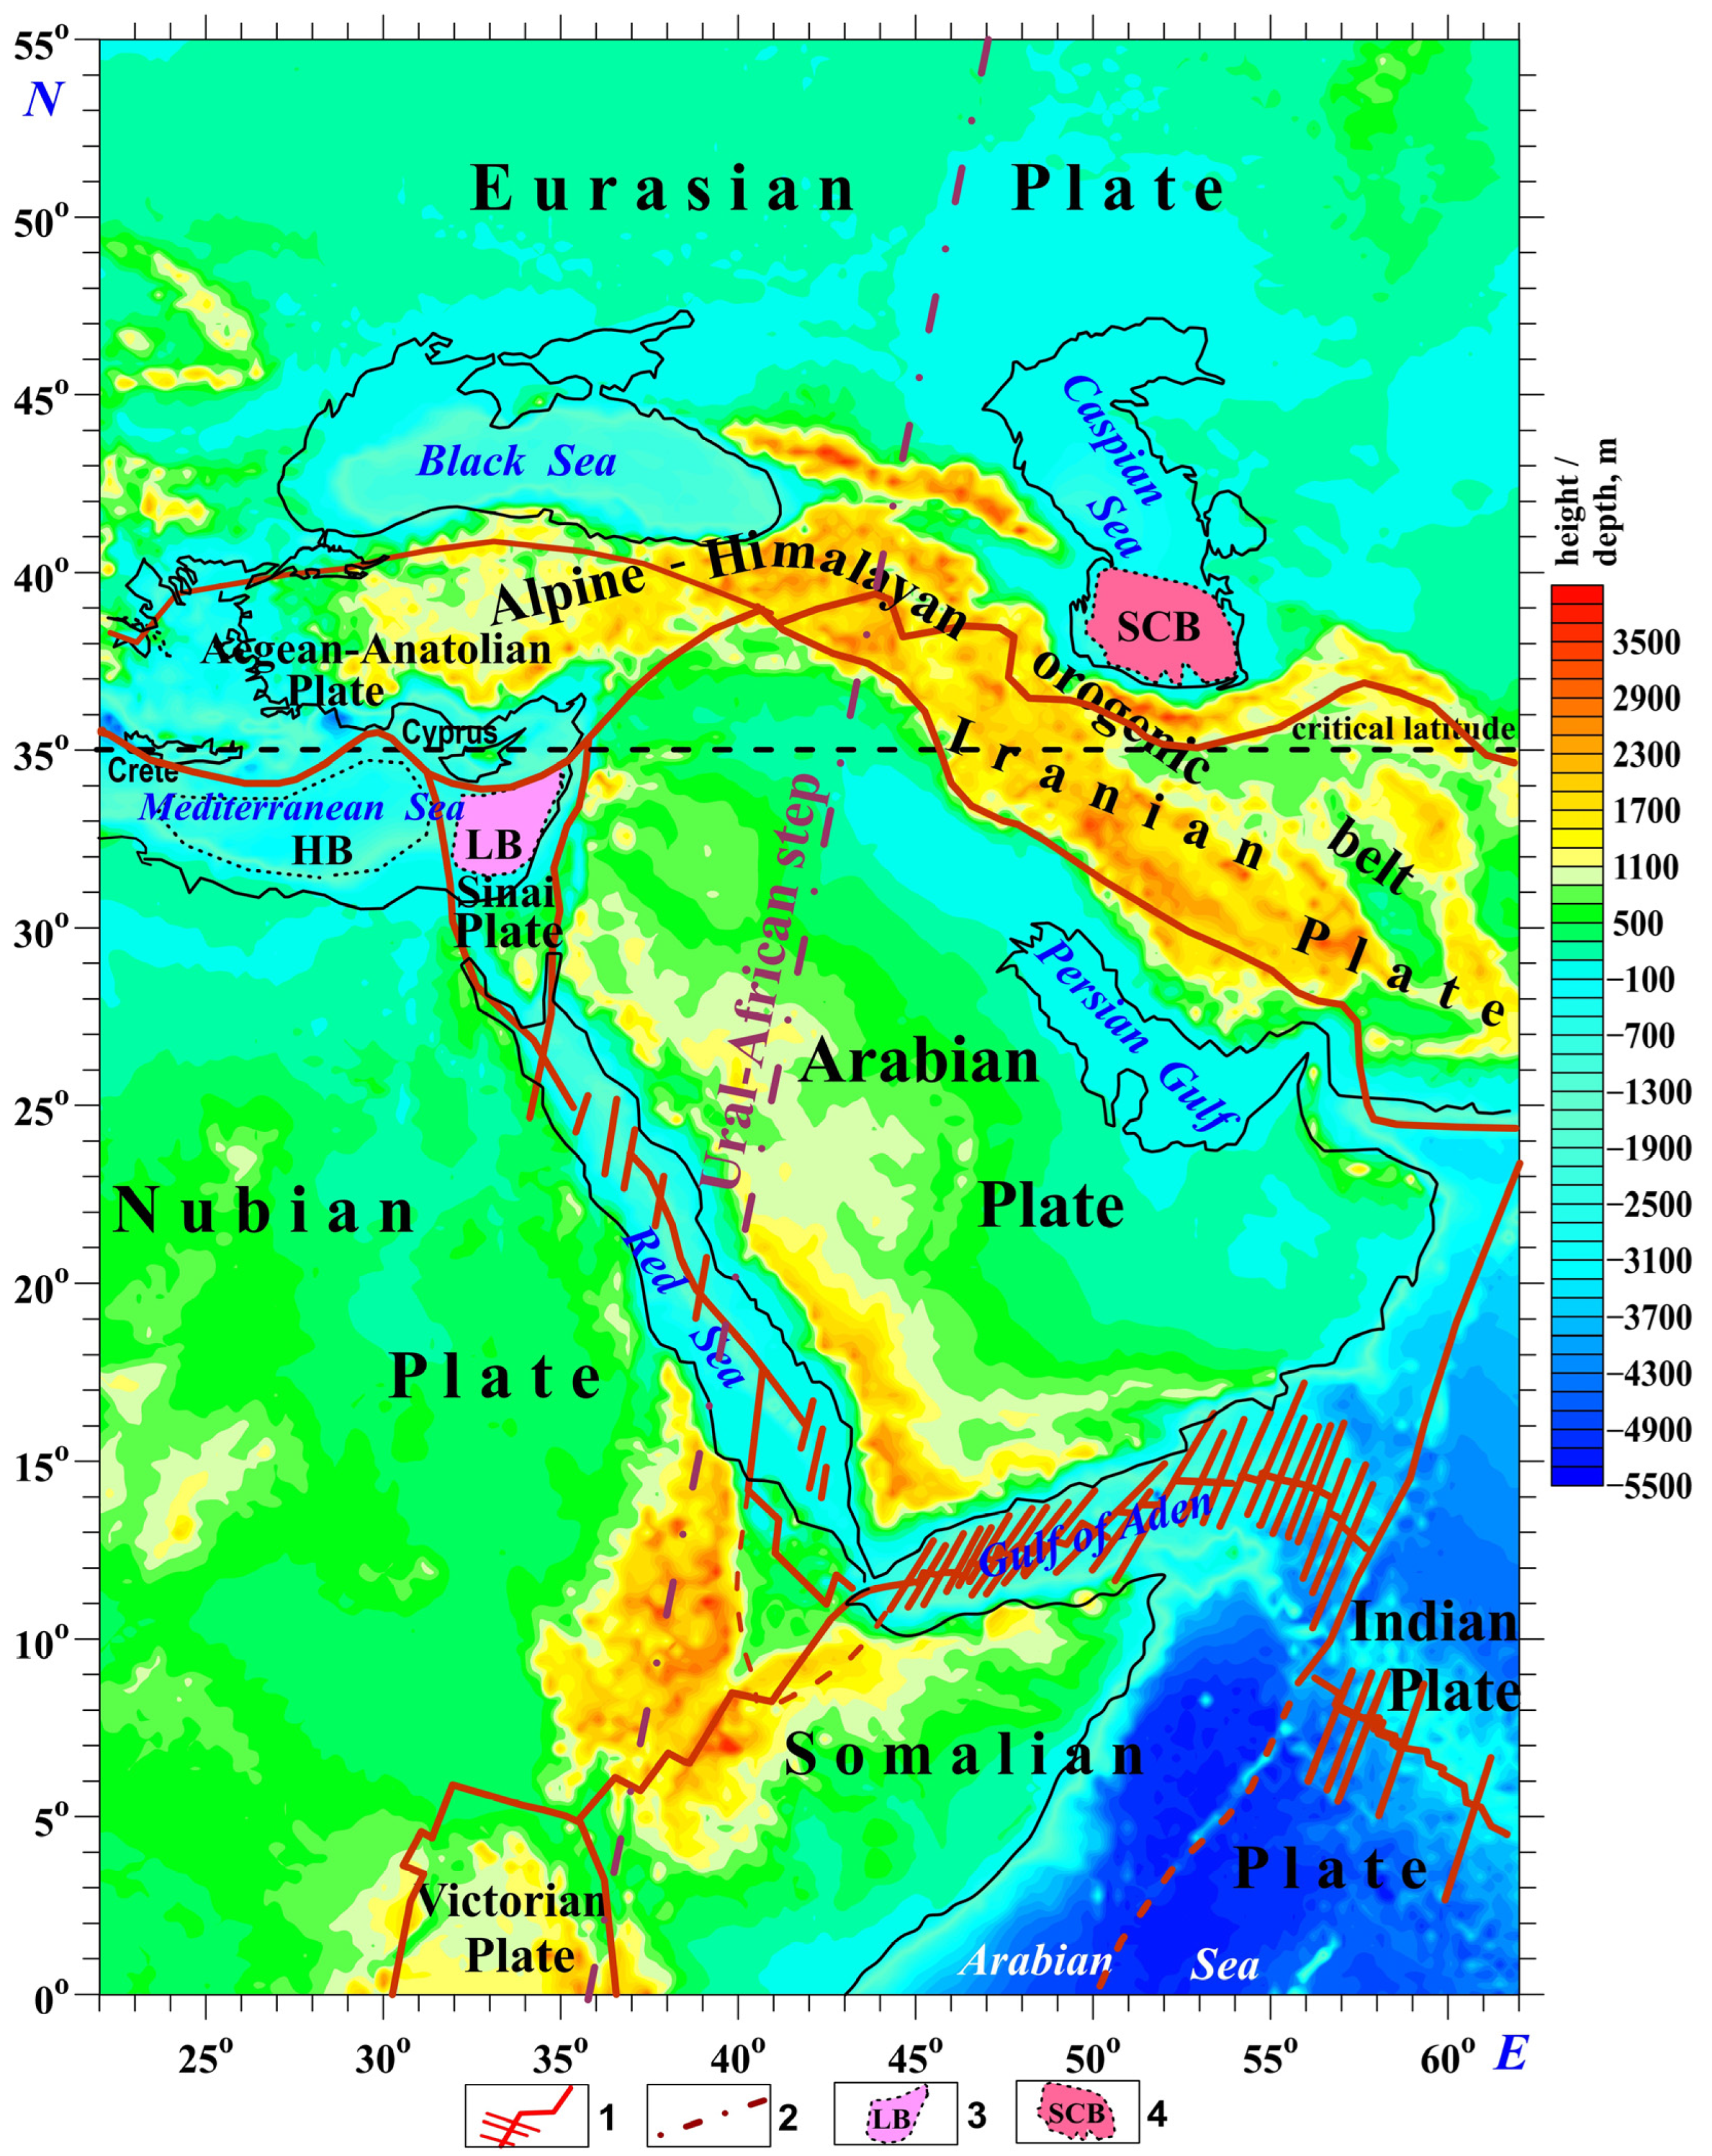
Figure 1. Tectonic–geomorphological map of the study region. (1) Main interplate faults, (2) Ural–African tectonic step, (3) Levant Basin (LB), (4) South Caspian Basin (SCB). HB, Herodotus Basin.
Geosciences 15 00281 g001
Figure 2. Regional geophysical–tectonic map for the region under study (supplemented and revised after [9]). (1) Residual satellite-derived gravity field isolines, (2) key interplate faults, (3) Ural–African step, (4) arrangement of the GPS velocity vectors (after Refs. [11,12,13,14]), (5) Mesozoic Terrane Belt (MTB) distal part, (6) Levant Basin (LB) outline, (7) South Caspian Basin (SCB) outline, (8) location of deep seismotomographic profiles. The blue lines indicate the boundaries between land and sea. SF, Sinai Fault; DST, Dead Sea Transform; OF, Owen Fault. The green dashed line indicates the position of the critical Earth’s latitude of 35°.
Geosciences 15 00281 g002
Figure 3. Deep seismotomographic profiles 1, 2, 3, and 10 from Refs. [33,37]. The yellow circles with a dot in the center, placed by the authors of this article, show the position of the centers of mass of the mantle anomalous structure.
Geosciences 15 00281 g003
Figure 4. Structural–geodynamic map of the SCB (after Refs. [13,24,32,73,87,90,94]). (1) Shear zones, (2) Jurassic rift zone, (3) thrusts and underthrusts, (4) direction of strike-slip displacement, (5) block clockwise rotation. The thickness of the sedimentary layer (in km) is indicated in the column (right upper corner) and on the map (in km). The blue lines indicate the boundaries between the land and sea. TST, Turkmenian Structural Terrace; GOS, Gogran’dag-Okarem step. The blue lines indicate the boundaries between land and sea.
Geosciences 15 00281 g004
Figure 5. A regional Bouguer anomaly map of the South Caspian Basin (supplemented and modified after Ref. [20]). (1) Interplate faults, (2) intraplate faults, and (3) the SCB outline. Al—Alborz Mountains; GC—Greater Caucasus; GOS—Gogran’dag-Okarem step; KD—Kopet-Dagh Mountains; LC—Lesser Caucasus; TCM—Transcaucasian Massif; Tl—Talysh Zone; TST—Turkmenian Structural Terrace. Black lines represent the coastline boundaries.
Geosciences 15 00281 g005
Figure 6. Regional magnetic ΔZ map recalculated at an altitude of 2.5 km above mean sea level (msl) for the SCB and adjacent areas. (1) Interplate faults, (2) intraplate faults, (3) SCB outline. Al—Alborz Mountains; GC—Greater Caucasus; GOS—Gogran’dag–Okarem step; KD—Kopet-Dagh Mountains; LC—Lesser Caucasus; TCM—Transcaucasian Massif; Tl—Talysh Zone; TST—Turkmenian Structural Terrace. The white lines mark the land–sea boundaries.
Geosciences 15 00281 g006
Figure 7. The geodynamic-tectonic framework map of the study area (based on Refs. [3,6,9,62,76,80,82,83,86,87,91,97]). (1) Archean cratons; (2–4) compressional tectonic belts: (2) Paleo-Mesoproterozoic, (3) Neoproterozoic, (4) Late Paleozoic (Hercynian); (5) Mesozoic Terrane Belt (MTB); (6) Alpine–Himalayan orogenic belt; (7) boundaries of lithospheric plates; (8) folded belt and massif boundaries; (9) SCB boundaries. Structural zone indexes: AD—Ala Dagh; Af—Afghanistan Block; Al—Alborz Mountains; BN—Binalud Mountains; CI—Central Iran Massif; EAC—Eastern Arabian Craton; EI—Eastern Iranian Orogen; EP-AT—Eastern Pontides–Adjaro-Trialet Zone; G—Ga’ara Belt; GC—Greater Caucasus; HR—Hall-Rutbah Massif; KD—Kopet-Dagh Mountains; L—Lut Block; LC—Lesser Caucasus; Ma—Makran accretionary zone; SCB—South Caspian Basin; SS—Sanandaj–Sirjan zone; T—Tabas Block; TCM—Transcaucasian Massif; Tl—Talysh Zone; UD—Urumieh–Dochtar Magmatic Arc; W—Widyah Belt; Y—Yazd Belt; Zg—Zagros Folded Zone. The blue lines mark the land–sea boundaries.
Geosciences 15 00281 g007
Figure 8. Schematic paleomagnetic–geodynamic map of the region between the Iranian Plate and the South Caspian Basin. (1) Lithospheric plate boundaries; (2) Ural–African tectonic step; (3) Earth’s critical latitude of 35°; (4–10) paleomagnetic–geodynamical data corresponding to different geological periods: (4) Neogene, (5) Paleogene, (6) Upper Cretaceous, (7) Lower Cretaceous, (8) Jurassic, (9) data supplemented from Ref. [48], (10) data modified after Ref. [8]. The blue lines mark the land–sea boundaries.
Geosciences 15 00281 g008
Figure 9. A generalized tectonic–geophysical map of the Levant Basin and surrounding areas superimposed on a satellite-derived gravity map (updated and expanded after Ref. [77]). (1) Precambrian plates composed of continental crust, (2) oceanic crust, (3) Mesozoic Terrane Belt (MTB), (4) Alpine tectonic belt, (5) interplate faults, (6) southern margin of the Mediterranean accretionary belt, (7) major faults, (8) gravity field isolines spaced at 10 mGal intervals, (9) contour of the Kiama paleomagnetic hyperzone. Blue lines mark the boundaries between land and sea. ESM—Eratosthenes Sea Mount; SF—Sinai Fault; DST—Dead Sea Transform; Ant—Antilebanon; J-S—Judea–Samaria.
Geosciences 15 00281 g009
Figure 10. Magnetic ΔZ map reduced to 2.5 km above the MSL for the Levant Basin and surrounding regions. (1) Interplate faults, (2) the southern margin of the Mediterranean accretionary belt, (3) intraplate faults, (4) ΔZ magnetic field isolines, (5) the contour of the oceanic crust block of the Kiama paleomagnetic hyperzone. The white (blue) lines indicate the boundaries between land and sea. ESM, Eratosthenes Sea Mount Block; DST, Dead Sea Transform; SF, Sinai Fault; J-S, Judea–Samaria; Ant, Antilebanon.
Geosciences 15 00281 g010
Figure 11. An entropy map produced by applying a sliding window to satellite-derived gravity data (0.5 km × 0.5 km) with key tectonic features. (1) Main faults, (2) intraplate faults, (3) the southern boundary of the Mediterranean accretionary belt, (4) the contour of the oceanic crust block with the Kiama paleomagnetic hyperzone. Terranes of the Mesozoic Terrane Belt: 1—Negev, 2—Judea–Samaria, 3—Antilebanon, 4—South Palmyrides, 5—North Palmyrides, 6—Heletz, 7—Pleshet, 8—Galilee–Lebanon, 9—Aleppo, 10—Abdelaziz. The white lines indicate the boundaries between land and sea. ESM, Eratosthenes Sea Mount; SF, Sinai Fault; DST, Dead Sea Transform.
Geosciences 15 00281 g011
Figure 12. Basic geodynamic model of the studied region. (1) Main interplate faults; (2) main intraplate faults; (3) Mesozoic Terrane Belt’s distal part; (4) average position of the Ural–African tectonic step; (5) high-magnitude seismogenic sector in Eastern Turkey (6 February 2023); (6) average projection of the counterclockwise rotating mantle structure; (7) tectonic motions: (a) rotation, (b) northward and north–northeastward displacement. Numbered circles: 1—mantle rotating counterclockwise structure, 2—Iranian Plate, 3—South Caspian Basin. SCB, South Caspian Basin; SF, Sinai Fault; DST, Dead Sea Transform; OF, Owen Fault.
Geosciences 15 00281 g012
Table 1. Comparison of the SCB (northern part of the Neotethys) and the LB (southern part of the Neotethys).
NFactorSouth Caspian Basin (SCB)Levant Basin (LB)
1Area~200,000 km2~150,000 km2
2Paleogeographic
pattern
Relates to the eastern part of the remnant basin of the Paratethys [3,15,71]Relates to the east boundary part of the remnant Neotethys–Mediterranean Ocean [2,3]
3Plate tectonics
position
Eastern Caucasian part of the Eurasian Plate [11,15,67]The northern part of the Sinai Plate [11,15,77]
4Main tectonic peculiaritiesThe SCB basin is separated from the surrounding tectonic uplifts of the Alpine belts by deep fault zones—Alburz, West Caucasian, and Apsheron [11,15,24,31,67,78,85]. In the eastern part, on the border with the Kopet-Dagh Alpines [73], the Gogran’dag-Okarem tectonic step is developed. The basin’s tectonic features include displaced blocks of oceanic and continental crust framed by a fault systemThe LB is bounded from the south and east by the Mesozoic Terrane Belt [77] and from the north by an arcuate fault bordering a thick sequence of Cretaceous ophiolites and mantle diapirs of the Cyprus oceanic block system within the Anatolian Plate [1,15,81,89]. The LB is limited by submeridional deep faults on the west and east (influence of the giant rotating mantle structure) [9,10]
5Characteristic tectonic–geodynamic featuresThe SCB tectonic basin is located above the zone of marginal periclinal subsidence of the quasi-
ring mantle structure [9,25], where the dominant counterclockwise rotation mode is replaced by the opposite clockwise rotation [11,13,31]
The location of the LB above the apical zone of the mantle structure [25] explains the previously unclear phenomenon [9,10] of the counterclockwise rotation of the LB and its surrounding structures [25]
6Type of Earth’s crustPrimarily oceanic, with separate continental
crust blocks [23,24,38,56,64,65,68,70,72,79,85,90,116]
Oceanic, surrounded by continental terranes [2,77,88,117]
7The origin of the Earth’s crustAutochthonous [4,24,68,70,78]Allochthonous (central-southern part of the LB) [3,77,115]
8Oceanic crust age~170–230 Ma [39,56,69,118]≥225 Ma [7], Kiama block: ≥265 Ma [9,10,75]
9Sedimentary
thickness
Up to 28.5 km [16,24,34,54]Up to 12–14 km [2,32,35,66]
10Composition of sedimentary coverSedimentary deposits from the Jurassic to the Pleistocene [34,39,64]Terrigenous–carbonate formations from the Upper Permian to the Late Cenozoic [1,32,35]
11Salt seriesNone discovered [34]A thick sequence of the Upper Miocene (Messinian) salt [74,84,93]
12Gravity field
behavior
Middle-gradient, with a strong negative anomaly offshore of Baku [20,22,23]High-gradient with the closely disposed giant positive and negative anomalies (Cyprus–Dead Sea area) [2,21,77]
13Magnetic field
behavior
Low- and middle-gradient [26,27,119,120]Middle- and high-gradient [2,17,28,121]
14Thermal regimeLow: 45–50 mW/m2 [56,57,58,59,60]Low: 30–35 mW/m2 [53,54,55]
15SeismicityHeightened [13,31,58,63,99,100,101]Moderate–heightened [111,112,113,114]
16Mud volcanismSeveral hundred mud volcanoes [34,78,98,122,123]A few units of mud volcanoes are slightly west of the LB and possibly within the LB [36,103,104]
17Hydrocarbon potentialVery high: several hundred oil and gas deposits [34,39,58,79,90,124]High: about twenty gas deposits [32,88,105,106,107,108]
Disclaimer/Publisher’s Note: The statements, opinions and data contained in all publications are solely those of the individual author(s) and contributor(s) and not of MDPI and/or the editor(s). MDPI and/or the editor(s) disclaim responsibility for any injury to people or property resulting from any ideas, methods, instructions or products referred to in the content.