Article

Microclimate Variability in a Highly Dynamic Karstic System

by
Diego Gil
1,
Mario Sánchez-Gómez
1,* and
Joaquín Tovar-Pescador
2
1
Department of Geology, University of Jaén, Campus las Lagunillas, 23071 Jaén, Spain
2
Department of Physics, University of Jaén, Campus las Lagunillas, 23071 Jaén, Spain
*
Author to whom correspondence should be addressed.
Geosciences 2025, 15(8), 280; https://doi.org/10.3390/geosciences15080280
Submission received: 13 May 2025 / Revised: 17 July 2025 / Accepted: 18 July 2025 / Published: 24 July 2025
(This article belongs to the Section Climate and Environment)

Abstract

In this study, we examined the microclimates at eight entrances to a karst system distributed between an elevation of 812 and 906 m in Southern Spain. The karst system, characterised by subvertical open tectonic joints that form narrow shafts, developed on the slope of a mountainous area with a Mediterranean climate and strong chimney effect, resulting in an intense airflow throughout the year. The airflows modify the entrance temperatures, creating a distinctive pattern in each opening that changes with the seasons. The objective of this work is to characterise the outflows and find simple temperature-based parameters that provide information about the karst interior. The entrances were monitored for five years (2017–2022) with temperature–humidity dataloggers at different depths. Other data collected include discrete wind measurements and outside weather data. The most significant parameters identified were the characteristic temperature (Ty), recorded at the end of the outflow season, and the rate of cooling/warming, which ranges between 0.1 and 0.9 °C/month. These parameters allowed the entrances to be grouped based on the efficiency of heat exchange between the outside air and the cave walls, which depends on the rock-boundary geometry. This research demonstrates that simple temperature studies with data recorded at selected positions will allow us to understand geometric aspects of inaccessible karst systems. Dynamic high-airflow cave systems could become a natural source of evidence for climate change and its effects on the underground world.

1. Introduction

A cave’s microclimate is the result of complex interactions between the external climate and features of the inner karst, such as geothermal heat flux and conduit geometry ([1] Buecher, 1999; [2,3] Badino, 2005, 2018; [4] Pardo-Igúzquiza, 2019; [5] Kukuljan et al., 2021a). The influence of seasonal variations typically reaches the first hundred metres of karst systems ([6] Drogue, 1985; [7] Luetscher and Jeannin, 2004), although in solid underground environments, the typical thermal daily variation is restricted to the first metre (e.g., [8] McSween et al., 2019; [9] Ramos et al., 2012), and seasonal equilibrium is reached at a depth of about 10–20 m ([10] Brady and Weil, 2008; [11] Larwa, 2019; [12] Sliwa et al., 2019). To influence deeper zones, the external climate must therefore have good connectivity to exchange heat through circulating air or water.
In the vadose zone, where caves develop, water mostly moves down, drawn by gravity, but air can circulate upwards/downwards or inwards/outwards as a function of differences in its density ([13] Trombe, 1952; [14] Badino 1995; [15] Peters, 1965; [16] Lismonde, 2002 a; [17] Faimon et al., 2012), which in turn is mainly dependent on temperature ([18] Cigna, 1968; [19] de Freitas, 1982; [20] James et al., 2015). Air flows in the interior and in the entrances of the caves will therefore depend on the difference between the outside temperature at that moment and the temperature inside the cave ([21] Christoforou et al., 1996; [22] Kowalczk and Froelich, 2010). As the interior temperature tends to be the climatic average ([23] Cropley, 1965; [24,25] Badino, 2004, 2010; [26] Domínguez-Villar et al., 2014), airflows are mostly constrained to winter and summer in contrasting climates ([17] Faimon et al., 2012), while in tropical climates, with small annual and daily variations, oscillations in cave temperature are very small even at cave entrances ([27] McCann, 2013); consequently, thermally induced airflows are necessarily quite limited.
Microclimatic studies in caves mainly focus on the conservation and management of show, patrimonial, or therapeutic caves, most of which have preferential horizontal geometry. This results in small differences in elevation between cave entrances or between the cave entrance and the deepest places in the cave system (e.g., [28] Benavente et al., 2015; [29] Faimon and Lang, 2013; [30] Hoyos et al., 1998; [31] Sainz et al., 2018, [32] Fernández-Cortés et al., 2006); consequently, they also show limited thermally induced airflows (few cm/s or tens cm/s; [33] Pflitsch and Piasecki, 2003). Caves with a primarily horizontal preferential geometry record large airflows only when such airflows are induced by barometric effects ([34] Pflitsch et al., 2010). Nevertheless, many karst and pseudokarst areas exhibit greater vertical development of conduits along joints and faults (e.g., [35] Pedrera et al., 2015; [36] Kašing and Lenart, 2020; [37] Margielewski and Urban, 2017; [38] Lenart et al., 2018). A vertical preferential conduit direction enhances air circulation via the chimney effect ([39] Bertozzi et al., 2019; [7] Luetscher and Jeannin, 2004; [40] Kukuljan, 2021b), representing one of the most common mechanisms driving cave airflow; the difference in density between the subsurface air and the outside air results in pressure differences that drive ascending or descending airflows ([41] Gabrovšek, 2023). Caves with pronounced vertical development therefore exhibit highly efficient gas exchange between the karst interior and the atmosphere, and have particularly dynamic microclimates.
This work describes the microclimates of a karst system controlled by near-vertical tectonic fractures with multiple interconnected openings. The karst developed over Mesozoic carbonates of Sierra Mágina (southern Spain) under a Mediterranean climate. The objective of this work is to characterise the air outflows originating within the karst and identify simple, easy-to-obtain parameters based on temperature that provide information about the inaccessible karst system and its responses to the external climate. Our aim is to identify the factors that govern the thermal signature of each inlet, such as conduit geometry and thermal inertia inside the karst. Dynamic karst systems like the one presented here, driven by the chimney effect, could therefore become natural laboratories for climate change; as their response times are faster compared to classical inertial caves, they are well suited for long-term monitoring.

2. Geological, Speleological, and Climate Setting
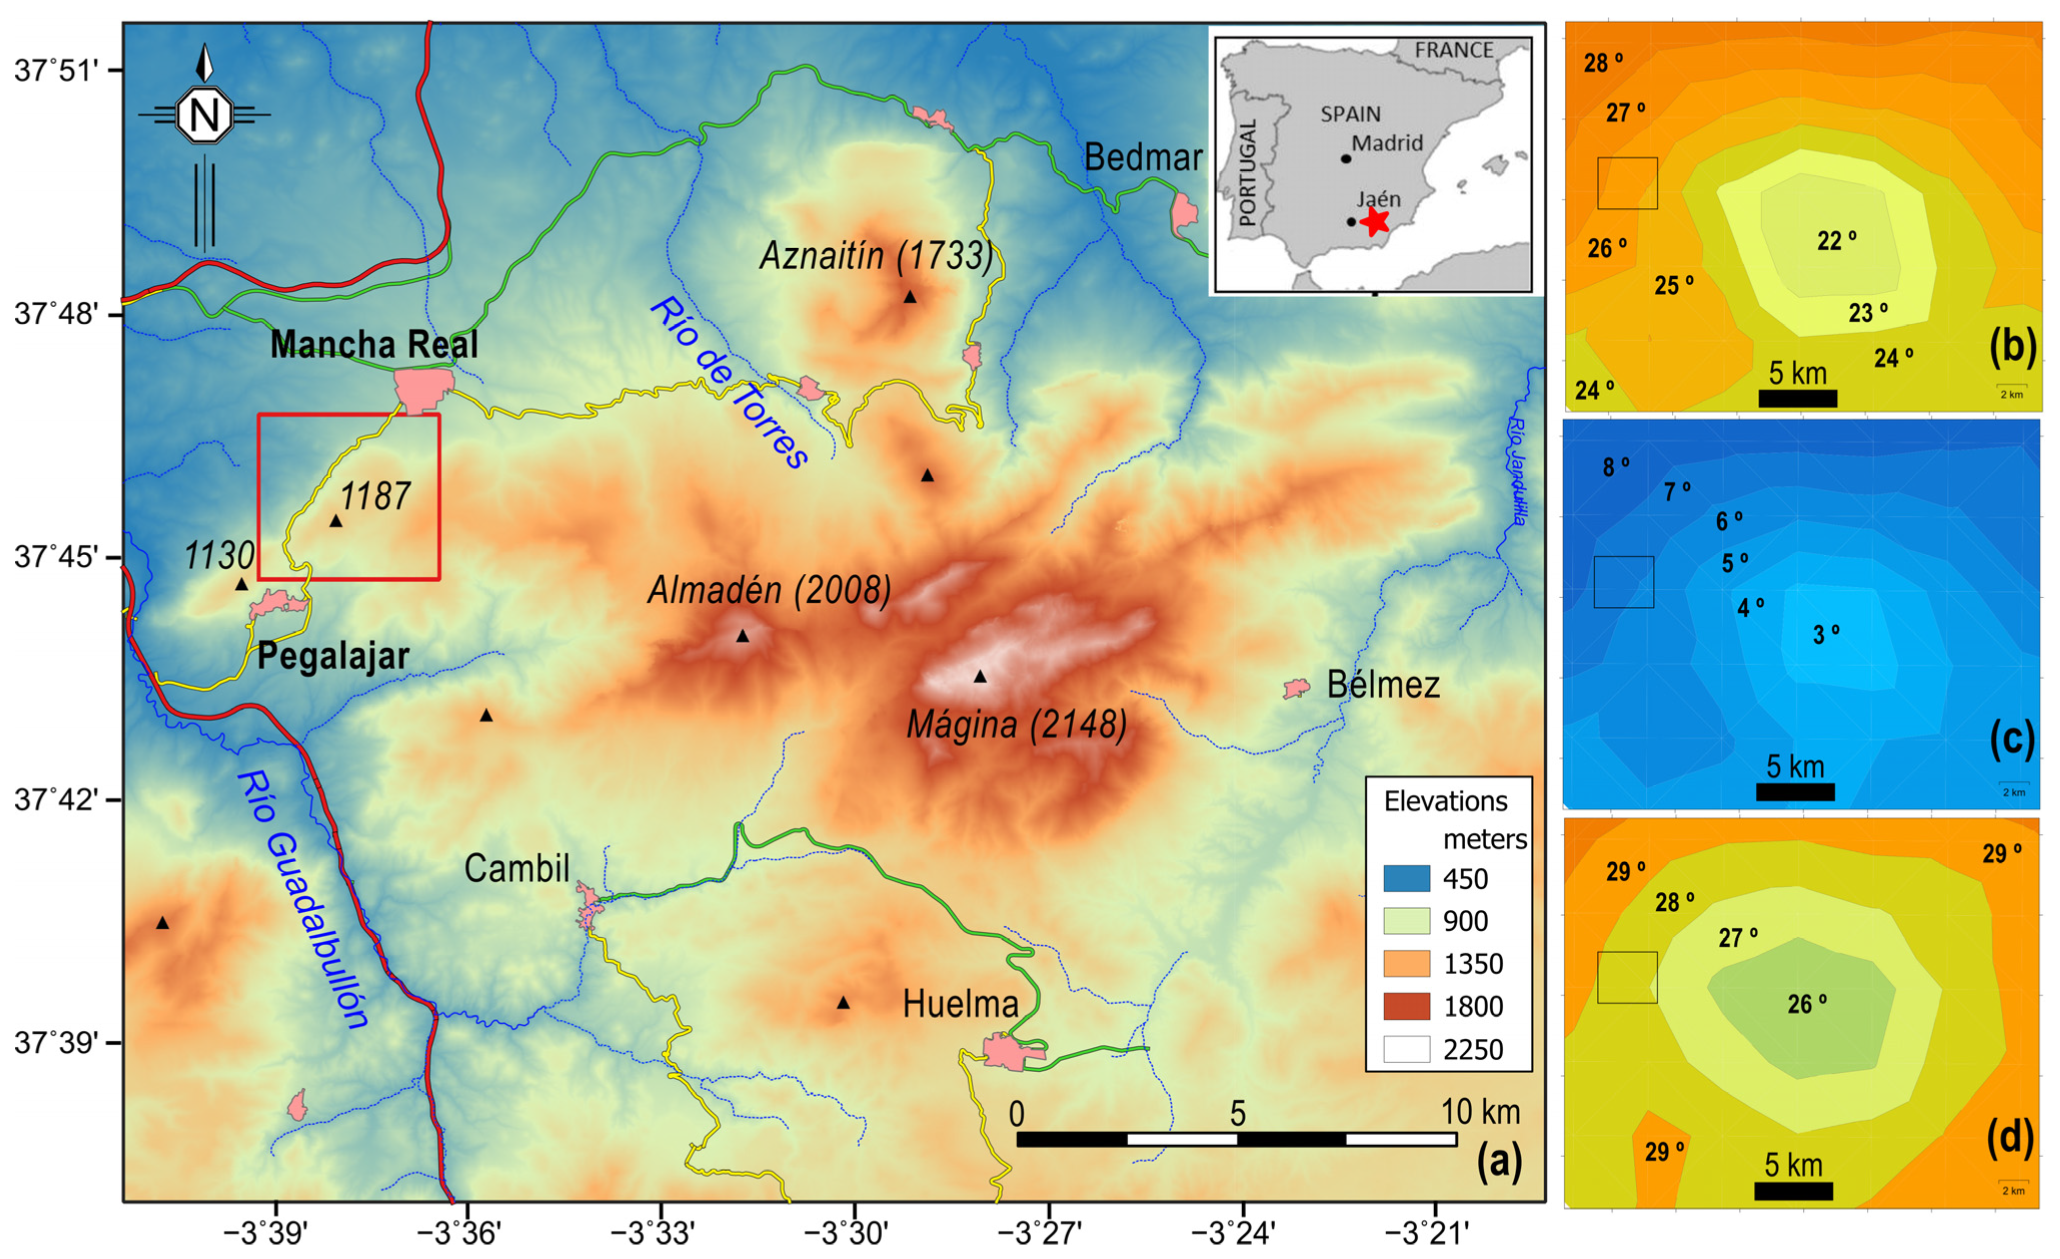
A cluster of neighbouring caves and narrow entrances have been studied in Sierra Mágina (Figure 1), an almost isolated mountain range at the northern front of the Betic Cordillera. The range forms part of a fold-and-thrust belt structure comprising units mainly composed of Jurassic and Cretaceous limestones and dolomites belonging to the non-metamorphic Betic foreland ([42] Ruiz-Ortiz, 1980). Carbonates form slabs a few hundred metres thick intercalated with marls and clays, in such a way that they form complex partially interconnected karst aquifers ([43] Gollonet et al., 2002; [44] González-Ramón, 2007). Large exokarst landforms, as diverse types of dolines, are restricted to heights greater than 1400 m, the same altitudes that periglacial conditions are assumed to have reached in the last glaciations ([45] García-Rossell and Pezzi, 1975). Nevertheless, karren and microkarren formations are ubiquitous and occur below that level.
Figure 1. Geographic location and temperature maps of Sierra Mágina. The marked rectangles indicate the study area in the Serrezuela de Pegalajar karst system. (a) Coloured elevation map of Sierra Mágina area and surroundings; (b) map of average daily external temperatures considering the hottest months (July and August); (c) map of average daily external temperatures of the coldest months (January and February) over the same period of years; (d) external temperature amplitude between the winter average minimum and summer average maximum. The calculated period is from 1998 to 2020.
Geosciences 15 00280 g001
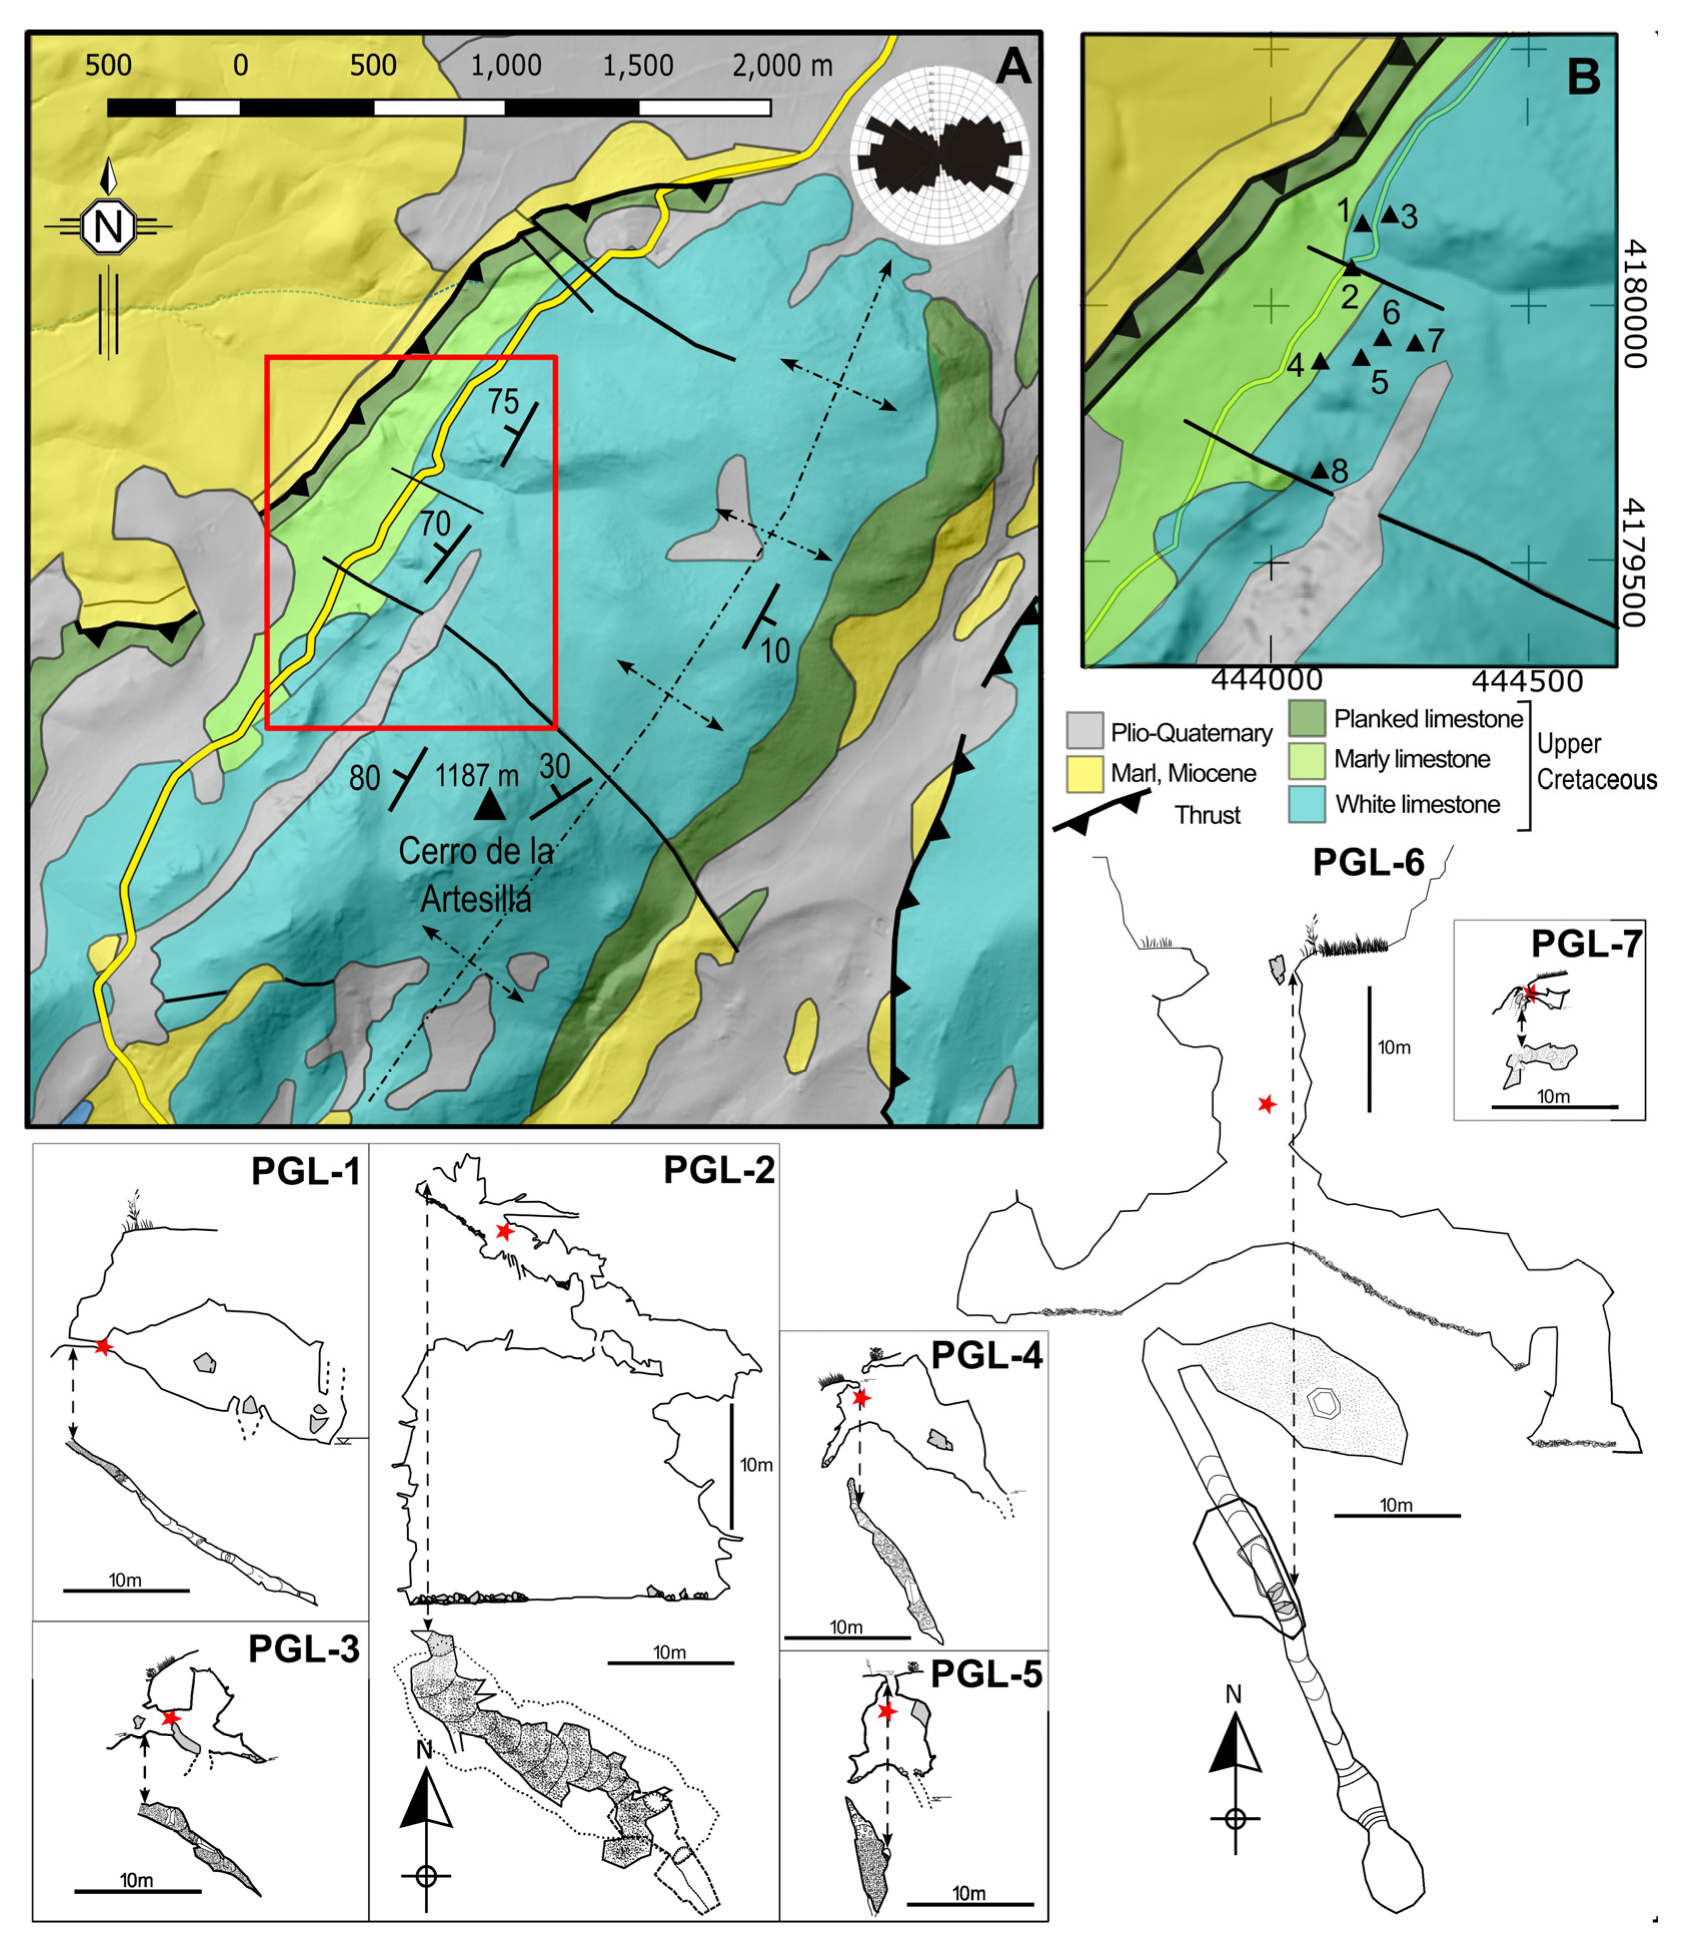
Figure 2. Geologic map of Serrezuela de Pegalajar and topographic profiles and plants of the studied shafts. (A) Geologic map modified from the Geologic continuous map of Spain (GEODE), available from the Spanish Geological Survey (IGME). The rose diagram with the orientation of the fractures taken from [44] González-Ramón (2007). (B) Enlargement of the studied area (red box) with the position of the cave entrances; the numbers correspond to the label order of each entry named in the text and in Table 1. All profiles and plants have the same vertical and horizontal scale; all plants have the same geographic orientation. Red stars in the topographic profiles indicate the reference temperature sensor. Topographic survey by T. Guerra, assisted by the Speleological Club of Jaén.
Geosciences 15 00280 g002
The studied caves correspond to fracture shafts of tectonic origin (widened joints or faults) geomorphologically characterised by a vertical development with limited superimposed dissolution, thus belonging to an immature karst ([46] Waltham, 2002), accessible for exploration up to depths of 40 m. The abundance of fractures is related to a complex tectonic history in a transpressive context that had been active from Miocene until today ([47] Pérez-Valera et al., 2017). Shaft wall strikes are oriented between N123° E and N155° E (Figure 2), forming a high angle with respect to a local anticline of axis N055° E and to the slope of the mountain range at that location (Figure 2A,B). The bedding in the area is dipping 70–80° towards the NW, that is, with the same orientation as the slope. Shaft orientations are compatible with the known regional WSW-ENE extension ([48,49] Galindo-Zaldívar et al., 2000, 2015) that could produce normal faulting, as it is observed in the area (Figure 2), and the generalised opening of pre-existing and new fractures.
The studied fracture/shaft system can be specifically integrated as part of the porosity of the Mancha Real-Pegalajar aquifer ([50] González-Ramón et al., 2012), comprising a 300 m thick sequence of Upper Cretaceous carbonates. The impermeable substrate of the aquifer comprises stratigraphically continuous Lower Cretaceous marls and overthrusted Miocene marls. The water table is located at a depth of 190 m below the studied entrances (640 m above sea level), with a groundwater temperature around 17.4 °C, although in the recharge zone, a few kilometres apart, the water temperature is 15.5 °C ([44] González-Ramón et al., 2007).
The climate of the area is Mediterranean with moderate continental influence, with dry, very hot summers and cold, relatively wet winters (Figure 3). The average annual precipitation is approximately 500 mm in the foothills of the sierra and may exceed 900 mm at the highest elevations; the annual rainfall amount calculated for the studied sector was 550 mm. The precipitation regime is clearly seasonal, with very scarce precipitation or none at all in summer (Figure 3). The average temperature in the studied area has been calculated for four periods (1950–1970, 1970–1990, 1990–2010, and 2010–2020), resulting in 12.6 °C, 13.3 °C, 14.3 °C, and 15.3 °C, respectively, showing a clear warming trend. The thermal oscillation between the mean of the coldest and the hottest day of each year is approximately 30 °C for all periods. The typical daily thermal oscillation is 6 °C for a winter day and 12 °C for a summer day.

3. Materials and Methods

3.1. Studied Caves

Eight openings distributed over an area of 0.1 km2 on the same hillside of the Serrezuela de Pegalajar (hereinafter Serrezuela) were monitored (Figure 1 and Figure 2, Table 1). Table 1 shows the geometric and microclimatic parameters of the eight openings arranged in ascending order according to their topographic height, from 812 m (the lowest entrance (PGL-1)) to 906 m (highest entrance (PGL-8)). The openings are all entrances to vertical shafts and are located at different elevations, except PGL-7, which corresponds to a narrow near-horizontal impenetrable conduit. There is no connection that can be explored between the analysed shaft; however, in all of them, continuity is observed through the narrower fracture itself, or through a chaos of blocks that allow an easy passage of air. It can therefore be affirmed that either there is a direct connection between at least part of the nearby shaft, or there are openings that have not been identified and that allow air circulation via the chimney effect.
The traditional name of the main entrance (PGL-2), “Sima del Aire” (air shaft), is meaningful and refers to an airflow that can be felt in summer by people mingling on a local road and even cools the pavement ([51] Sánchez-Gómez et al., 2021). Moreover, airflows of variable intensity have been verified in the rest of openings (Table 1). Entrances below 867 m show outward cool airflow in summer, and entrances above 893 m show outward warm airflow in winter.

3.2. Climatic Database

The cave system was monitored with temperature sensors, some in the external area of the caves and others inside them at different levels. The sensors were calibrated with a type A sensor and intercompared with each other, and the accuracy of the devices is 0.2 °C. The temperature was measured continuously with records every 10 min. In addition, air flows were measured discontinuously at the exits of the caves by using sensors detecting the speed and direction of the wind.
A second set of data was obtained from reanalysis data allowing the estimation of many meteorological variables at different levels of the atmosphere: temperature, pressure, humidity, wind speed, and direction. Estimates of these variables were obtained from simulations using the mesoscale numerical weather prediction (NWP) Weather Research and Forecasting (WRF) model. The WRF (https://www.mmm.ucar.edu/models/wrf; accessed on 22 April 2023) model provides meteorological fields with high spatial and temporal resolutions in limited areas. In our case, we adopted a spatial–temporal resolution of 1 h and a 3 km grid size, an approach known as dynamic downscaling, as the model solves the governing equations in limited nesting areas in which spatial and temporal resolution gradually increases. In our study, the set of parameterization schemes used in the simulations is reported in ([52] Lara-Fanego et al., 2012). The estimated data from reanalysis have been calibrated with data from more than 60 ground meteorological stations, finally obtaining a set of highly reliable data.
Both data sets show a good fit (the temperature difference is always less than 1°), although on-site summer daily average or some maximum values are slightly higher than synthetic ones (Figure 3b), which could be attributed to the influence of direct solar radiation or soil radiance depending on the season or the time of day. A synthetic temperature series has therefore been used for further calculations as the best approximation for the 1.5 m air temperature, thus avoiding the issue of missing data from on-site sensors.
Additionally, we obtained a data set comprising diary temperatures and rain averages over the period 1950 to 2020 from different ground station networks provided by the Andalusia Environmental Information Network (REDIAM) and WRF data that we used to estimate the theoretical cave average.

3.3. Microclimatic Monitoring

Three microclimatic parameters were measured, namely wind velocity, temperature, and humidity, from April 2017 to April 22, ensuring that all openings were monitored for at least 4 full years. Air velocity data were obtained sporadically at the cave openings measuring during the moments of daily maximum thermal contrast between the interior and exterior of the cave system. A portable hot-wire anemometer (model PCE-423) was used, with a resolution of 0.01 m/s and accuracy of 0.2 m/s. The sensor was placed in the centre of the entrance using the device’s extension rod, taking care not to obstruct the air outlet or inlet. Data collection started after the thermic stabilisation of the anemometer (a few minutes), observing the values obtained during 10–15 min to register the highest sustained one.
Temperature dataloggers were placed at the entrances at three or four positions located between 0 and 13 m depth/inside. After the first year of measurements, a representative position of each entrance was identified as critical and then monitored until completion of the 4-full-year period, but monitoring was maintained at least in one other position for each opening as a control measure and to overcome data gaps in case of malfunction in the critical position. The devices used are commercial data loggers with an operating range of between −30 to +70 °C, with 0.3–0.5 °C accuracy (between −20 and 40 °C) and 0.1 °C resolution. To ensure the temperature data between recorders was comparable, periodic cross-calibrations were performed under stable laboratory conditions, determining a relative accuracy of ±0.15 °C between sensors after correction. Temperature sensors were left in place for around 3 months, measuring at intervals of 10–30 min (see Supplementary Material S1).
Humidity was recorded only at some positions and entrances, and at the outdoor reference location, using combined temperature/humidity data loggers. The resolution of the devices is 0.1% and their accuracy is ±3% within the interval 20–80% and ±5% for the intervals RH < 20% and RH > 80%.
To characterise the heterothermic zone, we placed sensors at three typical levels, slightly varying the depth depending on the development and accessibility of the cave, at (0), (2–5), and (7–13) metres from the cave openings. After the thermal regime of the entrance was determined, the second level (2–5 m) was set (Figure 2, red stars) as it provided the most distinctive signature. Some sensors were fixed to the walls in direct contact with the bedrock, while others were hung in the central part of the chimneys or corridors of the caves. In addition, a reference sensor was placed outside the caves, 1.5 m from the ground, in a shaded area protected from rain. Although all sensors have been carefully placed in the most protected places possible, sporadic vandalism, natural hazards (including animal curiosity) and some malfunctions have caused some gaps in the data record (see Supplementary Material S1).

4. Results

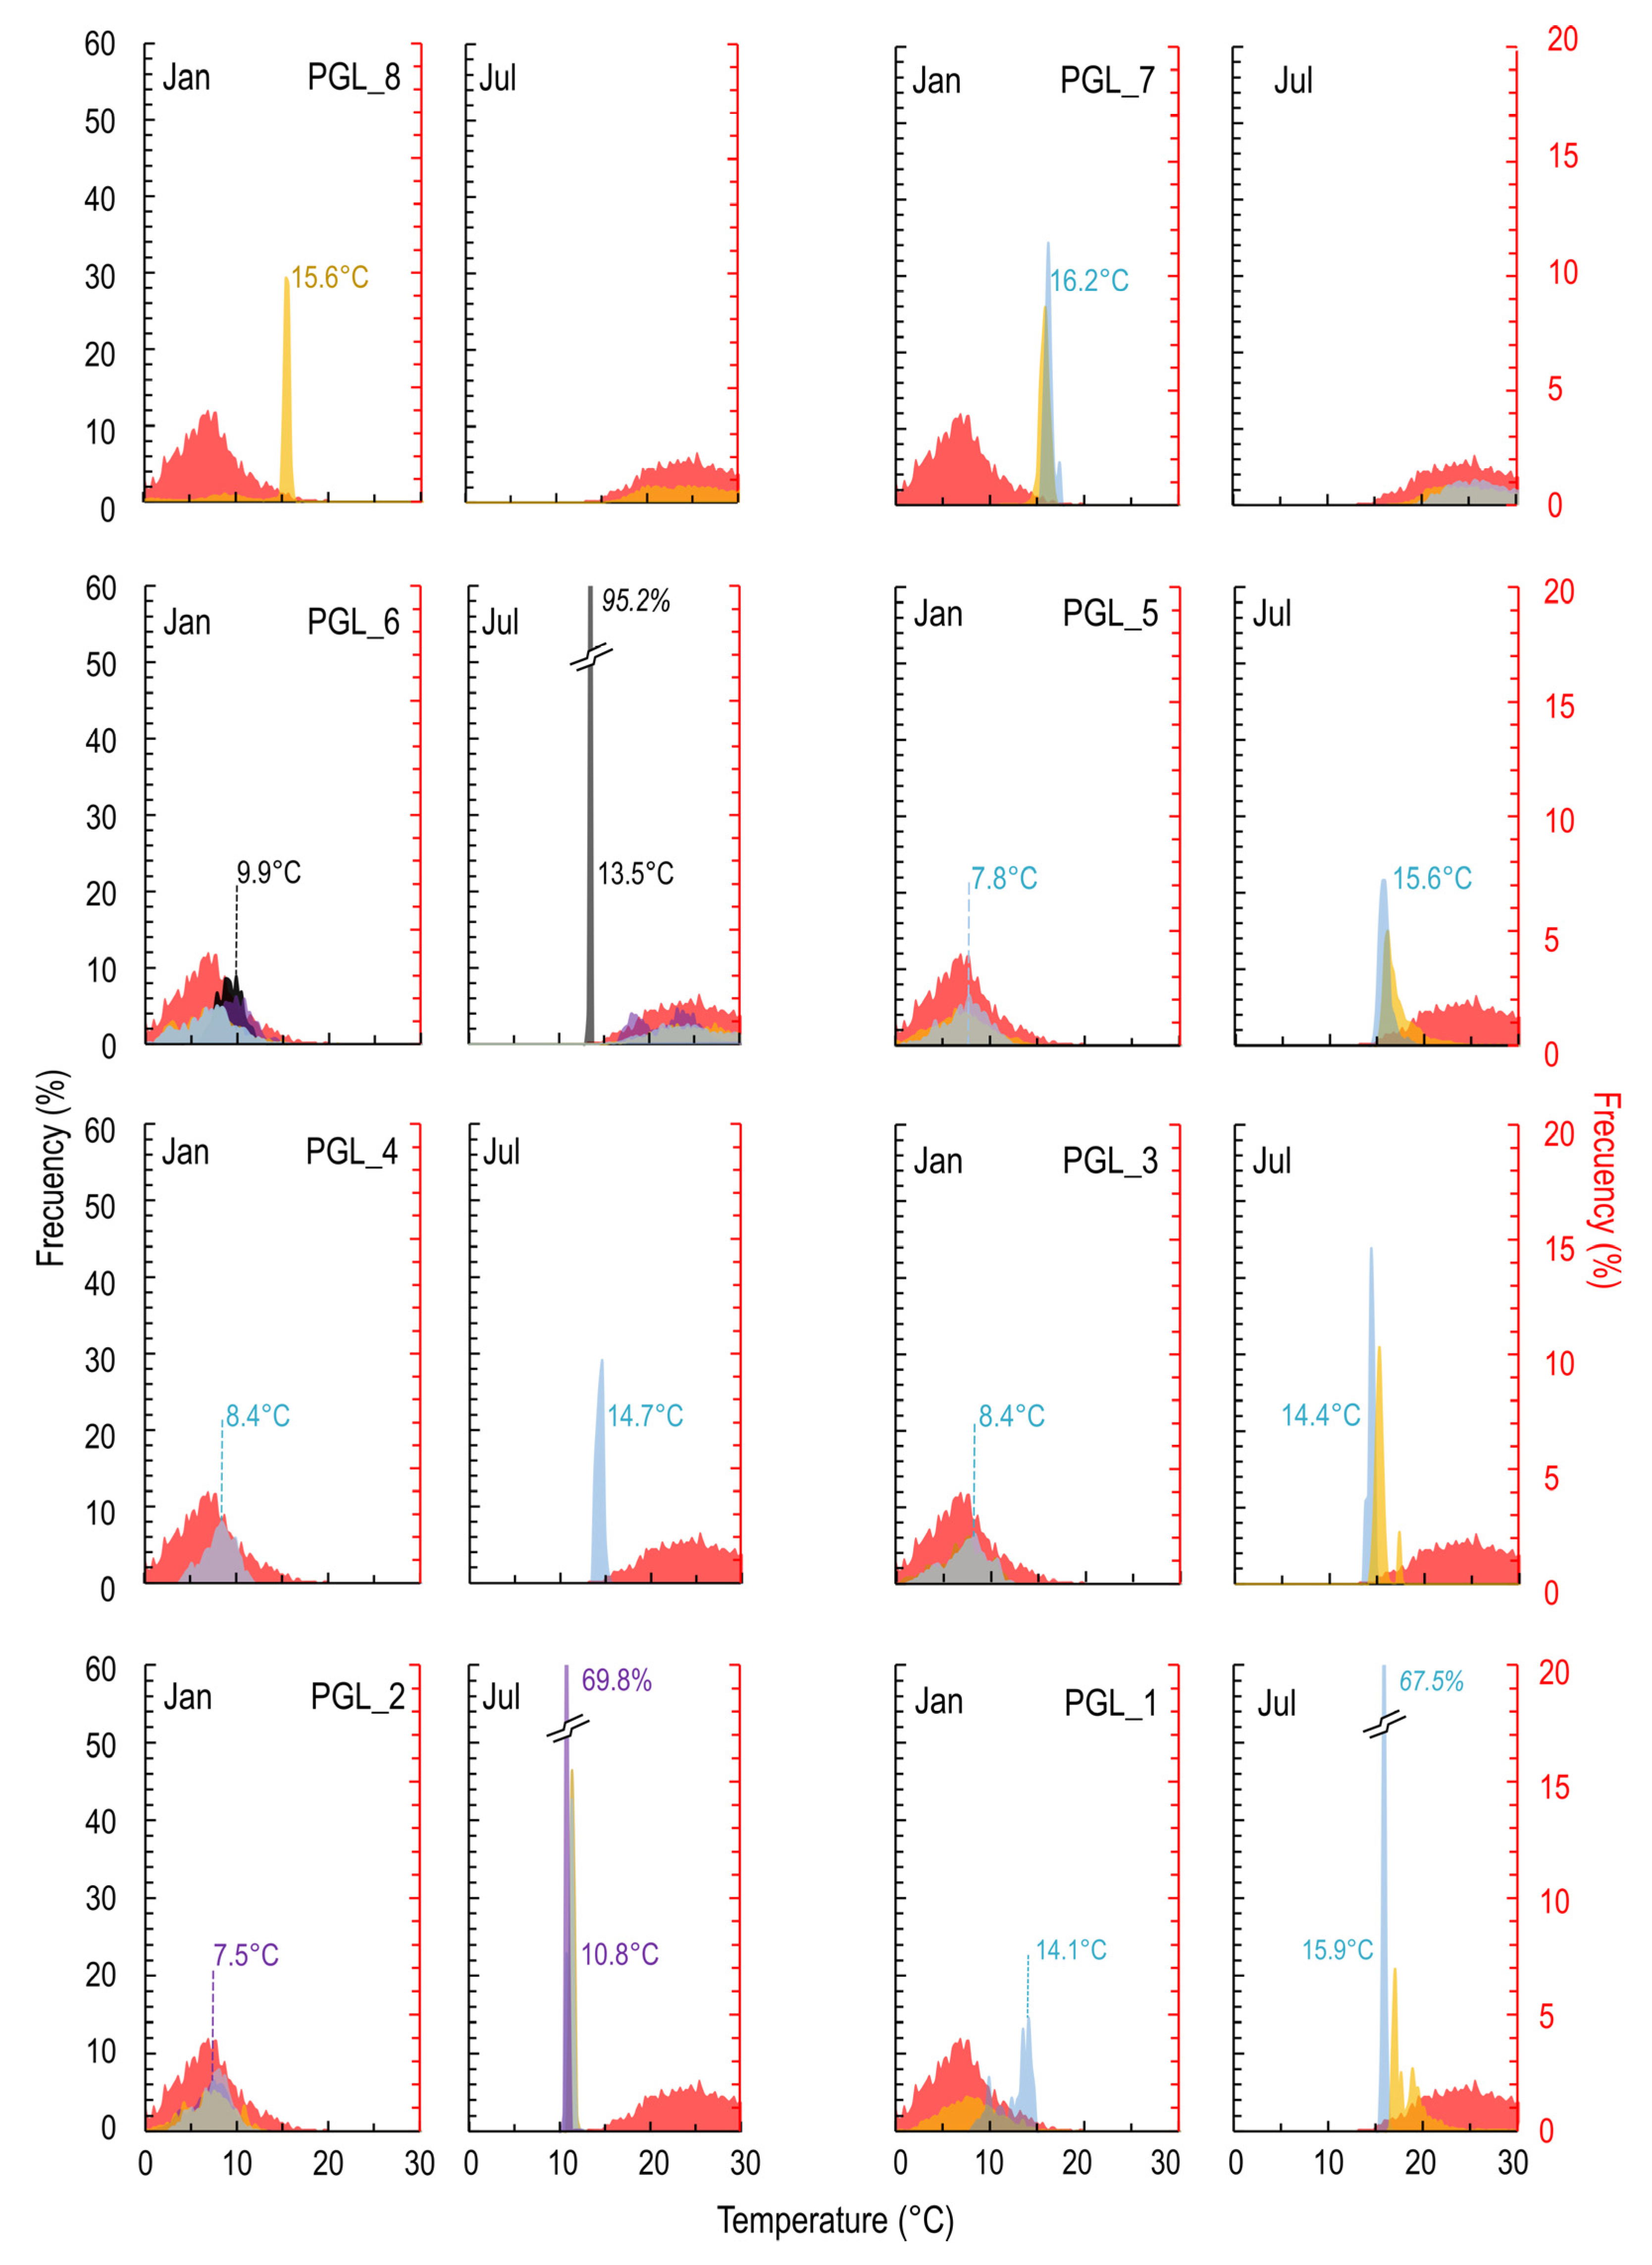
Direct air flows have been observed in all the studied openings except PGL-6, with maximum values for the outflows that oscillate between 0.9 and 4.3 m/s and inflows with values ranging from 0.4 to 2.3 m/s (Table 1). The distribution of temperature frequencies by month at each entrance (see Supplementary Material S2) reflects the effects of these airflows. When outflow dominates at an inlet, temperatures recorded at different depths are homogenised, showing a distinct modal value that contrasts with the temperature oscillations at the exterior (Figure 4). When inflow dominates, the distribution of temperatures at the interior of entrances mimics the exterior temperature while smoothing the extreme values. With this simple analysis, entrance PGL-6 also shows evidence of outflow in summer and inflow in winter (Figure 4), albeit below the wind detection threshold. It can then be established that all openings below 880 m altitude show outflow in summer, and those above that level show it in winter.
The analysis of relative temperature frequencies can also indicate the efficiency of the airflow, that is, the capacity of the air to cool or heat the rock until it reaches an equilibrium temperature. Sensors at a determined level can be highly influenced by outflows registering the same temperature with frequencies of more than 60% (intervals of 0.3 °C) with an oscillation of less than ±0.6 °C (PGL-1, -2, and -6; Figure 4). Less efficient outflows produce a modal temperature with frequencies of 20-30% and an oscillation of ±2 °C (v.g. PGL-4, -5, and -7; Figure 4), although intermediate situations are also noticed. Further, differences can be observed in the effectiveness of the airflow depending on position depth and the geometry of the entrance. The entrance with a large area but low air velocity (PGL-6) only shows a clear influence of the outflow in a deep position, but the influence of the inflow is reflected in the superficial positions (Figure 4). However, small or narrow openings (PGL-3 and PGL-7) show similar thermal behaviour at all the positions, with moderate airflow velocities. For a subsequent outflow analysis and a comparison between openings, a sensor position has been chosen based on its performance (Table 1).
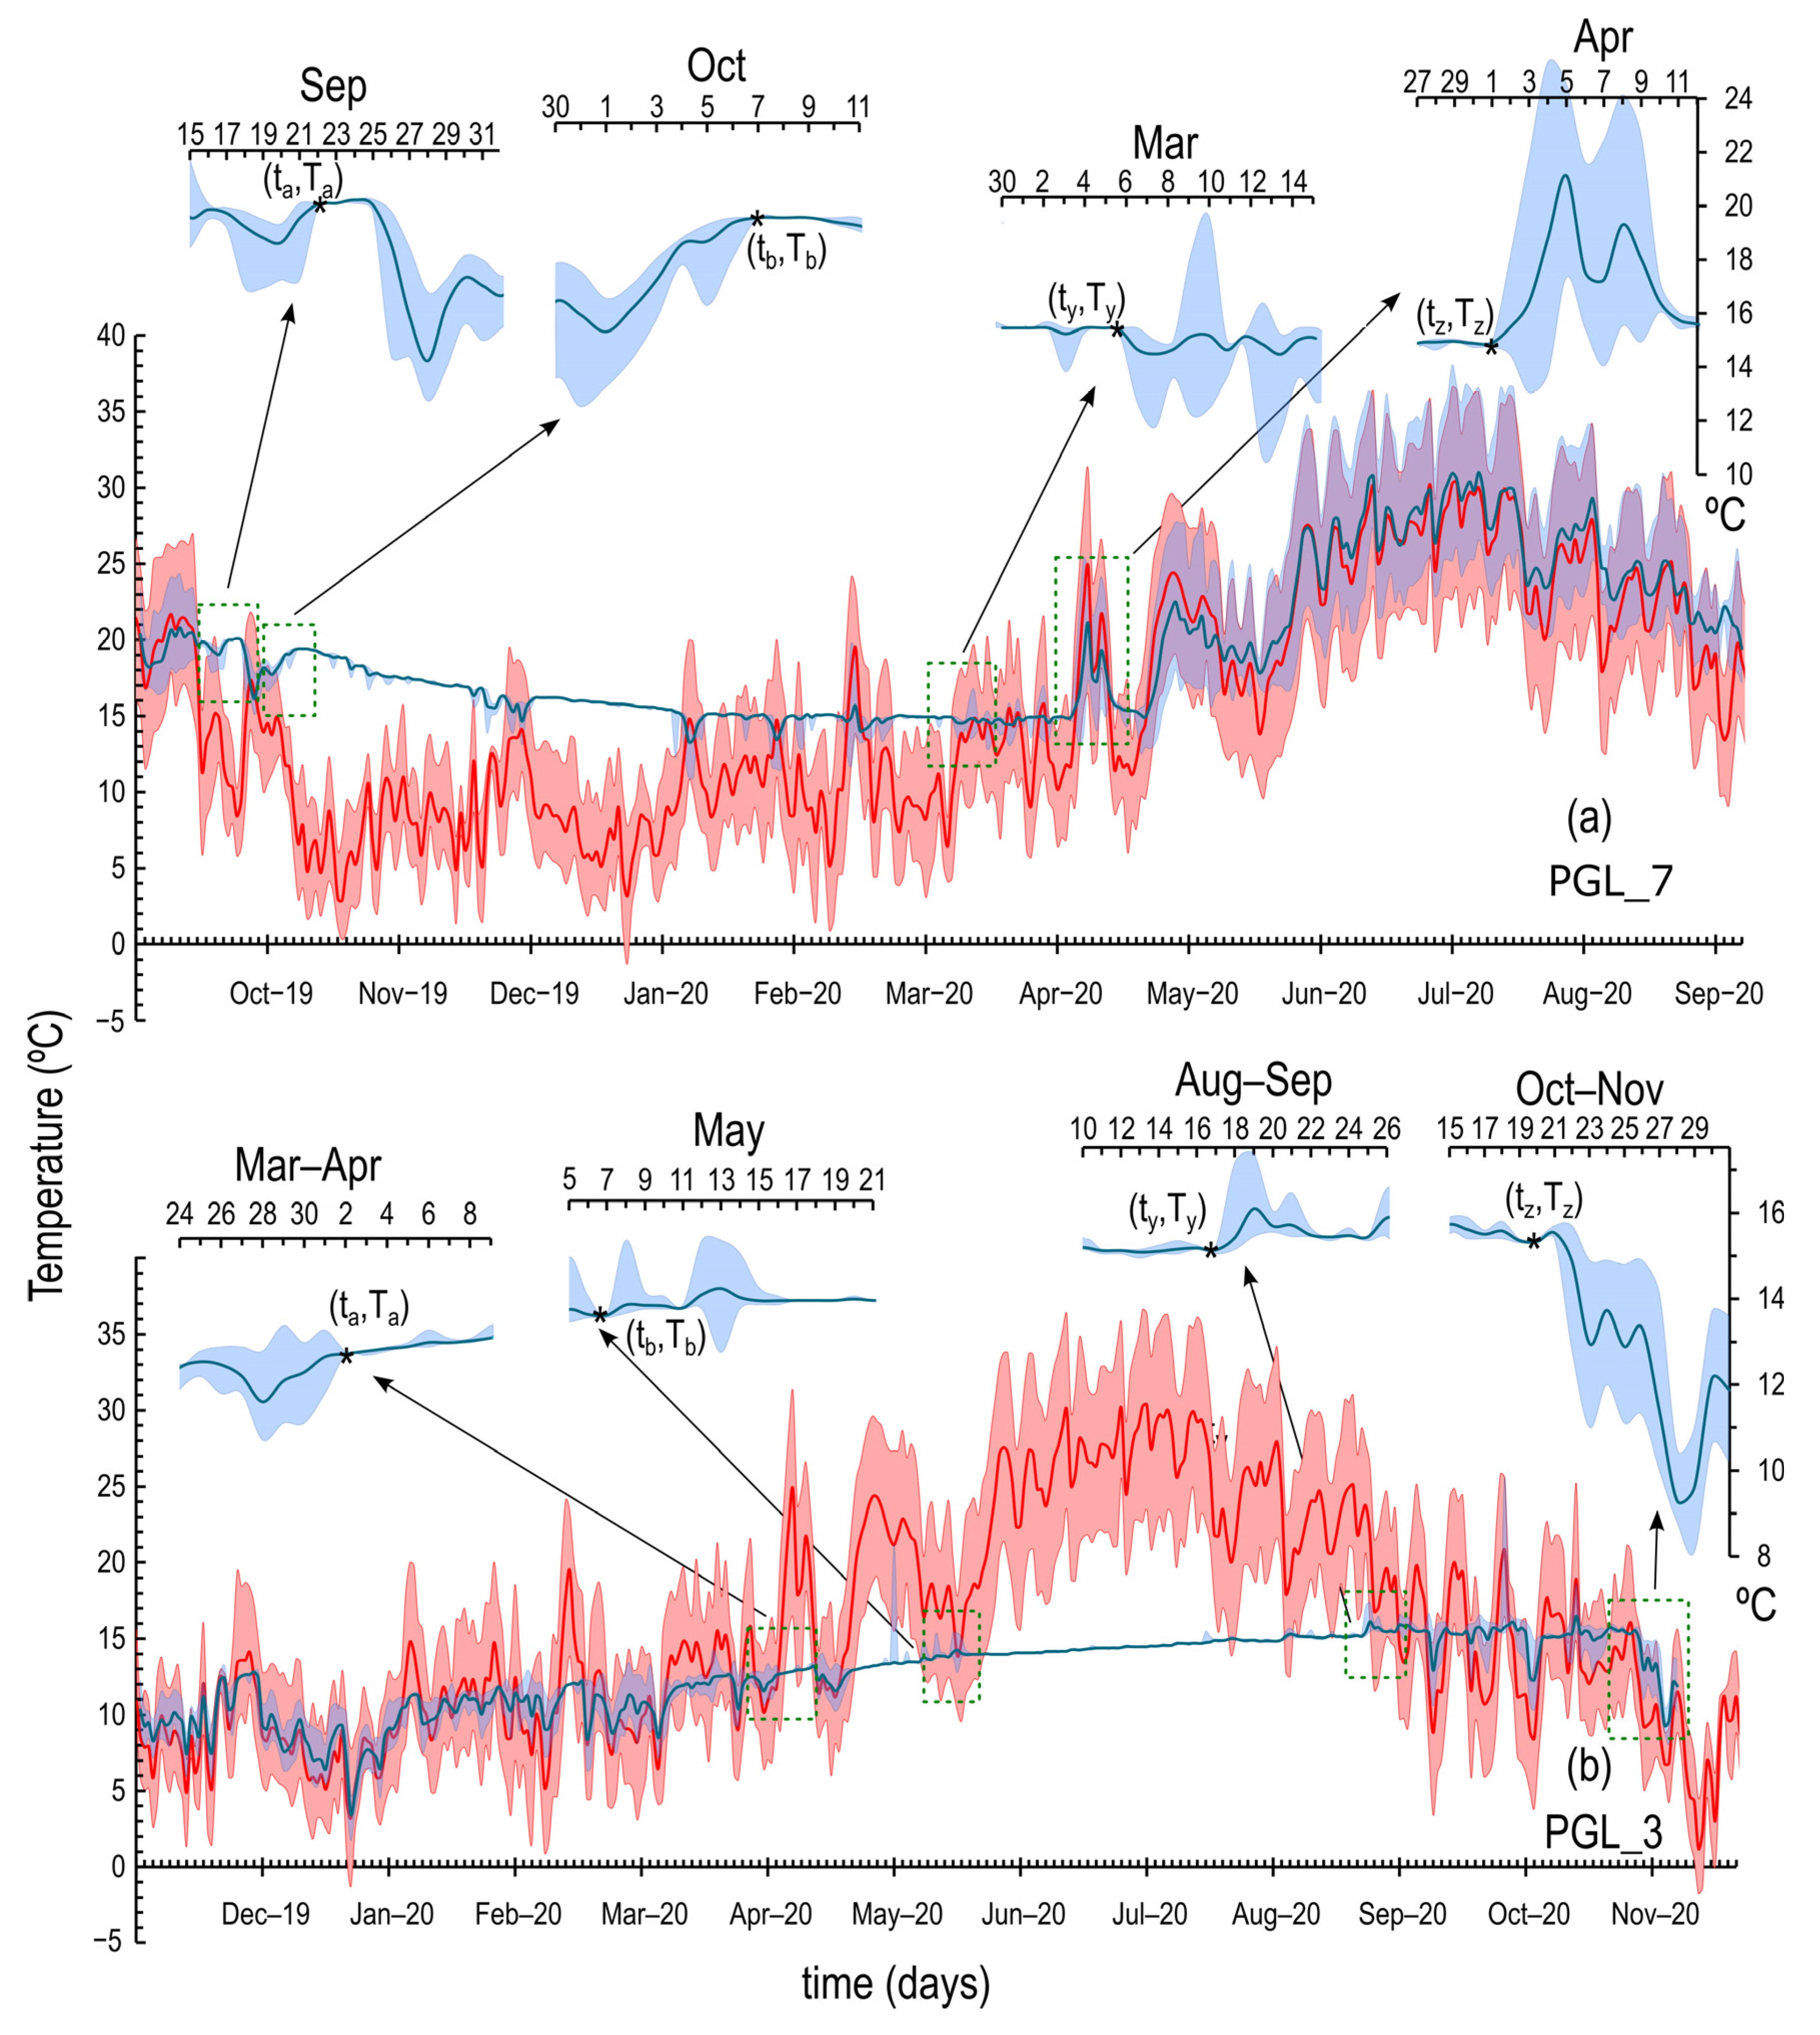
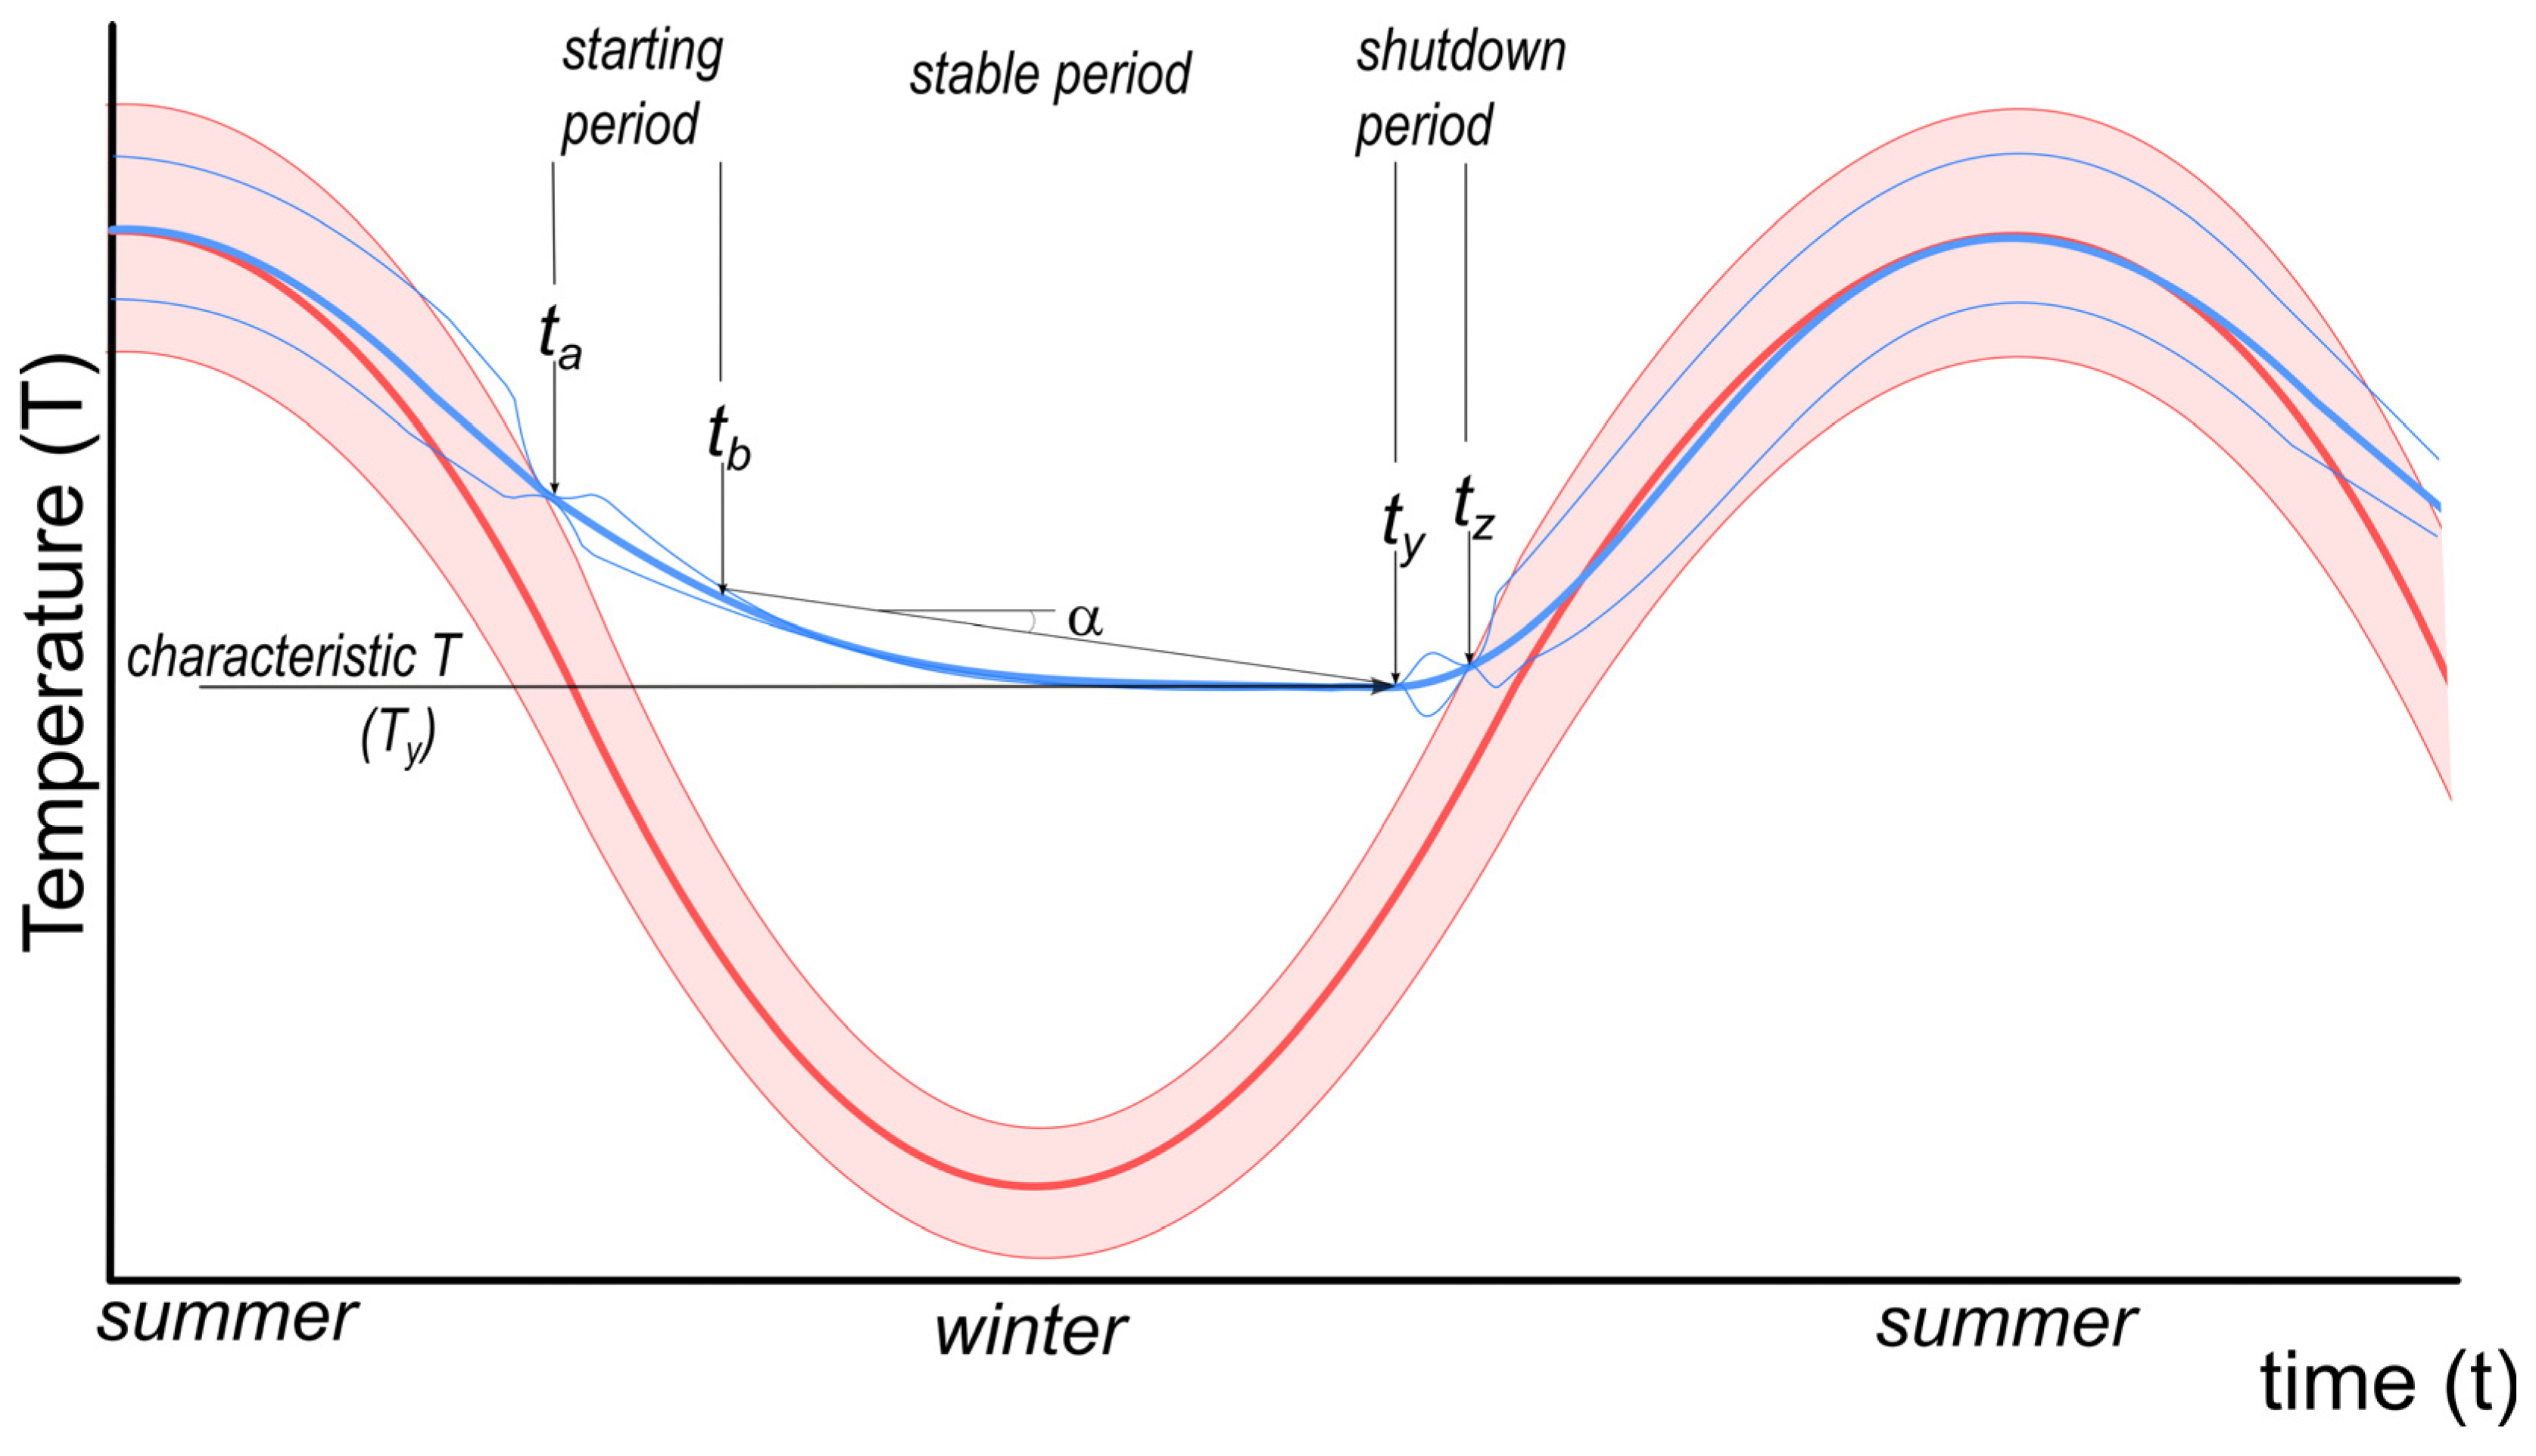
The outflow season at a determined entrance can be established when daily maximum and minimum temperatures are equal to the average for a few consecutive days (Ta in Figure 5). After a period of 20–60 days, the outflow stabilises and the temperature recorded by the sensor is practically constant (Tb, Figure 5). When the outflow is continuous, only sporadic daily excursions of the maximum (summer) or minimum (winter) can be observed, but it has a small effect on the average (Figure 5). Before the end of the season, the variability in the daily temperature increases at ty, although the average remains little variation. Finally, the daily average, maximum, and minimum temperatures undergo a dramatic change in trend (tz), with large variations that mimic the outside temperature.
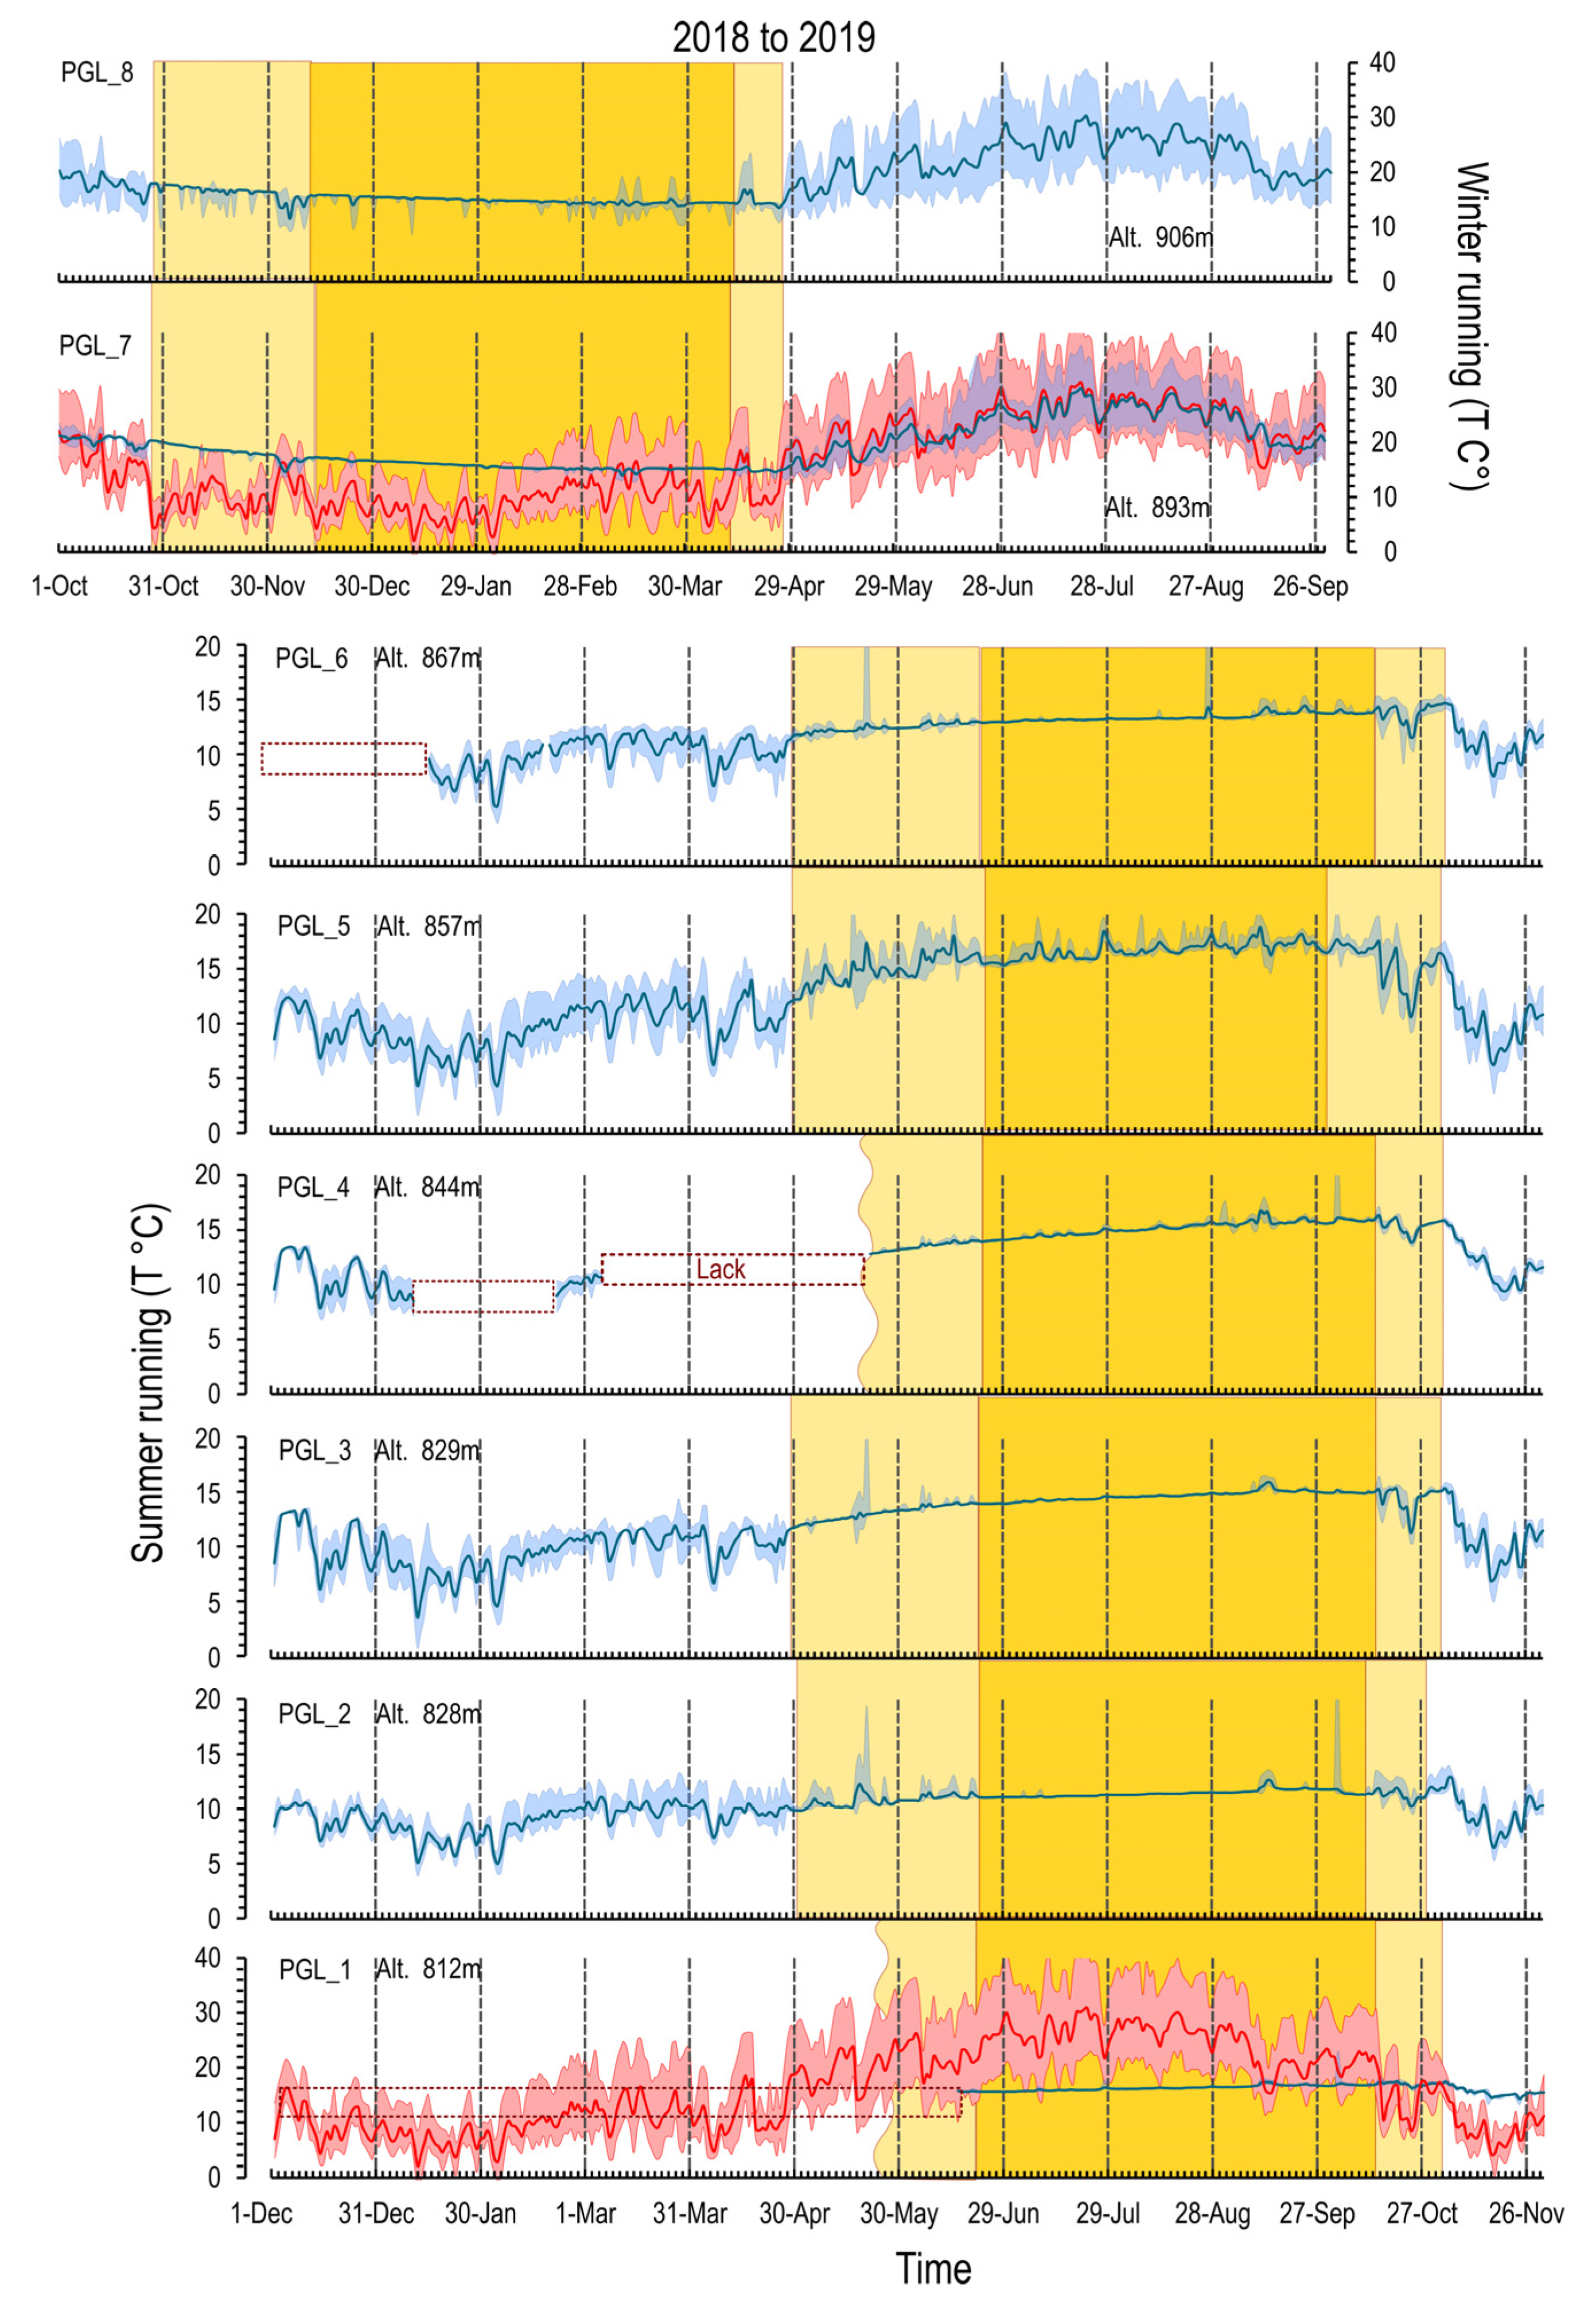
In general, the milestones in the behaviour of the outflow can be recognised in all the openings, although the thermal signature differs from one inlet to the other (Figure 6). All inlets show a clear summer or winter operating regime. Nevertheless, the outflow cannot stabilise the temperature completely in some of them, which shows more- or less-evident oscillations as a response to the external weather. Depending on the period at which the outflow starts (ta), the entrances can be grouped into two types of operating regimes (Figure 6): winter running (PGL-7, PGL-8), with a relatively warm outflow during the winter season, and summer running (PGL-1 to PGL-6), with a relatively cool air outflow during the summer season.
Regardless of whether the daily temperature variations are minimal, throughout the outflow season, the recorded temperature at the inlets undergoes a gradual variation (Figure 5 and Figure 6). These seasonal variations fluctuate between 0.5 and 4 °C (Table 1) considering the difference between the temperature at time ty, when the stable outflow ends, and the temperature when the outflow stabilises (time tb). A straight or exponential line along the season can be drawn to show heating or cooling (Figure 6). Typical cooling or heating monthly rates are between 0.1 and 0.9 °C/month (Table 1).
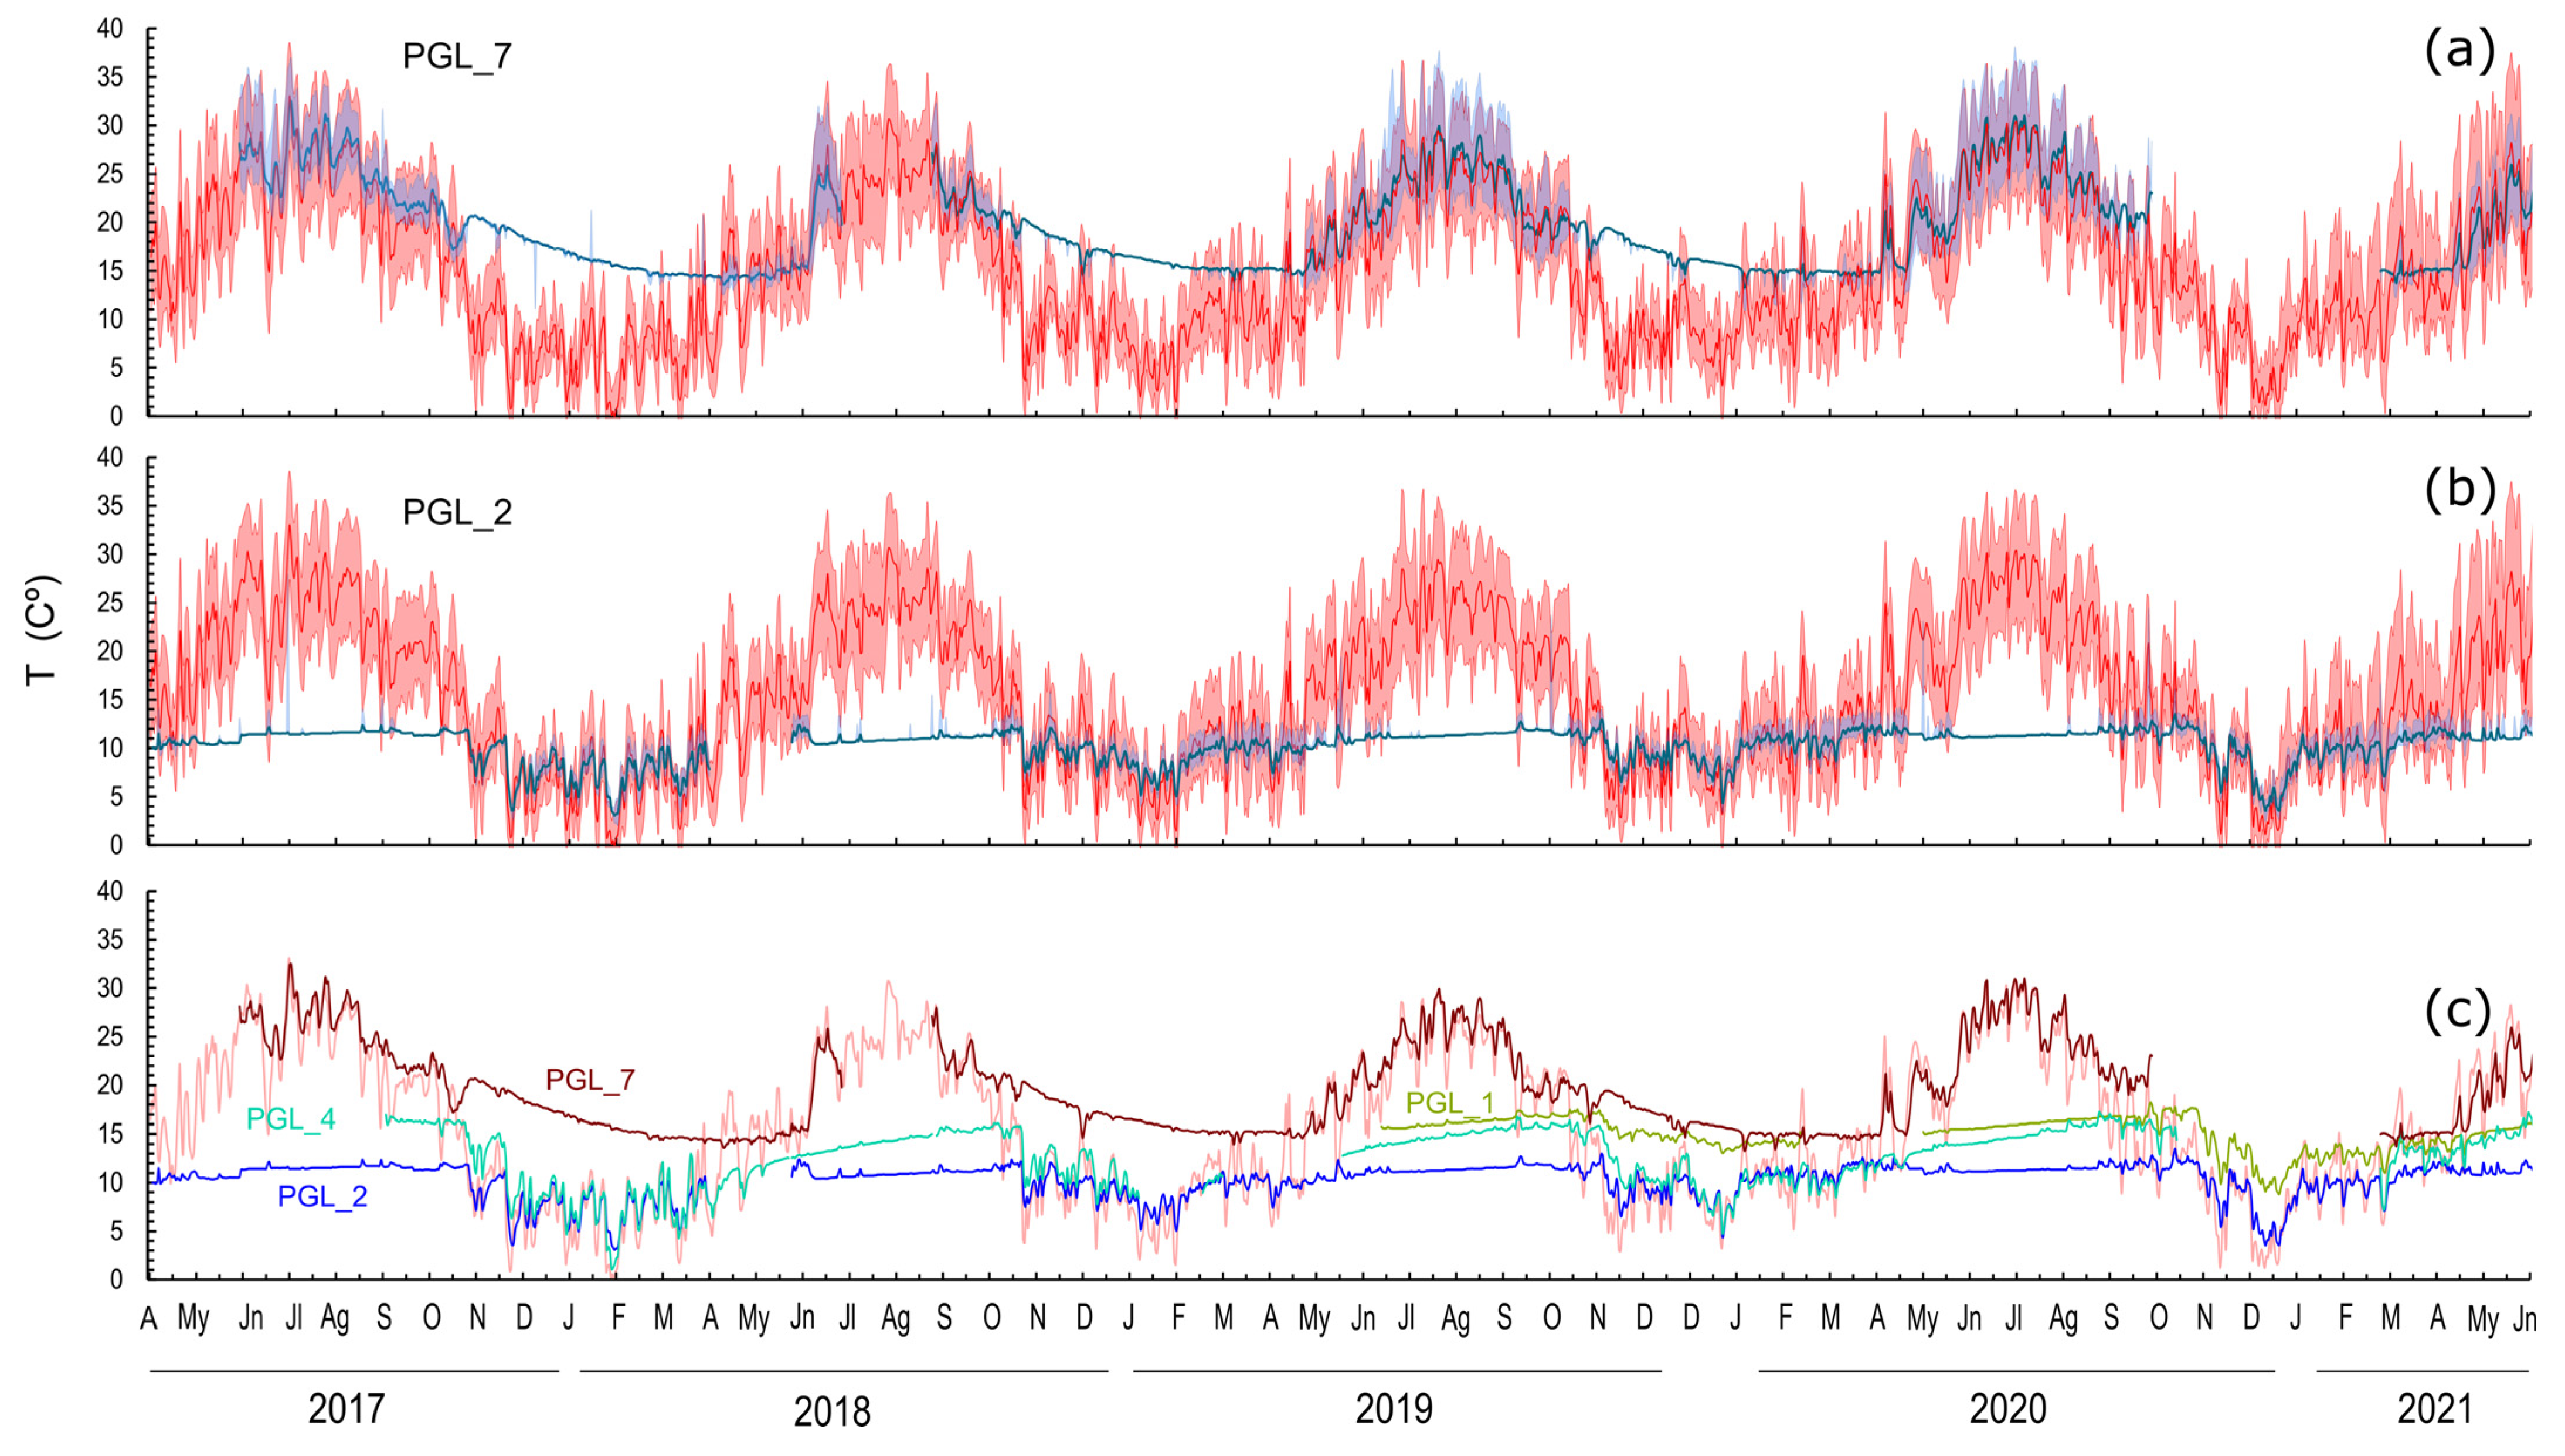
Temperatures at the shutdown of the stable outflow season (ty) show minimal variations along the studied years in all inlets, with a typical standard deviation below 0.2 °C. However, the start of the season presents larger standard deviations between 0.5 and 1.5 °C, when outflow stabilises at tb (Table 1, Figure 7). The temperature at some inlets tends to converge between them at the end of the season (i.e., they show a similar Ty (Table 1)), regardless of whether the flow regime is winter- or summer-running and the temperature at the beginning of the season (ta), which can be quite different (Figure 7).

5. Discussion

The caves studied in this work (Table 1) have a main vertical development (Figure 2) and can be considered highly connected via a fracture network. With this geometry, a major microclimatic conditioning factor will be the so-called chimney effect ([13] Trombe, 1952; [16] Lismonde, 2002; [53] Perrier and le Mouël, 2016; [39] Bertozzi et al., 2019), which implies airflows and larger seasonal temperature variations much greater than those that can be observed in predominantly horizontal caves ([29] Faimon and Lang, 2013; [31] Sainz et al., 2018; [40] Kukuljan et al., 2021b) or inertial caves ([54] Muladi and Mucsi, 2014). The microclimate recorded at the entrances or openings (sometimes simple inlets) shows a distinctive seasonal behaviour within a period when the temperature registered is completely decoupled from the outside (Figure 4 and Figure 8). This decoupling of the temperature between openings and exterior is due to the stabilisation of the temperature sensor by the outflow that reflects the conditions at the interior of the karst. The outflows present typical velocities of 1 m/s, although they can reach up to 4 m/s (Table 1) in the hours of more thermic contrast.
The air movement is caused by the differences in density ([15] Peters, 1965; [19] de Freitas at al., 1982; [29] Faimon and Lang, 2013) resolved as differences in pressure ([55] Bögli, 1980; [56] Massen et al., 1998; [57] Batiot-Guilhe at al., 2007). Two seasons can thus be observed in the interior of the karst system: in winter, upper openings evacuate relatively warm and lighter air, while the lower inlets draw air in, causing an upward air flow (UAF) in the karstic system ([17] Faimon at al., 2012; [36] Kašing and Lenart, 2020); in summer, the movement of air reverses, and the relatively cool and heavier airflow leaves the lower openings causing a downward air flow (DAF). To start the chimney effect airflow, the driving pressure differences must compensate for the frictional forces ([41] Gabrovšek, 2023). A typical ΔT observed to induce the upward airflow is about 5 °C ([58] Pérez-García et al., 2018), and although it has been suggested that the temperature difference required to initiate the downward flow process might be slightly lower ([41] Gabrovšek, 2023), our data lack the necessary resolution to show this extreme. The monthly temperature frequency graphics (Figure 4) show that the typical summer (cave) season takes place between the months of May and October, and the winter season one is between November and April (see Supplementary Material S2), with transition periods in April–May and October–November (Figure 6). Cave microclimatic seasons therefore do not match exactly with the climatic, agronomic, or astronomical seasons.
The simple recording of the temperature at a point in the cavity can therefore determine not only the characteristics of the air flow regime, but also the behaviour of the entrance with respect to the karst system through which air circulates. The shallower position where the outflow becomes dominant and sets the temperature can be defined as the critical depth of each entrance. Outward from the critical depth, the temperature will also be influenced by the external climate; inward, temperature changes will be progressively smoother until reaching the homothermic zone, typically at 40–100 m ([6] Drogue, 1985). The critical depth depends on the relationship between the size of the entrance and the velocity of the outflow. Our caves have a typical critical depth between 0 and 2 m, except for PGL-6 with a 10.5 m2 area opening (Table 1), in which the sensor located at 13 m had to be chosen (Figure 2, red stars) to detect the thermal signature of seasonal airflows.
The thermal behaviour of the entrances beneath the critical depth is not homogeneous during the season. Although the mean temperature shows little change in the short term (several days), throughout the outflow season, each opening exhibits a long-term cooling/warming pattern (Figure 7). In general, the temperatures given in the caves reflect an exponential cooling (Figure 8) or heating rate, depending on the type of air flow they expel (warm or cool). The temperature average for openings thus represents a parabola over time, with a negative slope in the winter running, and a positive slope in summer (Figure 5, Figure 6 and Figure 7). The curvature depends on the effectiveness of walls cooling/warming due to the outflow. Small openings usually start the season with a relatively strong cooling/warming that stabilises afterward, becoming asymptotic to a straight line (Figure 8). The difference in the temperature of the outflow at the beginning and end of the season and that in the cooling/heating rate (Table 1) therefore indicate the effectiveness of the outflow to modify the wall temperature. The studied openings show cooling/warming rates between 0.1 and 0.9 °C/month independent of whether they are winter or summer running.
The outflow temperature becomes stable at the end of the season (ty, Figure 8) when the outflow temperature average variation is minimal in successive days. Ty can be considered the characteristic temperature of each entrance, exhibiting little variation during the studied period, typically with σ below 0.15 (Table 1). The characteristic temperature should be associated with the equilibrium temperature of the interior of the karstic system. In fact, most of the studied openings that have a different outflow temperature (Tb) at the beginning of the stable period (tb) tend to converge in clusters, even between the summer- and winter-running openings (Table 1, Figure 7c), suggesting that they are connected to the same fracture and duct karst system. On the contrary, one of the entrances (PGL-2) has a distinctive thermal signature with a Ty separated from the rest (Table 1, Figure 7).
The characteristic temperature does not necessarily coincide with the one registered when the outside temperature is maximal or minimal, and the airflow is therefore maximum when reaching the climax. These conditions are usually achieved in July (summer-running entrances) or January (winter-running entrances), when sensors show the most homogeneous records with frequencies up to 95% for the same value (climax mode, Table 1) and an oscillation lower than ±0.3 °C. When the outside temperature moderates significantly but the flow regime endures (ty-tz, Figure 8), the shutdown period starts, characterised by an increase in daily oscillations (Figure 5 and Figure 6), but the daily temperature is maintained with little variation.
Summarising, each entrance or opening from vertical cave systems is characterised by a thermal signature or pattern along the outflow season, with three parts (Figure 8): the starting, stable, and shutdown periods. In the starting period, the temperature of the outflowing air would be associated with the cooling/heating of the shallow duct walls during the previous inflow season; it will thus depend on the weather of that particular year and the geometry of the entrance. The stable period can therefore vary the starting temperature by up to three degrees (Table 1, σT at tb time). During the stable period, the outflow temperature increases/decreases homogeneously, reaching the characteristic temperature Ty, which is the one that varied the least over the study years, and is therefore the one that comes closest to the equilibrium temperature of the karst system and is independent of the specific weather in any given year. The temperature difference along the stable period (Ty-Tb, Table 1) and the cooling/warming rate (ΔT/month, Table 1; tan α, Figure 8) would be related to the capacity of the inner karst system to heat interchange. Large voids or fracture systems with more exposed surfaces will stabilise the air temperature earlier, as it can be observed in PGL-2, PGL-5, and PGL-6, with little variations along the stable period.
All the parameters described here correlate the cave system microclimate with the weather outside, while providing information on the interior geometry that often cannot be explored. Fracture caves with a Z-dimension preferential development ([59] Pardo-Igúzquiza et al., 2024) and a noticeable chimney effect will be more sensitive to the external weather conditions than typical horizontal show, archaeological, or therapeutic caves (e.g., [60] Gázquez et al., 2022; [61] Bourges et al., 2014; [62] Liñán et al., 2018). These dynamic caves will thus function as natural laboratories for studying climate change and its effects on underground ecosystems (e.g., [63] Ladle et al., 2012; [64] Mammola et al., 2015; [65] Jiménez-Valverde et al., 2017).

6. Conclusions

An immature karst system in South Spain with eight openings distributed between an elevation of 812 and 906 m was climatically monitored for five years (2017–2022), yielding a near-continuous temporal series. All the outlets showed a noticeable chimney effect with a high airflow of up to 4 m/s being reached when the temperature contrasts between the external and the inner karst climate conditions are maximum in the hottest and coldest months. Entrances above 880 m exhibit outward warm airflow in winter, and below this altitude, they expel cool air in summer. Paradoxically, during the outflow season, the temperature of the openings at shallow critical depths is further affected by the outside temperature, reaching differences of more than 25 °C in the torrid Mediterranean summers of the region.
The outflows conditioned the temperature of the entrance environments, showing a distinctive signature in each outlet. By analysing the outflow temperature series in a single selected position and comparing them with the exterior weather, we found three parameters that simply describe the thermal behaviour throughout the year. The most significant is the characteristic temperature (Ty) registered at the end of the outflow season, which presents very small variations over the years, with a standard deviation usually less than 0.2 °C. Another parameter is the temperature recorded at the beginning of the outflow season (Tb), which shows much more variability, with a standard deviation of up to 1.6 °C throughout the monitored period. The rate of cooling/warming (|Ty-Tb|/month) is also a distinctive parameter, ranging between 0.1 and 0.9 °C/month depending on the opening. These parameters depict the dynamic response of the cave microclimate to weather change and group the entrances into clusters, regardless of their spatial proximity, with the same values, that is, the same thermal behaviour.
The three selected parameters—the characteristic temperature (Ty), the temperature at the beginning of the outflow (Tb), and the cooling/warming rate (|Ty-Tb|/month)—can provide insights into the geometric characteristics of the ducts through which air circulates at depth. Ty is related to the deep interior of the system through which the air has passed, while Tb reflects the cooling or warming of the upper metres of the Earth’s surface due to the previous season’s weather and the exit duct geometry. The rate of cooling/warming illustrates the efficiency in the heat exchange between the outside air and the cave walls that will depend on the rock boundaries exposed by the geometry of the inner karst.
This research proposes a simple methodology based on temperature monitoring that can provide information about the geometric aspects of inaccessible karst. Moreover, the dynamic fracture Z-caves with high airflow could become a natural source of evidence of climate change and its effects on the underground world.

Supplementary Materials

The following supporting information can be downloaded at https://www.mdpi.com/article/10.3390/geosciences15080280/s1. Figure S1: Complete temperature record of the studied period at all the positions of each cave; Figure S2: Relative frequency distribution of the temperatures in the studied entrances; Table S1: Table with the temperature parameters calculated for each cave.

Author Contributions

Conceptualization and methodology, M.S.-G.; investigation, data curation, and writing—original draft preparation, D.G.; writing—review and editing, D.G., M.S.-G. and J.T.-P.; supervision and funding acquisition, J.T.-P.; project administration, M.S.-G. All authors have read and agreed to the published version of the manuscript.

Funding

This research is part of D.G.’s predoctoral grant under the Research Personnel Training Program funded by the University of Jaén’s Research Support Plan (2017–2019). The work was also supported by the Centro de Estudios Avanzados en Ciencias de la Tierra, Energía y Medio Ambiente (CEACTEMA), the Instituto de Estudios Giennenses (IEG), and the RNM-325 Junta de Andalucía research group.

Data Availability Statement

The original contributions presented in this study are included in the article material and Supplementary Data. Further inquiries can be directed to the corresponding author.

Acknowledgments

We would like to thank the Jaén Speleology Group (CDEJ) and Theo Guerra for their assistance in the field and during the caving activities. We also thank J.A. García-Armenteros for preparing the temperature map and T. Fernández for his support during the early stages of the manuscript’s creation.

Conflicts of Interest

The authors declare no conflict of interest.

References

  1. Buecher, R.H. Microclimate study of Kartchner Caverns, Arizona. J. Cave Karst Stud. 1999, 61, 108–120. [Google Scholar]
  2. Badino, G. Underground drainage systems and geothermal flux. Acta Carsol. 2005, 34, 277–316. [Google Scholar] [CrossRef]
  3. Badino, G. Geothermal flux and phreatic speleogenesis in gypsum, halite, and quartzite rocks. Int. J. Speleol. 2018, 47, 1–11. [Google Scholar] [CrossRef]
  4. Pardo-Igúzquiza, E.; Dowd, P.A.; Durán, J.J.; Robledo-Ardila, P. A review of fractals in karst. Int. J. Speleol. 2019, 48, 11–20. [Google Scholar] [CrossRef]
  5. Kukuljan, L.; Gabrovšek, F.; Covington, M.D.; Johnston, V.E. CO2 dynamics and heterogeneity in a cave atmosphere: Role of ventilation patterns and airflow pathways. Theor. Appl. Climatol. 2021, 146, 91–109. [Google Scholar] [CrossRef]
  6. Drogue, C. Geothermal gradients and ground water circulation in fissured and karstic rocks: The role played by the structure of the permeable network. J. Geodyn. 1985, 4, 219–231. [Google Scholar] [CrossRef]
  7. Luetscher, M.; Jeannin, P.-Y. A process-based classification of alpine ice caves. Theor. Appl. Karstol. 2004, 17, 5–10. [Google Scholar]
  8. McSween, H.Y.; Moersch, J.E.; Burr, D.M.; Dunne, W.M.; Emery, J.P.; Kah, L.C.; McCanta, M.C. Conductive Heat flow. In Planetary Geoscience; Cambridge University Press: Cambridge, UK, 2019; pp. 139–142. [Google Scholar]
  9. Ramos, M.; De Pablo, M.A.; Sebastian, E.; Armiens, C.; Gómez-Elvira, J. Temperature gradient distribution in permafrost active layer, using a prototype of the ground temperature sensor (REMS-MSL) on Deception Island (Antarctica). Cold Reg. Sci. Technol. 2012, 72, 23–32. [Google Scholar] [CrossRef]
  10. Brady, N.C.; Weil, R.R. The Nature and Properties of Soils, 13th ed.; Prentince Hall: Upper Saddle River, NJ, USA, 2008; pp. 662–710. [Google Scholar]
  11. Larwa, B. Heat transfer model to predict temperature distribution in the ground. Energies 2019, 12, 25. [Google Scholar] [CrossRef]
  12. Sliwa, T.; Sojczyńska, A.; Rosen, M.A.; Kowalski, T. Evaluation of temperature profiling quality in determining energy efficiencies of borehole heat exchangers. Geothermics 2019, 78, 129–137. [Google Scholar] [CrossRef]
  13. Trombe, F. Traité de Spéléologie; Bibliothèque Sicientifique: Paris, France, 1952. [Google Scholar]
  14. Badino, G. Fisica del Clima Sotterraneo, 7th ed.; Istituto Italiano di Speleologia: Bologna, Italy, 1995. [Google Scholar]
  15. Peters, W.H. Air density and temperature as a cause of breathing phenomenon. In Speleo Digest—1963; Haarr, A.P., McGrew, W.C., Eds.; Pittsburgh Grotto Press, National Speleological Society: Huntsville, AL, USA, 1965; pp. 103–104. [Google Scholar]
  16. Lismonde, B. Climatologie du Monde Souterrain. Vents des Ténèbres, 1st ed.; Comité Départemental de Spéléologie de Isère: Eybens, France, 2002; Volume 1. [Google Scholar]
  17. Faimon, J.; Troppová, D.; Baldík, V.; Novotný, R. Air circulation and its impact on microclimatic variables in the Císařská Cave (Moravian Karst, Czech Republic). Int. J. Climatol. 2012, 32, 599–623. [Google Scholar] [CrossRef]
  18. Cigna, A. An analytical study of air circulation in caves. Int. J. Speleol. 1968, 3, 41–54. [Google Scholar] [CrossRef]
  19. de Freitas, C.R.; Littlbjohn, R.N.; Clarkson, T.S.; Kristament, I.S. Cave climate: Assessment of airflow and ventilation. J. Climatol. 1982, 2, 383–397. [Google Scholar] [CrossRef]
  20. James, E.W.; Banner, J.L.; Hardt, B. A global model for cave ventilation and seasonal bias in speleothem paleoclimate records. Geochem. Geophys. Geosyst. 2015, 16, 1044–1051. [Google Scholar] [CrossRef]
  21. Christoforou, C.S.; Salmon, L.G.; Cass, G.R. Air exchange within the Buddhist cave temples at Yungang, China. Atmos. Environ. 1996, 30, 3995–4006. [Google Scholar] [CrossRef]
  22. Kowalczk, A.J.; Froelich, P.N. Cave air ventilation and CO2 outgassing by radon-222 modeling: How fast do caves breathe? Earth Planet. Sci. Lett. 2010, 289, 209–219. [Google Scholar] [CrossRef]
  23. Cropley, J.B. Influence of Surface Conditions on Temperatures in Large Cave Systems. Bull. Natl. Speleol. Soc. 1965, 27, 1–10. [Google Scholar] [CrossRef]
  24. Badino, G. Cave temperatures and global climatic change. Int. J. Speleol. 2004, 33, 103–113. [Google Scholar] [CrossRef]
  25. Badino, G. Underground Meteorology—“What’s the Weather Underground? ” Podzemna Meteorologija: “ Kaksno Je Vreme V Podzemlju?” . Acta Carsol. 2010, 39, 427–448. [Google Scholar] [CrossRef]
  26. Domínguez-Villar, D.; Lojen, S.; Krklec, K.; Baker, A.; Fairchild, I.J. Is global warming affecting cave temperatures? Experimental and model data from a paradigmatic case study. Clim. Dyn. 2015, 45, 569–581. [Google Scholar] [CrossRef]
  27. McCann, S.C. Atmospheric Influences on Cave Meteorology, Jinapsan Cave, Guam: A Drip Rate Analysis. Master’s Thesis, Mississippi State University, Starkville, MS, USA, 2013. [Google Scholar]
  28. Benavente, J.; Vadillo, I.; Liñán, C.; del Rosal, Y.; Carrasco, F. Influence of the ventilation of a karst show cave on the surrounding vadose CO2 reservoir (Nerja, South Spain). Environ. Earth Sci. 2015, 74, 7731–7740. [Google Scholar] [CrossRef]
  29. Faimon, J.; Lang, M. Variances in airflows during different ventilation modes in a dynamic U-shaped cave. Int. J. Speleol. 2013, 42, 115–122. [Google Scholar] [CrossRef]
  30. Hoyos, M.; Cañaveras, J.C.; Sánchez-Moral, S.; Sanz-Rubio, E.; Soler, V. Microclimatic characterization of a karstic cave: Human impact on microenvironmental parameters of a prehistoric rock art cave (Candamo Cave, northern Spain). Environ. Geol. 1998, 33, 231–242. [Google Scholar] [CrossRef]
  31. Sainz, C.; Rábago, D.; Celaya, S.; Fernández, E.; Quindós, J.; Quindós, L.; Fernández, A.; Fuente, I.; Arteche, J.L.; Quindós, L.S. Continuous monitoring of radon gas as a tool to understand air dynamics in the cave of Altamira (Cantabria, Spain). Sci. Total Environ. 2018, 624, 416–423. [Google Scholar] [CrossRef] [PubMed]
  32. Fernández-Cortés, A.; Calaforra, J.M.; Sánchez-Martos, F. Spatiotemporal analysis of air conditions as a tool for the environmental management of a show cave (Cueva del Agua, Spain). Atmos. Environ. 2006, 40, 7378–7394. [Google Scholar] [CrossRef]
  33. Pflitsch, A.; Piasecki, J. Detection of an airflow system in Niedzwiedzia (Bear) Cave, Kletno, Poland. J. Cave Karst Stud. 2003, 65, 160–173. [Google Scholar]
  34. Pflitsch, A.; Wiles, M.; Horrocks, R.; Piasecki, J.; Ringeis, J. Dynamic climatologic processes of barometric cave systems using the example of jewel cave and wind cave in South Dakota, USA. Acta Carsol. 2010, 39, 449–462. [Google Scholar] [CrossRef]
  35. Pedrera, A.; Luque-Espinar, J.A.; Martos-Rosillo, S.; Pardo-Igúzquiza, E.; Durán-Valsero, J.J.; Martínez-Moreno, F.; Guardiola-Albert, C. Structural controls on karstic conduits in a collisional orogen (Sierra de las Nieves, Betic Cordillera, S Spain). Geomorphology 2015, 238, 15–26. [Google Scholar] [CrossRef]
  36. Kašing, M.; Lenart, J. Cave airflow mechanism of a crevice-type cave: A case study from Czechia. Int. J. Speleol. 2020, 49, 55–67. [Google Scholar] [CrossRef]
  37. Margielewski, W.; Urban, J. Gravitationally induced non-karst caves: Tectonic and morphological constrains, classification, and dating; Polish Flysch Carpathians case study. Geomorphology 2017, 296, 160–181. [Google Scholar] [CrossRef]
  38. Lenart, J.; Kašing, M.; Tábořík, P.; Piotrowska, N.; Pawlyta, J. The cyrilka cave—The longest crevice-type cave in Czechia: Structural controls, genesis, and age. Int. J. Speleol. 2018, 47, 379–392. [Google Scholar] [CrossRef]
  39. Bertozzi, B.; Pulvirenti, B.; Colucci, R.R.; di Sabatino, S. On the interactions between airflow and ice melting in ice caves: A novel methodology based on computational fluid dynamics modeling. Sci. Total Environ. 2019, 669, 322–332. [Google Scholar] [CrossRef]
  40. Kukuljan, L.B.; Gabrovšek, F.; Covington, M.D. The relative importance of wind-driven and chimney effect cave ventilation: Observations in postojna cave (Slovenia). Int. J. Speleol. 2021, 50, 2392. [Google Scholar] [CrossRef]
  41. Gabrovšek, F. How do caves breathe: The airflow patterns in karst underground. PLoS ONE. 2023, 18, e0283767. [Google Scholar] [CrossRef]
  42. Ruiz Ortíz, P.A. Análisis de Facies del Mesozoico de las Unidades Intermedias (Entre Castril Provincia de Granada y Jaén). Ph.D. Thesis, Universidad de Granada, Granada, Spain, 1980. [Google Scholar]
  43. Gollonet, J.; González-Ramón, A.; Rubio-Campos, J.C. Nuevas aportaciones sobre el funcionamiento hidrogeológico del sistema kárstico de Sierra Mágina. In Karst and Environment; Carrasco, F., Durán, J.J., Andreo, B., Eds.; Fundación Cueva de Nerja: Nerja, Spain, 2002; p. 9. [Google Scholar]
  44. González-Ramón, A. Hidrogeología De Los Acuíferos Kársticos De Las Sierras De Pegalajar Y Mojón Blanco (Jaén). Ph.D. Thesis, Universidad de Granada, Granada, Spain, 2007. [Google Scholar]
  45. García-Rossell, L.; Pezzi, M. Un karst mediterráneo supraforestal en Sierra Mágina (Jaén). Condicionamientos geológicos y geomorfológicos. Cuad. Geogr. Univ. Granad. 1975, 1, 19–75. [Google Scholar]
  46. Waltham, T. The engineering classification of karst with respect to the role and influence of caves. Int. J. Speleol. 2002, 31, 19–35. [Google Scholar] [CrossRef]
  47. Pérez-Valera, F.; Sánchez-Gómez, M.; Pérez-López, A.; Pérez-Valera, L.A. An evaporite-bearing accretionary complex in the northern front of the Betic-Rif orogen. Tectonics 2017, 36, 1006–1036. [Google Scholar] [CrossRef]
  48. Galindo-Zaldívar, J.; Ruano, P.; Jabaloy, A.; López-Chicano, M. Kinematics of faults between Subbetic Units during the Miocene (central sector of the Betic Cordillera). Comptes Rendus De L’académie Des Sci. Ser. IIA-Earth Planet. Sci. 2000, 331, 811–816. [Google Scholar] [CrossRef]
  49. Galindo-Zaldivar, J.; Gil, A.J.; de Galdeano, C.S.; Lacy, M.C.; García-Armenteros, J.A.; Ruano, P.; Ruiz, A.M.; Martínez-Martos, M.; Alfaro, P. Active shallow extension in central and eastern Betic Cordillera from CGPS data. Tectonophysics 2015, 663, 290–301. [Google Scholar] [CrossRef]
  50. González-Ramón, A.; López-Chicano, M.; Rubio-Campos, J.C. Piezometric and hydrogeochemical characterization of groundwater circulation in complex karst aquifers. A case study: The Mancha Real-Pegalajar aquifer (Southern Spain). Environ. Earth. Sci. 2012, 67, 923–937. [Google Scholar] [CrossRef]
  51. Gómez, M.S.; Gil, D.; López, J.M.G.; Tovar, J.; García, J.L.P.; Fernández, T.; Jiménez, R. Cool-air falls from crevice caves. Bol. Soc. Esp. Espeleol. Cienc. Karst 2021, 16, 16–24. [Google Scholar]
  52. Lara-Fanego, V.; Ruiz-Arias, J.A.; Pozo-Vazquez, D.; Santos-Alamillos, F.J.; Tovar-Pescador, J. Evaluation of the WRF model solar irradiance forecasts in Andalusia (southern Spain). Sol. Energy 2012, 86, 2200–2217. [Google Scholar] [CrossRef]
  53. Perrier, F.; le Mouël, J.L. Stationary and transient thermal states of barometric pumping in the access pit of an underground quarry. Sci. Total Environ. 2016, 550, 1044–1056. Available online: http://www.sciencedirect.com/science/article/pii/S0048969716301255 (accessed on 30 January 2023). [CrossRef]
  54. Muladi, B.; Mucsi, L. Investigation of the spatial and temporal trends of the air temperature of the Hajnóczy cave in the Bükk mountains. Geogr. Pannonica 2014, 18, 51–61. [Google Scholar] [CrossRef]
  55. Bögli, A. Karst Hydrology and Physical Speleology; Springer: Berlin/Heidelberg, Germany, 1980. [Google Scholar] [CrossRef]
  56. Massen, F.; Dusar, M.; Loy, W.; Vandenberghe, N. Cave volume computed on the behaviour of a blowing well (Tournai basin, W. Belgium). Terra Nova 1998, 10, 131–135. [Google Scholar] [CrossRef]
  57. Batiot-Guilhe, C.; Seidel, J.L.; Jourde, H.; Hébrard, O.; Bailly-Comte, V. Seasonal variations of CO2 and 222Rn in a mediterranean sinkhole—Spring (Causse d’Aumelas, SE France). Int. J. Speleol. 2007, 36, 51–56. [Google Scholar] [CrossRef]
  58. Pérez-García, J.L.; Sánchez-Gómez, M.; Gómez-López, J.M.; Guerra, T.; Gil, D.; Fernández, T. Georeferenced thermal infrared mages from UAV surveys as a potential tool to detect and characterize shallow cave ducts. Eng. Geol. 2018, 246, 277–287. [Google Scholar] [CrossRef]
  59. Pardo-Igúzquiza, E.; Luque-Espinar, J.A.; Sanz de Galdeano, C.; Durán-Valsero, J.J. The importance of fault control on the geomorphological development of a deep karst system: The case of Sima GESM, a Z-supercave in southern Spain. Discov. Geosci. 2024, 2, 78. [Google Scholar] [CrossRef]
  60. Gázquez, F.; Quindós, L.; Rábago, D.; Fuente, I.; Celaya, S.; Sainz, C. The role of cave ventilation in the triple oxygen and hydrogen isotope composition of condensation waters in Altamira Cave, northern Spain. J. Hydrol. 2022, 606, 127416. [Google Scholar] [CrossRef]
  61. Bourges, F.; Genthon, P.; Genty, D.; Lorblanchet, M.; Mauduit, E.; D’Hulst, D. Conservation of prehistoric caves and stability of their inner climate: Lessons from Chauvet and other French caves. Sci. Total Environ. 2014, 493, 79–91. [Google Scholar] [CrossRef]
  62. Liñán, C.; del Rosal, Y.; Carrasco, F.; Vadillo, I.; Benavente, J.; Ojeda, L. Highlighting the importance of transitional ventilation regimes in the management of Mediterranean show caves (Nerja-Pintada system, southern Spain). Sci. Total Environ. 2018, 631–632, 1268–1278. [Google Scholar] [CrossRef]
  63. Ladle, R.J.; Firmino, J.V.L.; Malhado, A.C.M.; Rodríguez-Durán, A. Unexplored Diversity and Conservation Potential of Neotropical Hot Caves. Conserv. Biol. 2012, 26, 978–982. [Google Scholar] [CrossRef] [PubMed]
  64. Mammola, S.; Piano, E.; Giachino, P.M.; Isaia, M. Seasonal dynamics and micro-climatic preference of two alpine endemic hypogean beetles. Int. J. Speleol. 2015, 44, 239–249. [Google Scholar] [CrossRef]
  65. Jiménez-Valverde, A.; Sendra, A.; Garay, P.; Reboleira, A.S.P.S. Energy and speleogenesis: Key determinants of terrestrial species richness in caves. Ecol. Evol. 2017, 7, 10207–10215. [Google Scholar] [CrossRef]
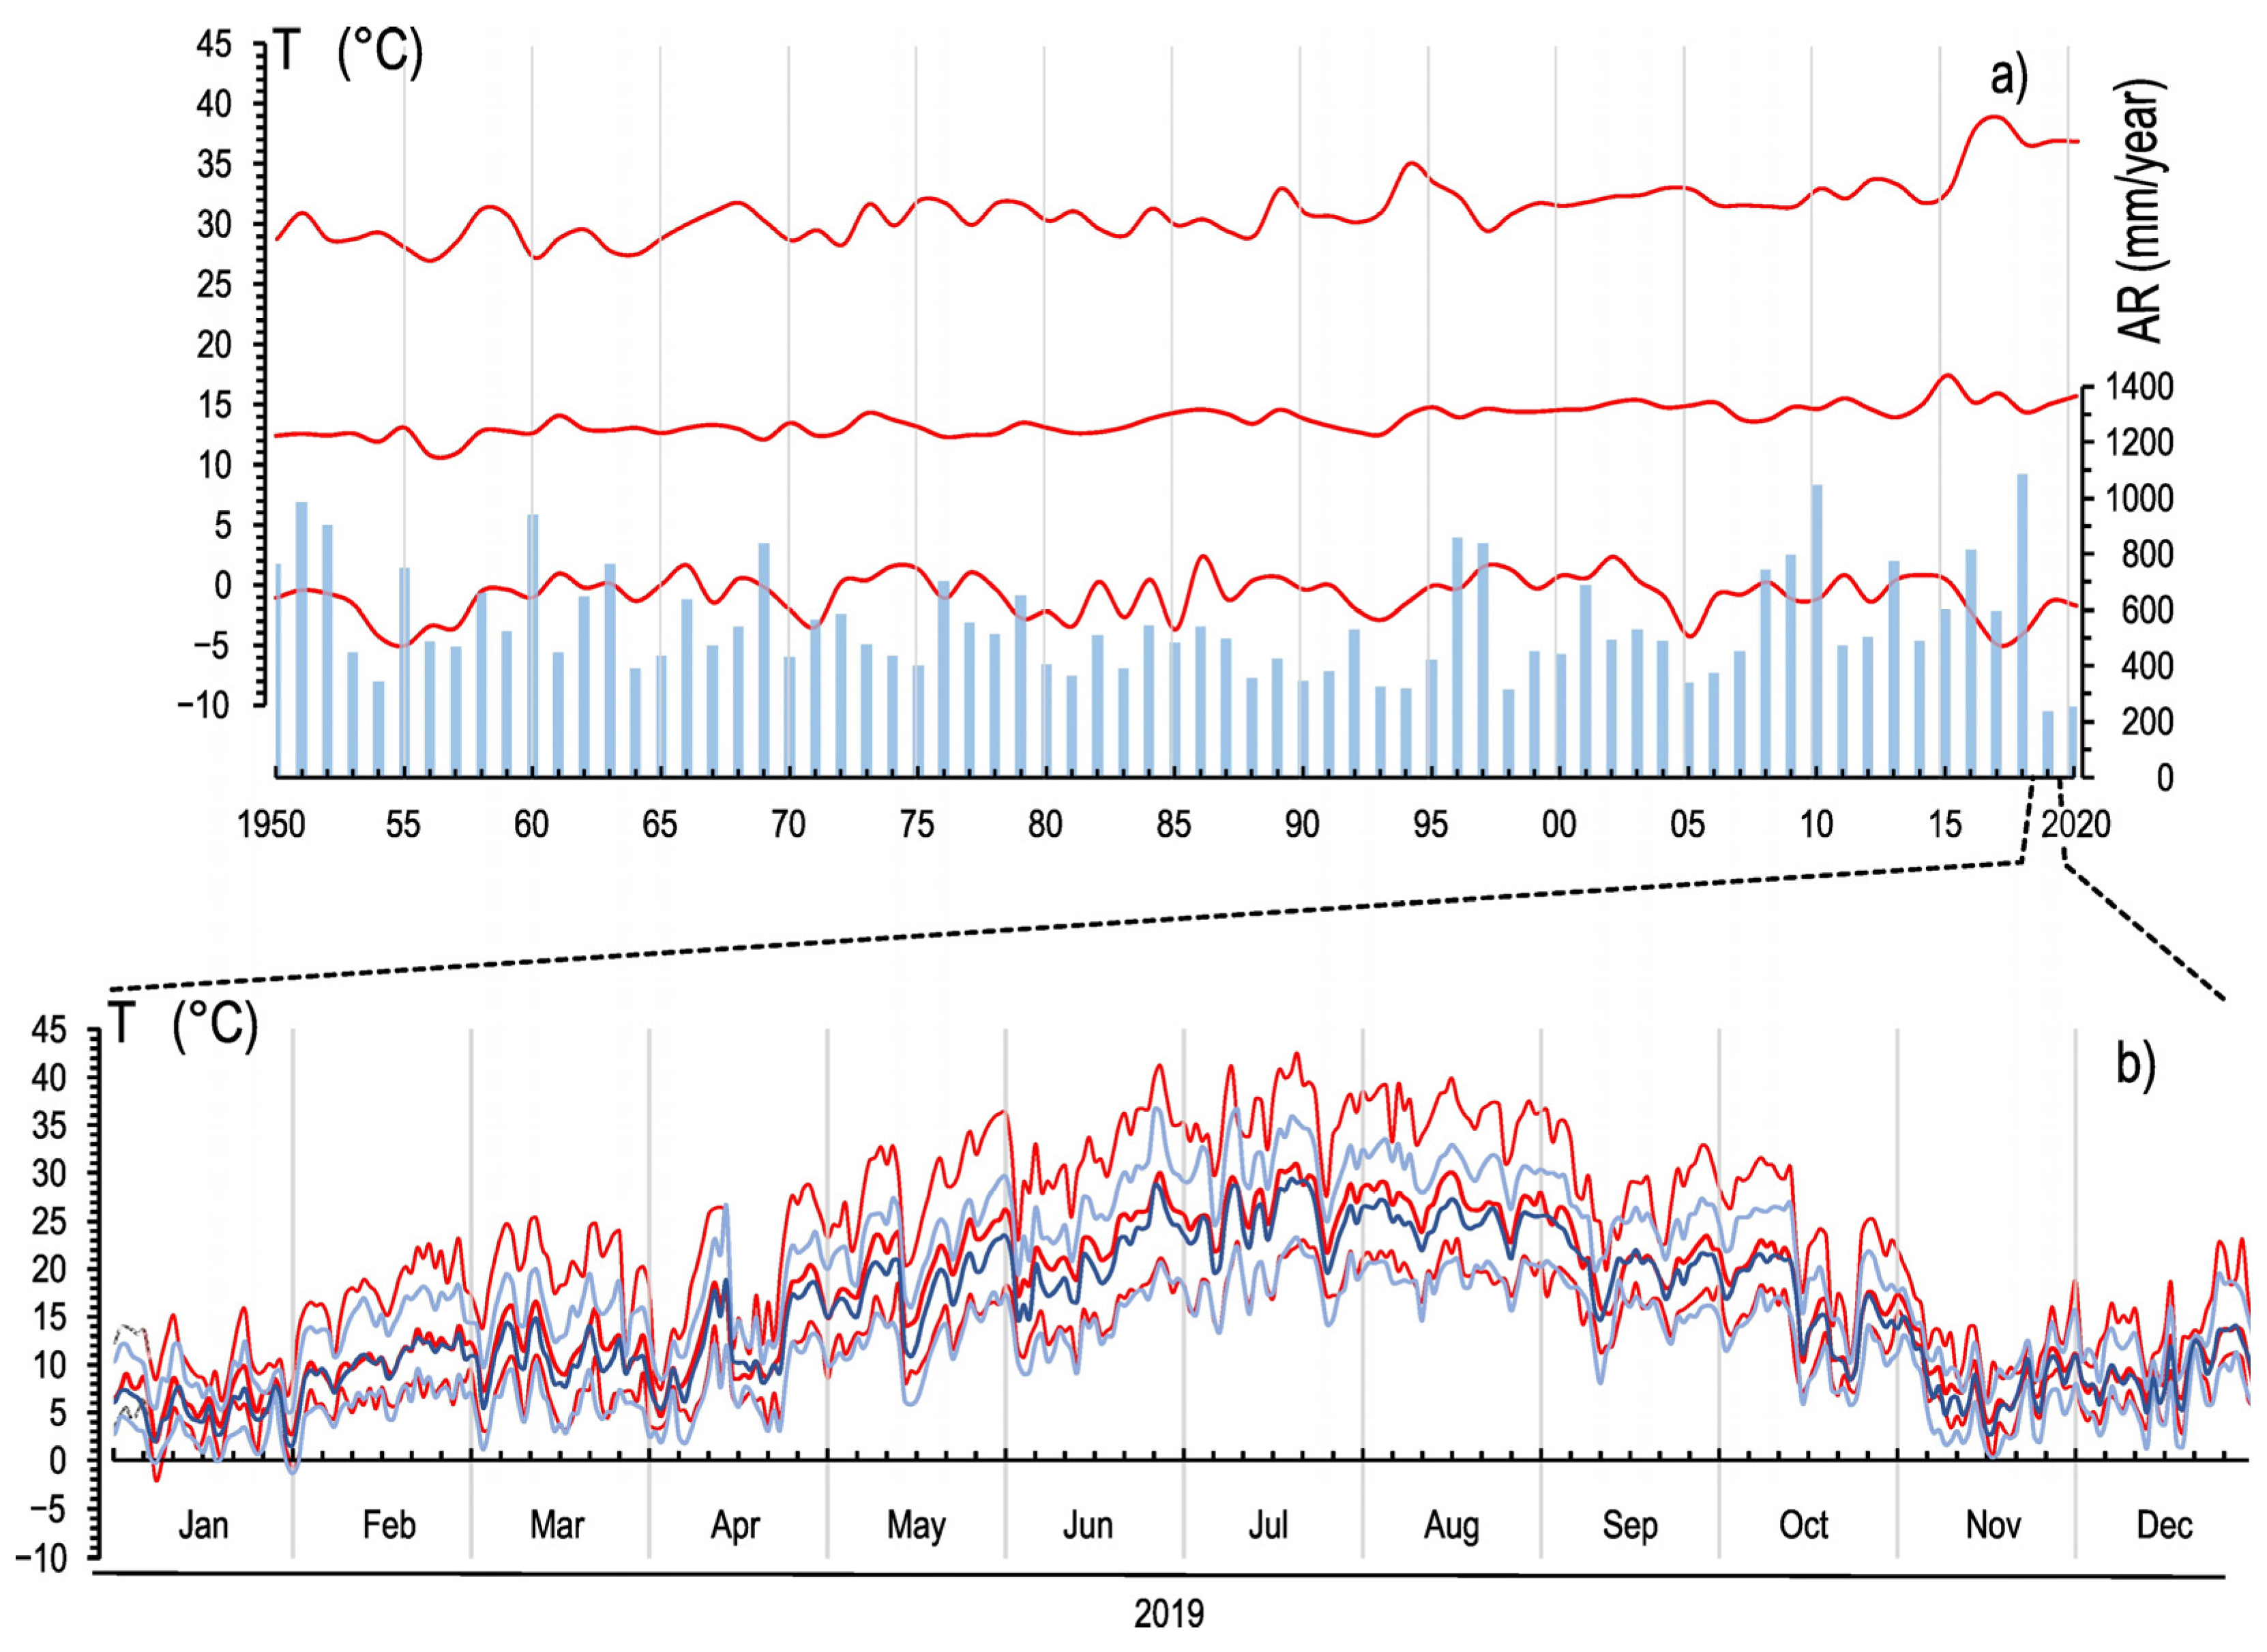
Figure 3. External temperatures and rain of the studied area. (a) Annual temperature average, with its annual maximum and minimum average temperatures of the last 70 years plotted together with total annual rain, from the MATRAS database (https://matras.ujaen.es; accessed on 30 January 2023). Note an effective annual thermal oscillation of around 30 °C. (b) An example showing one year of the adjustment between the synthetic temperature data used for the work (bluish tones) and those obtained directly (reddish tones) in the study area. Daily average, maximum, and minimum temperatures are obtained from 10 min series data in both kinds of values. Note the good adjustment in the winter months with less insolation. In the summer months, direct measurements show slightly higher values, probably due to poor insulation from direct radiation (see text for further explanation).
Geosciences 15 00280 g003
Figure 4. Relative frequency distribution of the temperatures in the studied entrances during the months of maximum airflow (January and July) in Serrezuela de Pegalajar. The ordinate axis indicates the frequency of the temperature registered (10–30 min interval); scale in red colour on the right corresponds to the exterior frequencies, while the left scale corresponds to frequencies of the data temperature in the interior of the caves. The distance from the entrance is indicated by different line colours: brown, 0 m; light blue, 2–6 m; violet, 8–10 m; black, +10 m; red, outside. Each temperature position holds approximately 17,000 records for the months selected in every sampled period with an interval of 10 min between data (see Supplementary Material S2).
Geosciences 15 00280 g004
Figure 5. Examples of relationships between the daily outside and inside temperatures for two representative openings during an annual cycle (2019–2020). (a) Winter-running entrance (PGL-7) and (b) summer-running entrance (PGL_3). The daily average (bold line) and the maximum and minimum temperatures (shaded area boundaries) are represented. The reddish and bluish colours indicate outside and inside temperatures, respectively. Enlargements represent different moments when outflow changes the thermal signal at the interior of the entrance: the lowercase (t) indicates the times at which the period is considered to begin, and the uppercase (T) indicates the temperatures at that time. The starting of the outflow (ta) is reflected by a constant temperature (Ta) for a few days; (tb) indicates the beginning of the continuous outflow; (ty) indicates the end of the continuous outflow; and (tz) represents the end of the net outflow with a shift to the new airflow regime mimicking the outside temperature at that position.
Geosciences 15 00280 g005
Figure 6. Correlation of daily temperature record in the studied openings located at various altitudes from 2018 to 2019. Tmax and Tmin are represented by the boundaries of the coloured areas, and Tmean is represented as a bold line in the middle of each area. The external temperature is the same in all openings, but is only represented as a reddish shaded area as an example in two entrances. The entrances have been grouped into two types of operating regimes: winter running (PGL_7, PGL_8), with a relatively warm outflow during the winter season, and summer running (PGL_1 to PGL6), with a relatively cool air outflow during the summer season. Intense yellow stripes represent the continuous outflow period, and the light-yellow ones the transition periods.
Geosciences 15 00280 g006
Figure 7. Comparison of the inner and outside daily temperatures of representative inlets throughout the period under study. The external temperature is represented as a reddish area (between Tmax and Tmin) with Tmean as a bold line. Inlet temperatures are represented in the same way in bluish colours. (a) Typical winter-running inlet. (b) Typical summer-running inlet. (c) Comparison among all monitored entries and exterior temperatures (in pink colour).
Geosciences 15 00280 g007
Figure 8. Conceptual sketch of the air circulation system in the Serrezuela karst in a winter-running opening. Red colours indicate outside daily oscillation temperatures, with the average represented by the bold line and the maximum and minimum by the light lines. Blue colours indicate temperature of the entrance.
Geosciences 15 00280 g008
Table 1. Main geometric and microclimatic parameters of the studied entrances. The temperature means and modes shown in the table are from April 2017 to April 2022, and although not all openings date from all the period (see Supplementary Material S3), the sampling average is more than 3 full years. The area of the openings is expressed by the two axes of an equivalent ellipse. The climax mode is the mode temperature registered in the months with more extreme exterior temperature (July or January). The shutdown mode is the temperature mode registered in the month when outflow is stopped in each opening (September or March). For the remaining parameters, see the text for explanations. Capital T indicates temperature, and lowercase t time.
Water
Table
PGL-1PGL-2PGL-3PGL-4PGL-5PGL-6PGL-7PGL-8
Height (m)650812828829844857867893906
Explored depth (m) −9.5−34−5−7−12.2−38−2.43.5
Explored length (m) 21.56310.313.212.2953.711
Average width (m) 0.53.91.241.42.11.45.5
Opening axes (m·10−1) * 7 × 615 × 930 × 410 × 97 × 573 × 155 × 316 × 7
Outflow max. vel. (m/s) 2.44.30.911.4--14
month Aug.Jul.Sep.Jul.Jun. Dec.Mar.
Inflow max vel. (m/s) 22.30.40.51.6--0.51.1
month Dec.Dec.Mar.Dec.Dec. Jun.Jun.
Sensor depth (m) 3 r6 a2 a2.5 a2 a13 a2 r0.5 a
T (°C) climax mode 15.911.115.314.715.613.516.816.5
T (°C) shutdown mode 16.811.415.315.617.714.11514.7
T (°C) characteristic (Ty)17.416.811.415.216.116.914.014.814.6
∆T (°C) Ty-Tb --0.41.83.60.50.9−4.1−1.5
tanα (|∆T|/month **) --0.10.40.80.10.20.90.4
σT at tb time --0.40.611.30.11.61.3
σT characteristic (at ty) 00.10.200.100.40
* The openings can be assumed as an ellipse or rectangle with two axes. ** To determine the warming or cooling rate, a lunar month of 28 days or 4 weeks was considered.
Disclaimer/Publisher’s Note: The statements, opinions and data contained in all publications are solely those of the individual author(s) and contributor(s) and not of MDPI and/or the editor(s). MDPI and/or the editor(s) disclaim responsibility for any injury to people or property resulting from any ideas, methods, instructions or products referred to in the content.