Article

Coccolithophore Assemblage Dynamics and Emiliania huxleyi Morphological Patterns During Three Sampling Campaigns Between 2017 and 2019 in the South Aegean Sea (Greece, NE Mediterranean)

by
Patrick James F. Penales
1,2,
Elisavet Skampa
1,
Margarita D. Dimiza
1,
Constantine Parinos
3,
Dimitris Velaoras
3,
Alexandra Pavlidou
3,
Elisa Malinverno
4,
Alexandra Gogou
3 and
Maria V. Triantaphyllou
1,*
1
Faculty of Geology and Geoenvironment, National and Kapodistrian University of Athens, Panepistimioupolis, 15784 Athens, Greece
2
Department of Earth Sciences, University of Lille 1, Cité Scientifique, CEDEX, 59655 Villeneuve d’Ascq, France
3
Institute of Oceanography, Hellenic Centre for Marine Research, P.O. Box 712, 19013 Anavyssos, Greece
4
Department of Earth and Environmental Sciences, University of Milano-Bicocca, 20126 Milano, Italy
*
Author to whom correspondence should be addressed.
Geosciences 2025, 15(7), 268; https://doi.org/10.3390/geosciences15070268
Submission received: 19 March 2025 / Revised: 28 June 2025 / Accepted: 2 July 2025 / Published: 11 July 2025
(This article belongs to the Section Biogeosciences)

Abstract

This study presents the living coccolithophore communities and the morphological variability of Emiliania huxleyi in the South Aegean Sea from three sampling regions during winter-early spring (March 2017, March 2019) and summer (August 2019). Emphasis is given to March 2017 to monitor the variations in coccolithophore assemblages after an exceptionally cold event in December 2016, which resulted in newly produced dense waters that ventilated the Aegean deep basins. The assemblages displayed distinct seasonality with the predominance of E. huxleyi and Syracosphaera molischii during winter-early spring, associated with the water column mixing. By contrast, summer assemblages were featured by holococcolithophores and typical taxa of warm, oligotrophic upper waters. It seems that the phytoplanktonic succession as well as the nutrient supply to the upper euphotic layers were affected by the water column perturbation during the extreme winter of 2016–2017, which led to strong convective mixing and dense water formation. The decreased coccosphere densities during March 2017, accompanied by the notable presence of diatoms, were most probably associated with a prolonged diatom bloom, causing delay in the development of the coccolithophore community and resulting in a nitrogen-limited setting. Emiliania huxleyi morphometry showed the characteristic seasonal calcification trend of the Aegean, with the dominance of smaller coccoliths in the summer and increased coccolith length and width during the cold season. The intense cold conditions and wind-induced mixing during the winter of 2016–2017 possibly increased the absorption of atmospheric CO2 in surface waters, causing increased acidity and the subsequent presence of etched/undercalcified E. huxleyi coccoliths and other taxa, most probably implying in situ calcite dissolution.

1. Introduction

As one of the most abundant and productive groups of phytoplankton in modern oceans, coccolithophores play a significant role in the biogeochemical cycles of marine ecosystems, being an integral part of the carbonate pump [1,2,3]. In the oligotrophic eastern Mediterranean Sea, coccolithophores are among the predominant calcifying primary producers that showcase sensitivity to seasonal changes and exhibit notable regional patchiness [4,5,6,7,8,9]. Coccolithophore species composition, diversity, and productivity in this area is affected by several factors, including seasonal variations in sea surface temperature (SST), nutrient content, and sea surface circulation [4,7,10,11]. Studying their distribution in a variety of oceanographic settings is the key to understanding their spatial/temporal distribution along with their species diversity and ecological tolerances [5]. Therefore, research on the dynamic response of these organisms could prove quite useful given the future trends of rising ocean temperatures, atmospheric CO2 levels, and ocean acidification.
Previous studies in the Aegean Sea (NE Mediterranean) have shown that coccolithophores, although comprising a small part of the Aegean total phytoplankton assemblage [12], display a clear seasonality pattern, with species composition being dominated by Emiliania huxleyi, Syracosphaera spp., Rhabdosphaeraceae, and holococcolithophores [4,5,9]. Maximum coccolithophore densities are observed during the cold period, mainly depicted by increased abundance of E. huxleyi, and are directly linked to late winter-early spring water column mixing; in contrast, increased holococcolithophore densities, and also Syracosphaera spp. and Rhabdosphaeraceae, during the warm period (summer-autumn), particularly in the South Aegean Sea, are associated with thermally stratified surface layers [5]. Ecological factors like temperature, salinity, and availability of nutrients have been linked to changes in Emiliania huxleyi coccolith size and morphology [13,14,15,16]. Coccolith morphometric analysis in the Aegean Sea [9,10,17] showed that low SST-moderate productivity conditions during the winter/spring are consistent with the trend of increased E. huxleyi (type A) coccolith and coccosphere size as well as inner tube element thickness, in contrast with the high SST-low productivity summer period.
The Aegean Sea, a crucial Dense Water Formation (DWF) area in the eastern Mediterranean, can experience significant DWF events during exceptionally cold winters [18,19,20]. According to Velaoras et al. [21], such an event occurred during the intense winter of 2016–2017. A distinct atmospheric circulation pattern in December 2016, characterized by a high-pressure system over northwest Europe, brought cold air masses from higher latitudes into the Aegean Sea, causing extreme surface cooling over the eastern Mediterranean, with newly produced dense waters ventilating the Aegean deep basins up to a certain depth [21]. Specifically, in the southwest Aegean Sea, dense waters filled the bottom layers of the Myrtoan Basin toward the West Cretan Straits. The unusually high heat loss in December (Qnet < 500 Wm−2) was comparable to that seen during the 1992–1993 Eastern Mediterranean Transient (EMT) event [21]. Such events are associated with water column mixing and relatively low sea surface temperature values, resulting in the vertical flux of nutrients to the euphotic zone [11,22] and increased coccolithophore productivity, namely “E. huxleyi dominance” [17], a species directly linked to nutrient enrichment [4,5,23].
The release of carbon dioxide (CO2) from human industrial and agricultural activities has resulted in dramatically increased atmospheric CO2 concentrations during the last 200 yrs. CO2 is absorbed by seawater, causing reduced pH and carbonate ion concentration, thus resulting in ocean acidification. Multiple studies have demonstrated the sensitivity of calcification in response to acidification for a variety of organism groups, which affects global oceanic carbonate production [24,25]. Natural increases in CO2 seawater concentrations, like extreme cold events and DWF [26], may provide excellent opportunities to assess the potential effects of acidification on calcifying oceanic groups such as coccolithophores.
The present study focuses on the investigation of living coccolithophore species composition and abundance in the South Aegean Sea during the cold winter-early spring (March 2017, March 2019) and warm late summer (August 2019) seasons. The main aim is to test the hypothesis that coccolithophore spatial and temporal variations were affected by the exceptionally cold event in December 2016 and define the morphological features of E. huxleyi in order to evaluate any impacts of potential acidification effects on coccolith calcification.

2. Oceanographic Setting

The Aegean Sea (NE Mediterranean) lies between Turkey and Greece, connected to the Black Sea and the Marmara Sea via the Dardanelles Strait and to the open eastern Mediterranean through the Cretan Straits. The intricate circulation patterns within the Aegean Sea result from several contributing factors, including the geographical distribution of island chains, the uneven seabed topography, the influx of cooler and less saline Black Sea Waters (BSW), numerous rivers originating from the northern Hellenic coast and the western Turkish coast (Figure 1), and seasonal variations in meteorological conditions [18,20,27].
The Aegean Sea is connected to the Levantine Basin and the Ionian Sea through the eastern (Kassos) and western (Antikythira-Kithira) Cretan Straits, respectively (Figure 1). Warm and saline Levantine Waters carried by Asia Minor Current (AMC) branches enter the Aegean at the surface and at intermediate depths through the eastern Cretan Straits and travel north along the eastern Aegean Sea [28], reaching the Black Sea outflow near Limnos, where they submerge beneath the lighter BSW layer, formed by waters exiting the Dardanelles [29]. Both the Myrtoan Sea and the eastern Cretan Sea feature strong cyclonic circulation that contributes to the transport of the upper water layers into the southeast Aegean [20,28]. The northeastern part of South Aegean Sea is characterized by the northward flow of the LIW, enabling thermohaline circulation from the Levantine Basin toward the NE Mediterranean [18,28]. The surface water circulation is also influenced by the presence of low-salinity Modified Atlantic Waters (MAW), which primarily enter the Cretan Sea through the Antikythira Strait and occasionally through the Kassos Strait [28] (Figure 1). Τhe Levantine Intermediate Water mass (LIW) and dense Cretan Deep Water (CDW) occur in the intermediate and deep layers of the Cretan Sea and outflow from the South Aegean Sea through the Kassos and Antikythira Straits, sinking in the deeper layers and affecting the deep thermohaline circulation of the eastern Mediterranean [28]. Dimiza et al. [5] and Karatsolis et al. [10] verified the presence of the LIW by coccolithophore species such as Umbellosphaera tenuis and Syracosphaera pulchra, and also K-selected holococcolithophores, which have preferences for warm temperate low-nutrient waters. In addition, Emiliania huxleyi is evidently reduced toward the mid photic zone, marking the presence of fewer nutrients and more saline LIW masses [5].
Between the LIW and CDW masses, an intrusive water mass of eastern Mediterranean origin called Transient Mediterranean Water (TMW) is observed, showing a local salinity and oxygen minimum [30]. This nutrient-rich water mass [31] is linked to episodes of productivity increase in the Cretan Sea [32,33,34]. Indeed, Triantaphyllou et al. [8] pointed out that the coccolithophore productivity pattern in the Cretan Sea, with highest values in late March-late June, is the result of fertilization in the upper photic zone due to the intrusion of the TMW from the Kassos Strait.
The South Aegean Basin is regarded as a “typical oceanic margin” environment, ranging from oligotrophic to ultra-oligotrophic conditions, characterized by very low export rates of organic matter from the euphotic zone, minimum particle mass flux, and low primary productivity mainly influenced by Saharan dust inputs [8,27,32,35]. The oligotrophy, seen in both primary productivity and chlorophyll-a concentrations, is attributed to an eastward increase in phosphorus limitation through the eastern Mediterranean, leading to an increase in the N/P ratio. The annual mean chlorophyll-a concentrations peak in February (slightly more than 0.2 µg L−1) due to the dominance of picophytoplankton cells [32,36].
On average, annual SSTs in the Aegean Sea range from approximately 15 to 27 °C, while the average annual sea surface salinity (SSS) varies seasonally between approximately 38 and 39.2 psu [20]. Several factors, like the distribution of colder and low-salinity BSW, the advection of warmer LΙW from the southeastern Aegean, upwelling and downwelling processes, and locally significant freshwater river inflows, contribute to distinct spatial and seasonal patterns of SST and SSS.

3. Materials and Methods

This study examined 24 seawater samples collected from 3 stations (Figure 1) during three oceanographic cruises conducted by the Hellenic Centre for Marine Research (HCMR) in March 2017 (“Winter 2017 deep Aegean Sea basins” cruise), March 2019 (“2MFSD” cruise), and August 2019 (“3MFSD” cruise) on board the R/V “Aegaeo.” The three sampling areas, i.e., the Myrtoan Basin in the western South Aegean Sea, the Cretan Sea-Kassos Straits in the southeast, and the northeastern part of the South Aegean Sea, were selected to represent the major South Aegean Sea hydrographic regimes (see Section 2). The exact same positions were not precisely re-sampled during the sampling campaigns as the oceanographic cruises served different scope and sampling strategies (i.e., regular sampling within the framework of EU Marine Strategy Framework Directive (MFSD) vs. targeting the deep Aegean Sea basins after the extreme cold event of December 2016); however, for the shake of clarity in the present study, effective coding has been applied for proximal sampling stations (Figure 1; Table 1), depicting similar oceanographic settings. The seasonality pattern is adequately represented through the present study samplings, as coccolithophores of the Aegean Sea are practically divided into winter-spring assemblages related to high nutrients and abundant E. huxleyi and summer-autumn assemblages with warm, oligotrophic species and dominance of holococcolithophores [5,8]. The water column was sampled using a SBE911 CTD unit equipped with a 24-bottle SBE32 carousel water sampler. At each sampling station, samples were taken from 2–4 standard depths within the photic layer (2–75 m). Temperature, salinity, and nutrient concentrations (nitrite + nitrate [NO3 + NO2], silicate [SIO4], phosphate [PO4]) were measured at all stations and depths (Table 1). Nutrients were measured at the HCMR Lab using a QuAAtro39 AutoAnalyzer with sensitivities of 0.01 μmoL−1 for phosphates and 0.03 μmol L−1 for nitrate + nitrite and silicates. In order to facilitate comparisons of the results, the vertical distributions of coccolithophore assemblages are grouped into two photic zone depth layers: the upper (2–20 m water depth; surface mixed layer) and the middle-lower (50–75 m water depth; layer with the deep chlorophyll-a maximum, DCM) photic zones. This definition follows previous studies in the Aegean Sea. Psarra et al. [32] defined the euphotic zone down to 80 m in the Cretan Sea, which is featured by pronounced DCM (at 75–100 m depth) throughout most of the year [32,34]. In addition, Dimiza et al. [5] grouped the coccolithophore vertical distribution into three depth layers (surface mixed layer down to 20 m; >20 to 50 m water mass just below the surface mixed layer, and >50 m layer with the deep chlorophyll-a maximum) in the photic zone.
For coccolithophore analysis, ~1.5 L of seawater per sample was filtered through a Whatman cellulose nitrate filter (47 mm diameter, 0.45 μm pore size) using a Whatman membrane filter holder and vacuum filtration system. Special care was given to ensure uniform distribution of the filtered material. Salt was removed by washing the filter with 2 mL of mineral water. The filters were open/oven-dried and carefully stored in plastic Petri dishes. A small part of each filter (~6 × 3 mm2) was affixed to a sputter-copper electron microscope stub with the help of double-sided adhesive tape and was coated with gold. The filters were examined using a Jeol JSM 6360 Scanning Electron Microscope (National and Kapodistrian University of Athens, Faculty of Geology and Geoenvironment). All of the individual coccospheres present in the designated filter area were identified and counted under 1200× working magnification, and at least 200 coccospheres per sample were counted.
Following Jordan & Winter [37], the absolute abundance of coccolithophores (number of coccospheres L−1) was estimated by scaling up the raw counts from a known scanned filter piece using the equation: A = N × S/V, where N represents the number of coccospheres of a certain species on the scanned filter area, S denotes the scaling factor (area of the entire filter/area of the scanned filter piece), V represents the volume of seawater filtered (l), and A indicates the absolute abundance of the species, expressed as coccospheres L−1. According to Jordan & Winter [37], this method is limited only by very small factors to provide noticeable error bars, namely, the area of the scanned filter piece measured to the nearest 0.5 mm and the tiny area of the filter between transects under SEM that is not counted to avoid duplicating coccosphere counts. The species identification and taxonomy were mainly based on taxonomic resources provided by Young et al. [38], and the online guide to the biodiversity and taxonomy of coccolithophores (www.mikrotax.org/Nannotax3 (accessed on 1 January 2025); Young et al. [39]). Diversity indices like species richness (S), Shannon–Wiener diversity index (H′), and Dominance (D) were calculated for each sample using Past software version 4.15 [40].
Statistical analyses were performed using PAST software version 4.15 and SPSS version 29.0.2.0. The non-parametric Mann–Whitney U test was used to determine differences in total coccolithophore densities between the two winter seasons (2017 and 2019) and between different water layers (upper and mid-lower). Differences were considered significant at p < 0.05. Spearman’s rank correlation was used to explore the relationship between coccolithophore species and environmental parameters. In addition, in order to group together samples and species with similar distributions, a hierarchical cluster analysis (HCA) was performed. Further, a Canonical Correspondence Analysis (CCA) was performed to investigate the influence of environmental variables on the abundance and distribution of coccolithophore species. Analysis was conducted on 23 taxa, each comprising more than 3% of the assemblage in at least one examined sample. To minimize the score and bias of more abundant species that could obscure the effect of less abundant species, the data were log (1 + x) transformed. Environmental variables, including temperature (T), salinity (S), NO3 + NO2, PO4, and SiO4, were also logarithmically transformed. In the CCA diagram, environmental variables are represented as arrow lines, where the direction and length of each arrow indicate the relative influence of the corresponding variable. The angle between an arrow and canonical axis reflects the strength of the correlation between them, with smaller angles indicating stronger correlations. The projection of coccolithophore species and sample points on the canonical axes indicates their relationships with environmental parameters.
For the morphometric analysis of E. huxleyi, coccolith length and width were measured for ~50 coccoliths attached to a coccosphere per seawater sample from the Aegean Sea. In total, 862 coccoliths/coccospheres from the South Aegean Sea water samples were analyzed in this study. Following the morphometric approaches of Young et al. [41], these photos were analyzed using ImageJ software. For each coccolith, an ellipse was dragged on its perimeter, creating an outline to measure its length and width; such an approach takes into account the fact that the coccolith geometry is primarily based on co-axial, parallel ellipses [42]. The differences in E. huxleyi morphometric parameters among the three samplings (winter 2017 and 2019 and summer 2019) were determined via one-way analysis of variance (ANOVA), with post hoc Tukey’s HSD multiple pairwise comparisons test at a significance level of 0.05.
Surface chlorophyll-a (Chl-a) concentrations for the sampling intervals were obtained for an average of 8 days, at 4 km resolution, from data acquired from MODIS-Aqua (http://disc.sci.gsfc.nasa.gov/giovanni/ accessed on 5 June 2025; [43]).

4. Results

4.1. Total Abundance and Diversity Indices

A total of 57 coccolithophore species were identified in the studied samples (Figure 2a–c; Table S1). The recorded coccosphere densities from all sampling periods in the studied stations are presented in Table S2.
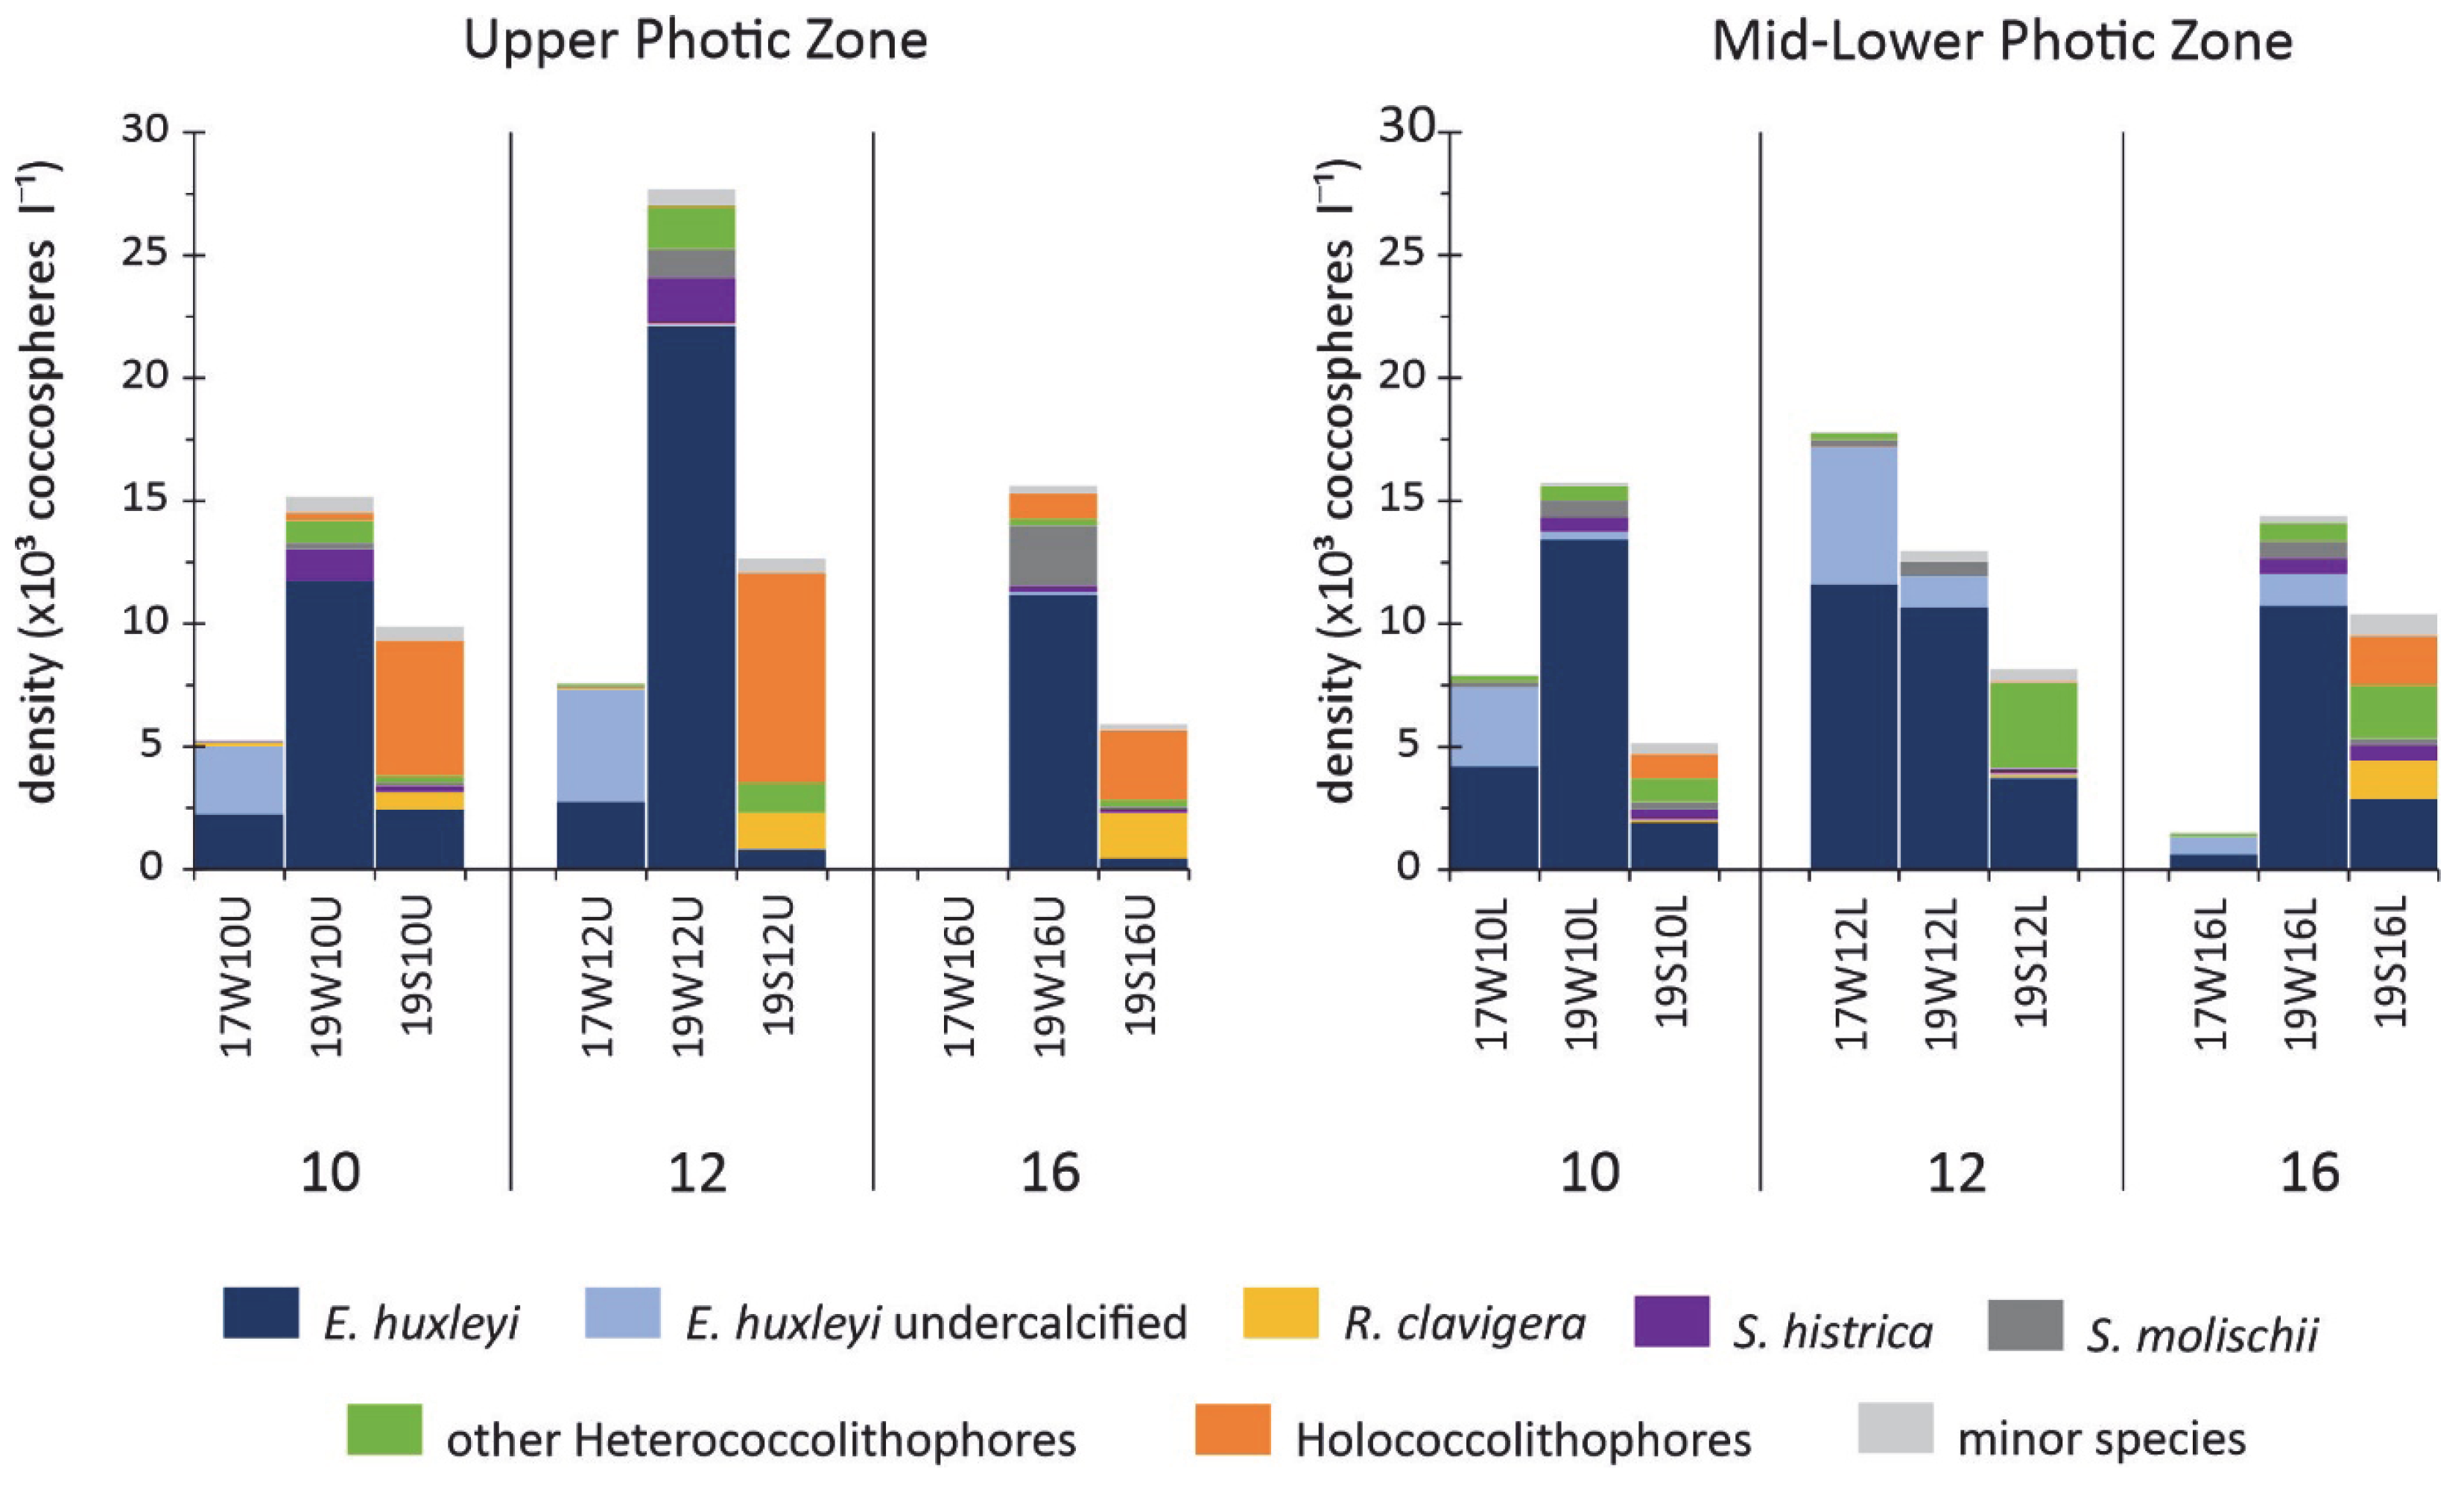
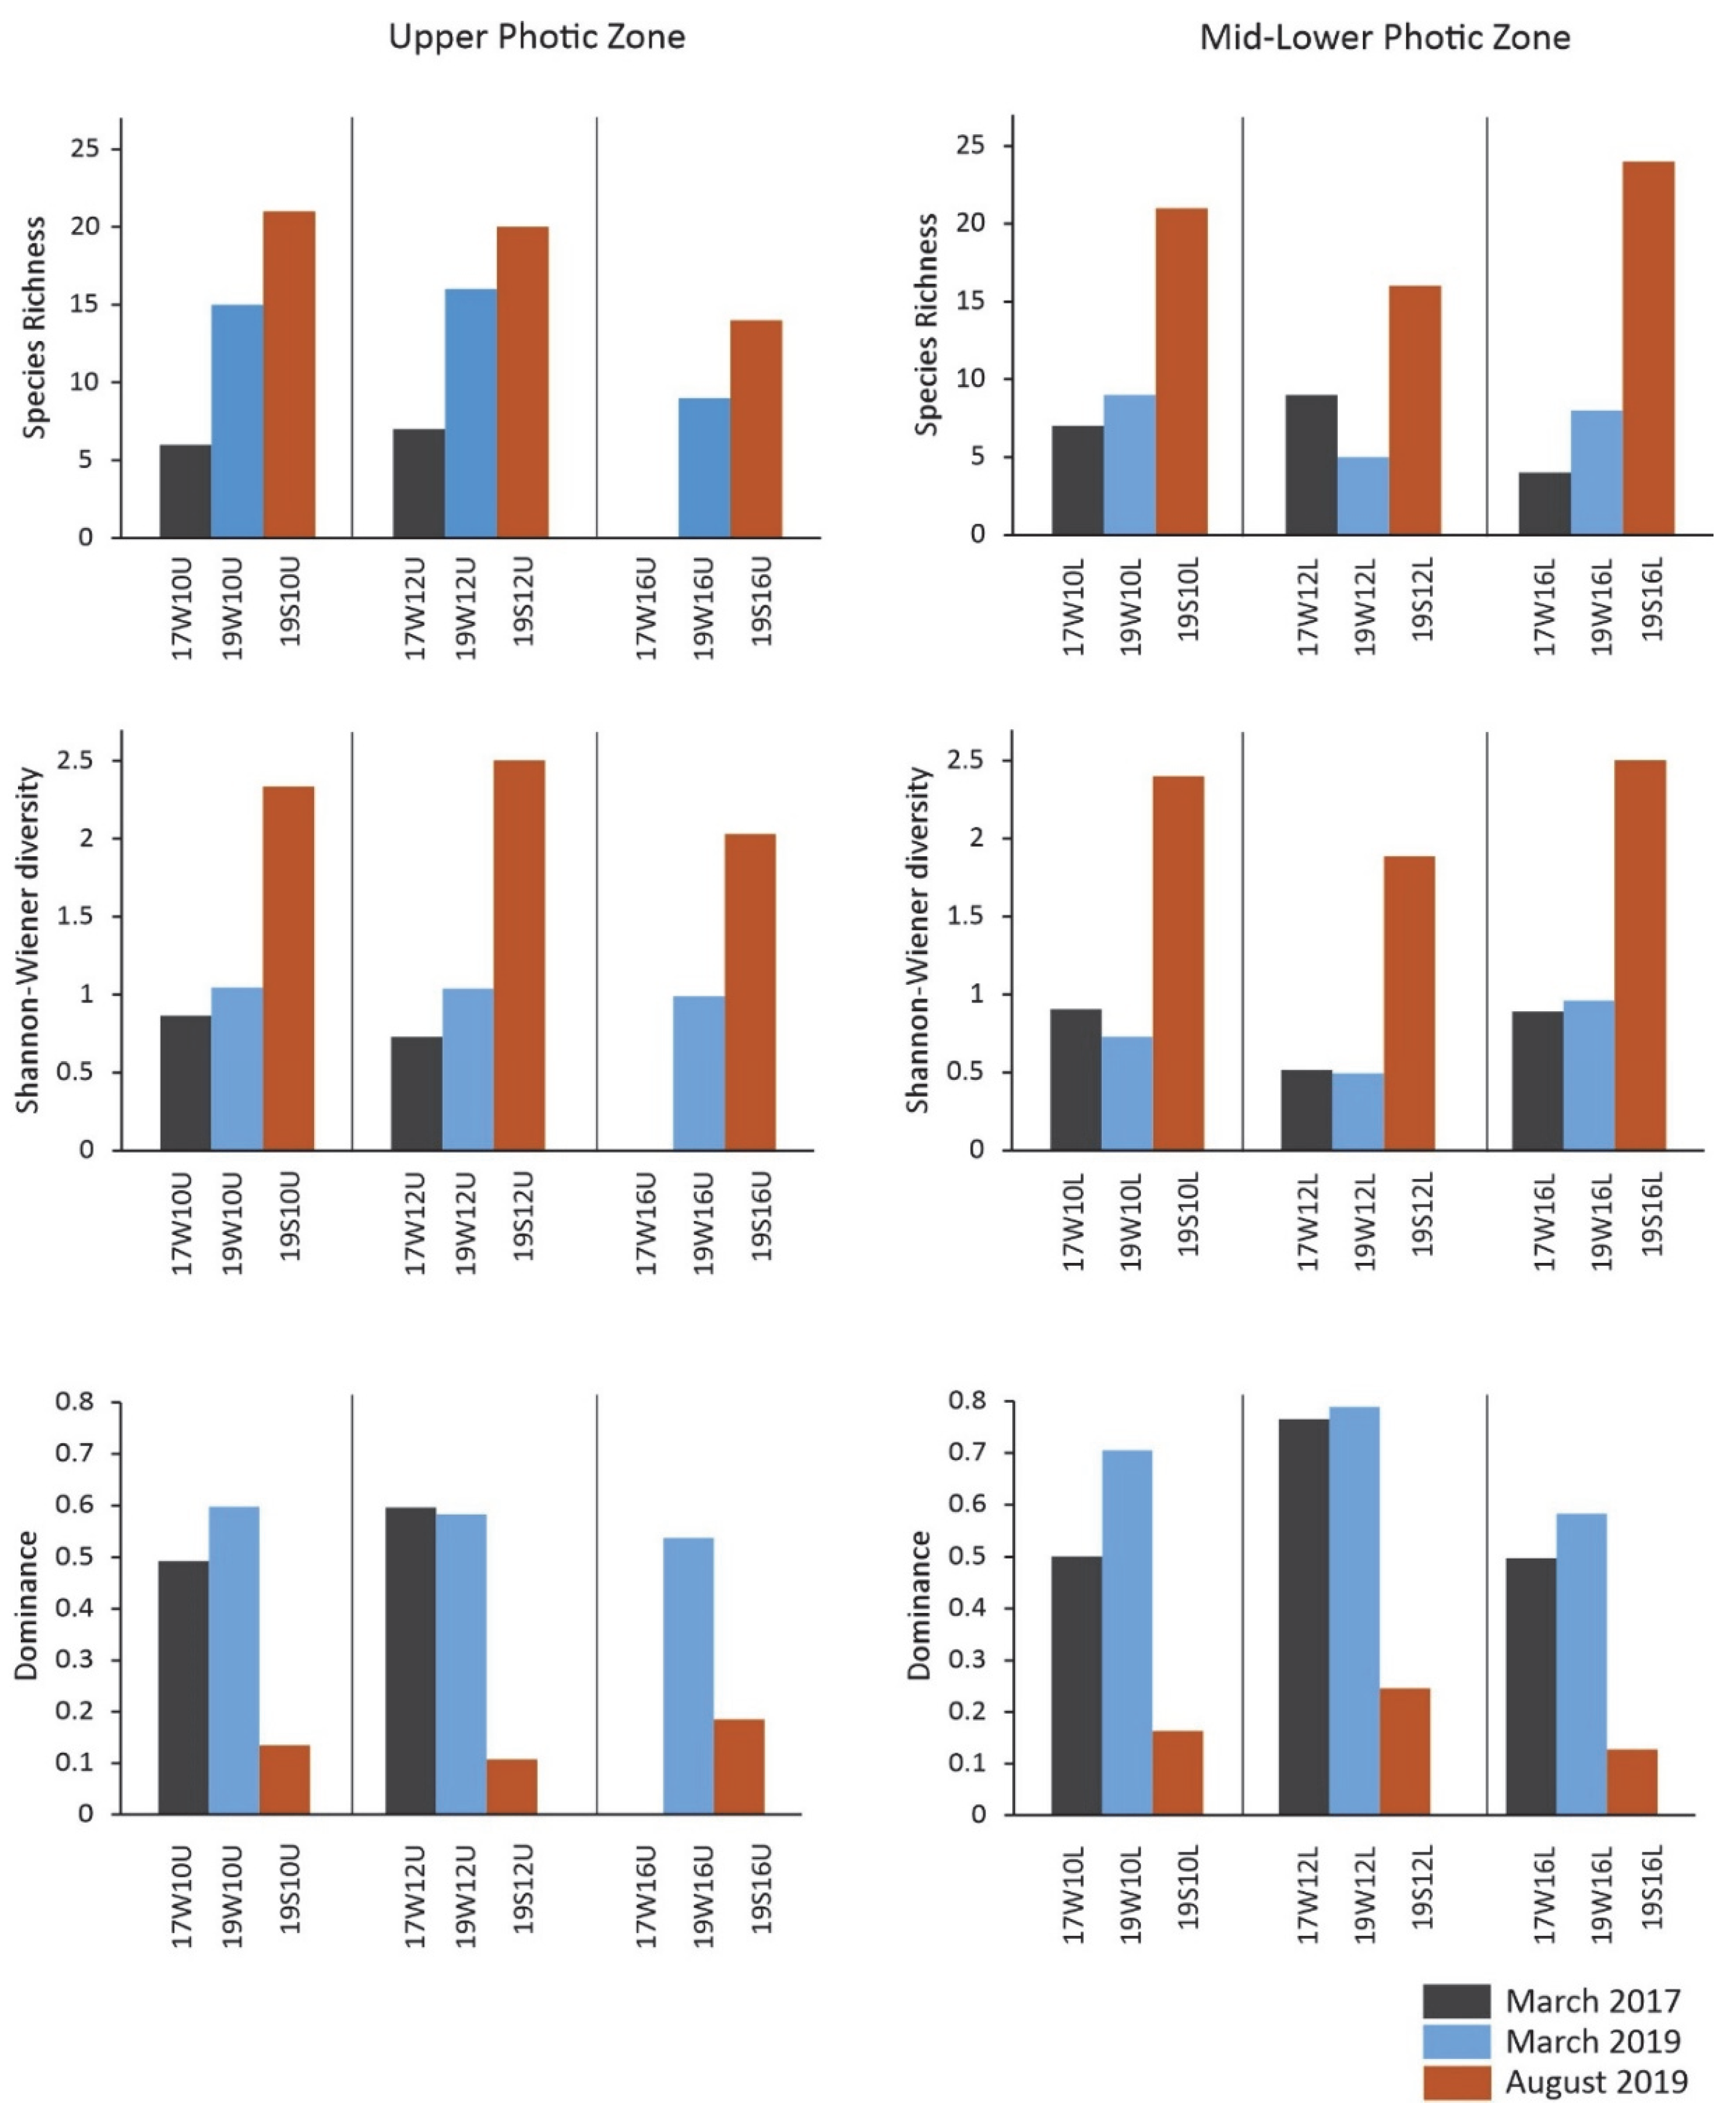
Notably low coccosphere densities were documented in the sampling of March 2017 (average total coccosphere density 6.7 × 10³ coccospheres L−1), with the highest coccolithophore abundance presented in 17W12L mid-lower water depths (17.8 × 10³ coccospheres L−1; Figure 3), with the rest of the studied stations displaying abundances less than 7.9 × 10³ coccospheres L−1. Remarkably low densities (1.5 × 10³ coccospheres L−1; Figure 3) in the mid-lower photic zone to even a striking total absence of coccospheres in the upper water column were recorded at station 17W16 (Figure 3). All samples in the March 2017 sampling were characterized by low values of S (min = 4 taxa; 17W16L) and H′ (min = 0.51; 17W12L) and rather high values of dominance (D) (max = 0.77; 17W12L) (Figure 4).
There were significant differences in coccolithophore abundances (Mann–Whitney U test, p = 0.007) between the two winter seasons, with much lower total coccosphere densities in March 2017 than those in March 2019 (Table S3). In March 2019, sampling station 19W12U presented the highest coccolithophore abundance (27.7 × 10³ coccospheres L−1) recorded in upper water depths. All studied stations displayed relatively higher abundances (>13 × 103 coccospheres L−1) in the upper water layers (average 19.5 × 10³ coccospheres L−1; Figure 3) than in the mid-lower layers (average 14.4 × 10³ coccospheres L−1). However, the Mann–Whitney U test revealed no statistically significant difference in coccolithophore abundance between these water layers (p > 0.05) (Table S3).
Samples from March 2019 were characterized by low S (min = 5 taxa; 19W12L) and H′ (min = 0.49; 19W12L) values and rather high dominance (max = 0.79; 19W12L). Furthermore, S displayed higher records in the upper photic zone during the 2019 sampling, while dominance values were practically similar between the upper and the mid-lower photic zone (Figure 4).
During the August 2019 sampling (average total coccosphere density 8.7 × 10³ coccospheres L−1), coccolithophore abundance was highest at sampling station 19S12U (12.7 × 10³ coccospheres L−1). The total coccolithophore abundance was generally higher in the upper photic zone (average 9.5 × 10³ coccospheres L−1) compared to the mid-lower layers (average 7.9 × 10³ coccospheres L−1) except for station 19S16 (Figure 3). In contrast to both winter-early spring periods, the late summer sampling exhibited the highest species richness (max = 24 taxa; 19S16L) and diversity (max = 2.50; 19S16L) and the lowest values of dominance (min = 0.11; 19S12U) (Figure 4).
Nutrient concentrations (particularly NO3 + NO2 and SiO4) presented overall lower values in March 2017 when compared to March 2019; the values were clearly lower in August 2019, in accordance with the prevailing summer oligotrophic conditions. Interestingly, PO4, although very low, was generally higher during March 2017.

4.2. Coccolithophore Community Structure and E. huxleyi Coccolith Morphology

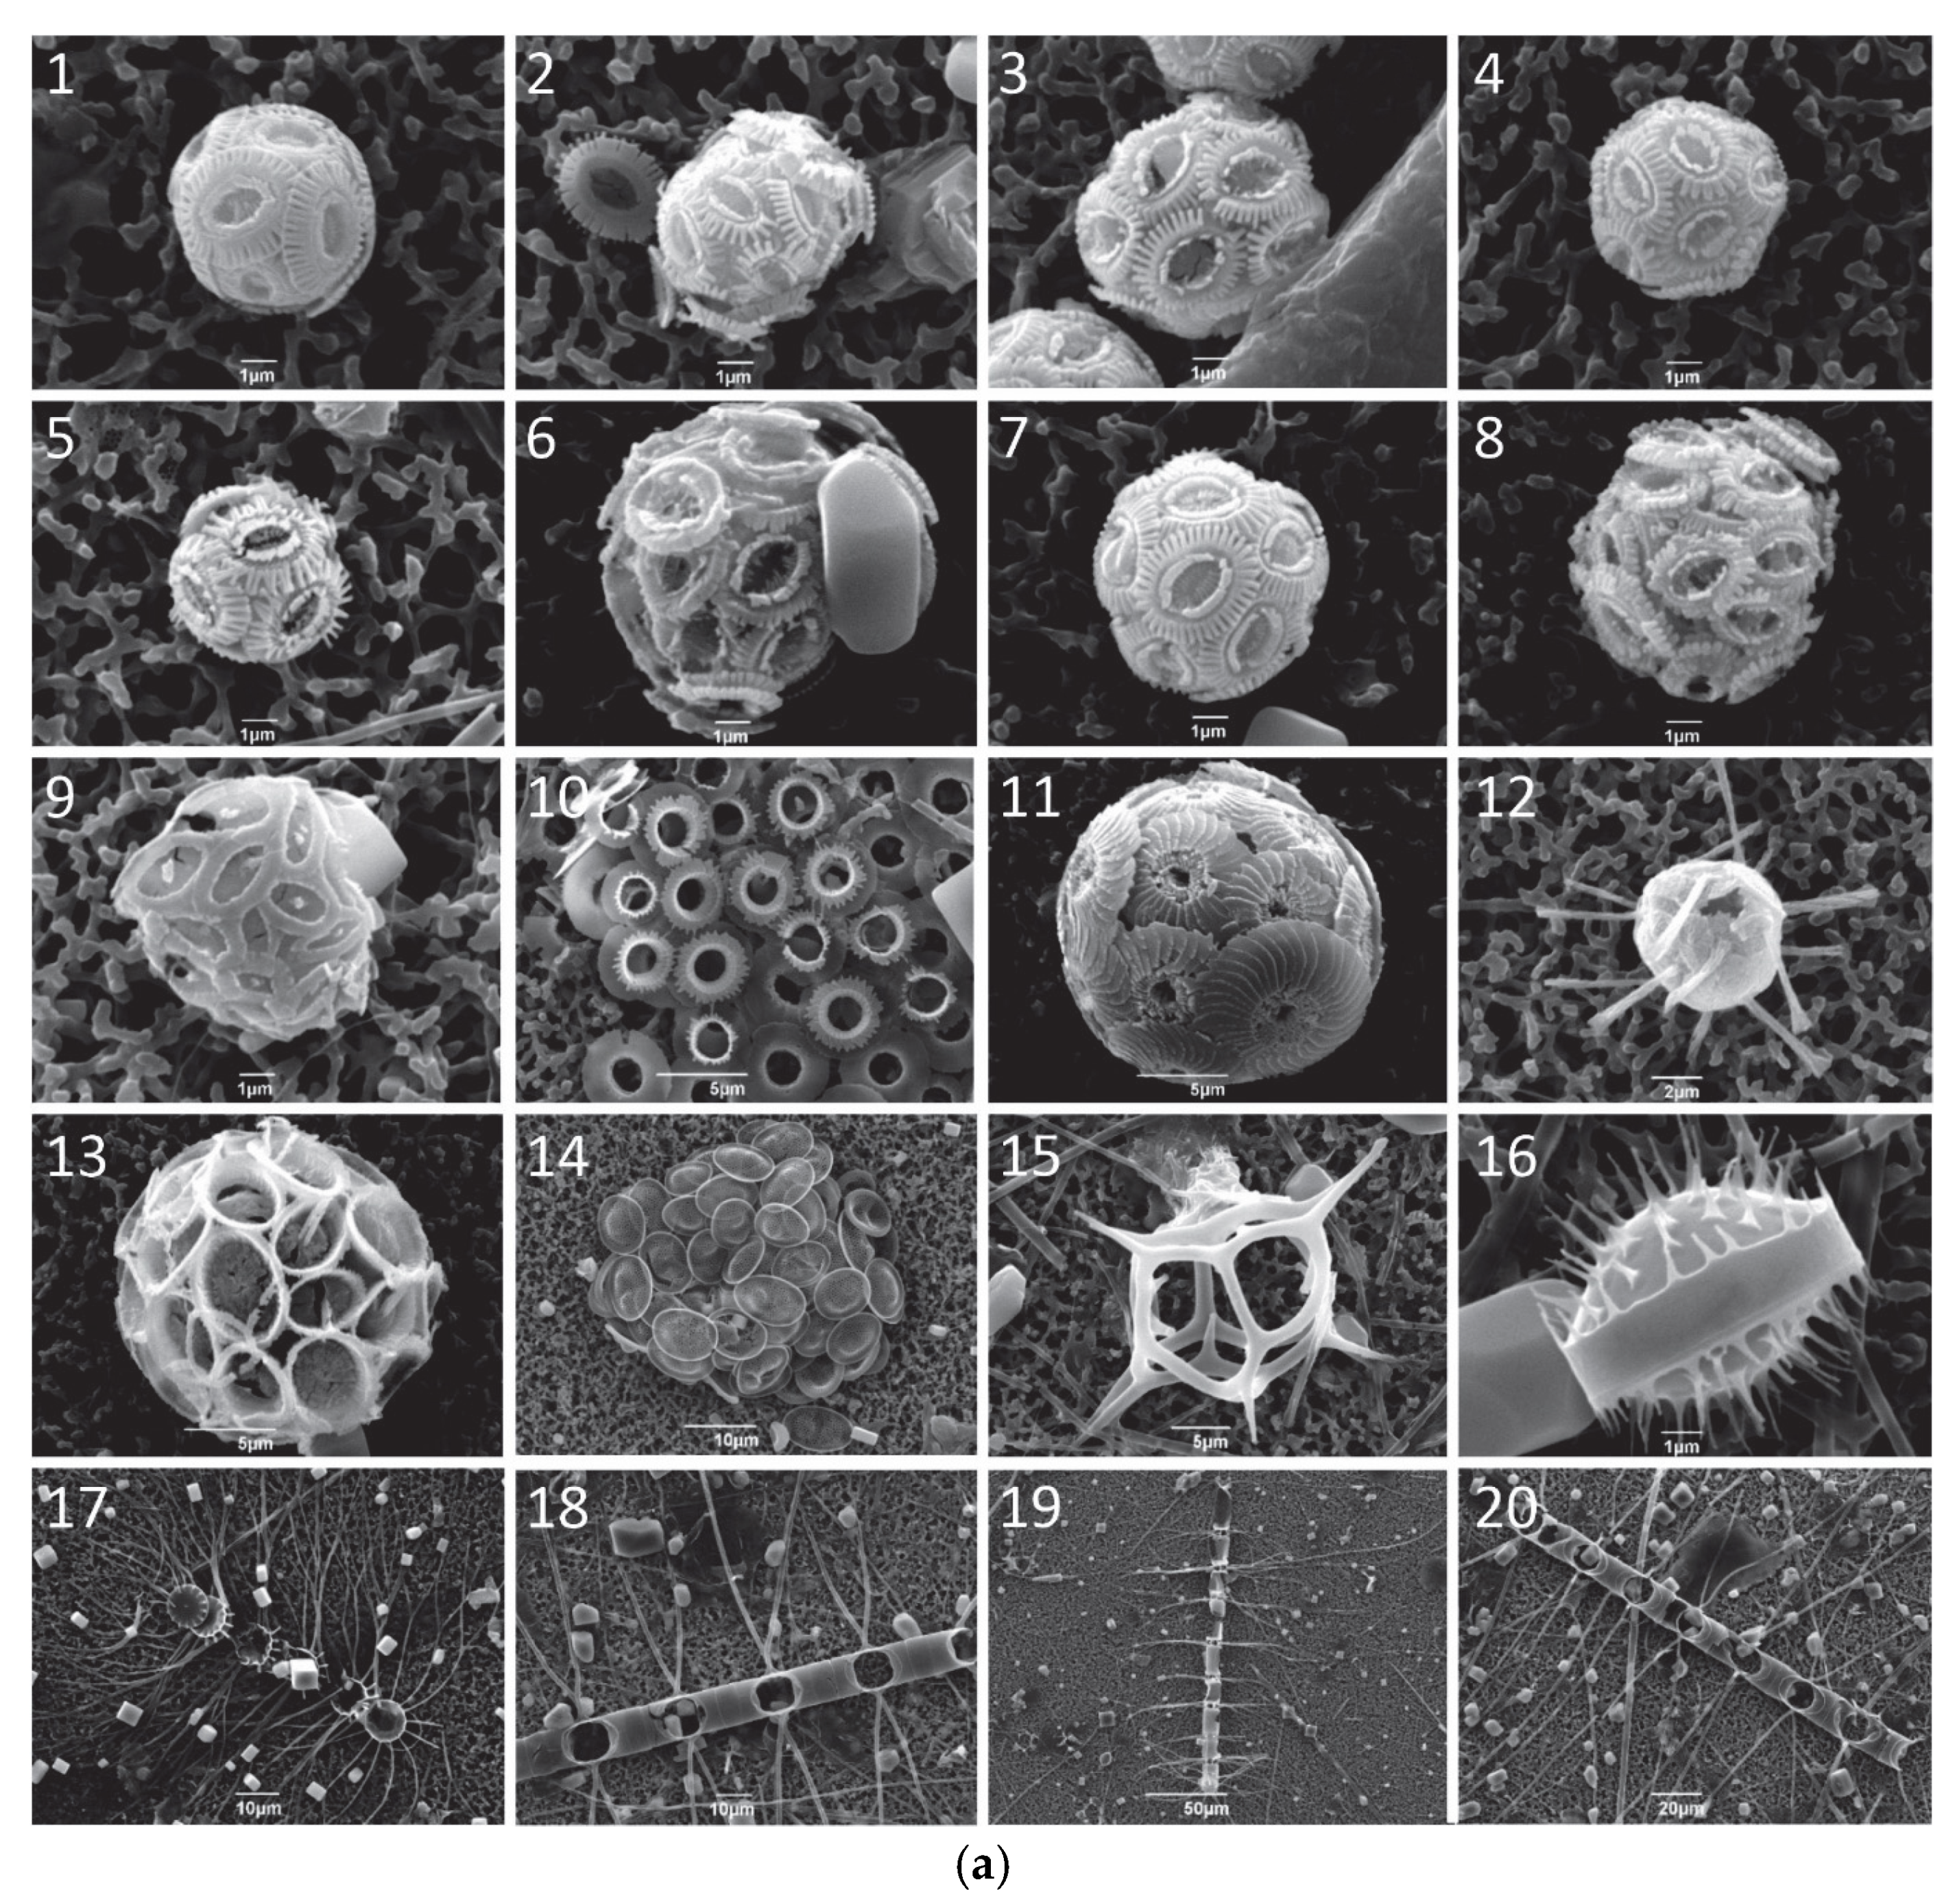
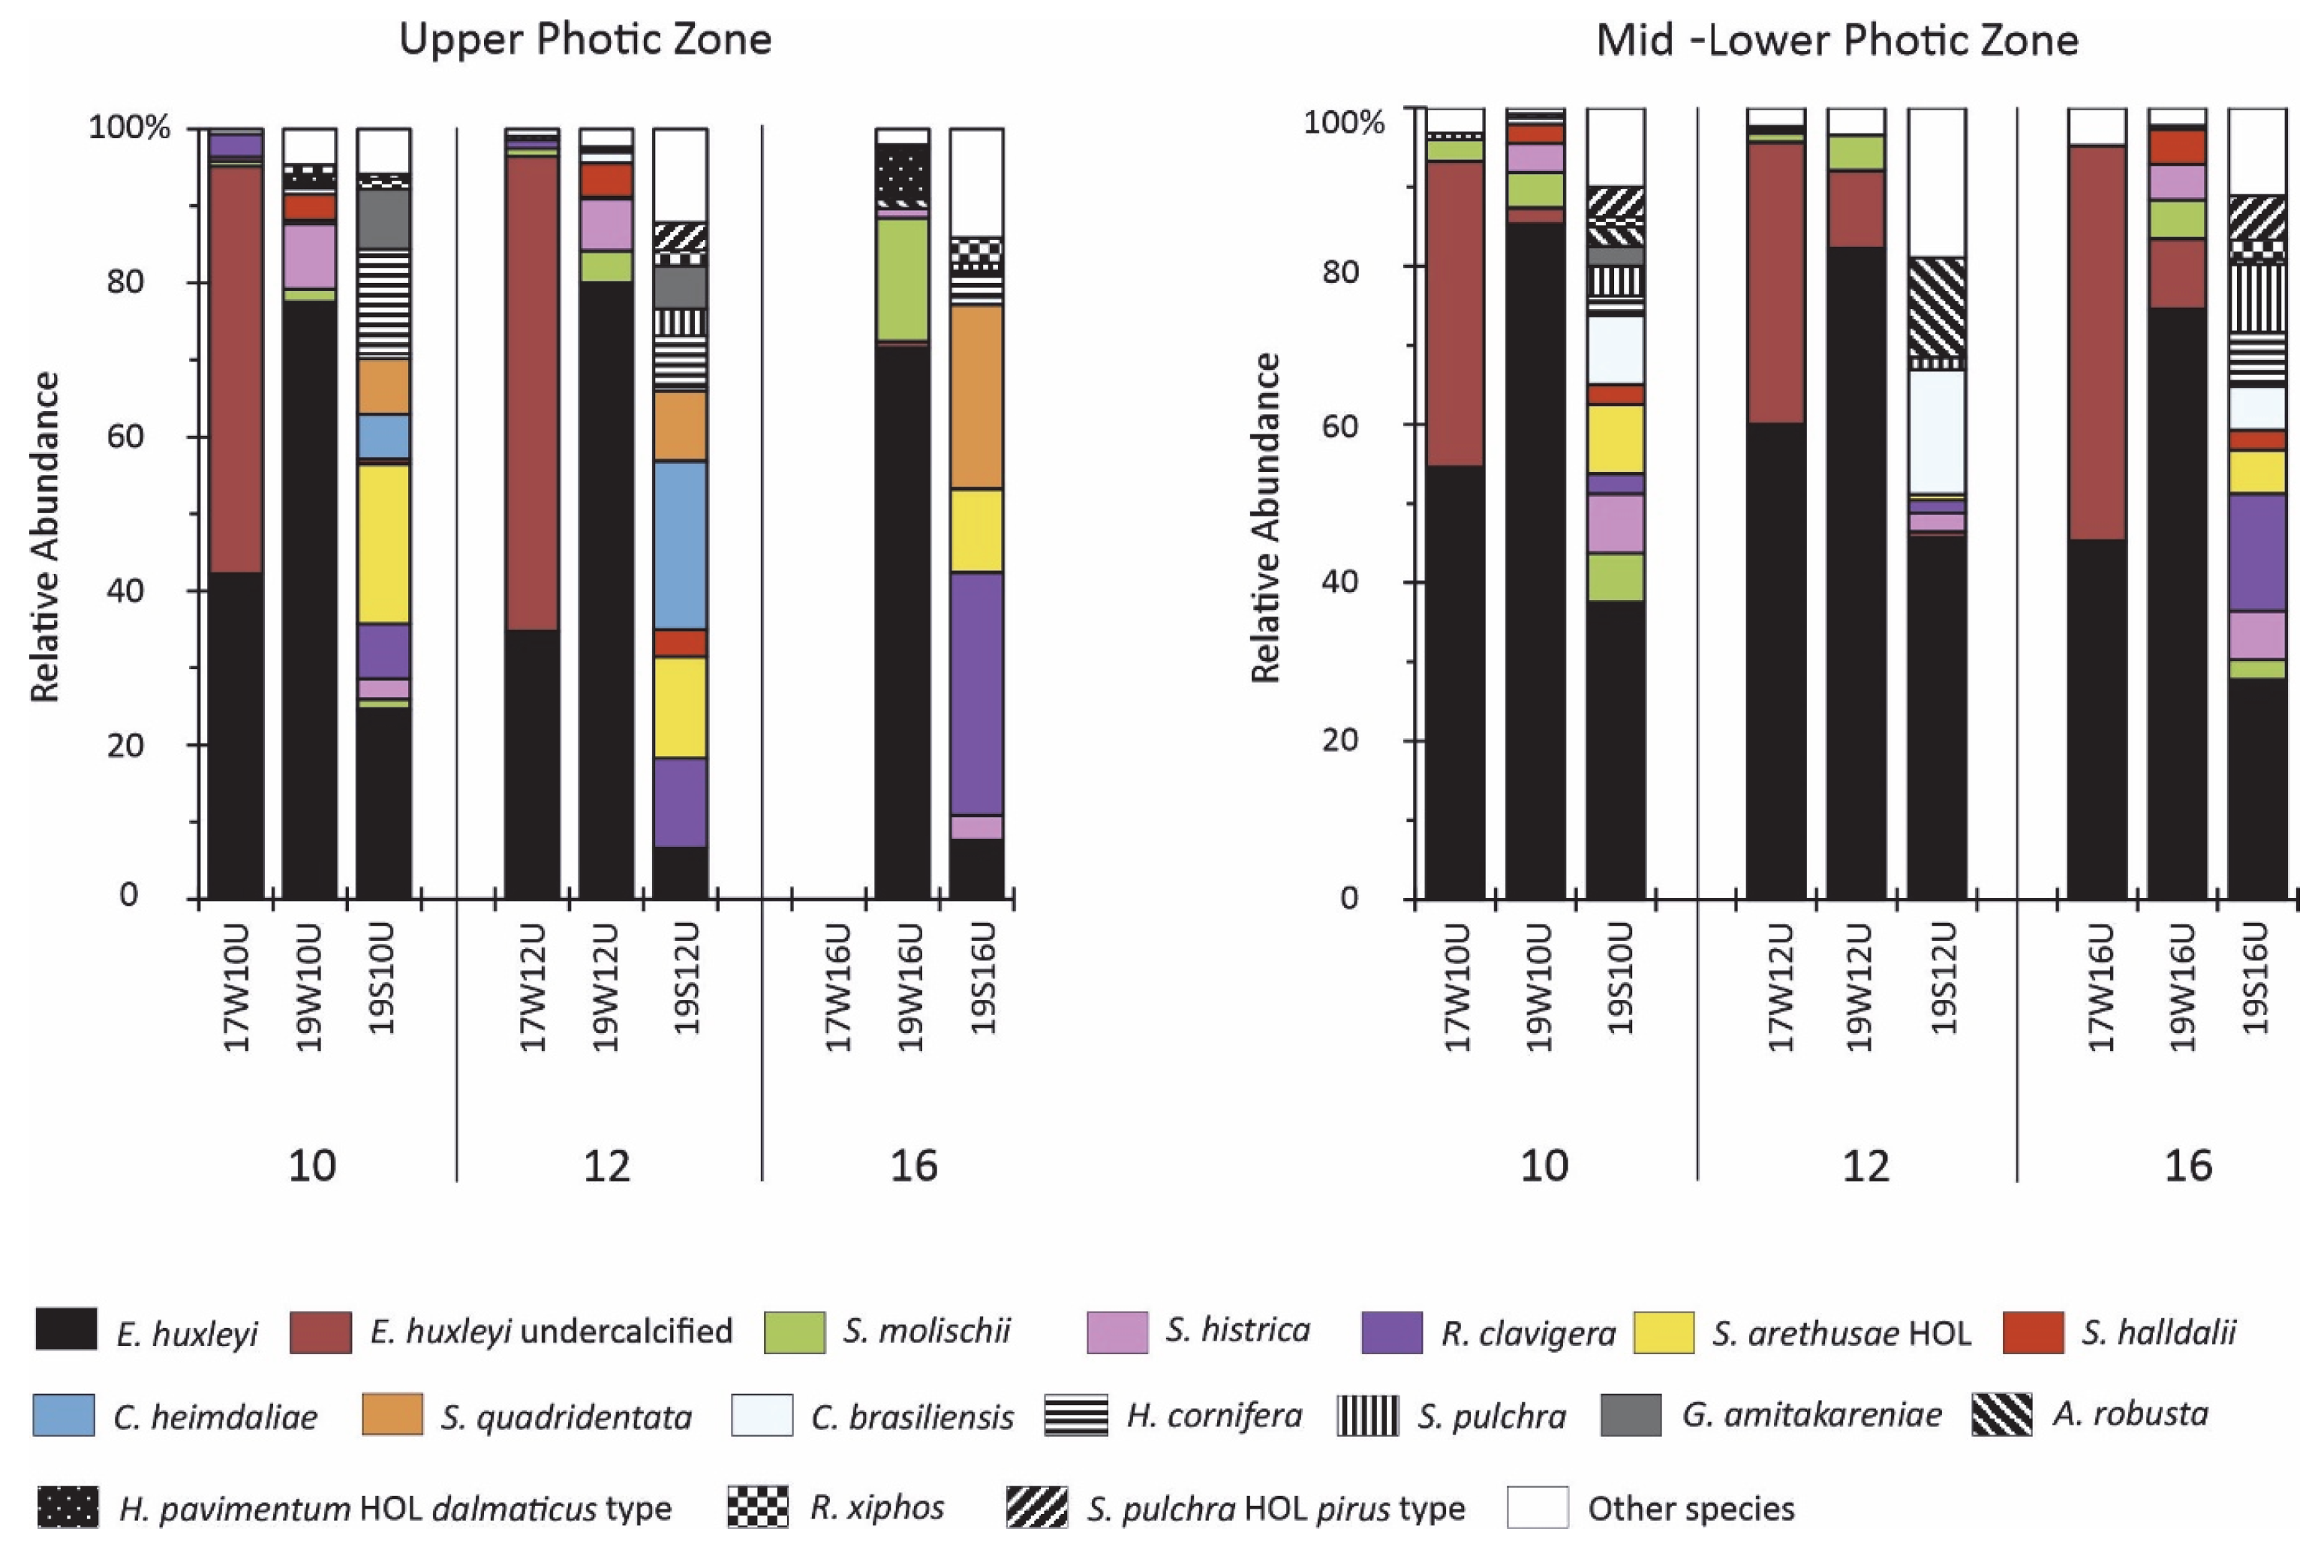
Emiliania huxleyi was the most abundant species (92–100%) in March 2017, ranging between 1.3 × 10³ coccospheres L−1 (station 17W16L) and 17.2 × 10³ coccospheres L−1 (station 17W12L) (Figure 3 and Figure 5; Table S2), except for the total absence of coccospheres at station 17W16U in the upper photic zone. A noticeably high number of etched/undercalcified specimens (sensu https://www.mikrotax.org/Nannotax3/maindb/Emiliania_huxleyi_type_A#gallery--11, accessed on 1 January 2025 [39,44]; Figure 5 and Figure 6) with weakly developed inner tubes and incomplete “T-shaped” coccolith elements (Figure 2a) was recorded during the March 2017 sampling, constituting on average ~50% of the total coccolithophore assemblage and E. huxleyi abundance (Figure 5). This type of morphology was observed in all samples taken throughout the water column in 2017, apart from sample 17W16U, which was devoid of coccolithophores and only displayed common diatom assemblages, mostly represented by Chaetoceros chains (Figure 2a). Furthermore, Hyalolithus neolepis, a haptophyte alga with siliceous scales, was recorded at station 17W12L (Figure 2a, Table S2). Few overcalcified E. huxleyi specimens were documented in the same dataset (Figure 2a). Syracosphaera spp. and Rhabdosphaeraceae (Figure 2a) were generally represented by low abundances, with Syracosphaera molischii (max = 3%) as the most common species, followed by Rhabdosphaera clavigera (max = 3%) (Figure 5, Table S2). Interestingly, most specimens of the former species were also documented with etched morphology (Figure 2a).
In the March 2019 sampling, E. huxleyi still dominated the coccolithophore assemblage (~82%) (Figure 5), ranging between 11.3 × 10³ coccospheres L−1 (station 19W16U) and 22.2 × 10³ coccospheres L−1 (station 19W12U) (Figure 3). A significant drop in the presence of etched/undercalcified E. huxleyi specimens was recorded, constituting on average ~4% of both the total coccolithophore assemblage and E. huxleyi abundance; etched/undercalcified E. huxleyi specimens were clearly restricted in the mid-photic zone layer (Figure 3 and Figure 5, Table S2). Similarly, Syracosphaera spp. were generally represented by low abundances, with S. molischii (max = 16%), followed by S. histrica (max = 8%), S. halldalii (max = 4%), and H. pavimentum HOL dalmaticus type (max = 7%) (Figure 5). Other holococcolithophores contributed with very low abundances and constituted on average < 1% of the total assemblage (Table S2).
Overall, E. huxleyi displayed significantly lower abundances during the August 2019 sampling; on average ~25% of the total coccolithophore assemblage, while etched/undercalcified specimens were totally absent (Figure 3). Emiliania huxleyi coccospheres densities ranged between 0.5 × 10³ coccospheres L−1 (station 19S16U) and 3.8 × 10³ coccospheres L−1 (station 19S12L) (Figure 3). In the upper photic zone of station 19S12U, Calyptrosphaera heimdaliae reached ~22% (2.8 × 10³ coccospheres L−1), and at station 19S16U, R. clavigera comprised ~32% of the total assemblage (1.9 × 10³ coccospheres L−1) (Figure 3 and Figure 5). The August 2019 assemblage was characterized by high species diversity: heterococcolithophores (up to ~62%) consisted mostly of R. clavigera (max = 32%), C. brasiliensis (max = 16%), and S. histrica (max = 8%) (Figure 5). Holococcolithophores accounted for ~38% of the total standing crop and were relatively well represented in the late summer coccolithophore assemblages (max = 70%; 19S12U 2–20 m), comprising several species, e.g., S. arethusae HOL (max = 21%), Sphaerocalyptra quadridentata (max = 24%), Algirosphaera robusta HOL (max = 24%), and Helladosphaera cornifera (max = 14%) (Table S2). Hyalolithus neolepis was recorded at both stations 19S12U and 19S10U during the late summer of 2019.
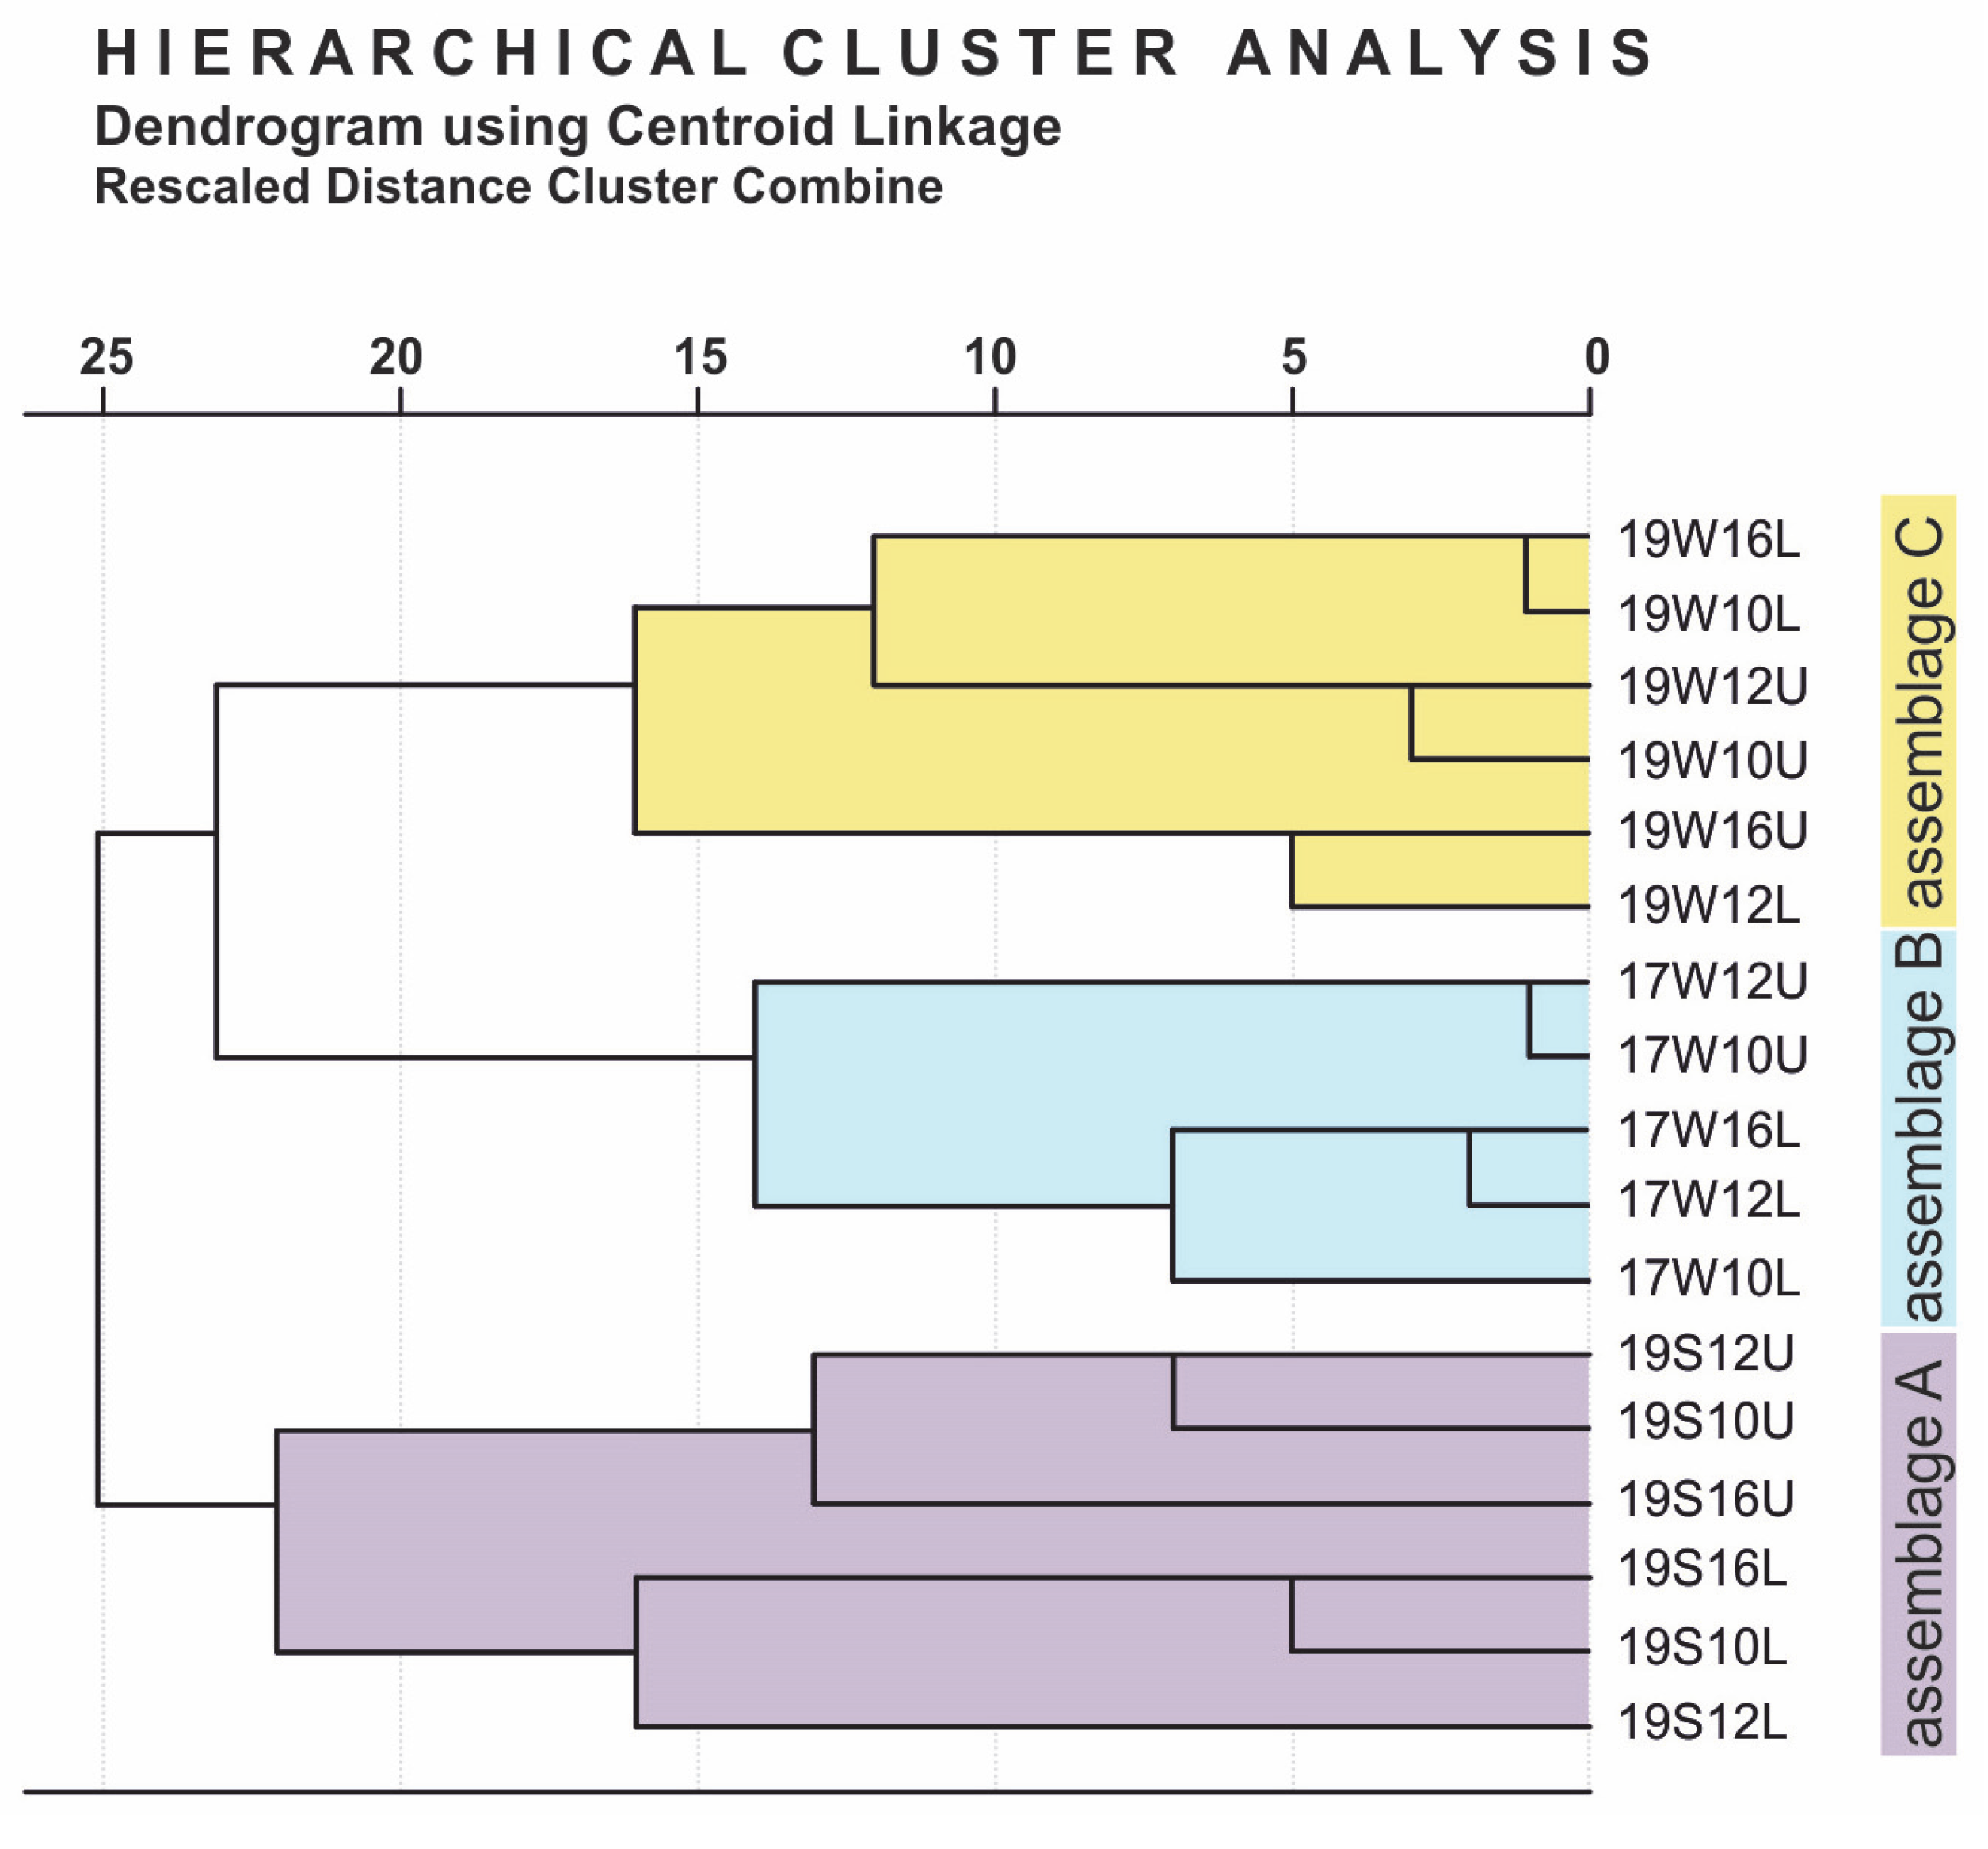
Q-mode hierarchical cluster analysis classified the samples based on their similarities in coccolithophore species composition. The resulting dendrogram (Figure 6) showed three main clusters. Assemblage A comprised samples collected in August 2019, whereas Assemblages B and C consisted of samples collected in March 2017 and March 2019, respectively.
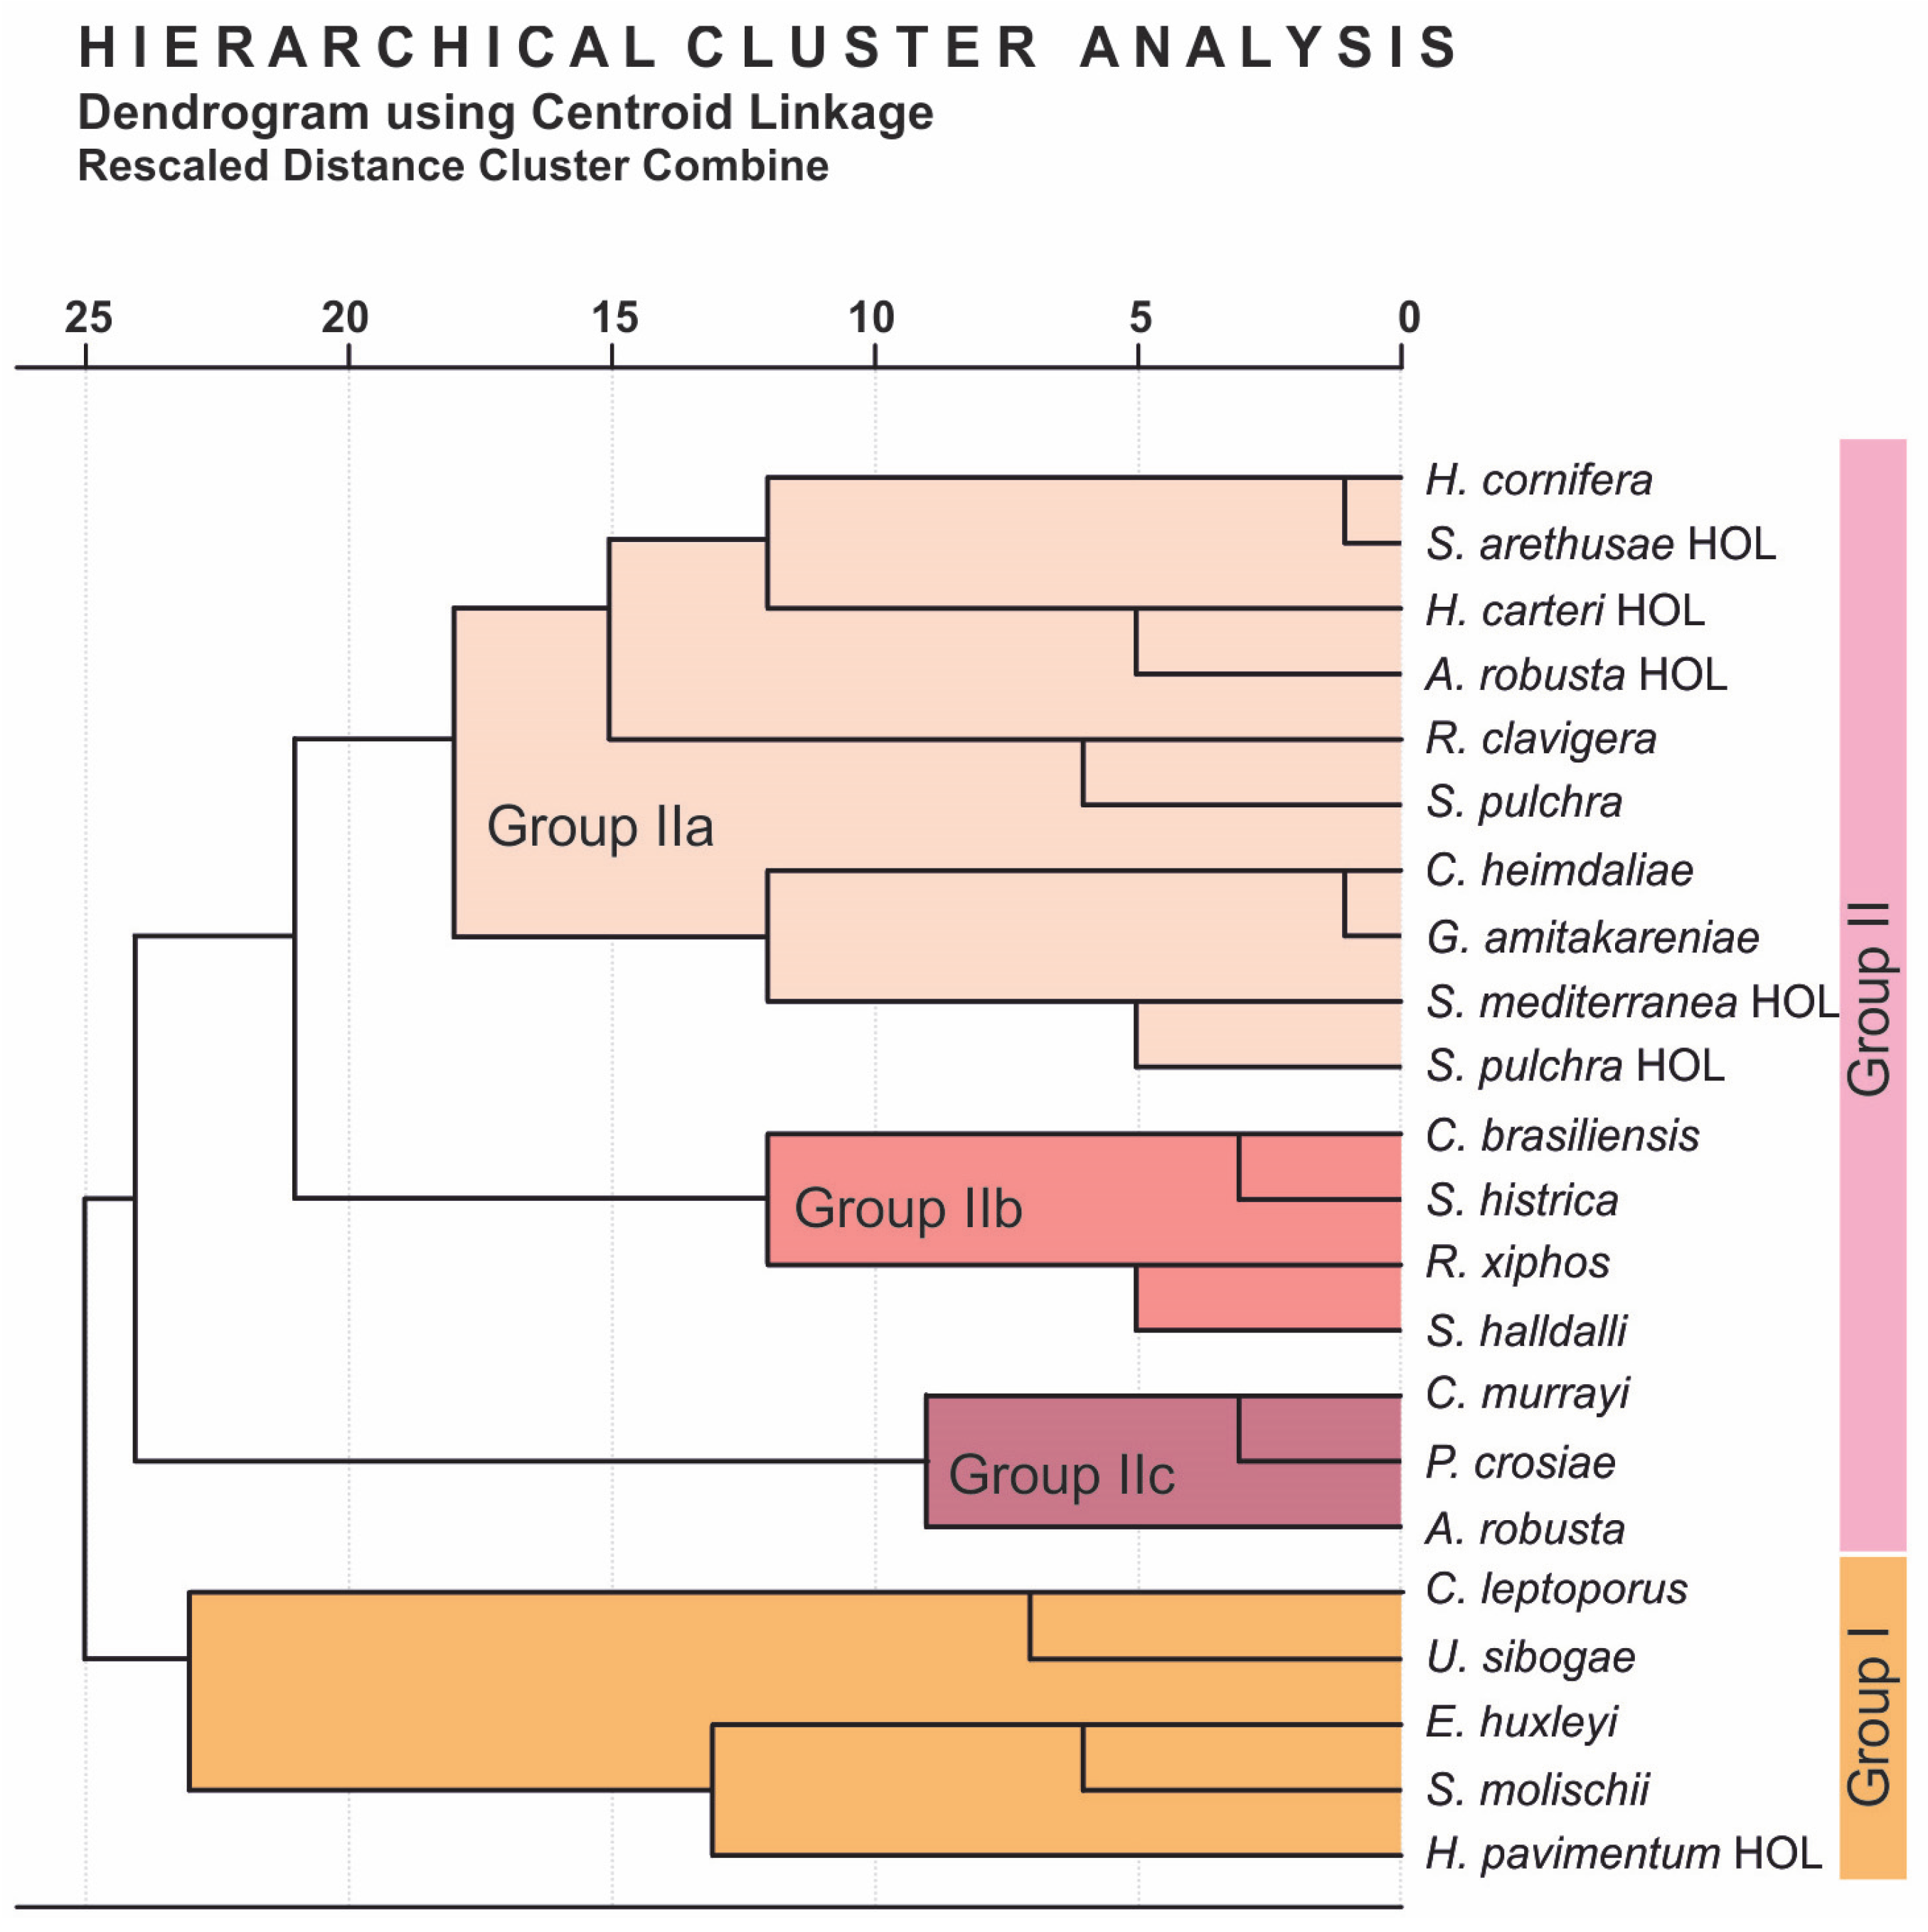
R-mode hierarchical cluster analysis on South Aegean Sea coccolithophore assemblages (Figure 7) enabled us to recognize two groups, one of which could be subdivided into three subgroups, comparable to those described by Dimiza et al. [5] for the Aegean Sea region. Group I was characterized by H. pavimentum HOL, S. molischii, E. huxleyi, C. leptoporus, and U. sibogae. Group II comprised three subgroups, including seventeen species, representing mostly holococcolithophores together with R. clavigera and S. pulchra (Group IIa), while Groups IIb and IIc clustered the species C. brasiliensis-S. histrica-R. xiphos-S. halldallii and C. murrayi-P. crosiae-A. robusta, respectively.
Coccolithophore assemblages were compared to the physicochemical parameters using Spearman’s correlation coefficient (Table 2). Out of Group I (Figure 7), Emiliania huxleyi etched/undercalcified specimens showed a significant negative correlation with temperature and positive correlations with the concentrations of nutrients. The abundances of C. brasiliensis and R. xiphos (Group IIb) and R. clavigera and holococcolithophores (Group IIa; excluding H. carteri HOL) showed strong positive correlations with temperature and negative correlations with nutrient concentrations. Syracosphaera pulchra (Group IIa) and S. histrica and S. halldalii (Group IIb) were also negatively correlated with nutrients. By contrast, C. leptoporus (Group I) was positively associated with PO4 concentration. A significant positive correlation was found between the abundance of S. halldalii (Group IIb) and salinity.
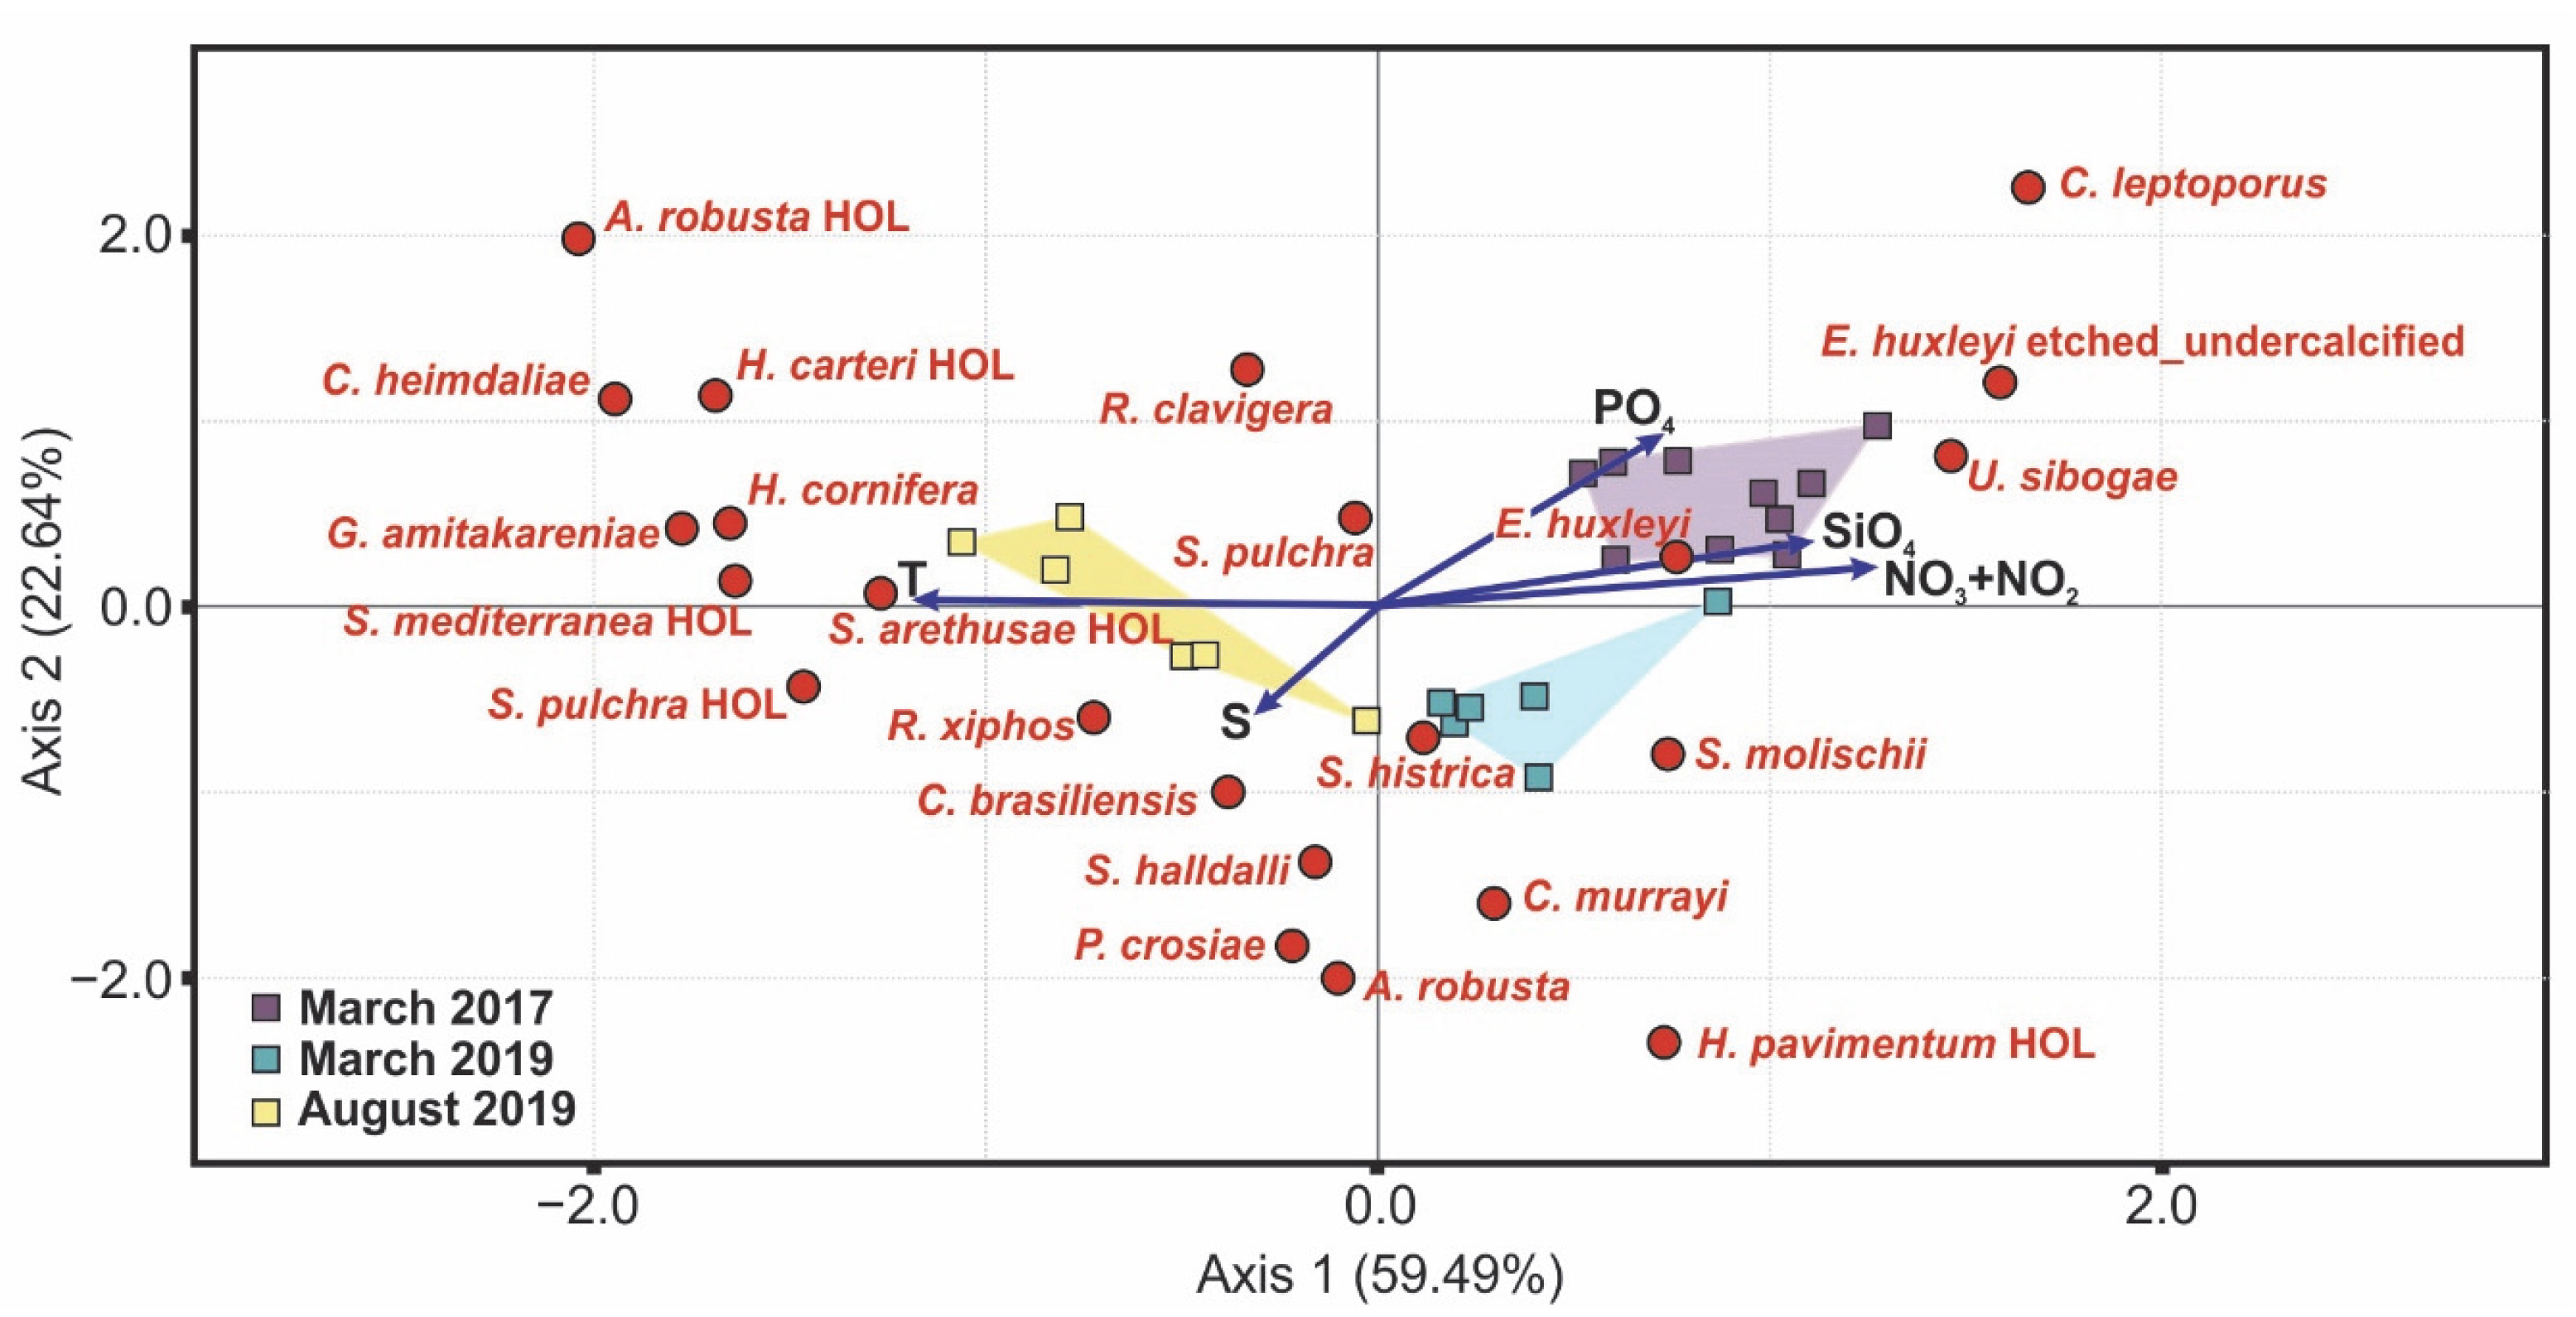
Through CCA analysis, the defined axes explained a total of 82.13% of the variance in coccolithophore distribution (Figure 8). The first axis (Axis 1: eigenvalue = 0,415, p < 0.05) accounted for 59.49% of the variance, was positively correlated with NO3 + NO2 and SiO4, and was negatively correlated with water temperature. The second axis (Axis 2: eigenvalue = 0,158, p < 0.05) explained a further 22.64% of the variance, showing a positive relationship with PO4 and a negative relationship with water salinity. However, the wide angle between environmental variables and Axis 2 suggested a moderate level of correlation.
Samples collected during the late summer (August 2019) exhibited a negative correlation with CCA Axis I, whereas samples from winter-early spring (March 2017 and March 2019) showed a positive correlation with CCA Axis I (Figure 8).
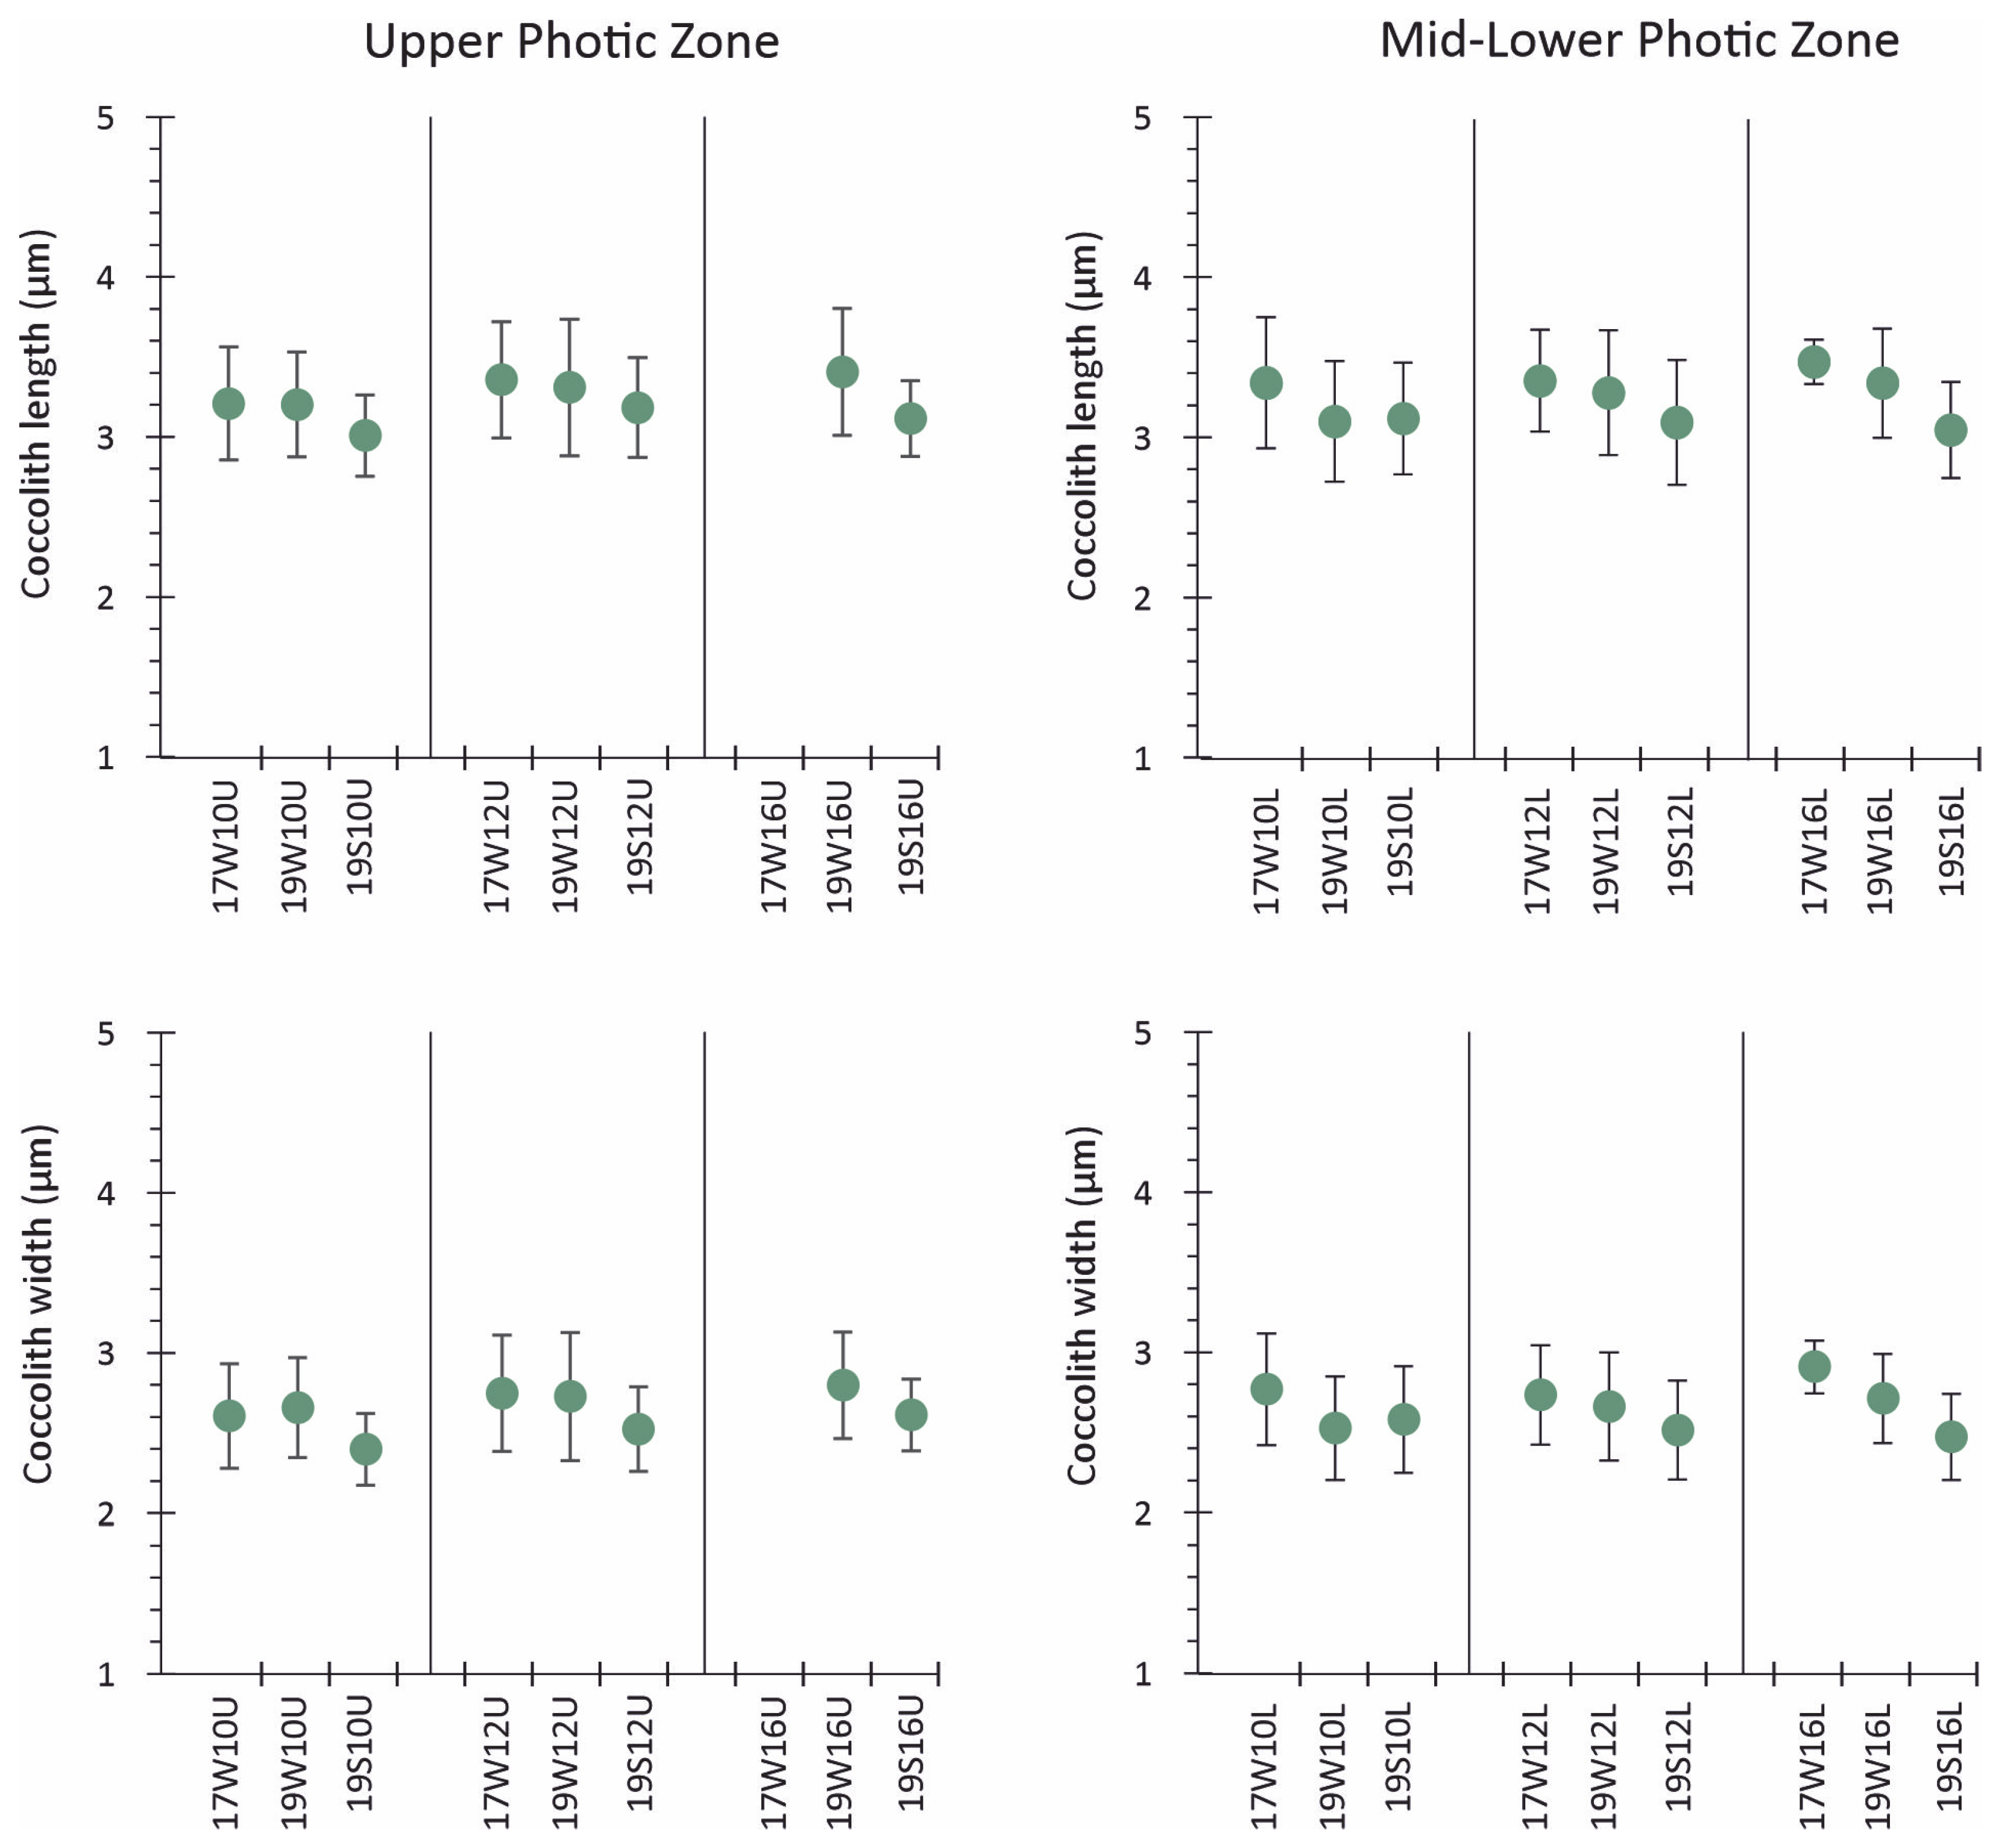
Morphometric analyses of E. huxleyi (Figure 9; Table S3) indicated that both coccolith length (ANOVA, F2,859 = 25.870, p < 0.001) and width (ANOVA, F2,859 = 27.626, p < 0.001) varied significantly during the sampling periods. Specimens from August 2019 were lightly calcified and showed statistically significant lower values of coccolith length and width relative to those from the two other samplings (post hoc Tukey HSD, p < 0.05; Table S3). However, in March 2017 and 2019, the mean length and width values were almost at the same level (post hoc Tukey HSD, p > 0.05; Table S3).

5. Discussion

5.1. Assemblage Composition and Dominant Species

Both March 2017 and 2019 sampled assemblages (Figure 5) were defined by the predominance of r-strategist taxa, typically prevalent in Mediterranean waters during the cold period (winter-spring), with opportunistic species of Group I (Figure 7; Table 2) like E. huxleyi, which quickly takes advantage of nutrient availability in both eutrophic and oligotrophic environments and serves as an indicator of high productivity conditions [4,5,7,8,9,45,46,47,48,49,50]. Also, Syracosphaera molischii, a minor component of Group I winter communities (Figure 7), shares ecological requirements with E. huxleyi [1] and is well documented as a common component during the winter in Mediterranean coastal settings [5,46,47,50,51]. In addition, Algirosphaera robusta is mostly a deep photic zone taxon that lives within or below the summer thermocline [48] and is recognized as exhibiting a flexible response to varying nutrient availability [7,37,52,53], in some cases positively related to salinity and nitrite levels [51]. Helicosphaera pavimentum HOL represents the only holoccocolithophore found during the late winter-early spring sampling periods (Group I; see Figure 7, Table 2) and is also recorded in winter mixing conditions [54]. Evidently, both the applied R-mode hierarchical cluster analysis and CCA indicated that taxa such Emiliania huxleyi, Syracosphaera molischii, and Helicosphaera pavimentum HOL dalmaticus type showed a preference for lower temperatures and higher nutrient concentrations and were associated with winter-early spring water column mixing (Figure 7 and Figure 8).
Although their coccosphere densities were low during the March 2017 sampling, S. histrica, C. brasiliensis, and S. halldalii showed an increase during March 2019 and especially during August 2019 (Figure 5). These species, forming Groups IIb and IIc (Figure 7), are indicative of summer stratified conditions, resulting in productivity throughout the water column. Indeed, previous studies in the central Aegean have indicated that C. brasiliensis reaches higher concentrations at a depth of 90 m, similar to C. murrayi, which has been recorded in the middle photic layers [55], showing close affinity to A. robusta, while S. halldalii was clustered with warm, oligotrophic taxa such as S. histrica and R. xiphos, preferring the upper water layers up to 25 m depth [5].
The Spearman’s correlations and CCA groupings (Figure 8; Table 2) suggested a clear seasonality pattern of species assemblage, with temperature, NO3 + NO2, and SiO4, being the main factors influencing their distribution. It was evident from the Q-mode hierarchical analysis (Figure 6) that samples collected in March 2017 differed from those collected in March 2019 in coccolithophore composition, while the Mann–Whitney U test (p = 0.007) clearly supported a significant difference concerning the total coccolithophore abundance (Table S3). Indeed, the coccolithophore assemblages from March 2017, besides the strong dominance of E. huxleyi, showed a high frequency of etched/undercalcified specimens. It is assumed that the strong convective mixing and deep water produced in 2016–2017 ventilated the Myrtoan Basin water column, uplifting the enriched nutrient concentrations in bottom waters to intermediate depths and even to upper water layers, according to a well-described mechanism [11,20]. The strong cyclonic circulation transported the upper water layers into the southeast Aegean [20,28], enhancing the nutrient-driven productivity of E. huxleyi. By contrast, the assemblages from March 2019 were more diverse, characterized by higher contributions of typical spring species S. molischii [5] and other Syracosphaera spp. (Figure 5), implying the common oligotrophic pattern for Aegean waters [32,36,56].
The late summer assemblages of August 2019 were typically characterized by numerous K-strategist taxa of Group IIa (Figure 7), such as holococcolithophores, R. clavigera, C. heimdaliae, and S. pulchra, typical taxa of warm, oligotrophic upper water layers [4,5,10,46,47,52,57,58], reflecting the influence of the LIW masses in the South Aegean Sea, as well as the effect of seasonality patterns, i.e., summer stratification of the water column [4,5]. Several holococcolithophores, such as Syracosphaera arethusae HOL, Syracosphaera pulchra HOL pirus type, Helladosphaera cornifera, and Gliscolithus amitakareniae, displayed a preference for higher temperatures and lower nutrient concentrations (Table 2) and were linked to the warm period (summer-autumn) water column stratification (Figure 8; Table 2).
Notably, the scattered presence of the siliceous haptophyte H. neolepis was recorded in the South Aegean Sea during March 2017 and August 2019 (Table S2). Besides indicating silica availability, the siliceous scales of H. neolepis have been found to occur in seawater samples around the world, showing its broad geographic distribution [59,60,61]. The present record from the Aegean Sea thus contributes to the understanding of the ecological factors that control the distribution of this poorly-known non-coccolithophore species.

5.2. Imprint of the Extreme 2016–2017 Winter on South Aegean Sea Coccolithophore Abundance

Dimiza et al. [5] recorded that during the winter-spring cold periods in the South Aegean Sea, the coccolithophore density ranged from 13.82 to 52.02 × 10³ coccospheres L−1, with high coccosphere densities throughout the whole photic zone. By contrast, the establishment of a seasonal thermocline during the summer results in more oligotrophic conditions, causing a drop in coccosphere concentrations by at least one order of magnitude, a reduction in the abundance of placolith-bearing taxa, and the formation of a vertical taxon zonation [5,49,62,63,64].
This coccolithophore seasonal differentiation was also confirmed by the R-mode and CCA analyses (Figure 7 and Figure 8) of the present study, as also revealed by noteworthy patterns in total coccosphere density and diversity indices. Particular differences between the winter-early spring March 2017 and March 2019 samplings were possibly related to the extreme winter event of 2016–2017 that affected the eastern Mediterranean [21]. Linked to the recorded 2016–2017 intense sea and air mass cooling, large-scale to global cold events e.g., negative El Niño-Southern Oscillation (ENSO), could have affected the Mediterranean [65]. Interestingly, a moderate La Niña event occurred in the second half of 2016 to the spring of 2017 [65,66,67]. Notably, the March 2017 sampling was associated with the tail end of the strong influence of the extreme surface cooling event over the eastern Mediterranean that led to DWF in the region, disrupting the water column structure in both northern and southern Aegean basins. In particular, the deep Myrtoan Basin in the southwest Aegean is ventilated by dense waters traceable southward to the West Cretan Straits, suggesting that the export of these masses from the Aegean Sea could have potentially impacted the thermohaline circulation of the entire eastern Mediterranean [21].
It seems that the extreme winter cooling of 2016–2017 significantly affected the coccolithophore assemblage of the Aegean (p = 0.007, Table S3), resulting in distinctly lower total coccosphere densities, species richness, and diversity, and in some cases even the total absence of coccospheres (e.g., station 17W16U, Figure 3). It is likely that the convective mixing and DWF that disrupted the water column structure enriched the nutrient supply to the upper euphotic layers in the South Aegean Sea and shifted the timing of the regular dynamics of phytoplanktonic species succession [68,69], thus increasing the duration and magnitude of the diatom bloom. Interestingly, Varkitzi et al. [11] extensively interpreted a similar diatom bloom in the South Aegean Sea during winter-spring 2008. Similarly to the present study, the exceptional diatom bloom of 2008 was triggered by a strong convection and deep mixing event, which caused the nutrient enrichment of surface waters.
Although this remains as hypothesis, since diatom abundance data before and after the samplings of the present study are unfortunately not available, the plotted Chl-a concentrations from satellite data (Figure S1) showed typical high late winter-early spring marine productivity due to diatom preference for a mixed, nutrient rich water column [11,70,71]. Accordingly, the observed presence of large diatom assemblages mostly represented by Chaetoceros chains in March 2017 samples implies that they may have been the remnants of an earlier prominent diatom bloom, as large diatoms that are often found in regions of upwelling [71] were also recorded as dominant by Varkitzi et al. [11] during the 2008 diatom spring bloom in the South Aegean Sea. In addition, the mineral nutrients (Table 1) presented overall lower values in March 2017 when compared to March 2019; this nutrient decrease can be linked to consumption by extensive phytoplankton biomass, implying that the March 2017 sampling was performed in the end of the conditions that triggered diatom growth [11,72]. The succession from diatoms to coccolithophores, suggested by the increase in coccolithophores, which can only take place during low-nutrient conditions after the fall of the diatom population, when it has already depleted the silicate and nitrate reserves in the water layer, is well documented in the world ocean [73] and well recorded in the Aegean Sea [32,68,69,72,74]. Liu et al. [67] recorded a similar reduction in oligotrophic warm water coccolithophore species abundance during negative ENSO phases (La Niña), linked to resource competitiveness with other algal groups and limited nutrient availability. The direct response of coccolithophore assemblage dynamics in such cold regional and global climate and hydrographic forcing events has largely remained undocumented to date [67]; hence, the Aegean Sea coccolithophore community response might provide further evidence to understand the group’s functional adaptation with respect to environmental challenges. On the other hand, the March 2019 assemblage resembled the “normal” pattern of winter-early spring in the eastern Mediterranean [4,5,7,8,75], with high coccolithophore abundance and dominance, predominantly led by E. huxleyi, as compared to relatively low species richness and diversity.

5.3. Μorphological Patterns of E. huxleyi

The E. huxleyi morphometric analysis indicated that both coccolith length and width (ANOVA, F2,859 = 25.870, p < 0.001 and ANOVA, F2,859 = 27.626, p < 0.001, respectively; Table S3) varied significantly between the different seasonal samplings (Figure 9); with clearly statistically significant lower values (post hoc Tukey HSD, p < 0.05; Table S3) of coccolith length and width featured in the warm season (August 2019), in line with the E. huxleyi seasonal calcification trend observed in the Aegean [9,10,17]. Although no statistically significant difference was recorded between the March 2017 and 2019 mean coccolith length and width values (post hoc Tukey HSD, p > 0.05; Table S3), it must be noted that the results of March 2017 E. huxleyi size were likely underestimated due to the observed etching in most of the analyzed coccoliths (Figure 2a), implying that even larger coccoliths had been formed during that time interval, following the typical cold season pattern for the Aegean.
Interestingly, both the upper and mid-lower water depths during March 2017 showed low absolute abundances and even the total absence of coccolithophores (see also the Mann–Whitney U test p > 0.05 in coccolithophore abundance between these water layers; Table S3), with the dominance of etched/undercalcified specimens, mostly E. huxleyi (Figure 3); however, other taxa, e.g., Calcidiscus and Rhabdosphaera, also displayed etched/undercalcified features (Figure 2a). Hence, this probably reflected the originally increased calcification that occurred in the Aegean Sea euphotic zone as an imprint of the exceptionally cold event in December 2016, which led to vertical water column mixing and DWF. In the Aegean Sea, the characteristic dominance of heavily calcified coccoliths and larger coccospheres of E. huxleyi usually occurs during the cold season, possibly related to a relative increase in [HCO3] content [9]. Indeed, several authors argue that higher calcification could be associated with elevated concentrations of bicarbonate ions during spring samplings [15,76]. Bach et al. [77] in their extensive culture experiment also observed that coccolith size variations are mainly influenced by levels of [HCO3] and [H+], while levels of [CO32−] might still be a significant factor. When CO2 dissolves in seawater, it triggers chemical reactions that decrease the carbonate ion concentration (CO32−), lower seawater pH by increasing H+ ions, and reduce the saturation states of biogenic carbonate minerals [78], thus resulting in ocean acidification. Although CO2 is more soluble in colder seawater, the supersaturation with respect to calcite and aragonite observed throughout the entire eastern Mediterranean Basin and the Aegean Sea [9,26] has prevented, so far, the development of notable acidification effects; by contrast, it supports coccolith overcalcification during the cold season. However, we cannot rule out the possibility that the etched/undercalcified E. huxleyi specimens dominating the entire water column during March 2017 could be the imprint of in situ calcite dissolution. Therefore, the cold conditions in winter 2016 seem likely to have enabled increased absorption of atmospheric CO2 in surface waters, causing increased acidity and subsequent etching/undercalcification, mostly but not only, in E. huxleyi coccoliths. Several views have been expressed concerning this morphology. According to Langer et al. [79], this type of coccolith represents incomplete calcification. In addition, Chauhan and Rickaby [12] suggested that malformations in E. huxleyi may appear as incomplete coccoliths at low pH. Vazquez et al. [80] also suggested that it is the high CO2 levels rather than low pH that restrict the growth and performance of E. huxleyi, and D’Amario et al. [81] linked coccolithophore malformations in the Mediterranean Sea with acidified conditions.
Differences in E. huxleyi coccolith and coccosphere size can also be affected by changes in salinity [82]; however, this does not seem to be the case of the present study, as the salinity fluctuations were practically minor (Table 1).
Concerning nutrient levels and coccolith malformation, the views are controversial. Triantaphyllou et al. [9] noted that the seasonal calcification pattern in Aegean Sea water column assemblages was not linked to the nutrient pattern nor with small changes in salinity. By contrast, Okada and Honjo [83] considered nitrogen deficiency as responsible factors for coccolith malformation, while Båtvik et al. [84] related phosphorus and nitrogen stress to changes in coccolith size and evidence of malformation. Langer et al. [85] showed that coccolith formation was affected under both nitrate and phosphate limitation only in heavily calcified heterococcolithophores. Nimer & Merrett [86] demonstrated a decreased calcification rate under increased nitrate, while Langer et al. [79] did not document any effect of high nitrate on coccolith morphogenesis.
Another possible reason for the dissolution/undercalcification of the coccoliths could be infection by coccolithoviruses (EhVs). Johns et al. [87] considered that EhV infection in the marine environment may cause reduced cellular calcification, resulting in differential calcification concerning coccolith morphologies. Interestingly, Karatsolis et al. [10] recorded a total absence of E. huxleyi during July 2014 in the NE Aegean, considering that either the strong stratification of the summer water column resulted in a dramatic nutrient decrease, which directly affected species productivity, or that a possible coccolithovirus attack caused cell lysis [88], with a massive impact on assemblages. Although this could be a possible option that needs further research before any solid conclusion, the nitrogen-limiting conditions coupled with higher concentration of dissolved CO2 in surface waters most probably resulted in the recorded etched/undercalcified morphologies during March 2017. Considering that both acidified and nitrogen-limiting conditions are expected to constantly increase in the future [89,90], the recorded coccolithophore abundance and morphology during March 2017 may provide a glimpse of future coccolithophores struggling to adapt to the ongoing climate and environmental change. Evidently, the winter-early spring sampling of March 2019 reflected the dominance of heavily calcified E. huxleyi within this period, representing the return to the established calcification mode of the species in the Aegean hydrographic regime. Apparently, more observations, detailed measurements of in situ water properties (especially for H+, pCO2, and HCO3- concentrations and continuous mineral nutrient monitoring), as well as culture and molecular experiments are needed to further interpret such trends.

6. Conclusions

The present study provides insights into the spatial and temporal variations in coccolithophore assemblages and E. huxleyi morphological features during the exceptional cold 2016–2017 winter and 2019 in the South Aegean Sea. The main conclusions can be summarized as follows:
  • A distinct imprint of seasonality patterns on coccolithophore abundance, diversity, and assemblage was observed across the stations in the South Aegean Sea, mainly affected by temperature, NO3 + NO2, and SiO4. Both the March 2017 and 2019 sampled assemblages were dominated by E. huxleyi and other r-strategist taxa typical of lower temperatures and increased nutrient conditions. The March 2017 assemblage was mainly featured by high dominance of E. huxleyi, with etched/undercalcified specimens, while the March 2019 assemblages were more diverse and presented higher contributions of other taxa, e.g., Syracosphaeracea. The August 2019 coccolithophore community was characterized by high diversity, with abundant holococcolithophores and other K-strategist taxa.
  • The South Aegean Sea coccolithophore assemblages appear to have been affected by the extreme winter of 2016–2017, as evidenced by noticeably lower overall coccosphere densities (March 2017: max.17.8 × 103 coccospheres L−1 in mid-lower photic zone; March 2019: max 27.7 × 10³ coccospheres L−1 in upper photic zone), species richness, and diversity, and even the complete absence of coccospheres in some cases, accompanied by the significant presence of diatoms. The decreased coccosphere densities during March 2017 may be attributed to nitrogen enrichment in the photic zone following strong mixing of the water column, which caused a prolonged diatom bloom, resulting in a delay in the regular phytoplanktonic succession. The resulting nitrogen-limited setting, coupled with the enhanced CO2 concentration in surface waters promoted by the extremely cold conditions and wind stress on the ocean surface, probably caused the etching/undercalcification mostly, but not only, in E. huxleyi coccoliths. By contrast, the March 2019 assemblages reflected the dominance of heavily calcified E. huxleyi, demonstrating the return to the typical calcification pattern in the Aegean. The coccolithophore assemblage and morphology responses during March 2017 may provide evidence for the expected increased acidification and nitrogen-limiting conditions in the future.
  • Morphometric analysis of E. huxleyi coccolith length and width from March 2017 revealed overall slightly higher values as compared to those from March 2019. Lower size of E. huxleyi coccoliths was observed during August 2019, following the seasonal calcification variability of the Aegean Sea.

Supplementary Materials

The following supporting information can be downloaded at: https://www.mdpi.com/article/10.3390/geosciences15070268/s1, Table S1: Coccolithophore species list; Table S2: coccolithophore densities and relative abundances; Table S3: Statistical tests; Figure S1: Satellite-derived Chlorophyll-a data in the study areas (obtained from http://disc.sci.gsfc.nasa.gov/techlab/giovanni/, accessed on 5 June 2025).

Author Contributions

Conceptualization, M.V.T., E.S., P.J.F.P. and M.D.D.; methodology, P.J.F.P., E.S. and M.D.D.; software, P.J.F.P. and M.D.D.; validation, A.G., C.P., E.S., D.V., A.P. and E.M.; formal analysis, P.J.F.P. and E.S.; investigation, P.J.F.P., M.V.T., A.G., M.D.D., E.S., C.P. and E.M.; resources, A.G. and M.V.T.; data curation, D.V. and A.P.; writing—original draft preparation, P.J.F.P., E.S., M.V.T., M.D.D. and A.G.; writing—review and editing, P.J.F.P., E.S., M.V.T., M.D.D., A.G., C.P., D.V., A.P. and E.M.; visualization, P.J.F.P., M.V.T., E.S. and M.D.D.; supervision, M.V.T., E.S. and A.G.; project administration, M.V.T.; funding acquisition, A.G. and M.V.T. All authors have read and agreed to the published version of the manuscript.

Funding

This research is partly supported by the Erasmus+ programme of the European Union through the scholarship awarded to Patrick James Penales by the PANGEA consortium (“European Joint Master in Paleontology, Geoconservation, Applications”, 2019–2025; Erasmus Mundus Joint Master’s Degree Project Number—610506-EPP-1-2019-1-FR-EPPKA1-JMD-MOB) for his joint master’s degree education at University of Lille and National and Kapodistrian University of Athens. This research was funded by the Greek National Project CLIMPACT: Flagship Initiative for Climate Change and its Impact by the Hellenic Network of Agencies for Climate Impact Mitigation and Adaptation. We also acknowledge the HCMR sampling campaigns “Winter 2017,” “2MFSD,” and “3MFSD”.

Data Availability Statement

Data supporting the reported results can be found in the Supplementary Materials (Tables S1–S3, Figure S1).

Conflicts of Interest

The authors declare no conflicts of interest.

Abbreviations

The following abbreviations are used in this manuscript:
DWFDense Water Formation
SSTSea Surface Temperature
SSSSea Surface Salinity
BSWBlack Sea Water
LWLevantine Water
LIWLevantine Intermediate Water
AMCAsia Minor Current
CIWCretan Intermediate Water
CDWCretan Deep Water
MAWModified Atlantic Water
TMWTransient Mediterranean Water
HCMRHellenic Centre for Marine Research
EMTEastern Mediterranean Transient
ENSOEl Niño-Southern Oscillation

References

  1. Haidar, A.T.; Thierstein, H.R. Coccolithophore Dynamics off Bermuda (N. Atlantic). Deep-Sea Res. II Top. Stud. Oceanogr. 2001, 48, 1925–1956. [Google Scholar] [CrossRef]
  2. Rost, B.; Riebesell, U. Coccolithophores and the Biological Pump: Responses to Environmental Changes. In Coccolithophores: From Molecular Processes to Global Impact; Thierstein, H.R., Young, J.R., Eds.; Springer: Berlin, Heidelberg, 2004; pp. 99–125. [Google Scholar] [CrossRef]
  3. Westbroek, P.; Brown, C.W.; van Bleijswijk, J.; Brownlee, C.; Brummer, G.J.; Conte, M.; Egge, J.; Fernández, E.; Jordan, R.; Knappertsbusch, M.; et al. A Model System Approach to Biological Climate Forcing. The Example of Emiliania huxleyi. Glob. Planet. Chang. 1993, 8, 27–46. [Google Scholar] [CrossRef]
  4. Dimiza, M.D.; Triantaphyllou, M.V.; Dermitzakis, M.D. Seasonality and Ecology of Living Coccolithophores in Eastern Mediterranean Coastal Environments (Andros Island, Middle Aegean Sea). Micropaleontology 2008, 54, 159–175. [Google Scholar] [CrossRef]
  5. Dimiza, M.D.; Triantaphyllou, M.V.; Malinverno, E.; Psarra, S.; Karatsolis, B.-T.; Mara, P.; Lagaria, A.; Gogou, A. The Composition and Distribution of Living Coccolithophores in the Aegean Sea (NE Mediterranean). Micropaleontology 2015, 61, 521–540. [Google Scholar] [CrossRef]
  6. Ignatiades, L.; Gotsis-Skretas, O.; Pagou, K.; Krasakopoulou, E. Diversification of Phytoplankton Community Structure and Related Parameters along a Large-Scale Longitudinal East-West Transect of the Mediterranean Sea. J. Plankton Res. 2009, 31, 411–428. [Google Scholar] [CrossRef]
  7. Malinverno, E.; Triantaphyllou, M.V.; Stavrakakis, S.; Ziveri, P.; Lykousis, V. Seasonal and Spatial Variability of Coccolithophore Export Production at the South-Western Margin of Crete (Eastern Mediterranean). Mar. Micropaleontol. 2009, 71, 131–147. [Google Scholar] [CrossRef]
  8. Triantaphyllou, M.V.; Ziveri, P.; Tselepides, A. Coccolithophore Export Production and Response to Seasonal Surface Water Variability in the Oligotrophic Cretan Sea (NE Mediterranean). Micropaleontology 2004, 50 (Suppl. 1), 127–144. [Google Scholar] [CrossRef]
  9. Triantaphyllou, M.V.; Dimiza, M.; Krasakopoulou, E.; Malinverno, E.; Lianou, V.; Souvermezoglou, E. Seasonal Variation in Emiliania Huxleyi Coccolith Morphology and Calcification in the Aegean Sea (Eastern Mediterranean). Geobios 2010, 43, 99–110. [Google Scholar] [CrossRef]
  10. Karatsolis, B.-T.; Triantaphyllou, M.V.; Dimiza, M.D.; Malinverno, E.; Lagaria, A.; Mara, P.; Archontikis, O.; Psarra, S. Coccolithophore Assemblage Response to Black Sea Water Inflow into the North Aegean Sea (NE Mediterranean). Cont. Shelf Res. 2017, 149, 138–150. [Google Scholar] [CrossRef]
  11. Varkitzi, I.; Psarra, S.; Assimakopoulou, G.; Pavlidou, A.; Krasakopoulou, E.; Velaoras, D.; Papathanassiou, E.; Pagou, K. Phytoplankton dynamics and bloom formation in the oligotrophic Eastern Mediterranean: Field studies in the Aegean, Levantine and Ionian seas. Deep-Sea Res. II Top. Stud. Oceanogr. 2020, 171, 104662. [Google Scholar] [CrossRef]
  12. Chauhan, N.; Rickaby, R.E.M. Size-Dependent Dynamics of the Internal Carbon Pool Drive Isotopic Vital Effects in Calcifying Phytoplankton. Geochim. Cosmochim. Acta 2024, 373, 35–51. [Google Scholar] [CrossRef]
  13. Bollmann, J.; Herrle, J.O. Morphological Variation of Emiliania huxleyi and Sea Surface Salinity. Earth Planet. Sci. Lett. 2007, 255, 273–288. [Google Scholar] [CrossRef]
  14. Langer, G.; Benner, I. Effect of Elevated Nitrate Concentration on Calcification in Emiliania huxleyi. J. Nannoplankton Res. 2009, 30, 77–80. [Google Scholar] [CrossRef]
  15. Paasche, E. A Review of the Coccolithophorid Emiliania huxleyi (Prymnesiophyceae), with Particular Reference to Growth, Coccolith Formation, and Calcification-Photosynthesis Interactions. Phycologia 2001, 40, 503–529. [Google Scholar] [CrossRef]
  16. Watabe, N.; Wilbur, K.M. Effects of Temperature on Growth, Calcification, and Coccolith Form in Coccolithus huxleyi (Coccolithineae). Limnol. Oceanogr. 1966, 11, 567–575. [Google Scholar] [CrossRef]
  17. Skampa, E.; Triantaphyllou, M.V.; Dimiza, M.D.; Gogou, A.; Malinverno, E.; Stavrakakis, S.; Panagiotopoulos, I.P.; Parinos, C.; Baumann, K.-H. Coupling Plankton—Sediment Trap—Surface Sediment Coccolithophore Regime in the North Aegean Sea (NE Mediterranean). Mar. Micropaleontol. 2019, 152, 101729. [Google Scholar] [CrossRef]
  18. Zervakis, V.; Georgopoulos, D.; Drakopoulos, P.G. The Role of the North Aegean in Triggering the Recent Eastern Mediterranean Climatic Changes. J. Geophys. Res. Oceans 2000, 105, 26103–26116. [Google Scholar] [CrossRef]
  19. Theocharis, A.; Krokos, G.; Velaoras, D.; Korres, G. An Internal Mechanism Driving the Alternation of the Eastern Mediterranean Dense/Deep Water Sources. In The Mediterranean Sea: Temporal Variability and Spatial Patterns; edited by Borzelli, G.L.E., Gaèiæ, M., Lionello, P., Malanotte-Rizzoli, P., Eds.; Geophysical Monograph Series; John Wiley: Oxford, UK, 2014; pp. 113–137. [Google Scholar]
  20. Velaoras, D.; Krokos, G.; Nittis, K.; Theocharis, A. Dense Intermediate Water Outflow from the Cretan Sea: A Salinity Driven, Recurrent Phenomenon, Connected to Thermohaline Circulation Changes. J. Geophys. Res. Oceans 2014, 119, 4797–4820. [Google Scholar] [CrossRef]
  21. Velaoras, D.; Papadopoulos, V.P.; Kontoyiannis, H.; Papageorgiou, D.K.; Pavlidou, A. The Response of the Aegean Sea (Eastern Mediterranean) to the Extreme 2016–2017 Winter. Geophys. Res. Lett. 2017, 44, 9416–9423. [Google Scholar] [CrossRef]
  22. Siokou-Frangou, I.; Christaki, U.; Mazzocchi, M.G.; Montresor, M.; Ribera d’Alcalá, M.; Vaqué, D.; Zingone, A. Plankton in the open Mediterranean Sea: A review. Biogeosciences 2010, 7, 1543–1586. [Google Scholar] [CrossRef]
  23. Kleijne, A. Holococcolithophorids from the Indian ocean, red sea, Mediterranean Sea and north atlantic ocean. Mar. Micropaleontol. 1991, 17, 1–76. [Google Scholar] [CrossRef]
  24. Riebesell, U.; Zondervan, I.; Rost, B.; Tortell, P.D.; Zeebe, R.E.; Morel, F.M. Reduced calcification of marine plankton in response to increased atmospheric CO2. Nature 2000, 407, 364–367. [Google Scholar] [CrossRef]
  25. Van de Waal, D.B.; John, U.; Ziveri, P.; Reichart, G.-J.; Hoins, M.; Sluijs, A.; Rost, B. Ocean Acidification Reduces Growth and Calcification in a Marine Dinoflagellate. PLoS ONE 2013, 8, e65987. [Google Scholar] [CrossRef]
  26. Krasakopoulou, E.; Souvermezoglou, E.; Giannoudi, L.; Goyet, C. Carbonate System Parameters and Anthropogenic CO2 in the North Aegean Sea during October 2013. Cont. Shelf Res. 2017, 149, 69–81. [Google Scholar] [CrossRef]
  27. Lykousis, V.; Chronis, G.; Tselepides, A.; Price, N.B.; Theocharis, A.; Siokou-Frangou, I.; Van Wambeke, F.; Danovaro, R.; Stavrakakis, S.; Duineveld, G.; et al. Major Outputs of the Recent Multidisciplinary Biogeochemical Researches Undertaken in the Aegean Sea. J. Mar. Syst. 2002, 33–34, 313–334. [Google Scholar] [CrossRef]
  28. Theocharis, A.; Balopoulos, E.; Kioroglou, S.; Kontoyiannis, H.; Iona, A. A Synthesis of the Circulation and Hydrography of the South Aegean Sea and the Straits of the Cretan Arc (March 1994–January 1995). Prog. Oceanogr. 1999, 44, 469–509. [Google Scholar] [CrossRef]
  29. Zervakis, V.; Theocharis, A.; Georgopoulos, D. Circulation and Hydrography of the Open Seas. In State of the Hellenic Marine Environment; Papathanassiou, E., Zenetos, A., Eds.; HCMR Publications: Athens, Greece, 2005; pp. 104–110. [Google Scholar]
  30. Souvermezoglou, Ε.; Krasakopoulou, Ε.; Pavlidou, A. Temporal and Spatial Variability of Nutrients and Oxygen in the North Aegean Sea during the Last Thirty Years. Mediterr. Mar. Sci. 2014, 15, 805–822. [Google Scholar] [CrossRef]
  31. Georgopoulos, D.; Chronis, G.; Zervakis, V.; Lykousis, V.; Poulos, S.; Iona, A. Hydrology and circulation in the southern Cretan Sea during the CINCS experiment (May 1994–September 1995). Prog. Oceanogr. 2000, 46, 89–112. [Google Scholar] [CrossRef]
  32. Psarra, S.; Tselepides, A.; Ignatiades, L. Primary Productivity in the Oligotrophic Cretan Sea (NE Mediterranean): Seasonal and Interannual Variability. Prog. Oceanogr. 2000, 46, 187–204. [Google Scholar] [CrossRef]
  33. Souvermezoglou, E.; Krasakopoulou, E.; Pavlidou, A. Temporal variability in oxygen and nutrients concentrations in the southern Aegean Sea and the straits of the Cretan Arc. Prog. Oceanogr. 1999, 44, 573–600. [Google Scholar] [CrossRef]
  34. Tselepides, A.A.; Zervakis, V.; Polychronaki, T.; Danovaro, R.; Chronis, G. Distribution of nutrients and particulate organic matter in relation to the prevailing hydrographic features of the Cretan Sea (NE Mediterranean). Prog. Oceanogr. 2000, 46, 113–142. [Google Scholar] [CrossRef]
  35. Stavrakakis, S.; Chronis, G.; Tselepides, A.; Heussner, S.; Monaco, A.; Abassi, A. Downward Fluxes of Settling Particles in the Deep Cretan Sea (NE Mediterranean). Prog. Oceanogr. 2000, 46, 217–240. [Google Scholar] [CrossRef]
  36. Ignatiades, L.; Psarra, S.; Zervakis, V.; Pagou, K.; Souvermezoglou, E.; Assimakopoulou, G.; Gotsis-Skretas, O. Phytoplankton size-based dynamics in the Aegean Sea (Eastern Mediterranean). J. Mar. Syst. 2002, 36, 11–28. [Google Scholar] [CrossRef]
  37. Jordan, R.W.; Winter, A. Assemblages of Coccolithophorids and Other Living Microplankton off the Coast of Puerto Rico during January–May 1995. Mar. Micropaleontol. 2000, 39, 113–130. [Google Scholar] [CrossRef]
  38. Young, J.R.; Geisen, M.; Cros, L.; Kleijne, A.; Probert, I.; Østergaard, J.B. A Guide to Extant Coccolithophore Taxonomy. J. Nannoplankton Res. 2003, S1, 1–132. [Google Scholar] [CrossRef]
  39. Young, J.R.; Bown, P.R.; Lees, J.A.; Nannotax3 website. International Nannoplankton Association. Available online: www.mikrotax.org/Nannotax3 (accessed on 12 July 2024).
  40. Hammer, Ø.; Harper, D.A.T.; Ryan, P.D. PAST: Paleontological Statistics Software Package for Education and Data Analysis. Palaeontol. Electron. 2001, 4, 9. [Google Scholar]
  41. Young, J.R.; Poulton, A.J.; Tyrrell, T. Morphology of Emiliania Huxleyi Coccoliths on the Northwestern European Shelf—Is There an Influence of Carbonate Chemistry? Biogeosciences 2014, 11, 4771–4782. [Google Scholar] [CrossRef]
  42. Young, J.R.; Kucera, M.; Chung, H.-W. Automated Biometrics on Captured Light Microscope Images of Coccoliths of Emiliania huxleyi. In Microfossils and Oceanic Environments; University of Wales, Aberystwyth Press: Aberystwyth, UK, 1996; pp. 261–277. [Google Scholar]
  43. Acker, J.G.; Leptoukh, G. Online analysis enhances use of NASA earth science data. Eos Trans. Am. Geophys. Union 2007, 88, 14–17. [Google Scholar] [CrossRef]
  44. Young, J.R. Variation in Emiliania huxleyi coccolith morphology in samples from the Norwegian EHUX experiment, 1992. Sarsia 1994, 79, 417–425. [Google Scholar] [CrossRef]
  45. Addante, M.; Grelaud, M.; Langer, G.; Maiorano, P.; Bonomo, S.; Álvarez, M.; Johnson, R.; Ziveri, P. Local Hydrodynamic in Coastal System Affects the Coccolithophore Community at a Short Spatial Scale. Mar. Micropaleontol. 2023, 185, 102309. [Google Scholar] [CrossRef]
  46. Cerino, F.; Malinverno, E.; Fornasaro, D.; Kralj, M.; Cabrini, M. Coccolithophore Diversity and Dynamics at a Coastal Site in the Gulf of Trieste (Northern Adriatic Sea). Estuar. Coast. Shelf Sci. 2017, 196, 331–345. [Google Scholar] [CrossRef]
  47. Cros Miguel, L. Planktonic Coccolithophores of the NW Mediterranean. Ph.D. Thesis, Universitat de Barcelona, Barcelona, Spain, 2002. [Google Scholar]
  48. Bonomo, S.; Placenti, F.; Quinci, E.M.; Cuttitta, A.; Genovese, S.; Mazzola, S.; Bonanno, A. Living Coccolithophores Community from Southern Tyrrhenian Sea (Central Mediterranean—Summer 2009). Mar. Micropaleontol. 2017, 131, 10–24. [Google Scholar] [CrossRef]
  49. Knappertsbusch, M. Geographic Distribution of Living and Holocene Coccolithophores in the Mediterranean Sea. Mar. Micropaleontol. 1993, 21, 219–247. [Google Scholar] [CrossRef]
  50. Skejić, S.; Arapov, J.; Kovačević, V.; Bužančić, M.; Bensi, M.; Giani, M.; Bakrač, A.; Mihanović, H.; Gladan, Ž.N.; Urbini, L.; et al. Coccolithophore Diversity in Open Waters of the Middle Adriatic Sea in Pre- and Post-Winter Periods. Mar. Micropaleontol. 2018, 143, 30–45. [Google Scholar] [CrossRef]
  51. Godrijan, J.; Young, J.R.; Marić Pfannkuchen, D.; Precali, R.; Pfannkuchen, M. Coastal Zones as Important Habitats of Coccolithophores: A Study of Species Diversity, Succession, and Life-cycle Phases. Limnol. Oceanogr. 2018, 63, 1692–1710. [Google Scholar] [CrossRef]
  52. Kleijne, A. Morphology, Taxonomy and Distribution of Extant Coccolithophorids (Calcareous Nannoplankton); Drukkerij FEBO BV: Amsterdam, The Netherlands, 1993. [Google Scholar]
  53. Andruleit, H.; Rogalla, U. Coccolithophores in Surface Sediments of the Arabian Sea in Relation to Environmental Gradients in Surface Waters. Mar. Geol. 2002, 186, 505–526. [Google Scholar] [CrossRef]
  54. Keuter, S.; Koplovitz, G.; Torfstein, A.; Frada, M.J. Two-Year Seasonality (2017, 2018), Export and Long-Term Changes in Coccolithophore Communities in the Subtropical Ecosystem of the Gulf of Aqaba, Red Sea. Deep-Sea Res. I Oceanogr. Res. Pap. 2023, 191, 103919. [Google Scholar] [CrossRef]
  55. Winter, A.; Rost, B.; Hilbrecht, H.; Elbrächter, M. Vertical and horizontal distribution of coccolithophores in the Caribbean Sea. Geo-Mar. Lett. 2002, 22, 150–161. [Google Scholar] [CrossRef]
  56. Gotsis-Skretas, O.; Pagou, K.; Moraitou-Apostolopoulou, M.; Ignatiades, L. Seasonal horizontal and vertical variability in primary production and standing stocks of phytoplankton and zooplankton in the Cretan Sea and the Straits of the Cretan Arc (March 1994–January 1995). Prog. Oceanogr. 1999, 44, 625–649. [Google Scholar] [CrossRef]
  57. D’Amario, B.; Ziveri, P.; Grelaud, M.; Oviedo, A.; Kralj, M. Coccolithophore Haploid and Diploid Distribution Patterns in the Mediterranean Sea: Can a Haplo-Diploid Life Cycle Be Advantageous under Climate Change? J. Plankton Res. 2017, 39, 781–794. [Google Scholar] [CrossRef]
  58. Keuter, S.; Silverman, J.; Krom, M.D.; Sisma-Ventura, G.; Yu, J.; Tsemel, A.; Ben-Ezra, T.; Sher, D.; Reich, T.; Koplovitz, G.; et al. Seasonal Patterns of Coccolithophores in the Ultra-Oligotrophic South-East Levantine Basin, Eastern Mediterranean Sea. Mar. Micropaleontol. 2022, 175, 102153. [Google Scholar] [CrossRef]
  59. Jordan, R.W.; Abe, K.; Cruz, J.; Eriksen, R.; Guerreiro, C.; Hagino, K.; Heldal, M.; Hernández-Becerril, D.U.; Malinverno, E.; Nishida, S.; et al. Observations on the Morphological Diversity and Distribution of Two Siliceous Nannoplankton Genera, Hyalolithus and Petasaria. Micropaleontology 2015, 61, 439–455. [Google Scholar] [CrossRef]
  60. Patil, S.; Mohan, R.; Shetye, S.; Gazi, S.; Jafar, S.A. Prymnesium neolepis (Prymnesiaceae), a Siliceous Haptophyte from the Southern Indian Ocean. Micropaleontology 2014, 60, 475–481. [Google Scholar] [CrossRef]
  61. Yoshida, M.; Noël, M.-H.; Nakayama, T.; Naganuma, T.; Inouye, I. A Haptophyte Bearing Siliceous Scales: Ultrastructure and Phylogenetic Position of Hyalolithus neolepis Gen. et Sp. Nov. (Prymnesiophyceae, Haptophyta). Protist 2006, 157, 213–234. [Google Scholar] [CrossRef]
  62. Di Stefano, E.; Incarbona, A.; Bonomo, S.; Pelosi, N. Coccolithophores in Water Samples and Fossil Assemblages in Sedimentary Archives of the Mediterranean Sea: A Review. In New Oceanography Research Developments; Nova Science Publishers: New York, NY, USA, 2009; pp. 127–162. [Google Scholar]
  63. Bonomo, S.; Grelaud, M.; Incarbona, A.; Malinverno, E.; Placenti, F.; Bonanno, A.; Di Stefano, E.; Patti, B.; Sprovieri, M.; Genovese, S.; et al. Living Coccolithophores from the Gulf of Sirte (Southern Mediterranean Sea) during the Summer of 2008. Micropaleontology 2012, 58, 487–503. [Google Scholar] [CrossRef]
  64. Oviedo, A.; Ziveri, P.; Álvarez, M.; Tanhua, T. Is Coccolithophore Distribution in the Mediterranean Sea Related to Seawater Carbonate Chemistry? Ocean Sci. 2015, 11, 13–32. [Google Scholar] [CrossRef]
  65. Kambezidis, H.D. Atmospheric Processes over the Broader Mediterranean Region: Effect of the El Niño–Southern Oscillation? Atmosphere 2024, 15, 268. [Google Scholar] [CrossRef]
  66. National Ocean Service. Available online: https://origin.cpc.ncep.noaa.gov/products/analysis_monitoring/ensostuff/ONI_v5.php (accessed on 5 June 2025).
  67. Liu, H.; Sun, J.; Wang, D.; Yun, M.; Narale, D.D.; Zhang, D.; Zhang, X.; Thangaraj, S. IOD-ENSO interaction with natural coccolithophore assemblages in the tropical eastern Indian Ocean. Prog. Oceanogr. 2021, 193, 102545. [Google Scholar] [CrossRef]
  68. Patoucheas, P.; Koukousioura, O.; Psarra, S.; Aligizaki, K.; Dimiza, M.D.; Skampa, E.; Michailidis, I.; Nomikou, P.; Triantaphyllou, M.V. Phytoplankton Community Structure Changes during Autumn and Spring in Response to Environmental Variables in Methana, Saronikos Gulf, Greece. Environ. Sci. Pollut. Res. 2021, 28, 33854–33865. [Google Scholar] [CrossRef]
  69. Nikolopoulou, I.; Skampa, E.; Varkitzi, I.; Dimiza, M.D.; Parinos, C.; Kambouri, G.; Stavrakaki, I.; Gogou, A.; Triantaphyllou, M.V. The Contribution of Siliceous Plankton to Vertical Export Flux in the Eastern Mediterranean: A Comparative Study of the North Aegean, Cretan, and Ionian Seas. J. Mar. Sci. Eng. 2024, 12, 2084. [Google Scholar] [CrossRef]
  70. Karageorgis, A.P.; Georgopoulos, D.; Kanellopoulos, T.D.; Mikkelsen, O.A.; Pagou, K.; Kontoyiannis, H.; Pavlidou, A.; Anagnostou, C. Spatial and seasonal variability of particulate matter optical and size properties in the Eastern Mediterranean. Sea. J. Mar. Syst. 2012, 105, 123–134. [Google Scholar] [CrossRef]
  71. Malviya, S.; Scalco, E.; Audic, S.; Vincent, F.; Veluchamy, A.; Poulain, J.; Wincker, P.; Ludicone, D.; de Vargas, C.; Bittner, L.; et al. Insights into global diatom distribution and diversity in the world’s ocean. Proc. Natl. Acad. Sci. USA 2016, 113, E1516–E1525. [Google Scholar] [CrossRef] [PubMed]
  72. Varkitzi, I.; Markogianni, V.; Pantazi, M.; Pagou, K.; Pavlidou, A.; Dimitriou, E. Effect of river inputs on environmental status and potentially harmful phytoplankton in a coastal area of eastern Mediterranean (Maliakos Gulf, Greece). Mediterr. Mar. Sci. 2018, 19, 326–343. [Google Scholar] [CrossRef]
  73. Margalef, R. Temporal Succession and Spatial Heterogeneity in Phytoplankton. In Perspectives in Marine Biology; University of California Press: Oakland, CA, USA, 1958; pp. 323–350. [Google Scholar] [CrossRef]
  74. Lagaria, A.; Mandalakis, M.; Mara, P.; Papageorgiou, N.; Pitta, P.; Tsiola, A.; Kagiorgi, M.; Psarra, S. Phytoplankton Response to Saharan Dust Depositions in the Eastern Mediterranean Sea: A Mesocosm Study. Front. Mar. Sci. 2017, 3, 287. [Google Scholar] [CrossRef]
  75. Broerse, A.T.C.; Brummer, G.-J.A.; Hinte, J.E.V. Coccolithophore Export Production in Response to Monsoonal Upwelling off Somalia (Northwestern Indian Ocean). Deep-Sea Res. II Top. Stud. Oceanogr. 2000, 47, 2179–2205. [Google Scholar] [CrossRef]
  76. Berry, L.; Taylor, A.R.; Lucken, U.; Ryan, K.P.; Brownlee, C. Calcification and Inorganic Carbon Acquisition in Coccolithophores. Funct. Plant Biol. 2002, 29, 289–299. [Google Scholar] [CrossRef] [PubMed]
  77. Bach, L.T.; Bauke, C.; Meier, K.J.S.; Riebesell, U.; Schulz, K.G. Influence of Changing Carbonate Chemistry on Morphology and Weight of Coccoliths Formed by Emiliania Huxleyi. Biogeosciences 2012, 9, 3449–3463. [Google Scholar] [CrossRef]
  78. Kawahata, H.; Fujita, K.; Iguchi, A.; Inoue, M.; Iwasaki, S.; Kuroyanagi, A.; Maeda, A.; Manaka, T.; Moriya, K.; Takagi, H.; et al. Perspective on the Response of Marine Calcifiers to Global Warming and Ocean Acidification—Behavior of Corals and Foraminifera in a High CO2 World “Hot House”. Prog. Earth Planet. Sci. 2019, 6, 5. [Google Scholar] [CrossRef]
  79. Langer, G.; Nehrke, G.; Probert, I.; Ly, J.; Ziveri, P. Strain-Specific Responses of Emiliania huxleyi to Changing Seawater Carbonate Chemistry. Biogeosciences 2009, 6, 2637–2646. [Google Scholar] [CrossRef]
  80. Vázquez, V.; León, P.; Gordillo, F.J.L.; Jiménez, C.; Concepción, I.; Mackenzie, K.; Bresnan, E.; Segovia, M. High-CO2 Levels Rather than Acidification Restrict Emiliania huxleyi Growth and Performance. Microb. Ecol. 2023, 86, 127–143. [Google Scholar] [CrossRef]
  81. D’Amario, B.; Pérez, C.; Grelaud, M.; Pitta, P.; Krasakopoulou, E.; Ziveri, P. Coccolithophore Community Response to Ocean Acidification and Warming in the Eastern Mediterranean Sea: Results from a Mesocosm Experiment. Sci. Rep. 2020, 10, 12637. [Google Scholar] [CrossRef] [PubMed]
  82. Sheward, R.M.; Poulton, A.J.; Young, J.R.; de Vries, J.; Monteiro, F.M.; Herrle, J.O. Cellular Morphological Trait Dataset for Extant Coccolithophores from the Atlantic Ocean. Sci. Data 2024, 11, 720. [Google Scholar] [CrossRef]
  83. Okada, H.; Honjo, S. Distribution of Coccolithophores in Marginal Seas along the Western Pacific Ocean and in the Red Sea. Mar. Biol. 1975, 31, 271–285. [Google Scholar] [CrossRef]
  84. Båtvik, H.; Heimdal, B.R.; Fagerbakke, K.M.; Green, J.C. Effects of Unbalanced Nutrient Regime on Coccolith Morphology and Size in Emiliania huxleyi (Prymnesiophyceae). Eur. J. Phycol. 1997, 32, 155–165. [Google Scholar] [CrossRef]
  85. Langer, G.; Jie, V.W.; Kottmeier, D.; Flori, S.; Sturm, D.; de Vries, J.; Harper, G.M.; Brownlee, C.; Wheeler, G. Distinct Physiological Responses of Coccolithus braarudii Life Cycle Phases to Light Intensity and Nutrient Availability. Eur. J. Phycol. 2022, 58, 58–71. [Google Scholar] [CrossRef]
  86. Nimer, N.A.; Merrett, M.J. Calcification Rate in Emiliania Huxleyi Lohmann in Response to Light, Nitrate and Availability of Inorganic Carbon. New Phytol. 1993, 123, 673–677. [Google Scholar] [CrossRef]
  87. Johns, C.T.; Grubb, A.R.; Nissimov, J.I.; Natale, F.; Knapp, V.; Mui, A.; Fredricks, H.F.; Van Mooy, B.A.S.; Bidle, K.D. The mutual interplay between calcification and coccolithovirus infection. Environ. Microbiol. 2019, 21, 1896–1915. [Google Scholar] [CrossRef]
  88. Wilson, H.H.; Tarran, G.A.; Schroeder, D.; Cox, M.; Oke, J.; Malin, G. Isolation of viruses responsible for the demise of an Emiliania huxleyi bloom in the English Channel. J. Mar. Biol. Assoc. UK 2002, 82, 369–377. [Google Scholar] [CrossRef]
  89. Sreeush, M.G.; Rajendran, S.; Valsala, V.; Pentakota, S.; Prasad, K.V.S.R.; Murtugudde, R. Variability, Trend and Controlling Factors of Ocean Acidification over Western Arabian Sea Upwelling Region. Mar. Chem. 2019, 209, 14–24. [Google Scholar] [CrossRef]
  90. Buchanan, P.J.; Aumont, O.; Bopp, L.; Mahaffey, C.; Tagliabue, A. Impact of Intensifying Nitrogen Limitation on Ocean Net Primary Production Is Fingerprinted by Nitrogen Isotopes. Nat. Commun. 2021, 12, 6214. [Google Scholar] [CrossRef]
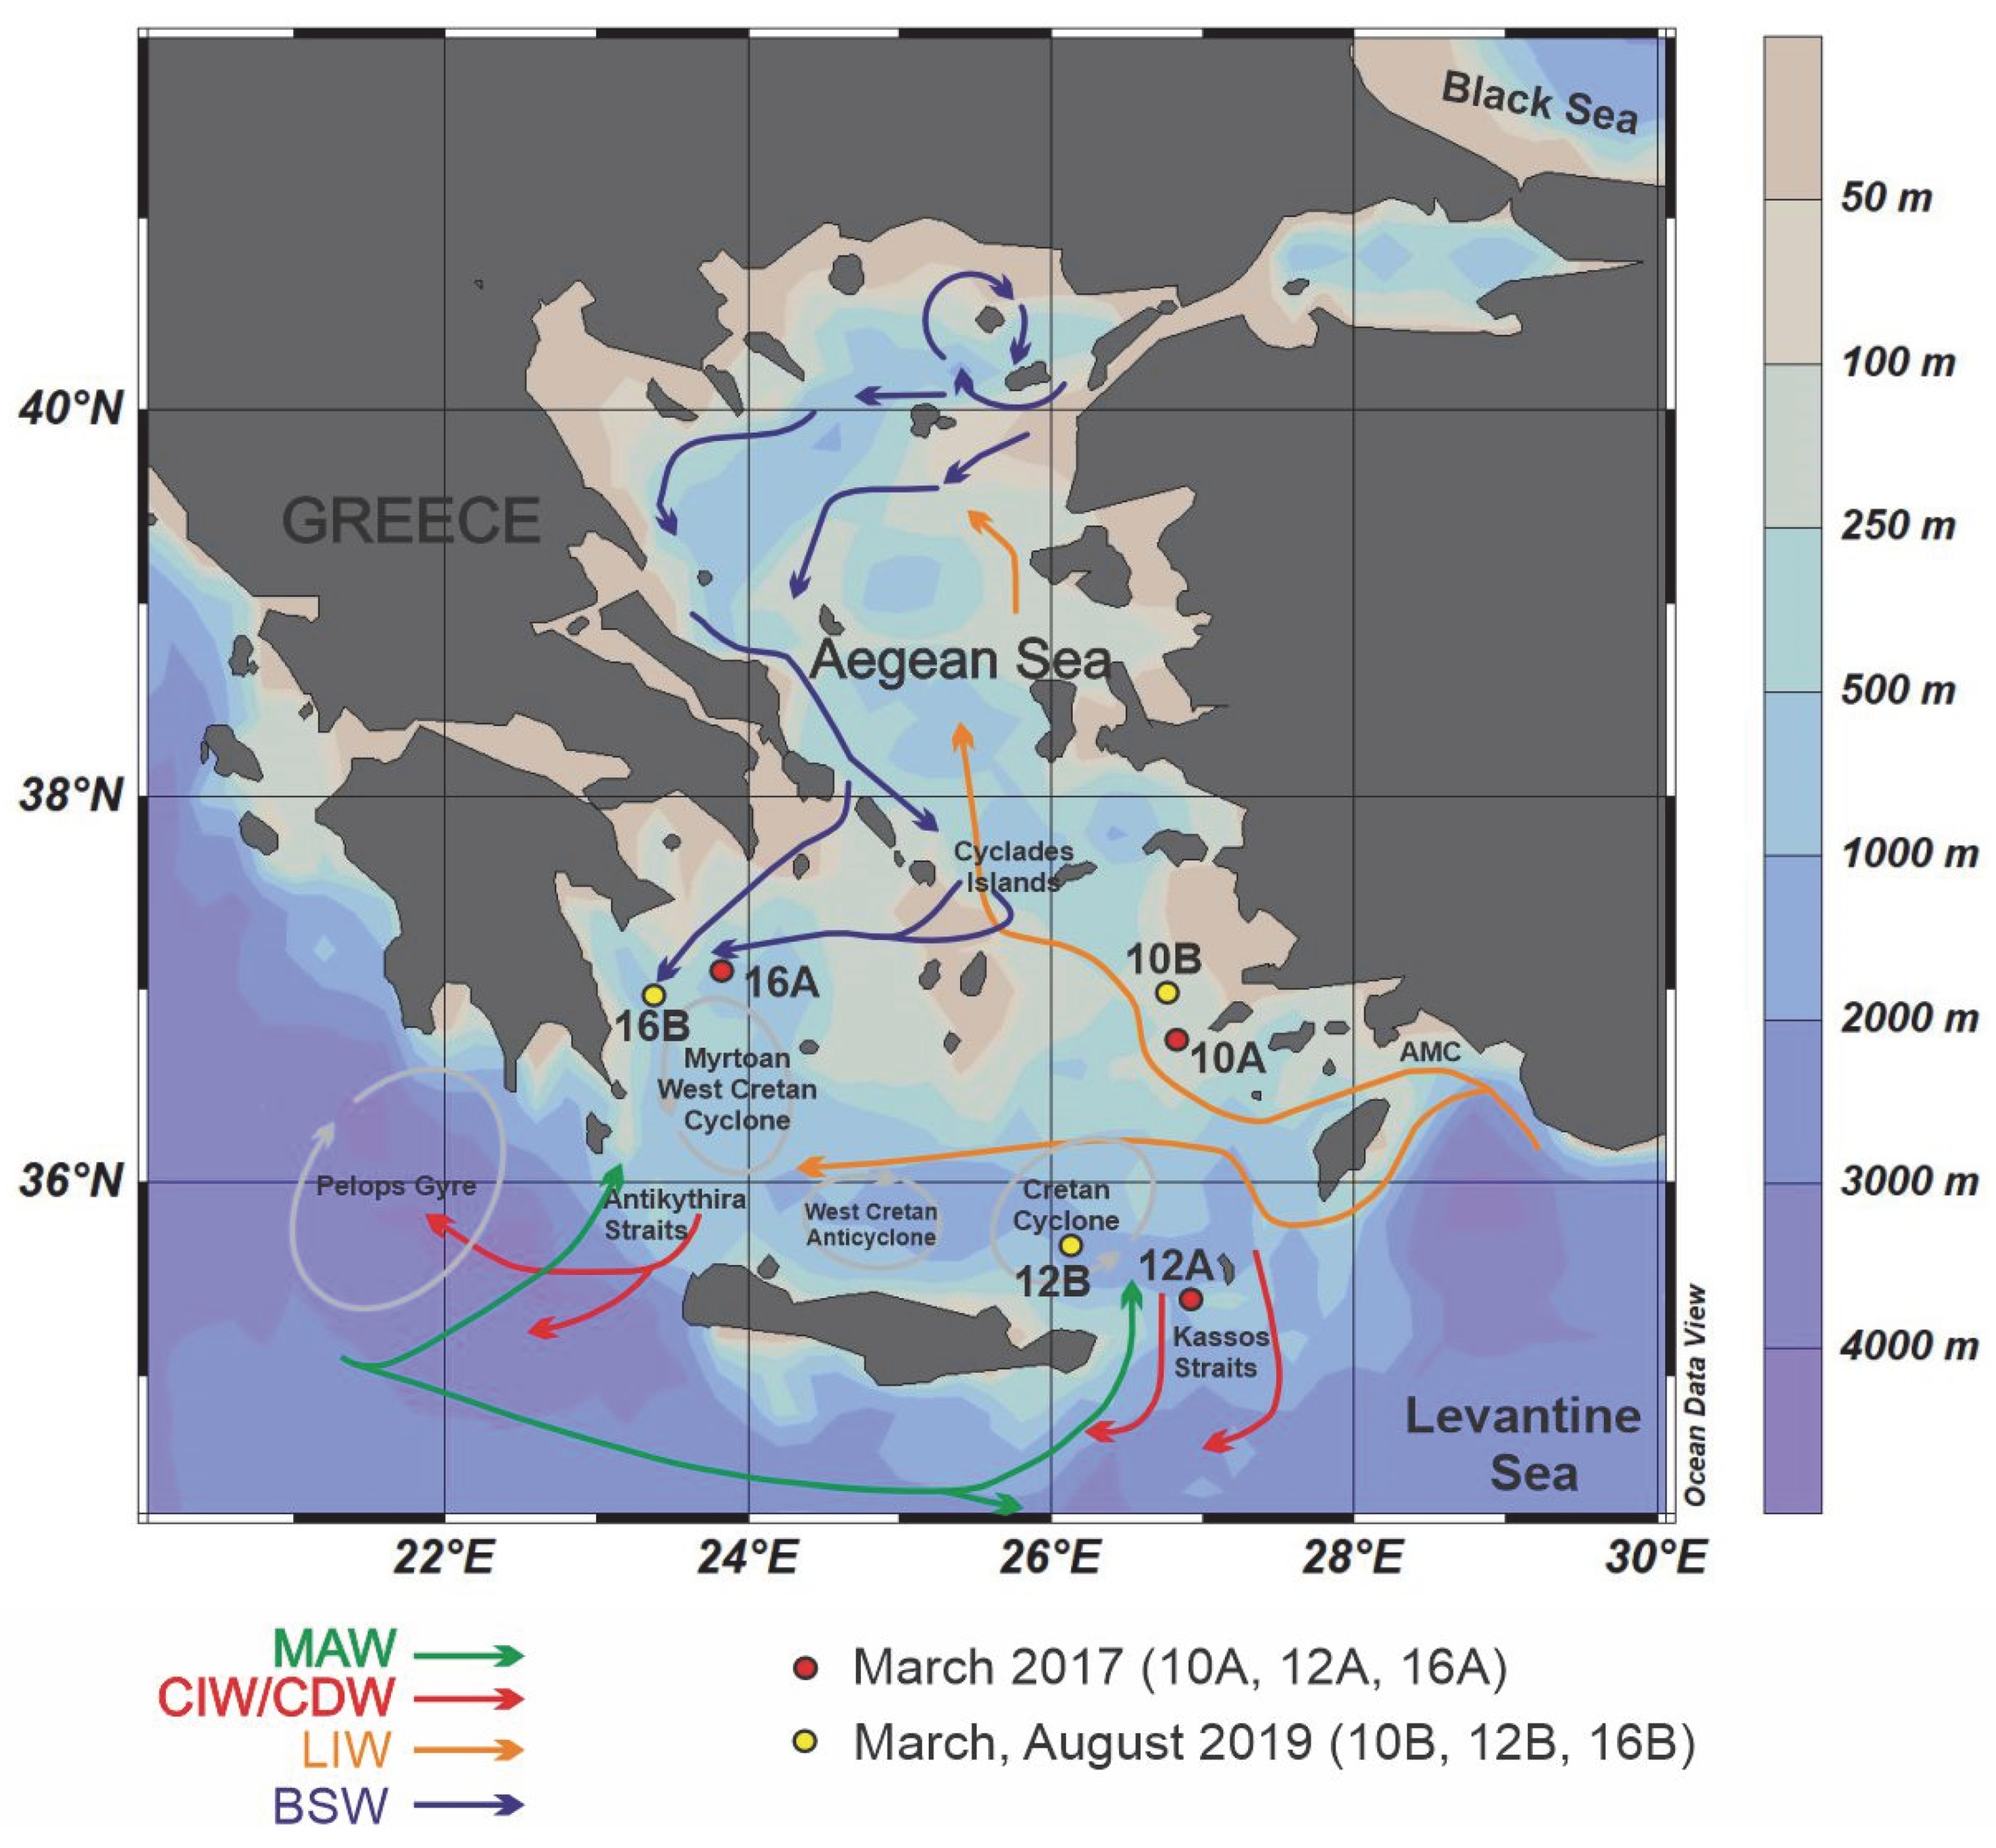
Figure 1. Bathymetric map of the Aegean Sea with the locations of studied stations and the general water mass circulation pattern (BSW: Black Sea Water, LIW: Levantine Intermediate Water, CIW: Cretan Intermediate Water, CDW: Cretan Deep Water, MAW: Modified Atlantic Water).
Geosciences 15 00268 g001
Figure 2. (a) Coccolithophore species of March 2017 sampling: 18. etched/undercalcified Emiliania huxleyi, 9. Syracosphaera molischii, 10. Umbilicosphaera sibogae, 11. Calcidiscus leptoporus, 12. Rhabdosphaera clavigera, 13. Syracosphaera pulchra, 14. Hyalolithus neolepis, 15. Silicoflagelate Dictyocha stapedia (double skeleton), 1620. Diatom Chaetoceros sp. (b) Coccolithophore species of March 2019 sampling: 14. Emiliania huxleyi, 56. etched/undercalcified E. huxleyi, 7. Acanthoica quattrospina, 8. Umbilicosphaera sibogae, 9. Michaelsarsia elegans, 10. Syracosphaera mediterranea, 11. Calciosolenia sp., 12. Helicosphaera pavimentum HOL dalmaticus type. (c) Coccolithophore species of August 2019 sampling: 13. Emiliania huxleyi, 4. Syracosphaera pulchra HOL oblonga type, 5. Rhabdosphaera clavigera, 6. Florisphaera profunda, 7. Syracosphaera nodosa, 8. Syracosphaera azureaplaneta, 9. Hyalolithus neolepis, 10. Gliscolithus amitakareniae, 11. Syracosphaera mediterranea HOL wettsteinii type 12. Syracosphaera pulchra HOL pirus type.
Geosciences 15 00268 g002aGeosciences 15 00268 g002b
Figure 3. Densities (coccospheres L−1) of the total coccolithophore assemblages and the dominant coccolithophore taxa during winter 2017 (17W), winter 2019 (19W), and summer 2019 (19S) from the upper and lower photic zones of stations 10, 12, and 16.
Geosciences 15 00268 g003
Figure 4. Species richness (S), Shannon–Wiener diversity index (H′), and dominance (D) for the sampling stations.
Geosciences 15 00268 g004
Figure 5. Relative abundances of the major coccolithophore species from the upper and lower photic zones of stations 10, 12, and 16.
Geosciences 15 00268 g005
Figure 6. Q-mode hierarchical cluster dendrogram of coccolithophore assemblages.
Geosciences 15 00268 g006
Figure 7. R-mode hierarchical cluster dendrogram in coccolithophore assemblages.
Geosciences 15 00268 g007
Figure 8. Canonical correspondence analysis (CCA) diagram showing coccolithophore taxa (red circular points) and environmental variables (blue arrows). Sample scores are plotted as square points.
Geosciences 15 00268 g008
Figure 9. Error bar charts of 95% confidence intervals of E. huxleyi coccolith length and width during the various sampling intervals.
Geosciences 15 00268 g009
Table 1. Stations, sampling details, and environmental parameters. For the locations of the stations, see Figure 1.
Station NumberSampling CodeLatitude (°N)Longitude (°E)Sampling PeriodWater Depth (m)Temperature (°C)Salinity (psu)NO3 + NO2
(μmol/L)
SiO4
(μmol/L)
PO4
(μmol/L)
10A17W10U36°33′27.72″26°42′17.28″March 20172, 10 16.3239.160.531.670.02
17W10L50, 7516.1539.160.701.560.01
12A17W12U35°15′17.64″26°40′19.56″March 20172, 10 16.4939.140.541.410.01
17W12L50, 7516.1539.150.581.290.02
16A17W16U36°58′48″23°57′36″March 20172, 1015.6739.100.070.360.04
17W16L50, 7515.2239.031.021.210.01
10B19W10U37°0′32.4”26°37′15.6”March 201920 17.3339.370.5571.0490.01
19W10L7517.3339.370.5930.9420.01
12B19W12U35°45′10.8″26°13′40.8″March 201920 17.339.360.4741.3070.01
19W12L7517.2539.380.9291.3080.01
16B19W16U36°48′18″23°27′54″March 201920 15.5939.170.2771.5220.01
19W16L7515.3639.141.1201.6010.01
10B19S10U37°0′32.4″26°37′15.6″August 201920 21.2139.120.010.670.01
19S10L7517.7339.240.010.640.01
12B19S12U35°45′10.8″26°13′40.8″August 201920 22.1339.320.010.7980.01
19S12L751739.270.620.960.01
16B19S16U36°48′18″23°27′54″August 201920 25.8438.980.011.100.01
19S16L7516.8939.150.010.720.01
Table 2. Matrix of Spearman’s rho correlation coefficients for coccolithophore species and environmental parameters. Colors are after the coccolithophore assemblage groups produced by the R-mode hierarchical cluster dendrogram (see Figure 7).
TSNO3 + NO2PO4SiO4
E. huxleyi−0.2230.3760.3390.1080.379
E. huxleyi etched/undercalcified−0.669−0.3800.5570.6760.675
S. molischii−0.0360.3330.060−0.3310.113
H. pavimentum HOL0.0090.387−0.193−0.2710.043
C. leptoporus−0.421−0.2550.2340.4470.154
U. sibogae−0.310−0.1200.2640.2550.245
H. cornifera0.634−0.012−0.724−0.367−0.665
S. arethusae HOL0.7340.083−0.649−0.456−0.759
H. carteri HOL0.4520.086−0.535−0.271−0.387
A. robusta HOL0.6040.100−0.535−0.271−0.405
R. clavigera0.589−0.119−0.704−0.041−0.446
S. pulchra0.392−0.028−0.451−0.136−0.437
C. heimdaliae0.4540.223−0.426−0.216−0.422
G. amitakareniae0.5390.100−0.535−0.271−0.571
S. mediterranea HOL0.4300.223−0.426−0.216−0.445
S. pulchra HOL0.4770.038−0.632−0.320−0.661
C. brasiliensis0.6170.328−0.390−0.590−0.696
S. histrica0.3310.261−0.382−0.486−0.392
R. xiphos0.6560.414−0.735−0.546−0.662
S. halldalii0.3800.575−0.278−0.500−0.427
C. murrayi0.157−0.1180.156−0.149−0.207
P. crosiae0.142−0.171−0.085−0.216−0.359
A. robusta0.099−0.254−0.299−0.320−0.331
Values in bold: correlation is significant at the 0.05 level (2-tailed).Values in bold and italic: correlation is significant at the 0.01 level (2-tailed).
Disclaimer/Publisher’s Note: The statements, opinions and data contained in all publications are solely those of the individual author(s) and contributor(s) and not of MDPI and/or the editor(s). MDPI and/or the editor(s) disclaim responsibility for any injury to people or property resulting from any ideas, methods, instructions or products referred to in the content.