1. Introduction
Urban coastal areas have witnessed increased infrastructure development, industrial, and mining activities in recent decades. Consequently, there is a growing need to prevent potential environmental and engineering hazards [
1,
2,
3,
4,
5]. Due to limited space in urban environments, the expansion in coastal areas includes projects such as the renovation and expansion of ports and marinas, as well as the construction of seawalls and breakwaters to protect communities from storm surges and erosion. As a result, many cities around the world have been expanded into vulnerable coastal sites, where a range of both environmental and geological hazards occur [
6]. Bearing this in mind, we try to reduce the risk of exposing populations to coastal hazards and enhance the planning and preliminary investigation to avoid project delays, economic losses and costs in construction projects [
7].
The primary objective of coastal projects is to provide reliable and efficient infrastructure and industrial activities to support the growth of these areas. Therefore, a multi-level exploration and research approach should be applied on a regional scale while focusing on local scale hazard management in coastal zones. On a larger scale, geo-engineers commonly address climate-related challenges such as the impact of sea level rise, sea water intrusion, shoreline erosion mainly caused by human activity, and landslides [
8,
9,
10,
11]. From an engineering geological point of view, a thorough smaller-scale geophysical investigation of coastal environments is required to determine subsurface soil, identify lithostratigraphy, bedrock depth, weakness zones and anthropogenic buried features, thus enhancing prevention and design to facilitate urban coastal planning strategy [
12,
13,
14,
15]. This geo-environmental setting may cause a series of adverse effects, including challenges for travel infrastructure, port facilities, bridges, and road pavements, as well as the subsidence of buildings in coastal zones. These disastrous consequences may be due to soil liquefaction in susceptible soil deposits (sandy, silty, and gravelly soils) created by torrential, colluvial, and human-made deposits. Additionally, they are also connected to expansive soils and their shrinking and swelling properties according to the season. Sea level rise and sea water intrusion have proven to be dominant in the corrosion of marine and coastal underground infrastructure [
6] related to gas, water and energy (e.g., pipes, cables, and systems).
In some landslide cases [
16,
17], it is stated that it is critical to identify water intrusion and pathways to better understand landslide dynamics and hydro-geological conditions of unstable slopes. The use of geophysical methods that study landslide structure and dynamics, slip surfaces and bedrock depth related to fluid circulation, which usually play a key role in triggering movement, have been shown to be successful.
In an attempt to mitigate the exposure of coastal areas to hazards, the implementation of various geophysical methods can provide 2D and 3D models of the subsurface as well as integrated information from both geotechnical and lithological perspectives [
13]. The general conditions in the coastal environment establish sufficient contrast in physical parameters, such as electrical conductivity, seismic velocity, density, and susceptibility. These contrasts enable successful application of geophysical methods, in particular for detecting anthropogenic features. The most commonly used geophysical methods can be divided into two main categories, those in which conductivity (with its electrolytic character) is the main parameter and thus the penetration of salt water plays an important role [
18], and others (seismic, magnetics, gravitometry).
The electromagnetic induction method (FDEM) has proven to be a fast and low-cost geophysical method, enabling large areas to be covered. This method can be used to address both geological and hydro-geological issues, including mapping of saltwater intrusions, soil characterization and infiltration, and detection of buried anthropogenic features [
19,
20,
21,
22,
23,
24,
25,
26].
Along the same lines, another electromagnetic method, ground penetrating radar (GPR), is also effective and economically beneficial in surveying areas of great expanse. Although GPR may display certain weaknesses in fully achieving depth penetration and target classification due to the conductive environment, it has shown great results in detecting subsurface coastal infrastructure utilities and in mapping the boundaries of alluvial deposits, erosional surfaces, and anthropogenic deposits or structures [
27,
28,
29,
30,
31,
32,
33].
Moreover, the implementation of additional geophysical methods is necessary, as these techniques have limitations in coastal environments due to the attenuation of electromagnetic signals [
24]. Electrical resistivity tomography (ERT) can contribute to the detailed mapping of the course and lateral geological heterogeneities and can also determine hydrogeological parameters. In particular, ERT can map litho-stratigraphy, subsurface structures and top of bedrock, image sea water intrusion and its pathways, and identify mixing zones of seawater and groundwater aquifers [
33,
34,
35,
36].
The complexity of coastal environments necessitates the application of the resistivity method using a three-dimensional setup of electrodes for revealing zones of different formations in a spatial mode [
37,
38].
In coastal areas, seismic methods are less sensitive to salinity contrast and may be applied to assist material classification [
39]. In particular, seismic refraction tomography (SRT) and surface wave tomography are methods that are considered to be useful in providing specific geotechnical and lithological information and mainly focus on identifying top of the bedrock [
13,
34,
40,
41,
42].
In this study, we propose a methodological integration of geophysical methods in a human-made urban coastal area. The Thorikos Gulf in eastern Attica, Greece, has been used as a case study area that includes a variety of geological and geotechnical issues. In terms of geological problems, the most dominant are shoreline erosion due to sea level rise, torrential fluvial deposits, and the longshore drift controlled by wave conditions. The anthropogenic influence on this coastal environment is evident from the remaining offshore structures, as well as evidence of old mining deposits, both dating back to the recent settlement of the area. Based on these conditions, we should evaluate the suitable sequence of the applied geophysical methods to be applied and properly design the acquisition plan for each technique. FDEM and GPR were applied as reconnaissance methods on a larger scale, in order to map soil infiltration and seawater intrusion and to determine if anthropogenic features extend onto the land. The second part of the survey concentrated on applying the electrical geophysical method. First, this technique was used to verify the initial results and then, in a second step, to obtain information about the lithostratigraphy. The third part of the methodology included seismic methods, including seismic refraction tomography and surface wave tomography, whose main objective was to identify lithostratigraphy, provide additional geotechnical information (Vs30) and to integrate the results of the previous surveys. This study addresses a significant gap in the application of integrated near-surface geophysics in coastal archaeological settings that are both geomorphologically complex and anthropogenically altered. The novelty lies in the systematic combination of FDEM, GPR, ERT, and seismic methods tailored specifically for the multifaceted conditions of the Thorikos Gulf.
2. Geological, Geomorphological and Geophysical Settings—Area of Interest
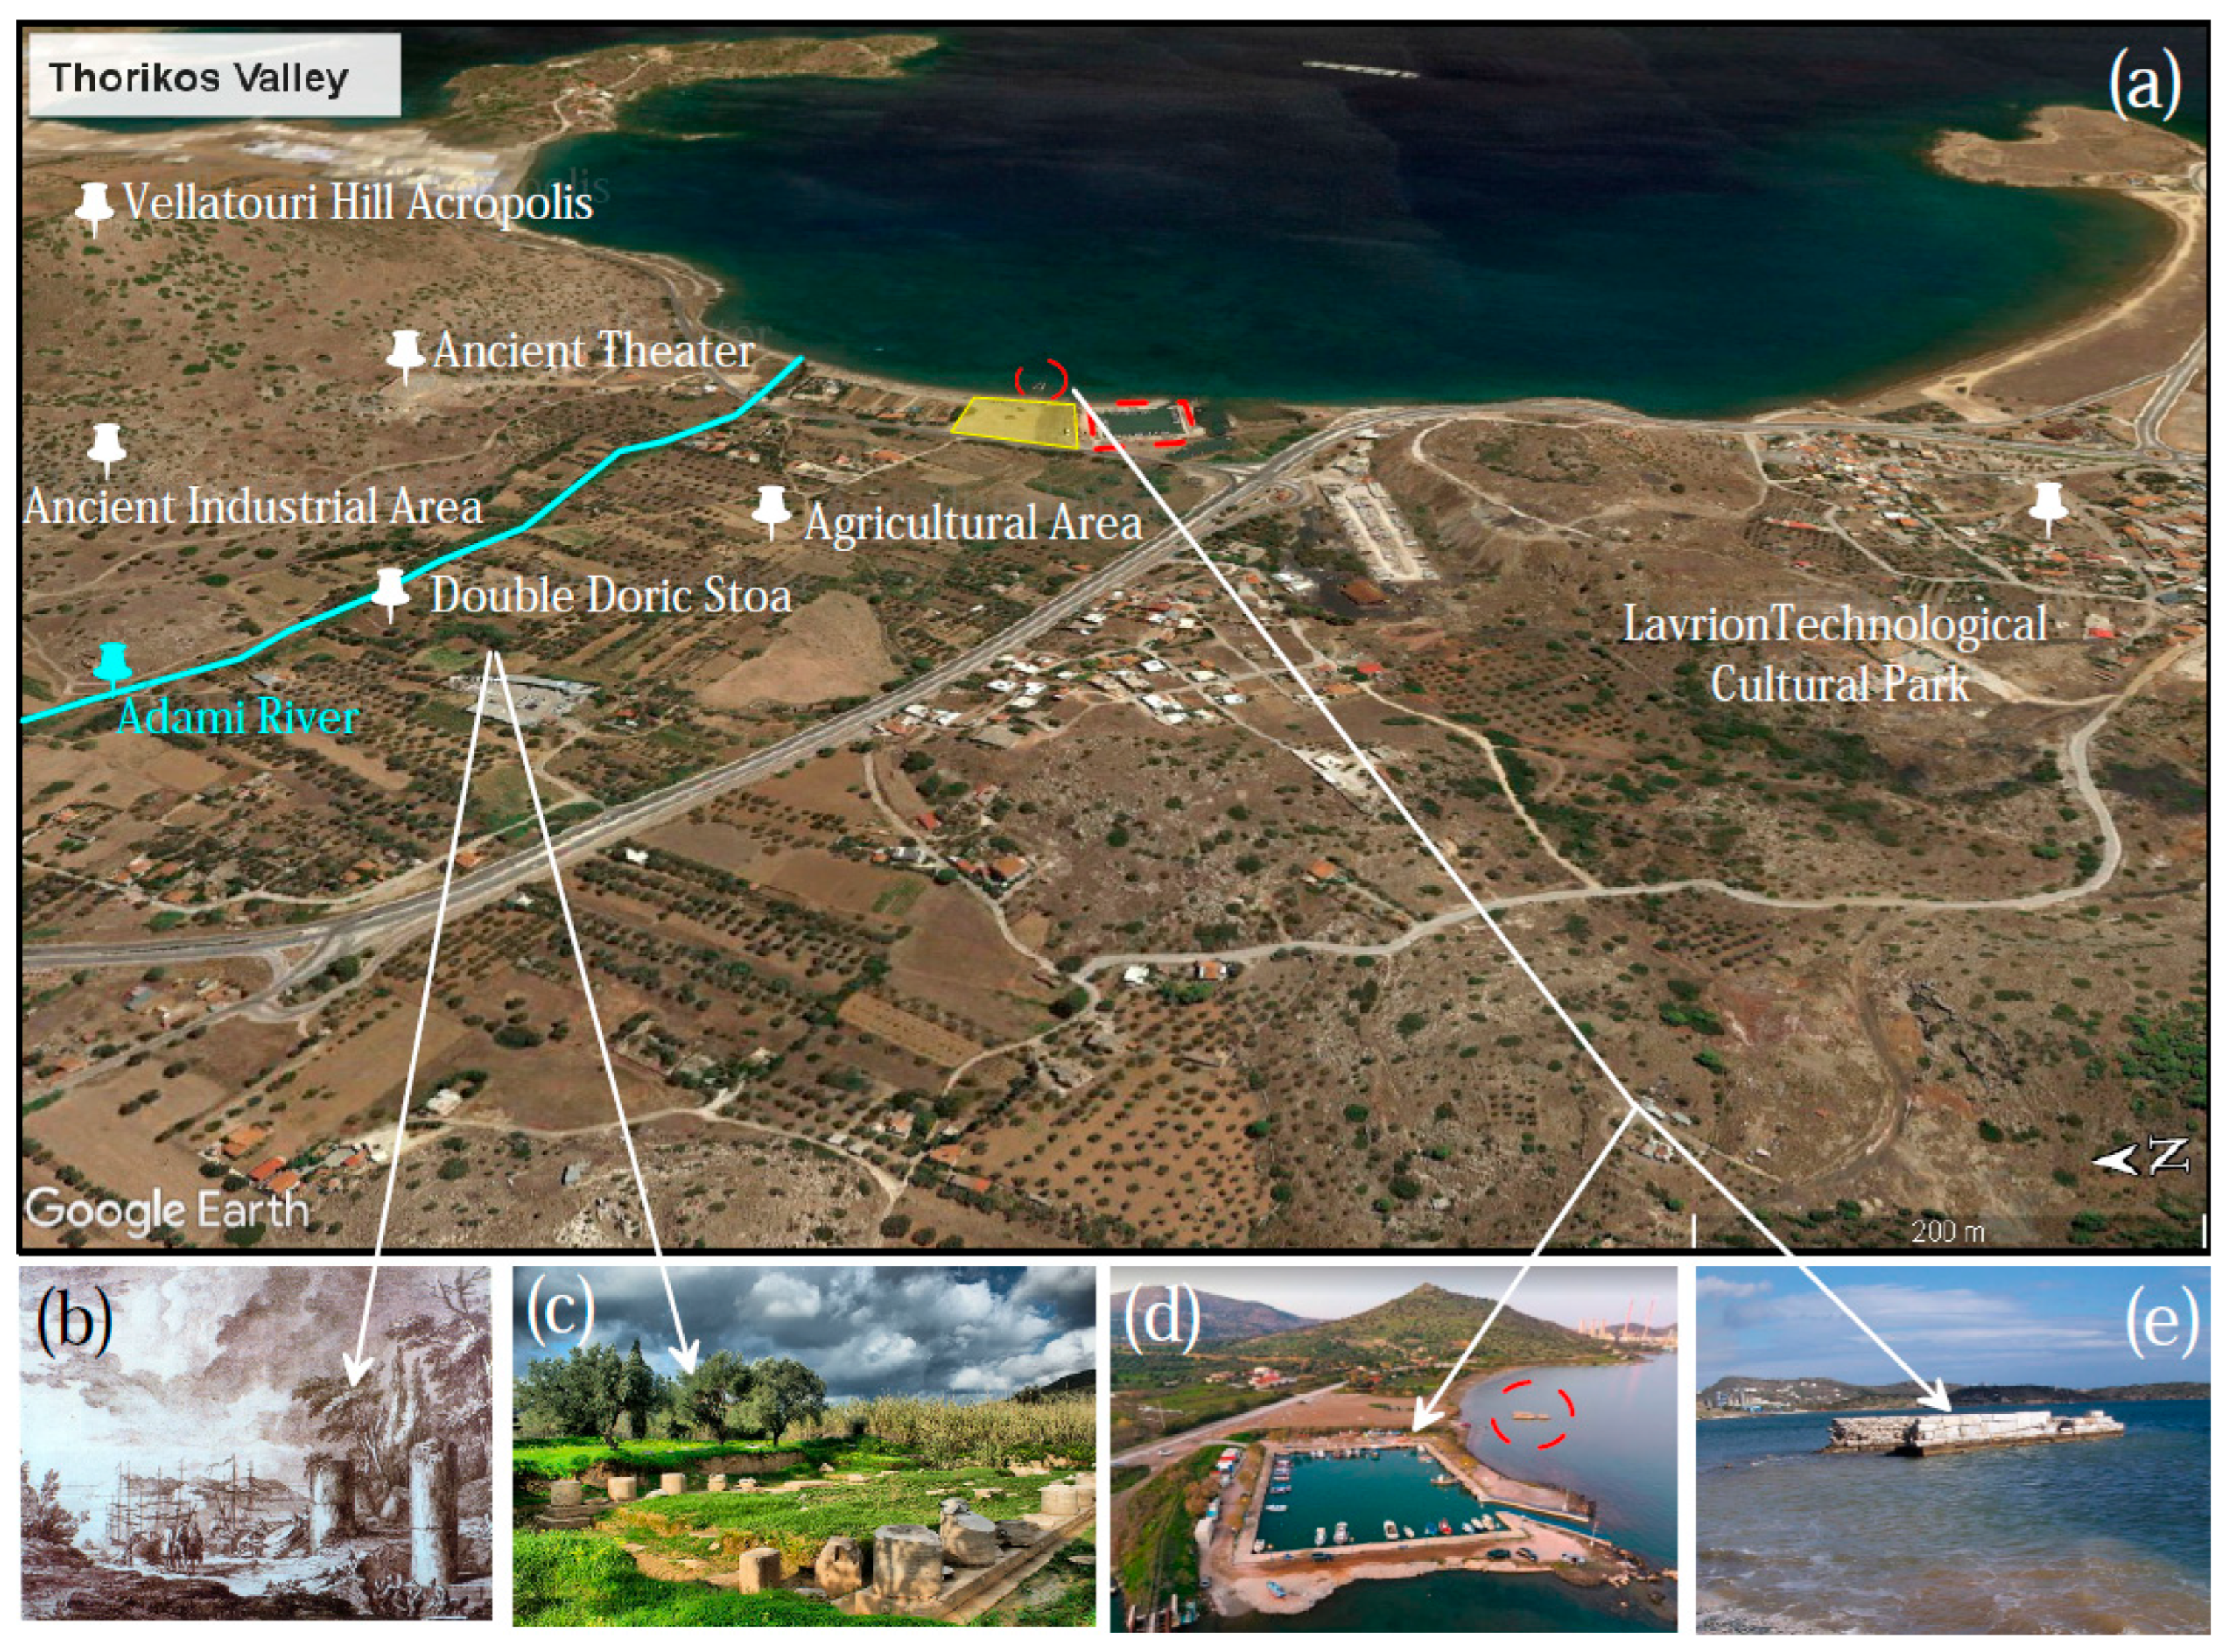
Thorikos is an area located in eastern Attica, Greece, approximately 50 km southeast of Athens (
Figure 1a). The large gulf that is part of it is bordered by the towns of Lavrio and Thorikos to the north and by the Aegean Sea to the south. The gulf’s length is approximately 9 km, and its maximum width is around 4 km (
Figure 1c).
Thorikos is an ancient mining town with a rich history in mining and industrial activity. It has been an important mining center since ancient times, particularly for the mining of silver, lead and other metals. The town was a major source of revenue for Athens during the Classical period. Ancient metallurgical processing facilities and cultural areas (ancient theater) have been revealed on the hillside of the Velatouri hill acropolis (
Figure 2a).
In the 19th century, Lavrio experienced a period of rapid industrialization, with the establishment of several factories and the construction of a port to facilitate the export of minerals. An old marble structure/pier (
Figure 2d) situated in the sea near the current marina may very well be part of such a port. However, the town suffered a decline in the 20th century, with many of its mines and factories closing down. The Lavreotiki Cultural and Technological Park, which is an area comprising renovated old mining and industrial facilities, was established in the early 2000s with the aim of promoting the region’s history and culture, while efforts have also been made to develop tourism and attract investment to the area (
Figure 2a). Metallurgical rusts have been deposited near the Park at the nearby anthropogenic coast. Such rusts may have been deposited there in earlier times.
The general geologic conditions show that Thorikos Valley is related to the Attic–Cycladic Metamorphic Complex, which exposes polyphasic metamorphic rocks, with the dominant formations being marble and schists alternations. The main tectonic units consist of (1) the lower unit composed of alternations of Kamariza schists and marbles, (2) the upper unit of Lavrion schists, also known as the “phyllitic cover”, including marble and metamorphic basic igneous rocks (
Figure 1d) [
43,
44,
45].
From a geomorphological perspective, the Thorikos area features a diverse landscape of mountains, valleys, and coastal plains. In the northern section of the downstream valley of the Adami River—which flows into the Bay of Thorikos—two distinct terrace systems are present (
Figure 1d) [
46]. The older terraces are composed of marble and phyllitic cover, exhibiting cohesive and compacted characteristics. In contrast, the younger terraces, located near the most recently active riverbed, consist of loose streambed deposits that form the agricultural land currently under cultivation (
Figure 1a).
The land processes that shape and influence the coastal zone are mainly due to the episodic flood discharges of the Adami River drainage network, which shows increased surface runoff after a period of intense rainfall. This is mainly due to the fact that, while the main rocks’ outcrop that appear in its watershed are practically impermeable (schists and phyllites) and have a low infiltration coefficient, they are easily eroded, facilitating the processes of valley elongation [
47,
48]. At the same time, part of the Adami River hydrographic network contributes to the current configuration of the hydrographic shape and morphology of the basin due to tectonic processes, but also to the prevailing backward erosion [
46].
A recent regional-scale geophysical study in the Thorikos Valley by Apostolopoulos and Kapetanios [
49] provided useful information on the general geological–geomorphological setting. Their study shows that the results of ERT profiles are fully consistent with the general geology of the area (
Figure 1d), revealing the alternation of marble–schists and the phyllitic cover. Moreover, by covering a wide area with EM measurements, they succeeded in detecting the seawater intrusion and the degree of salinization and the paleo-environment of the valley by including existing geomorphological details and by revealing ancient archeological structures (Double Doric Stoa, DDS) covered by the torrential deposits of the Adami River (
Figure 2c). More importantly, with the use of geophysical EM maps, Apostolopoulos and Kapetanions have suggested where the paleo-coast line was in ancient times, something that a gravure with DDS also shows (
Figure 2b). This excludes the case of any covered ancient structures in our survey area as there was sea there, with the only findings being some moved ancient objects covered by loose sediments.
The current study was conducted in the coastal zone of Thorikos Gulf, extended to the shoreline (
Figure 2a). This investigation area combines the previously presented geological–geomorphological–anthropogenic characteristics, located between the river mouth of the Adami River, a recently constructed marina, and the marble anthropogenic structure (pier) offshore. Moreover, ancient remains, mining activity, industrial facilities, and the possible deposition of metallurgical rust embankments of coarse material, make up the general setting of the area. All these features are very common in coastal studies in Greece and a geophysical survey conducted for any engineering project is bound to detect them.
3. Geophysical Survey—Datasets and Methodology
The current multidisciplinary geophysical survey was conducted in several steps, using alternative geophysical methods based on the geo-engineering questions. The primary objective of the proposed methodology is to accurately interpret collected data, facilitating the strategic planning and execution of subsequent investigation steps. This involves not only validating previous findings, but also effectively addressing emerging geo-engineering uncertainties for a comprehensive understanding of the site.
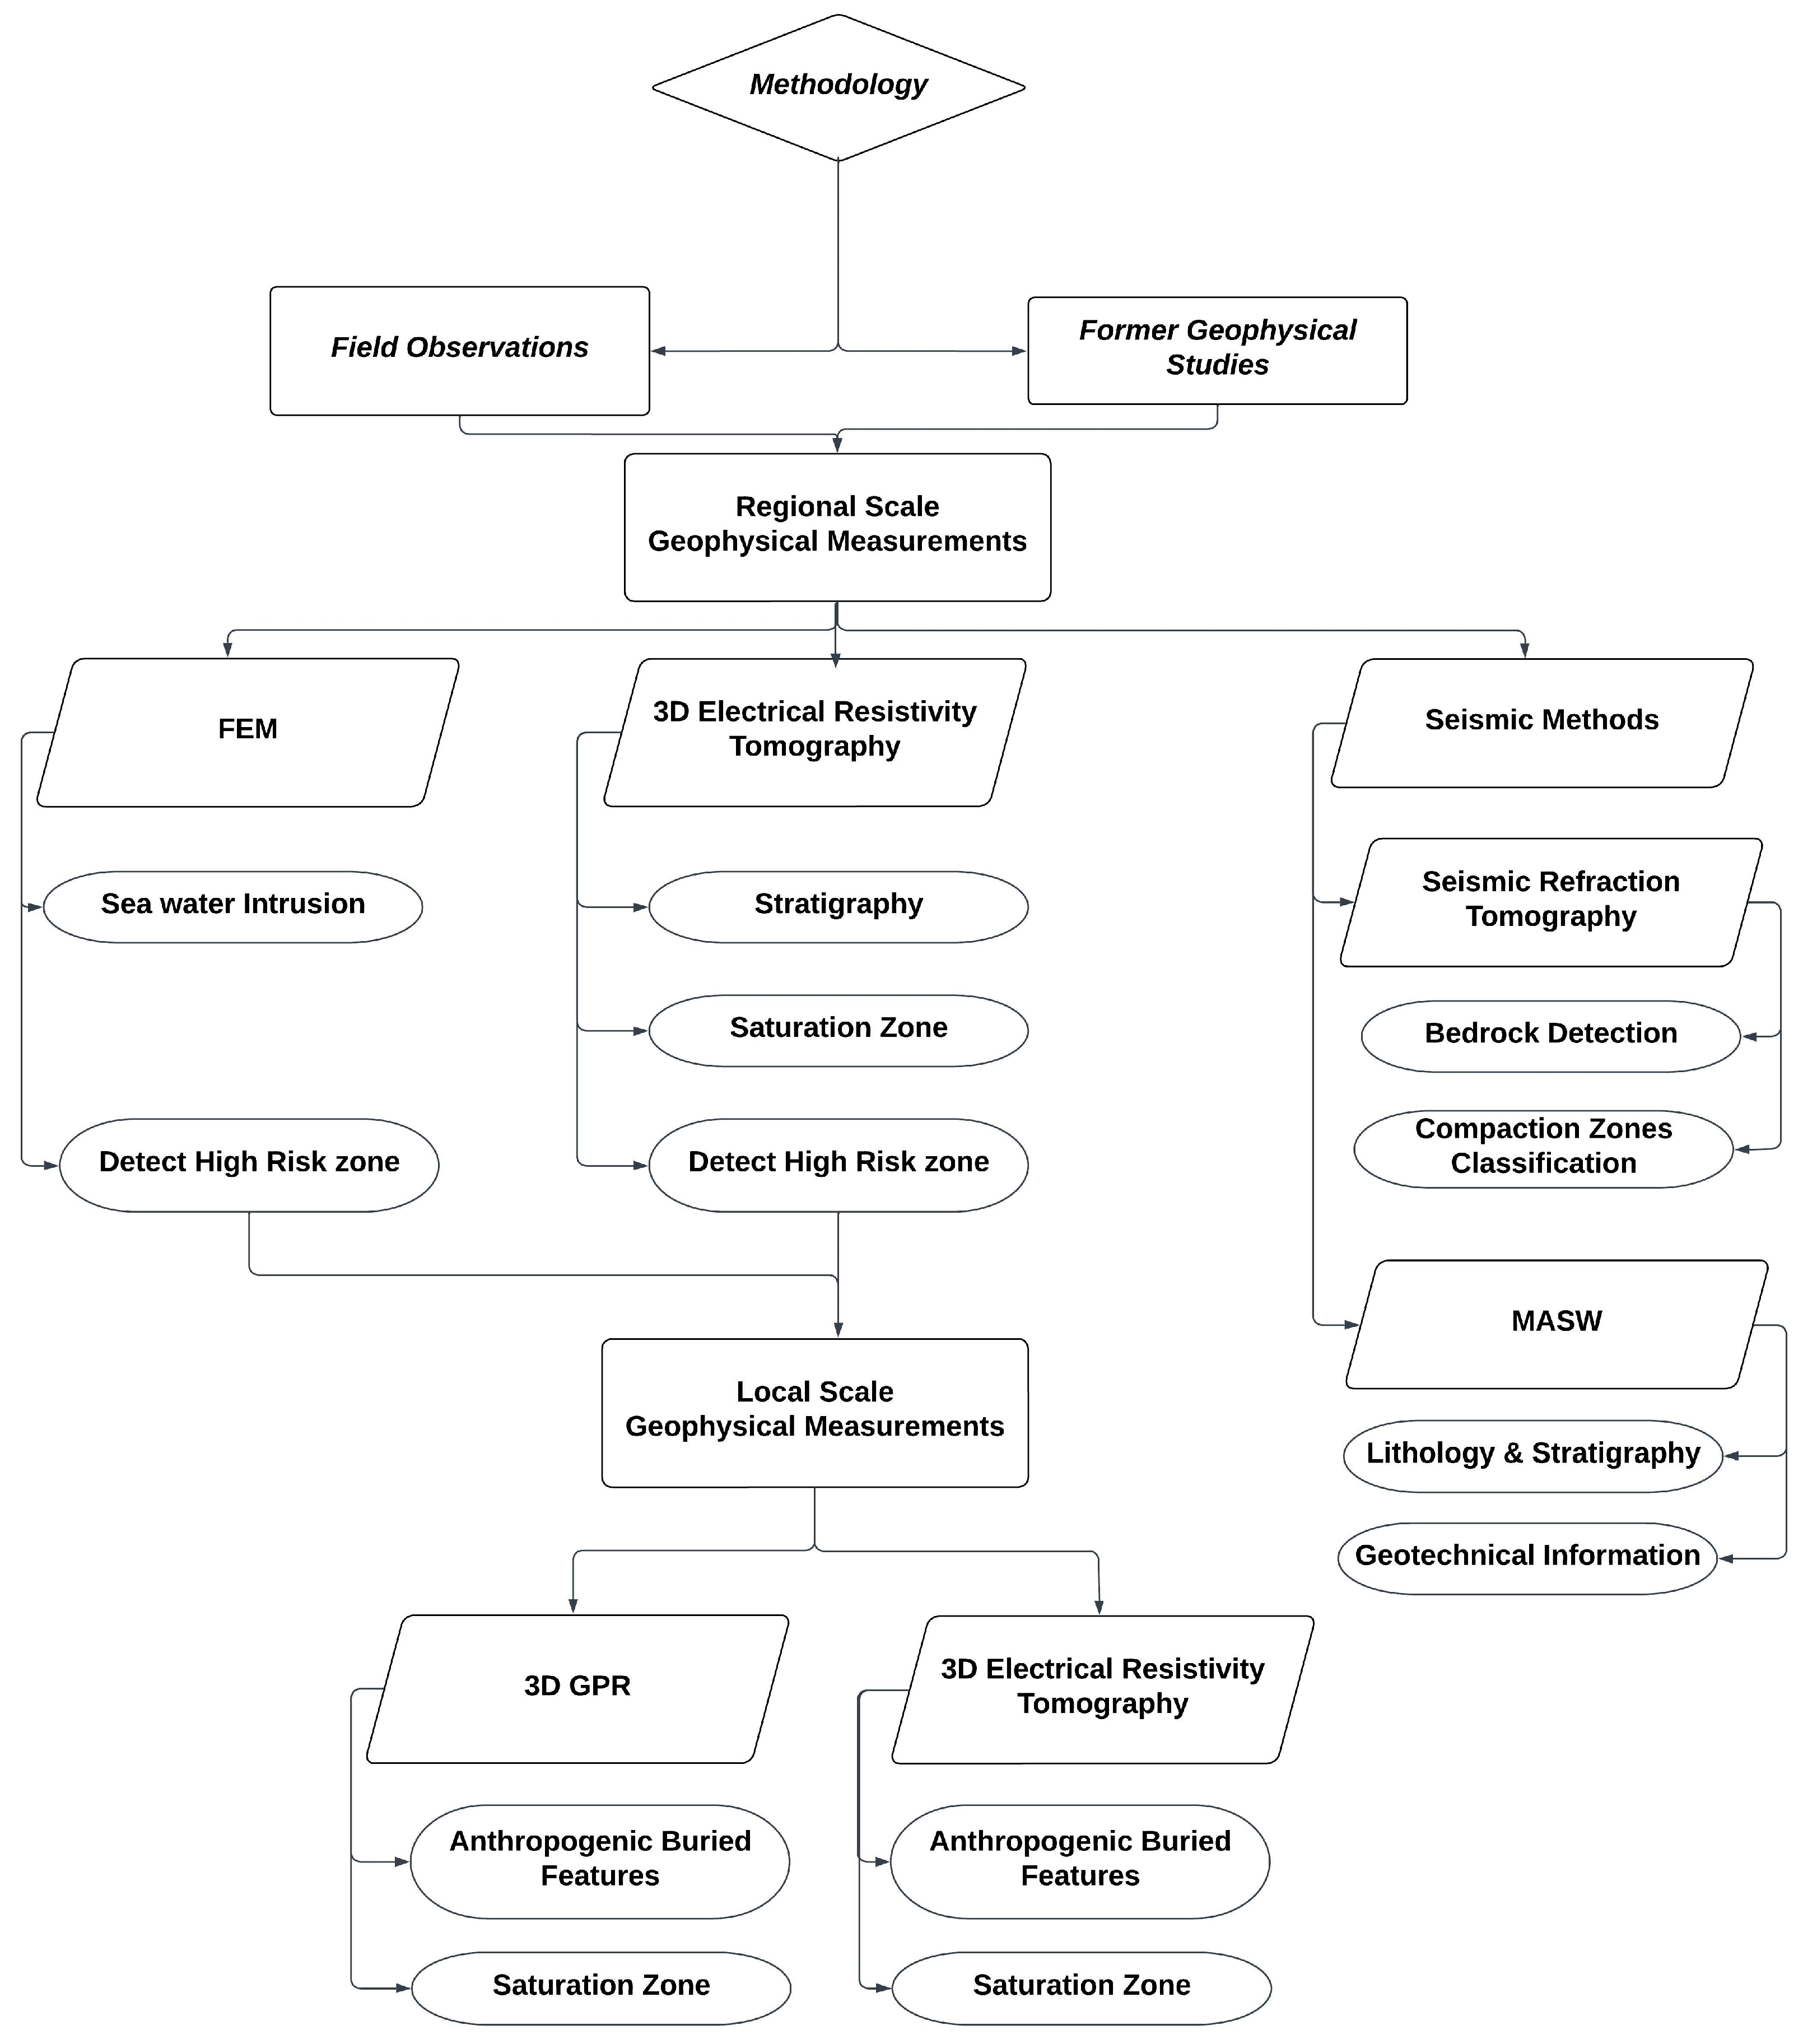
In an effort to answer geo-engineering questions in coastal areas, the proposed methodology (
Figure 3) begins with comprehensive initial data collection from field observations and existing geophysical studies. The next phase involves a regional geophysical survey using FDEM measurements followed by 3D electrical resistivity tomography (ERT), as well as seismic methods. FDEM and 3D ERT exhibit great sensitivity to seawater dynamics and play a pivotal role in detecting seawater intrusion, lithological variations, and high-risk zones. Concurrently, seismic methods, seismic refraction tomography (SRT), and multichannel analysis of surface waves (MASW) provide valuable insights into bedrock detection, compaction zones, geotechnical information, and the overall lithological and stratigraphic composition.
The third phase involves a more localized approach, employing 3D GPR measurements for buried structure detection and assessment of saturation zones. Simultaneously, 3D ERT is strategically used for either buried structure detection or saturation zone identification. The intricacies of the survey design, specifically the directionality of the 3D ERT lines, are tailored to the specific target or objective. For instance, when the aim is to detect buried structures, measurements are conducted perpendicular to the target detected in the previous steps. When the objective is to identify sea water intrusion, the profile measurements are taken perpendicular to the seashore.
Overall, the methodology integrates various geophysical techniques (
Figure 4) to comprehensively understand the coastal environment, ranging from a broad regional perspective to a detailed local investigation. The combination of various geophysical techniques that are tailored to the challenges posed by seawater, as well as their application to specific geological features, make this approach robust in addressing the challenges of coastal areas
3.1. FDEM Survey
The primary geophysical method was electromagnetic (FDEM) measurements, used mainly as a reconnaissance technique. The qualitative analysis of the results of this method allows us to overcome conventional constraints that other methods encounter in coastal environments and to acquire a spatial distribution of apparent conductivity and in-phase components (connected with susceptibility) in certain zones of detection depths [
22,
47]. In this way, areas of various fine or coarse material would be discriminated while probable metallic anthropogenic structures would also be detected. Electromagnetic measurements were made over an area of 9000 m
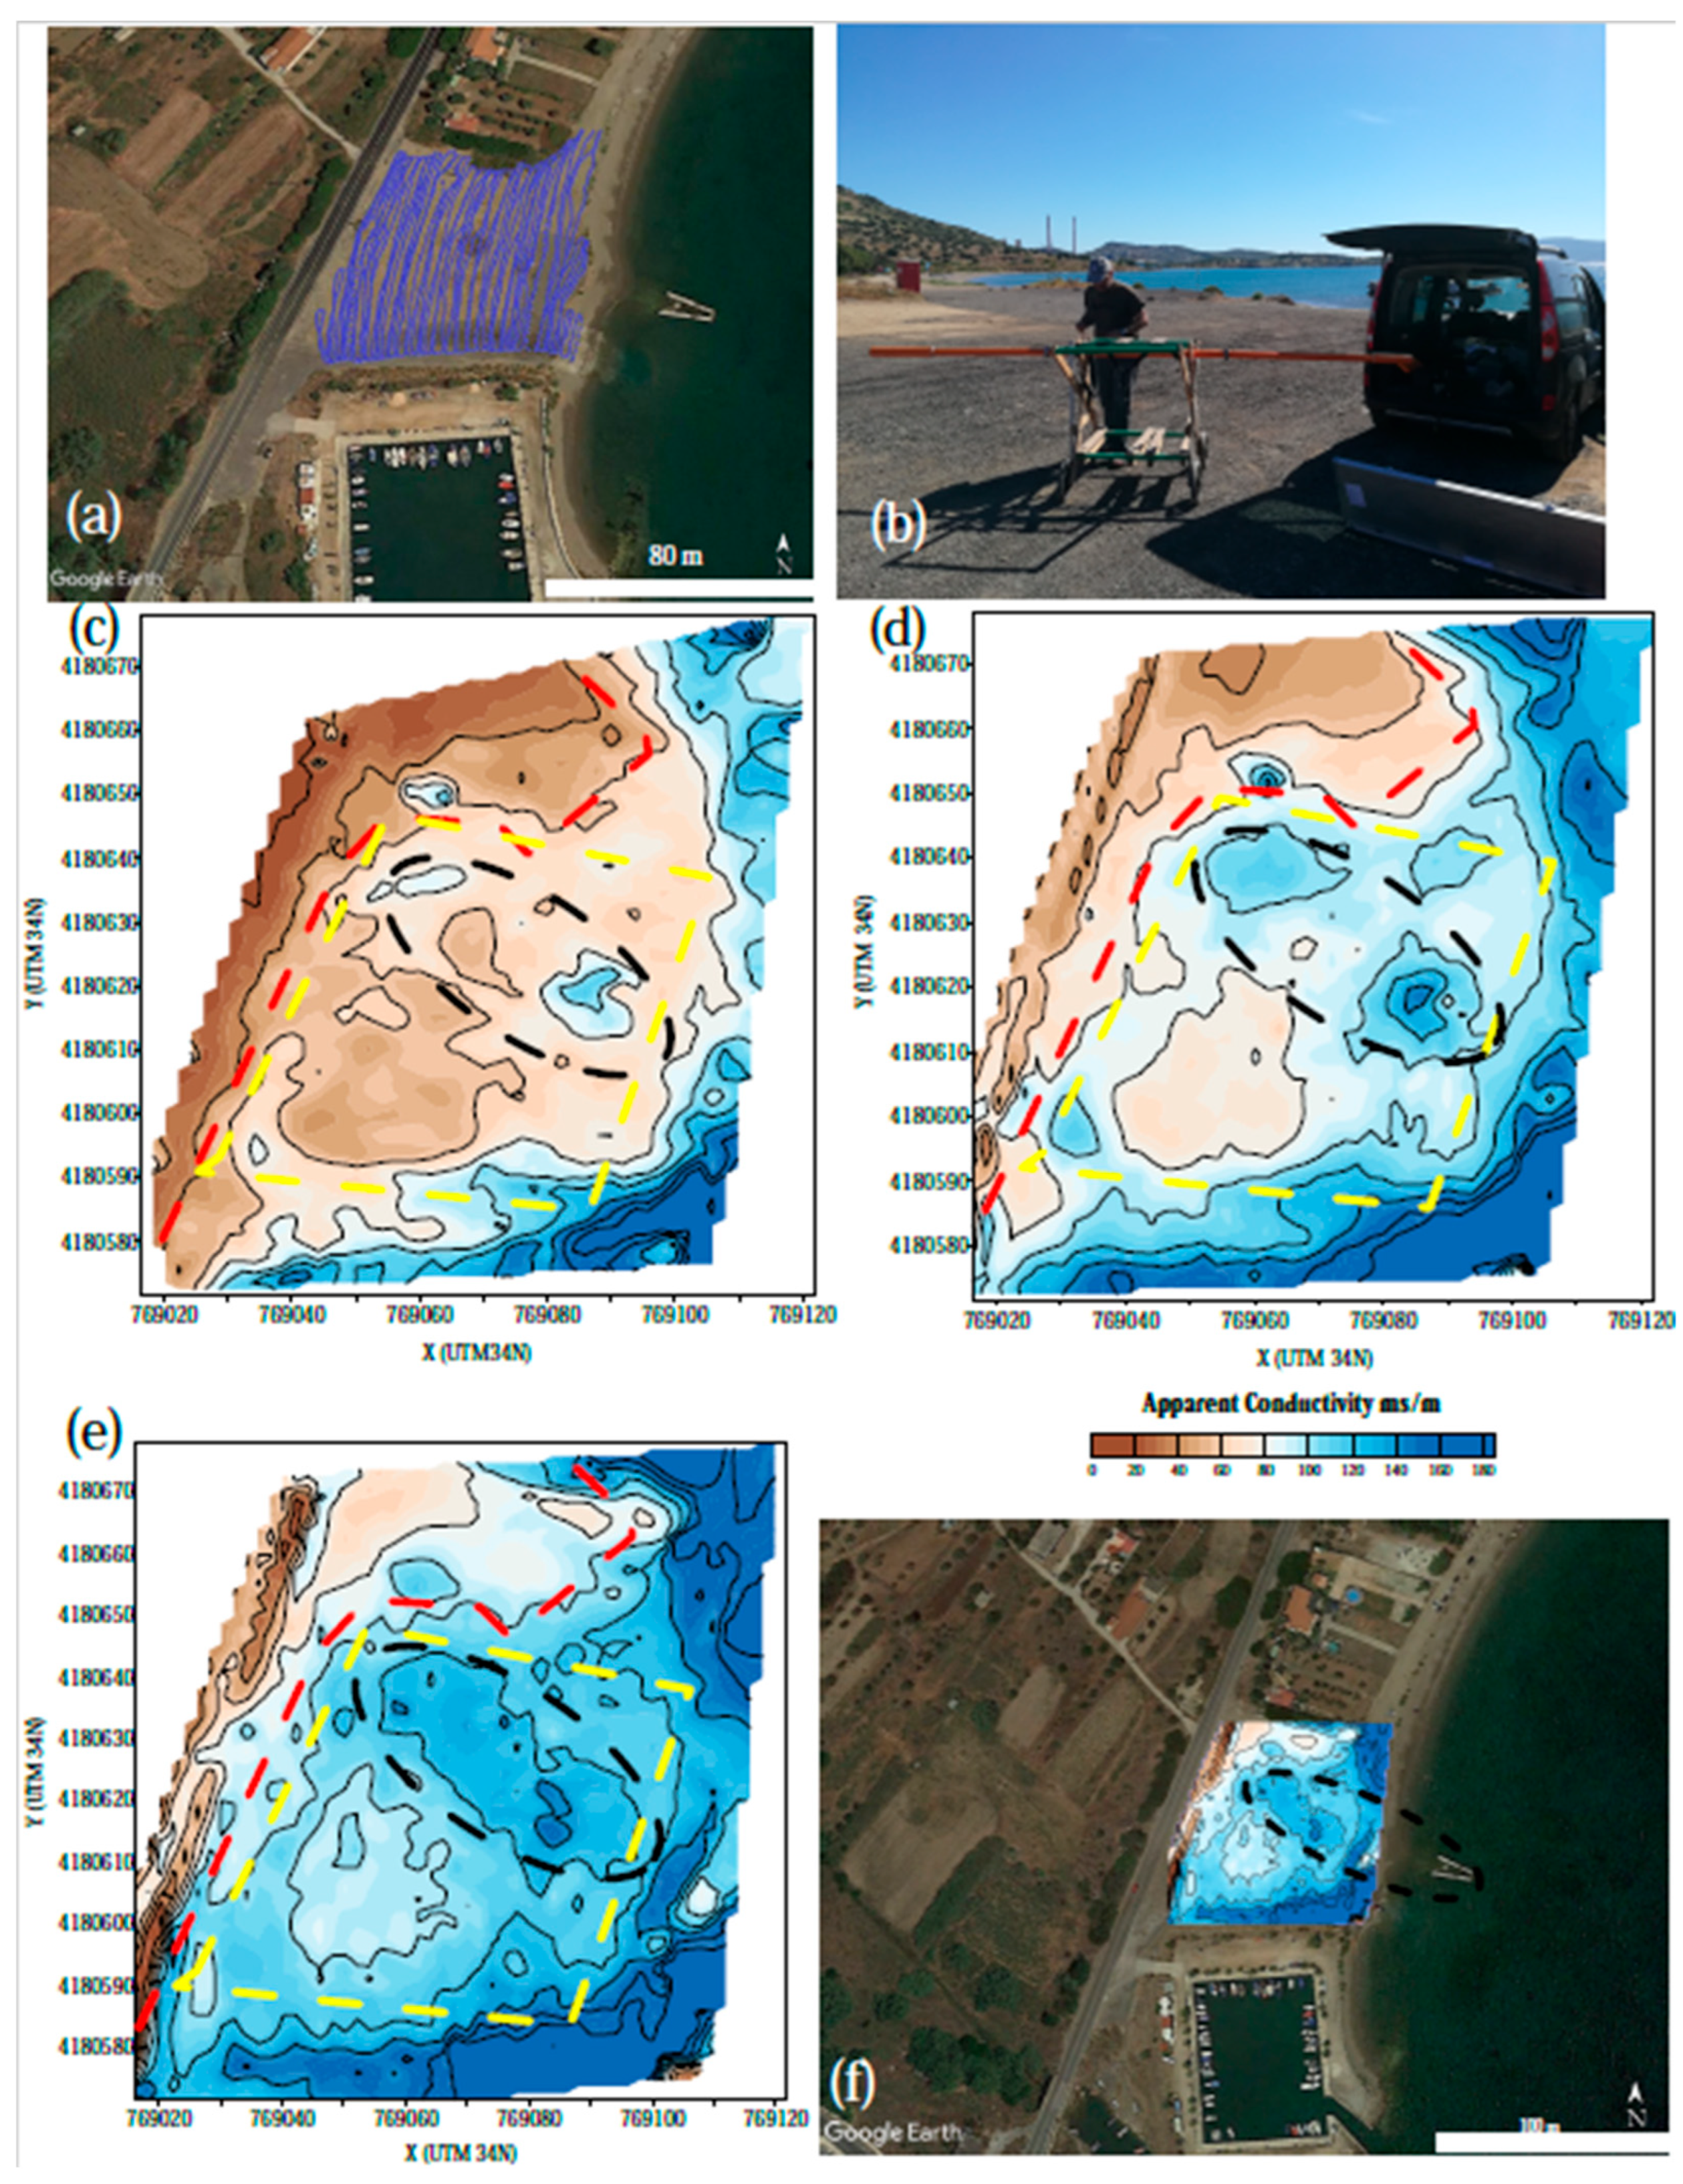
2 using the CMD2 and CMD4 conductivity meters of GF Instruments (
Figure 5b), which operated in continuous measurement mode of 1 s intervals, moving parallel to the shoreline (
Figure 5a). The instruments were set in both VPC and HCP modes and reached three depths of investigation of zones (1.5 m, 3 m, and 6 m). A wooden-carrying cart was used to carry CMD4, and both instruments were connected to a RTK GNSS receiver, using the Leica Smartnet Network, for accurate positioning (
Figure 5b).
The FDEM measurement maps were created based on field survey coverage, for setting the suitable grid and using the ‘kriging’ method.
All three maps (
Figure 5c–e), presenting the distribution of apparent conductivity of the zones detected, show increased conductivity values for the effective depths of 1.5, 3, and 6 m, which are related to the influence of saline water.
The lower conductive area eastwards, outlined with a red dashed line (
Figure 5c–e), is associated with coarse material from road construction embankments and mixed torrent-born deposits. The distribution of these sediments gives an indication of the evolution of the paleo-shoreline, also mentioned previously in geomorphological observations [
47,
48].
In the central part of the surveyed area (
Figure 5c–e), the distribution of conductivity values increases with depth, and is outlined with a yellow dashed line. In the upper part of the subsurface, where investigation of an effective depth of up to 1.5 m took place, a layer of coarse material, mostly connected to human activity deposits, was detected. When examining the FDEM measurement maps at effective depths of 3 and 6 m (VCP) of this area, saline water intrusion is dominant, although the deposited material can be identified and classified compared to the lateral conductivity values.
A characteristic area with higher values of apparent conductivity was detected (black dashed line) in the northern part of all maps (
Figure 5c–e). The relative diversification in apparent conductivity values is constant in three investigation depths. This is mostly connected to the dominant presence of saline water. Taking into consideration this detail, we can assume that this contrast in conductivity values anticipates a pathway of saline water inshore.
In order to give an overview of the distribution of the apparent conductivity in the coastal surveyed area, the map at the investigated effective depth of 6 m was combined with the satellite image of Google Earth as a base map (
Figure 5f). The combination of the maps shows that the remains of a marble structure/offshore pier is situated in the same direction as the area with the higher conductivity values, meaning that the structure continues inland and serves as a dominant pathway of saline water
3.2. GPR Survey
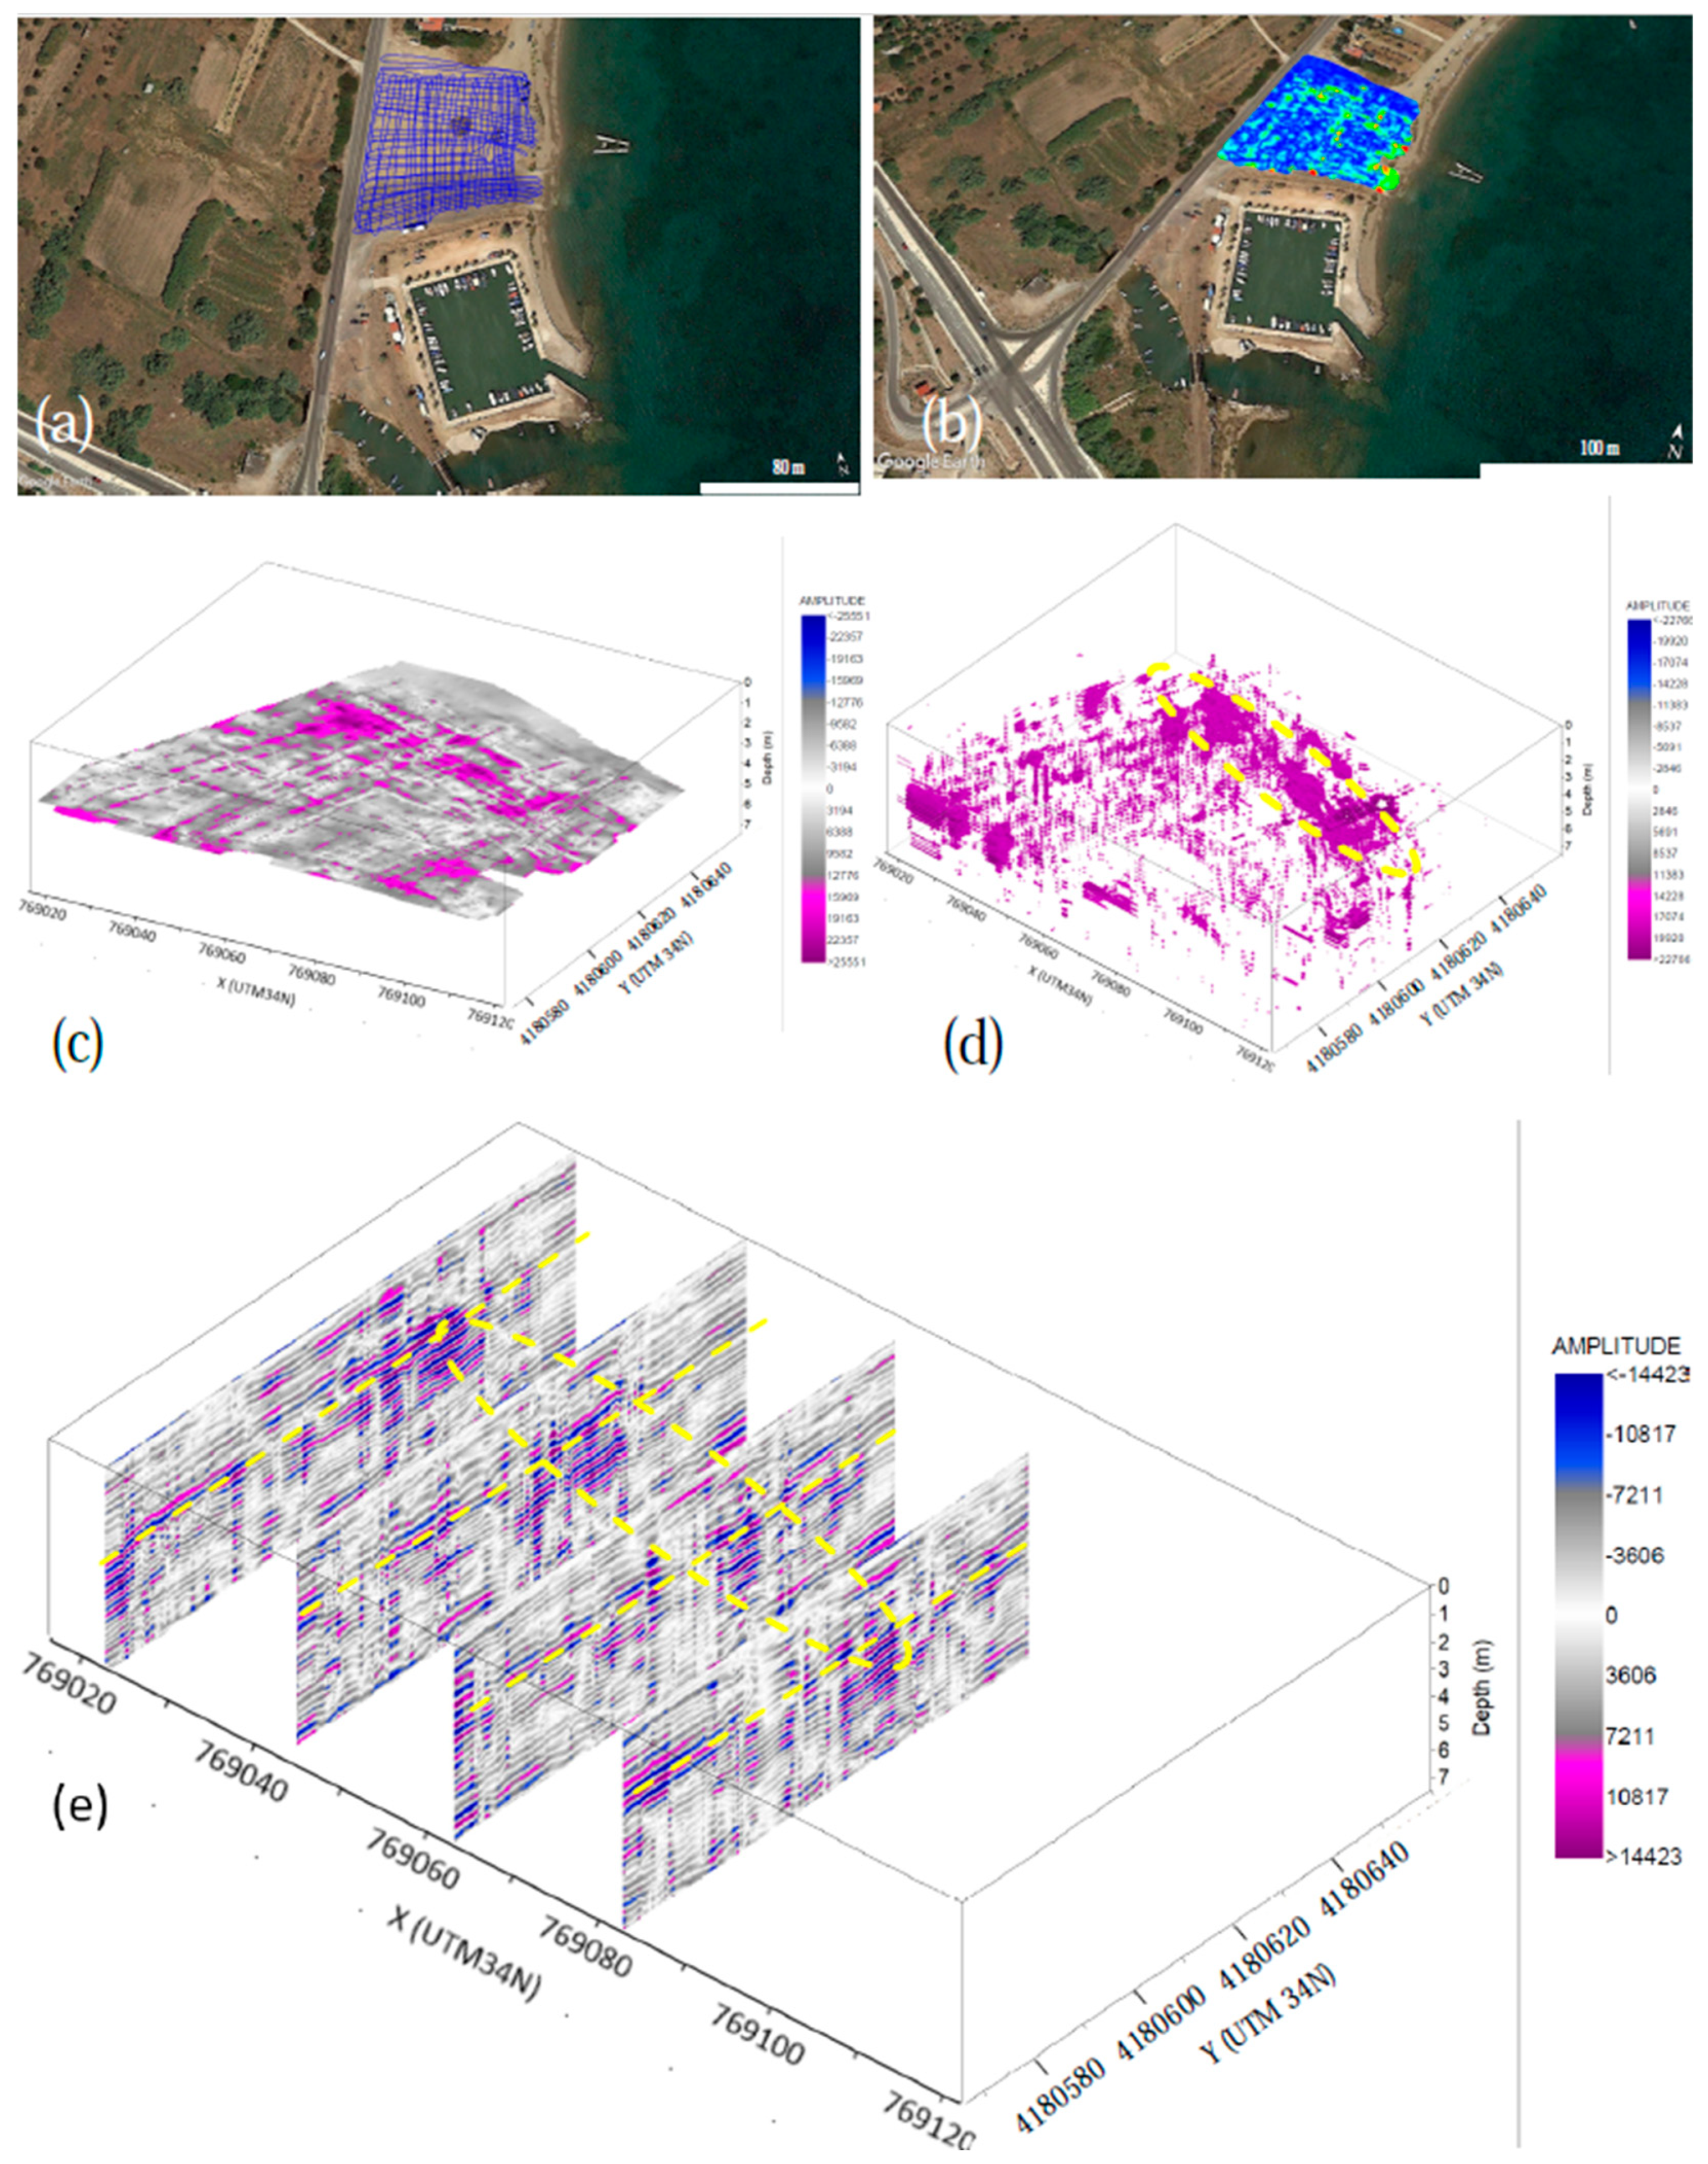
The GPR survey was designed to cover the respective FDEM measurements area in a moving 3D mode, aiming to detect mainly buried anthropogenic features and secondary metallic objects. The survey was carried out in two phases based on the direction of the profiles. Initially the direction of the GPR measurements was perpendicular to the shoreline, followed by the second phase moving parallel to the coastal zone (
Figure 6a).
A MALA RAMAC 100 MHz shielded GPR antenna was used, connected to a Leica 1200 RTK GNSS System for positioning. The GPR system’s specifications for mapping were: (a) number of samples: 240, (b) time window: 222 ns and (c) trace interval of 1 s.
The GPR data were processed with ReflexW software (v. 10.0) [
50] with a standard filtering procedure including Subtract-mean (Dewow), Static Correction, Bandpass Butterworth filter (50–250), Background Removal, Mean Filter, Kirchoff migration and velocity 0.1 m/ns [
20,
40,
48,
51].
For additional interpretation of the data, GEOLITIX alternative processing software was used for the following processing procedures: Time Correction, Constant Scale, Background subtraction, Energy decay, Manual Gain and Frequency Band pass filter.
The primary objective is to identify possible effects that cause the existence of high conductivity values on the apparent conductivity maps. As a first assessment, a GPR slice at the depth of 3 m, created using both Geolitix (v.2024.06) and ReflexW (v.10.0) Software, shows a high amplitude zone outlined in a yellow dashed line (
Figure 6b–e). The observed high amplitude area is located in the same zone as the high conductivity values shown in the EM conductivity distribution maps. In addition, by overlaying the GPR slice at 3 m depth on the Google Earth map, we were able to identify the continuity of this high amplitude linear zone with the offshore marble pier. (
Figure 6b).
In order to verify the existence of this marble structure inland, we created a 3D GPR model, produced from the integration of the profiles, showing full envelope amplitude values. A filter passing the higher values, from 4000 to 20,000, shows the linear zone with the higher envelope amplitudes extending from a depth of 3 m up to 6 m (
Figure 6d).
A secondary observation of the GPR survey with the wide and dense coverage of measurements, that allows us to create section cuts from the 3D model, is the existence of a strong reflection horizon at the depth of 3 m (
Figure 6e).
3.3. Electrical Resistivity Tomography (ERT)
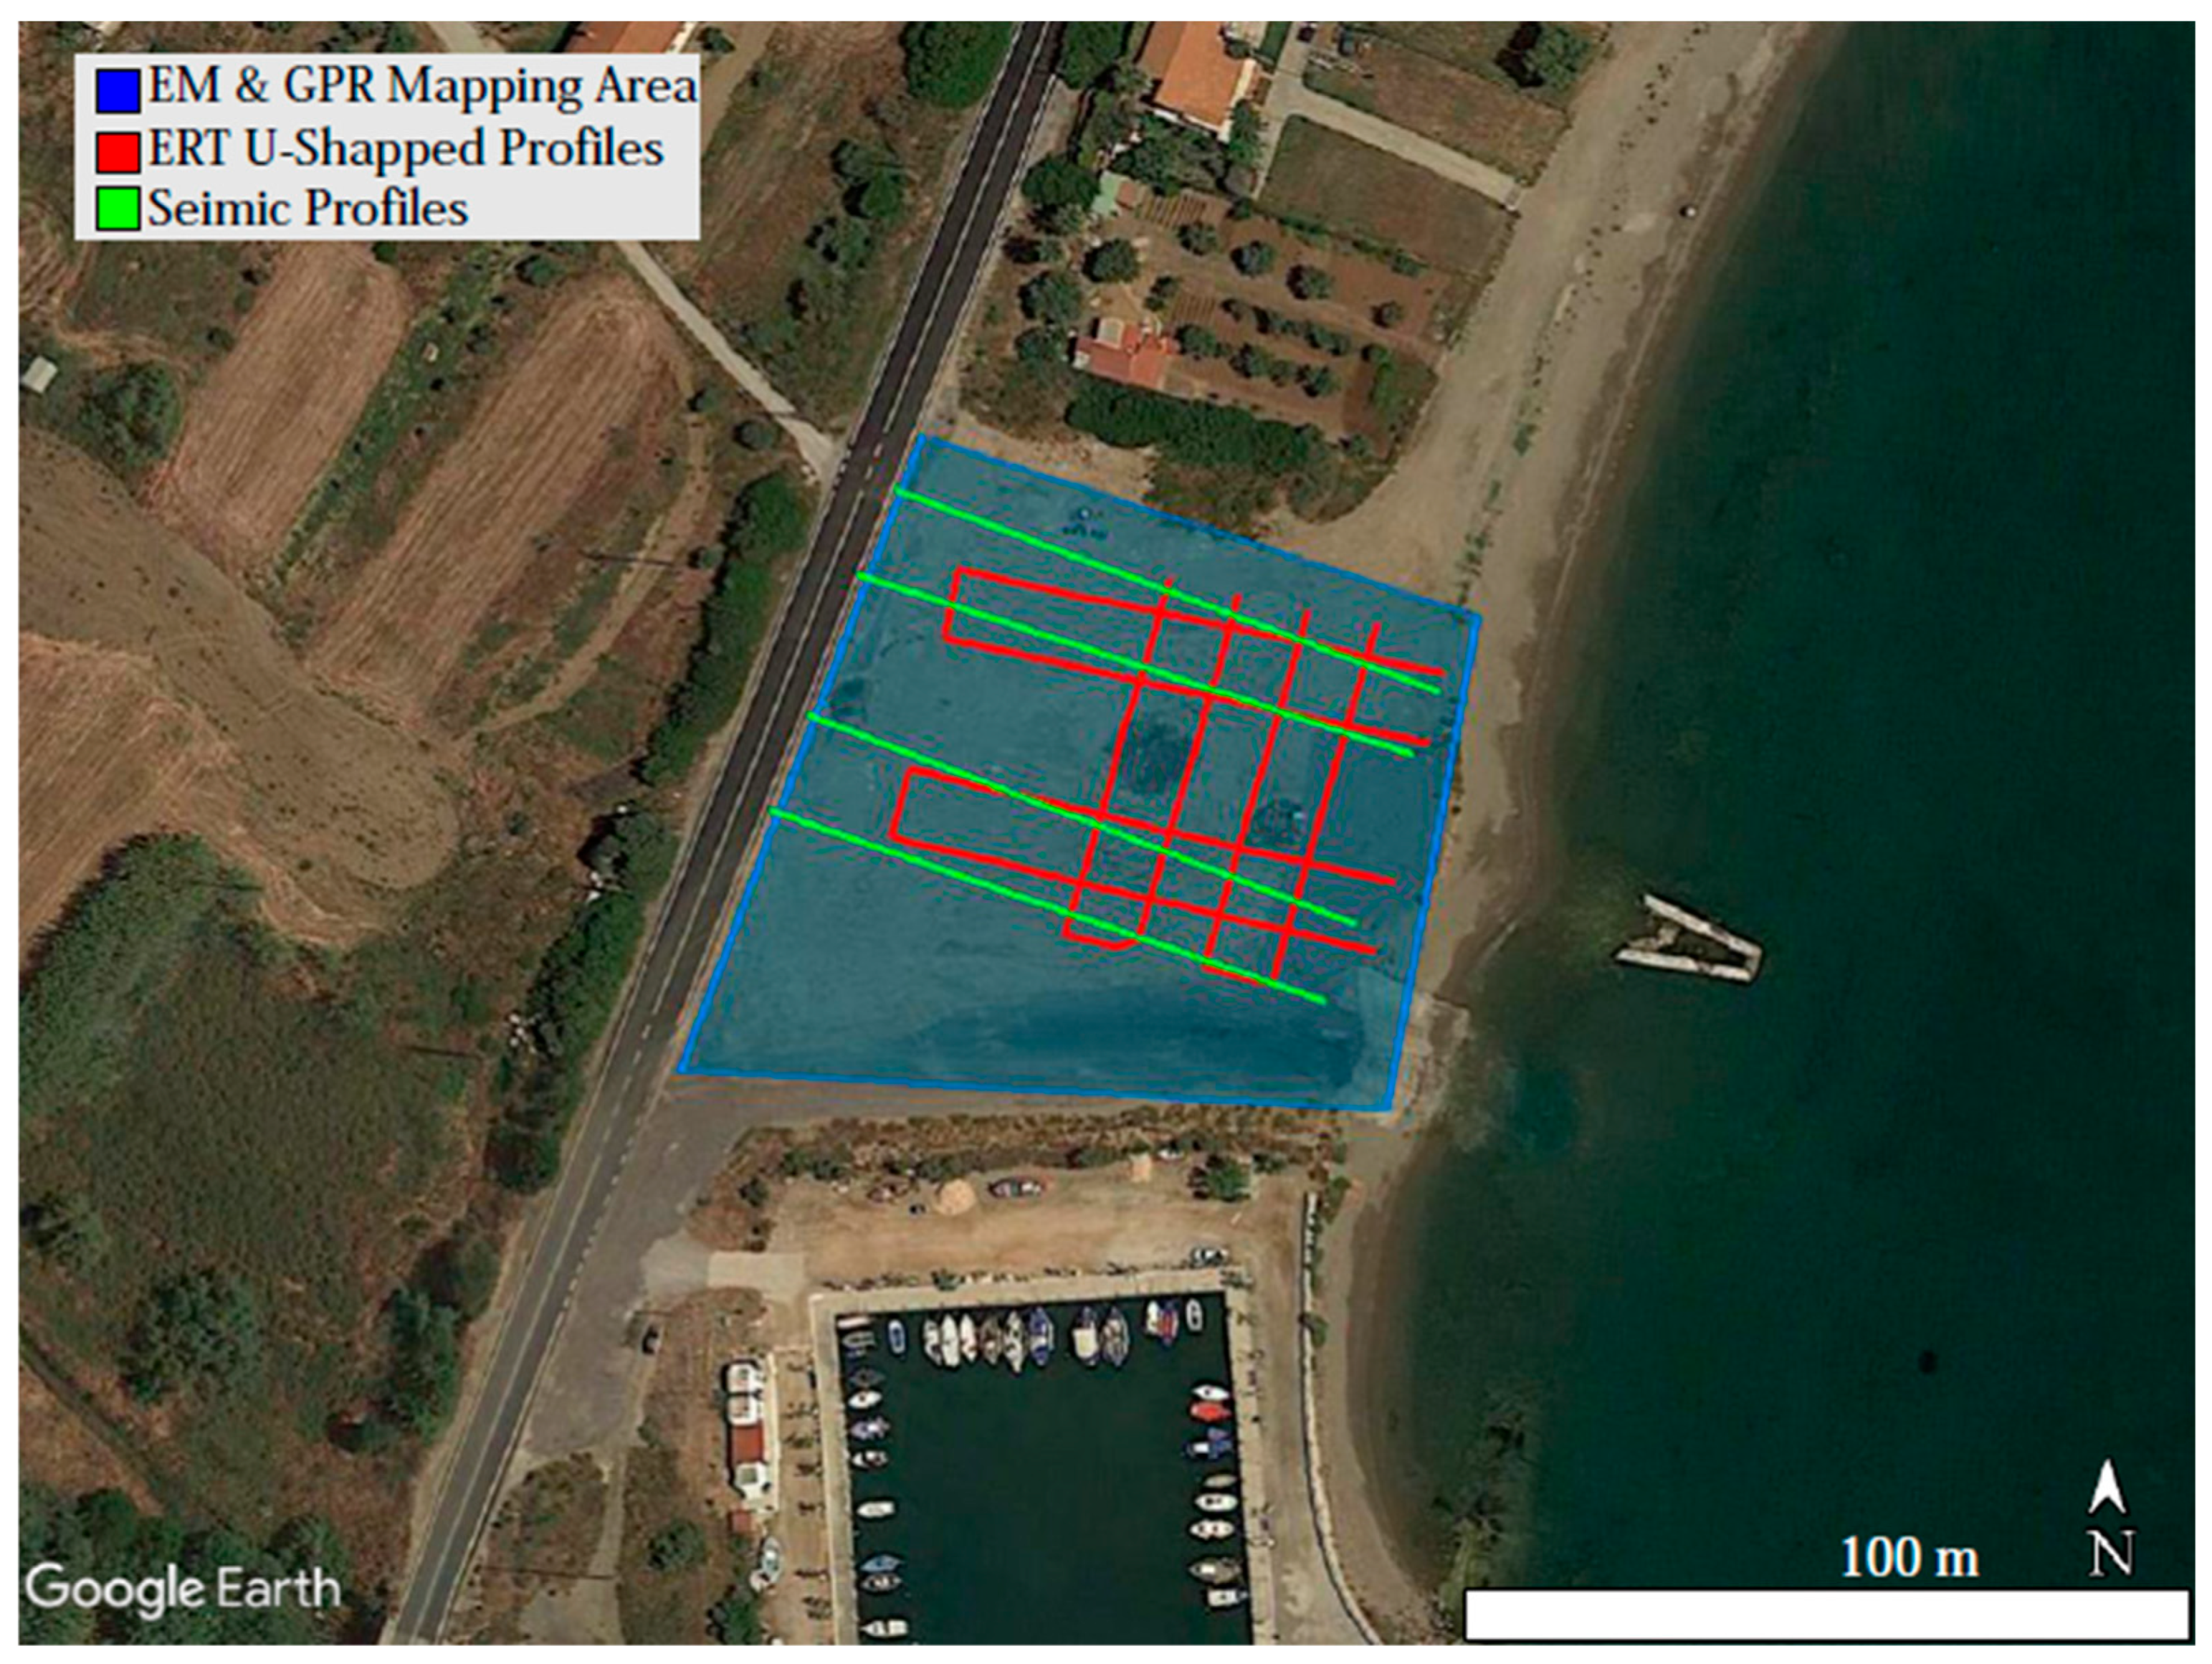
The subsurface imaging of a 3D ERT survey was carried out in two time phases and pursued three objectives: (a) detection of the anthropogenic marble structure, (b) seawater intrusion and its pathways (c) lithostratigraphy. Both surveys were carried out in a network of two U-shaped survey lines, oriented in both x and y directions (
Figure 7a,b). The U-shaped configuration allows for the targeted deployment of electrodes toward specific areas of interest, enhancing the focus and depth of subsurface mapping. This orientation not only facilitates detailed measurements along the electrode lines but also enables comprehensive data collection from the central area of the network, ensuring a more thorough investigation. Moreover, the unique design of this protocol substantially improves field operational efficiency. The ability to move the network in parallel offsets allows for rapid repositioning and expanded coverage, creating a more extensive resistivity model in a reduced timeframe. The resistivity multi-electrode system IRIS Syscal Pro was used for data acquisition and was connected to 72 electrodes arranged in the designed surface grid (
Figure 7d). The position of the electrodes was measured and stored by a Leica RTK GNNS Receiver.
In the first phase, we used the GPR slice map overlying the Google Earth map, showing a high amplitude area (
Figure 6b), in order to design and deploy the network of electrodes. It was decided that the long x-axis of our grid, 52 m in length, should be perpendicular to our target (inland anthropogenic marble structure) and parallel to the shoreline (N–S direction) (
Figure 7a), while the short y-axis of the grid, 30 m in length, had an E–W direction. In this phase, the x-axis electrode separation was 1.5 m and the y-axis was 10 m. Schlumberger and Pole–Dipole arrays were used to obtain quality results in terms of general stratigraphy and lateral resolution.
The following phase of the 3D ERT survey was carried out with the aim of better detecting the stratigraphy towards the sea shore. In order to accomplish this, we used a grid with the long x-axis in a W–E direction, 72 m in length perpendicular to the shoreline, and a 2 m electrode separation along this line. The short x-axis, 50 m in length, had a N–S direction, while the same electrode arrays were used as in the first phase.
The 3D ERT data were processed and interpreted utilizing RES3DINV software (v. 2.1) [
52]. Two 3D resistivity models were produced for each phase of the survey.
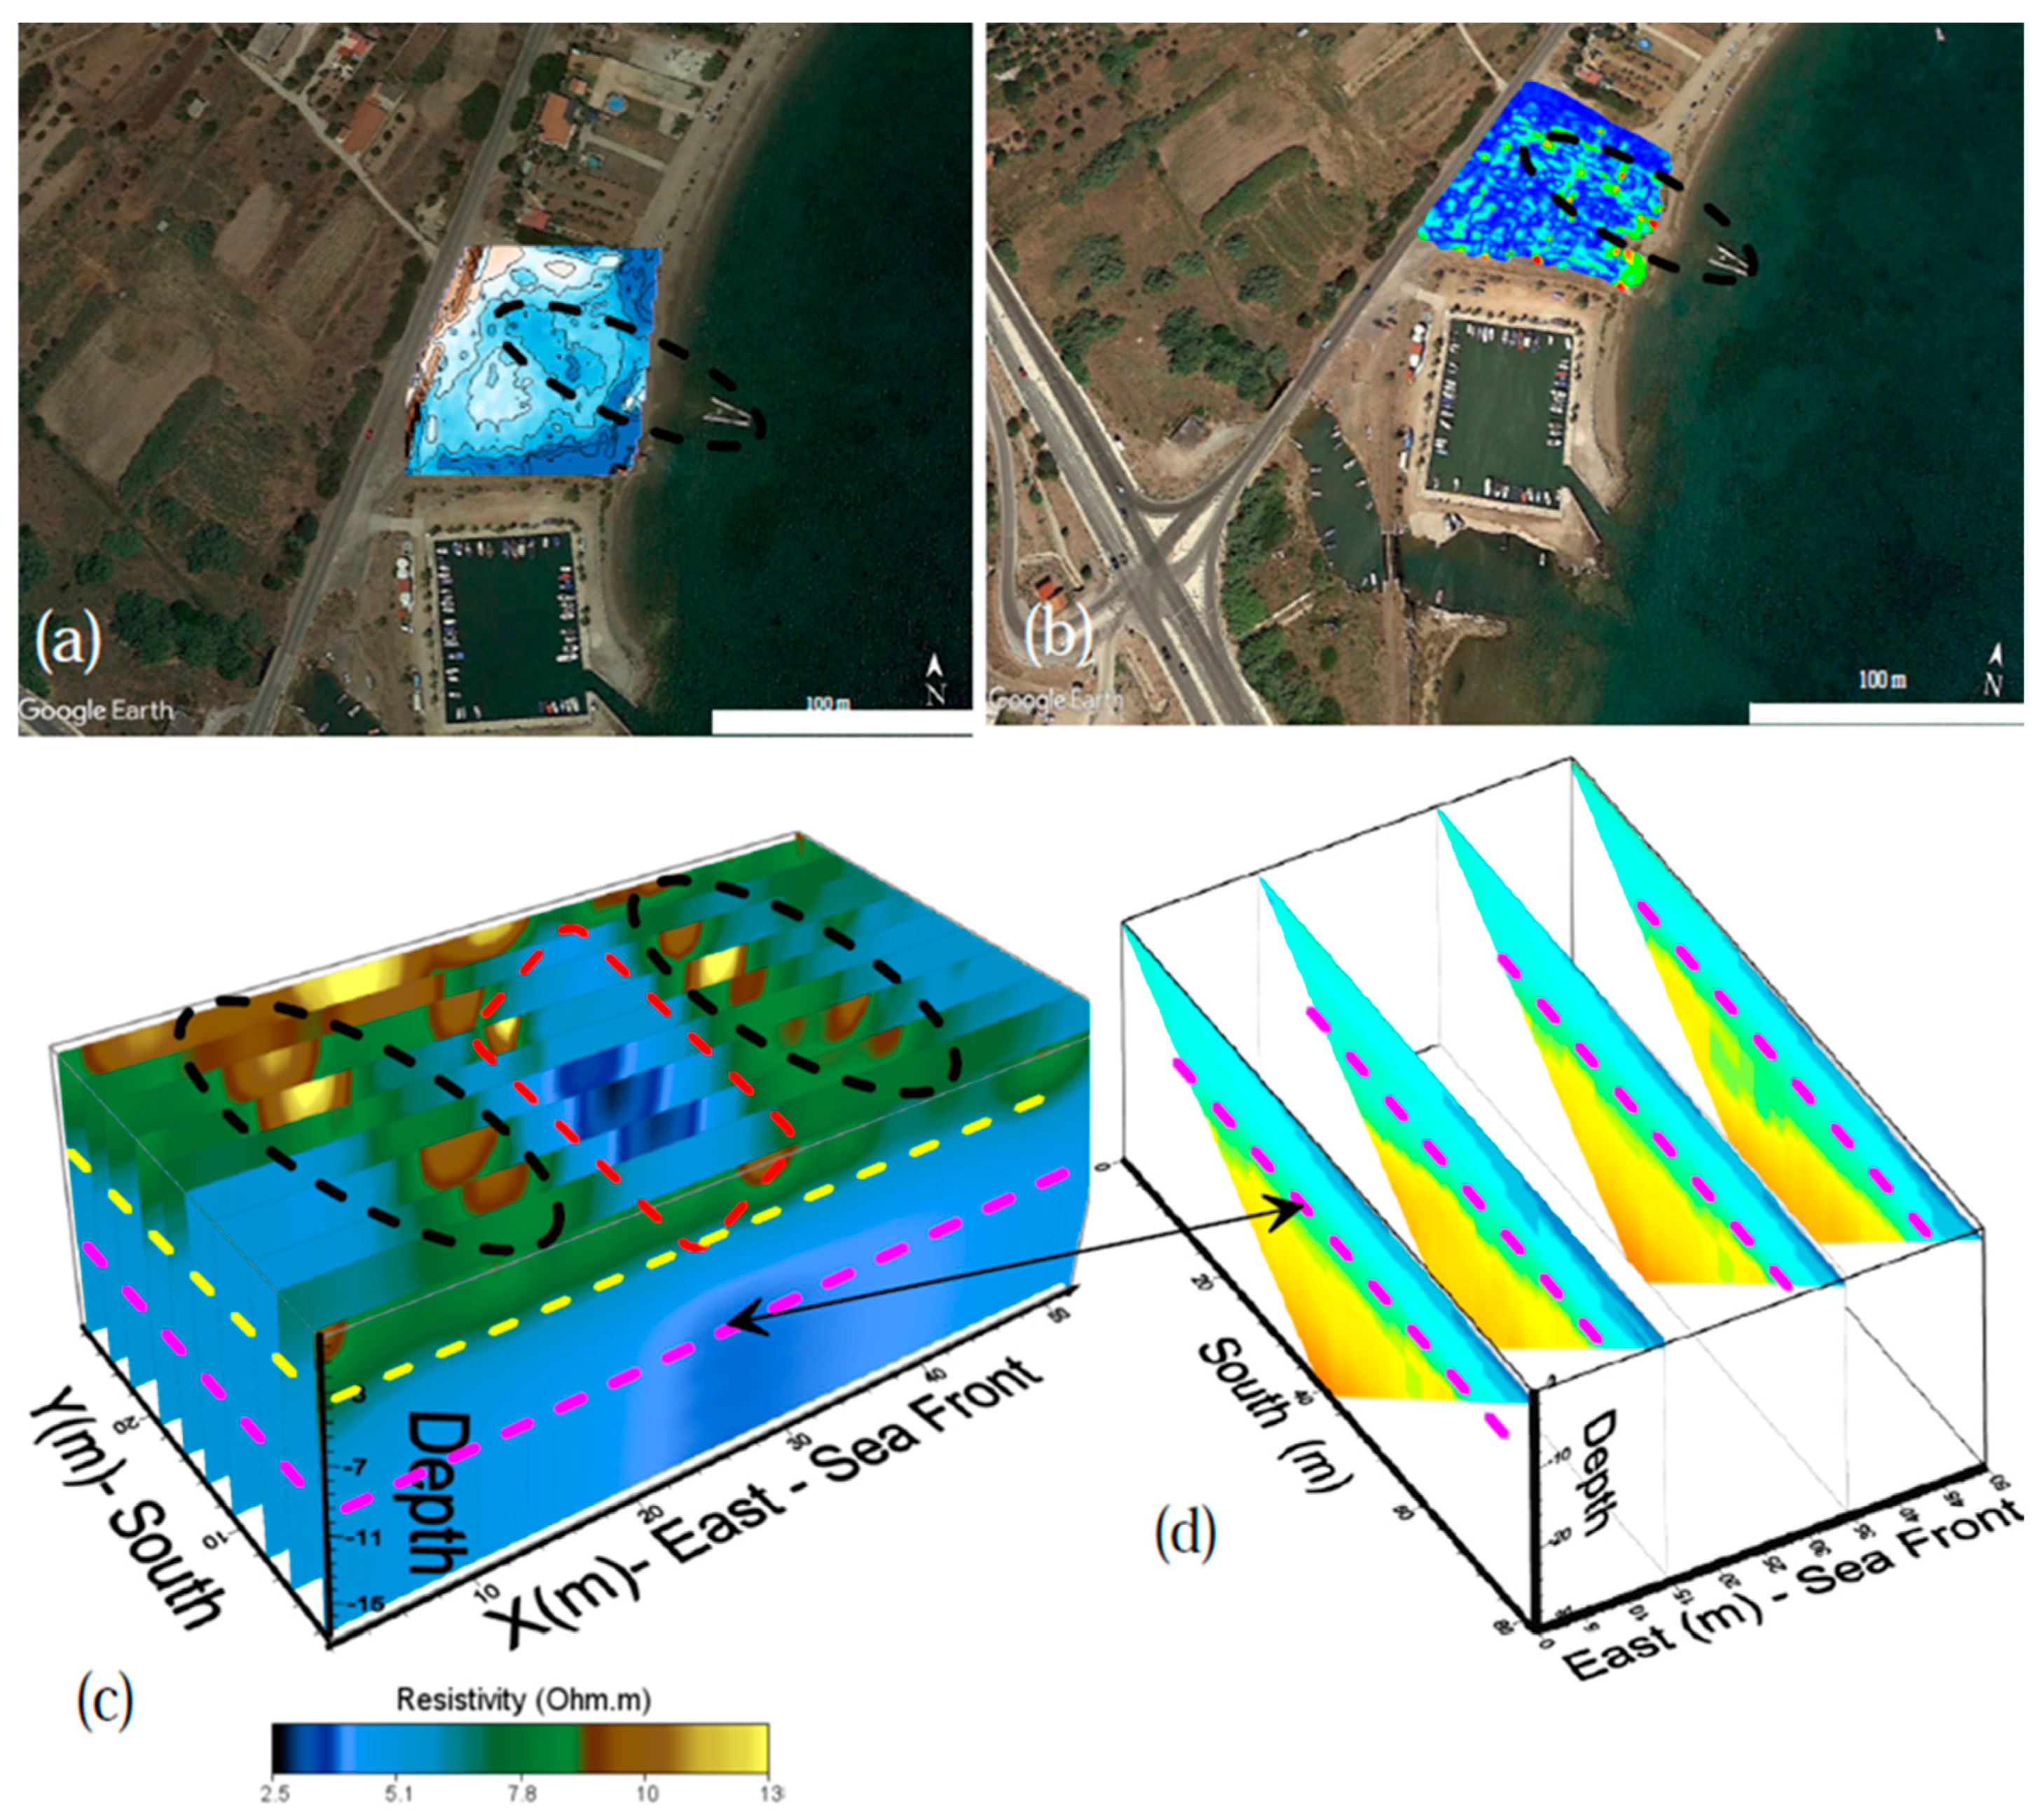
The first 3D resistivity model (
Figure 7e), focusing more on anthropogenic structure detection and sea water intrusion, provides useful information for the aforementioned targets. In
Figure 7e, two high resistivity areas (>12 Ohm.m) outlined with a black dashed line were detected in the x-axis sections of the resistivity model. These resistive areas, which possibly indicate the existence of the anthropogenic structure reaching 4 m depth, also revealed high amplitude areas in the GPR slices. For an additional interpretation, a horizontal slice of the resistivity model overlying the Google Earth map (
Figure 7c) was used in order to verify the positioning of the high resistive areas. The linearity of the marble structure/ offshore pier and the high resistivity areas are evident (
Figure 7c).
In addition, in all x-axis sections of the resistivity model, the topsoil of coarse material deposits, connected to the coarse material deposits, was identified (
Figure 7e), outlined with a yellow dashed line, verifying the existence of the GPR strong reflection horizon/interface at a depth of 3 m (
Figure 6c).
The range of resistivity values in both resistivity models (
Figure 7e,f) are low due to the influence of saline water (2.5–13 Ohm.m), although an area in the central part of the resistivity model, outlined with red dashed line, (
Figure 7e) shows very low resistivity values, indicating the saline water intrusion and its pathway.
The additional resistivity model that was produced from the second phase of the 3D ERT survey shows the stratigraphy of the mapping area in greater detail. Although this model has a low range of resistivity values, we have taken advantage of the high contrast to gain useful information. The higher resistivity values (12–13 Ohm.m) that appear in the western part of the x-axis section in the resistivity model (
Figure 7f), highlighted with a magenta dashed line, identify the formations that are saturated by saline water to the depth of 16 m. Geomorphological analysis [
46] and geophysical investigation [
49] in this area suggest the presence of an impermeable phyllitic cover below this depth. Below this depth, the impermeable phyllitic cover is confirmed by both geomorphological analysis [
46] and geophysical investigations [
49] conducted in this area.
In the same 3D resistivity model (
Figure 7f), a resistive area was detected and is outlined with a black dashed line. This identifies the presence of a marble structure inland. However, the resolution is not optimal. This limitation is primarily due to the orientation of the electrode lines, which was arranged mainly to map the stratigraphy toward the seas sore, rather than to detect the marble structure which is almost parallel to this direction.
Additionally, it is crucial to consider the impact of severe saline water intrusion found beneath the 3-m layer of coarse material. This intrusion significantly affects the ability to differentiate between the loose sediments and the marble in the resistivity model. Both of these formations are permeable and saturated with saline water, leading to low resistivity values. Consequently, this similarity in resistivity values makes it challenging to distinguish between them in the model.
Taking this into consideration, the last part of our survey uses the seismic method to resolve this issue.
3.4. Seismic Refraction Tomography (SRT) & MASW
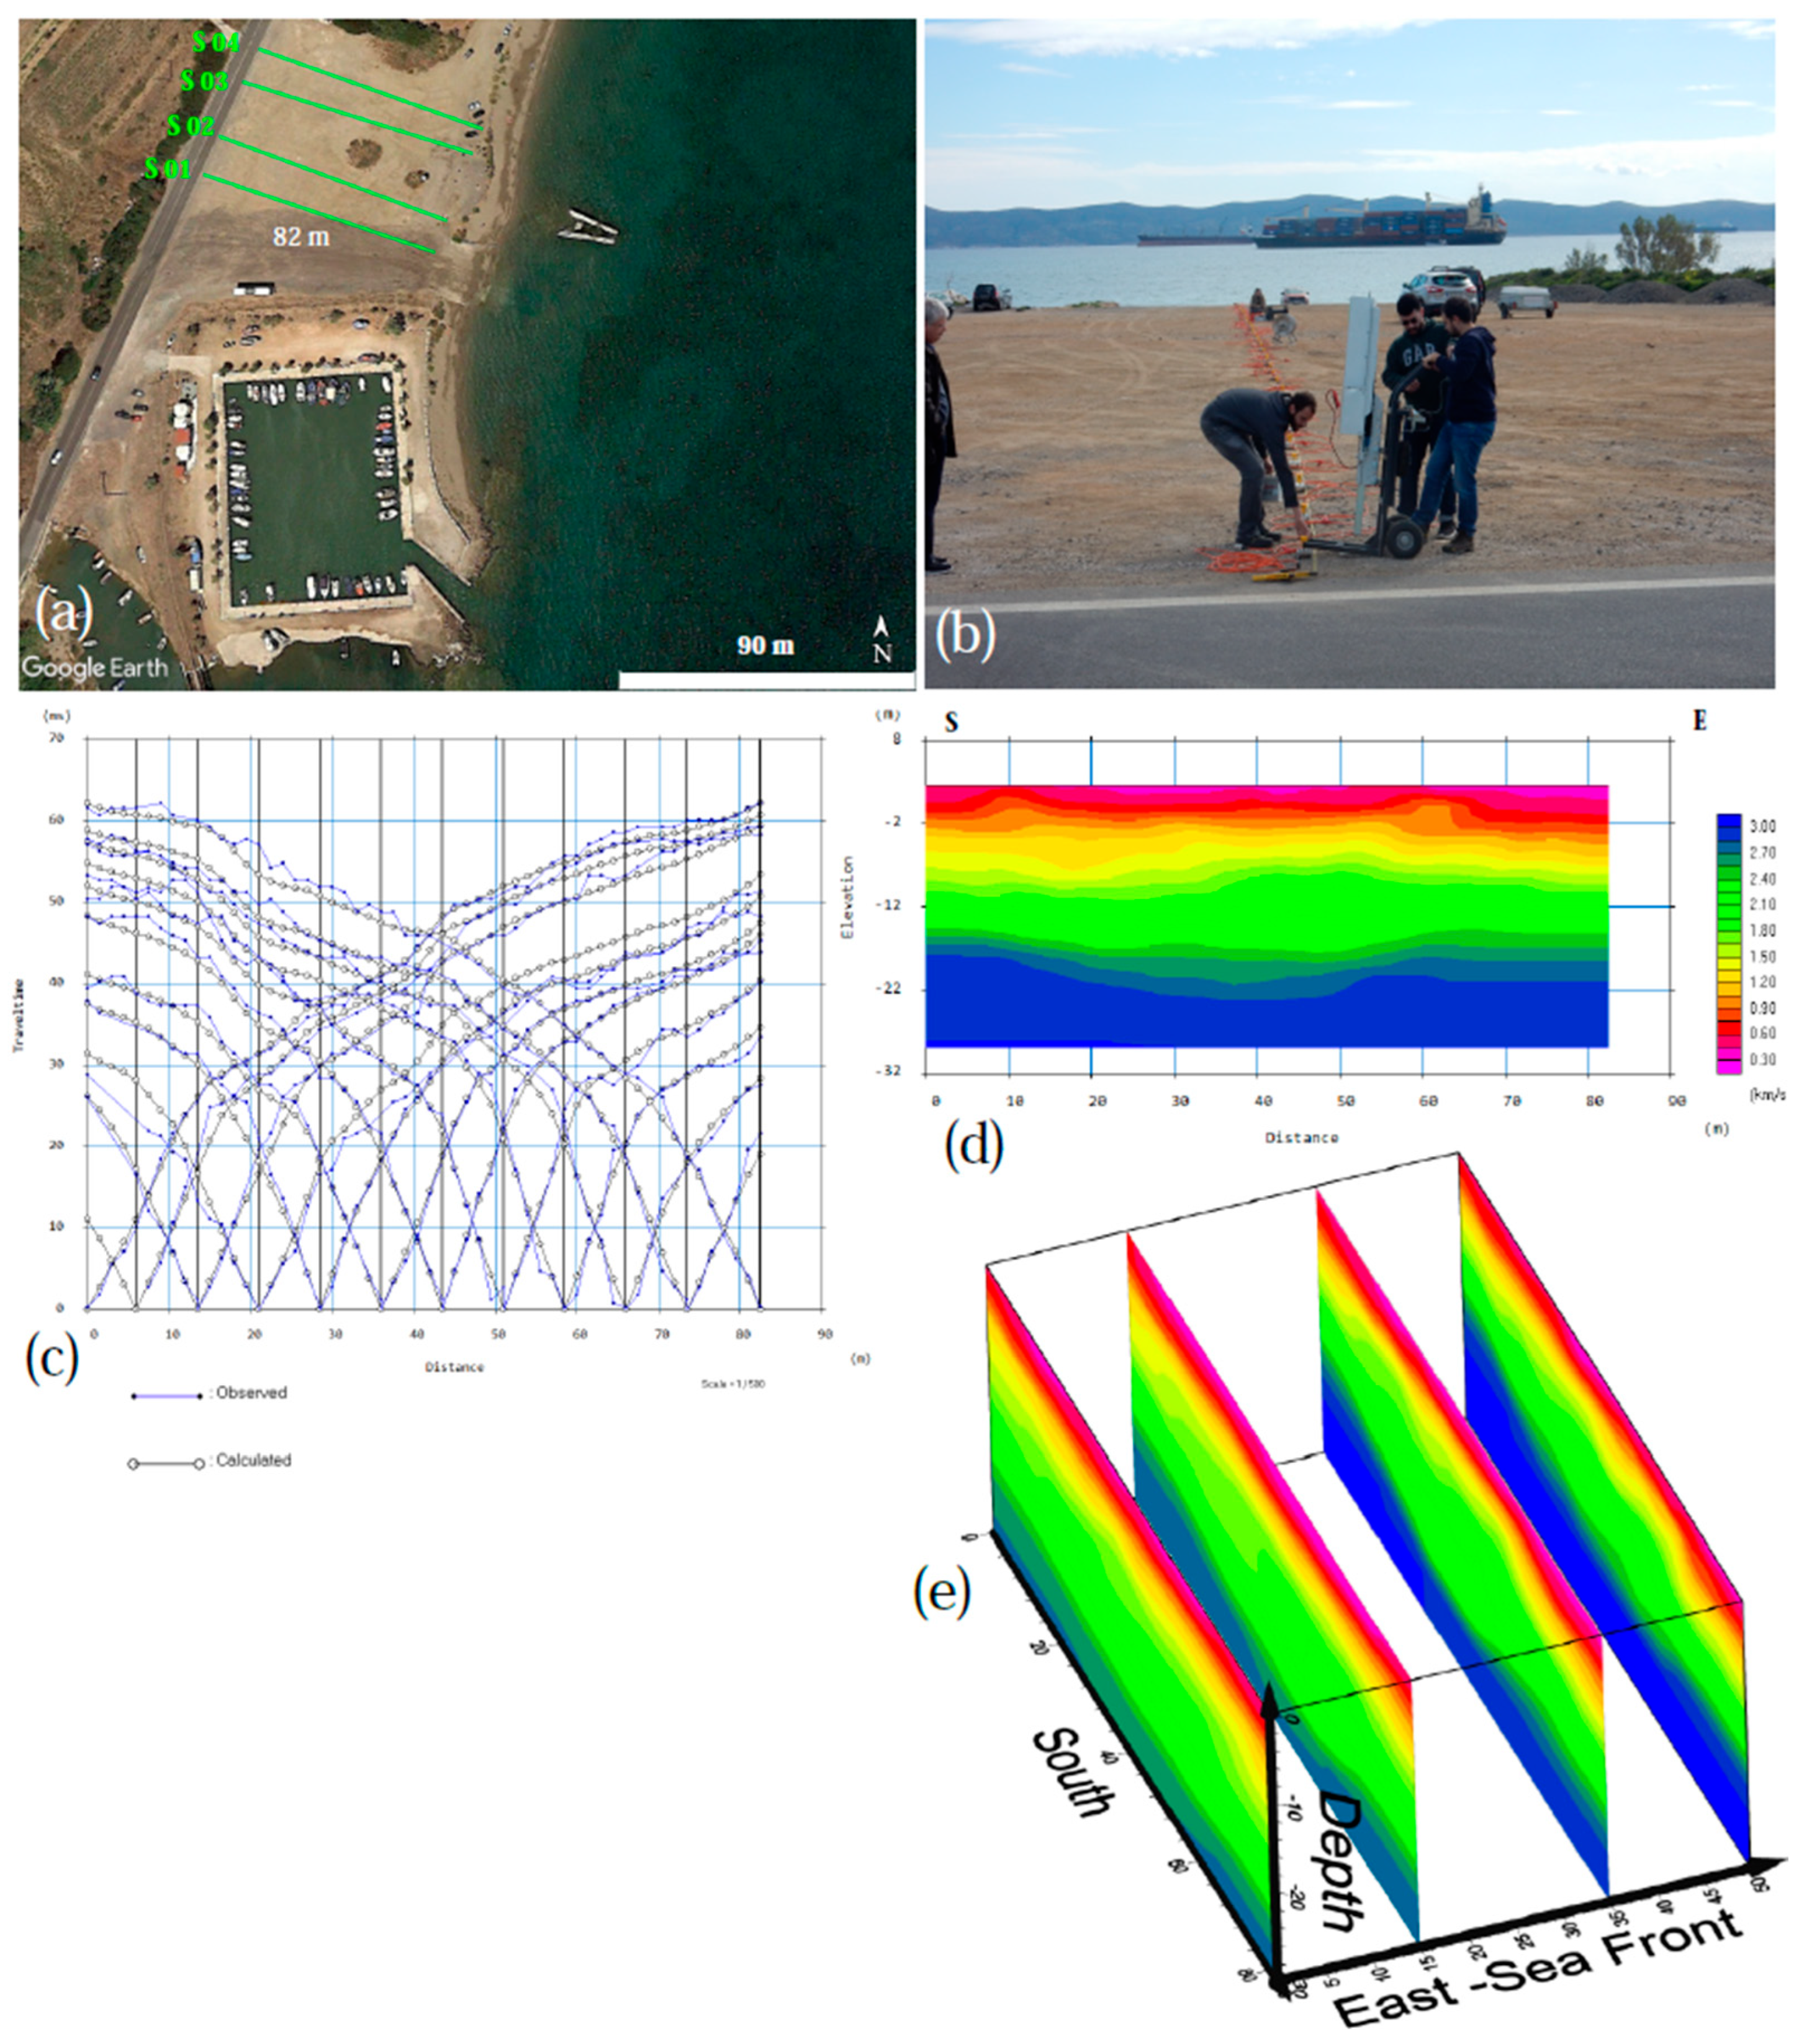
In accordance with the resistivity data, seismic refraction data were collected in order to identify the bedrock formation and its extension. Four parallel seismic profiles were acquired oriented perpendicular to the shoreline, W–E direction, following the setup of the second phase of the ERT survey (
Figure 8a). The Geometrics Strataview (60 channels) seismograph and GISCO ESS-Miniseismic source were used to perform the seismic surveys. Geophones (4.5 Hz) were deployed along the seismic lines with 1.5 m spacing, with a profile length of 82 m, and shot points were placed every 5 m (
Figure 8b).
Seisimager software (v. 2.73) [
53] was used for data pre-processing. The data show great signal/noise ratio (
Figure 8c) with this condition to extend to every seismic shot of the data set.
The results of the seismic refraction tomography (
Figure 8) revealed three different layers.
The superficial layer to the depth of 8–10 m with Vp 0.5–1.3 km/sec was identified with all of the former geophysical methods. This layer consists of coarse loose material of various levels of compaction originating from the torrential deposits of the Adami river and anthropogenic activity, an age-old process that has been taking place.
The two following layers, one with Vp 1.3–2.7 km/s and 10–14 m depth and the deep one with Vp greater than 2700 km/s, with their interface not being detected by the resistivity tomography, could either be both bedrock/marble with different compactions or the upper layer dense comprising coarse material and the lower one bedrock, all full of saline water.
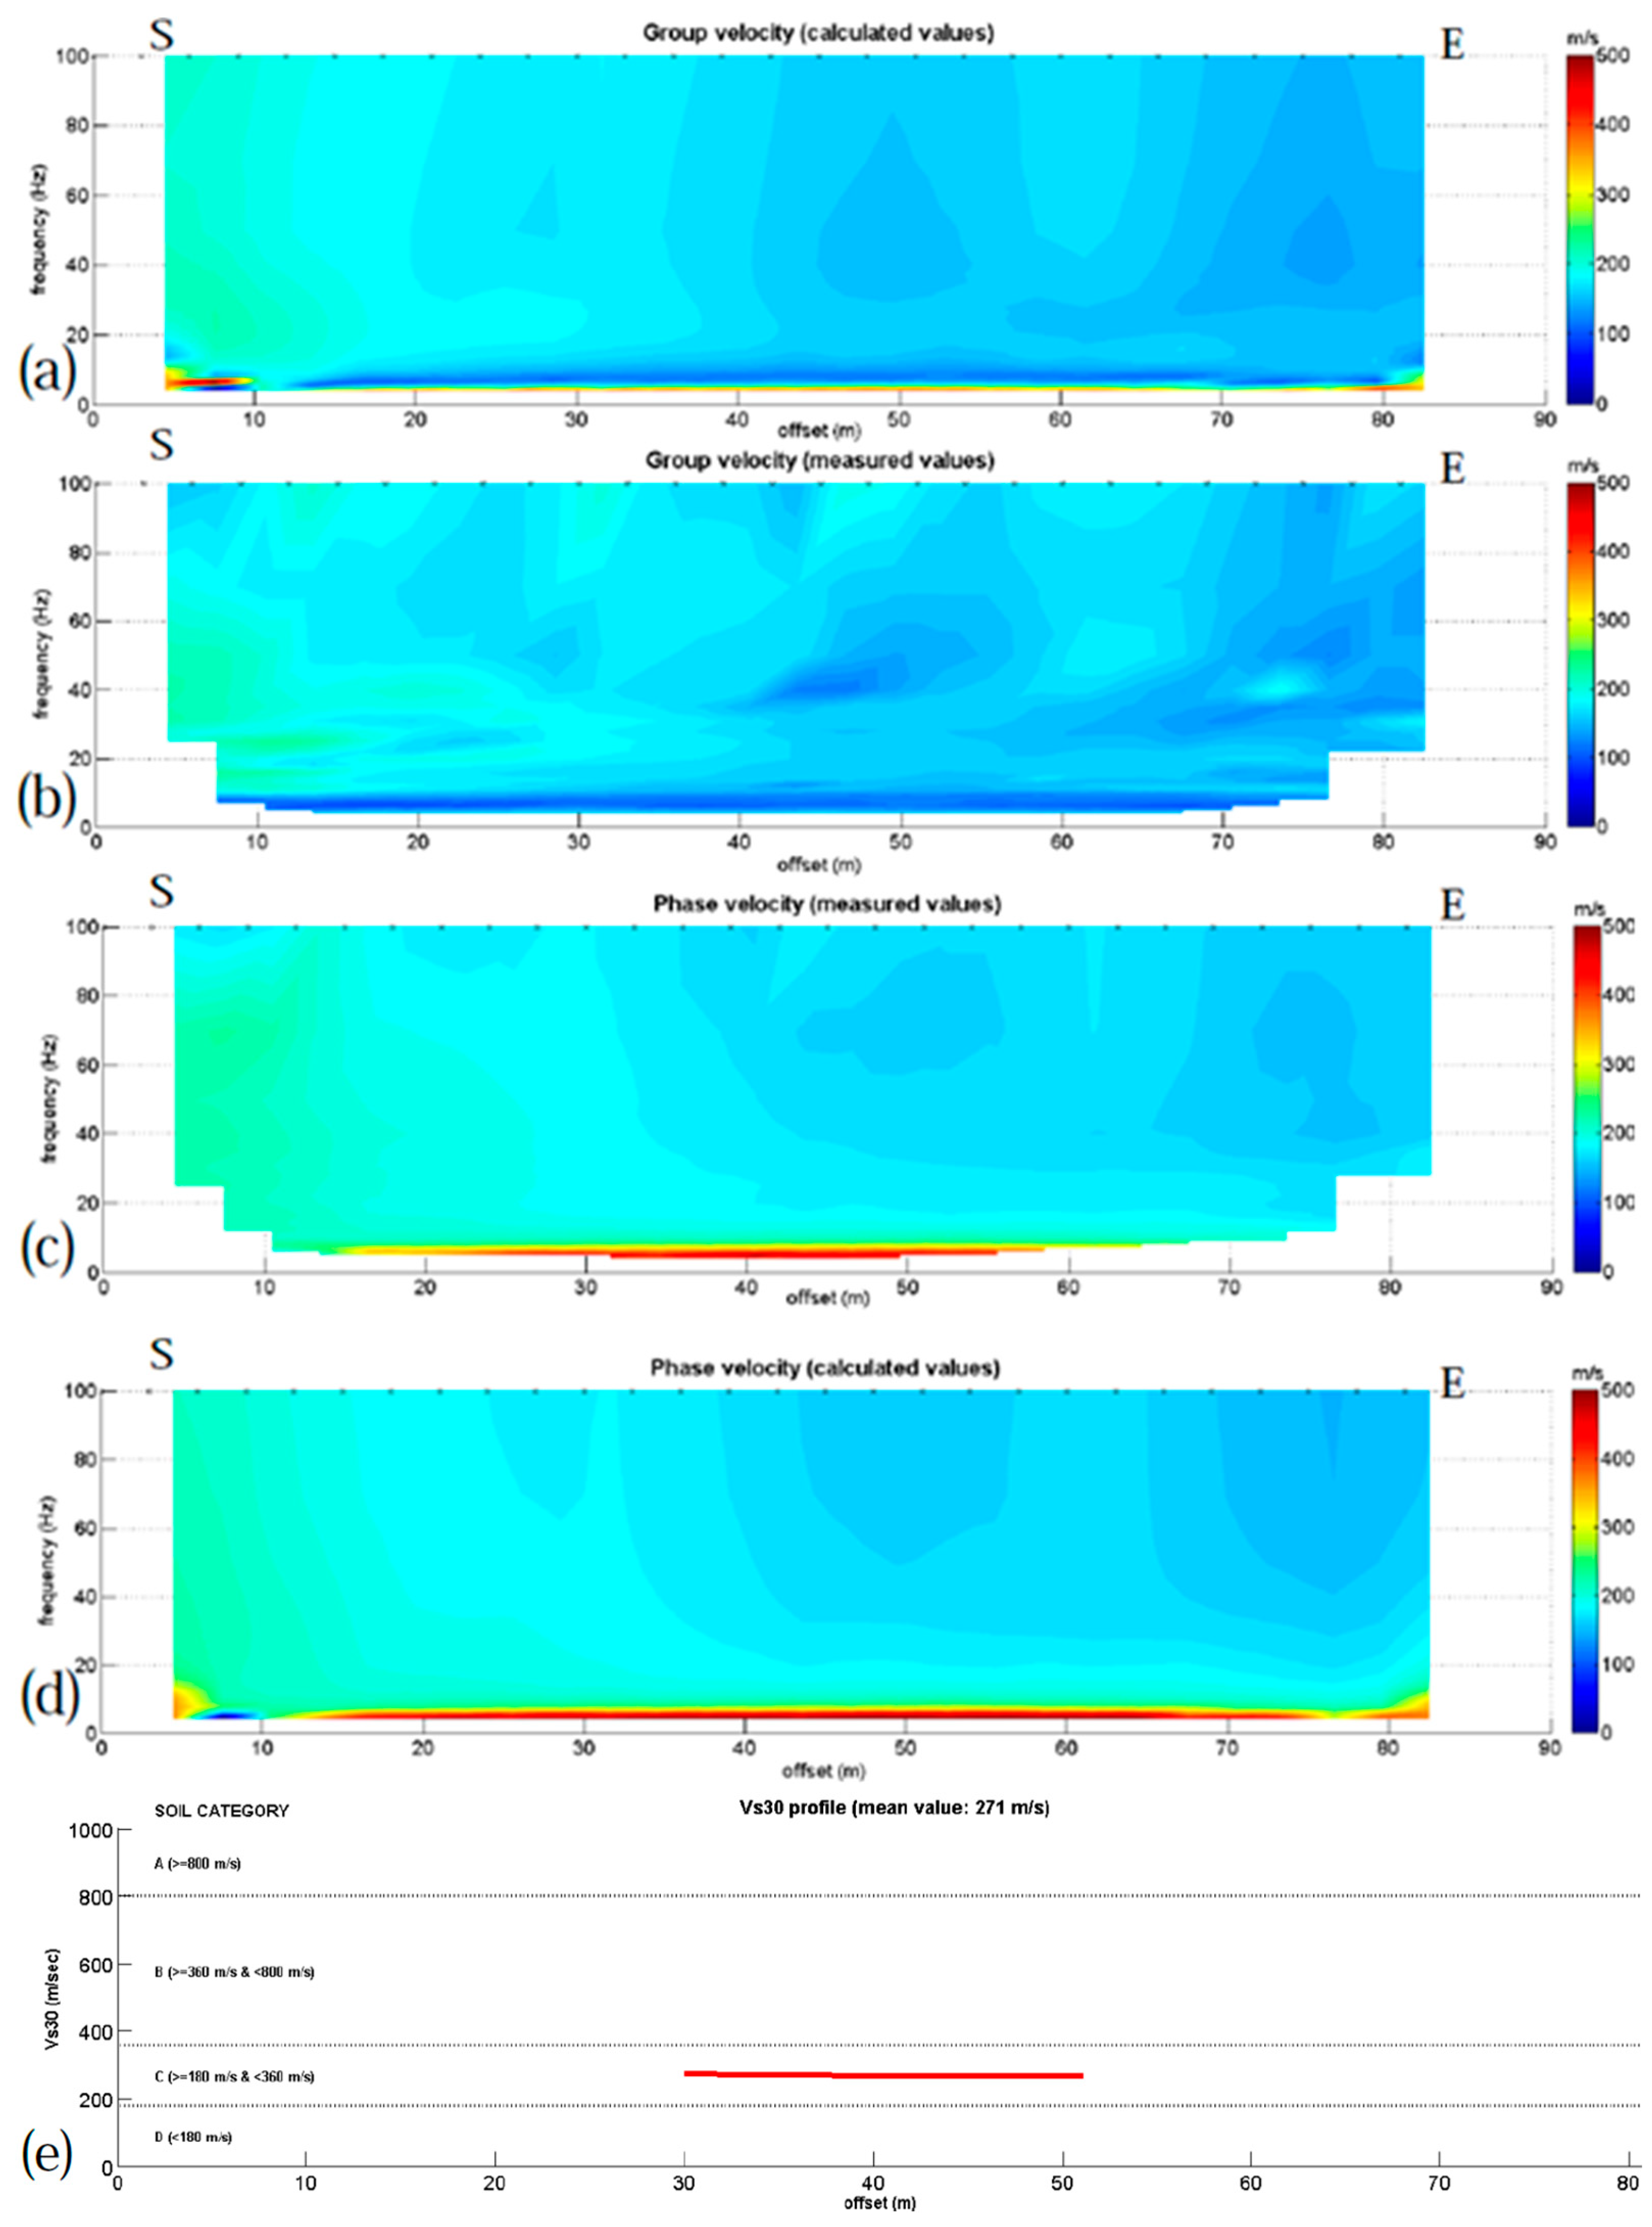
In order to solve this dilemma and have a better understanding of the stratigraphy, we used surface waves analysis (MASW). The main advantage of this method is that surface waves and the resulting velocity Vs distribution are not affected by the saline water’s presence. A 2D technique which better correlates the resulting section with the ones taken by the other methods is preferable. The common-mid-point cross-correlation stacking tomography technique (CMPCCST) [
54] is an alternative approach to estimate the frequency-dependent spatial distribution of Rayleigh waves’ group and phase velocity throughout an active seismic network.
The method employs a novel approach, integrating a stacking-based common-mid-point (CMP) cross-correlation (CC) analysis technique. This is combined with the precision of the travel-time tomography method, typically utilized in regional seismological studies. The objective is to construct detailed, frequency-dependent group and phase velocity maps. These maps are capable of detecting both lateral and in-depth velocity variations within a survey area. The main analysis is based on partitioning the different wave propagation directions (3D approach), weighting the CC frequency–velocity analysis around one wavelength, and stacking the CMP dispersion images. The CMPCCST method is well adapted to near-surface active seismic surveys for the creation of the quasi-3D Vs model of the area under investigation and can be implemented in both 2D and 3D active seismic data acquisition schemes involving both uniform and non-uniform layouts of receivers.
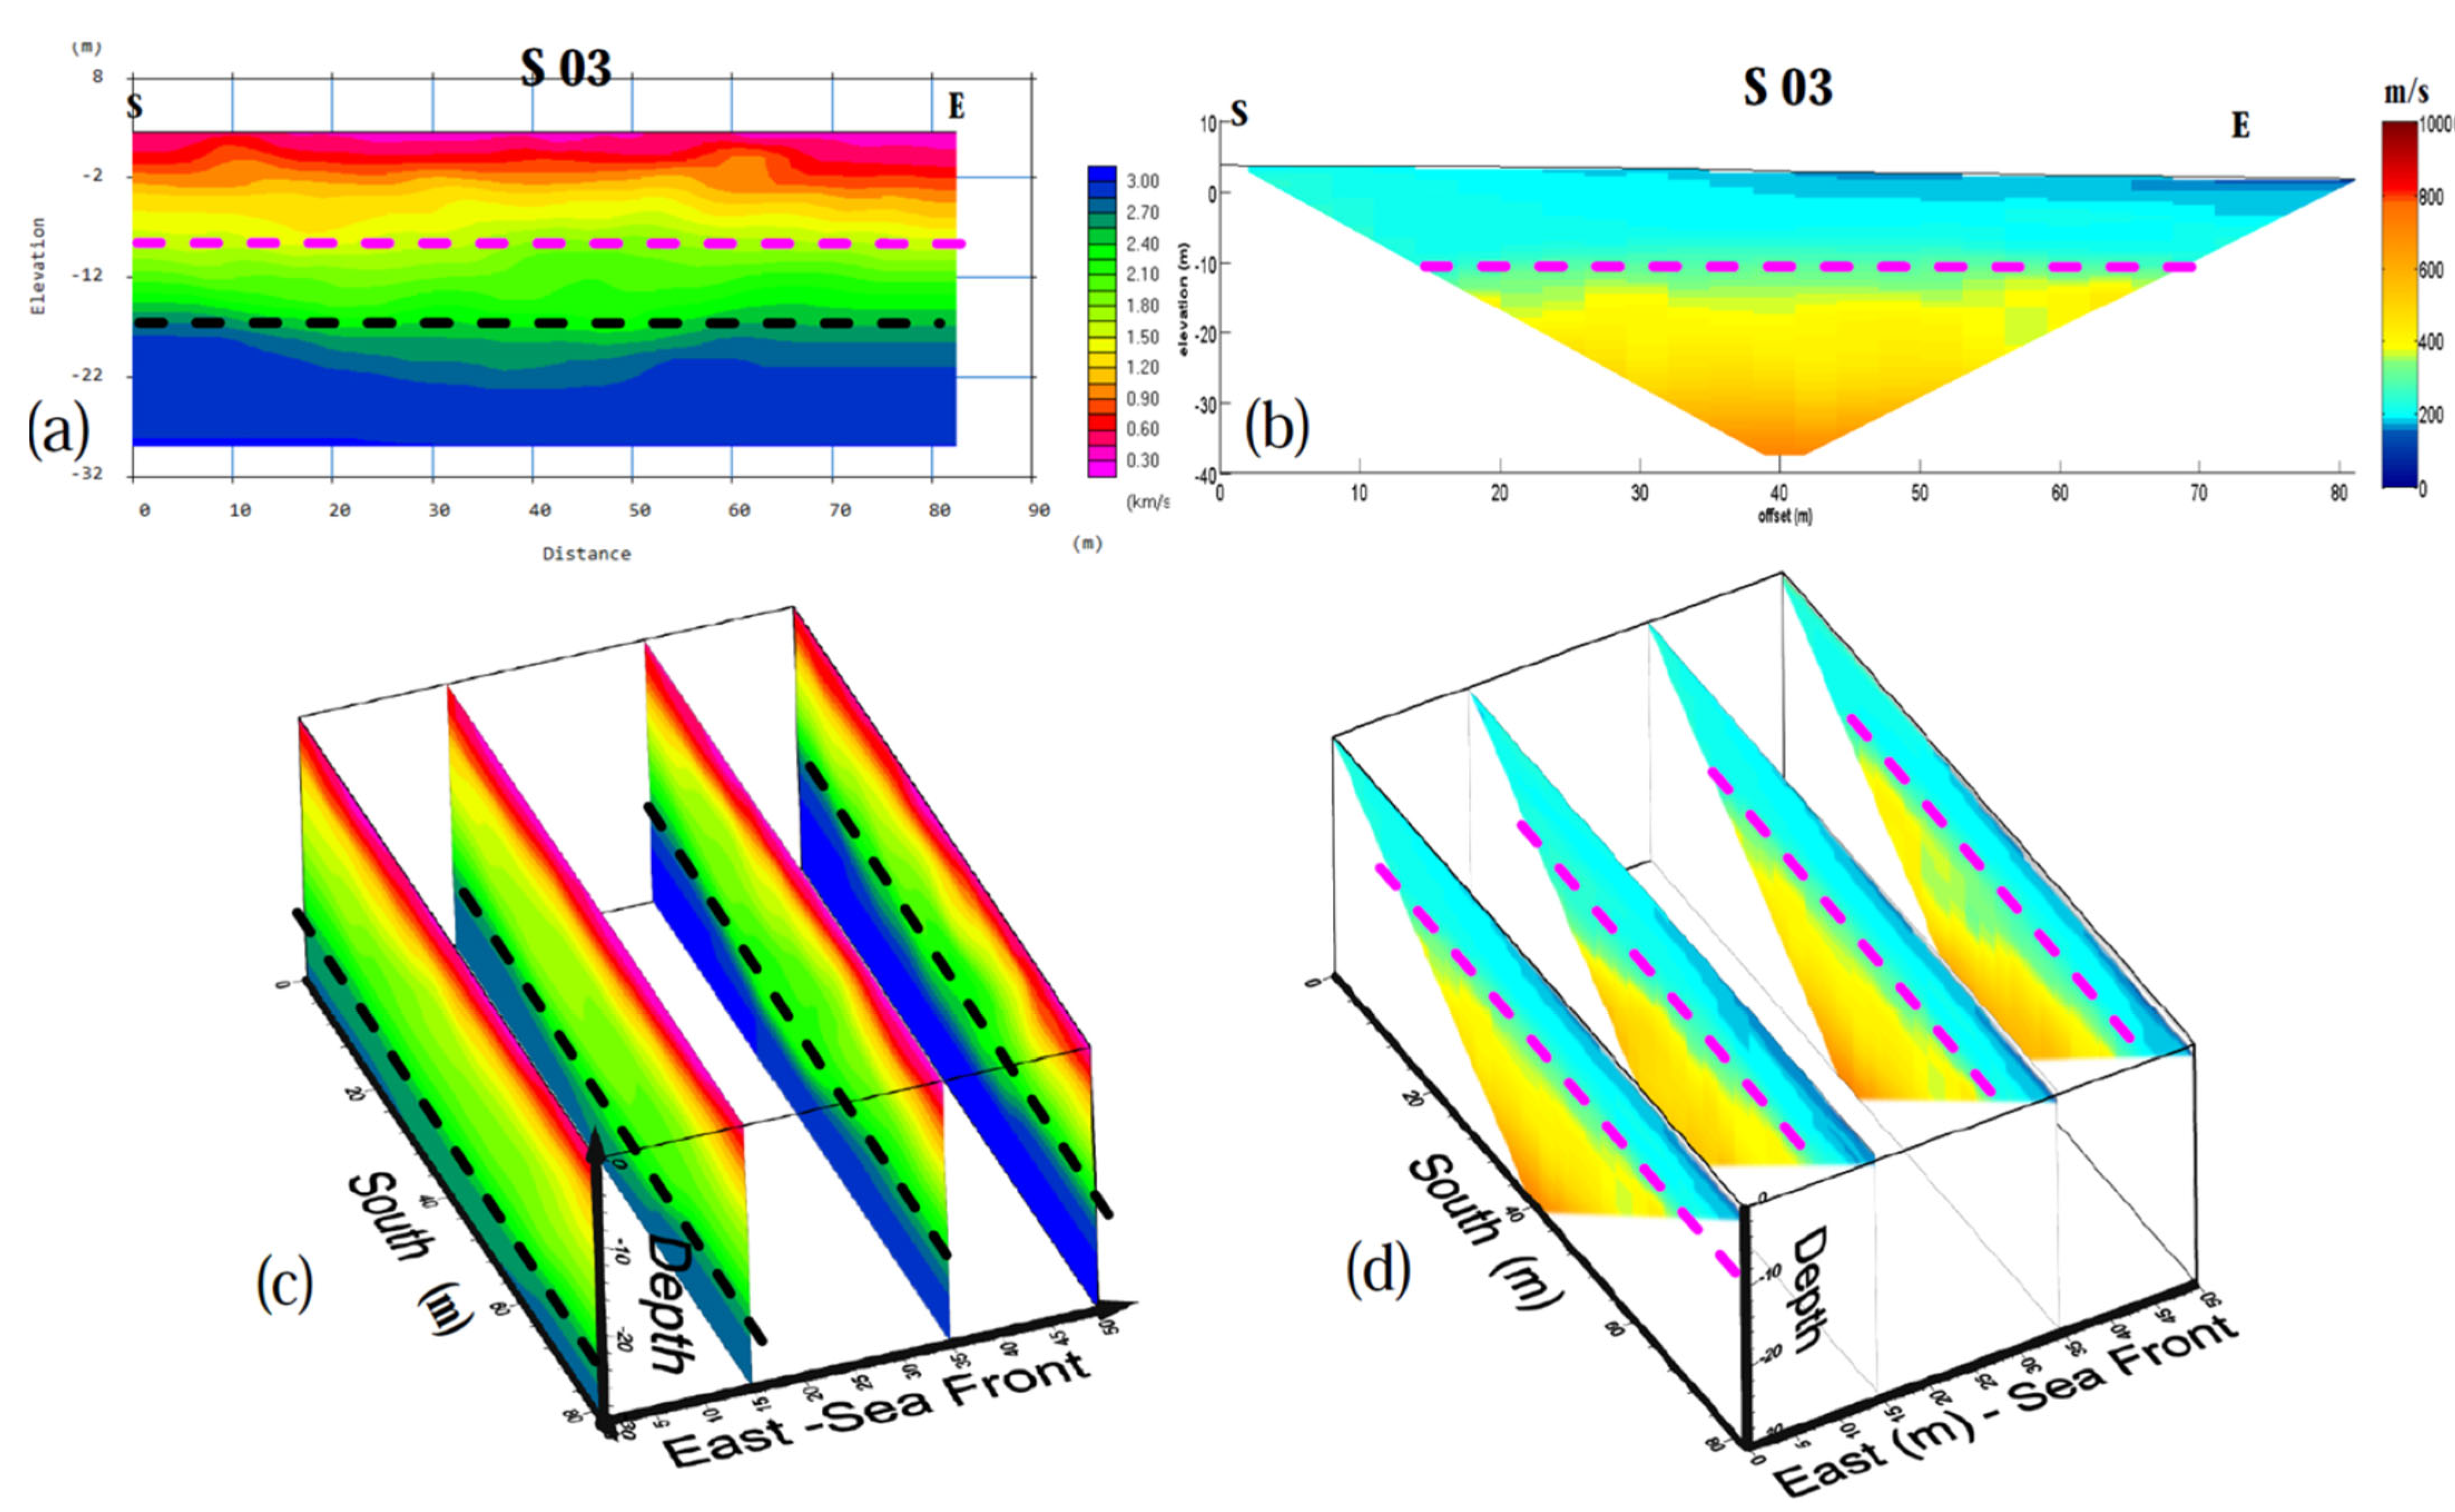
CMPCCST with the analysis of phase and group velocities (
Figure 9a–d) for seismic profile “S03” resulted in the Vs seismic section (
Figure 10b). This provided the answer to the question, indicating that marble/bedrock underlie the superficial coarse material layer at depths of about 10 m, full of saline water. In addition, refraction tomography (
Figure 10a) divides marble into two different compaction zones at a depth of about 14–15 m.
Both the refraction tomography and surface waves analysis sections, all in 3D mode (
Figure 10c,d), show marble top relief at the same level (about 3 m) with its compacted zone top relief dipping to the south.
Additional information for engineers is provided by CMPCCST with Vs30 distribution in seismic profile S03 (
Figure 9e).
3.5. Integrated Analysis of Geophysical Survey Results
In
Figure 11, we showcase selected results from our integrated geophysical survey, presenting the synergy between various survey methods.
Figure 11a displays the apparent conductivity distribution map at an effective depth of 6 m, overlaid on Google Earth imagery, where high values (outlined with a black dashed line) potentially indicate sea water intrusion, suggesting a preferential pathway. This is also supported by
Figure 11b, where a GPR slice over the same area reveals high amplitude values. These values are thought to be associated with a buried marble structure or pier that extends inland, which has an offshore continuation near the shoreline. Both the buried structure (black dashed line) and the sea water intrusion zone (red dashed line) are outlined in the resistivity model obtained from the 3D ERT survey (
Figure 11c). The resistivity model is predominantly influenced by saline water intrusion and thus has not discriminated preamble loose formations and bedrock (marble), both having low resistivity values. However, the 2D analysis of surface waves (
Figure 11d), accurately identified the bedrock top relief (magenta dashed line). This pivotal detail is highlighted by a magenta dashed line in the resistivity model (
Figure 11c) with all other features also visible.
4. Discussion
This present study introduces an integrated geophysical approach for complex coastal environments. It outlines a series of specific steps that begin with a broader regional geophysical investigation using FDEM and 3D ERT as well as the seismic method and, followed by a geophysical survey of the local region using 3D GPR and 3D ERT, ultimately provide engineers with valuable detailed information for upcoming anthropogenic activities. Our case study area, the Thorikos Valley, is considered a complex coastal environment where the aforementioned environmental threats and engineering issues appear.
The results of the proposed methodology can be summarized as follows: As a first step of the regional investigation, assessment and interpretation of the geological and geo-morphological information provided of the coastal zone is very beneficial.
The initial geophysical method, FDEM measurements, is considered the most suitable reconnaissance technique due to its efficiency in terms of time and its ability to cover extensive areas while providing valuable results. In particular, the maps of apparent conductivity distribution represent the spatial extent of formations and local structures, as well as the influence of sea water intrusion inland, regarding coastal areas. Furthermore, the maps of conductivity distribution at three investigation depths can specify the evolution of the superficial deposited material. Moreover, this technique allows us to distinguish any geo-morphological processes (e.g., torrential deposits of coarse material) due to human activity (e.g., embankments) on a local scale. Finally, maps of inphase component distribution may show soil-covered metallic anthropogenic constructions.
The second phase includes 3D GPR mapping of the designated area. This involves high resolution analysis and detection of local features. The generated depth slices help confirm whether the pathways of seawater are connected with buried structures. In addition, presenting the geo-referenced depth slices on Google Earth maps allows us to interpret possible target (hyperbolas or local high reflectivity) and their continuation offshore. Another valuable aspect of the GPR slices is the detection of superficial stratigraphy, always considering the attenuation of EM signal with saline water presence.
The following step, after acquiring spatial information for formations and local structure distribution, is subsurface imaging with three-dimensional resistivity tomography appropriately designed in the field. This phase comprises two design components: (i) a local 3D ERT survey to confirm the anthropogenic buried structures and their spatial extent in great detail and (ii) a broader 3D ERT survey to obtain valuable information about the stratigraphy. In both phases, U-shaped survey lines were used, with the inline electrodes in a dense mode and the longer detection in the direction normal to the one we are interested to see in detail the underground. The distance between the lines of electrodes is dependent on the area to be covered with the U-shaped profiles. The measuring protocols result in measuring points both along the lines and between them. This 3D data acquisition setup enhances spatial coverage and accuracy of the desired subsurface imaging. A 3D ERT survey is highly recommended for the detection of saline water and its pathways. It also reveals the bedrock in cases of an impermeable formation and mapping of the upwelling front. An important question that is often raised regarding coastal-zone lithology is how the saline water intrusion influences the formations and thus the interpreted lithology from the ERT.
The final phase involves the use of the seismic method. The results from the previously applied FDEM, GPR, and ERT methods are drastically influenced by seawater by also providing identification of the litho-stratigraphy. The seismic method can distinguish formations in respect of compaction, identifying the important interface between loose sediments and the bedrock; these issues are of great interest to engineers. Seismic velocities can provide useful information on excavability, which is a crucial aspect of an engineering project. After interpretation, the seismic refraction tomography (SRT) field setup leads to the resulting seismic section of the underground with its Vp distribution. The presence of saline water influences Vp distribution, adding an interface with its presence. MASW provides 2D or 3D seismic models of Vs distribution by specifically using the CMPCCST, thus enhancing the existing valuable information obtained from the SRT by offering additional geotechnical details without the influence of sea water presence. Surface waves analysis revealed formations on the stratigraphy due to a compaction factor, clearly showing the interface between loose sediments and the bedrock. The ability of the technique to provide reliable results in terms of stratigraphy in such complex coastal settings makes this technique a valuable asset of the proposed methodology.
Focusing on the results/findings of our case study in Thorikos coastal area, the proposed geophysical survey provided the stratigraphy of lithological and geotechnical aspects as well as hidden local structures. More specifically, the anthropogenic marble structure’s remains were detected in greater detail inland. It is evident that, over the past few years, the old offshore marble pier has extended into the eastern part of Thorikos Gulf, reclaiming an area that was once submerged in water. The geo-morphological evolution of the area is a result of two processes. This first is connected to the extensive flow of the Adami River, which has caused massive torrential deposits in the Thorikos Gulf, while the second involves the deposition of coarse material due to human activity, mainly coming from metallurgical activity (metallurgical processing remains) and construction activity (the recent construction of the port, roads, and residential expansion). The bedrock top relief has been revealed at its realistic depth with the use of all available geophysical methods. ERT was able to identify the phyllitic cover at depth as an impermeable formation, while the upper marble, a permeable to sea water formation, was detected and classified via the seismic method
This study proposes an integrated geophysical methodology combined with geological and geo-morphological aspects in complex coastal environments. The applied approach aims to provide a complete information package to the modern-day engineer in order to approach specific challenges in coastal settings, which can be substantially improved with borehole data at specific sites following an integrated geological–geo-morphological–geophysical study.


