1. Introduction
This study describes fluorescent research on marine sediments. In 1786, the poet Goethe, an enthusiastic collector of minerals, showed that while sending colored light (through filters) onto a heated barite crystal, only blue light induced luminescence. Georges Stokes observed luminescence while studying fluorite and gave to this phenomenon the name of
fluorescence [
1,
2]. Fluorescence as an optical phenomenon is produced by the transition of optically stimulated outer-orbital electrons from one lower-energy state to a higher-energy state with light (photons) emitted upon the electron’s return to a lower-energy state. A luminescent mineral is a solid, which converts certain types of energy into electromagnetic radiation over and above thermal radiation. The electromagnetic radiation emitted by a luminescent mineral is usually in the visible range [
2]. As Gaft et al. (2015) note, luminescence is usually characterized by its quantum yield. The quantum yield is the ratio of the number of photons emitted to the number absorbed. Luminescence centers, in minerals, with the largest quantum yields display the brightest emission or fluorescence. It should be noted that a mineral’s fluorescence is different from its color [
3]. There are coincidences, such as the color and fluorescence of rubies being red. In the ruby example, impurity-ionic substitutions in the crystal structure create energy levels that are excited by light absorption, yielding color. Nassau [
3] identifies this as impurity-caused color. Color, otherwise, typically arises from the presence of unpaired electrons in ionic crystals. Metal impurities include chromium, cobalt, iron, and manganese, to name but a few of the more common.
As Nassu and others [
3] note, most pure minerals do not fluoresce. Impurities, such as manganese, iron, chromium, etc., acting as “activators” or “luminescent centers” must be present to introduce a sufficient number of energy levels in the mineral to allow fluorescence to occur. Iron, particularly Fe
2=, can dampen fluorescence [
3]. Marine minerals will be shown to have the kinds of impurity atoms (Mn
2+, Cr
3=, Al
3+, etc.) capable of nucleating fluorescence.
Taraschan [
4], whose work has unfortunately not been translated into English, is practically unknown to non-Russian-speaking scientists, has extensively studied the field of mineral luminescence [
2] (Gaft et al., 2015). A detailed summary of some key elements in the history of luminescent studies of minerals can be readily found in these references [
5,
6,
7,
8,
9,
10]. These references include the work of Gorobets and Rogojine (2001), “
Luminescent Spectra of Minerals” [
11], in which the authors created the first systematic compilation of the luminescence spectra of minerals together with contemporary interpretation of the luminescence centers found in nature.
Of the various “excitors” used in luminescence studies—optical, photo, cathode and X-ray—ultraviolet (UV) is the most widely used optical method [
12]. Blue light-stimulated fluorescence, in comparison, has been less widely utilized than UV. Dravis and Yurewicz [
13] and Dravis [
14] examined blue light fluorescence in carbonates.
Dravis and Yurewicz found that of the methods used—UV, blue, and green light—blue light yielded the best results, with stronger fluorescence. Mazel and Verbeek [
15] used blue light on a suite of 38 minerals in the Sterling Hill Collection known to fluoresce [
16]. The same light source was used in this study. Blue light stimulation is also regularly used in Optical Stimulation Luminescence (OSL) dating [
17].
To our knowledge, little fluorescent research has been conducted on marine sediments. Fluorescent study of marine organisms such as corals has a recent history, particularly with regard to ultraviolet light [
18,
19]. Fluorescence was demonstrated to originate in proteins within pigments of the organisms [
18,
19,
20]. Mazel [
15], in particular, discussed the use of blue light in underwater settings.
Mazel and Verbeek [
15] noted that short-, medium-, and long-range- (254–365 nm) wavelength UV is a standard source in most fluorescence studies of minerals. Dravis and Yurewicz [
13] discussed how UV and blue light are commonly used filters in fluorescent incident-light microscopy of carbonate minerals. Those authors suggested the fluorescence in dolomites or feldspar results from residual organic matter preserved during dolomitization [
13]. Calcites were readily identified in thin sections. Aragonite, a marine cement, fluoresced brightly as well.
Mazel and Verbeek report deep red fluorescence for marble under long-wavelength UV [
15]. Blue light increases the fluorescence in the blue and green spectrum. Scapolite (Ca
4Al
6Si
6O
24CO
3) and Wollastonite (CaSiO
3) occur in limestones, resulting in pastel blue emissions under UV light. As an impurity, Fe
3+ was suggested as the luminescent ion responsible for the fluorescent response. Blue light shifts this fluorescence to yellow-cream [
15]. Dravis [
14] notes that blue light fluorescence readily identifies anhydrites as well as dolomites. Together with fluorite (bright green) and sphalerite (red), dolomite fluoresces bright green, orange, and red in blue light.
Christensen et al. (20), and Brown and Christensen [
21] examined blue light-induced fluorescence of bone underwater in contrast to UV and long-wavelength sources. Bone and teeth fluoresce yellow to orange (2014). Christensen et al. suggested bone collagen contributed most significantly to its fluorescent properties [
20].
This study had two primary objectives:
Examine mineral fluorescence in marine sediments under different portions (90) of the visible and invisible light spectrum.
Identify specific minerals within the sediments responsible for the fluorescence observed.
2. Methods
We have collected many samples during research expeditions off the Georgia Bight conducted for other purposes. This study evolved out of that research. Our two main ways of collecting sediment samples are via PONAR grabs from smaller vessels, and box cores taken using the R/V Savannah. Box coring was found to be the better of the two options, as it allowed us to penetrate past the palimpsest sediment on the seafloor. These box core samples underwent particle size analysis (PSA), which was performed mechanically or by using a pipette.
Our study examined sediments in situ from the sea floor in the laboratory using the SOLA Go-Be Nightsea blue light. A Tiffen Yellow 12 block filter was used to mask wavelengths below 445 nm. This barrier/block filter effectively removes any reflected blue light fluorescence. Transmission begins just below 500 nm and increases through the range above this point [
15].
Fluorescent sediments were examined using X-ray powder diffraction (XRD) with the University of Georgia Bruker D8-Advance diffractometer. (Bruker AXS SE Östliche Rheinbrückenstr. 49, 76187 Karlsruhe, Germany). Samples were initially ground using a corundum mortar and pestle and then further ground in ethanol using a McCrone micronizing mill for 10 min to reduce particle size to <10 µm. Powders were backfilled against a glass plate and pressed up to 400 psi to create a flat, self-supporting mount with minimal sample transparency. The D8 optics included a 250 cm goniometer radius, 0.6 mm divergence slit, and Bragg–Bentono geometry. A knife-edge blade was set 2 mm above the sample surface and data was collected using a cobalt radiation source (K
α1 = 1.7890 Å and K
α2 = 1.7928 Å) that was operated at 35 kV and 40 mA with a position-sensitive Lynx-Eye
® detector (Bruker, Leuven, Belgium). To verify alignment and calibration within 0.01° 2-theta tolerance of the certificate value for the brightest reflection peak position, an external NIST Reference standard SRM1976b corundum (α-Al
2O
3) was used. Using a locked–coupled continuous scan mode with a step size of 0.01° 2ϴ and a count rate of 0.2 s per step, the scan range was enhanced from 2 to 70° 2ϴ. The Bruker Eva
® program (
https://www.bruker.com/pt/products-and-solutions/diffractometers-and-x-ray-microscopes/x-ray-diffractometers/diffrac-suite-software/diffrac-eva.html, accessed on 28 April 2025) presents raw data and graphs known as diffractograms with patterns and peak positions identified. The raw data was K
α2-stripped. Peak locations were compared to information from the powder diffraction file (PDF-4+) database of the International Centre for Diffraction Data (ICDD). Eva software was used with the database to identify the best-fit phases for mineral identification.
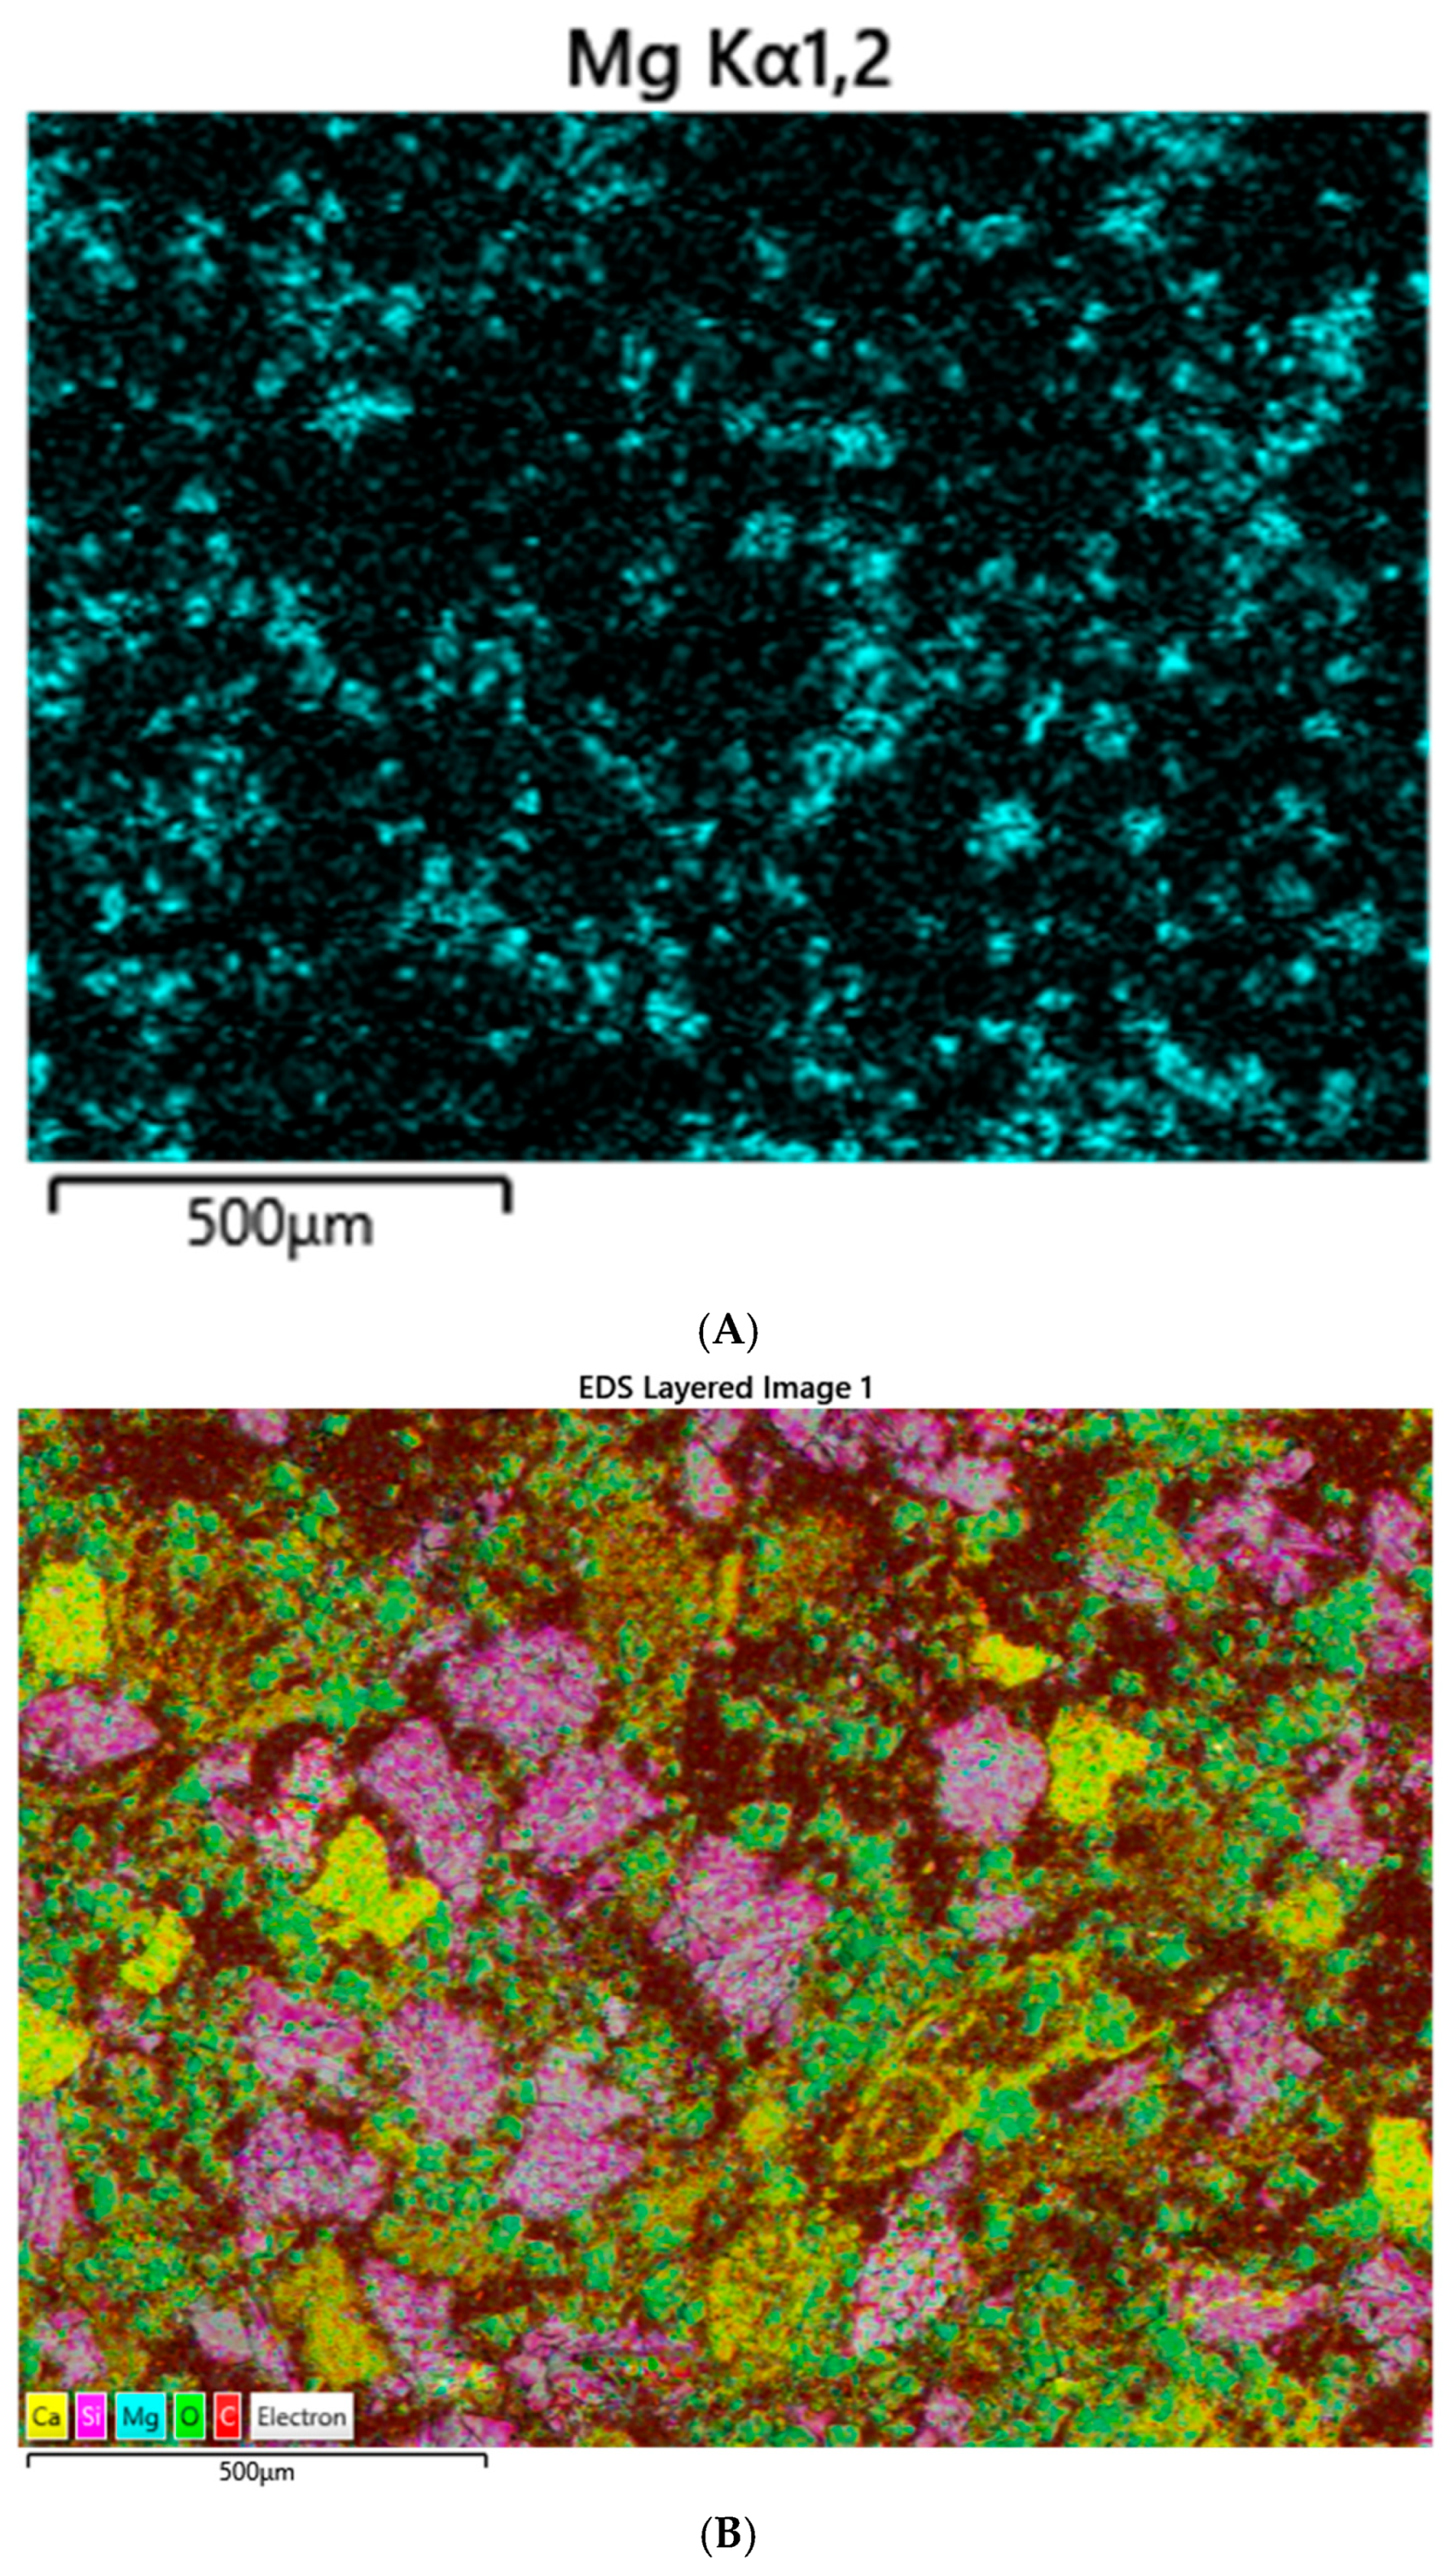
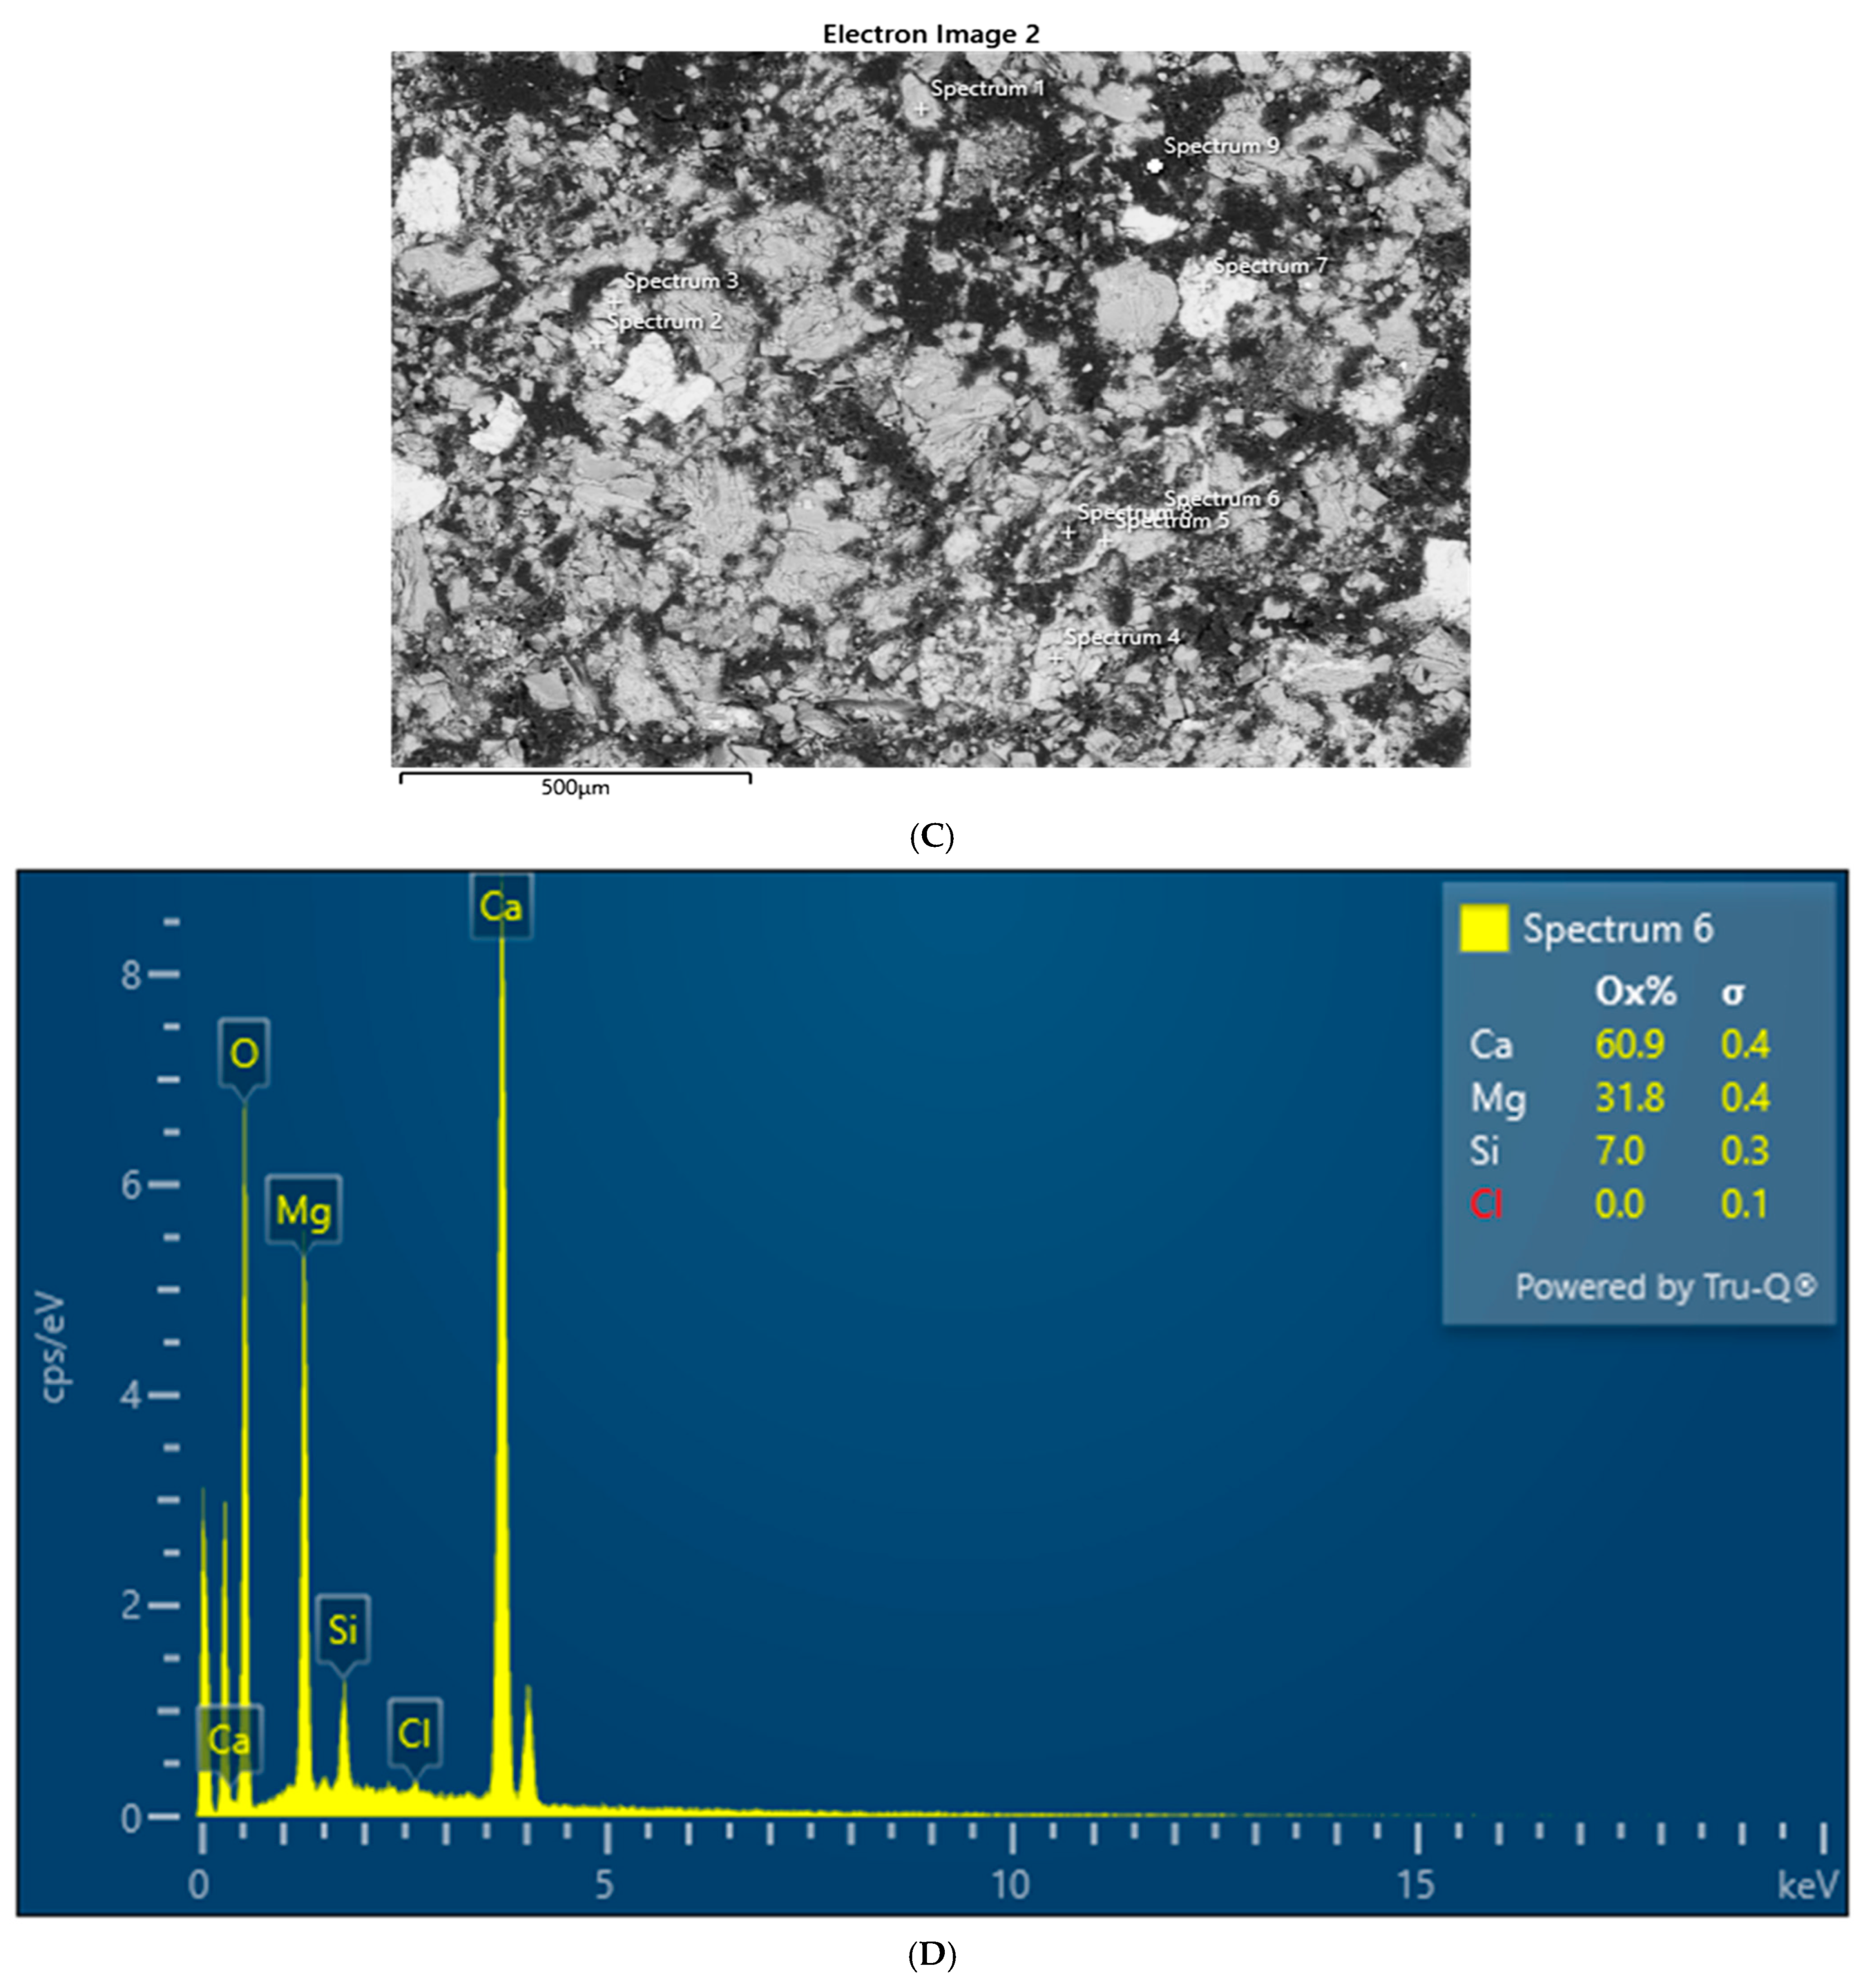
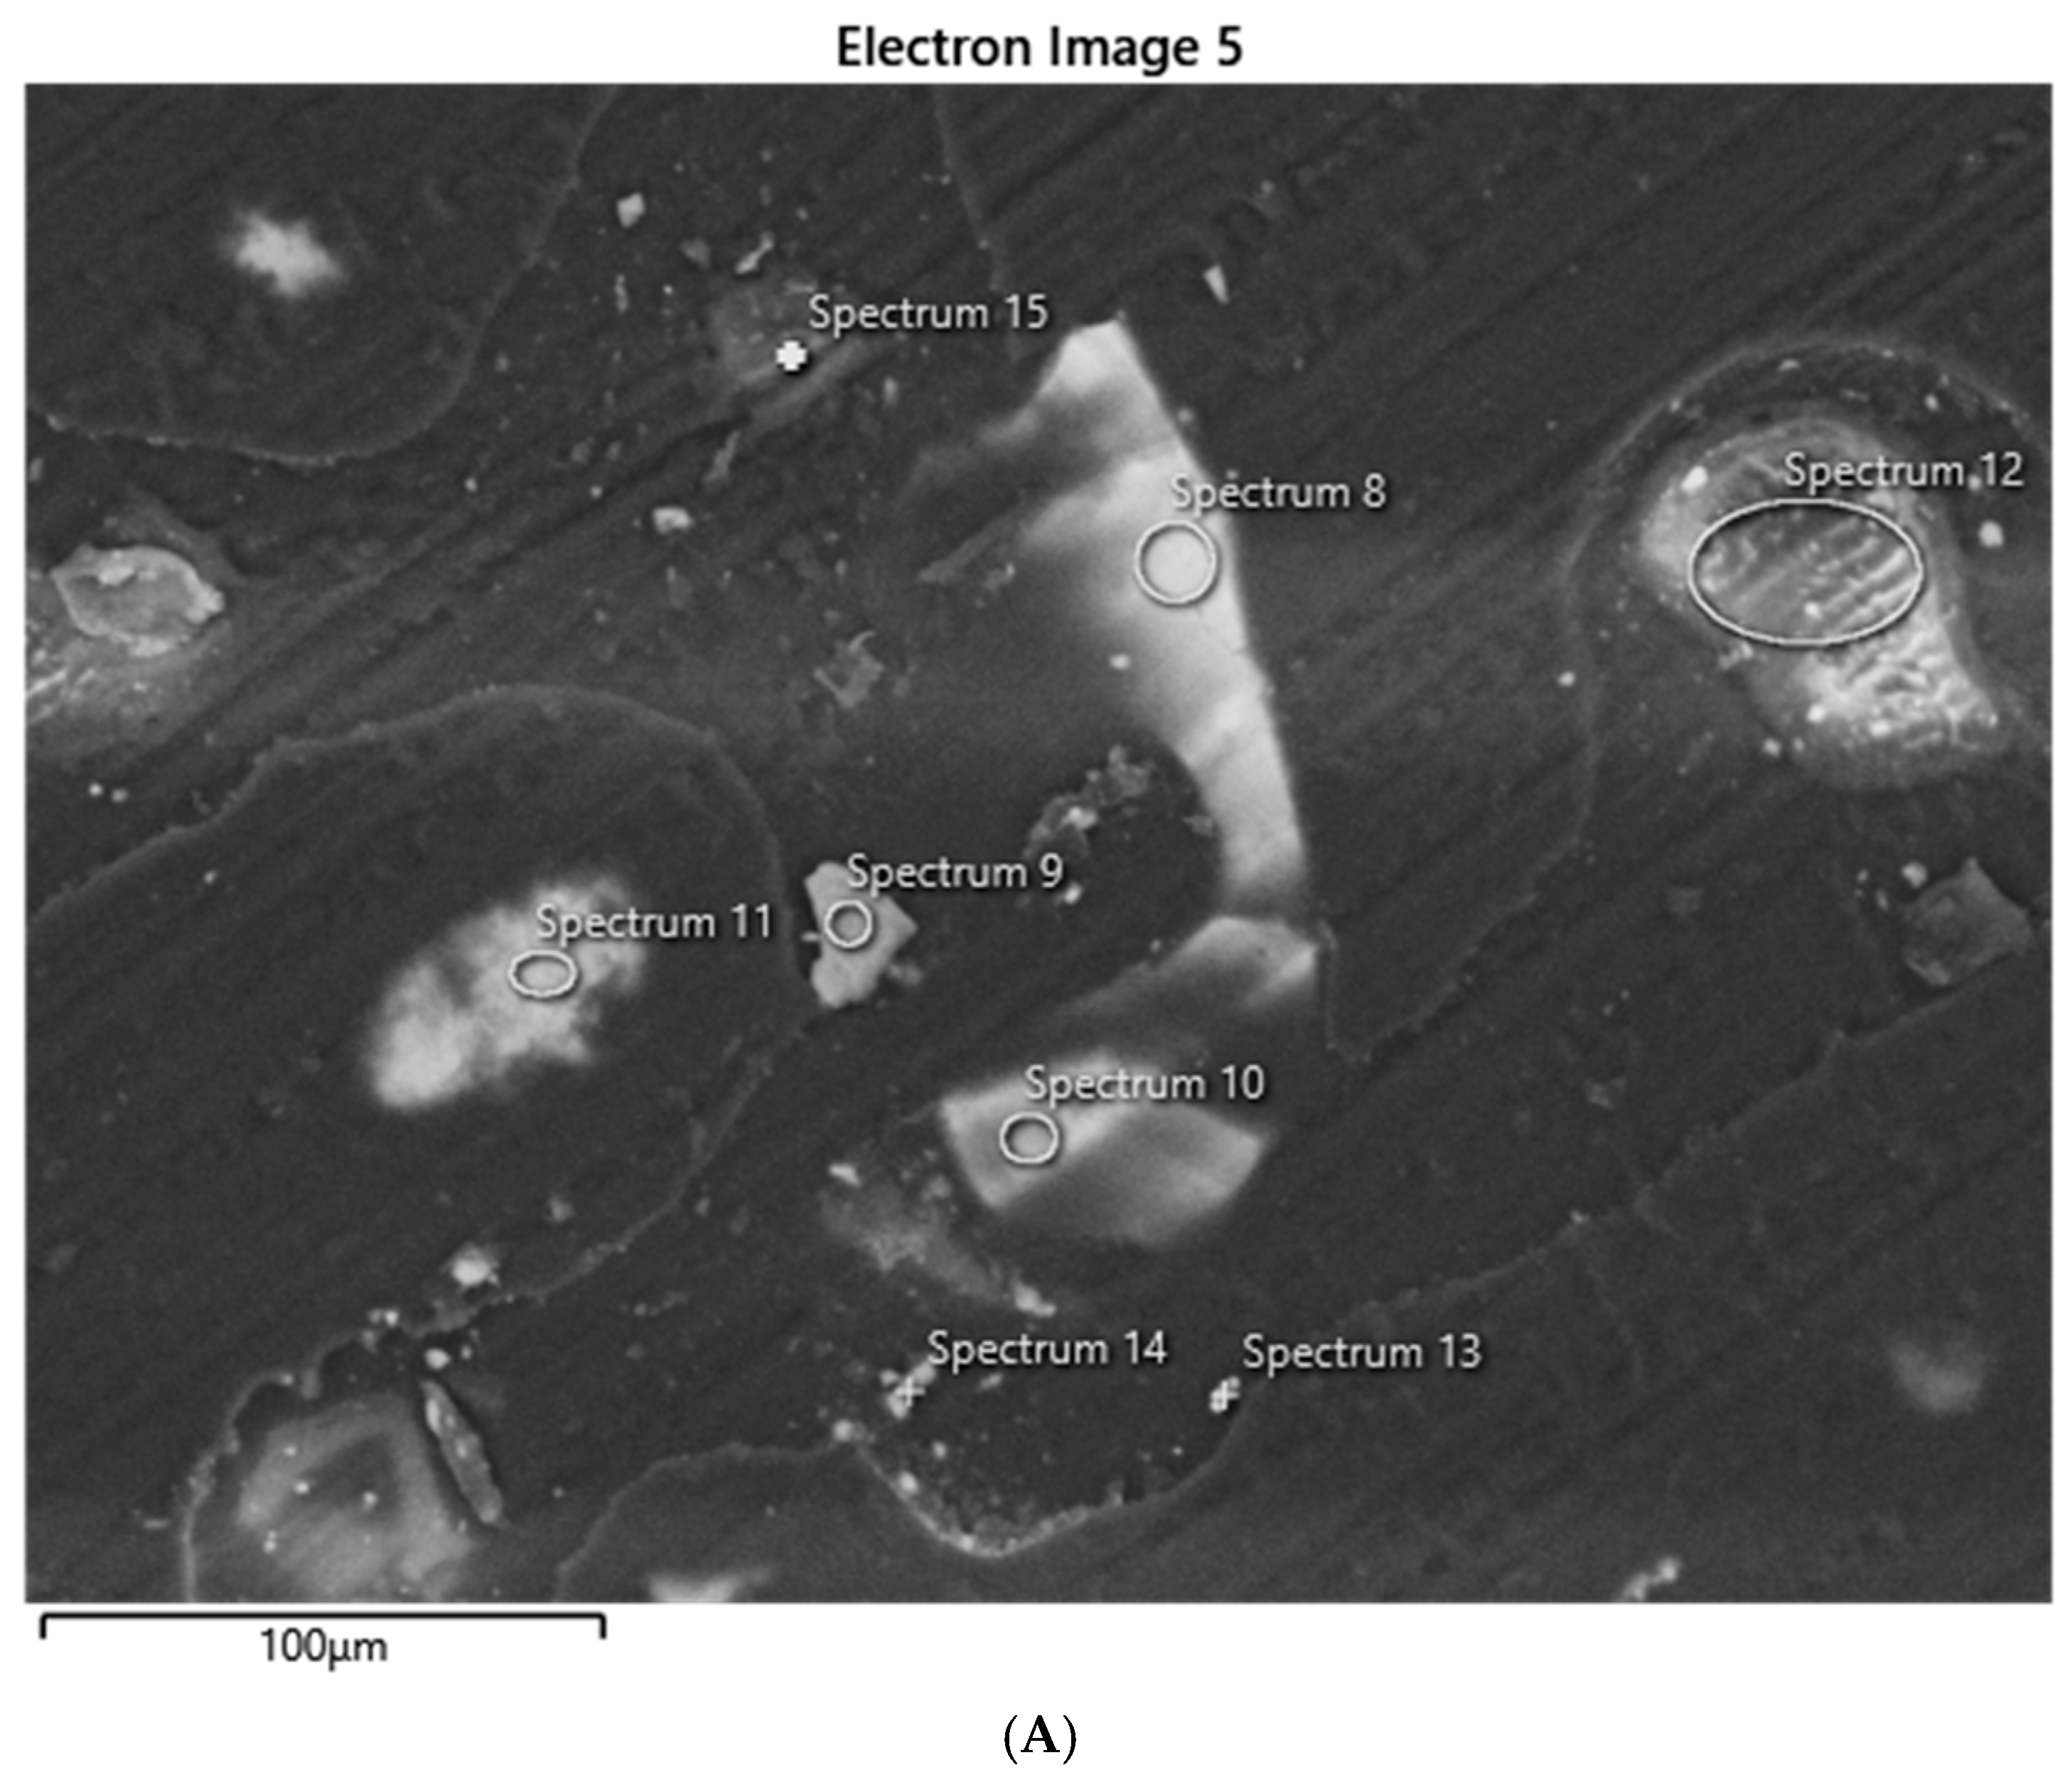
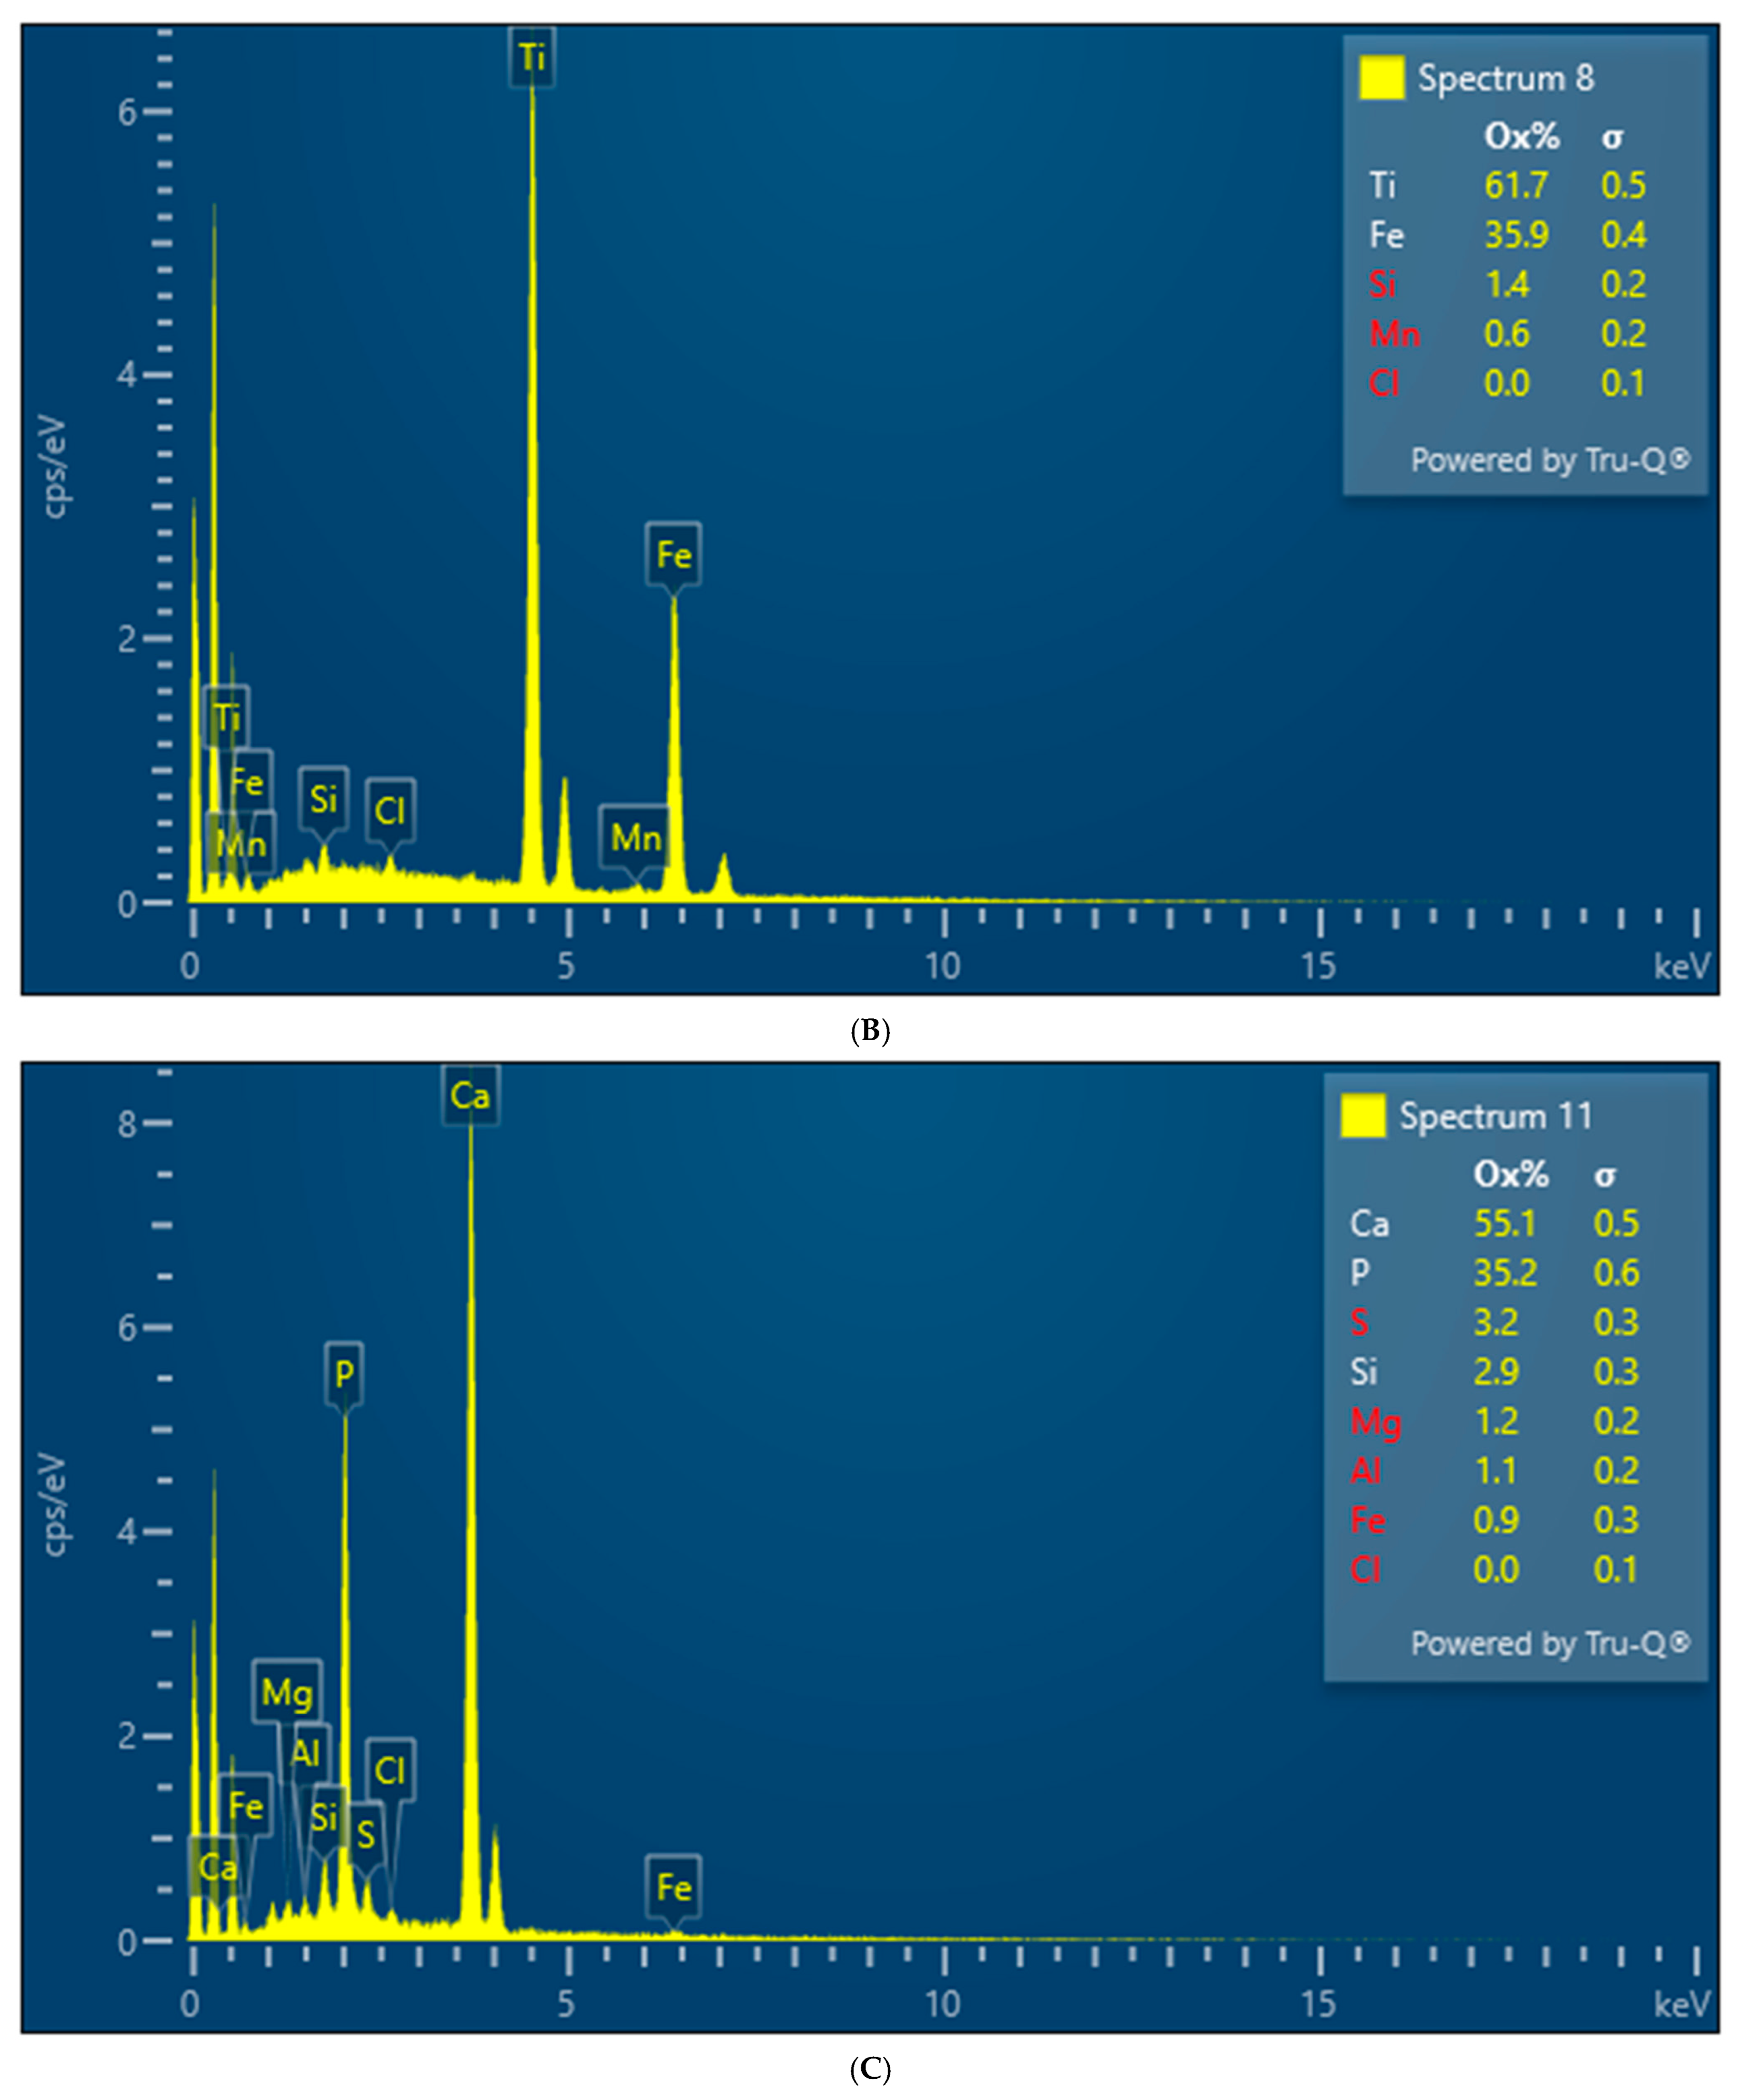
SEM–Electron-Dispersive Spectroscopic (EDS) analysis of sediments was performed on grains consolidated into polished epoxy mounts. EDS is a common analytical approach for evaluating mineralogy in combination with XRD. Identification of individual elements alone is not enough to determine mineralogy [
22]. This can be performed for the elements that appear in major abundances by recalculating the structural formula using an assumed stoichiometric model. We compared the quantitative measure of major elements in feldspars using wavelength-dispersive spectroscopy (WDS) and found that they compare well with EDS results.
EDS analyses were performed with a Hitachi 3900 SU3900 instrument at the Georgia Electron Microscopy (GEM) facility at the University of Georgia (UGA). The instrument can operate in a high vacuum, 30 Pa (Pascals), or 50 Pa of pressure. The 3900 has a secondary electron (SE), backscatter electron (BSE), and ultra (U)-variable (V) pressure detector (D). The secondary electron resolution is 3.0 nm at accelerating voltage of 30 kV; BSE resolution is 4.0 nm at that same voltage. Cathodoluminescence (CL) observation is facilitated with the UVD detection of light generated from electron–gas interactions, enabling the study of crystal defects and mineral structures in this study. Low-count energy-dispersive X-ray spectra are generated, which provide information on the element composition at selected measurement points.
4. Discussion
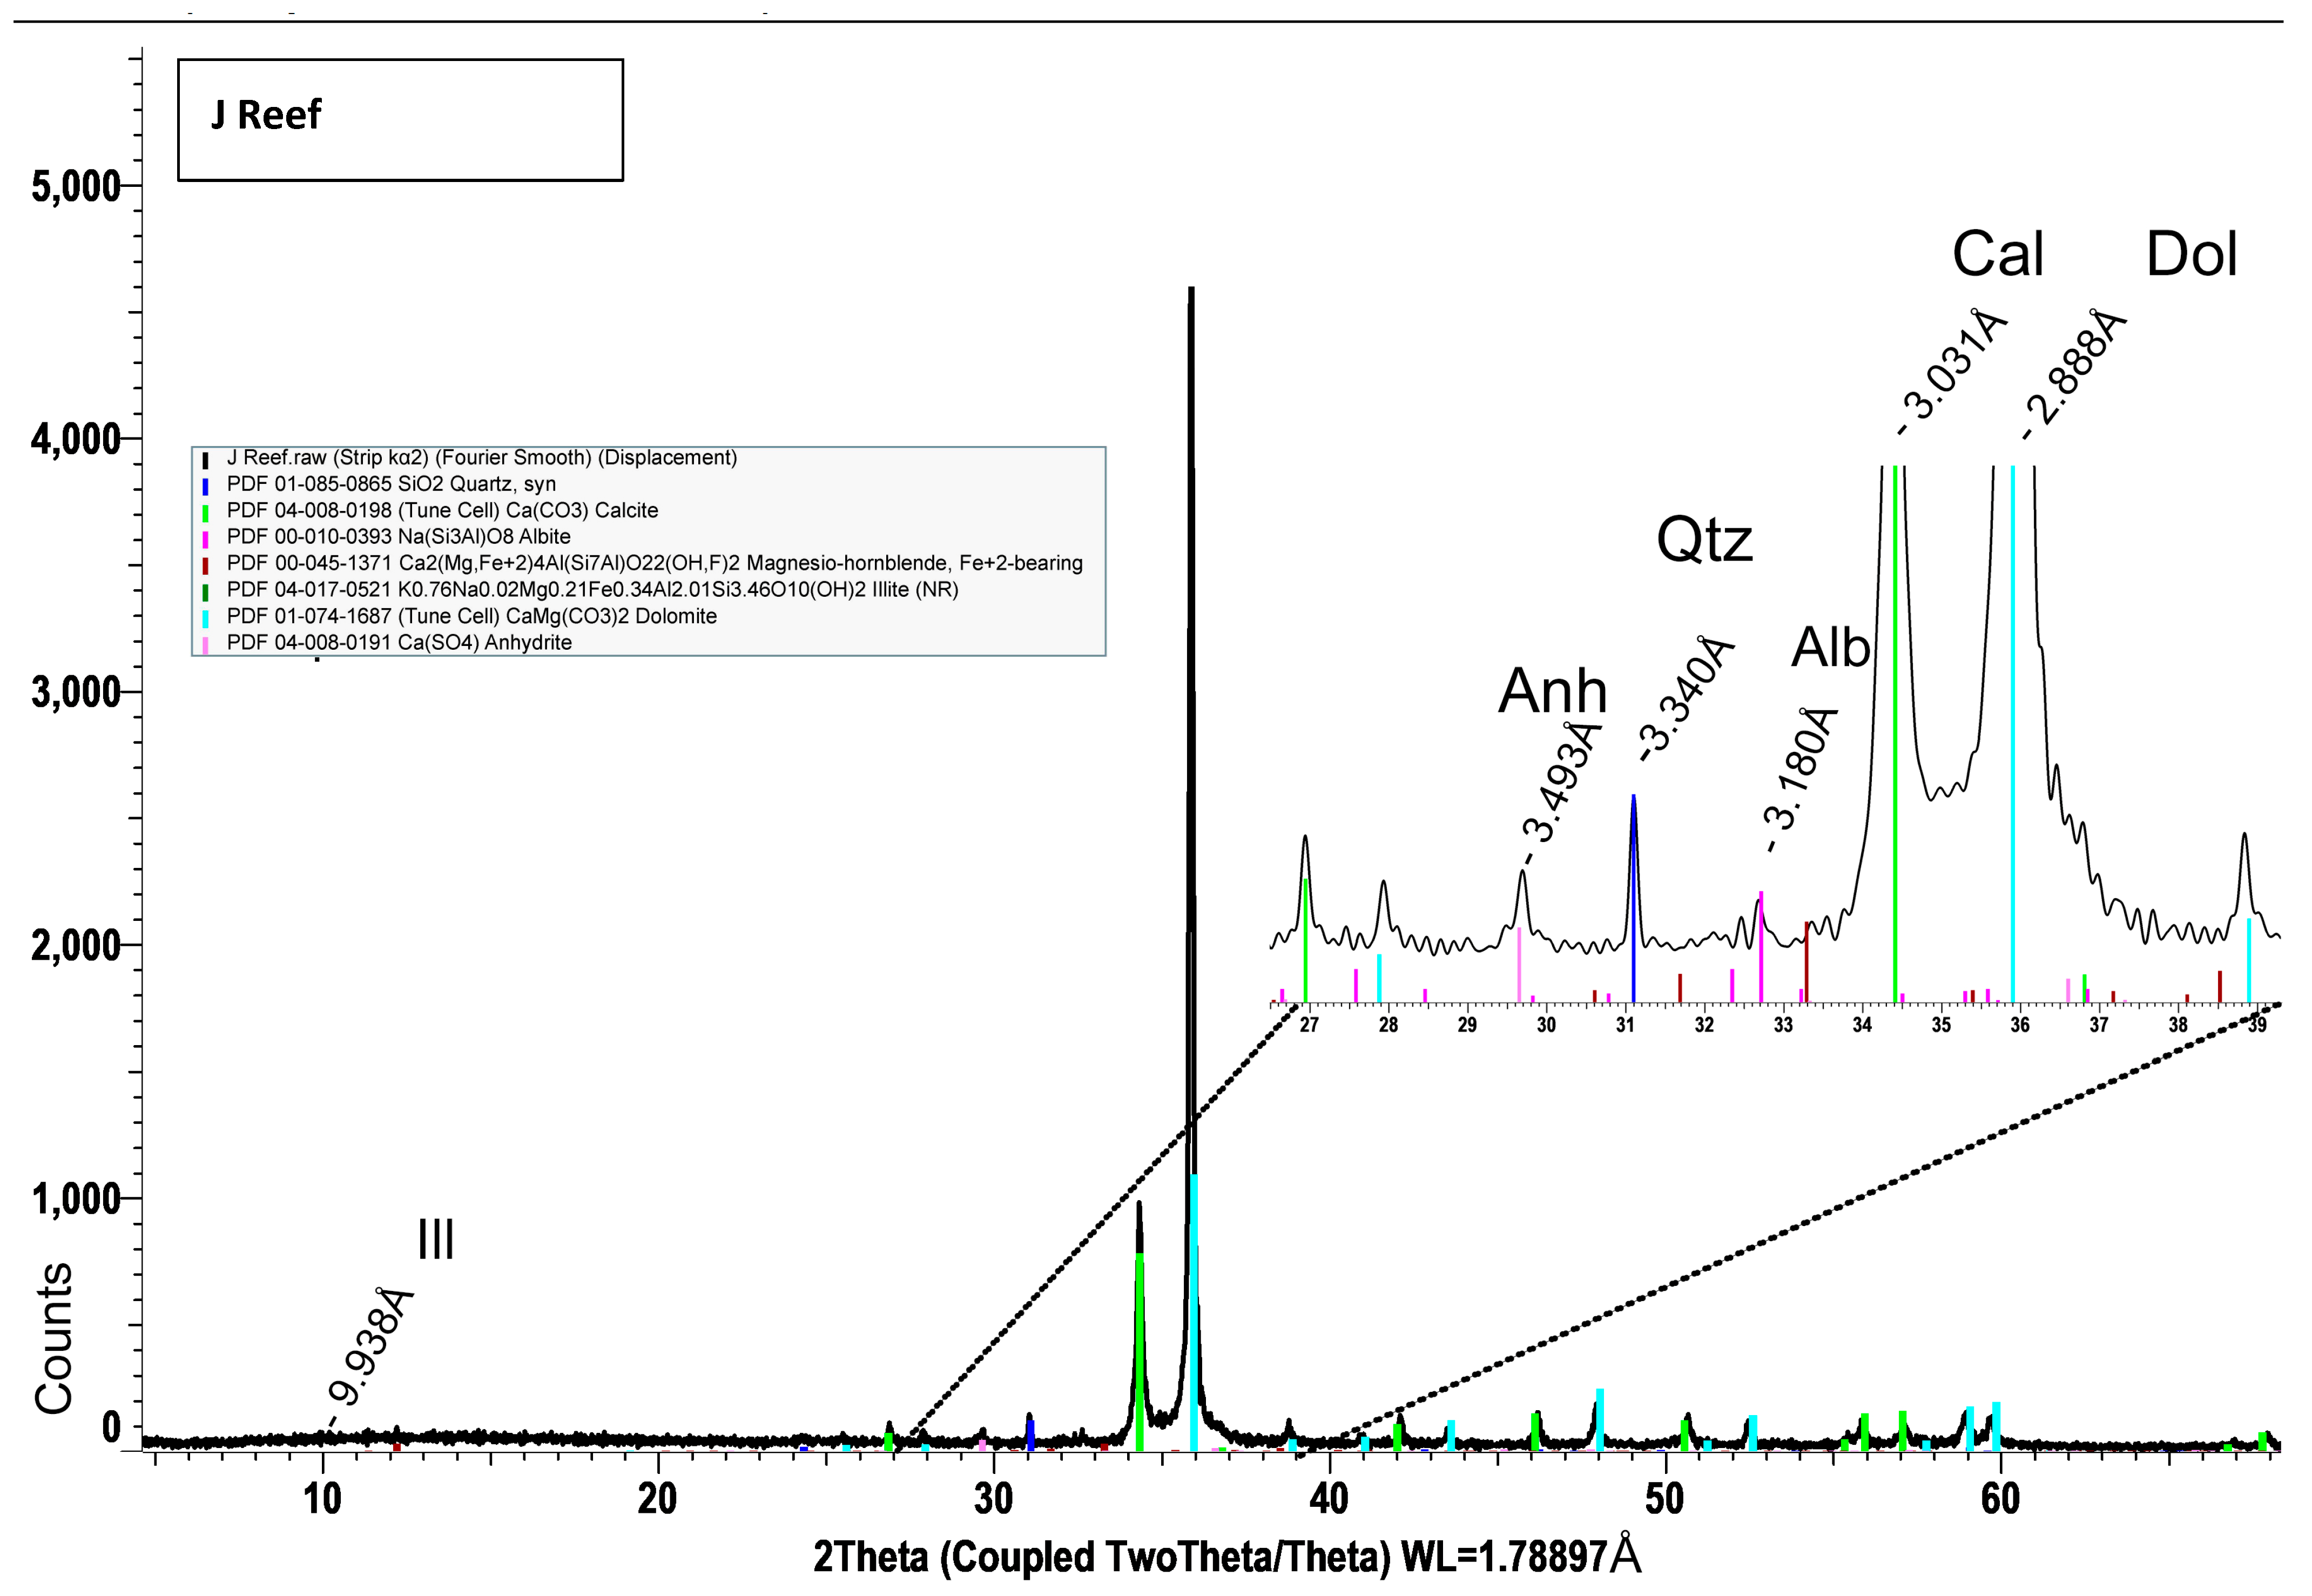
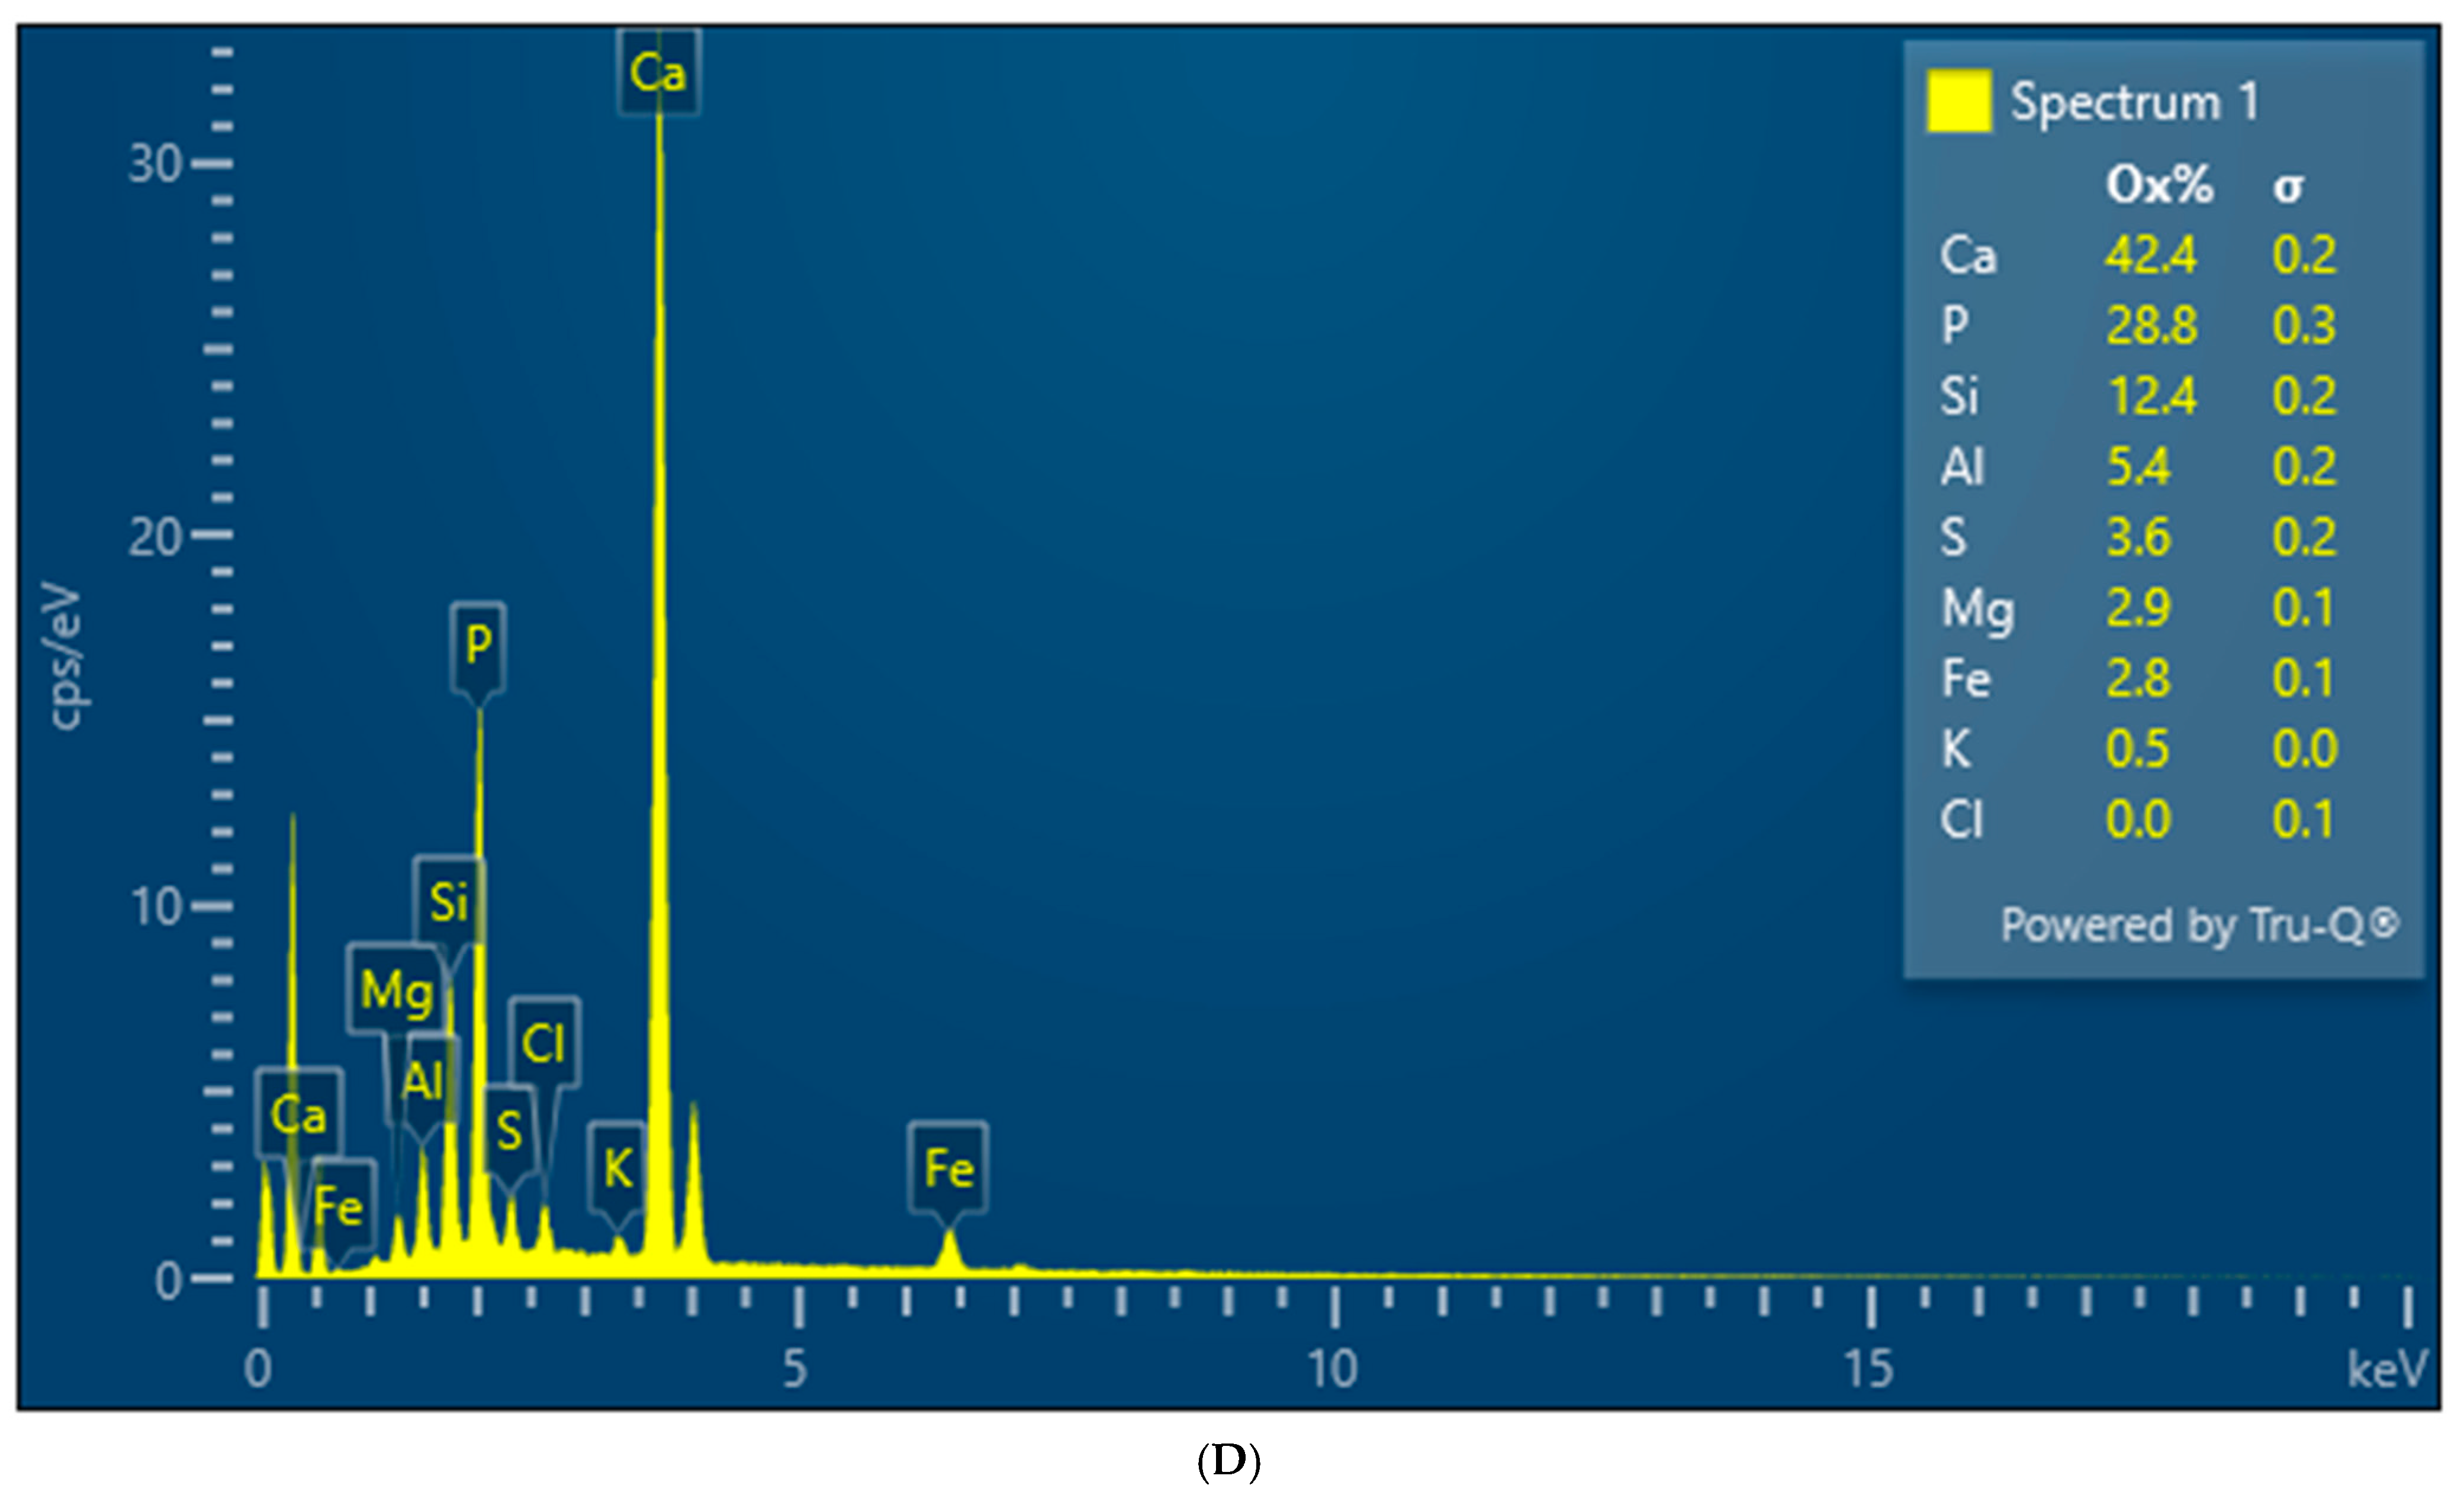
The main minerals of note that we found in the samples were calcite, albite, and dolomite. This is not to say that we did not find other minerals, like quartz, but these main three were of particular interest to us. Early on, we believed that these minerals could be behind the blue light fluorescence coloration we saw. However, it is important to say that these are just hypotheses of correlation.
Mazel and Verbeek suggest Fe
3+ forms the luminescent ions, and that blue light shifts this fluorescence to yellow-cream (2014: 20). Mazel and Verbeek [
14] also found that quartz fluoresces a more yellow/green color under blue light. The reddish fluorescence in the J Reef sediment sample may originate from Mn
2+ centers in the dolomitic fraction. Modreski [
23] notes that red fluorescence can be attributed to Fe
3+ as well. Iron is observed in samples, but not at significant concentrations. Likewise, when detected, as in hornblende, the type of iron found is Fe
2+.
Rutile (titanium), along with hornblende, is a common heavy mineral in shelf sediments off the coast of Georgia. Calcite fluoresces red in UV but shifts to yellow-green under blue light [
13]. Mn
2+ centers have been suggested as the source of the fluorescence [
23,
24,
25]. Dravis and Yurewicz assign bright blue light fluorescence in calcium carbonate polymorphs—calcites/aragonites—to fibrous, isopachous forms; the equant calcites are non-fluorescent (1985).
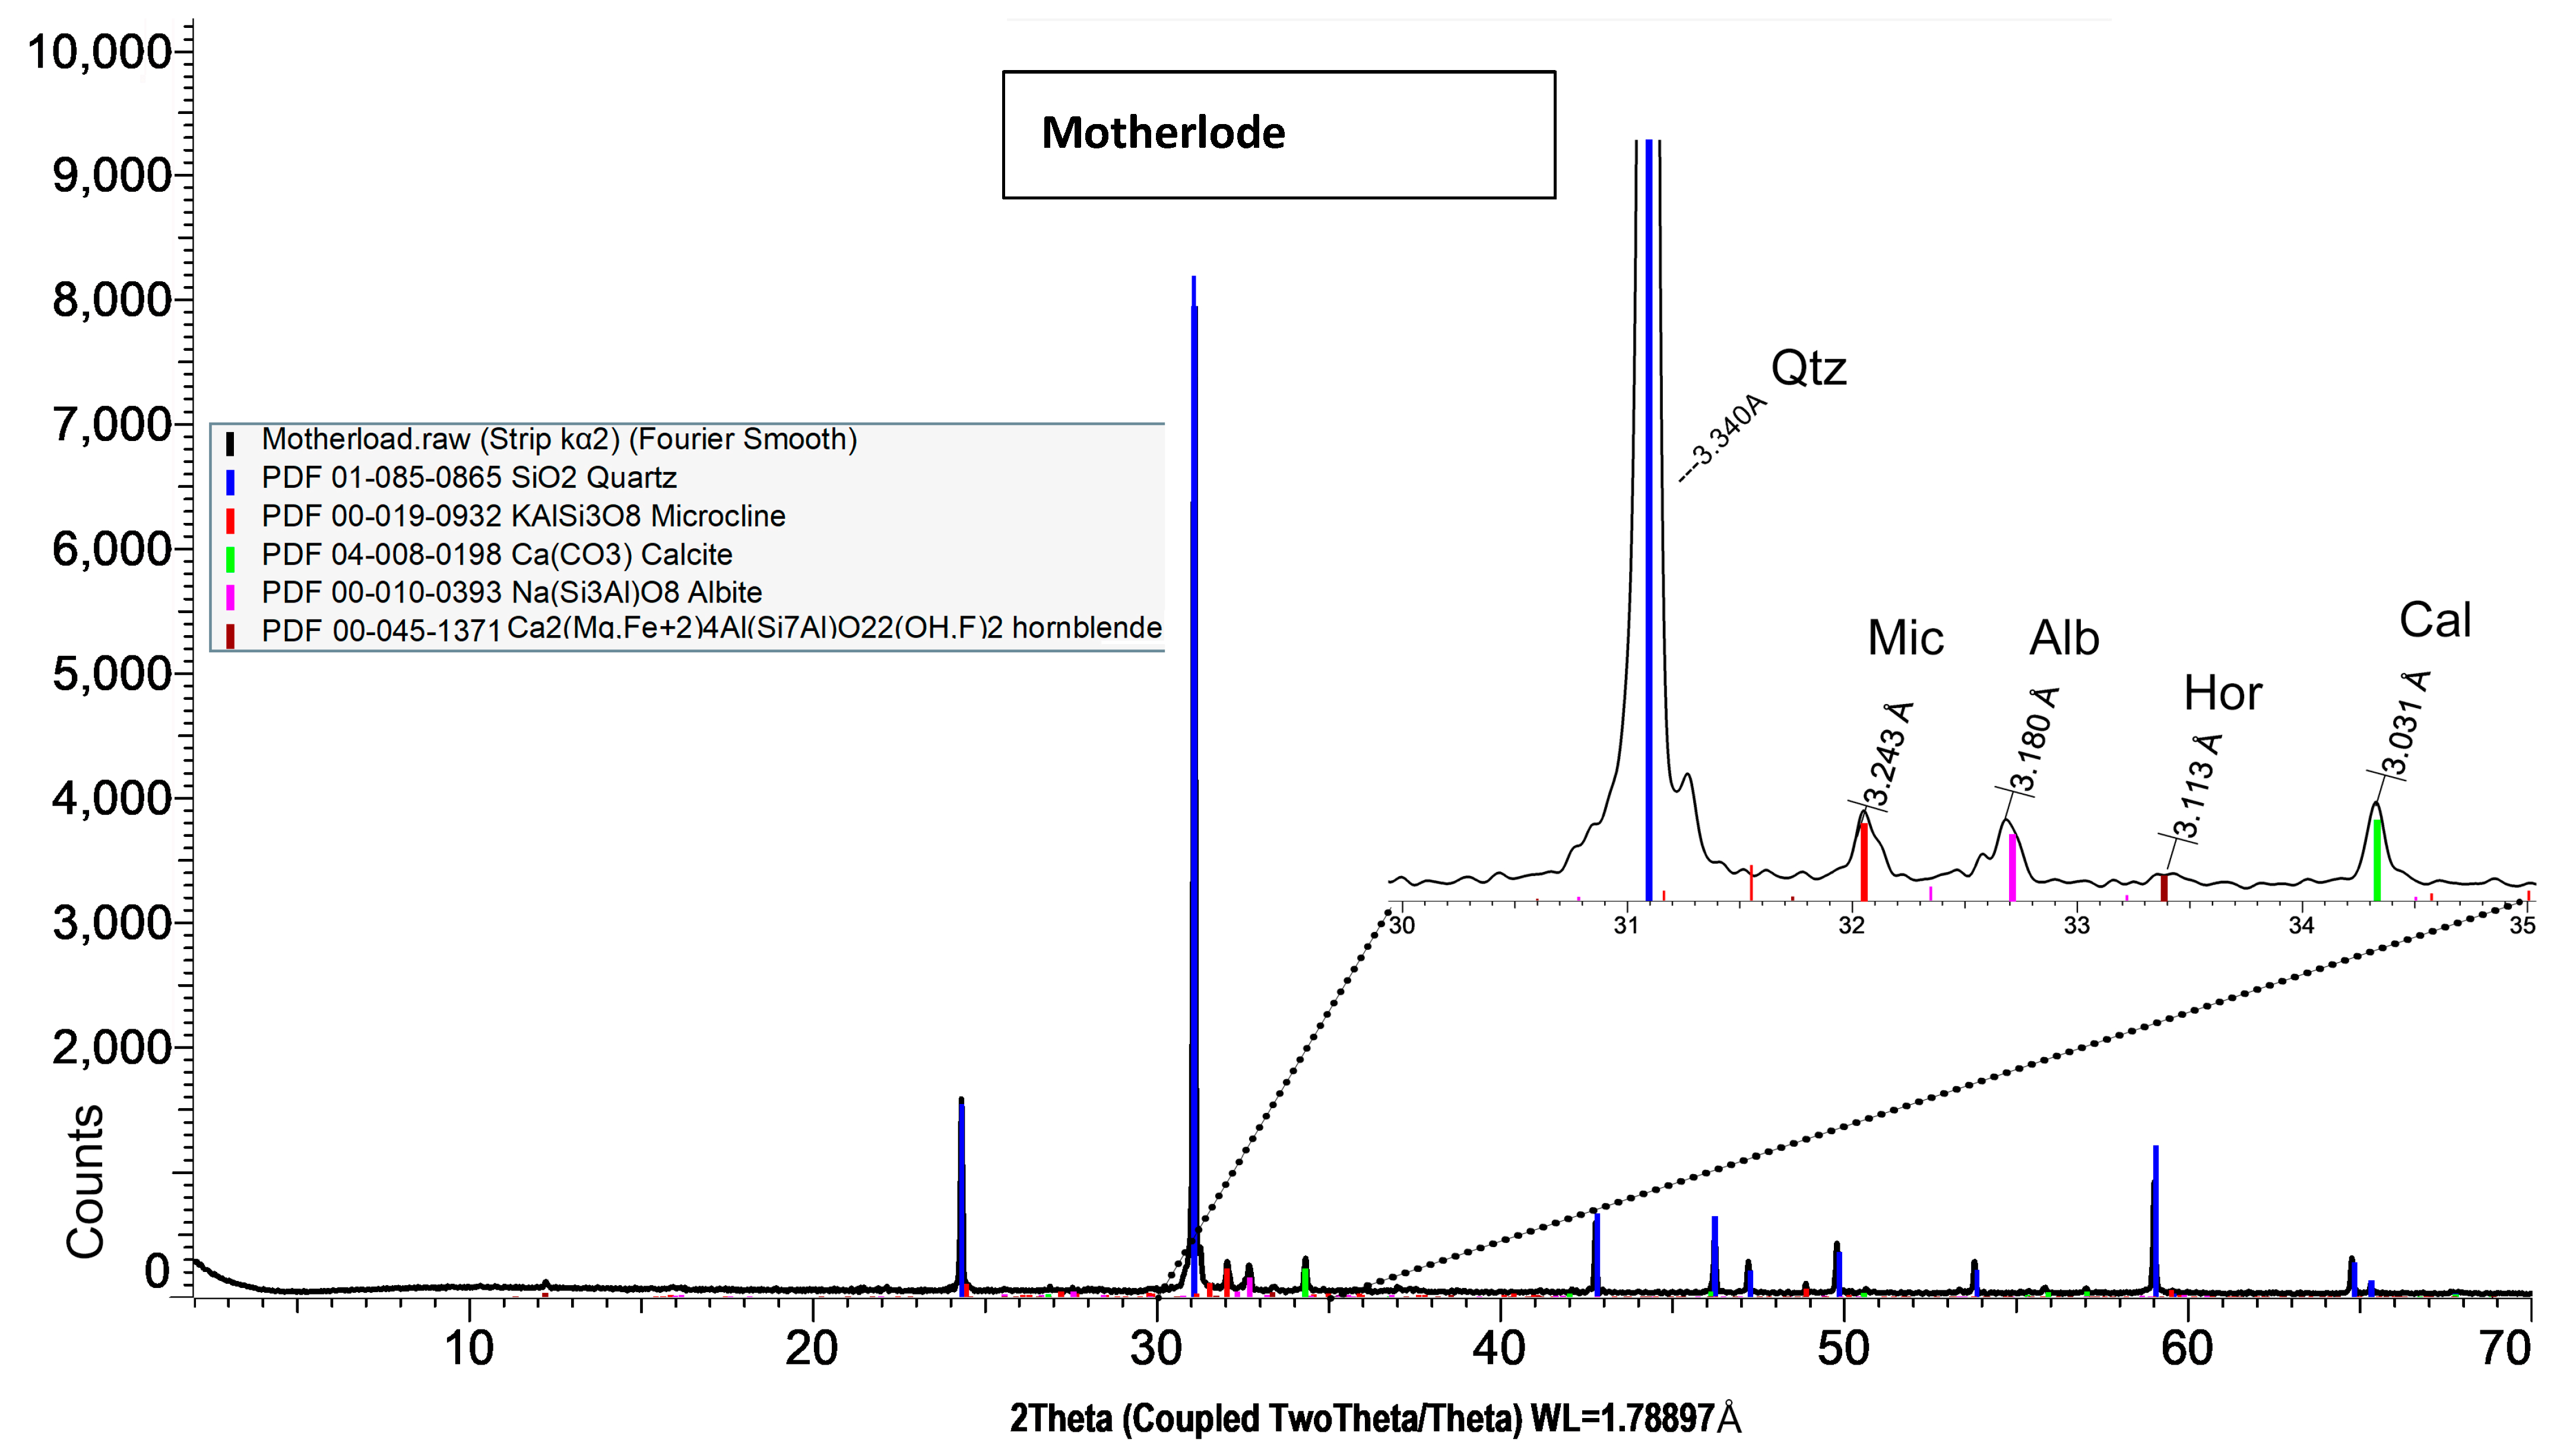
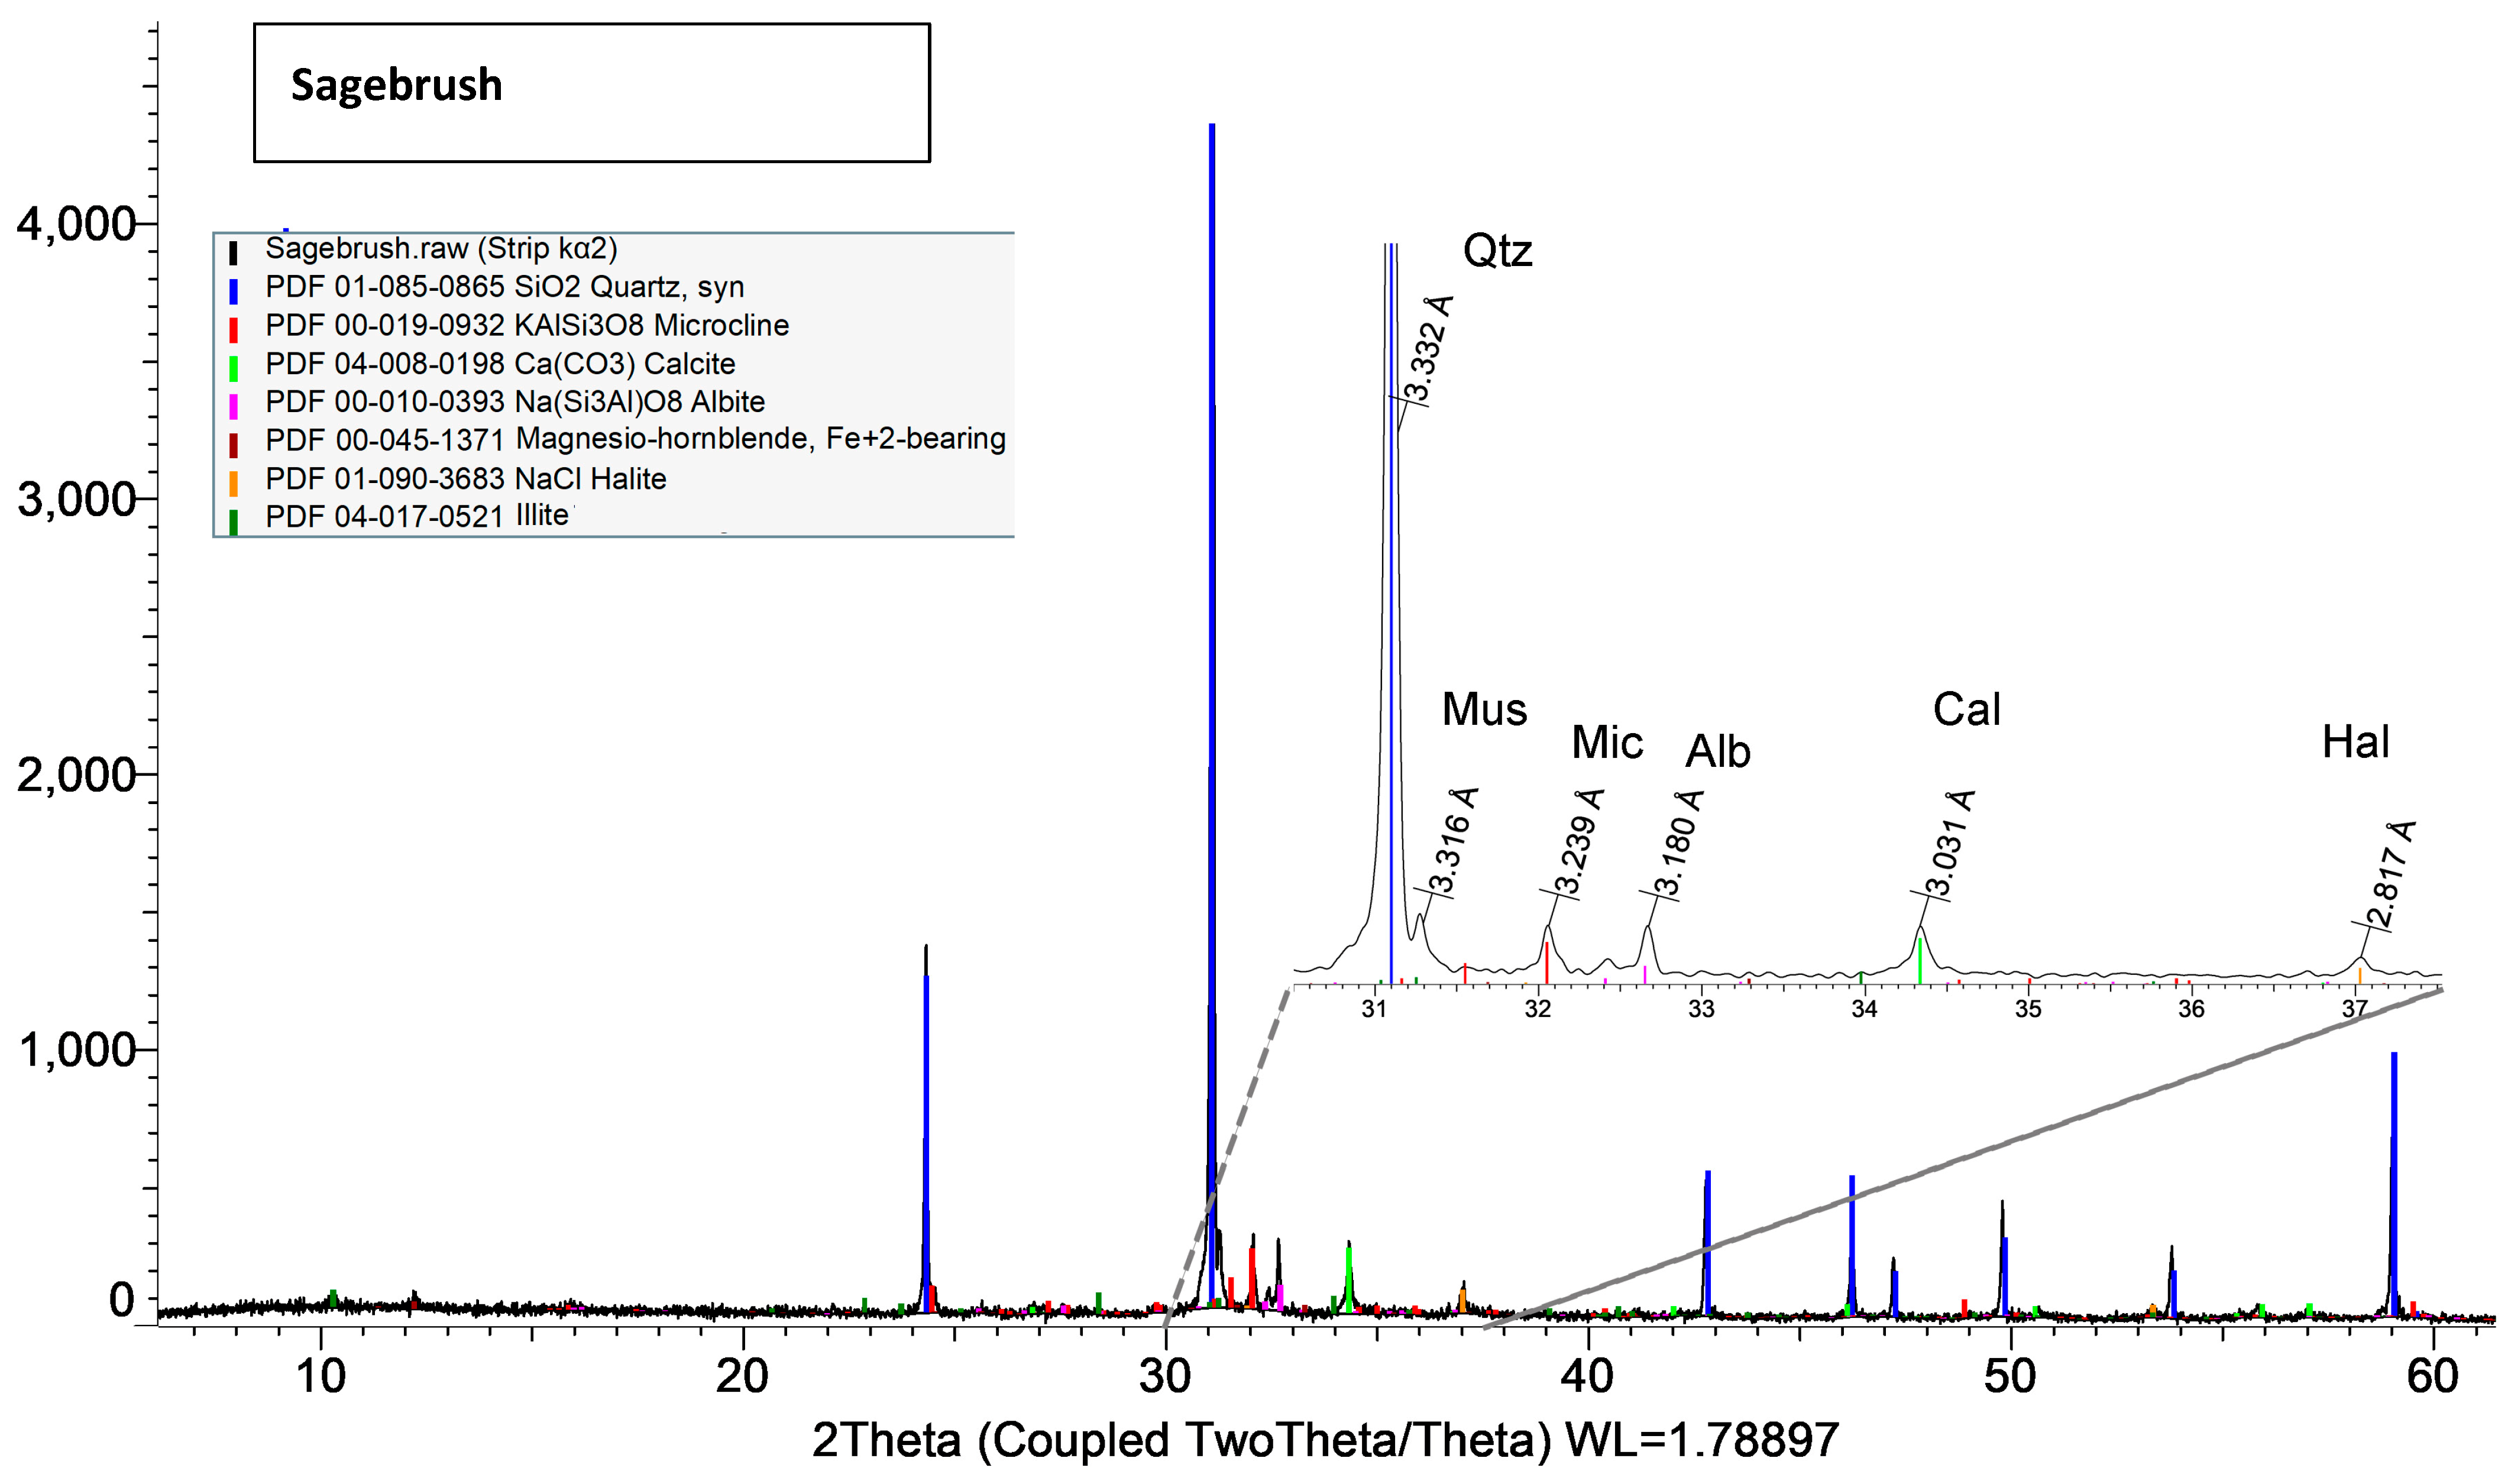
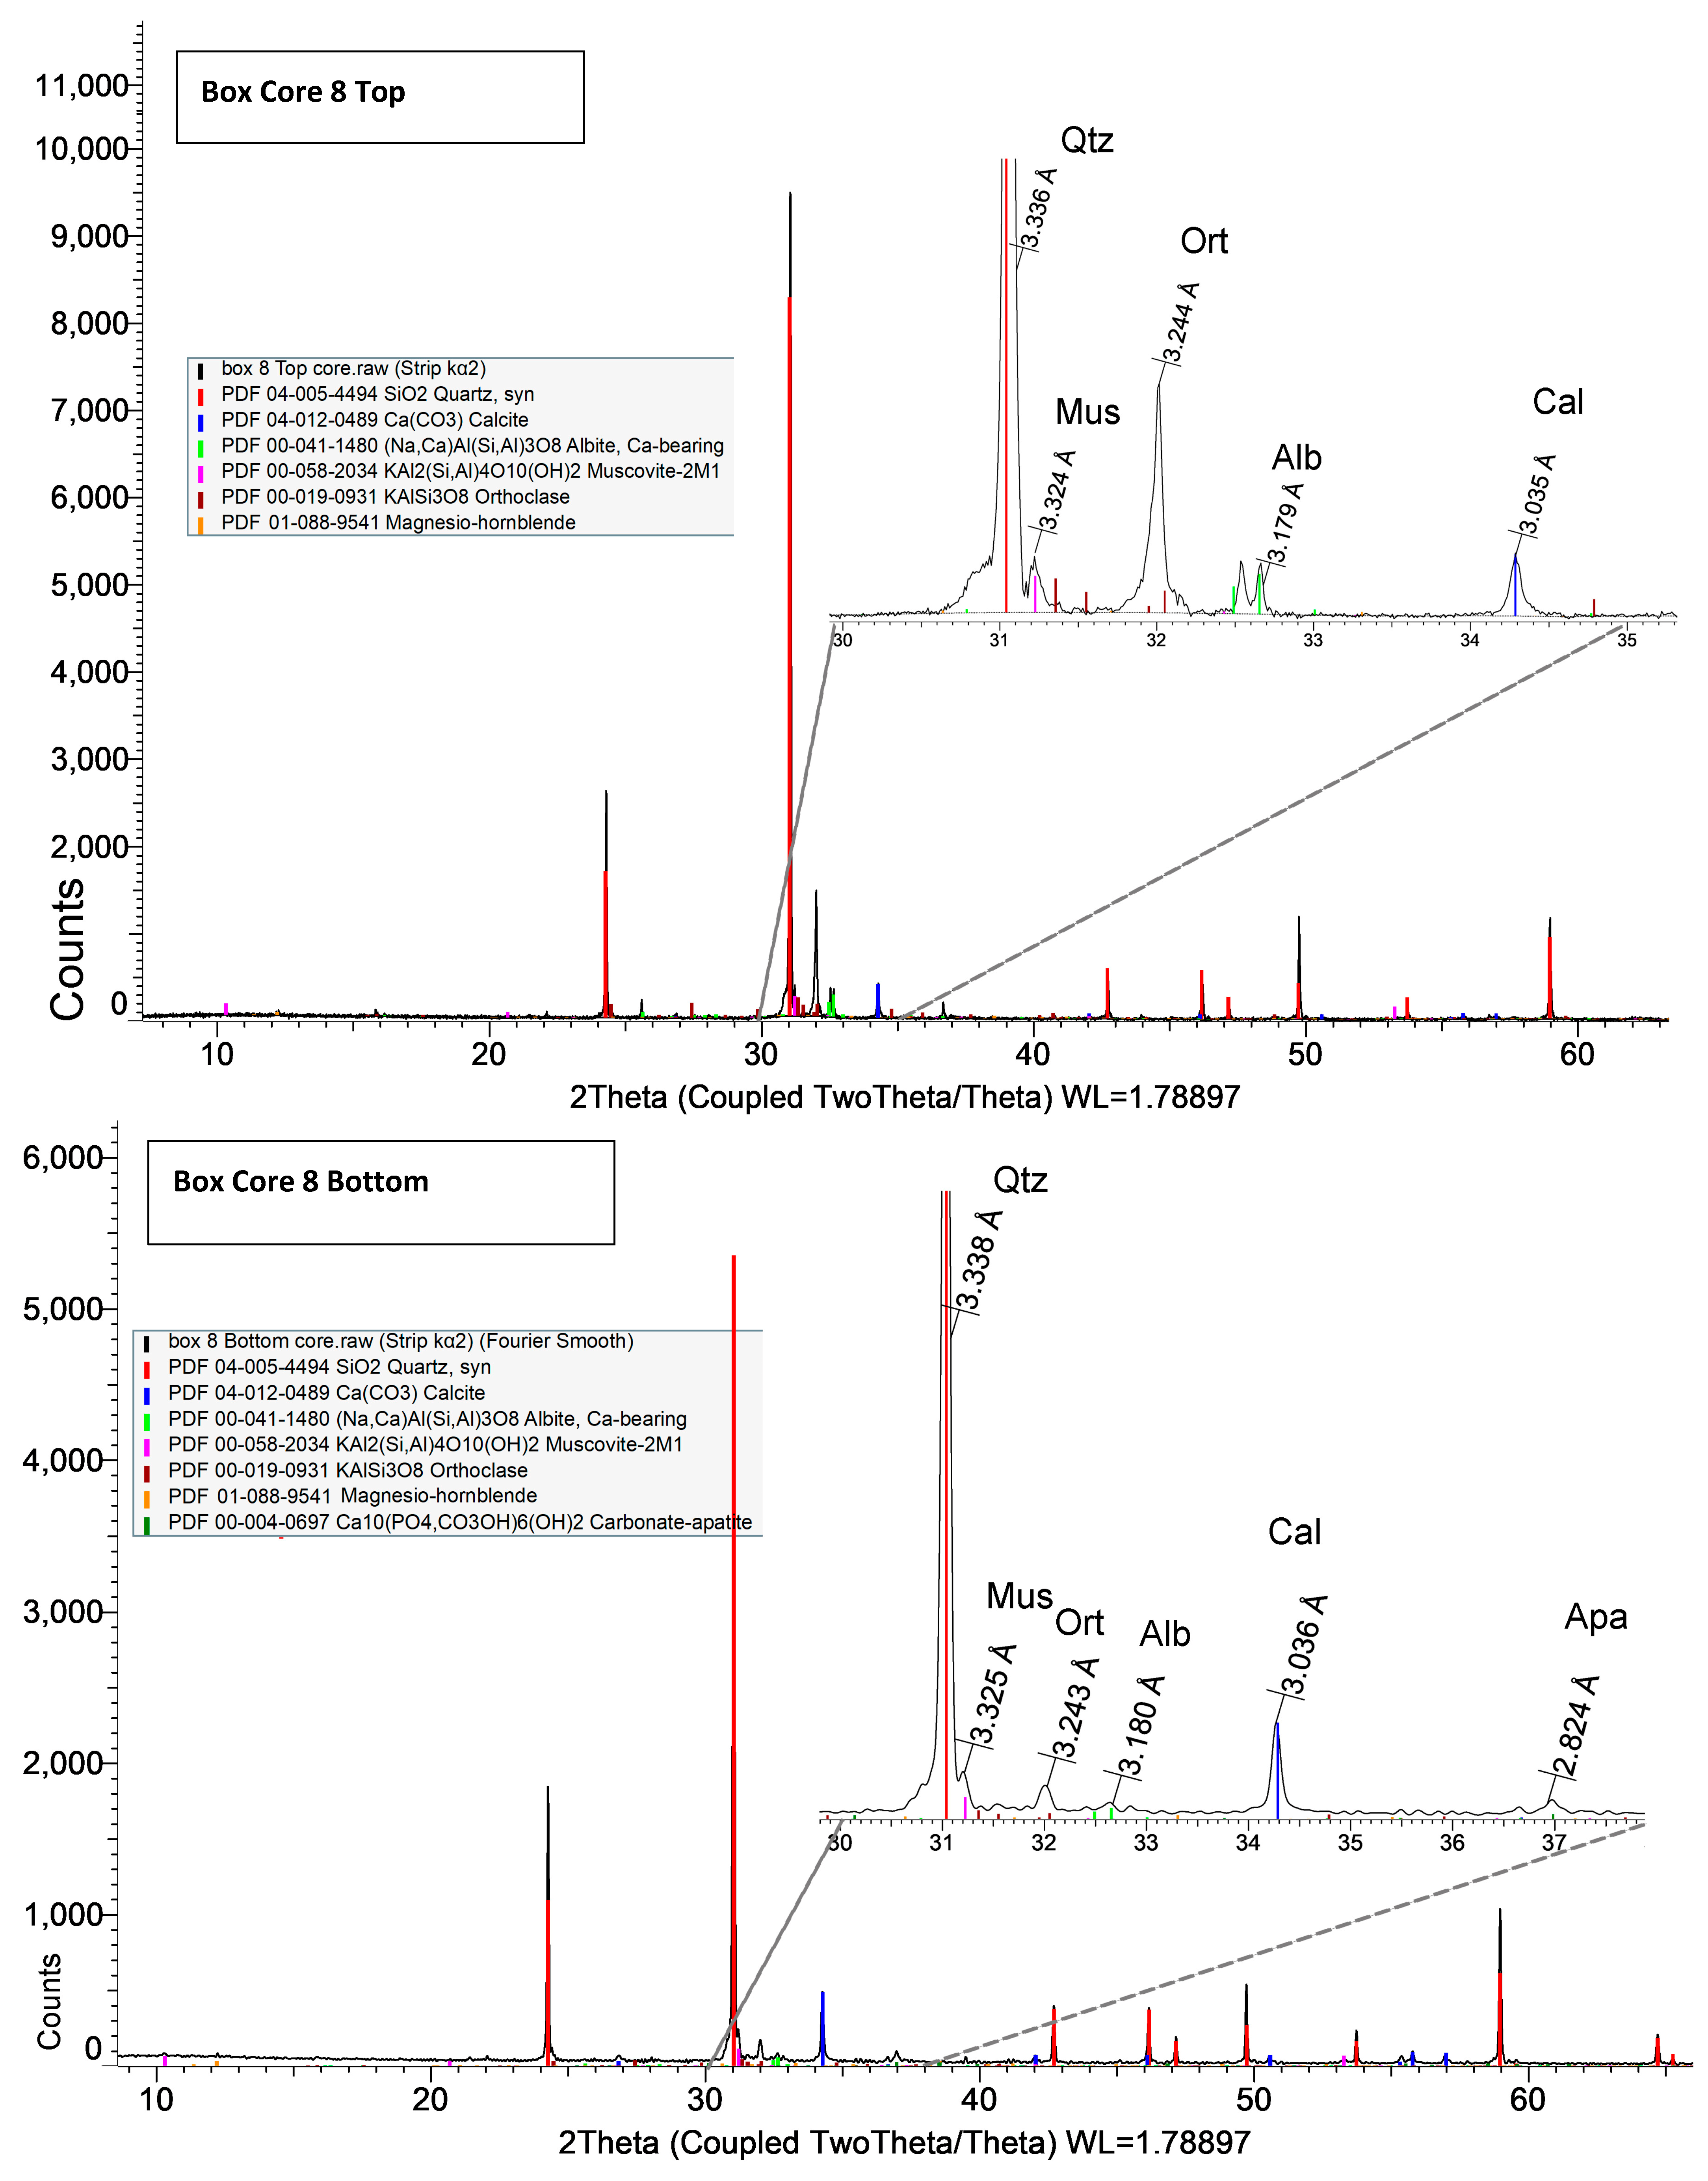
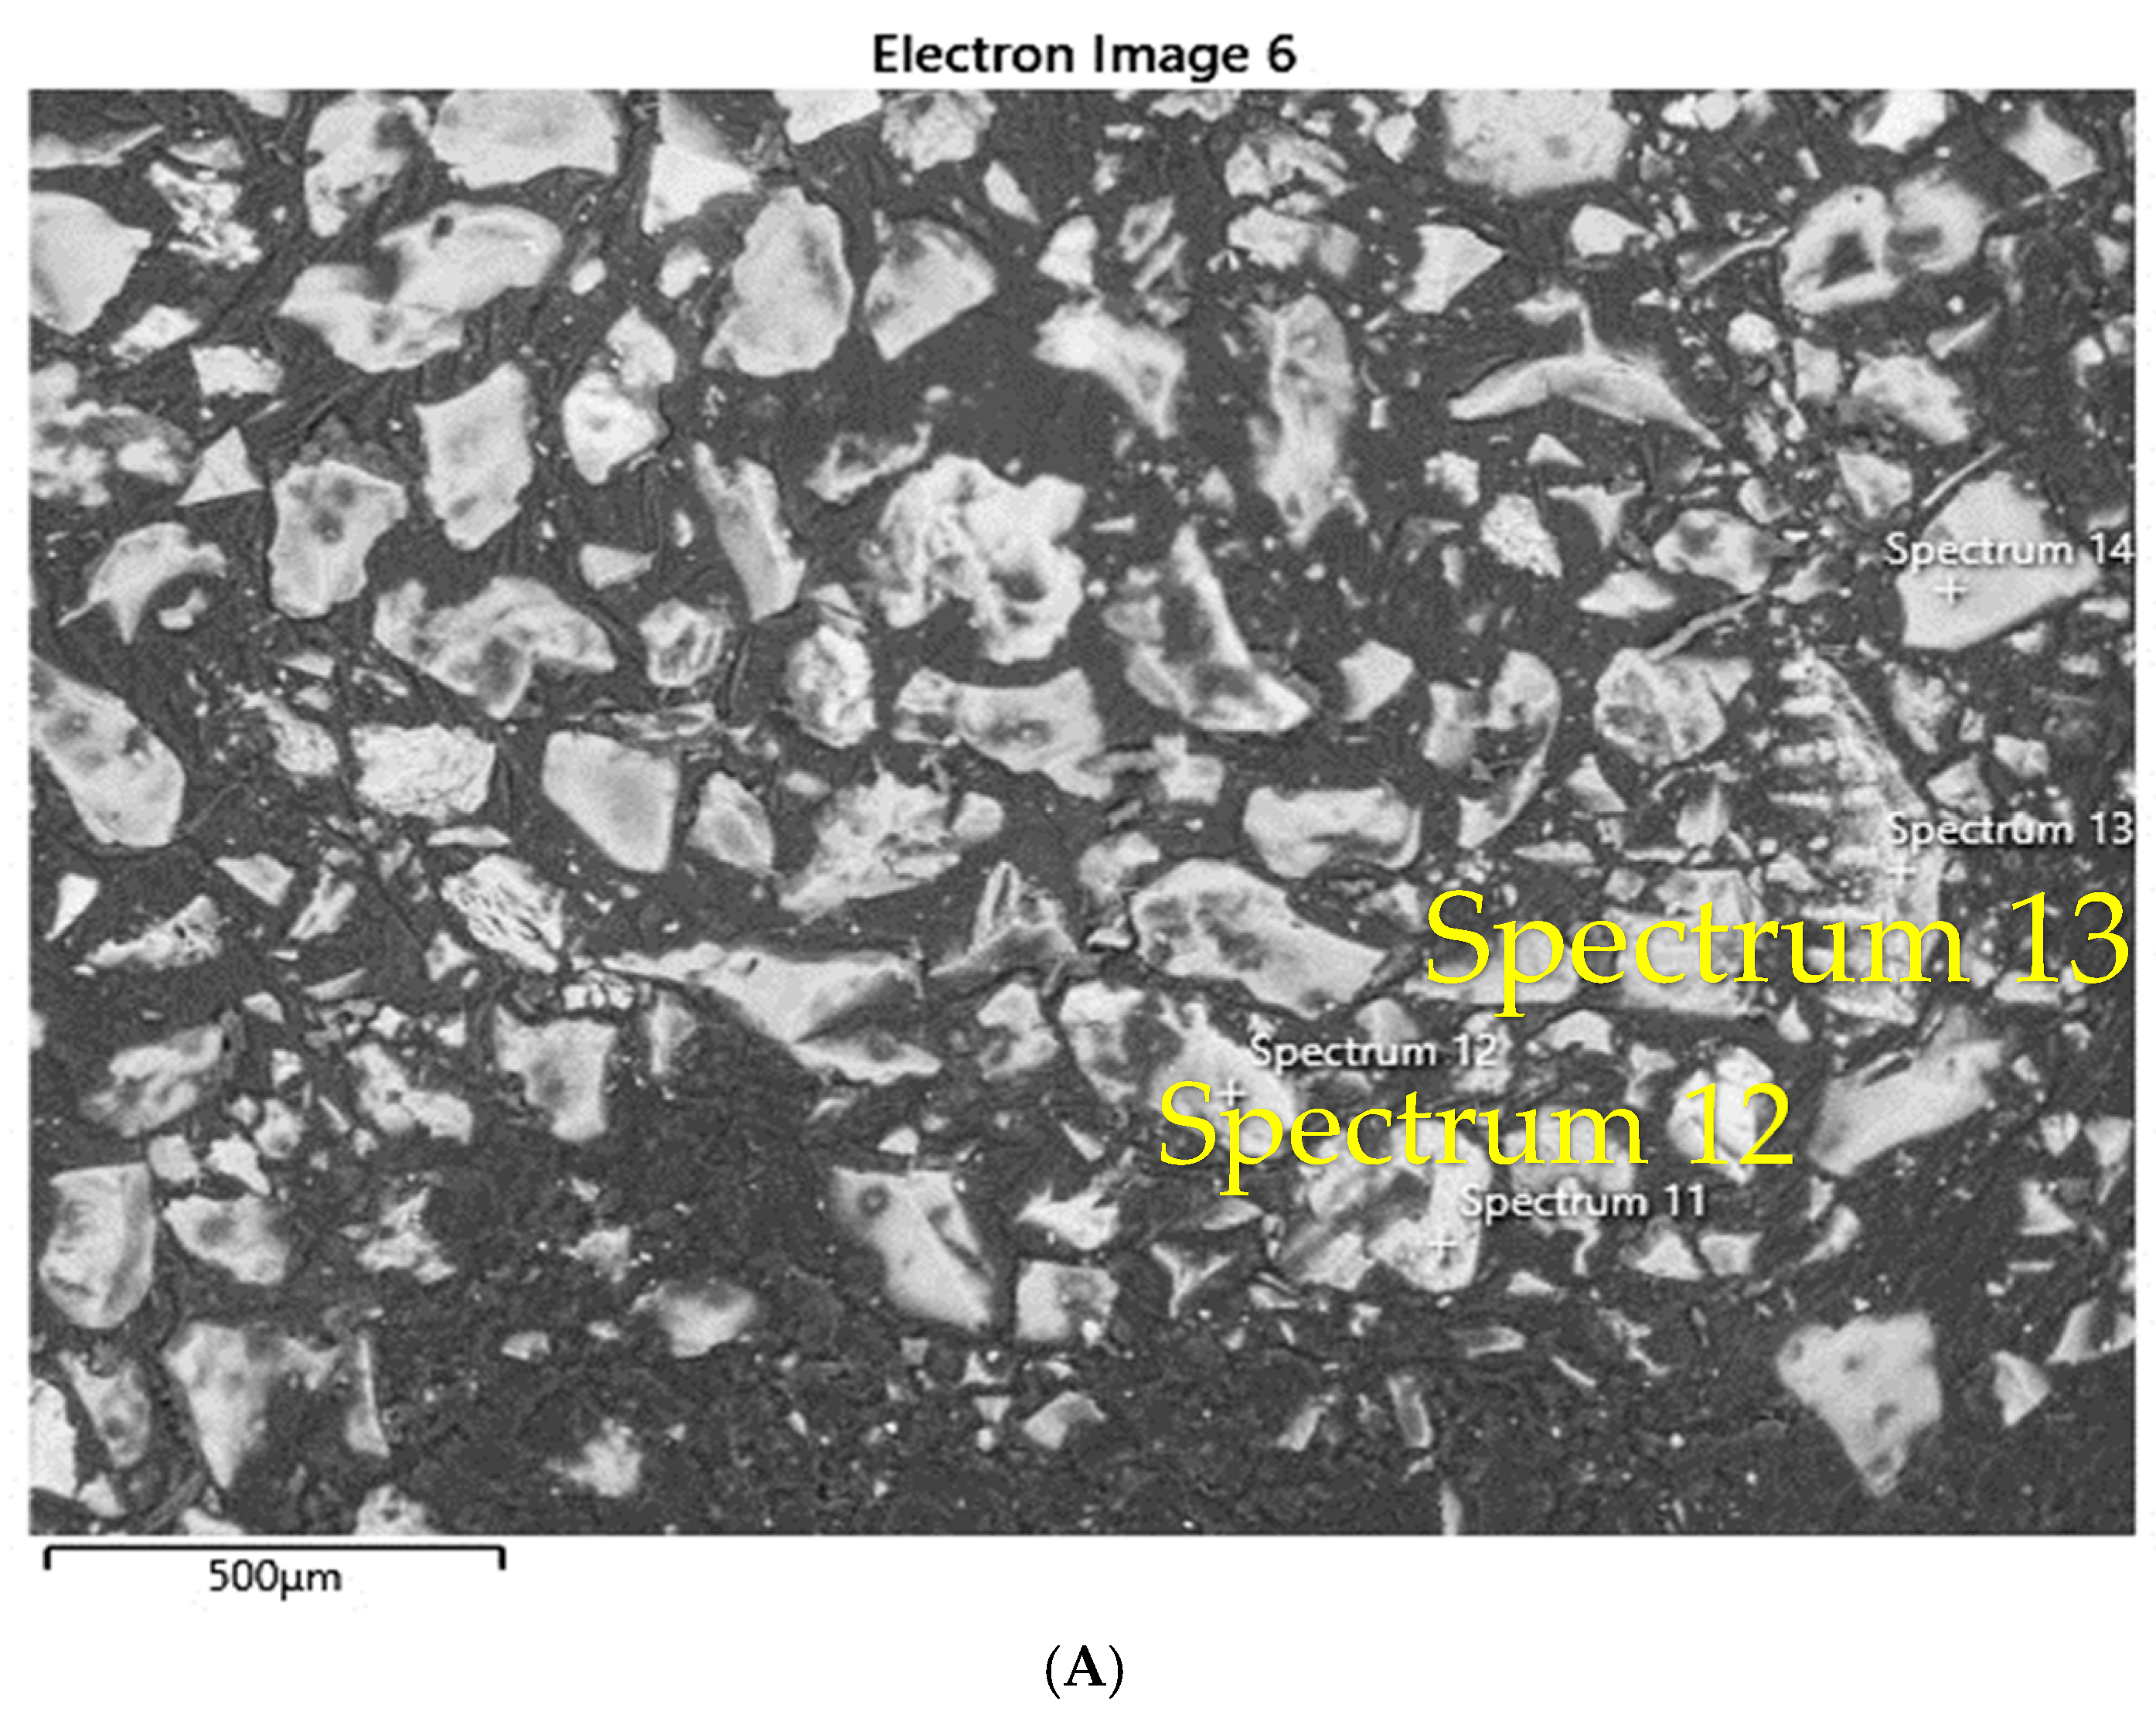
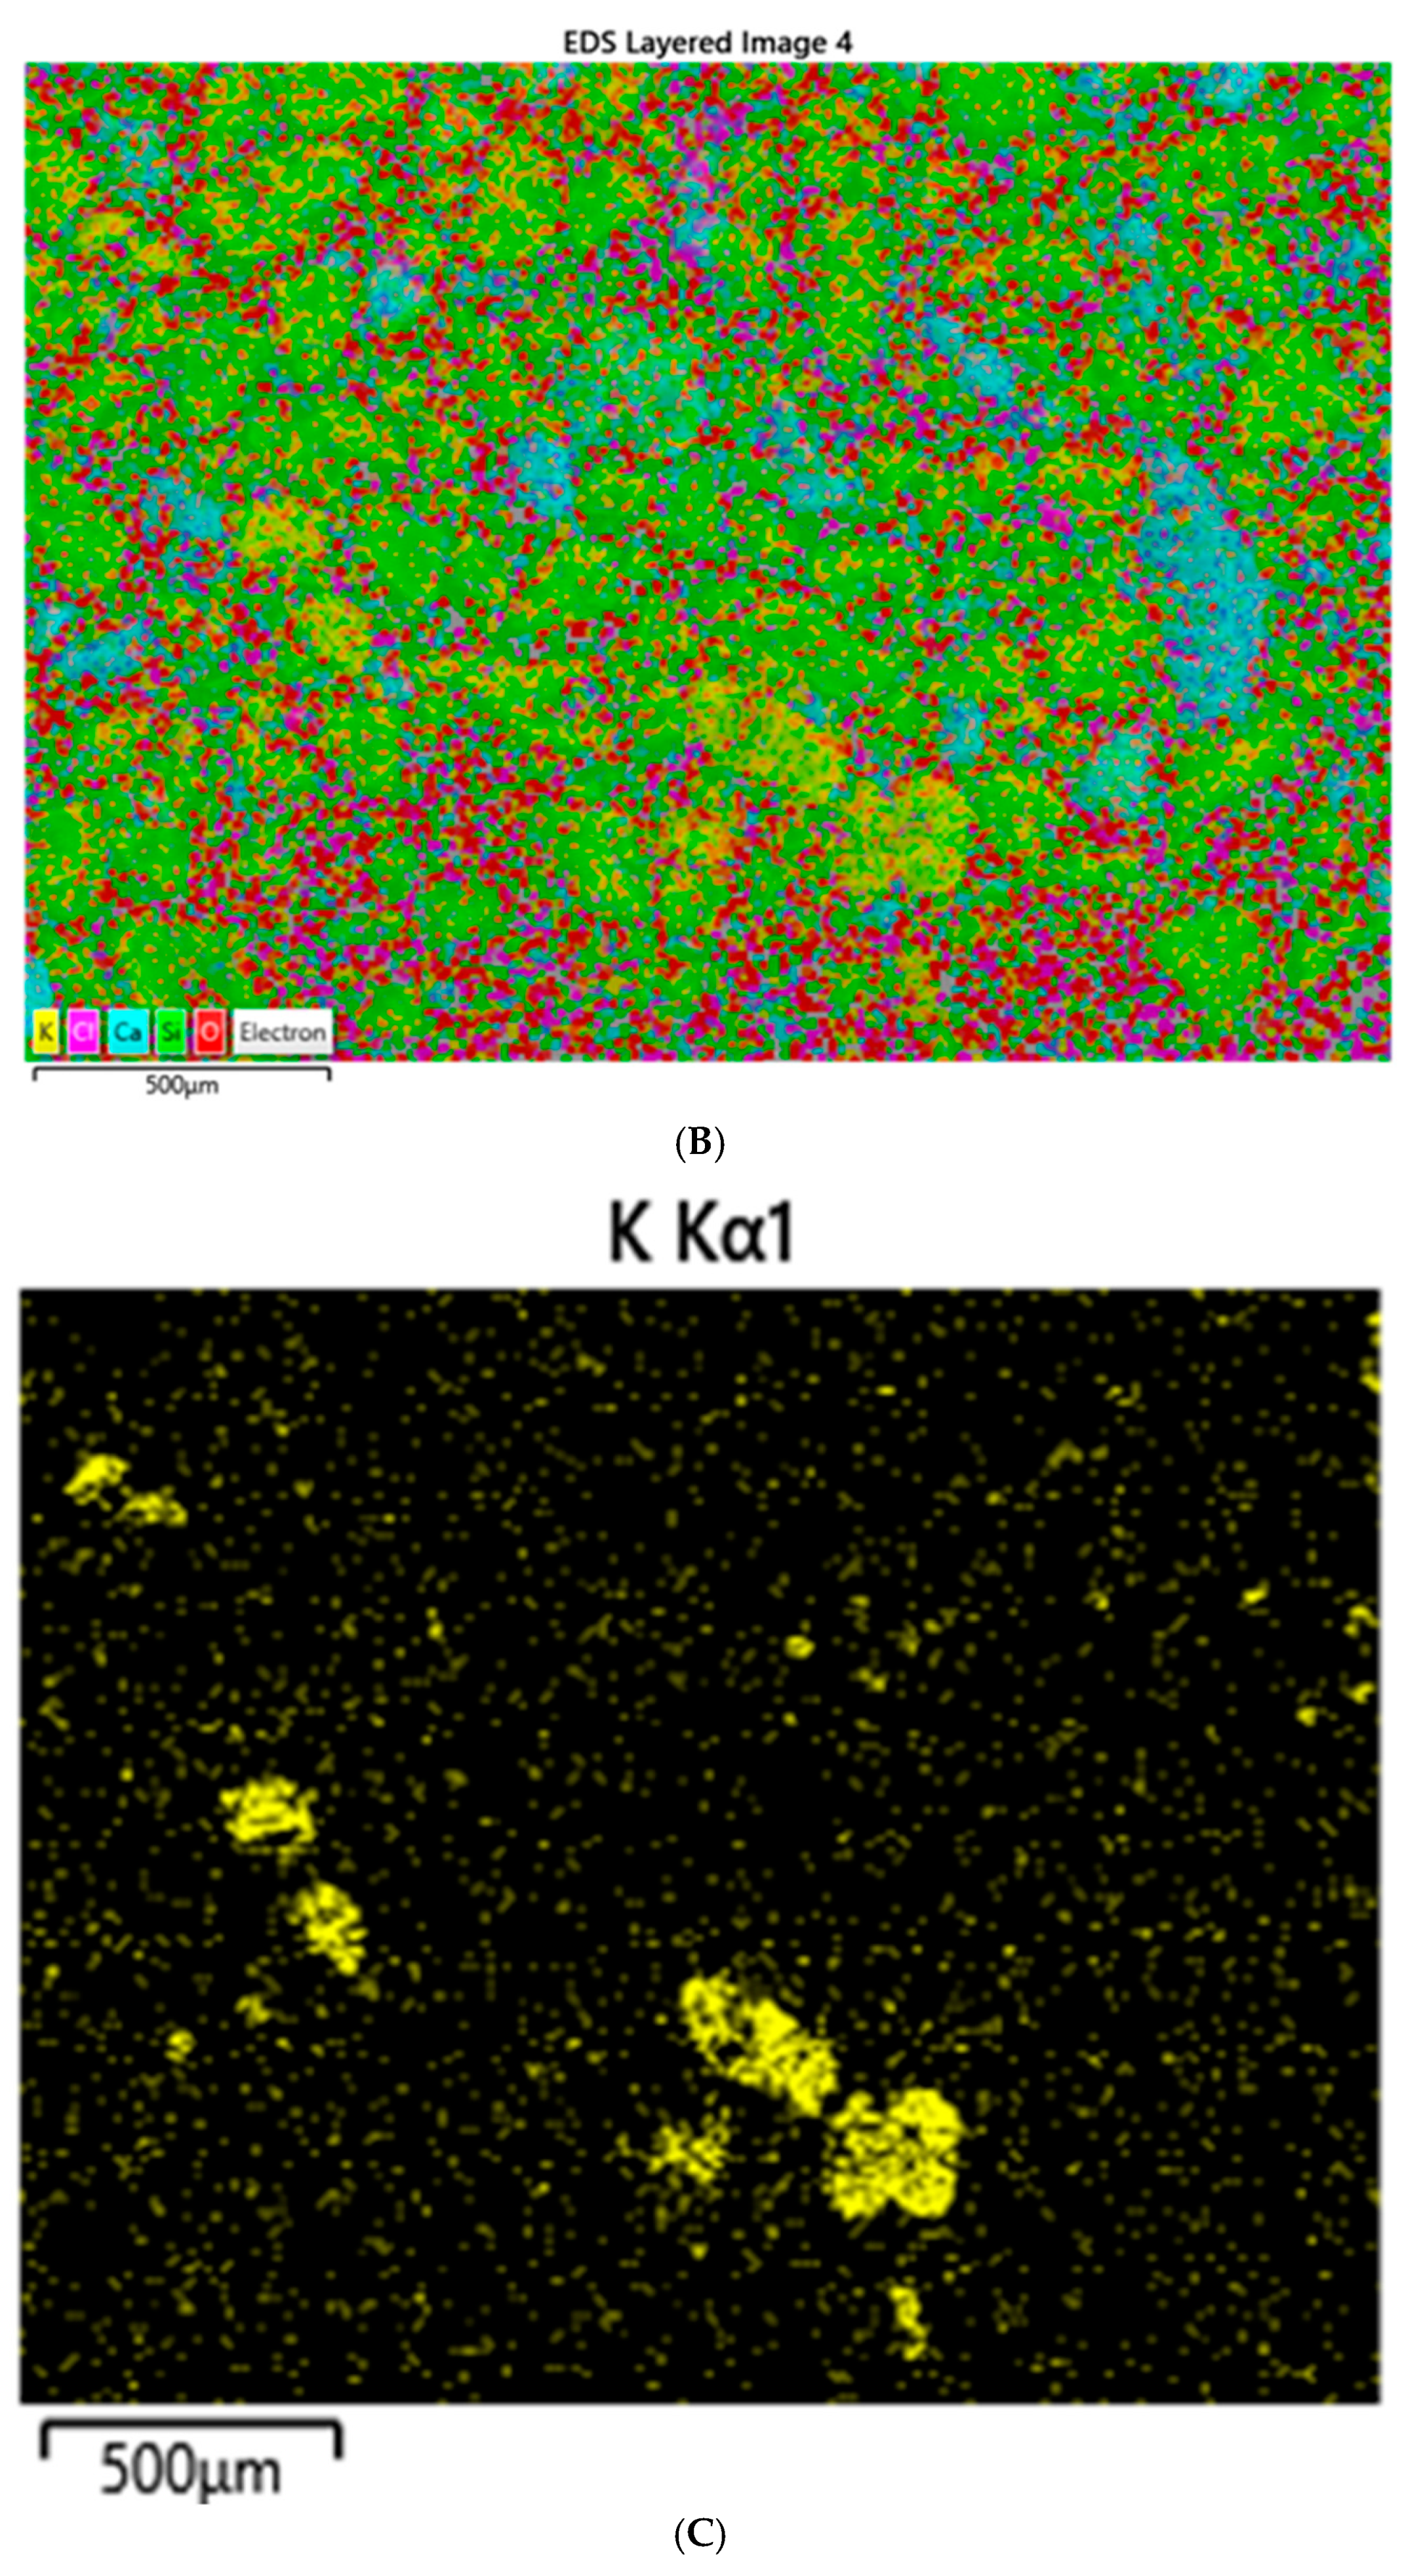
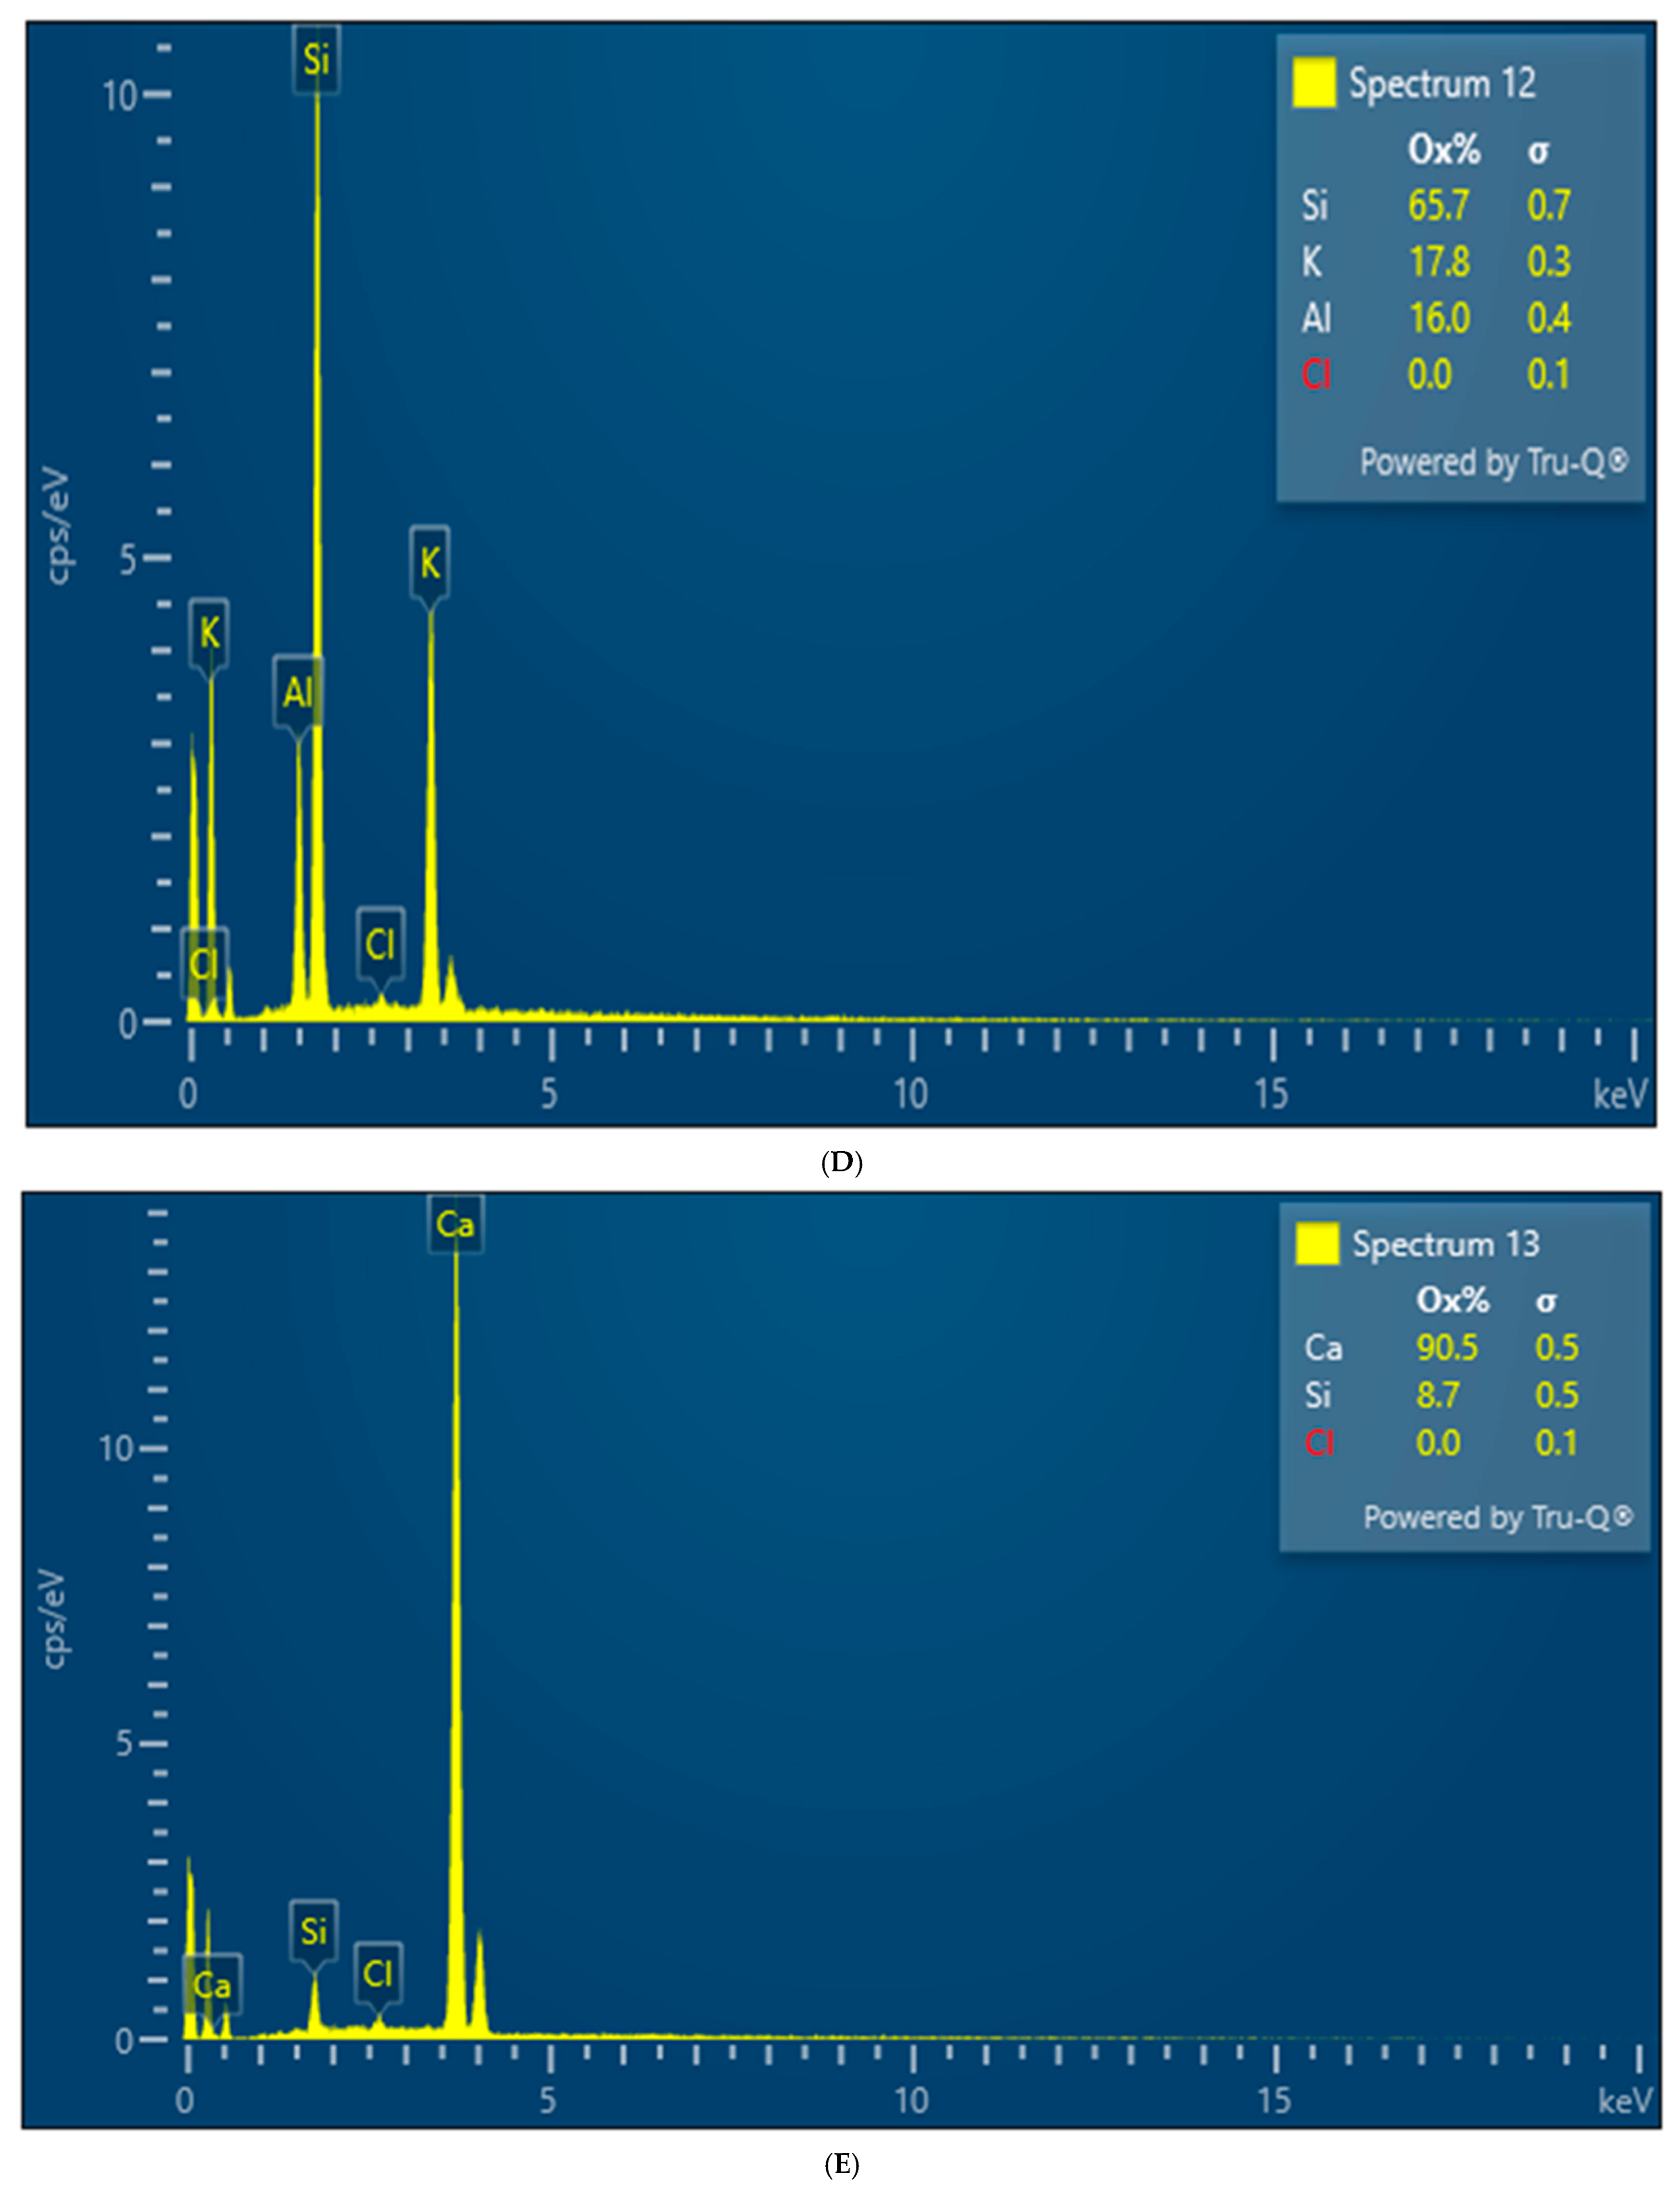
Both XRD and EDS show albite (Na) and microcline feldspar (K) present in J Reef, box 8, Reef JY Sagebrush, and Motherlode samples. Modreski [
24] notes that both albite and feldspars fluoresce in shades of red. XRD distinguished increased proportions of albite and calcite in the lower portion of box core 8 as well Sagebrush (
Figure 9) and Motherlode (
Figure 10). The presence of these minerals was confirmed by the EDS results [
Figure 7,
Figure 8 and
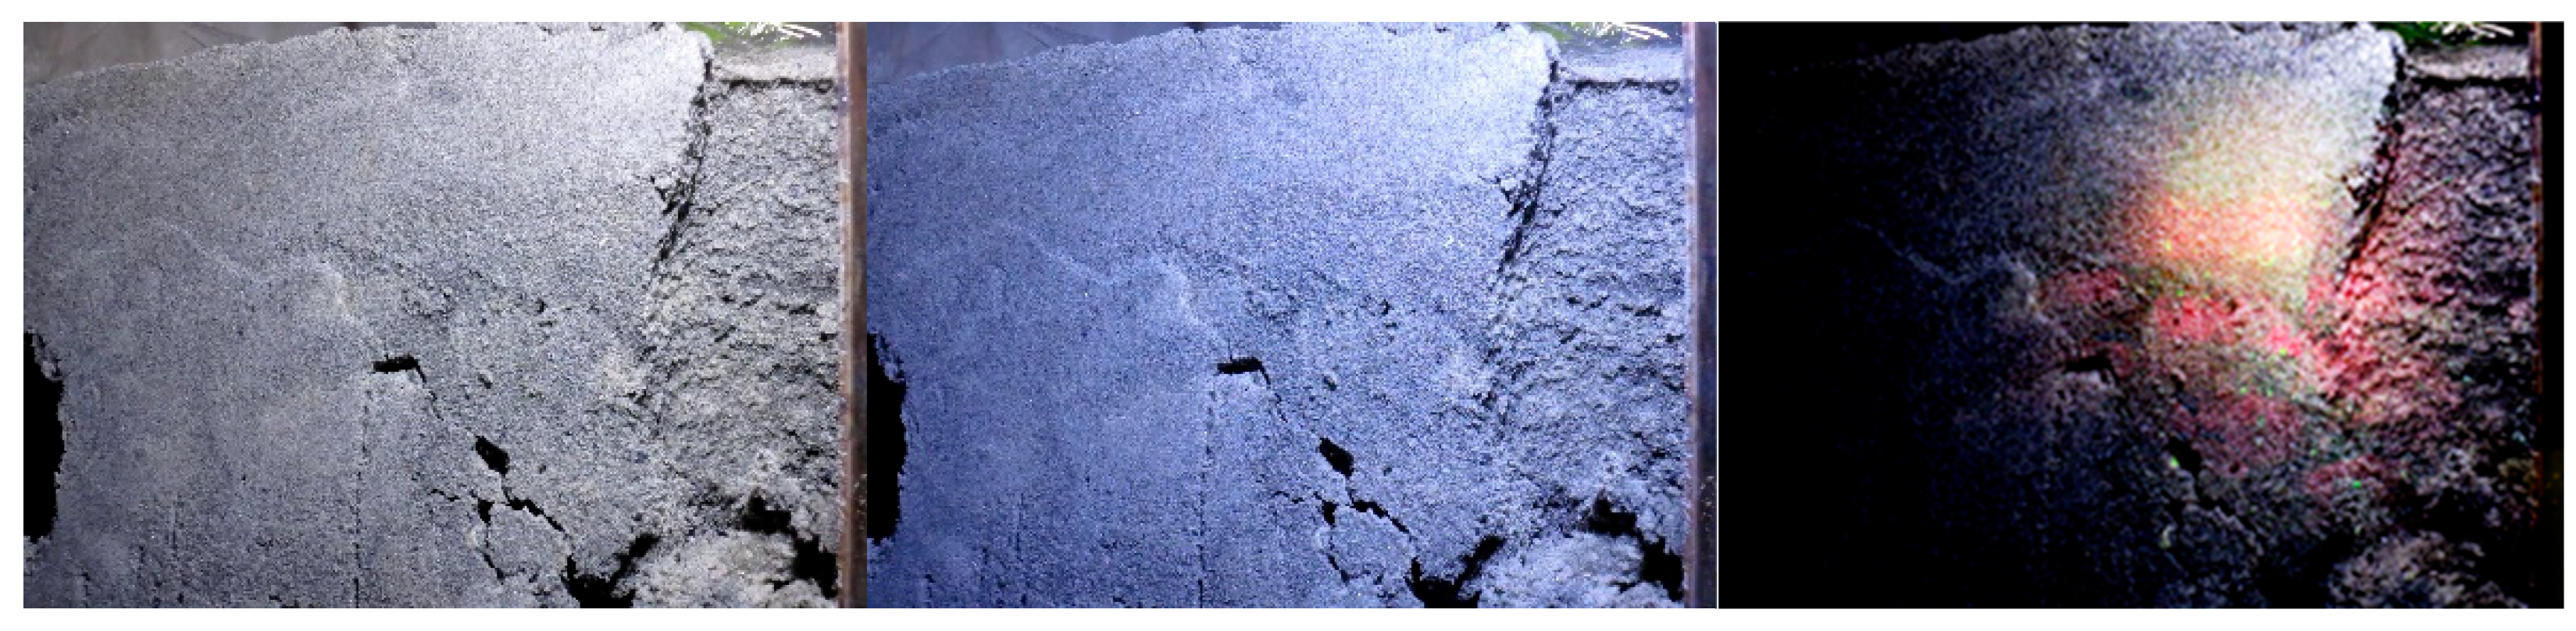
Figure 9]. No real difference could be detected in the red fluorescence between the upper and lower portions of the box core sediments.
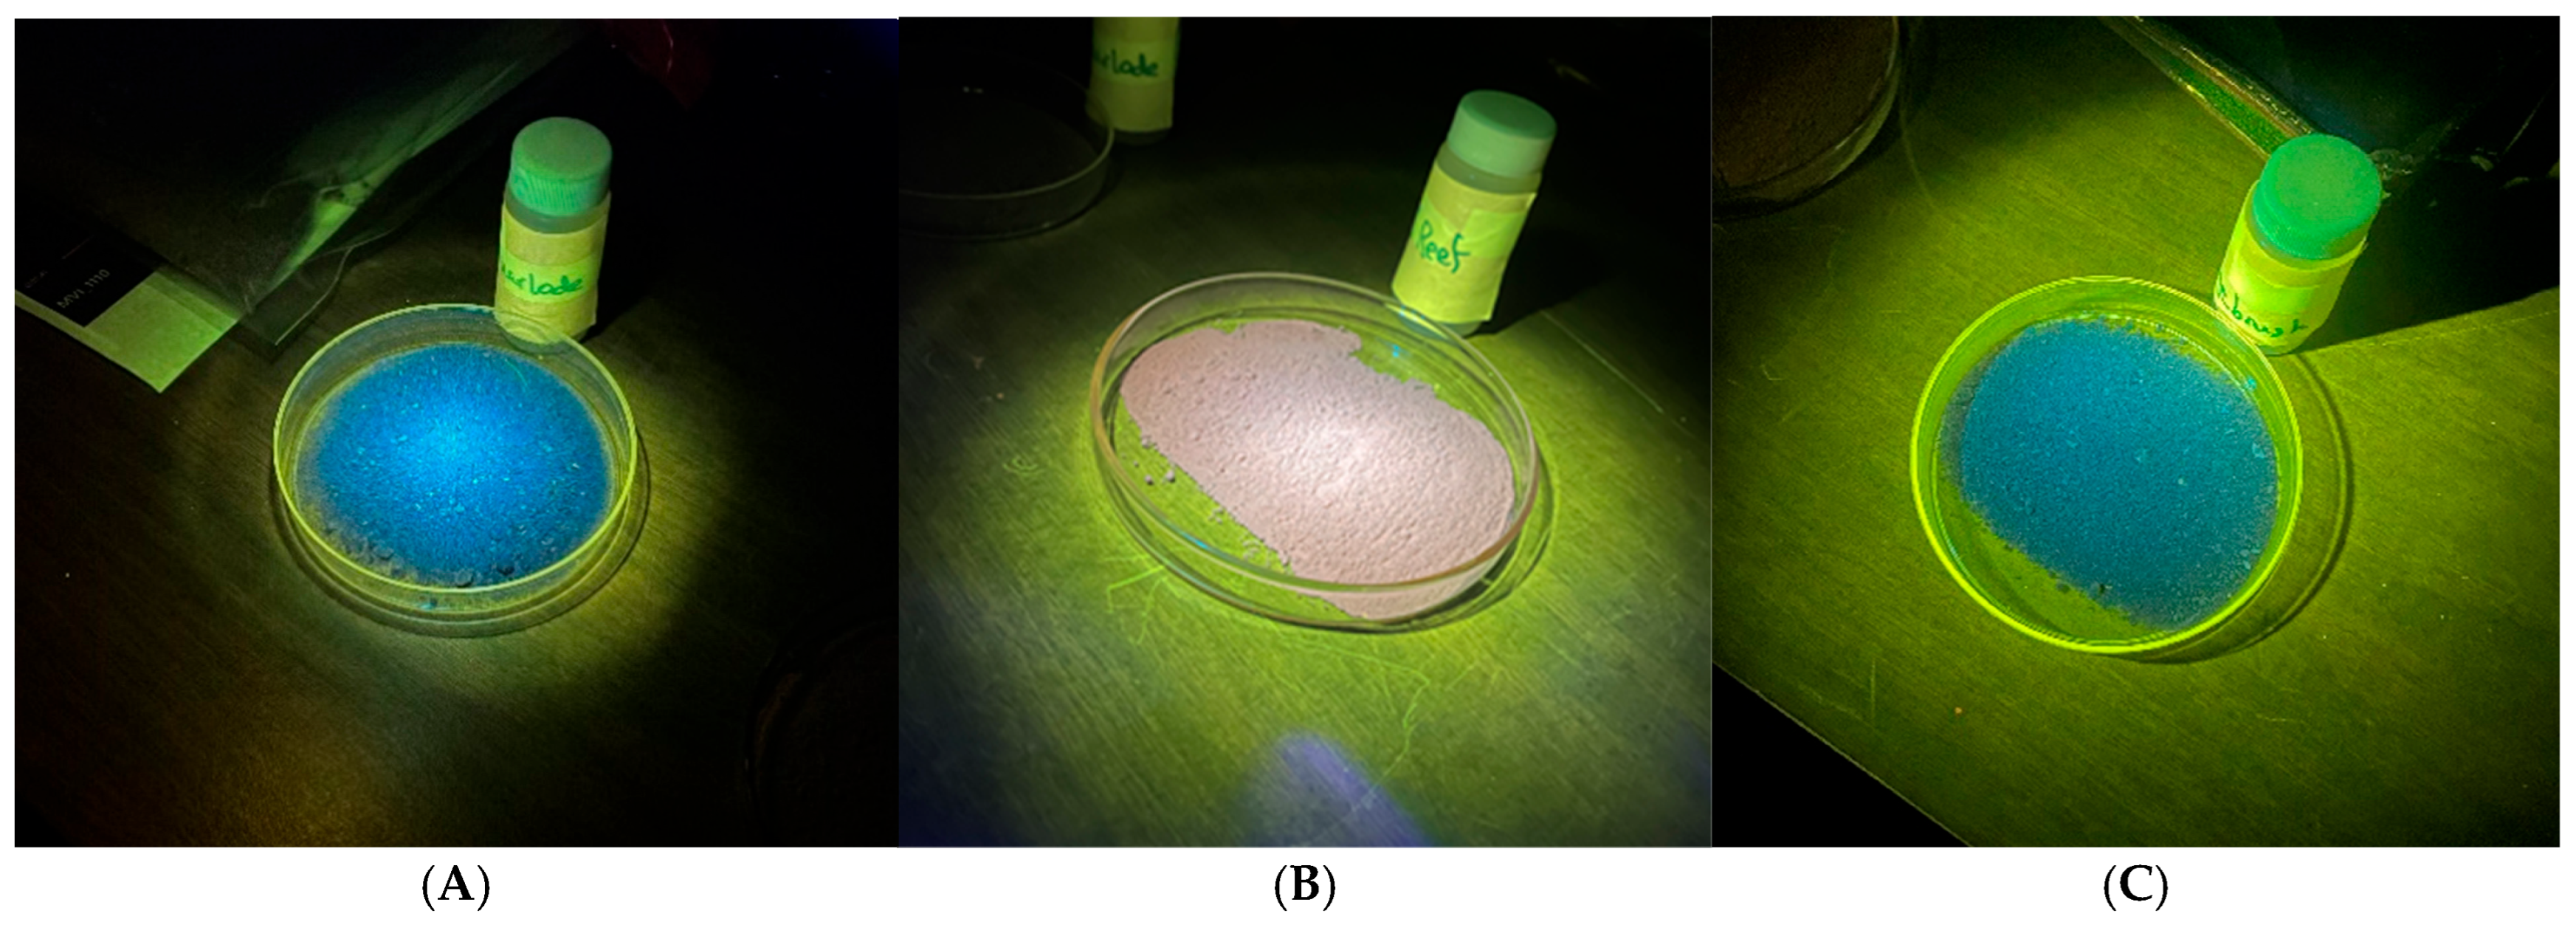
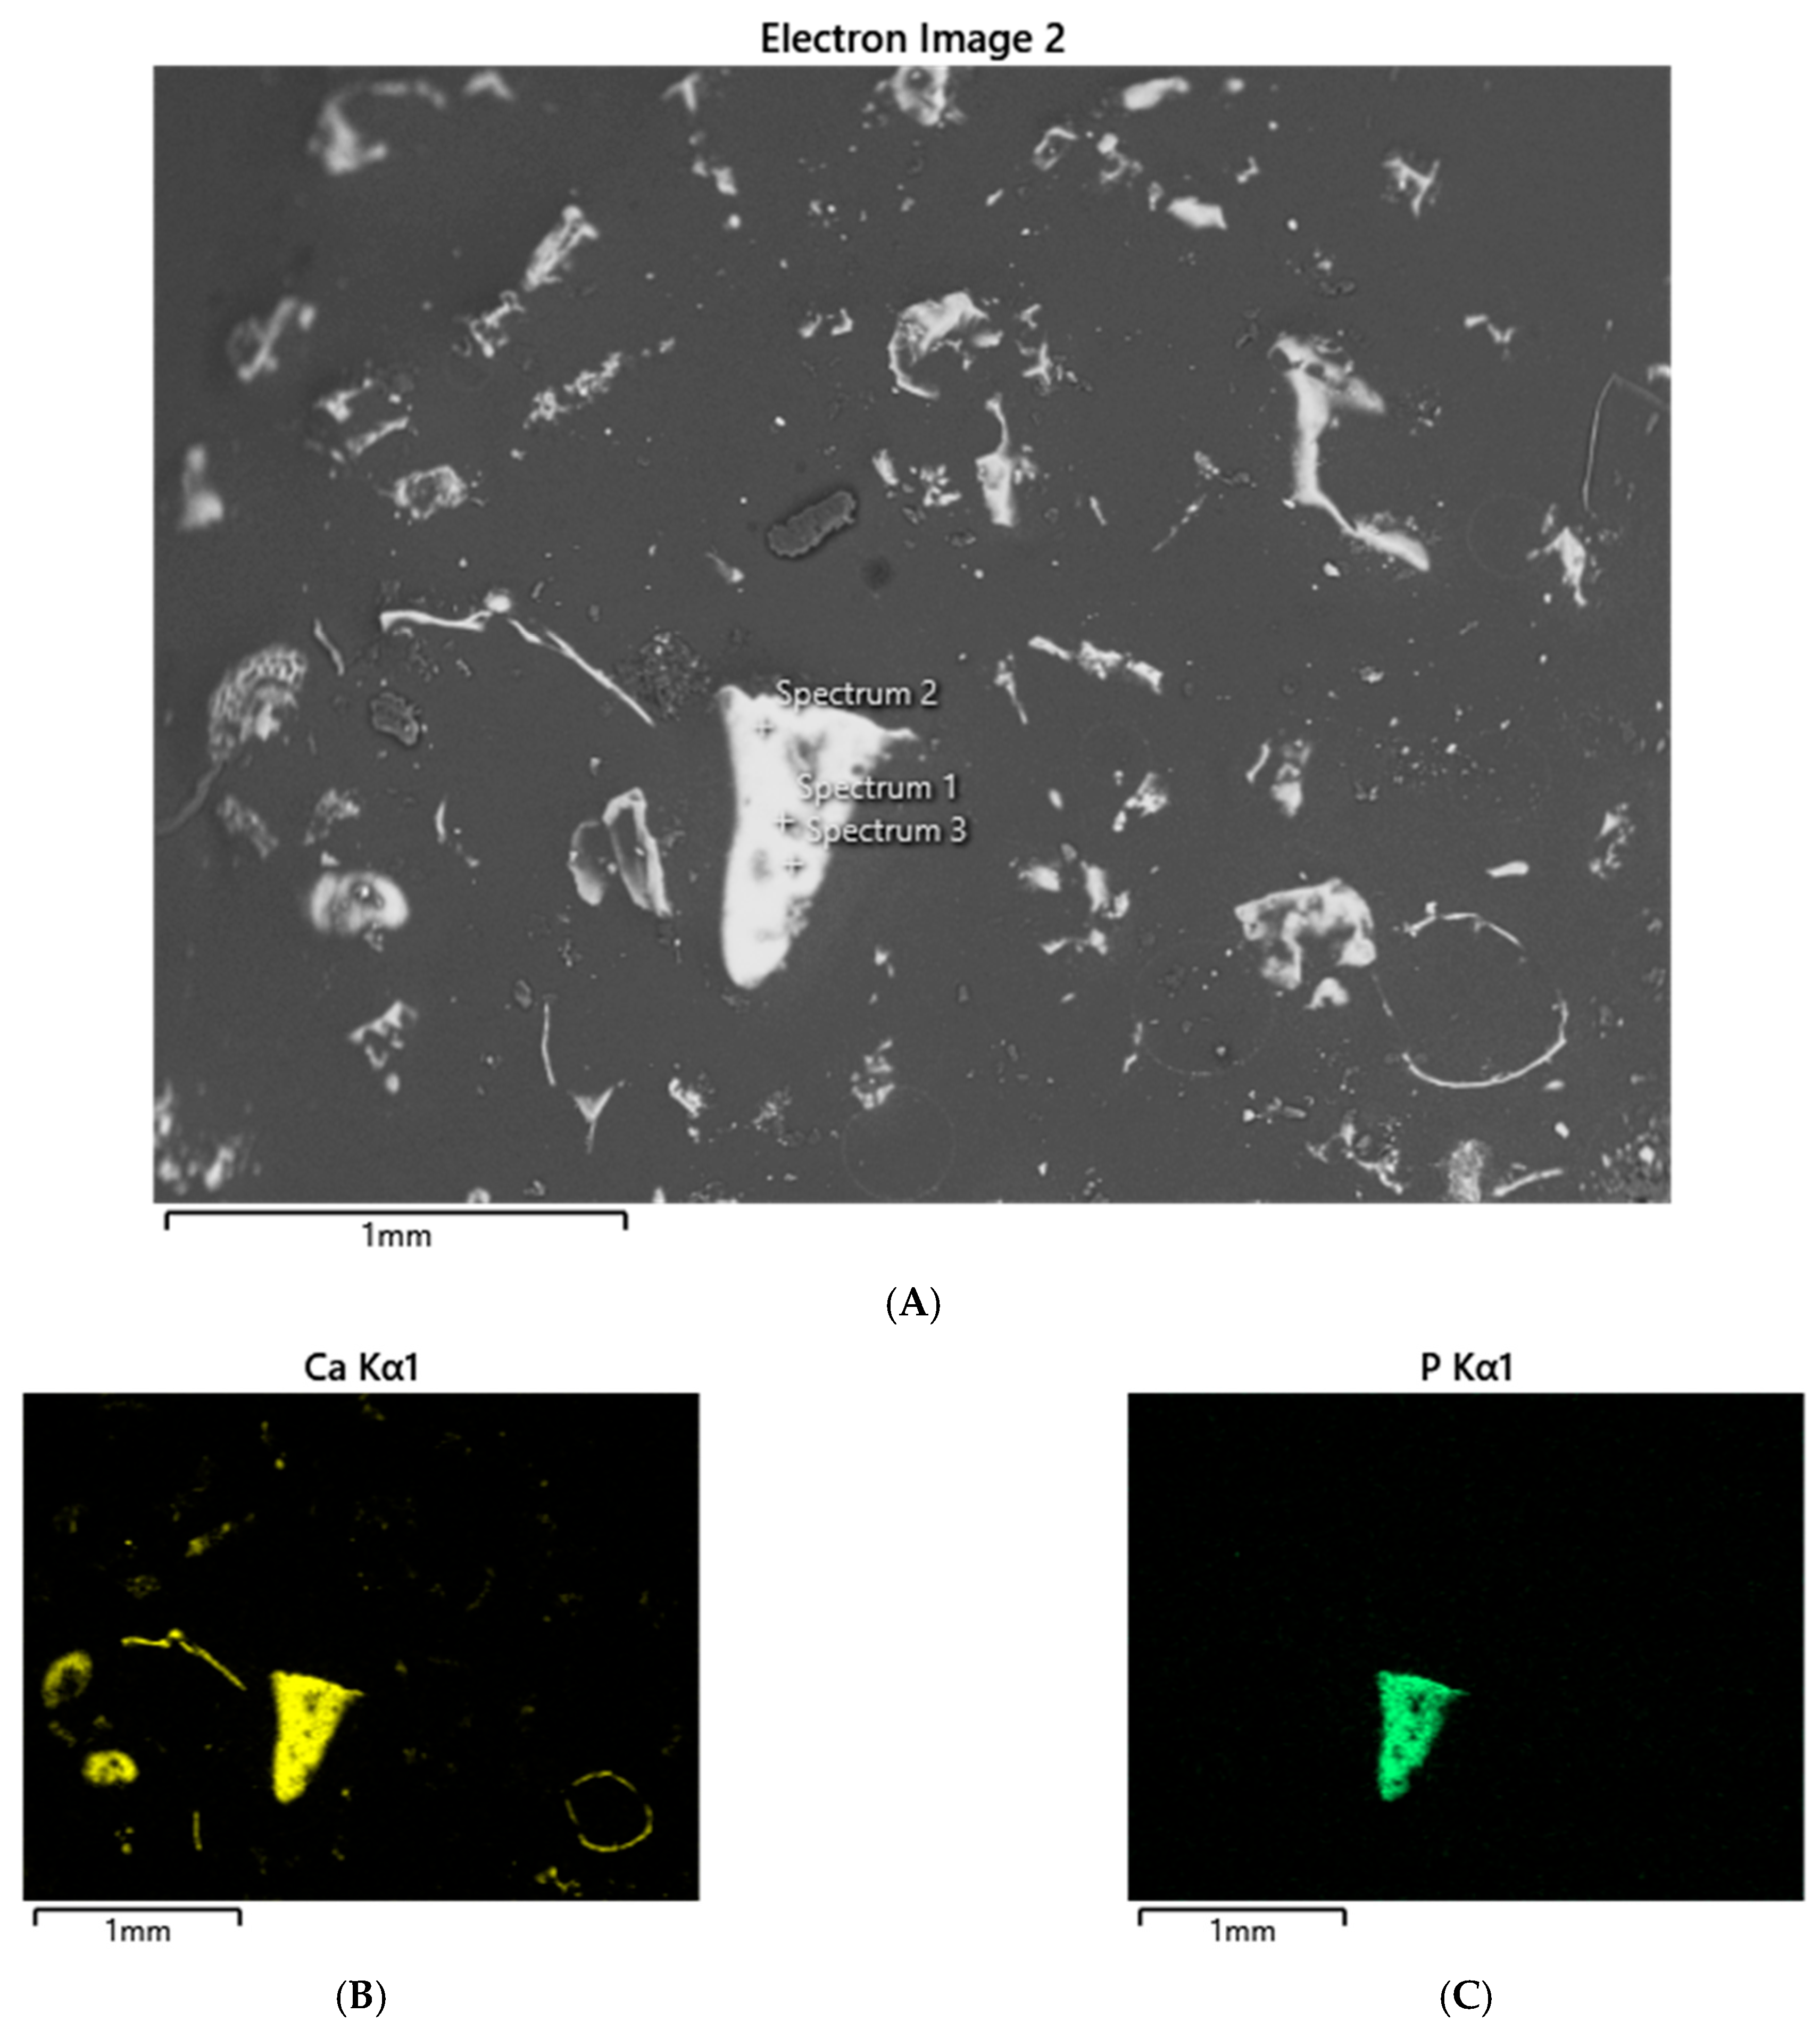
It is immediately apparent that the fluorescent colors observed for Reef KC Motherlode hand-collected samples (
Figure 1) and box core 8 (
Figure 2) are different: blue fluorescence is observed for the hand-collected sample and red fluorescence for the samples collected via the box core method. We suggest the blue fluorescence observed in the grab sample may be result of the dolomitic/Mg fraction seen in both XRD and EDS results. Magnesium, in marine sediments, can be present as both dolomite (Ca
0.5Mg
0.5)CO
3 and magnesite (MgCO
3) (25). These minerals are easily observed with simple XRD techniques (25). Coral and coralline algae are the likely sources for MgCO
3, as we commonly observe coral fragments in our samples.
Magnesium, either as dolomite or magnesite, is present in box core samples, but not to the degree seen in the grab sample. There is a sediment particle size disparity, albeit not a large one, between the samples. The box core 8 sediments are 63% medium and 22% fine sands, whereas the PONAR grab sample’s sediments are 74% medium and 19% fine sands. Particle size may influence fluorescence.
Albite and K-feldspars are both observed in the box core sediments (
Figure 5 and
Figure 8); Sagebrush (
Figure 9) and Motherlode (
Figure 10). In the box core, both aluminum (16%) associated with albite and potassium (17%)-associated impurity centers may be sufficient to create the fluorescence observed. Al
3+ centers in albite have been shown to nucleate fluorescence (26). While we are comfortable suggesting magnesium as the potential source of the blue, fluorescent colors in the grab sample, but less so for Sagebrush, we cannot make the same inference for the box core sample. Because of the amount of magnesium present, substitution of a fluorescent impurity such as Mn
2+ must be expected. In this sample, red fluorescence predominates (
Figure 2). No changes in the fluorescent color or intensity were observed as the box core dried.
If magnesium-associated luminescence in dolomite/MgCO
3 is the source of the blue fluorescence in the Reef KC Motherlode grab sediments, the same cannot be said of the hand-collected Reef JY Sagebrush sample, which exhibits a blue fluorescence without a comparative amount of magnesium present. In this sediment, as with Motherlode, albite is present. Other research suggested that heating might extinguish fluorescence in the three LOI samples [
26]. Stoops notes that heating of shells can alter fluorescence [
27]. McDougall [
28] suggests that fluorescence in some minerals can be “quenched” or permanently destroyed by heating if the mineral is altered. No such effect was observed during our experiments.
5. Conclusions
Fluorescence of minerals is not uncommon, occurring in approximately 15% of all minerals. Within this 15%, only certain variations and compositions of these minerals fluoresce. The fluorescence of these minerals can be observed using ultraviolet, X-ray, cathode electrons, and visible spectrum light sources (blue light, etc.). In marine sediments, blue light illumination has produced an easily observed fluorescent response in both underwater and in laboratory settings. Fossilized shells and bone were observed to fluoresce under blue light. This fluorescence, like that of the sediments, can be attributed to carbonate minerals, such as calcite/aragonite. Feldspars are major accessory minerals in the sediment prism of the Georgia Bight, and much of the observed fluorescence in our samples may be attributed to their presence. Feldspars are to be expected in sediments whose origins are rivers draining the Blue Ridge and Georgia Coastal Plain.
Albite is also a common mineral in shelf sediments. As a possible source of fluorescence, it would be most closely associated with the strong blue response in both JY Sagebrush and Reef KC Motherlode sediments.
We found blue light fluorescence in the blue and red wavelength portions of the visible light spectrum, and surprisingly little in the yellow/green portion. Our use of XRD and SEM-EDS was successful in identifying the mineral composites and elemental makeup of our samples. This was our strongest point in our research, proving that these are good identification methods for finding out what is causing which color. To this end, we were less successful at determining exactly which mineral impurity led to which fluorescent color, though we do believe our inferences regarding impurity centers in albite and magnesium are reasonable. Future work should investigate grain size and individual mineral fractions.


