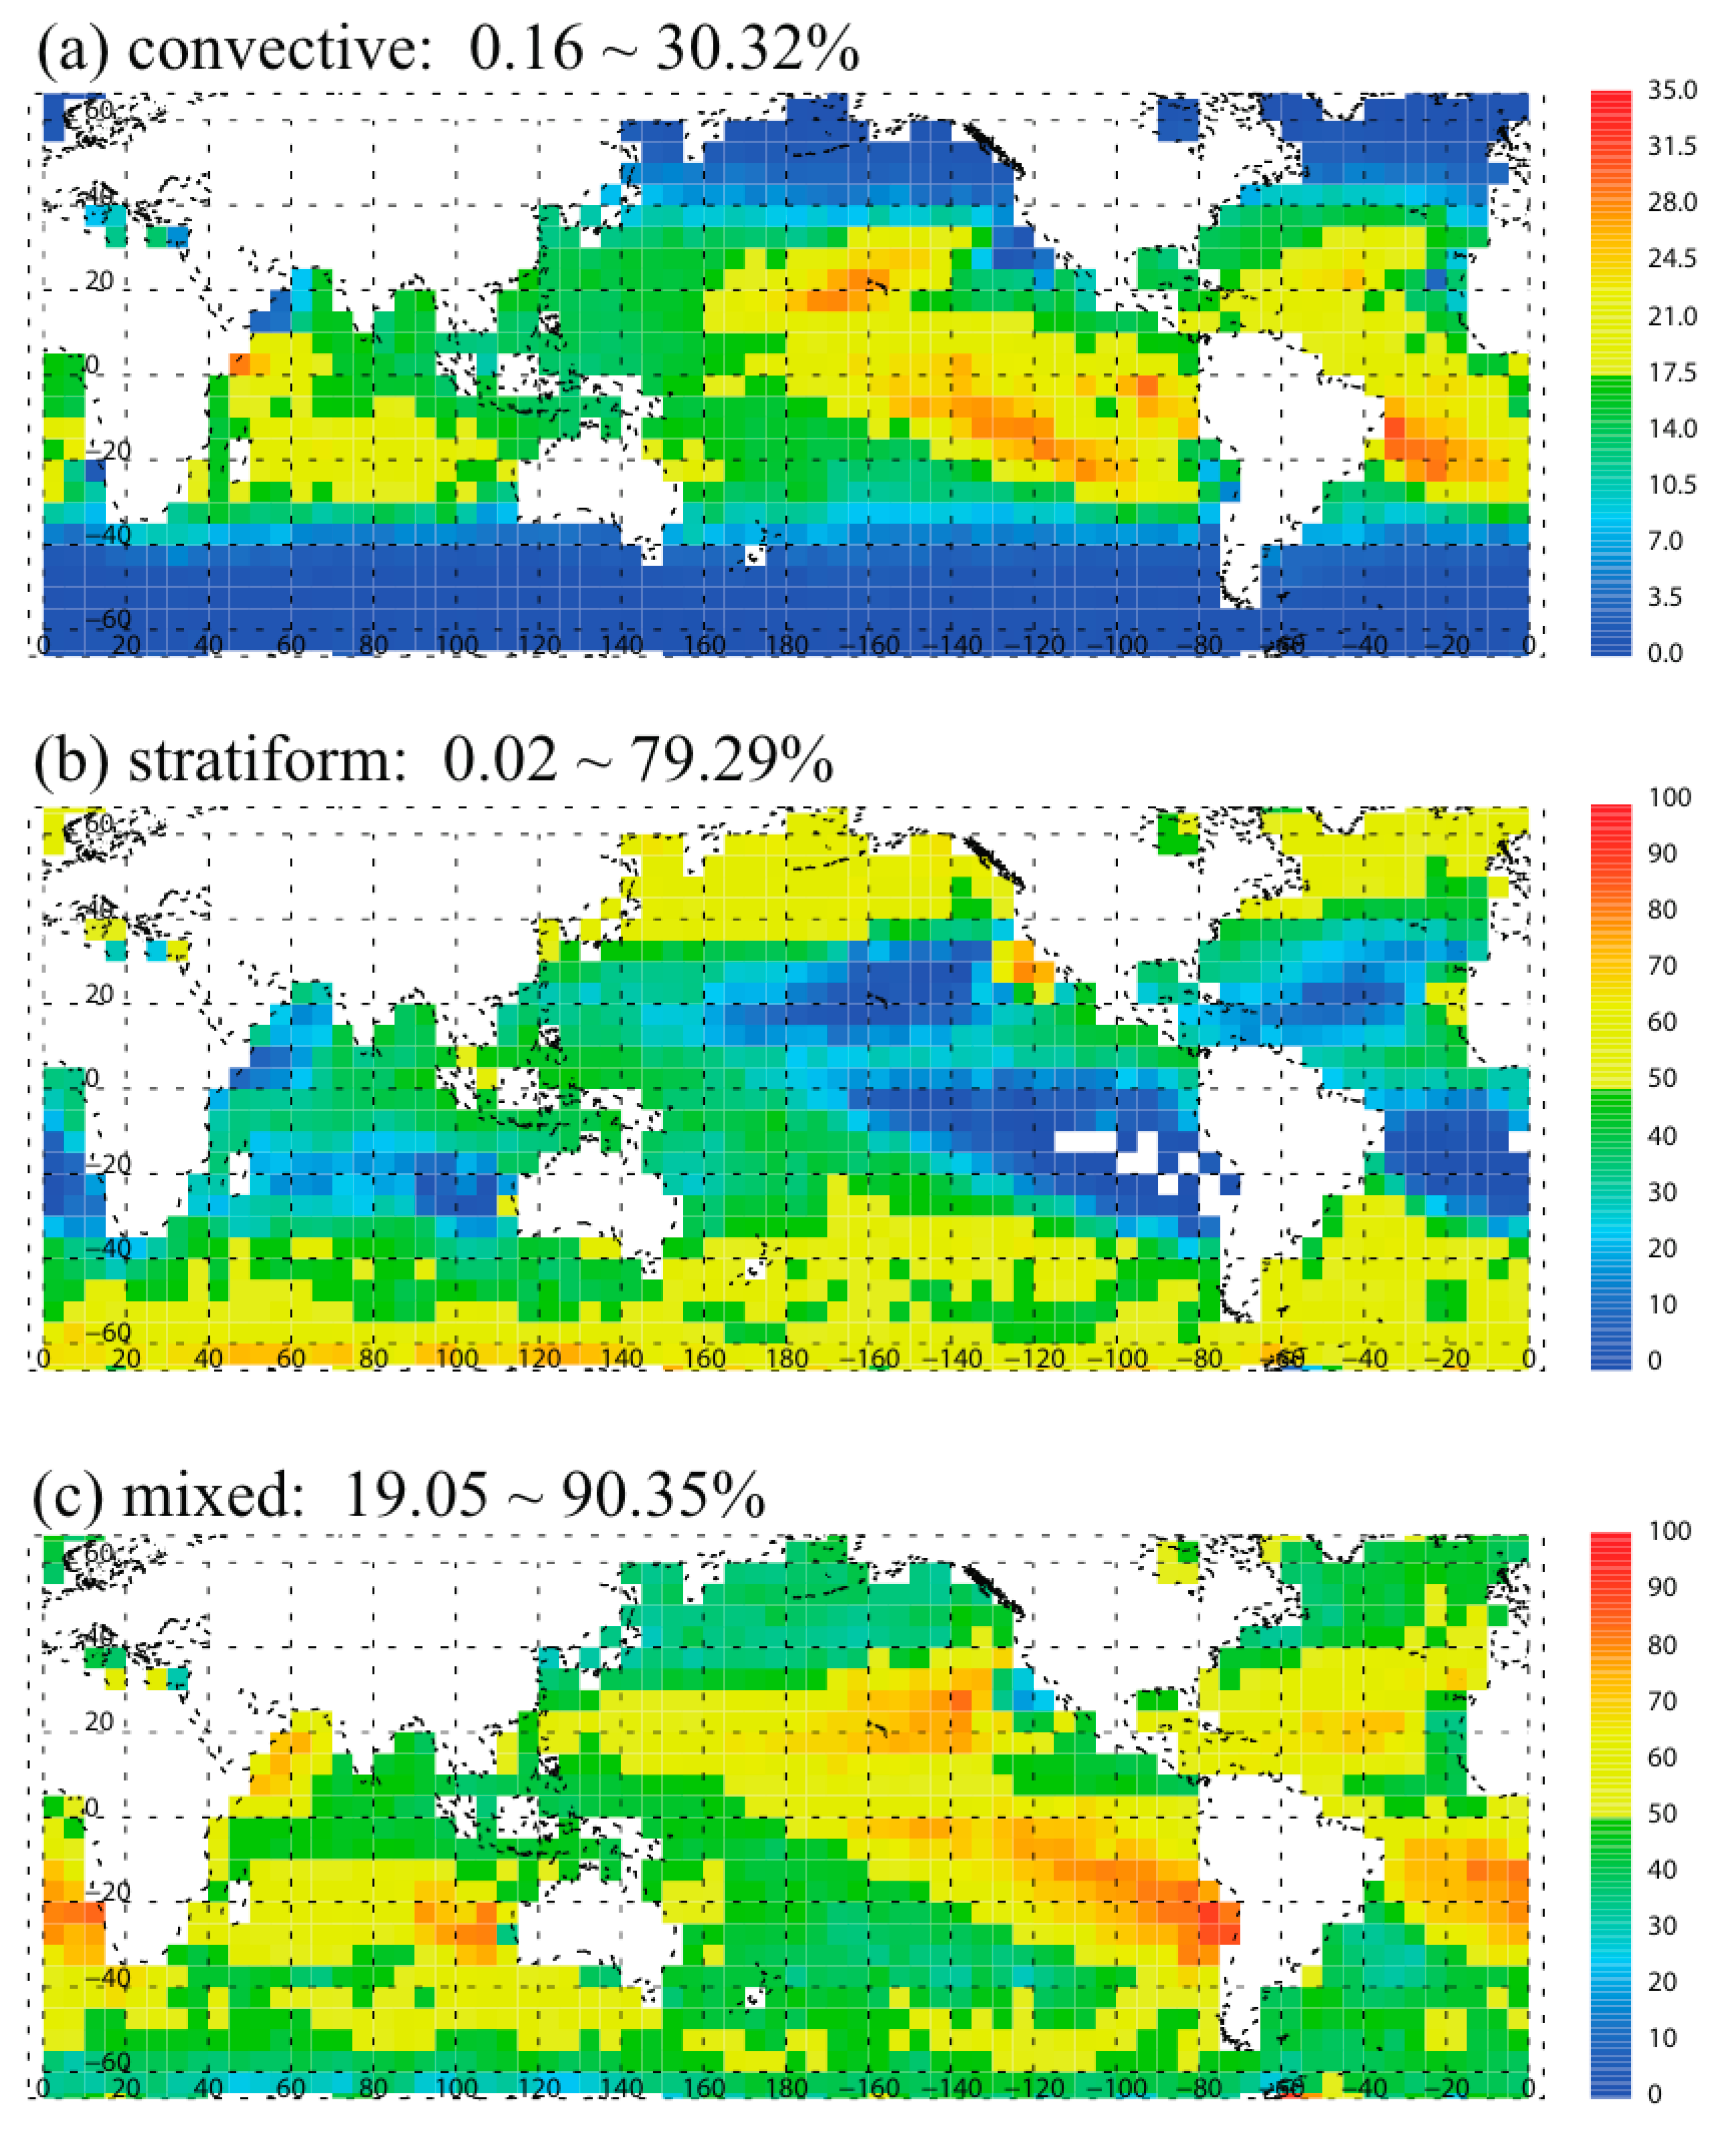
3.1. Global Distribution
We analyzed rainfall events within 5° × 5° grids to calculate the fractional occurrence of precipitation types (
Figure 1). This analysis reveals distinct regional characteristics in the global spatial distribution of convective, stratiform, and mixed precipitation categories. In low-latitude regions (between approximately ±30° latitude), convective fractions are typically in the range of 15–25%, while stratiform fractions generally range from 30% to 50%. Mixed-type precipitation is highly prevalent, typically exceeding ~40%. Within these tropical and subtropical regions, the subtropical high pressure (STHP) systems’ core and surrounding regions in both hemispheres exhibit a distinctive precipitation pattern, showing relatively higher convective fractions (~20–25%) with minimal stratiform precipitation (<15%) but substantial mixed-type precipitation (~60–85%). This suggests that precipitation is likely to form as isolated or unorganized convective systems in these thermodynamically stable and subsidence-dominated environments. These isolated and unorganized systems rarely develop large stratiform areas, unlike organized Mesoscale Convective Systems (MCSs) that typically produce extensive trailing stratiform regions (e.g., [
29,
30]). Beyond ±40° latitude in both hemispheres, convective fractions drop sharply below 10%, stratiform fractions increase up to ~75%, and mixed-type fractions typically vary between 20 and 40%, with an average around 30%. It should be noted that the relatively coarse horizontal resolution (~15 km) used in this analysis may influence precipitation type classifications. Isolated convective systems, particularly those smaller than the pixel scale, may be classified as mixed rather than convective precipitation, contributing to the high global mixed precipitation fraction (47.6%) and potentially explaining the lower convective fractions compared to studies using finer spatial resolution (e.g., [
30,
31]). These distributions reveal a clear shift from convective/mixed dominance in lower latitudes to stratiform dominance in regions beyond 40° latitude (e.g., [
30,
32]). Interestingly, the most pronounced gradient in this transition typically occurs between 30 and 40° latitude even during summer months, when one might expect this transition zone to shift poleward due to increased solar heating. These latitudinal patterns demonstrate how latitude fundamentally influences precipitation regimes across the global oceans.
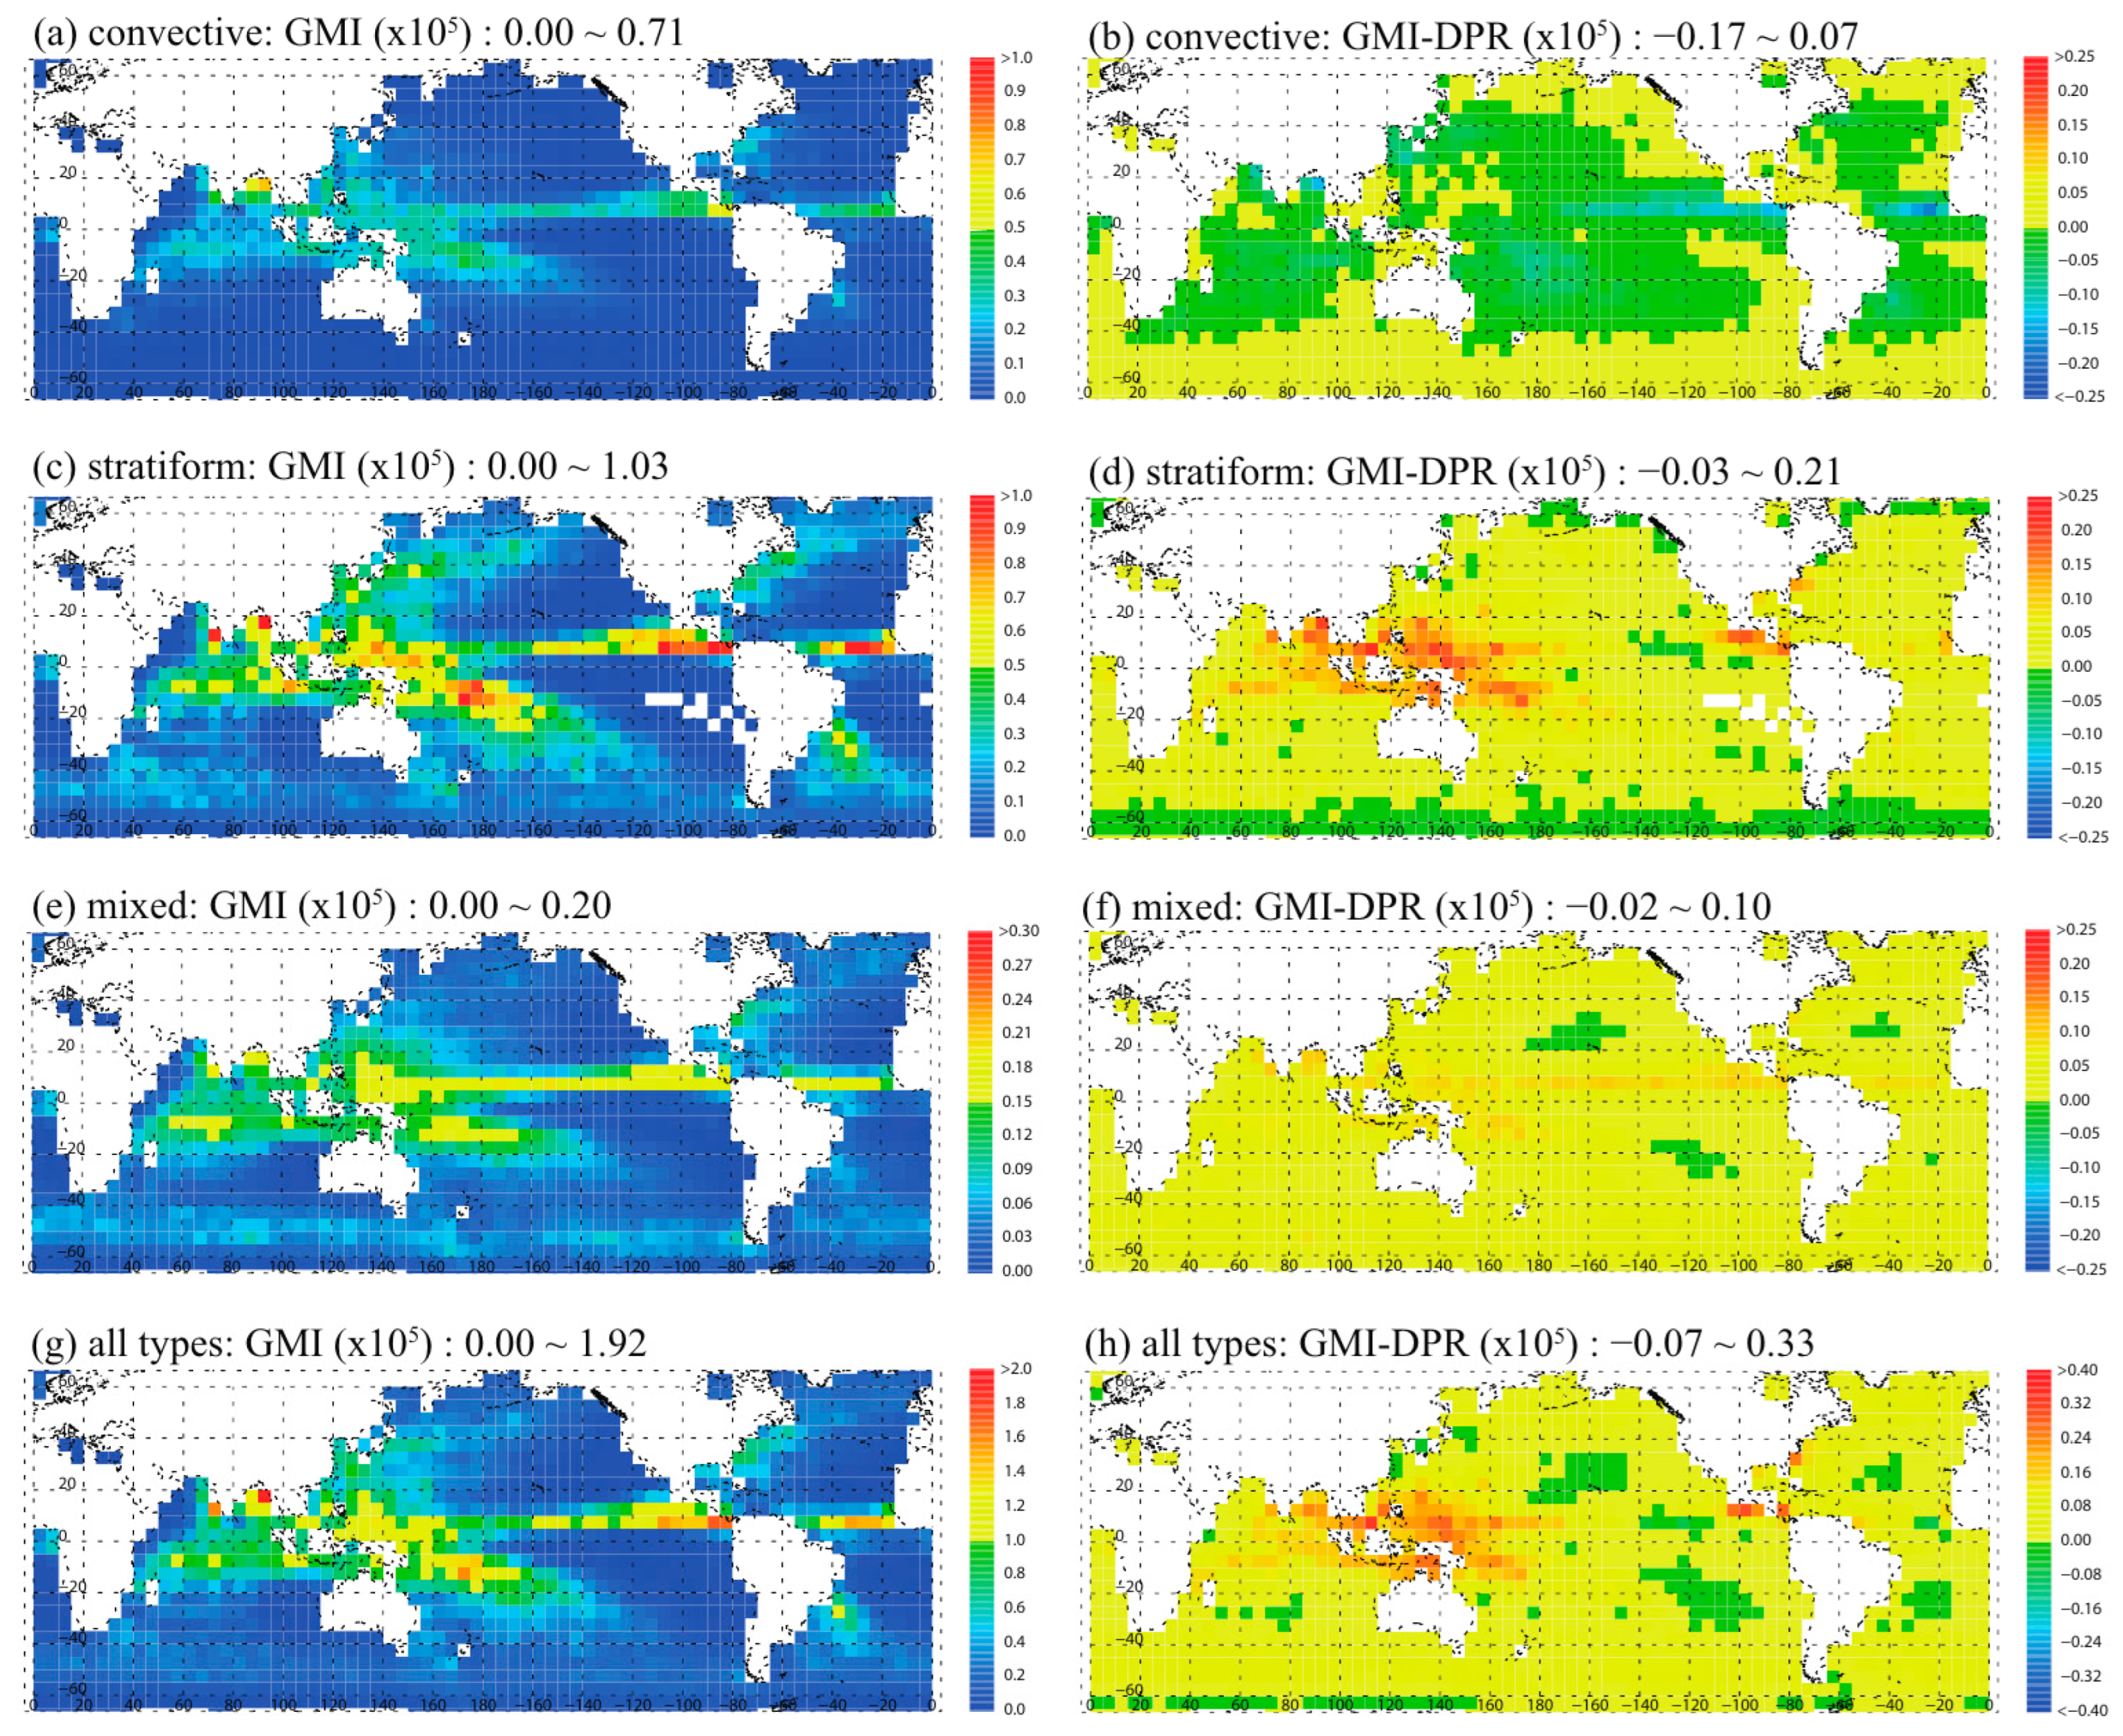
To analyze annual accumulated precipitation, GMI precipitation intensities (mm/h) were accumulated within 5° × 5° grids over five summer seasons and then divided by five to derive annual values. As previously explained, sampling frequency variations with latitude have been adjusted, ensuring uniform sampling coverage across all grid cells. Therefore, when applying a consistent time interval factor to these normalized samples, these accumulation values effectively represent the spatial distribution of annual accumulated precipitation during the study period.
Figure 2 displays these annual accumulated precipitation values of GMI along with their differences from DPR observations (GMI minus DPR) for each hemisphere by precipitation type, providing a representation of the annual precipitation distribution. The GMI measurements effectively capture major precipitation features across all precipitation types, including high accumulated rainfall zones associated with the Inter-Tropical Convergence Zone (ITCZ) and Southern Pacific Convergence Zone (SPCZ) and enhanced precipitation bands along continental eastern seaboards (west of STHP systems). The measurements also clearly depict dry regions in and extending from STHP systems in both hemispheres. These observations are consistent with documented global precipitation patterns (e.g., [
33,
34,
35]). The relatively small differences between GMI and DPR values (typically within 5–8% of the total precipitation amounts) indicate good agreement between the two observational systems in both spatial patterns and quantitative assessments. This consistency supports previous cross-validation studies (e.g., [
18,
36]).
More detailed examination reveals systematic differences between the two measurements across various precipitation types. For convective precipitation (
Figure 2a,b), the GMI exhibits a characteristic behavior similar to what was documented by Seo et al. (2015) [
25] in their comparison between the TRMM Microwave Imager (TMI) and Precipitation Radar (PR), where passive microwave sensors tend to overestimate precipitation at lower rain rates (<~1 mm/h) and underestimate at higher rain rates compared to radar measurements. In particular, the underestimation of the GMI at higher rain rates is primarily due to the scattering effects from large ice particles, the saturation effect in the TB-rain rate relationship at high intensities (e.g., [
7,
37]), the confusion between the surface and atmospheric signals [
17], and limitations in the Bayesian approach used in retrieval algorithms [
24]. This pattern is clearly reflected in the spatial distribution of GMI-DPR differences. Across most tropical and subtropical oceanic regions with intense convection, the GMI shows negative differences, indicating underestimation of high-intensity rainfall. Conversely, higher latitude regions (beyond approximately ±40°) show positive differences, reflecting the GMI’s tendency to overestimate lower rainfall intensities that are common in these areas. These positive differences also appear in Maritime Southeast Asia and Caribbean/Central American coastal regions despite these regions typically experiencing higher rainfall intensities. In these coastal and island regions, the proximity of landmasses is likely to influence the microwave signatures detected by the GMI. This influence leads to increased brightness temperatures in emission channels, which probably results in overestimation of precipitation, even in areas with substantial rainfall.
In contrast to convective precipitation, stratiform precipitation (
Figure 2c,d) exhibits remarkably uniform positive differences (GMI > DPR) across almost all oceanic regions, without the latitude-dependent variation seen in convective precipitation. This widespread overestimation trend aligns with previous findings regarding passive microwave sensors’ tendency to overestimate stratiform precipitation (e.g., [
24,
25]). The overestimation is particularly pronounced in the tropical Pacific warm pool and the Bay of Bengal. Mixed precipitation exhibits similar difference patterns to stratiform precipitation (
Figure 2e,f). In the overall analysis of all precipitation types, the GMI generally shows positive differences across most regions, indicating that the overestimation in stratiform and mixed precipitation outweighs the underestimation in convective precipitation (
Figure 2g,h).
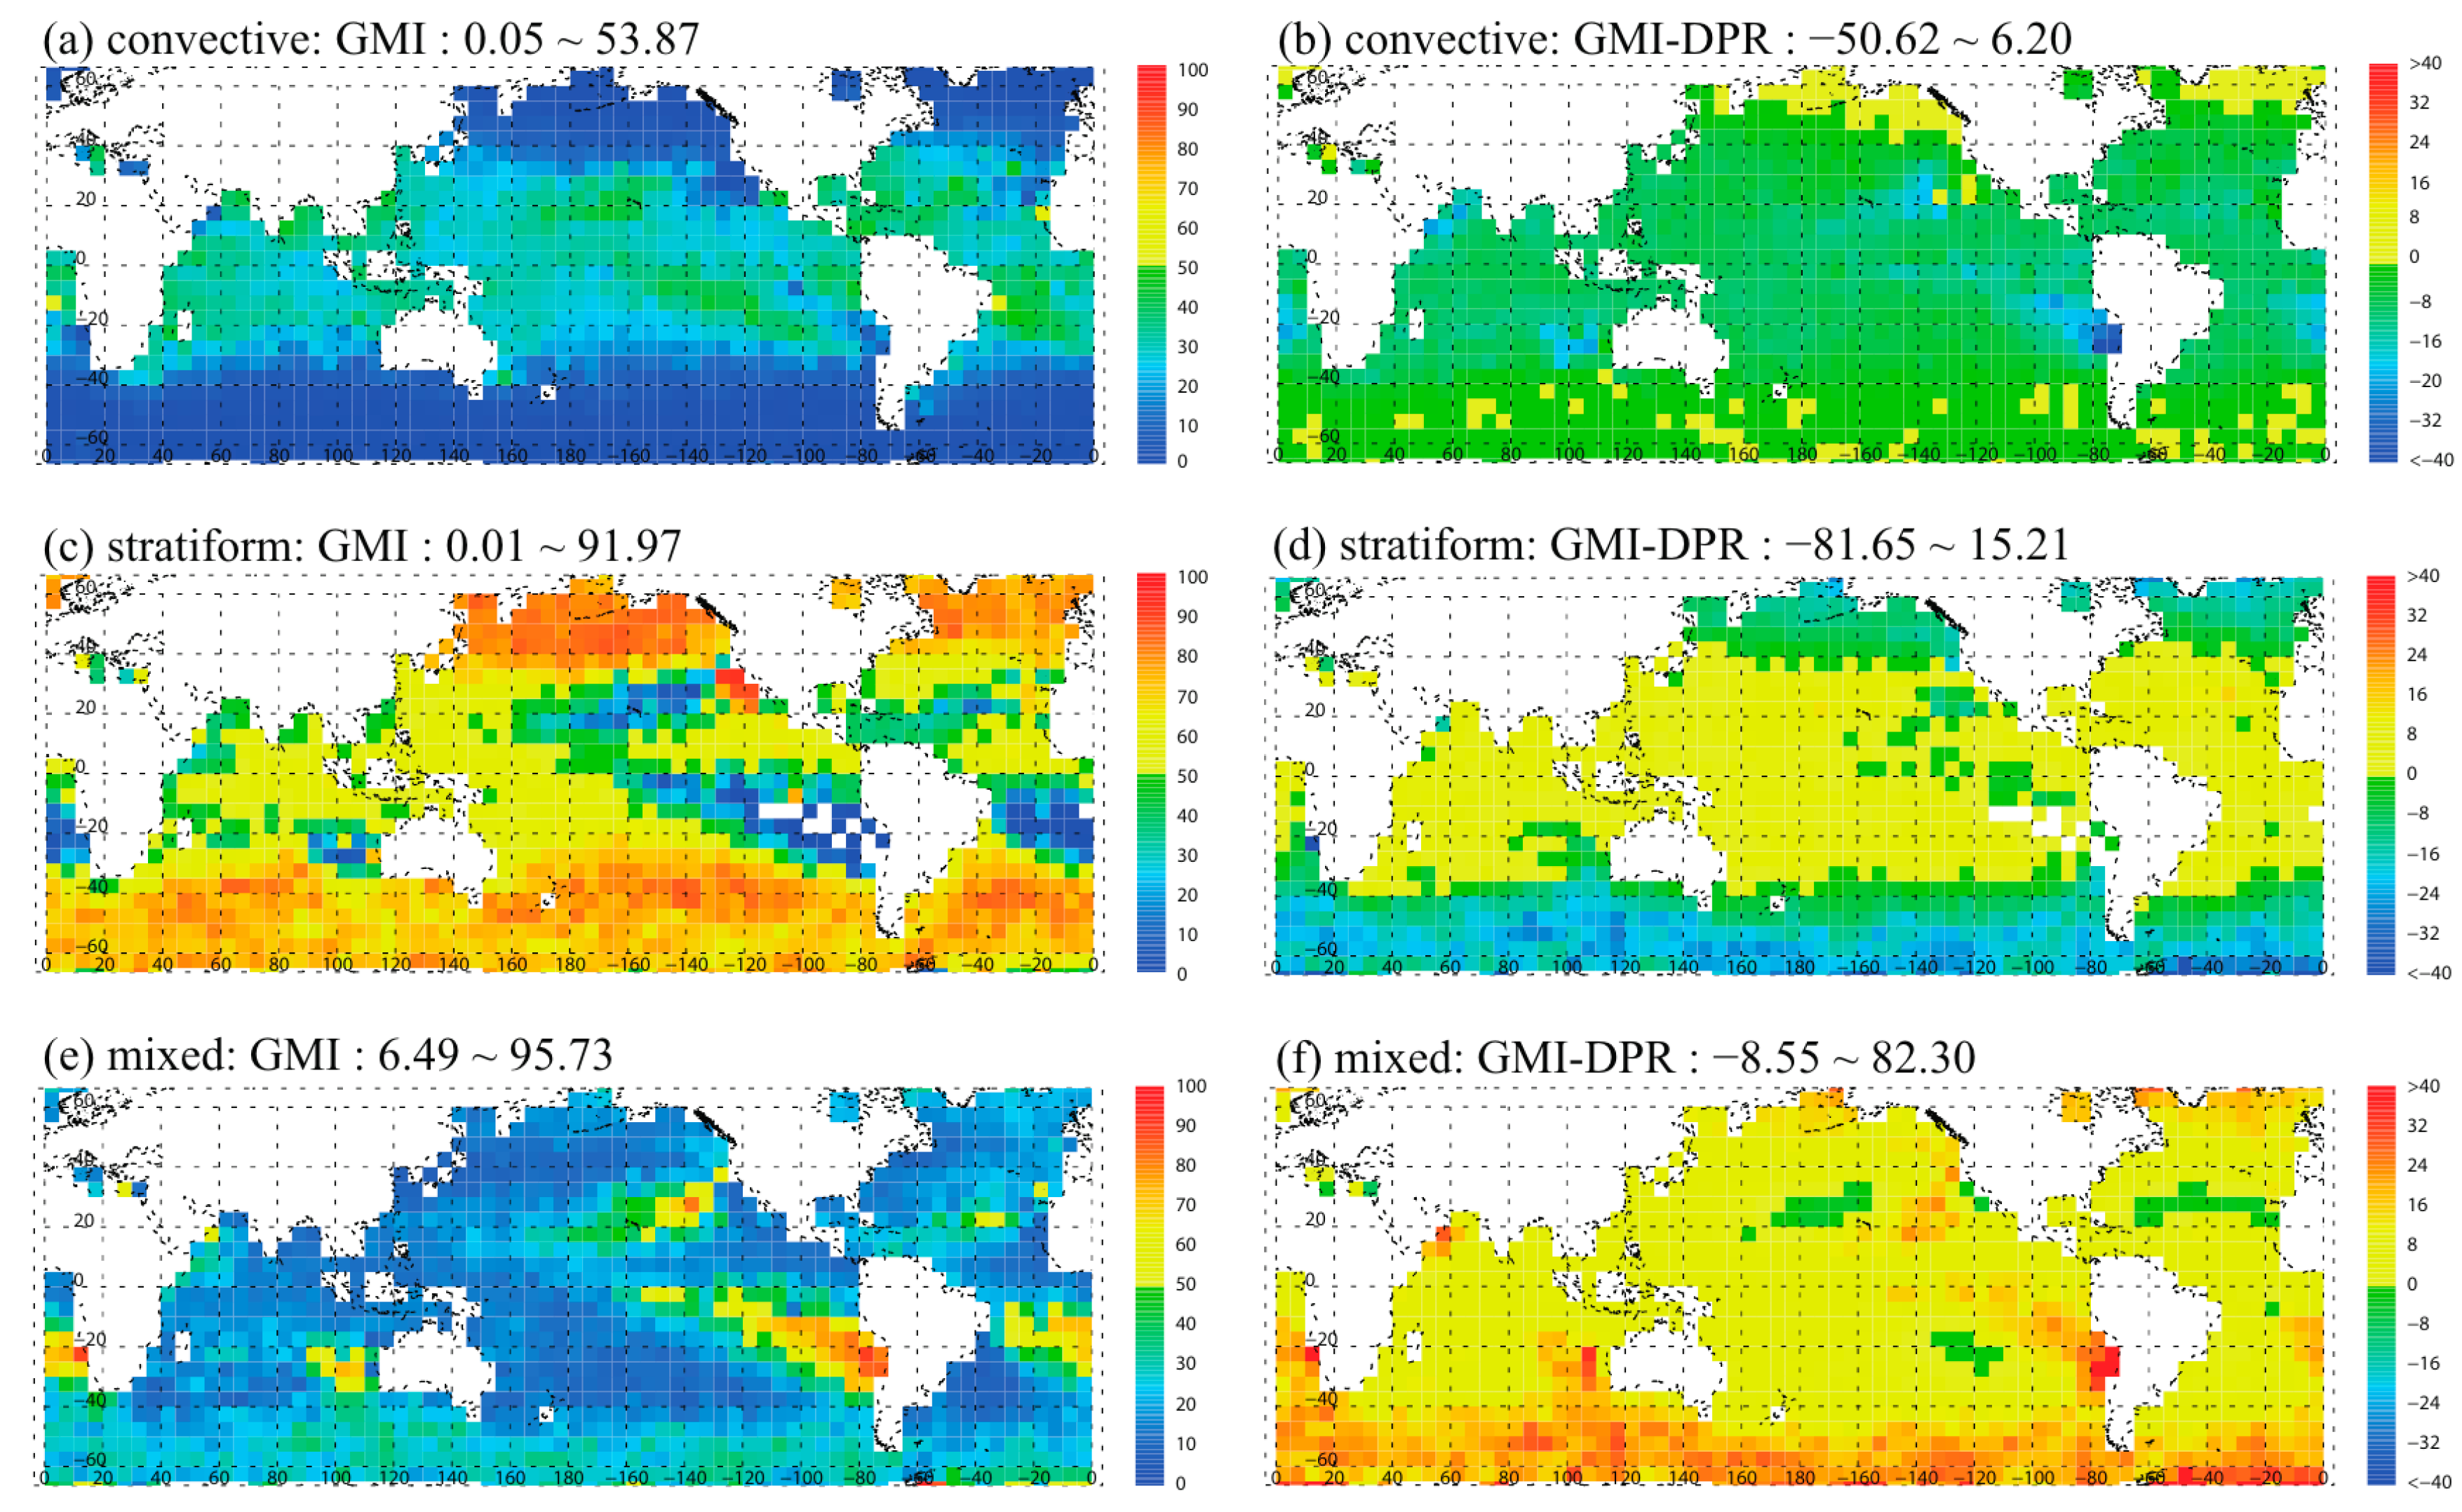
Figure 3 shows the relative contributions of precipitation types to annual accumulated precipitation for each measurement as shown in
Figure 2. While spatial distributions generally align with occurrence fraction patterns (
Figure 1), certain regions show distinct characteristics. In monsoon-influenced areas, along continental eastern seaboards, in the Gulf of Mexico, and in regions west of the Pacific STHP system, convective precipitation delivers approximately 40% of total precipitation despite less occurrence (typically ~20%) compared to other types (
Figure 3a). This significant contribution reflects the high intensity of convective events in most of these regions except for areas near STHP. These regions share favorable environmental conditions: abundant moisture and warm ocean surfaces, particularly in areas away from STHP centers (e.g., [
38]). The convective contribution progressively decreases poleward, accounting for less than 20% of total precipitation in most regions beyond 30° latitude in both hemispheres. The GMI-DPR differences show that the GMI generally underestimates convective contributions in tropical and subtropical regions (up to approximately 40°), while slight overestimation appears in limited areas of latitudes beyond 40° (
Figure 3b).
In most of tropical and subtropical regions (below 40° N), stratiform precipitation accounts for approximately 50–70% of rainfall. Meanwhile, lower stratiform contribution (20–30%) is found mainly in the periphery of subtropical high pressure systems of the NH and in both the center and periphery of subtropical high pressure systems of the SH (
Figure 3c). These findings are consistent with PR-based studies. Ref. [
30] found that while stratiform precipitation covers 73% of the rain-affected areas in the tropics, it contributes only 40% of the total precipitation volume according to TRMM PR data. The spatial patterns in both studies show similarities in the central and eastern Pacific (50–60% stratiform fraction) but differ significantly in oceanic regions near continents. This GMI-DPR analysis shows higher stratiform fractions (50–70%) over the Maritime Continent region, and oceanic areas near Africa and South America compared to Schumacher and Houze’s results (20–40%). This discrepancy likely stems from differences in instrumentation (DPR vs. TRMM PR) and spatial resolution (~15 km vs. ~5 km), affecting precipitation classification particularly in these regions with complex precipitation systems.
In mid-latitudes (beyond 40°), stratiform precipitation becomes increasingly dominant, comprising up to ~85% of total precipitation in the NH and ~80% in the SH. This pattern reflects the prevalence of synoptic-scale systems and diminished convective potential at higher latitudes. Pfahl et al.’s (2014) [
39] findings support this result, showing that warm conveyor belts (WCBs) within extratropical cyclones contribute substantially to precipitation in these regions, producing primarily stratiform rainfall. The GMI-DPR comparison shows that the GMI overestimates stratiform contributions below 40° while underestimating them in higher latitudes, with particularly larger negative differences in SH high latitudes (
Figure 3d). Mixed precipitation is dominant in small, localized regions primarily in the southwestern United States near California and along the Argentine coast (contributing up to 85% of total precipitation) while remaining minimal (below 10%) throughout most other global regions (
Figure 3e). The GMI-DPR differences show predominantly positive biases across most regions, indicating the GMI’s tendency to overestimate mixed precipitation contributions (
Figure 3f).
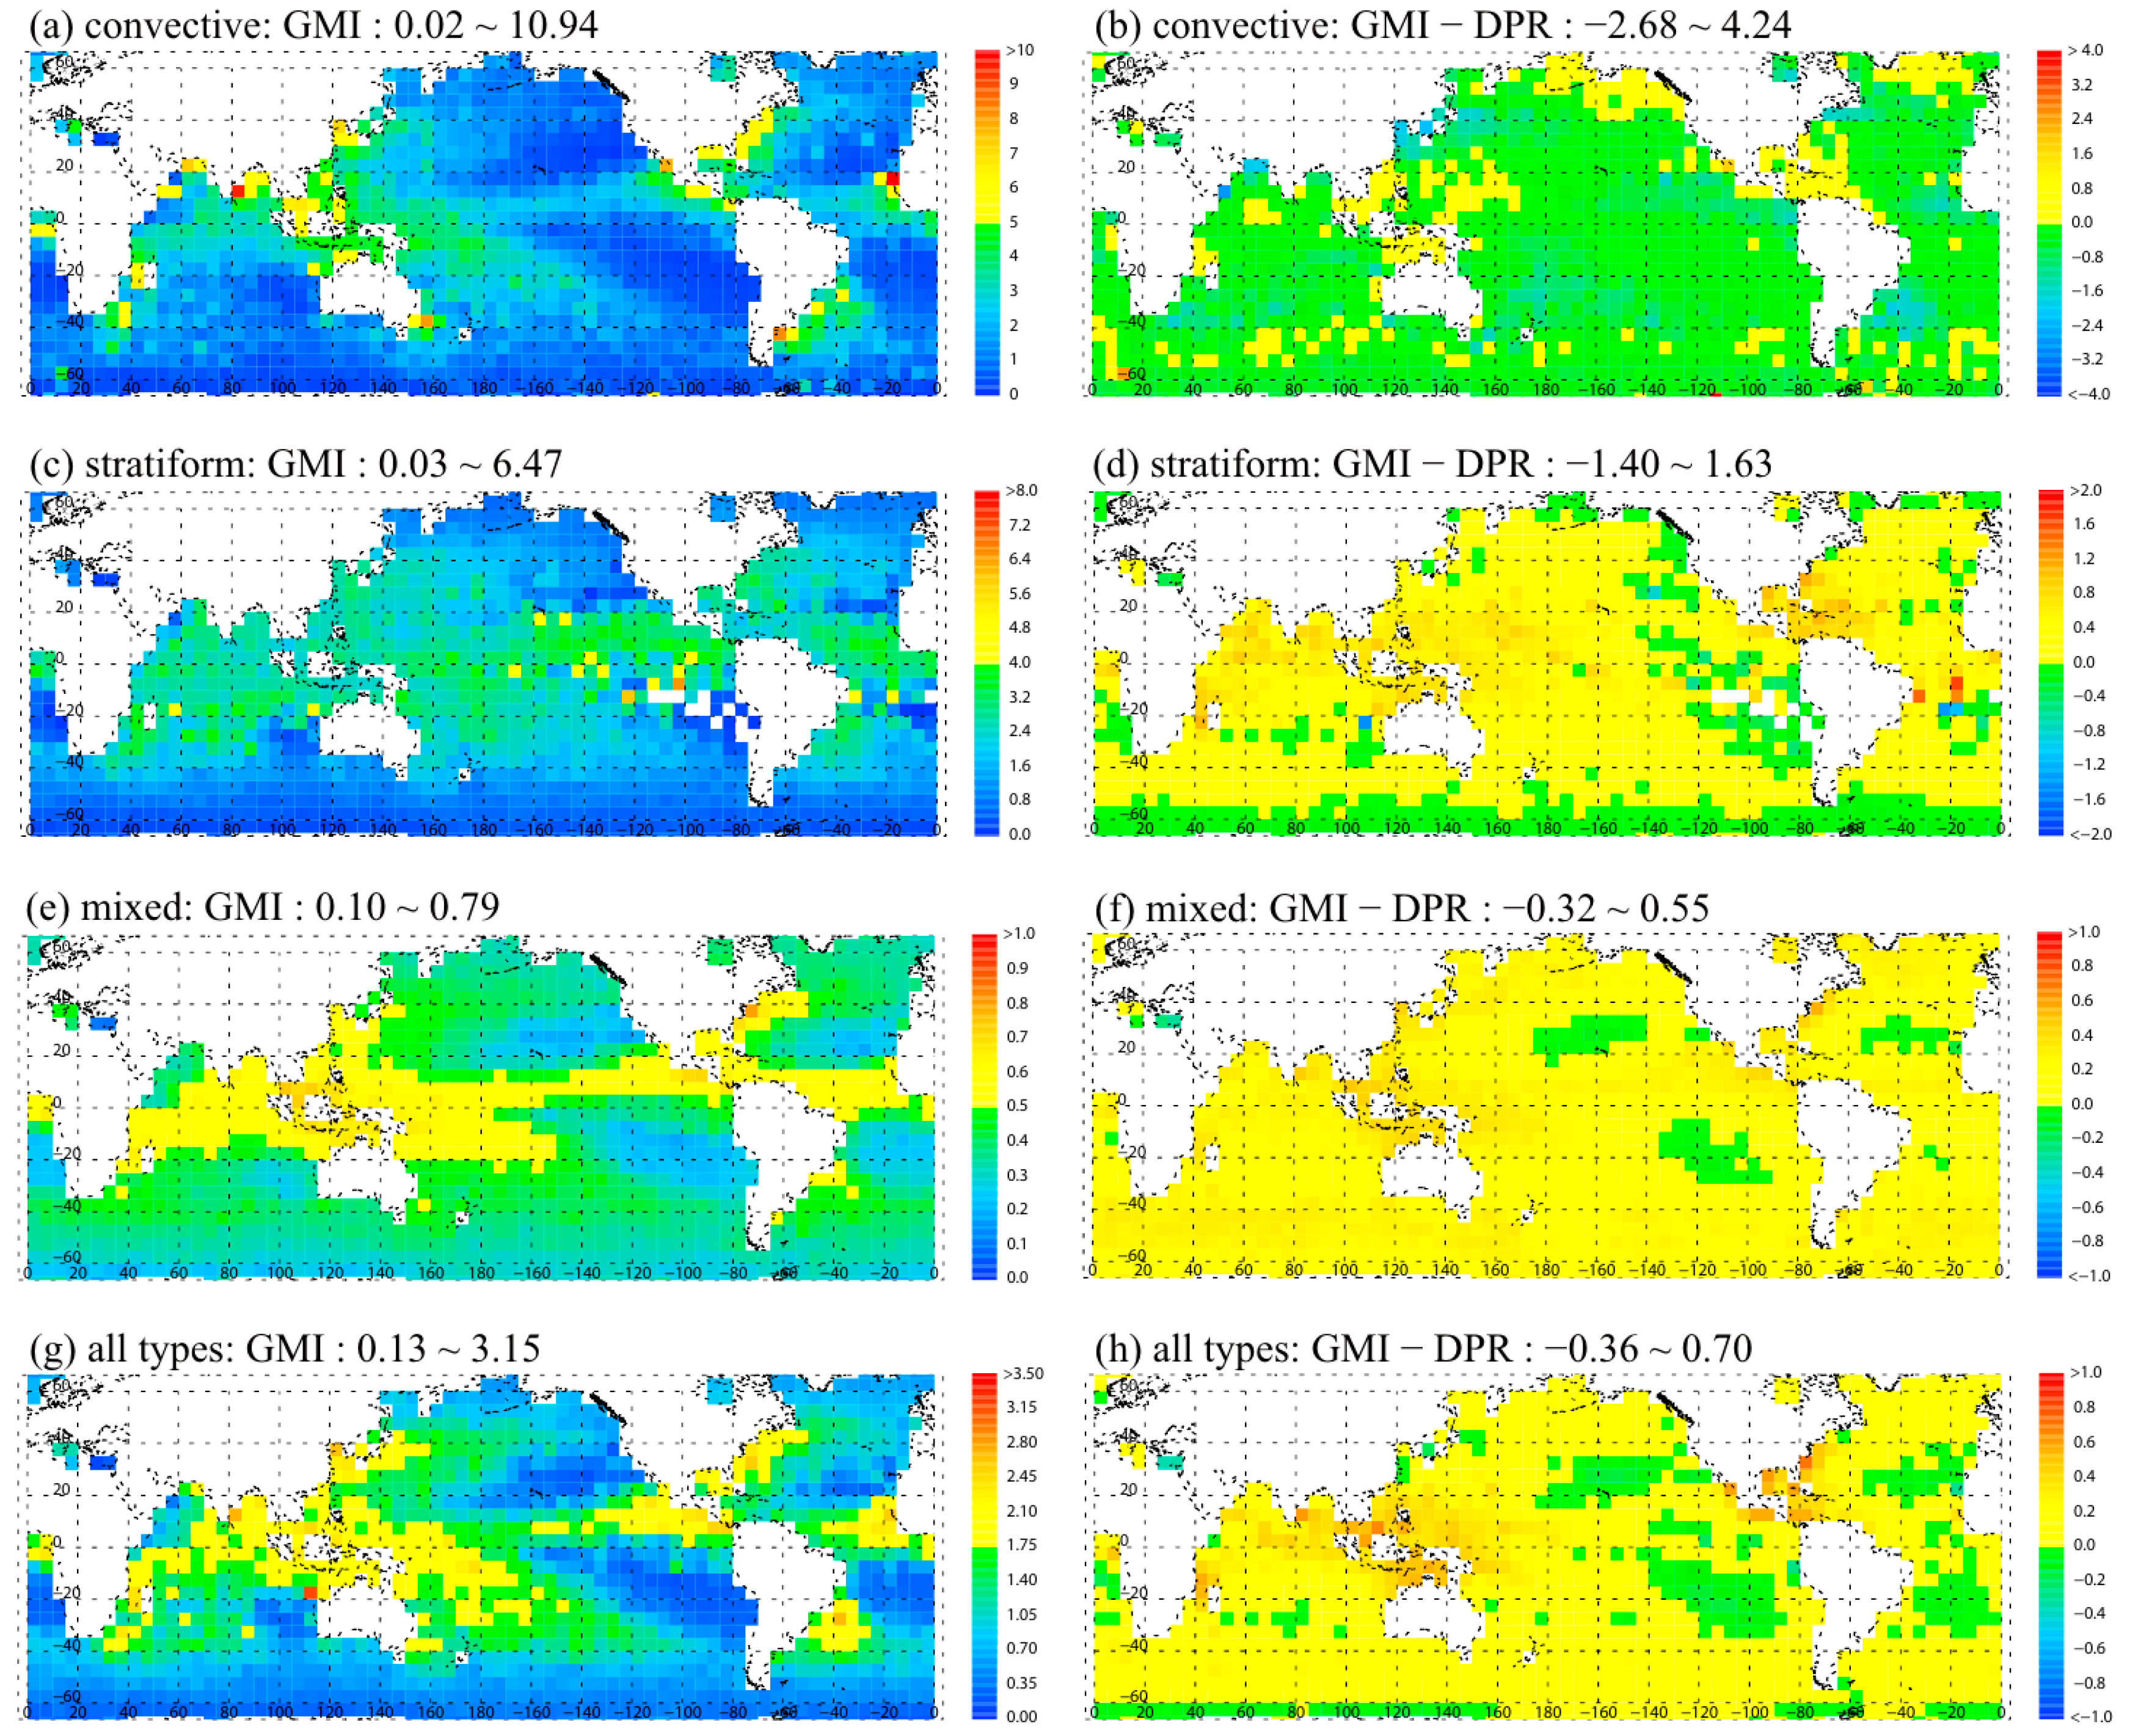
Mean precipitation intensities (
Figure 4) exhibit consistent spatial patterns of annual accumulated precipitation across precipitation types as shown in
Figure 2. For convective precipitation, both the GMI and DPR show high intensities (>4 mm/h) over Asian monsoon regions, the Gulf of Mexico, and storm tracks and east continental coasts in both hemispheres (
Figure 4a). The GMI-DPR difference reveals negative values (generally between −0.6 to −1.2 mm/h) throughout most oceanic regions globally, indicating the GMI systematically underestimates convective intensities (
Figure 4b). Stratiform precipitation patterns show similar spatial distributions between retrievals, but with the GMI displaying higher values across most regions in both hemispheres (
Figure 4c,d). Similar to stratiform precipitation, mixed precipitation also exhibits uniformly higher GMI values relative to DPR (
Figure 4e,f). Thus, the contrasting GMI-DPR differences between convective (negative) and stratiform (positive) precipitation intensity is likely to offset each other to some degree when all types are combined. When examining overall patterns, mean precipitation intensity for all global oceanic rain is in the range of 0.24 to 2.40 mm/h, with higher values (>2 mm/h) primarily observed in the western Pacific, tropical convergence zones, and mid-latitude storm tracks, while lower values are seen in subtropical regions and beyond 40° (
Figure 4g). The spatial pattern of GMI-DPR differences for combined precipitation types closely mirrors that of stratiform precipitation (
Figure 4h). This indicates that the positive differences from stratiform and mixed precipitation components outweigh the GMI’s underestimation of convective precipitation intensity, resulting in a net positive difference when all types are combined. While similar compensating effects between precipitation types were observed in earlier TRMM TMI and PR comparisons [
24], measurement differences for convective precipitation have significantly improved in current GMI-DPR observations. As for statistical significance of GMI-DPR differences, statistically significant differences (
p < 0.001) are observed across all grid cells even for convective precipitation (the least frequent type).
3.2. Latitudinal Variations
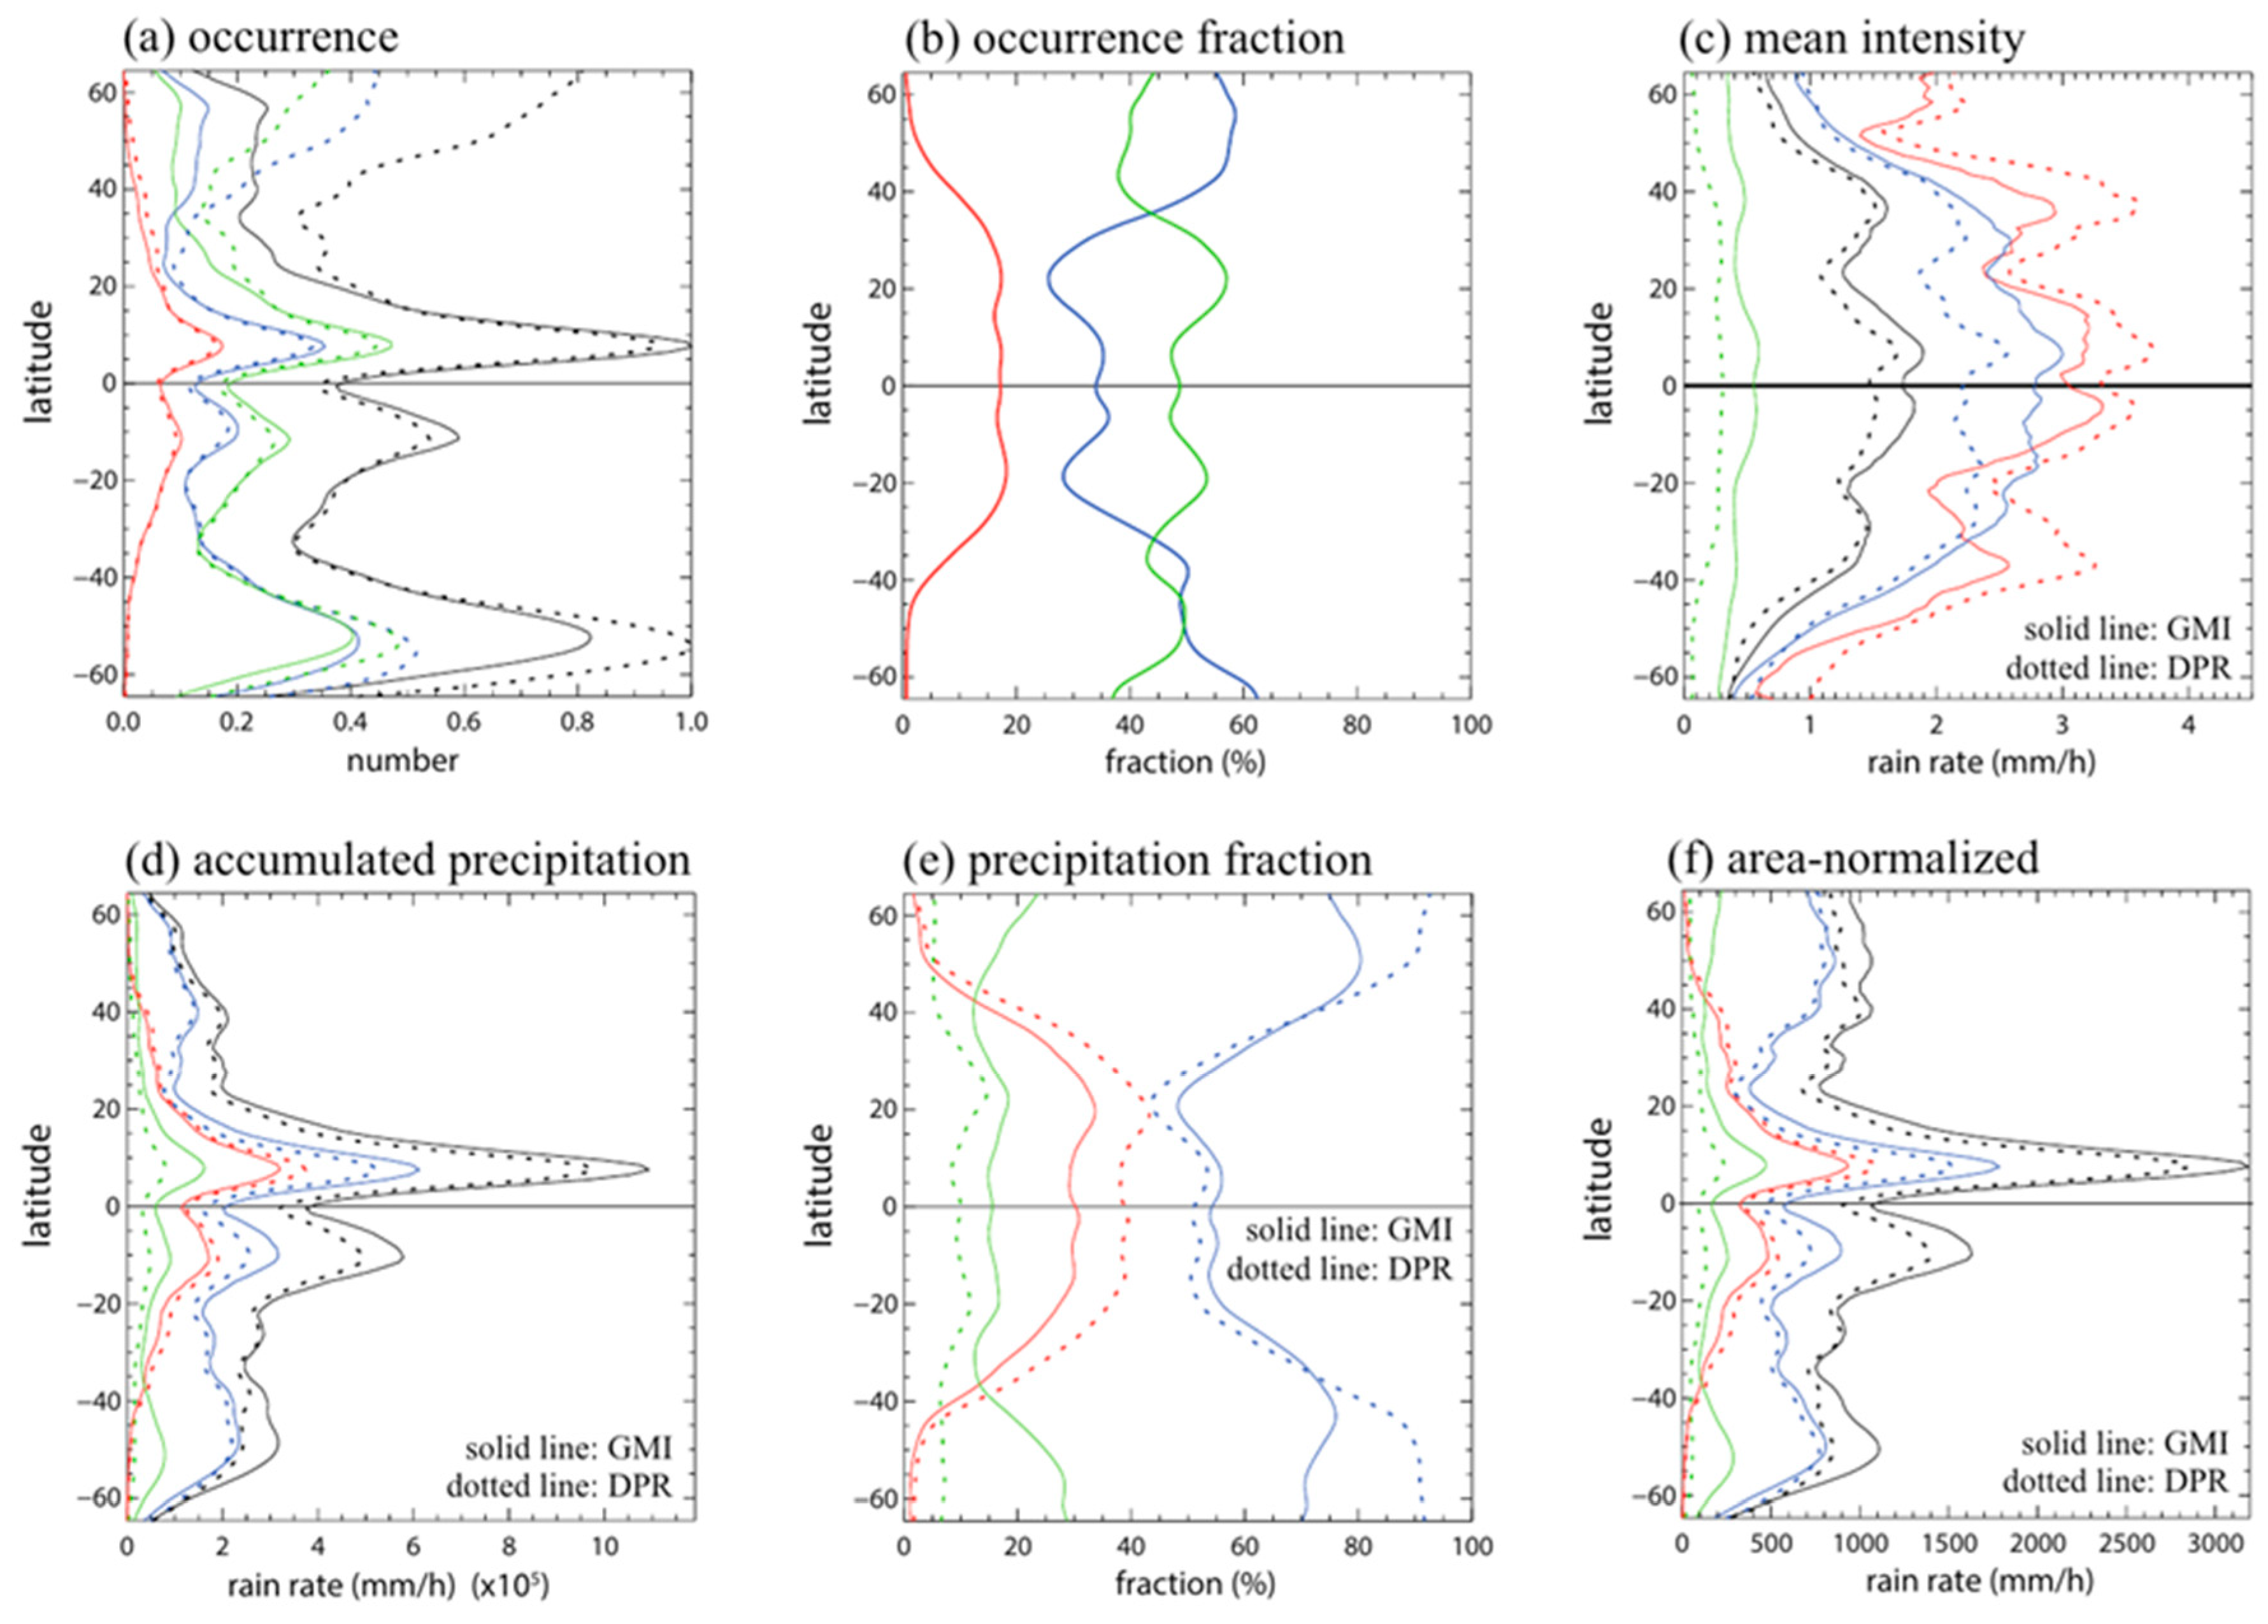
The relative number of oceanic precipitation occurrences for all precipitation types, adjusted for GPM sampling frequency and averaged over five summer seasons, is calculated at each latitude, showing a distinct peak at ~7.5° N with sharp gradients (solid lines in
Figure 5a). The prominent peak is partly attributed to the extensive oceanic surface area in this equatorial region. Meanwhile, this maximum also coincides with the ITCZ location, where converging trade winds and warm sea surface temperatures foster rain band development [
40]. Beyond this peak, the frequency of convective precipitation decreases gradually poleward. In particular, non-convective precipitation types (stratiform and mixed) show a pronounced increase beyond 40° S in the SH, though this pattern is absent in the NH due to differences in ocean coverage between the hemispheres.
When normalized by ocean area at each latitude (dotted lines in
Figure 5a), representing the number of occurrences per unit ocean area (100 km × 100 km), the tropical maximum at ~7.5° N remains distinct but appears less dominant compared to high-latitude values, while the frequency increases significantly poleward of 40° in both hemispheres for non-convective precipitation types. Notably, these high-latitude precipitation frequencies approach the magnitude of those observed at the ITCZ, revealing a secondary region of substantial precipitation driven by mid-latitude baroclinic systems and associated storm track activity [
1,
5].
The fractional contribution of each precipitation type to total precipitation occurrences (
Figure 5b) reveals distinct latitudinal patterns that complement the occurrence distributions as shown in
Figure 1. The convective type maintains ~20% up to ~30° latitude in both hemispheres before decreasing from mid-latitudes poleward. The stratiform type shows a local maximum near the ITCZ, slightly decreases up to ~20° latitude, then increases markedly to reach 50–60% from 40° poleward in both hemispheres. The mixed type fluctuates between 40% and 55% across the full latitudinal range. This distribution pattern highlights how precipitation mechanisms vary with latitude, with stratiform processes dominant at mid-latitudes. These results suggest a fundamental shift in precipitation processes, from tropical regions, where convective systems make a significant contribution alongside stratiform precipitation, to mid-latitude regions, where stratiform processes become increasingly dominant (e.g., [
29,
30]).
The mean summer precipitation intensity shows relatively symmetric patterns between hemispheres, with some asymmetry remaining only at higher latitudes for convective precipitation (
Figure 5c). Convective precipitation shows the highest intensities, with maximum values occurring in the tropics (~3.4 mm/h in GMI, ~3.8 mm/h in DPR) and a secondary peak at ~40° latitude in both hemispheres. GMI measurements for convective precipitation are consistently 10–15% lower than DPR values across most latitudes. This mid-latitude maximum appears to be strongly associated with storm track activity along the eastern margins of continents in both hemispheres, as shown in
Figure 4. These regions are characterized by enhanced baroclinic instability and frequent cyclone development. For stratiform precipitation, the GMI reports higher precipitation intensities than DPR, particularly in tropical regions (by approximately 15–25%). Interestingly, in the Southern Hemisphere around 30° S, GMI stratiform precipitation intensity actually exceeds that of convective precipitation. However, the difference between measurements becomes substantially smaller (typically 2–5%) at latitudes above 35°, indicating better measurement agreement away from the tropics. Mixed precipitation types generally remain below ~0.5 mm/h throughout all latitudes, showing the least variation across latitudinal bands.
The latitudinal distribution of total accumulated precipitation (
Figure 5d) shows characteristic patterns that differ from the occurrence distributions (
Figure 5a). Both GMI and DPR measurements reveal a tropical maximum near the ITCZ. For all precipitation types, the GMI consistently shows higher values than DPR across all latitudes, with the greatest differences appearing in tropical regions. Stratiform precipitation contributes the largest amount to total accumulated precipitation at each latitude, followed by convective and mixed types (
Figure 5e). This dominant role of stratiform precipitation persists across all latitudes, though its relative importance increases poleward of 40°, where both convective and mixed precipitation become highly limited. The tropical regions exhibit higher accumulated precipitation in the NH than in the SH across all precipitation types, while mid-latitude regions show greater accumulation in the SH than in the NH, particularly in areas with extensive ocean coverage. Notably, the difference in total accumulation between the NH and SH at mid-latitudes has diminished significantly compared to the occurrence frequency distribution (
Figure 5a), suggesting relatively lower rainfall intensity in the SH mid-latitudes, as confirmed by the mean precipitation intensity shown in
Figure 5c.
Figure 5e presents the fractional contribution of each precipitation type to the total accumulation. Despite convective precipitation’s lower occurrence frequency, it contributes approximately 40% of the totals in tropical regions. At mid-latitudes, stratiform precipitation dominates, accounting for 60–90% of the totals. A significant transition occurs in both hemispheres, though at different latitude bands—between 30–45° N in the NH and between 30–40° S in the SH. During this transition, the convective fraction sharply decreases to a few percent, while the stratiform fraction increases substantially. GMI measurements indicate stratiform precipitation reaches approximately 80% around 50° N and 75% around 45° S, while DPR measurements show stratiform fractions approaching 90% in both hemispheres. The poleward shift of this transition zone in the NH compared to the SH is particularly noteworthy as it may reflect differences in continental configuration and associated circulation patterns.
When normalized by ocean area (100 × 100 km
2) at each latitude (
Figure 5f), the accumulated precipitation distribution effectively shows the relative precipitation production efficiency across different regions during the summer months. The tropical maximum remains prominent, with rainfall efficiency in the ITCZ region approximately three times higher than typical mid-latitude values. Unlike the total accumulated rainfall shown in
Figure 5d, which shows gradual variations with latitude poleward of 30°, the normalized precipitation demonstrates a more distinct pattern: a pronounced maximum in the tropical region, followed by relatively uniform values extending to approximately 60° in both hemispheres. The normalized distribution also shows greater hemispheric symmetry compared to the non-normalized data in
Figure 5d. This uniform precipitation efficiency across extratropical latitudes is maintained through a clear passing of the baton from convective to stratiform precipitation with increasing latitude.
3.3. Statistics of Rain Intensity
While previous sections examined the spatial distributions and geographical characteristics of precipitation parameters, this section presents a quantitative statistical analysis of five years of collocated GMI and DPR observations across global oceans, revealing their measurement characteristics for different precipitation types (
Table 1). For convective precipitation, which accounts for 10.4% of occurrences but contributes 22.7% (GMI) to 29.6% (DPR) of total precipitation, the GMI systematically underestimates by 13.8% compared to DPR (2.77 mm/h vs. 3.18 mm/h). This underestimation appears in the global distribution maps as shown in
Figure 4, with negative GMI-DPR differences concentrated in the eastern Pacific ITCZ and along the eastern coasts of mid-latitude continents in both hemispheres. The significantly higher standard deviations for convective precipitation (5.42 mm/h for the GMI versus 8.42 mm/h for DPR) and larger RMSE (5.65 mm/h) demonstrate that overall DPR has enhanced capability in measuring extreme precipitation events compared to stratiform and mixed precipitation.
Conversely, for stratiform precipitation, which represents 42.0% of occurrences and contributes 60.8% (GMI) to 61.4% (DPR) of total precipitation, the GMI shows overestimation (1.84 mm/h) compared to DPR (1.63 mm/h), with a difference of 12.1%. The standard deviations (2.74 mm/h for the GMI and 3.32 mm/h for DPR) and lower RMSE (2.24 mm/h) reflect the moderate characteristics compared to convective precipitation type. This overestimation pattern is clearly visible in the spatial distribution of GMI-DPR differences for stratiform precipitation as shown in
Figure 4d, with positive values (yellow to red colors) spread widely across tropical, subtropical, and most mid-latitude areas. This overestimation can be attributed to fundamental detection characteristics of both instruments. Bringi et al. (2021) [
41] demonstrated that in stratiform rain, where smaller drops predominate, the ratio of specific attenuation (k) to reflectivity (Z) increases. Since GMI (passive microwave) measurements are more sensitive to attenuation processes, while DPR (active radar) measures reflectivity, this physical relationship explains why the GMI is likely to retrieve higher rainfall rates than DPR in stratiform precipitation environments. This pattern aligns with observations by Turk et al. (2021) [
42], who noted that the GMI and DPR offer complementary capabilities in precipitation detection, with the GMI potentially providing enhanced sensitivity to light precipitation that predominates in stratiform systems. According to Schumacher and Houze (2003) [
30], who analyzed TRMM PR data (1998–2000) focused on tropical regions (20° N–20° S), stratiform precipitation accounts for 73% of rain-covered areas and 40% of total rainfall, with maximum fractions of ~60% in the eastern/central Pacific ITCZ. This current study, using GMI and DPR measurements with an additional mixed classification category and different spatial resolution, shows comparable stratiform rainfall contribution (~60%) in ITCZ regions while showing lower fractions in subtropical high-pressure regions. When considering the additional contribution from the mixed precipitation type, the combined fraction becomes similar to or even higher than the maximum stratiform fractions (~60%) reported by Schumacher and Houze (2003) [
30]. Despite methodological differences, both studies confirm that tropical oceanic environments also efficiently produce stratiform precipitation through warm, moist boundary layers and near-moist adiabatic stratification.
Mixed precipitation types, while occurring most frequently (47.6%), show large differences in their contribution to total precipitation between the two instruments: 16.5% for the GMI and 9.0% for DPR. The large difference and the low correlation between GMI and DPR measurements (0.41) likely reflects uncertainties in detecting very light rain.
For all precipitation types combined, the GMI measures higher precipitation intensity than DPR (1.27 mm/h versus 1.12 mm/h, a difference of 12.6% relative to their mean value). The overall correlation coefficient of 0.76 represents the relationship between GMI and DPR measurements across precipitation types, indicating good general agreement. The mean absolute difference of 0.72 mm/h, however, is relatively large compared to the mean precipitation rates, suggesting that while the two measurements capture similar precipitation patterns, they often differ significantly in magnitude at specific locations. This systematic difference (12.6%) between the GMI and DPR is comparable with regional uncertainties found by Adler et al. (2012) [
33], who analyzed differences between various satellite products across all seasons and surface types (land and ocean). Their comprehensive assessment underscores the importance of considering measurement uncertainty when interpreting precipitation patterns, particularly in higher-latitude oceanic regions.


