Abstract
Underground longwall mining conducted in the vicinity of the barrier pillars in the KWK ROW Ruch Marcel mine has led to volume changes in the rock mass. As the longwalls progressed, a gradual increase in stress occurred in the goaf overburden, as a result of which this part of the rock mass increased in density in relation to the surrounding strata. Seismic events occurring during mining as a result of elastic energy accumulation led to the relaxation of the medium and local decreases in its bulk density. The microgravimetric method is sensitive to variations in this physical parameter of rock. The most transparent effects of the differences in rock mass density can be observed by performing periodic local gravity field surveys and analysing their spatial and temporal variability. This paper analyses the relationship between ground deformations and the spatial and temporal gravity field distribution changes observed on the surface in the context of the safety of barrier pillars F1 and F2 in Marklowice (the GSB-GFO testing ground of project EPOS-PL+). Relative gravimetric surveys, referenced to the determined absolute values of g, were performed in 7 series over the period of 2021–2023. The collected data made it possible to chart differential maps of gravity field changes and anomalies with Bouguer reduction. The differential anomaly distributions between successive survey series and the reference series were analysed. This served as the basis for assessing the safety of the barrier pillars maintained by the mine and the possibility of ground deformation occurrence on the surface.
1. Introduction
The underground mining of extractive resources leads to changes in the initial state of stress in the locations of the conducted extraction as well as in their vicinity and the overburden. Leftover pillars transfer the pressure exerted on them to the overlying parts of the rock mass and also provoke an excess pressure increase in the area [1]. The changes in the rock mass result in disruptions to the bulk density distribution and in the formation of rock material densification and thinning zones. A mine pillar is a very sensitive fragment of the rock mass that determines the safety of a mine’s underground technical infrastructure as well as work safety. The presence of a heterogeneous medium in the vicinity of maintained hard coal mine barrier pillars leads to the appearance of geodynamic hazards to the pillar safety as well as surface hazards related to the generation of continuous and discontinuous ground deformations [2,3,4,5,6].
The parts of the rock mass subjected to mining activity, as well as their vicinity and overburden at risk of geodynamic phenomenon occurrence, generate their own gravity field. The temporal variability of the gravity field parameters depends on the hazard level [7], which typically varies over time and space. Because of this variability, the method involving the temporal variations of the gravity anomaly g and the anomaly with Bouguer reduction Δg finds successful application in the studies and prediction of dynamic phenomenon development in a rock mass subjected to mining activity [7,8]. The method consists in measuring the gravity values in measurement grid points distributed on the surface above the conducted extraction, e.g., adjacent to barrier pillars, in certain time intervals. Afterwards the differential anomalies are analysed between the successive measurement series and the reference series, typically the first one, gi+1–g1. The zones of densification, i.e., positive differential anomalies, should be concentrated in the mined-out part of the rock mass, where elastic energy is accumulated after extraction is concluded. Shifts of the thinning zones generated by the progressing dilatation process in the rock mass, or zones of no density variations, should occur in the undamaged medium or in locations where the prior accumulated stress is released by the occurrence of seismic tremors.
The goal of this paper is to analyse the relationship between mining activity conducted in several coal deposits adjacent to hard coal mine barrier pillars and the changes in the gravity field distribution observed on the surface in the context of determining the safety of the pillars and the hazard level on the surface. This work continues the analyses of differential gravity field anomalies obtained as part of periodic local gravity field surveys in temporal series conducted in the Upper Silesian Coal Basin [9,10], including as obtained by the author in the Rybnik Coal Area [11] and the Dąbrowa Basin [12]. As presented in the aforementioned publications, the measurement of periodic changes in g and Δg provides good and verifiable results in the analysis of stress distribution disorders of different origins. Gradient variation zones and anomalies enable the identification of areas that exhibit growing or decreasing geologic medium bulk density, which makes it possible to designate hazard zones in the rock mass and on the surface. Such variations occur, e.g., in the areas of underground mines that conduct extraction. The novelty of this work lies in the analysis of the differential maps of the gravity field in relation to the safety of the mine barrier pillars (stress distribution within the rock mass, ground deformations), which has not been the subject of research thus far.
The test results presented herein were obtained during surveys performed in the years 2021–2023 at the observation grounds of the research and development project “EPOS-PL+—European Plate Observing System” [13]. The project is a part of the largest European programme for research infrastructure development in earth science titled EPOS (European Plate Observing System), which facilitates the understanding of mechanisms resulting in earthquakes [14] or volcano eruptions [15] as well as geohazards of smaller scale, e.g., related to deposit extraction [11,12,16,17,18,19,20].
The EPOS-PL+ infrastructure includes a new testing ground named the Geophysical Safety System for Mine Barrier Pillars (Geofizyczny System Bezpieczeństwa dla Górniczych Filarów Ochronnych, GSB-GFO) located in the area of the KWK ROW Ruch Marcel mine in Marklowice, in the southern part of the USCB (Figure 1). This area was of particular interest to the industrial partner in the project—PGG S.A.—due to the expected major influence of the conducted mining on the environment, including the predicted high number of strong seismic tremors and significant ground subsidence on the surface in inhabited areas.
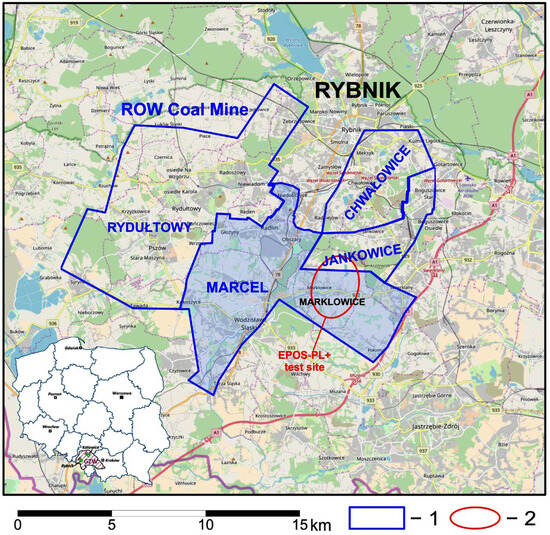
Figure 1.
Location of the observation grounds for gravimetric monitoring over the barrier pillars F1 and F2 displayed on a topographic map with the indication of the active mining areas of KWK ROW (1)—orientation, (2)—study area.
As part of Task 8, periodic gravimetric surveys of gravity acceleration in the area of two barrier pillars, F1 and F2, were performed at the EPOS-PL+ testing grounds as an element of GSB-GFO. The pillars are located in the mining area of the Marcel mining plant. The relative measurements were referenced to the absolute gravity values for a given survey period. The purpose of analysing the databases obtained during the surveys was to identify the potential precursors of seismic hazards (stress accumulation) and ground deformations. Databases concerning the differential gravimetric anomaly variations were linked with ground deformation observation databases. A repository from the GSB-GFO testing grounds is currently being established as an episode on the EPOS website.
The mining area of the KWK ROW Ruch Marcel mine extends over a surface area of 30.8 km2 and is located within the administrative borders of the following cities and municipalities: Radlin, Marklowice, Rybnik, Wodzisław Śląski, Świerklany, and Mszana. The mine conducts its activity as part of the Radlin I and Radlin II Mining Areas. The GSB-GFO testing ground is located in the Marklowice municipality, Wodzisław district.
From the morphological perspective, the survey area is situated within the Rybnik Plateau. A characteristic local landscape feature is the diverse vertical relief resulting from the erosive cut of the poorly resistant loess formation cover by water flows. The testing ground area is situated at heights of 252 to 270 m ASL in the northern part (grid F1) and 268 to 282 m ASL in the southern part (grid F2).
From a structural perspective, the Marcel mine deposit is within two basins: the Jejkowice basin, constituting the core part of the mine, and the Chwałowice basin, where the Marklowice-orientated part of the mine is located. The border of the two basins is a local tectonic dislocation in the form of the Michałkowice overthrust with an amplitude of about 1100 m [21]. Figure 2 presents the area encompassed by the activity of the Marcel mine.
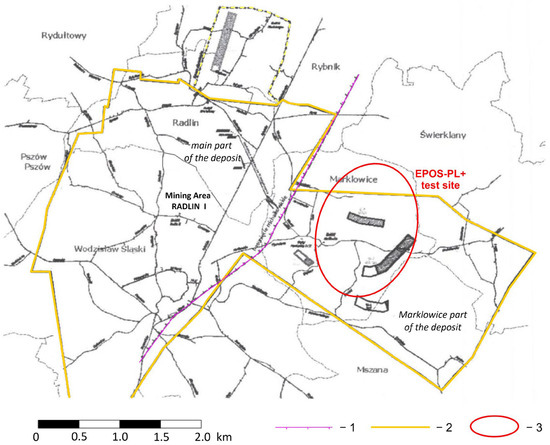
Figure 2.
Area encompassed by the activity of the Marcel mining plant, 1—michałkowickie overtrust, 2—Mining Area Radlin I, (3)—study area (Szymiczek et al. 2008) [21].
2. Geology and Mining Conditions
2.1. Geology
The geologic structure in the area of the KWK Marcel testing ground consists of Carboniferous, Tertiary, and Quaternary sediments (Figure 3a).
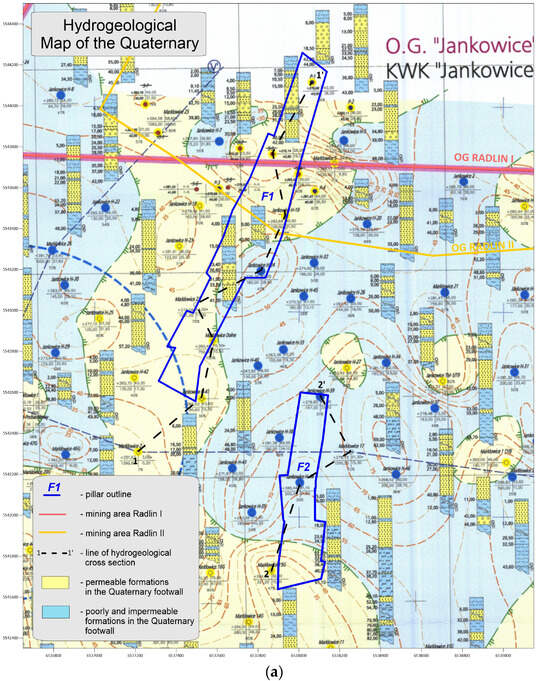
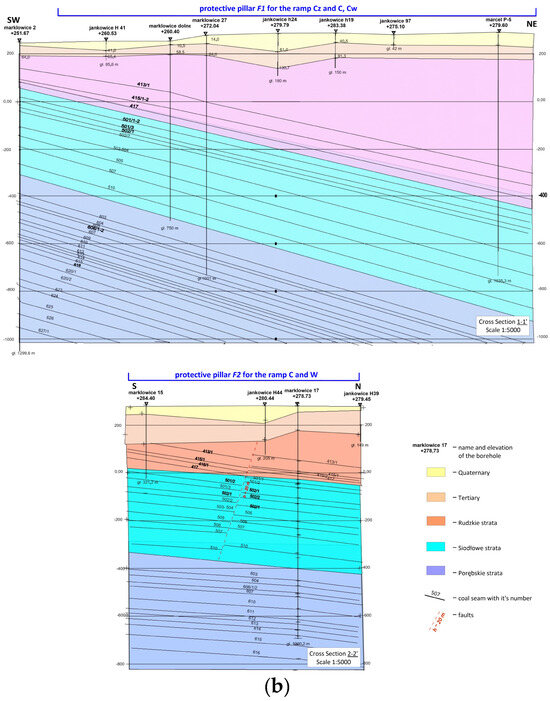
Figure 3.
Geology: (a) hydrogeological map of the Quaternary in the area of the GSB-GFO testing ground, (b) geological cross sections through the barrier pillars.
The Carboniferous is represented by Ruda and Poruba strata. The Carboniferous rock roof is at a depth of about 60–70 m. In the Marklowice-orientated section of the mine, close to the barrier pillars, it is represented by the lower part of Ruda strata in the form of siltstones with coal seams of group 400. A series of anticline strata is deposited deeper. The presence of anticline strata, with a thickness of about 280 m, was detected by boreholes in the southern part of the area in question. They constitute a network of medium- and coarse-grained sandstones, sometimes conglomerates. The series also contains less numerous siltstones and mudstones with coal seams of group 500. As per the determined mining boundaries, apart from Ruch Marcel, the deposits of these strata are extracted by the Jankowice mine.
The Tertiary is represented by a Miocene silt network in the form of arenaceous shale and shaly marlstone of green-grey colour, locally shifting into clay slate. The relatively lithologically uniform series of Miocene silt constitutes the direct overburden of the Carboniferous formations. The interbedding silt and sand form separate thicker strata or are present as thin lamellae and laminae. In the Miocene silt floor, sand and gravel formations of quicksand character are found in pits in the Carboniferous bedrock. The Miocene thickness increases from north to south and ranges from several dozen to about 100 m.
The Quaternary formations are related primarily to the Pleistocene fluvioglacial accumulation and secondarily to the contemporary activity of groundwater (Holocene sediments), and their total thickness ranges within 30–40 m (Figure 3b). The Quaternary sediments cover nearly the entire area and are characterised by very varied thickness and diverse lithological properties. The lithologically diverse Pleistocene sediments are present in the form of clay, dust, sand of various gradation, and fluvioglacial gravel. The sand is dominated by fine- and medium-grained sand, while the clay is typically strongly sandy, often with pebble admixtures. Genetically, these constitute aeolian formations that nevertheless, due to the sedimentation of the material in water, exhibit features characteristic of fluvioglacial lacustrine formations, such as parallel stratification, and no macroporosity features characteristic of loesses. Organic substance is present sometimes in the form of admixtures, particularly in the near-surface parts of the dust and clay series. Dusty sand laminae are also common. The dust and clay series is separated by a sand and gravel stratum, which is a typical fluvioglacial sediment. The lone dust lenticels exhibit similar genesis. The Holocene sediments are related to watercourse valleys and are typically present in the form of fine- and medium-grained sand with silt and dust interbedding. Peat and warp are found in the area of the Marklowice stream, organically related to its valley and separated by clay and sand. The maximum determined thickness of these sediments is 4.0 m. Locally the fluvial sediments were removed and replaced by a layer of mineral anthropogenic fill.
2.2. Mining
The origins of the mine date back to 1858. It was called “Emma” until 1945 and “Ema” from 1945 to 1949. On 27 April 1949, the mine was renamed to “Marcel”. Since 2016, the mine has been part of Polska Grupa Górnicza sp. z o.o. (since 2017—PGG S.A.).
Ruch Marcel is a two-panel mine. Coal seams of group 700 are mined in the core part, while seams of group 500 are mined in the Marklowice-orientated part, in the area of the testing ground (Figure 4). In the core part, Ruch Marcel produces coal with very good quality parameters. In the Marklowice-orientated part, these are primarily power coals. Coking coal is also present here, though it is deposited at a stage below the level of 600 m, primarily in coal seam 507. Ruch Marcel has seven shafts: two ventilation shafts, three work shafts, including Marklowice I (work shaft) and Marklowice II (ventilation-outtake shaft), one extraction shaft, and one backfilling shaft, as well as a transport slope. The natural hazards present in the Marcel mine include first- and second-degree rock burst hazards, third-degree methane hazards, first- and second-degree water hazards, class “A” and “B” coal dust explosion hazards, and first-degree climatic hazards (core part). During the EPOS-PL+ project, the KWK ROW Ruch Marcel mine conducted extraction based on a mining plan for the years 2022–2024.
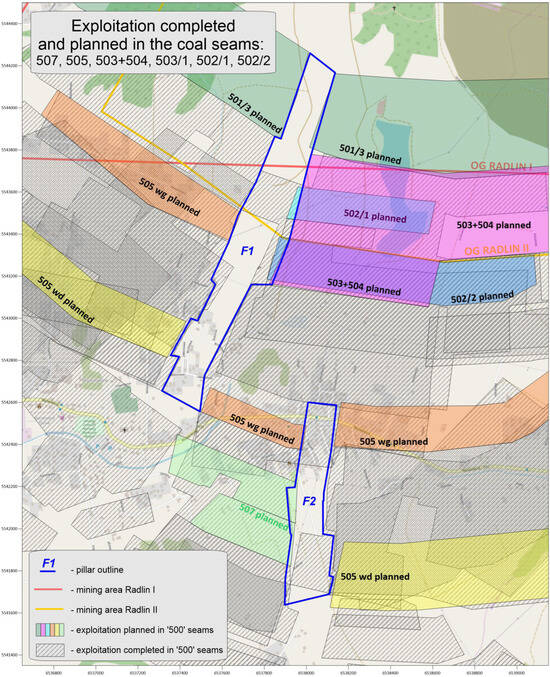
Figure 4.
Conducted and planned extraction in the area of the F1 and F2 barrier pillars at the GSB-GFO testing ground.
The mine continues to conduct coal extraction from deposits situated beneath the localities of Radlin, Marklowice, Wodzisław Śląski, Rybnik-Niedobczyce, Mszana, and Świerklany. The largest coal deposits are in the area of the Marklowice municipality. The primary concentration of current extraction, as well as the future of the mine, is associated with the Marklowice-orientated part, where deposits are mined at depths from 290 to 700 m below ground level.
In the area of the designated GSB-GFO barrier pillar of the KWK ROW Ruch Marcel and Jankowice mines, mining was conducted with the following longwalls during project EPOS-PL+: C-1 in seam 505 wd, C-2a in seam 505 wd, C-3 in seam 507, C-4 in seams 503–504 and 503, C-4 in seam 507, C-5 in seams 503 and 504, W-7 in seam 505 wg, W-8 in seam 505 wg, Z-2 in seam 502/1, and Z-3b in seam 501/3 (Figure 4).
3. Materials and Methods
3.1. Study Area
The study area comprised two linked grids of points above the barrier pillars for the inclines between blocks Cz and C, Cw, and C and W of the Marcel mine. The first grid, designated F101–F133, was plotted above the north pillar—F1. This grid is a square zone with dimensions of about 2000 × 400 m. The second grid was established above the south pillar—F2. The points were analogically designated from F201 to F221. The grid range was nearly half as extensive relative to pillar F1, measuring about 1050 × 430 m. In both the grids, the points were distributed at distances of about 200 m from each other. The points were determined and situated in the field in such a way that their range would overlap with the pillars and extend away from their projection on the surface by several dozen to 100 m in each direction. The distribution of the points over the pillars is displayed in Figure 5.
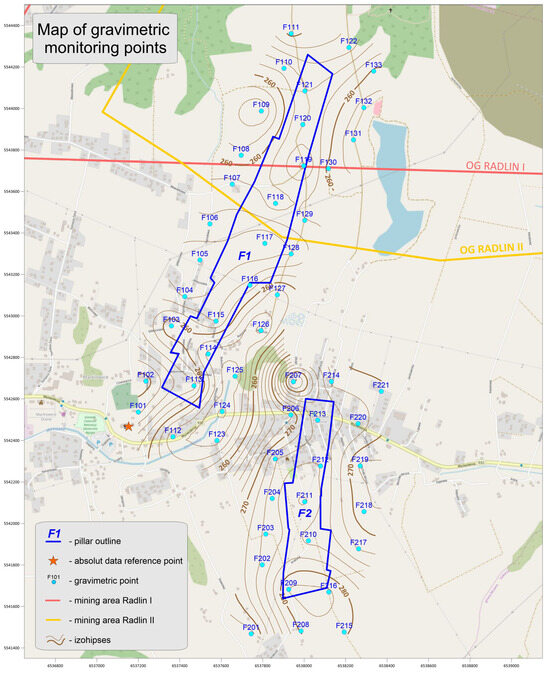
Figure 5.
Locations of gravimetric measuring points in the GSB-GFO testing ground with a projection of the barrier pillars on the surface and a hypsometric map. The absolute value reference station is marked with the orange star.
Figure 6 presents example ways in which points F120, F130, and F209 were established in the testing ground area.

Figure 6.
Example ways of establishing points F120, F130, and F209 in the GSB-GFO testing ground in Marklowice.
3.2. Survey Series
A total of seven survey series of relative gravity g were carried out at the testing ground. Survey series I-VI were performed in approximate intervals of 3–4 months—in the spring, summer and autumn of the years 2021–2022. The final series was carried out a year after the last autumn series, i.e., in November 2023. The specific survey performance time with reference to the absolute value employed in the calculations and the passage of time from the first survey series is compiled in Table 1.

Table 1.
Data from measurement series at the EPOS-PL+ testing ground.
3.3. Gravimetric Survey Methodology
The periodic gravimetric surveys were conducted by ranging, where the daily survey cycles were referenced to a local base point located about 86 m southwest from the first point of the testing ground grid over pillar F1 (F101). The point (designated no. 1000) is situated on a massive stone step of the east entrance to the sacristy of the Church of St Stanislaus the Martyr on Wyzwolenia 134 street in Marklowice. It is marked with an orange five-pointed star in Figure 5. As part of the EPOS-PL+ project, the Geodesy and Geodynamics team of the Institute of Geodesy and Cartography in Warsaw determined the current—reference absolute value of gravity (gabs) for this point by means of a Micro-g Solutions Inc. A10 absolute gravimeter, serial number 020.
Observations on the constituent points in the testing ground (F101–F133, F201–F221) were performed using the Canadian Scintrex CG-6 Autograv gravimeter, serial number 18040086. The CG-6 gravimeter is characterised by a very low but linear residual drift (<0.020 mGal/day) that was eliminated during the data processing. The device enables measurements with a reading resolution of 0.0001 mGal and a result repeatability of ±0.005 mGal.
A detailed description of the gravimetric observation methodology, with a description of the performed raw data reductions and calculations required to obtain the g value and the anomaly with complete Bouguer reduction Dg, together with the error analysis methodology, is provided by the author in [11,22,23].
All the gravimetric monitoring surveys were always preceded by geodetic surveys. Surveys were carried out for the X and Y coordinates of the points within the Polish National Geodetic System PL-2000/6 (meridian 18) as well as the B (ϕ) and L (λ) coordinates within the WGS84 system. The orthometric height H of the points in m ASL was determined within the Amsterdam Ordnance Datum. The grid was measured as point pairs determined by GNSS, per the static method using Trimble R2 receivers [24,25,26,27,28,29,30]. The GNSS survey was performed in independent measurement sessions spanning half an hour. In locations unavailable to the satellite survey, the point height was determined by traditional methods.
The catalogues of the gravimetric monitoring survey series contain point numbers, current XY coordinates [m], current point heights [m], g values [mGal], anomalies with Bouguer reduction Dg [mGal], and the mean error of a single survey defined as the quotient of the standard deviation from a sample series and the square root of the sample number N in a series: SErr = SDev/√N across individual survey series, as compiled in Table 2. Data from Series II from the summer of 2021 is burdened with the lowest error (the most stable weather conditions), while the greatest measurement error, SErr, was noted for Series IV in the winter of 2022 (unstable weather and ground conditions—thawing, liquefaction of near-surface soils and strata). The gravity acceleration reduction together with height was performed using the actual vertical gravity acceleration gradient determined as part of surveys for the absolute measurement and the normal vertical gravity acceleration gradient (−0.3085 mGal/m) for field points. The reduction of relative surveys at the base point 1000 was carried out using the actual gradient, as applying the normal gradient for a reduction from a height of 40 cm would result in a systematic difference in the determined absolute gravity acceleration values of about 0.004–0.005 mGal relative to the values determined using the actual gradient.

Table 2.
Mean measurement errors in the gravimetric measurement series I–VII.
As part of the gravimetric data analysis and processing, distribution maps were prepared for the Earth’s gravity field and the anomalies with Bouguer reduction across individual survey series. The subject of analysis in this paper includes differential maps of gravity field (g) variations as well as differential maps of distribution variations in anomalies with Bouguer reduction (∆g) in successive survey series with reference to the initial series (I) performed at the testing ground in April 2021. Comparing the distribution variations of the specified fields during the extraction conducted by KWK ROW Ruch Marcel is intended to display the medium density fluctuations within the pillars, corresponding to variations in the state of stress, with a distribution of tremors induced by the mining activity during the performance of the gravimetric monitoring.
4. Results
4.1. Survey Results—Differential Maps of g
The results of the gravimetric monitoring conducted over the barrier pillars are presented in the form of temporal differential maps of g (Figure 7) as well as differential maps of anomalies with Bouguer reduction (Figure 8), overlaid on a topographic map with marked ranges of the pillars. The initial spring Series I of late April 2021 was adopted as the reference series.
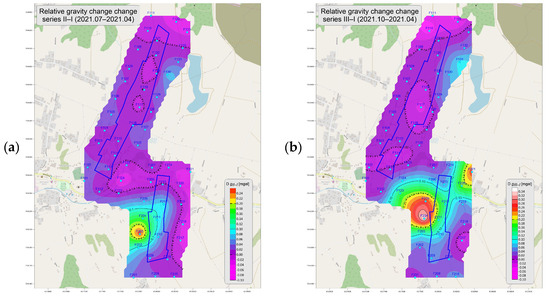
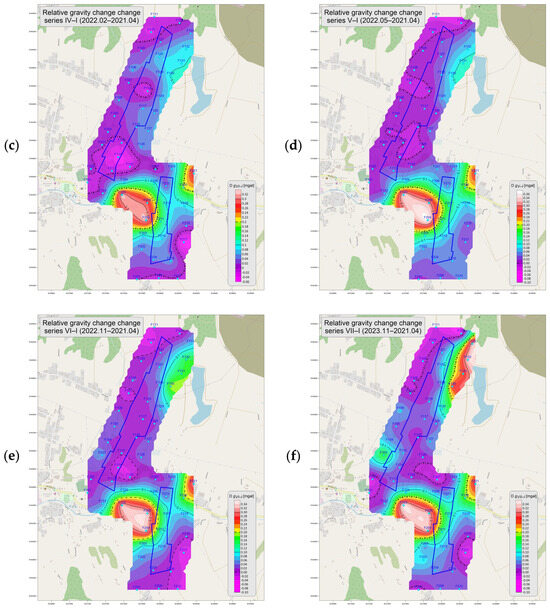
Figure 7.
Differential map of the Earth’s gravity field variations in the period of April 2021—November 2023 (g values relative to the base point 1000) at the testing ground in Marklowice. (a)—series II−I, (b)—series III−I, (c)—series IV−I, (d)—series V−I, (e)—series VI−I, (f)—series VII−I.
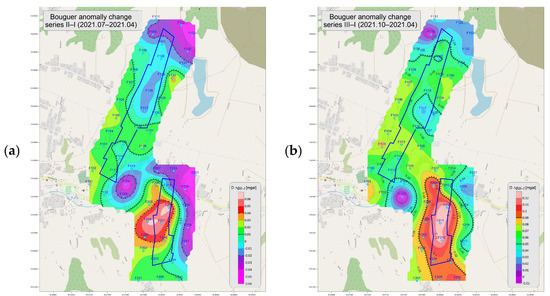
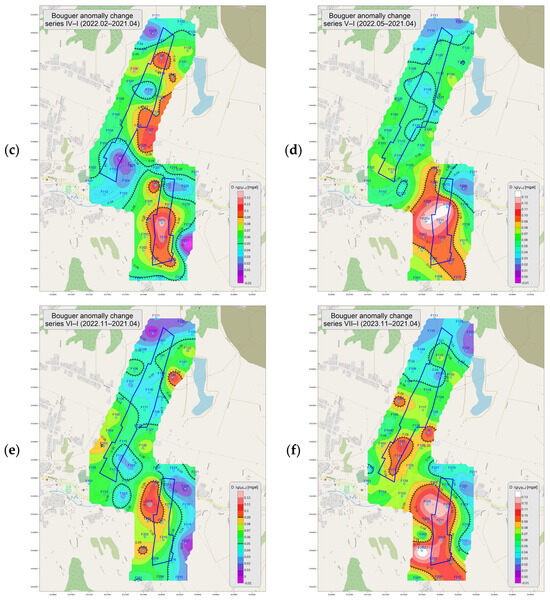
Figure 8.
Differential maps of anomaly distributions with Bouguer reduction in the period of April 2021—November 2023 (Δg values relative to the base point 1000) at the testing ground in Marklowice. (a)—series II−I, (b)—series III−I, (c)—series IV−I, (d)—series V−I, (e)—series VI−I, (f)—series VII−I.
The maps of g and ∆g distribution variations present locations of gravity field decreases marked in cool colours (purple and blue hues) as well as areas where the analysed values increased, marked in warm colours (from yellow to red). Light blue and green (for ∆g) denote an approximate lack of variations in the relative gravity anomaly values among the analysed survey series. The bold broken hatched line marks the zero isoline of the g and ∆g variations. The rock mass state in the thus marked zones can be deemed as exhibiting no density variations, which corresponds to a relative stabilisation of the stress distribution. The 0.10 mGal isoline was adopted as the measure of anomalous elevated values for g (~the middle of the variability range of −0.1 to 0.30 mGal), while the 0.0 mGal isoline was adopted for ∆g (exactly in the middle of the range).
The image of the differential anomalies in the gravity field g observed in successive survey series with reference to the first series (Figure 7a–f) is dominated by the influence of three anomalous regions. The first of these is located in the central-western part of pillar F2 in the south of the testing ground, encompassing points F203–204 (agricultural fields). The second is concentrated in the northeast corner of the pillar F2 grid, in points F221–220 (urban areas by DK932/Wyzwolenia and Jankowicka streets), and the third is in the northeast of the testing ground, in points F130–131 of pillar F1, near the basin of Water Reservoir Z6 Orka.
A progression in the density increase and elevated state of stress towards the SE-NW is visible together with the passage of time. Initially, during Series II (Figure 7a) of the monitoring surveys performed 3 months after the reference series, the differential anomaly distribution was disturbed only in the area of point F203. The differential anomaly value gII-I reached a level of 0.258 mGal. A weak anomaly in point F130 is slightly discernible from the background in the northeast.
In the differential map of Series III referenced to I (Figure 7b), i.e., 6 months after the monitoring was commenced, the extreme of the positive anomaly in F202–204 moved northward to encompass points F204–205. The maximum differential value gIII–I reached 0.341 mGal in pt F204. A new focus of density increase also appeared in points F221–F220. Pillar F1 was still free of changes in the state of stress, and a slight increase in the gravity field value relative to the reference series was observed only in the northeast of the testing ground at points F130–131, with a discernible shift, analogous to pillar F2, relative to the gravity field distribution for Series II–I from Figure 7a.
The next survey series (differential map of Series IV–I—Figure 7c) yielded greater variations in the differential gravity anomaly distribution. The anomalous area in the vicinity of points F204–205 expanded towards point F123 over the SE-NW direction after 4 months from the previous series, while the anomaly in the northeast of pillar F2 became considerably stronger. The maximum values of the F204–205 anomaly reached 0.332 mGal in pt F204. The anomaly in the northeast of pillar F1 also reached higher values (0.104 mGal in pt F130), while simultaneously expanding its range in the SE-NW direction, i.e., towards point F120.
In Series V–I, the results of which are presented in Figure 7d, the progression of the differential increases in g towards N and NW had ceased. After 13 months from the reference series, the three described main anomalous zones retained the surface areas and shapes from the previous series with a simultaneous increase of the values within their ranges. This is particularly visible in the case of the F204–205–123 anomaly, where the values reached as much as 0.378 mGal. Due to its increased value, the anomaly combined itself (0.10 mGal isoline) with the F221–220 anomaly (maximum of 0.280 mGal) in this series. The area of increased differential values in the northeast of the testing ground became stronger in pt F131, to a value of 0.112 mGal.
From Series VI onwards, the increase in ground density relative to the reference series would progress further, as presented in Figure 7e. In this series, performed 6 months after the previous one and 19 months after the initial series, the area of the F130–131 anomaly expanded to include point F132, and new focuses of changes appeared as well. These are visible along the western border of the measuring grid for pillar F1, in point F103 (property at Jabłoniowa 28) and near F106 (agricultural fields). The greatest differential value of the F203–204 anomaly reached 0.335 mGal; for F221–220, it was 0.308 mGal; and for F130–131–132, it was 0.198 mGal. The F204–205 and F221–220 anomalies did not combine in this series.
In the final Series VII (a year after the previous one and 2 years 7 months after the reference series), new focuses of anomaly can be witnessed very clearly (Figure 7f). In pt F103, the extreme of the anomaly reached 0.177 mGal. The anomaly in the northeast corner of the testing ground reached a considerable area, encompassing points F133, F129, F119 and F120 together with points F130–131–132. The greatest values can be found in pt F132 (0.336 mGal) and F133 (0.328 mGal). In the final series with reference to the initial series, the values of the anomaly in the south, i.e., F204–F205 towards F123, increased only slightly after a year relative to the previous series to levels of 0.332, 0.321, and 0.365 mGal, respectively. The disturbance in pt F221–220 remained at a very similar level (maximum of 0.291 mGal). The two last anomalous areas were once again linked by the 0.10 mGal isoline.
Apart from the positive anomalies described above that indicate increases in density and stress, the differential gravity field images also exhibit anomalies with considerably lower amplitudes that imply medium thinning and relaxation (blue to purple colours). The areas where the relative gravity values decrease in successive series are located in the northwest (by pt F11), in the centre of pillar F1 (pt F117–118), in the south of pillar F1 (pt 114–125), and in the southeast of the testing ground (by pt F217). The maximum amplitudes of these gravity field disturbances were observed during Series IV relative to I (Figure 7d), and they reached up to −0.028 mGal in pt F110, −0.033 mGal in pt F118, −0.052 mGal in pt F114, −0.032 mGal in pt F125, and −0.062 mGal in pt F217. Considering that the differential variability range of g is not symmetrical relative to 0, as is the case for ∆g, these seemingly minor values are actually significant and related to the occurrence of local decreases in the rock mass density and stress.
The described differential anomalies of g reach values of nearly two orders of magnitude greater than the mean measurement errors for the individual survey series compiled in Table 2, which attests to their reliability and the possibility of interpreting their changing distribution.
4.2. Survey Results—Differential Maps of Dg
As for the differential anomaly distributions of gravity with Bouguer reduction ∆g (Figure 8a–f), it can be stated that these changes correspond to a certain degree with the changes in g presented in Figure 7a–f, particularly for the initial differential series. However, the field distribution of ∆g during the monitoring period underwent much greater periodic variations. These were changes different from the approximately constant trend observed in the case of the changes in g. The reason for this is that the variability of the analysed values consists of the following factors other than the measured gravity g: the free-air (Faye) correction eliminating the influence of the measurement point height relative to the reference point, a correction factoring in the influence of the reduced value’s density, and the Bouguer correction eliminating the vertical attractive force component of a rock network limited by horizontal planes passing through the measurement point and reference level. The first two corrections depend on the measurement point height above sea level, which underwent variations between individual series. The height variations have a significant effect on the reduced value of the gravity field. During the 3 years of monitoring, F1 and F2 varied within −1.9 m to +0.1 m. The normal gravity value is further subtracted from the measured g value reduced by means of the corrections. In the performed gravimetric surveys, a local normal field was adopted with relative values that increased by 0.0008 mGal towards the north.
In the case of the differential maps of changes in ∆g with Bouguer reduction, the division into positive and negative anomalies is slightly more legible due to the symmetry of the data ranges applied when charting the maps relative to 0.
In Series II–I (Figure 8a), the location of the positive and negative anomalies is nearly identical to the differential anomaly distribution of g (Figure 7a), whereas their relative values are more contrasted, which makes the variation image more distinctive. The locations of the anomaly extremes and the shapes of the zones where they can be found overlap with the image for the differential anomalies of g in this series. Apart from a strong positive anomaly in the centre of pillar F2 (longwall C-4 mining in coal seam 507), elevated gravity field values are also found in the northeast corner of the testing ground (longwall W-8 in coal seam 505 wg). Negative anomalies are located in the north of the testing ground, in the southeast corner of the grid for pillar F1 and in the northern and eastern parts of the grid for pillar F2. The greatest values reach 0.062 and 0.067 mGal in pt F204 and F212, while the lowest are −0.049, −0.053, and −0.047 in pt F220, F124, and F133. Negative anomalies are clearly distinct in Series II–I, and in further series they are dominated by increases in stress. The increase that was inhibited a little in Series IV–I has a clear culmination in Series V–I. Afterwards, in the following Series VI, the differential positive values became weaker, while the negative values became more distinct. In the final Series VII, another increase in stress is observed in nearly the entire pillar F2 as well as in new locations in pillar F1.
In the next, Series III, relative to the initial series (Figure 8b), the differential gravity anomaly distribution with Bouguer reduction is considerably different from the variations in g (Figure 7b). Whereas in the case of g the existing anomalies became stronger, for ∆g, apart from an increase in their values, there was also a change in the shape and range of the positive and negative anomalies as well as a repositioning of the anomaly extremes. The positive anomaly from the centre and west of pillar F2 shifted southward, where the shallowest deposit in the region, coal seam 507 (longwall C-4), is mined. In this series, the anomaly encompassed nearly the entire pillar F2 and even reached beyond its southern boundary. The negative anomaly in the southeast of F2 underwent considerable weakening, with similar cases observed for the anomaly in the south of pillar F1, in the north of the entire testing ground, and in the centre of pillar F1. The greatest values of ∆g were recorded at points F210–211–212, and they exceeded 0.12 mGal. The negative field assumed the lowest values in pt F110 in the north of the F1 grid (−0.014 mGal) and in pt F123 in the south of the same grid (−0.027 mGal).
A significant restructuring of the anomaly system is visible in Series IV–I, particularly within pillar F1 (Figure 8c). The area of decreased differential values of ∆g present in the previous series in the central and eastern part of pillar F1 was limited to a minor anomaly with an extreme in pt F118 (0.013 mGal) and was replaced by a strong anomalous zone of an opposite sign. This zone stretched from pt F126–127 through F129–130 (values of about 0.10 mGal) until pt F120, where the extreme of this anomaly was located (0.114 mGal). The presence of this strong positive anomaly can be associated with a seismic tremor with a magnitude of M = 2.5 registered by GRSS [31] 35 days before the gravimetric surveys, 675 m east from pt F131 (Figure 9). The event was related to the operation of longwall Z-3b in coal seam 501/3 and may have led to a local destressing in the area of the epicentre, a “momentary” densification of the rock mass in the vicinity of the pillar and a displacement of the zone exhibiting an increased state of stress towards the pillar’s direction. The zone of decreased gravity in the north of the testing ground shrank relative to Series I. The rock medium density decrease in the south of the F1 pillar grid exhibited a considerably greater area in this series relative to the previous and the first, and it continued its expansion outside the testing ground—further southward. On the other hand, the anomaly indicating an increase in the density and stress in pillar F2 decreased in size. At this point in time, it was limited by the pillar boundary from the south and considerably reduced from the north by the strengthened negative anomaly in that area. At the southeast boundary of the F2 grid, the mass thinning in pt F217 became considerably stronger (−0.026 mGal). At the same time, it yielded the lowest differential gravity field value ∆g in this survey series relative to the first.
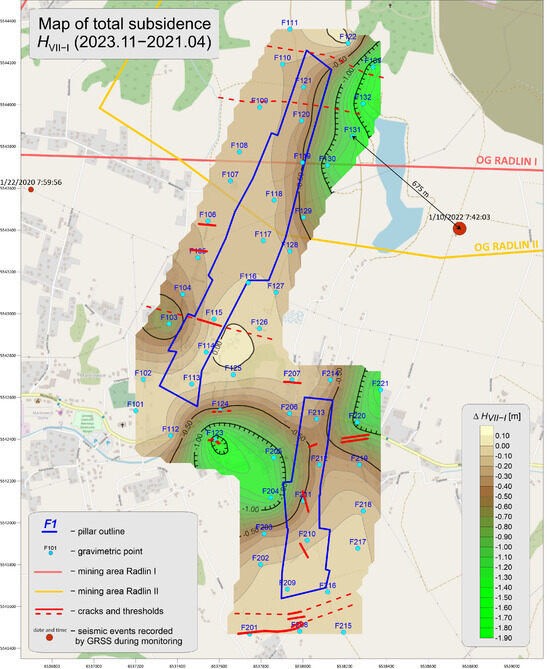
Figure 9.
Map of total subsidence over 04.2021–11.2023 in the GSB-GFO testing ground, with marked ground deformation in the form of crevices and fault ledges.
In the following Series V, performed 13 months after Series I, the differential anomaly fields ∆g underwent relative stabilisation, similar to the field distribution of g (Figure 8d). The image is dominated by a strong positive anomaly (high state of stress) in the centre of pillar F2 as well as a zone of elevated values located around it that stretched from the southeast to the northwest of the F2 grid. Other positive anomalies had faded, while the location of the areas where the differential values of ∆g were increased relative to Series I did not change. At the same time, the area and amplitude of the latter disturbances was greatly limited in this series. The positive anomaly along the eastern boundary of F1 from the previous series became negative. This indicates that the rock mass was destressed after the seismic events related to the Z-3b longwall mining that had occurred during the monitoring.
The comparison results of Series VI and I, as pictured in Figure 8e, reveal another activation of areas exhibiting ground density reduction previously observed in Series IV–I and earlier (Figure 8a–c). Moreover, 19 months after monitoring began, the anomalous region distribution was generally very similar to Series IV (4 months after I—Figure 8c), though the anomalies indicating an increase in rock mass density were not as expansive as before. Apart from a dominant anomaly within pillar F2, which shifted from the centre towards the northwest in this series, outside the western boundary of F2, only three single-point positive anomalies are visible outside the boundaries of the pillars in points F103, F130, and F202. Elevated states of stress had occurred in the vicinity of these points in the past, though they had faded in the previous series. Anomalies indicating thinning (medium relaxation) can once again be seen in the field distribution map. They are also found in places similar to those of Series IV and prior. The border and amplitude of the anomaly in the north with an extreme in pt F110 increased to 0.024 mGal, whereas the negative anomalies in pt F118, F114–125, and F123 became weaker. The zone of decreased density along the northeastern and eastern boundary of pillar F2 became stronger this time compared to the previous series, while relative to Series I it exhibited extremes close to zero in pt F220 (0.003 mGal) and F217 (0.004 mGal).
In the final Series VII (Figure 8f), conducted a year after the previous one and 2 years and 7 months after Series I, the differential anomaly field distribution had once again undergone a significant change relative to the previous series (Figure 8e). The anomalous region distribution was dominated by a considerably large positive anomaly within pillar F2. Similar to Series III and V, it stretched outside the testing ground in the south. This time, it exhibited two extremes with a large area and the following amplitudes: 0.151 mGal in pt F202 and 0.129 mGal in pt F205. The remaining positive anomalies were located in the southern part of pillar F1, in places where they had not occurred in previous survey series relative to I. These were areas around points: F115 (0.050 mGal), F127 (0.064 mGal) and F106 (0.060 mGal). The zones of decreased stress were strongly limited and exhibited a lower amplitude than in the previous series (Figure 8e), and they were found in the north of the testing ground in pt F132-133 (−0.071 mGal) and F119 (−0.020 mGal) as well as in the northeast and east of pillar F2: F220 (0.012 mGal) and F117 (0.021 mGal).
The discussed differential anomalies of ∆g reached values an order of magnitude greater than the mean measurement errors compiled in Table 2.
4.3. Discussion
Differential gravity field anomalies in relation to ground subsidence in the GSB-GFO testing ground in Marklowice obtained in the periodic surveys exhibit very good correlation with observations of macroscopic ground variations. Ground subsidence, fault ledges, cracking and crevices in the asphalt road surfaces and building façades were observed during the conduction of the monitoring. The locations of these deformations are presented in Figure 9. Their presence testifies to the actual transformation in density and structure in the deep part of the rock mass. This state is the result of the extraction conducted by KWK ROW Ruch Marcel near the barrier pillars, which exposed them to danger (particularly pillar F2).
It can be stated that the differential anomalies of g overlap with the changes in the monitoring point heights, which is well illustrated by the map of total subsidence between Series I and VII of the monitoring surveys (Figure 9). The spatial co-occurrence of the anomalies in g with subsidence extremes and ground deformations is particularly discernible in the result maps for anomalies in g (Figure 7a–f) between the pillars (F204–205-123), in the northeast corner of the F1 measurement grid (F132–135) and F2 grid (F221–220). The total subsidence reaches 1.9 m in the north of the testing ground and 1.4 m between the pillars as well as in point F221. The change in height is also related to the smaller anomaly in points F103–104, which manifests itself clearly in the ∆g maps of the two final survey series (differential maps gVI–I—Figure 7e and gVII–I—Figure 7f).
After factoring in the heights of the points included in the Bouguer reduction, the ground subsidence overlaps not exactly with the anomaly centres but with the locations of strong differential gradient variations of gravity ∆gi–I. On the maps in Figure 8f, these locations exhibit neighbouring positive and negative anomalies. This indicates the presence of a zone of abrupt variations in the medium density. The stress here undergoes accumulation, which leads to the risk of its potential sudden release in the form of seismic tremors. In the case of the differential map for the final series (Figure 8f), the gradient is disrupted by a general increase in the gravity field value, particularly within the entire area of pillar F2, but also by the density increase in the southern part of pillar F1. This suggests an accumulation of stress resulting from the compaction of the rock material in these areas.
The subsidence summary map shows that its extremes correlate very well with the performed longwall mining. The significant negative anomaly visible between the pillars in the south correlates with the extraction conducted by the C-4 longwall in seam 507. The ground subsidence in the northeastern part of F1 corresponds to the extraction by the following longwalls: W-8 in seam 505 wg, C-5 in seams 503–504, Z-2 in seam 502/1, and Z-3b in seam 501/3. The anomaly in the area of point F103 reflects the extraction conducted by the longwall on the western side of F1 in seam 505 wd (Figure 4 and Figure 8). The negative anomaly in the northeast of F2, in combination with the data from the differential maps of g and ∆g, suggests that coal extraction could have commenced there in seam 501/3 at a time after the first series of gravimetric surveys.
Associating the positive anomalies in the description of the differential gravity anomaly field variations with Bouguer reduction of Series IV with a single seismic tremor from the GRSS network suggests that adding seven epicentres of all the registered tremors from the relevant time periods to the maps in Figure 7 would be a significant feature helpful in assessing the safety of the pillars and the surface.
5. Conclusions
The underground multiple-seam longwall mining conducted in the vicinity of pillars F1 and F2 of the Ruch Marcel mine led to volume changes in the rock mass. As the longwalls progressed, a gradual increase in stress occurred in the goaf overburden, as a result of which the density of this medium increased in relation to the surrounding environment. The basic result of the performed gravity surveys is the identification of areas exhibiting increased density in the GSB-GFO testing ground. These areas were equated with differential positive gravimetric anomalies and zones of strong gradients.
In the areas characterised by a strong gradient of differential anomalies ∆g, maximum total ground subsidence can also be observed, as well as fault ledges, cracks and crevices in road surfaces and building facades. These areas include: the area between the central-western part of pillar F2 and the southeastern part of pillar F1; the area in the northeastern corner of pillar F2, and the area in the northeastern corner of pillar F1. These are the areas that pose the greatest hazard to the immediate surroundings of barrier pillars F1 and F2. Within the pillars themselves, the most noteworthy sections are: the central and southern part of pillar F2, and the southern and southwestern part of pillar F1.
Unfortunately, the lack of information about tremors near the pillars makes it impossible to link gravity anomalies with seismicity accompanying the exploitation and thus to fully assess the safety status of the pillars. The analysis shows that periodic gravimetric measurements provide indirect information about changes in the stress state during exploitation. However, without linking differential anomalies with seismicity induced by extraction, inferences about the safety of protective pillars are limited to information about places of high stress accumulation.
The mapped regions at risk require verification in the future. Locations of strong gradient occurrence in the differential gravity field should exhibit good correlation with the epicentres of high-energy mining tremors. However, the lack of such events accompanying the longwall mining in the vicinity of pillars F1 and F2 in the years 2021–2023 made it impossible to complete the cause-and-effect analysis in this paper. Nevertheless, the relationship between gravity and seismicity in mining areas will be investigated in the future.
Funding
This work was written as part of project EPOS-PL+: EPOS—European Plate Observing System. The project was accomplished as part of Priority IV: “Increasing the Research Potential” and Action 4.2: “Development of a modern research infrastructure for the science sector” in the Smart Growth Operational Program, co-financed by the European Regional Development Fund. Project coordinated by the Central Mining Institute—National Research Institute (2020–2023). Grant agreement number: POIR.04.02.00-00-C005/19-00.
Data Availability Statement
The data supporting reported results can be obtained on request in Central Mining Institute—National Research Institute. There are not publicly archived databases concerning the differential gravity measurements in EPOS-PL+ project.
Conflicts of Interest
The author declares no conflicts of interest.
References
- Borecki, M.; Chudek, M. Mechanika Górotworu; Wydawnictwo “Śląsk”: Katowice, Poland, 1972. [Google Scholar]
- Kotyrba, A.; Kowalski, A. Linear discontinuous deformation of A4 highway within mining area “Halemba”. Miner. Resour. Manag. 2009, 25, 303–318. [Google Scholar]
- Kowalski, A.; Jędrzejec, E.; Gruchlik, P. Linear discontinuities deformations of the surface in the Upper Silesian Coal Basin. Arch. Min. Sci. 2010, 55, 331–346. [Google Scholar]
- Kowalski, A. Deformacje Powierzchni na Terenach Górniczych Kopalń Węgla Kamiennego; Główny Instytut Górnictwa: Katowice, Poland, 2020. [Google Scholar]
- Strzałkowski, P.; Ścigała, R. The causes of mining induced ground steps. Case study from Upper Silesia in Poland. Acta Geodyn. Geomater. 2019, 14, 305–312. [Google Scholar] [CrossRef]
- Strzałkowski, P.; Szafulera, K. Occurrence of linear discontinuous deformations in Upper Silesia (Poland) in conditions of intensive mining extraction—Case Study. Energies 2020, 13, 1897. [Google Scholar] [CrossRef]
- Fajklewicz, Z. Grawimetria Stosowana; Uczelniane Wydawnictwa Naukowo-Dydaktyczne AGH: Kraków, Poland, 2007. [Google Scholar]
- Fajklewicz, Z. Mikrograwimetria Górnicza; Wydawnictwo “Śląsk”: Katowice, Poland, 1980. [Google Scholar]
- Kotyrba, A.; Balicki, A.; Kortas, Ł. Zmiany regionalnego pola grawitacji w północnej części Górnośląskiego Zagłębia Węglowego w latach 2002–2003. Prz. Geol. 2005, 53, 299–305. [Google Scholar]
- Kotyrba, A. Czasowe zmiany pola siły ciężkości w Górnośląskim Zagłębiu Węglowym i ich związek z eksploatacją górniczą. Prz. Gór. 2014, 70, 48–57. [Google Scholar]
- Kortas, Ł. Gravity field changes during deep exploitation of the coal longwall and their relation to stress distribution and seismic activity. J. Sustain. Min. 2021, 20, 228–240. [Google Scholar] [CrossRef]
- Kotyrba, A.; Kortas, Ł.; Siwek, S. Spatio-temporal changes in the gravity and post-mining seismic activity in the abandoned deep coal mine Kazimierz-Juliusz during flooding. J. Sustain. Min. 2024, 23, 357–372. [Google Scholar] [CrossRef]
- Wierzbicki, G. Informacja Końcowa z Realizacji Projektu w Ramach Działania 4.2 Programu Operacyjnego Inteligentny Rozwój; Informacja Końcowa EPOS-PL+; GIG-PIB: Katowice, Poland, 2024; pp. 1–38. [Google Scholar]
- Buscetti, M.; Traversa, P.; Perron, V.; Rischette, P.; Hollender, F.; Shible, H. Epos-France Database of Earthquake Ground Motion for Mainland France: 1996–2021 Updated Version. Seismol. Res. Lett. 2024, 96, 1214–1226. [Google Scholar] [CrossRef]
- Spampinato, L.; Indovina, E.; Geyer, A.; Júlíusdóttir, R.; Reitano, D.; Puglisi, G.; Nave, R.; Santangelo, I.; Vogfjörd, K.; Labazuy, P.; et al. Data and service management of the EPOS Volcano Observations. Thematic Core Service by the European volcanological community. Bull. Volcanol. 2025, 87, 2. [Google Scholar] [CrossRef]
- Lasocki, S.; Orlecka-Sikora, B.; Leptokaropoulos, K.; Sterzel, M.; Szepieniec, T.; Kocot, J.; Mutke, G.; Barański, A. IS-EPOS: A Digital Research Space to Facilitate Integratedapproach to Anthropogenic Seismic Hazards. In Proceedings of the 16th World Conference on Earthquake, 16WCEE 2017, Santiago, Chile, 9–13 January 2017. Paper N° 4114. [Google Scholar]
- Mutke, G.; Kotyrba, A.; Lurka, A.; Olszewska, D.; Dykowski, P.; Borkowski, A.; Araszkiewicz, A.; Barański, A. Upper Silesian Geophysical Observation System—A unit of the EPOS project. J. Sustain. Min. 2019, 18, 198–207. [Google Scholar] [CrossRef]
- Sośnica, K.; Rohm, W.; Bosy, J.; Zajdel, R.; Hadas, T.; Kapłon, J.; Kudłacik, I.; Pawluszek, K.; Sierny, J.; Ilieva, M.; et al. Monitoring of Earth surface displacements using integrated multi-GNSS, gravity, seismic, and InSAR data in the framework of GGOS-PL++. In Proceedings of the 42nd COSPAR Scientific Assembly, Pasadena, CA, USA, 14–22 July 2018. Abstract id. B2. 1-37-18. [Google Scholar]
- Kortas, Ł. Sejsmo-grawitacyjne sygnatury wstrząsów górniczych w ciągłych zapisach siły ciężkości grawimetrów pływowych gPhoneX. Prz. Gór. 2020, 76, 37–44. [Google Scholar]
- Kotyrba, A.; Kortas, Ł. Co-seismic signals of mining tremors in continuous recordings of gravity by gPhoneX tidal gravimeters. Int. J. Rock Mech. Min. Sci. 2020, 129, 104288. [Google Scholar] [CrossRef]
- Szymiczek, W.; Kowalczuk, J.; Siedlaczek, A.; Kuziak, A. KWK “MARCEL” wczoraj i dziś–upadowa odstawczo-transportowa z poziomu 400 na powierzchnię. Zesz. Nauk. Politech. Śląskiej Ser. Gór. 2008, 1798, 155–169. [Google Scholar]
- Kortas, Ł. Analiza modelowa efektów mikrograwimetrycznych zarejestrowanych nad zlikwidowanymi szybami górniczymi. Prz. Gór. 2014, 70, 97–106. [Google Scholar]
- Kotyrba, A.; Kortas, Ł. Sinkhole hazard assessment in the area of abandoned mining shaft basing on microgravity survey and modelling–case study from the Upper Silesia Coal Basin in Poland. J. Appl. Geophys. 2016, 130, 62–70. [Google Scholar] [CrossRef]
- Bałtrukiewicz, M.; Maciej Onopiuk, M.; Biela, R.; Uwara, S. Sprawozdanie Techniczne; cykl 1. GLIMARPOL Gliw. 2021; unpublished work. [Google Scholar]
- Bałtrukiewicz, M.; Maciej Onopiuk, M.; Biela, R.; Uwara, S. Sprawozdanie Techniczne; cykl 2. GLIMARPOL Gliw. 2021; unpublished work. [Google Scholar]
- Bałtrukiewicz, M.; Maciej Onopiuk, M.; Biela, R.; Uwara, S. Sprawozdanie Techniczne; cykl 3. GLIMARPOL Gliw. 2021; unpublished work. [Google Scholar]
- Bałtrukiewicz, M.; Maciej Onopiuk, M.; Biela, R.; Uwara, S. Sprawozdanie Techniczne; cykl 4. GLIMARPOL Gliw. 2022; unpublished work. [Google Scholar]
- Bałtrukiewicz, M.; Maciej Onopiuk, M.; Biela, R.; Uwara, S. Sprawozdanie Techniczne; cykl 5. GLIMARPOL Gliw. 2022; unpublished work. [Google Scholar]
- Bałtrukiewicz, M.; Maciej Onopiuk, M.; Biela, R.; Uwara, S. Sprawozdanie Techniczne; cykl 6. GLIMARPOL Gliw. 2022; unpublished work. [Google Scholar]
- Bałtrukiewicz, M.; Maciej Onopiuk, M.; Biela, R.; Uwara, S. Sprawozdanie Techniczne; cykl 8. GLIMARPOL Gliw. 2023; unpublished work. [Google Scholar]
- Stec, K. Aktywność sejsmiczna Górnośląskiego Zagłębia Węglowego-30 lat ciągłej obserwacji przez Górnośląska Regionalną Sieć Sejsmologiczną. Prz. Gór. 2007, 7–8, 4–22. [Google Scholar]
Disclaimer/Publisher’s Note: The statements, opinions and data contained in all publications are solely those of the individual author(s) and contributor(s) and not of MDPI and/or the editor(s). MDPI and/or the editor(s) disclaim responsibility for any injury to people or property resulting from any ideas, methods, instructions or products referred to in the content. |
© 2025 by the author. Licensee MDPI, Basel, Switzerland. This article is an open access article distributed under the terms and conditions of the Creative Commons Attribution (CC BY) license (https://creativecommons.org/licenses/by/4.0/).