
A Provenance Study of Ceramic Artifacts from the Area of Makariopolsko Village, NE Bulgaria

 , , ,
, , ,
Abstract
1. Introduction
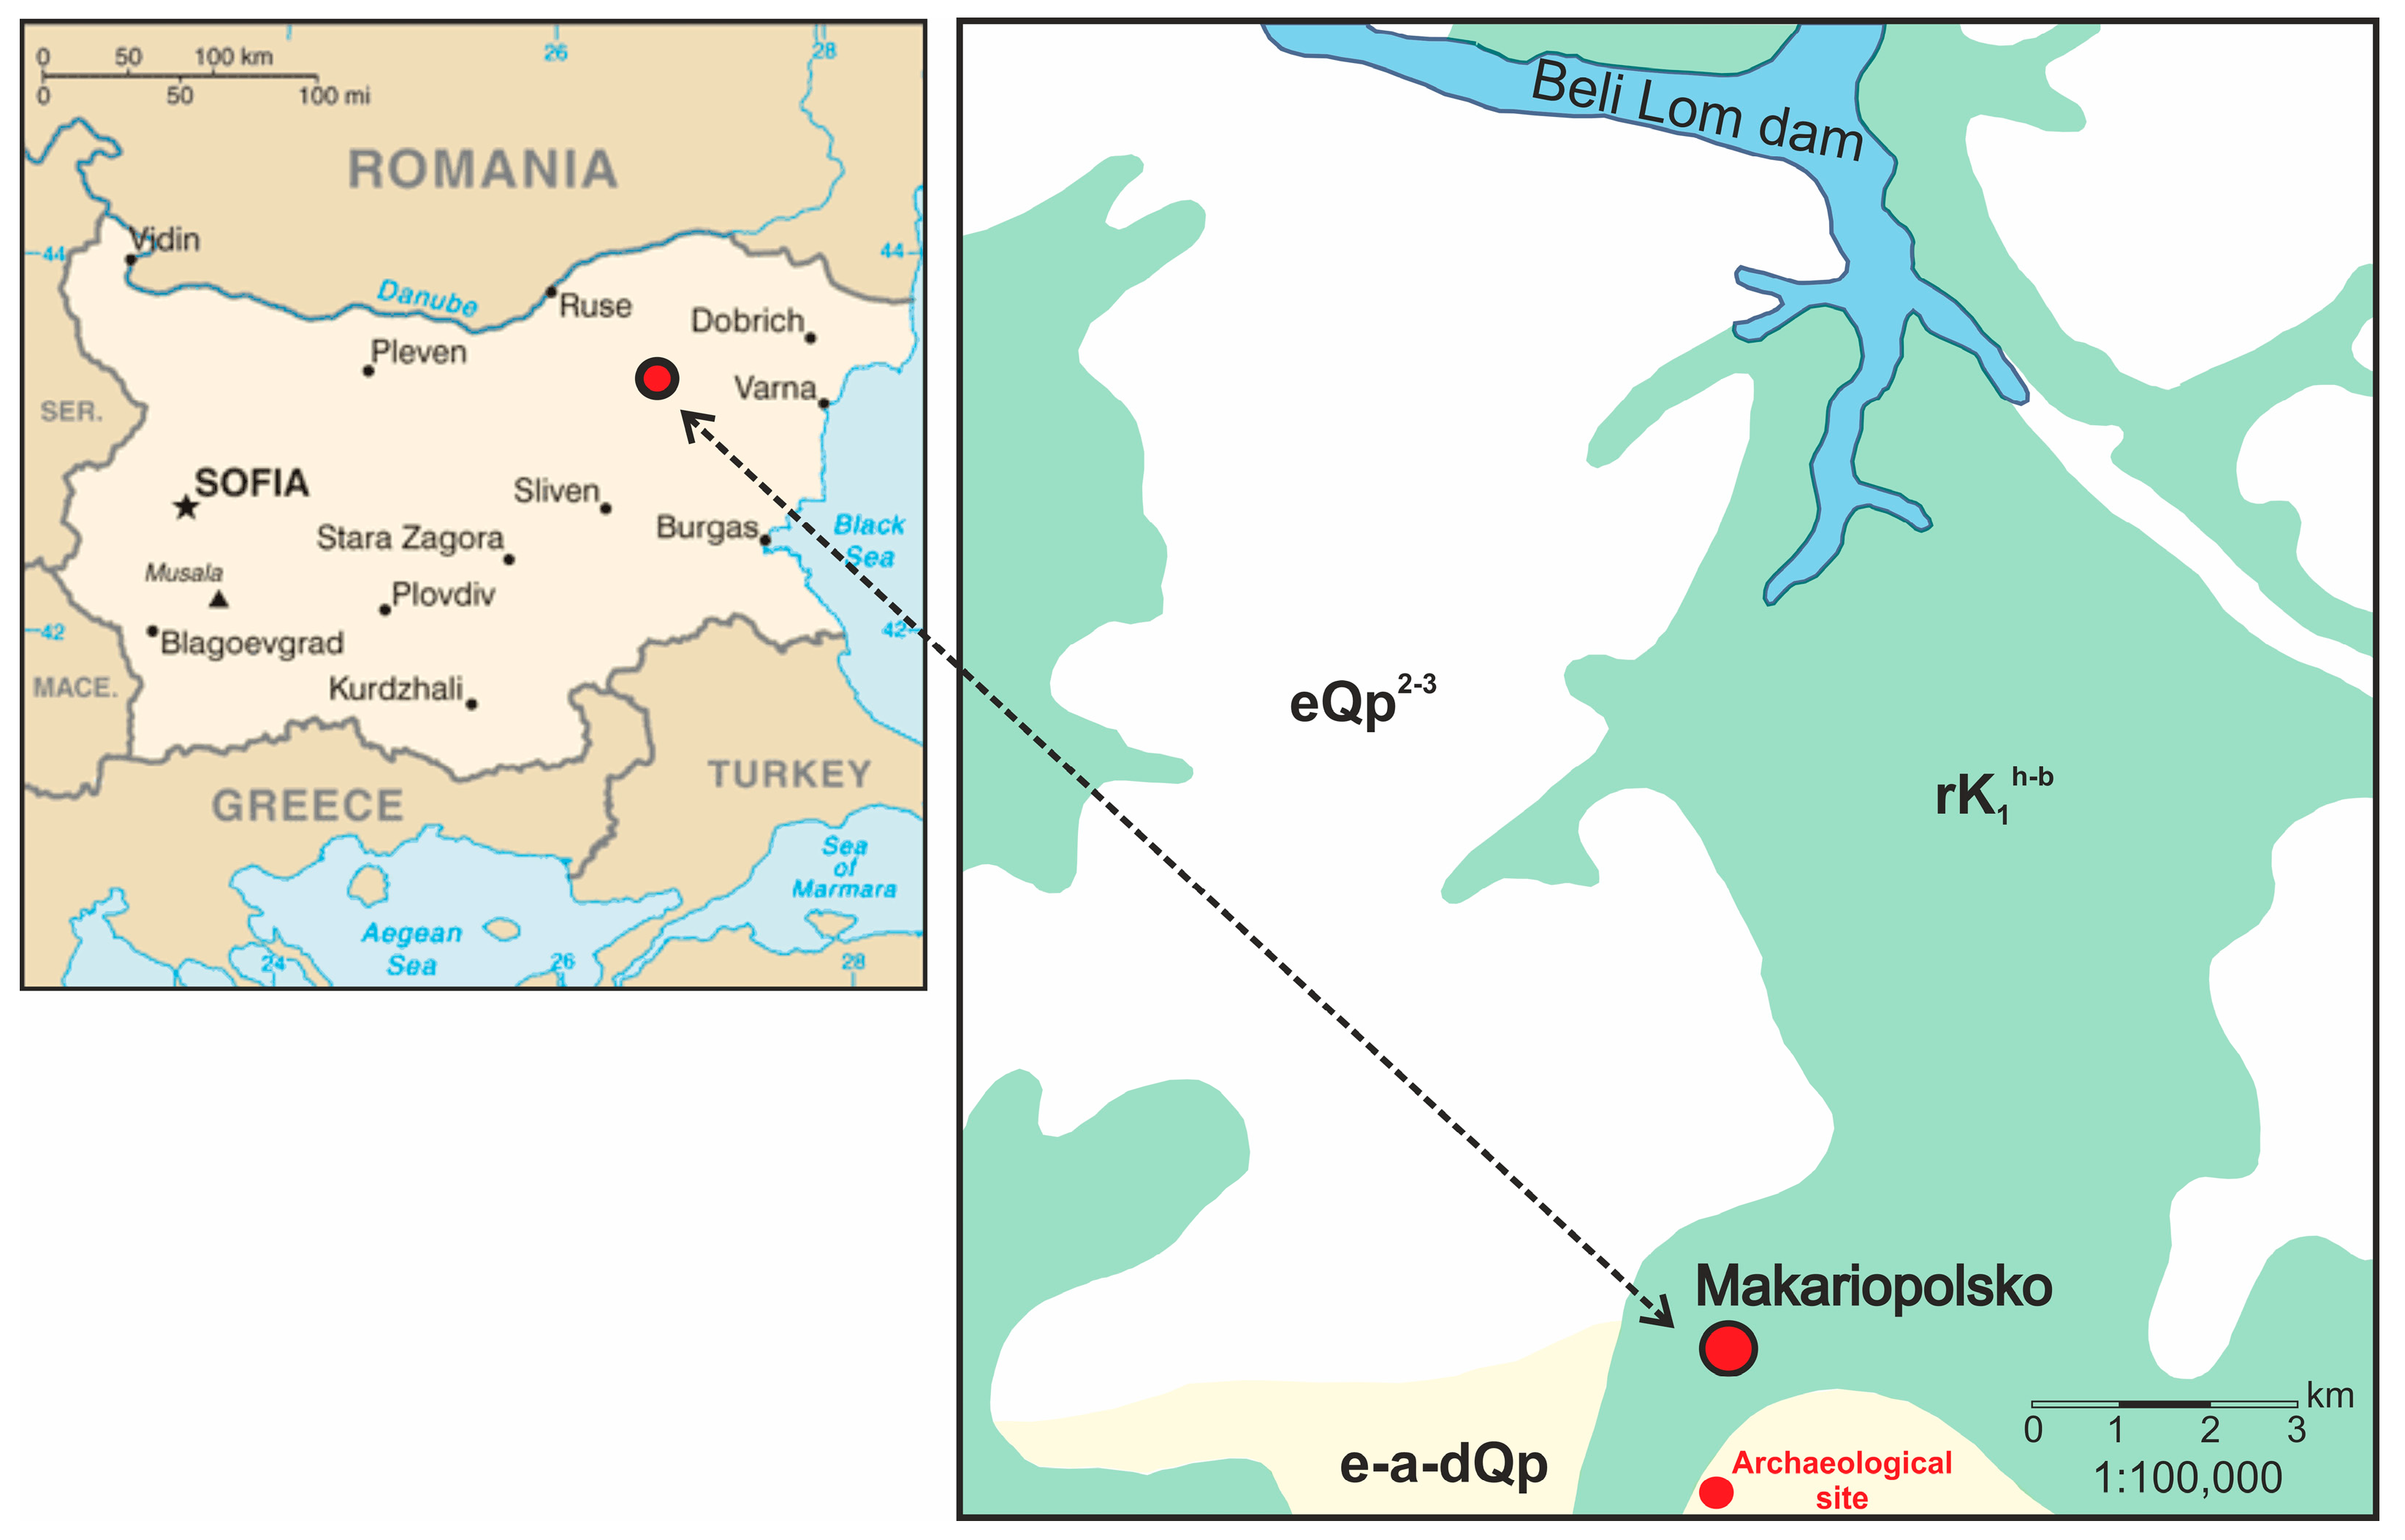
2. Study Area
2.1. Archaeological Background
2.2. Geological Background
3. Materials and Methods
3.1. Materials
3.1.1. Clay
3.1.2. Ceramic Sherds
3.2. Methods
3.2.1. Clay Sample Collection
3.2.2. Sample Preparation
3.2.3. XRF (X-Ray Fluorescence) Analysis
3.2.4. Statistical Processing
3.2.5. PXRD (Powder X-Ray Diffraction) Measurements
3.2.6. Thermal Analysis (TG/DTG-DSC)
4. Results
4.1. XRF
4.2. CA
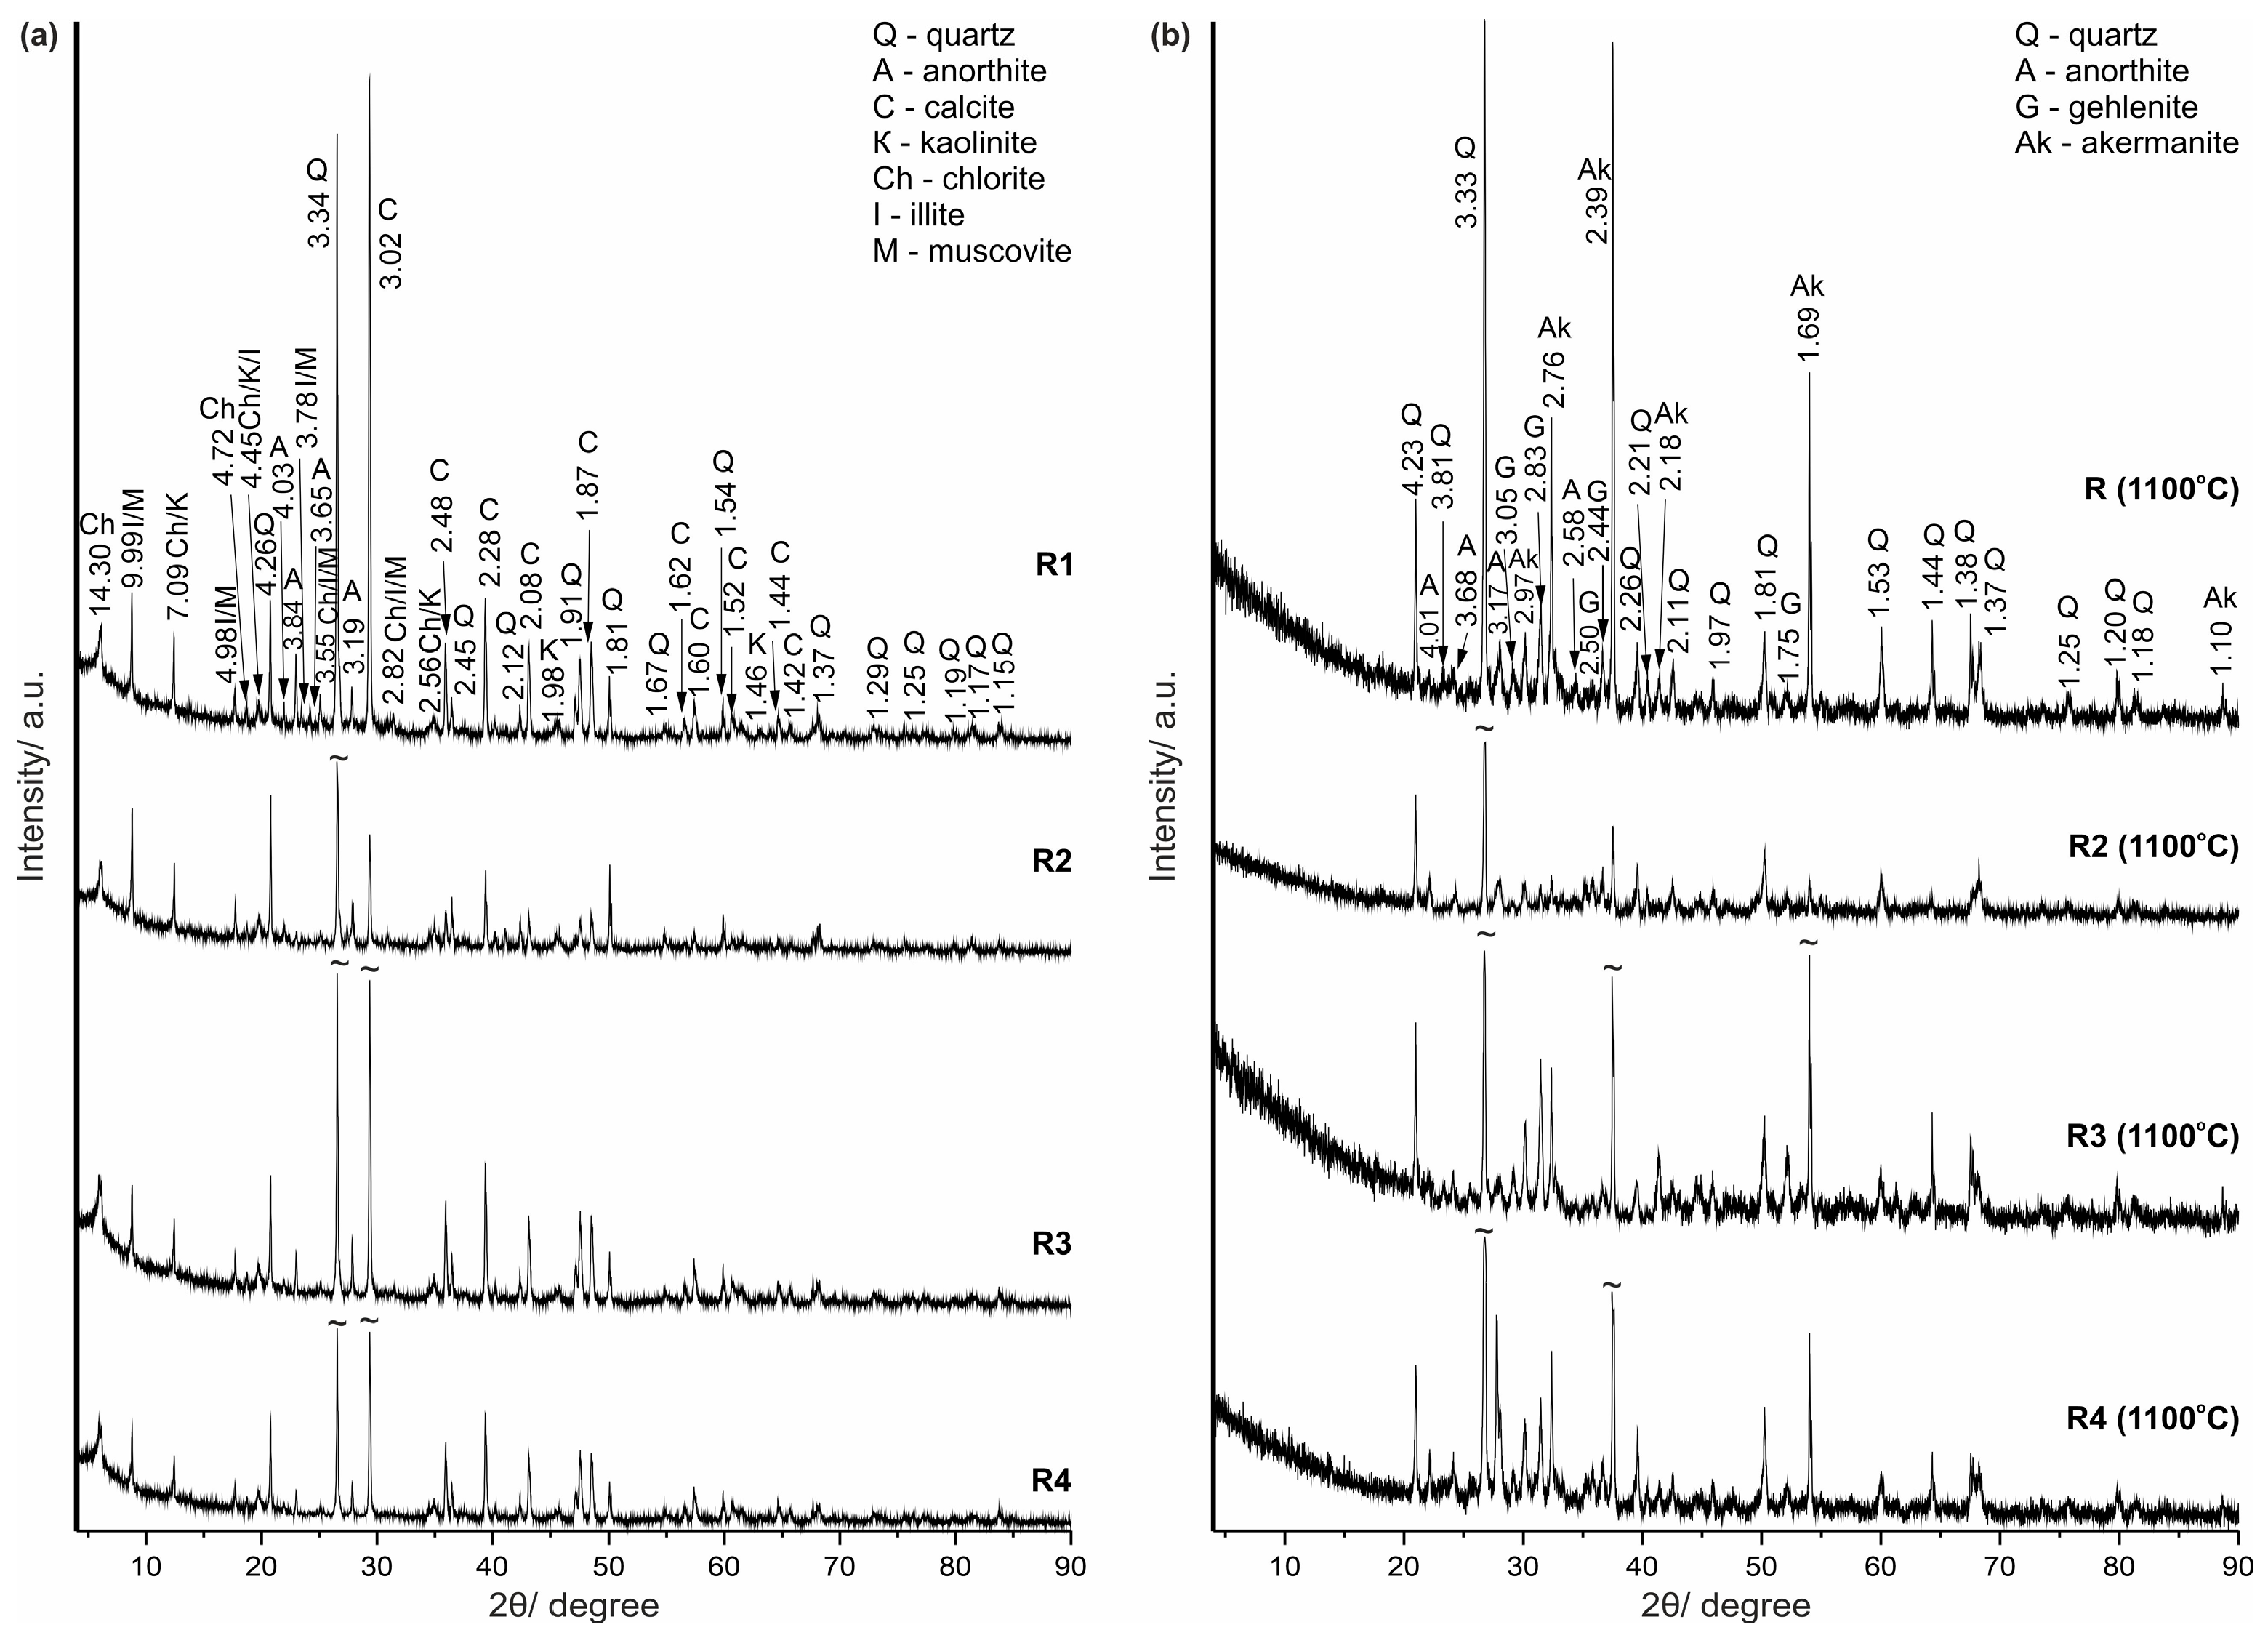
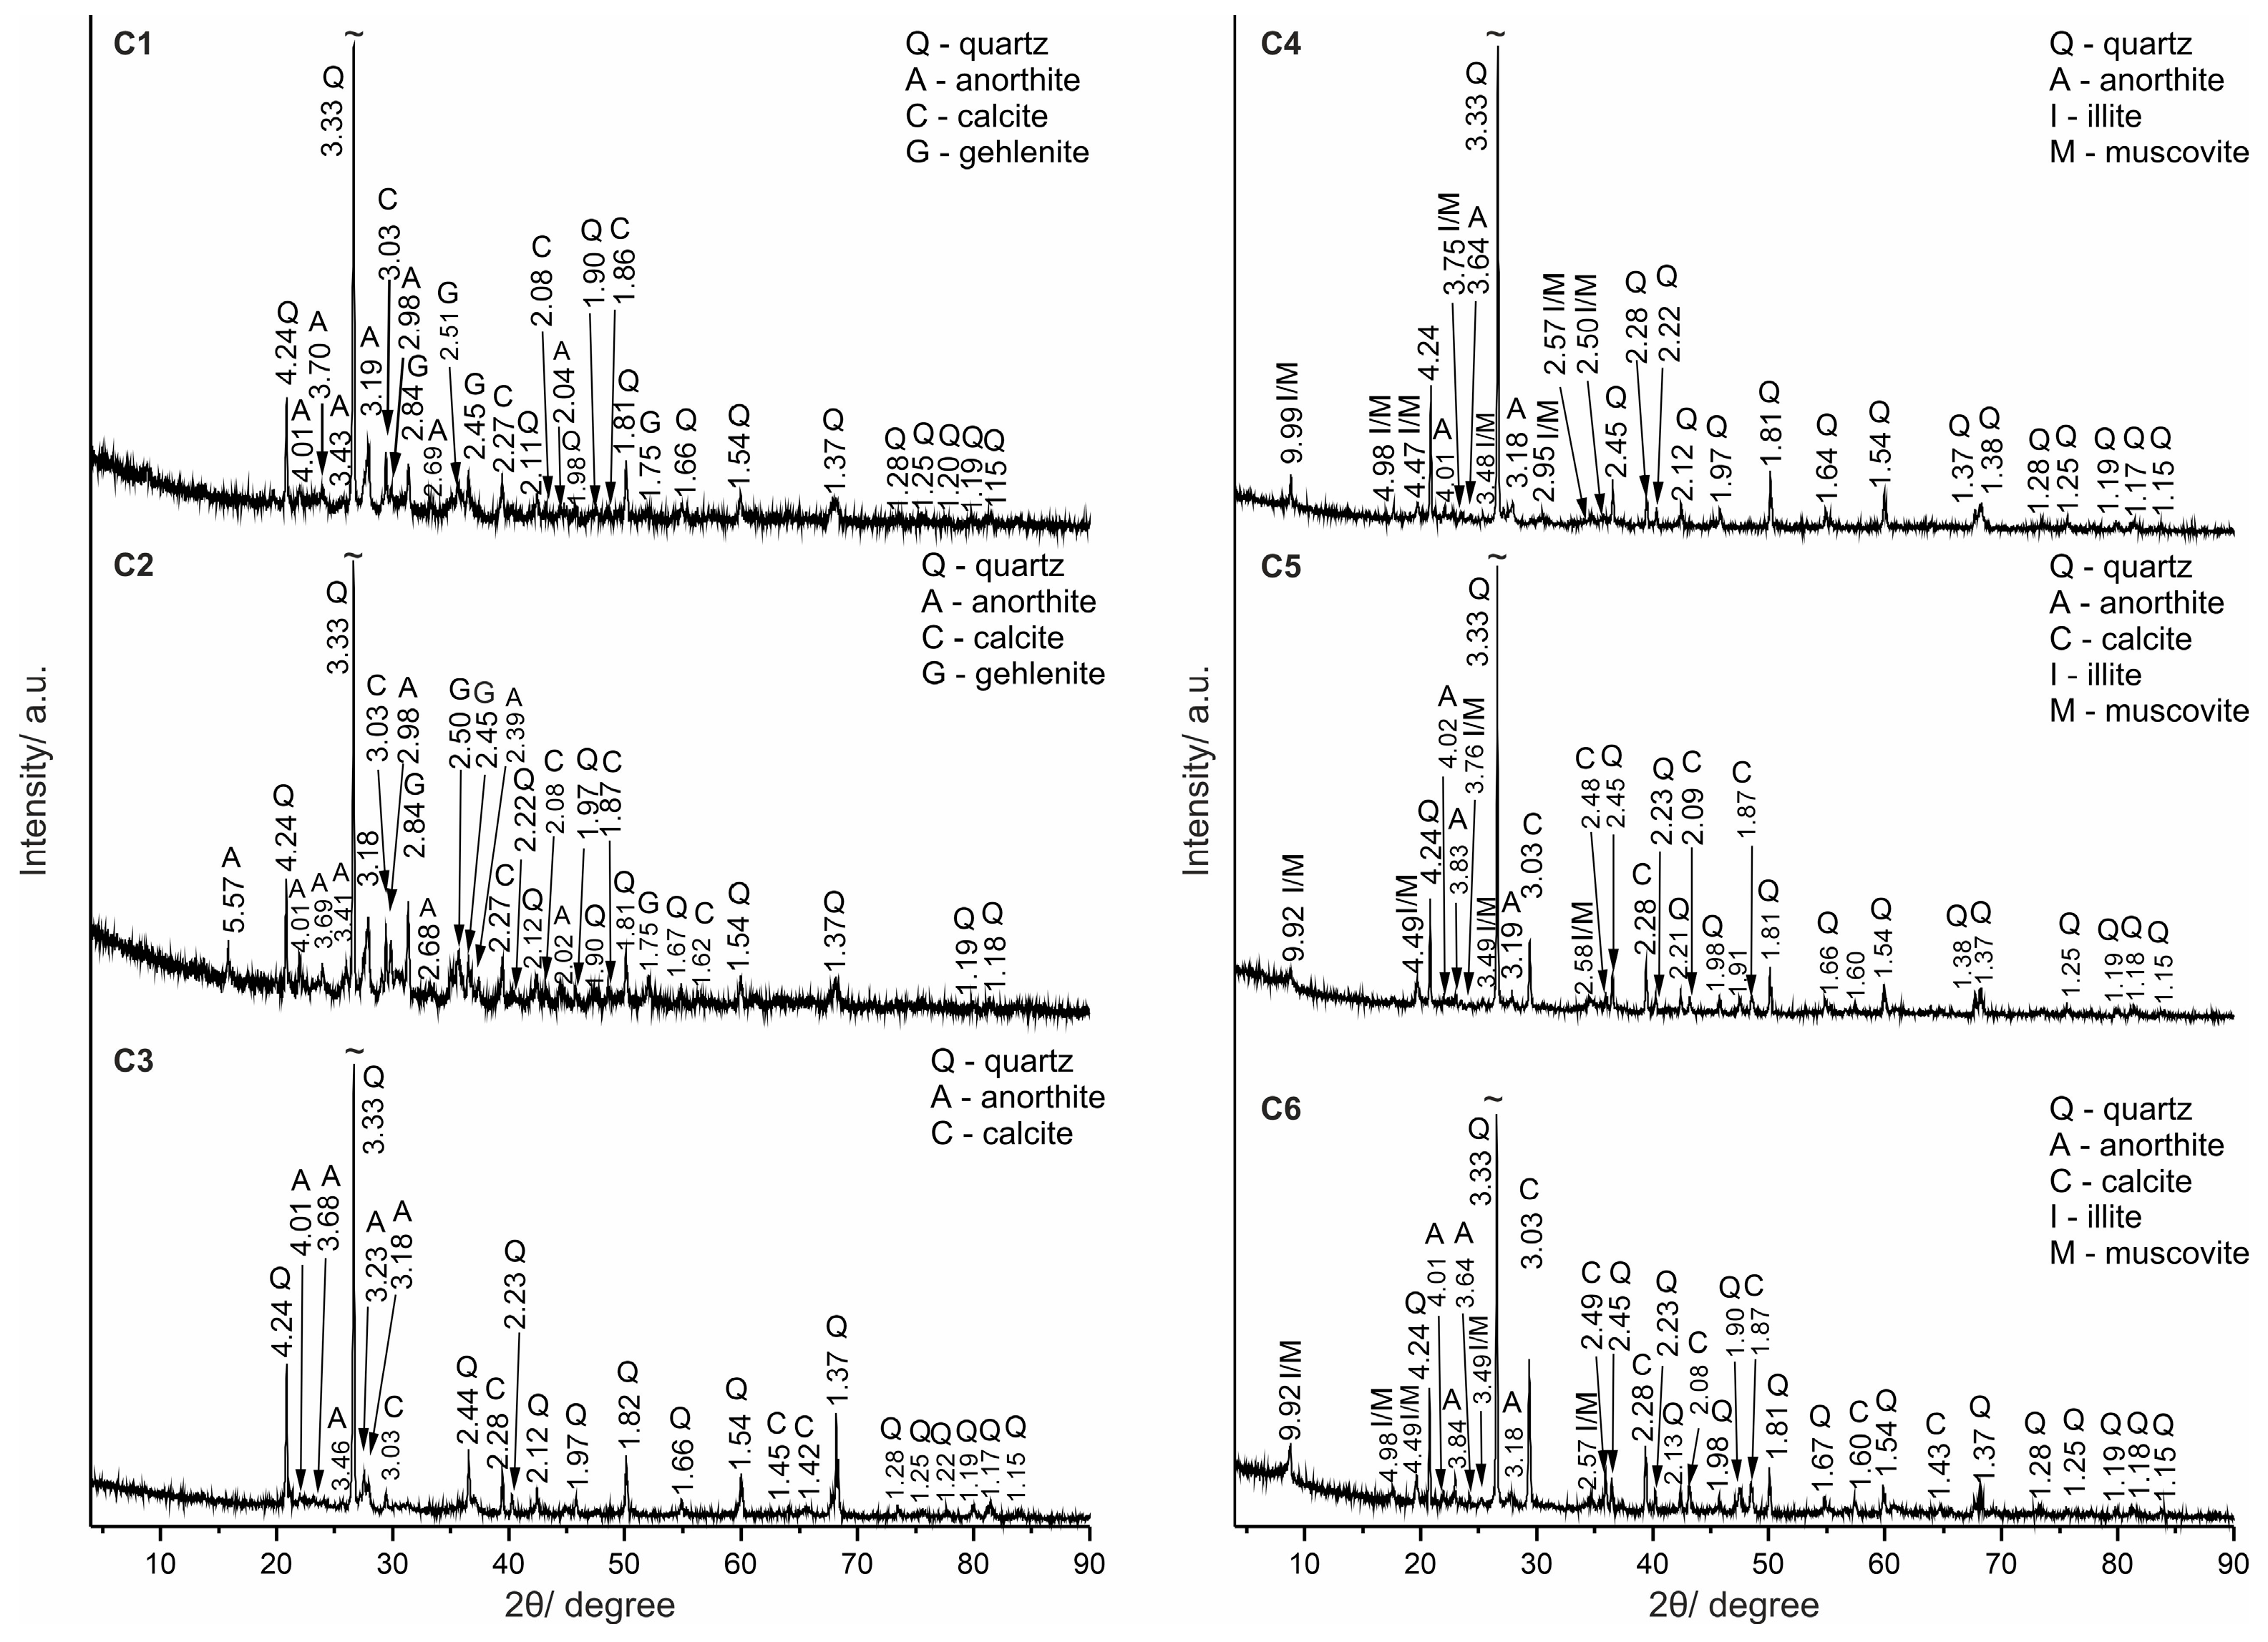
4.3. PXRD
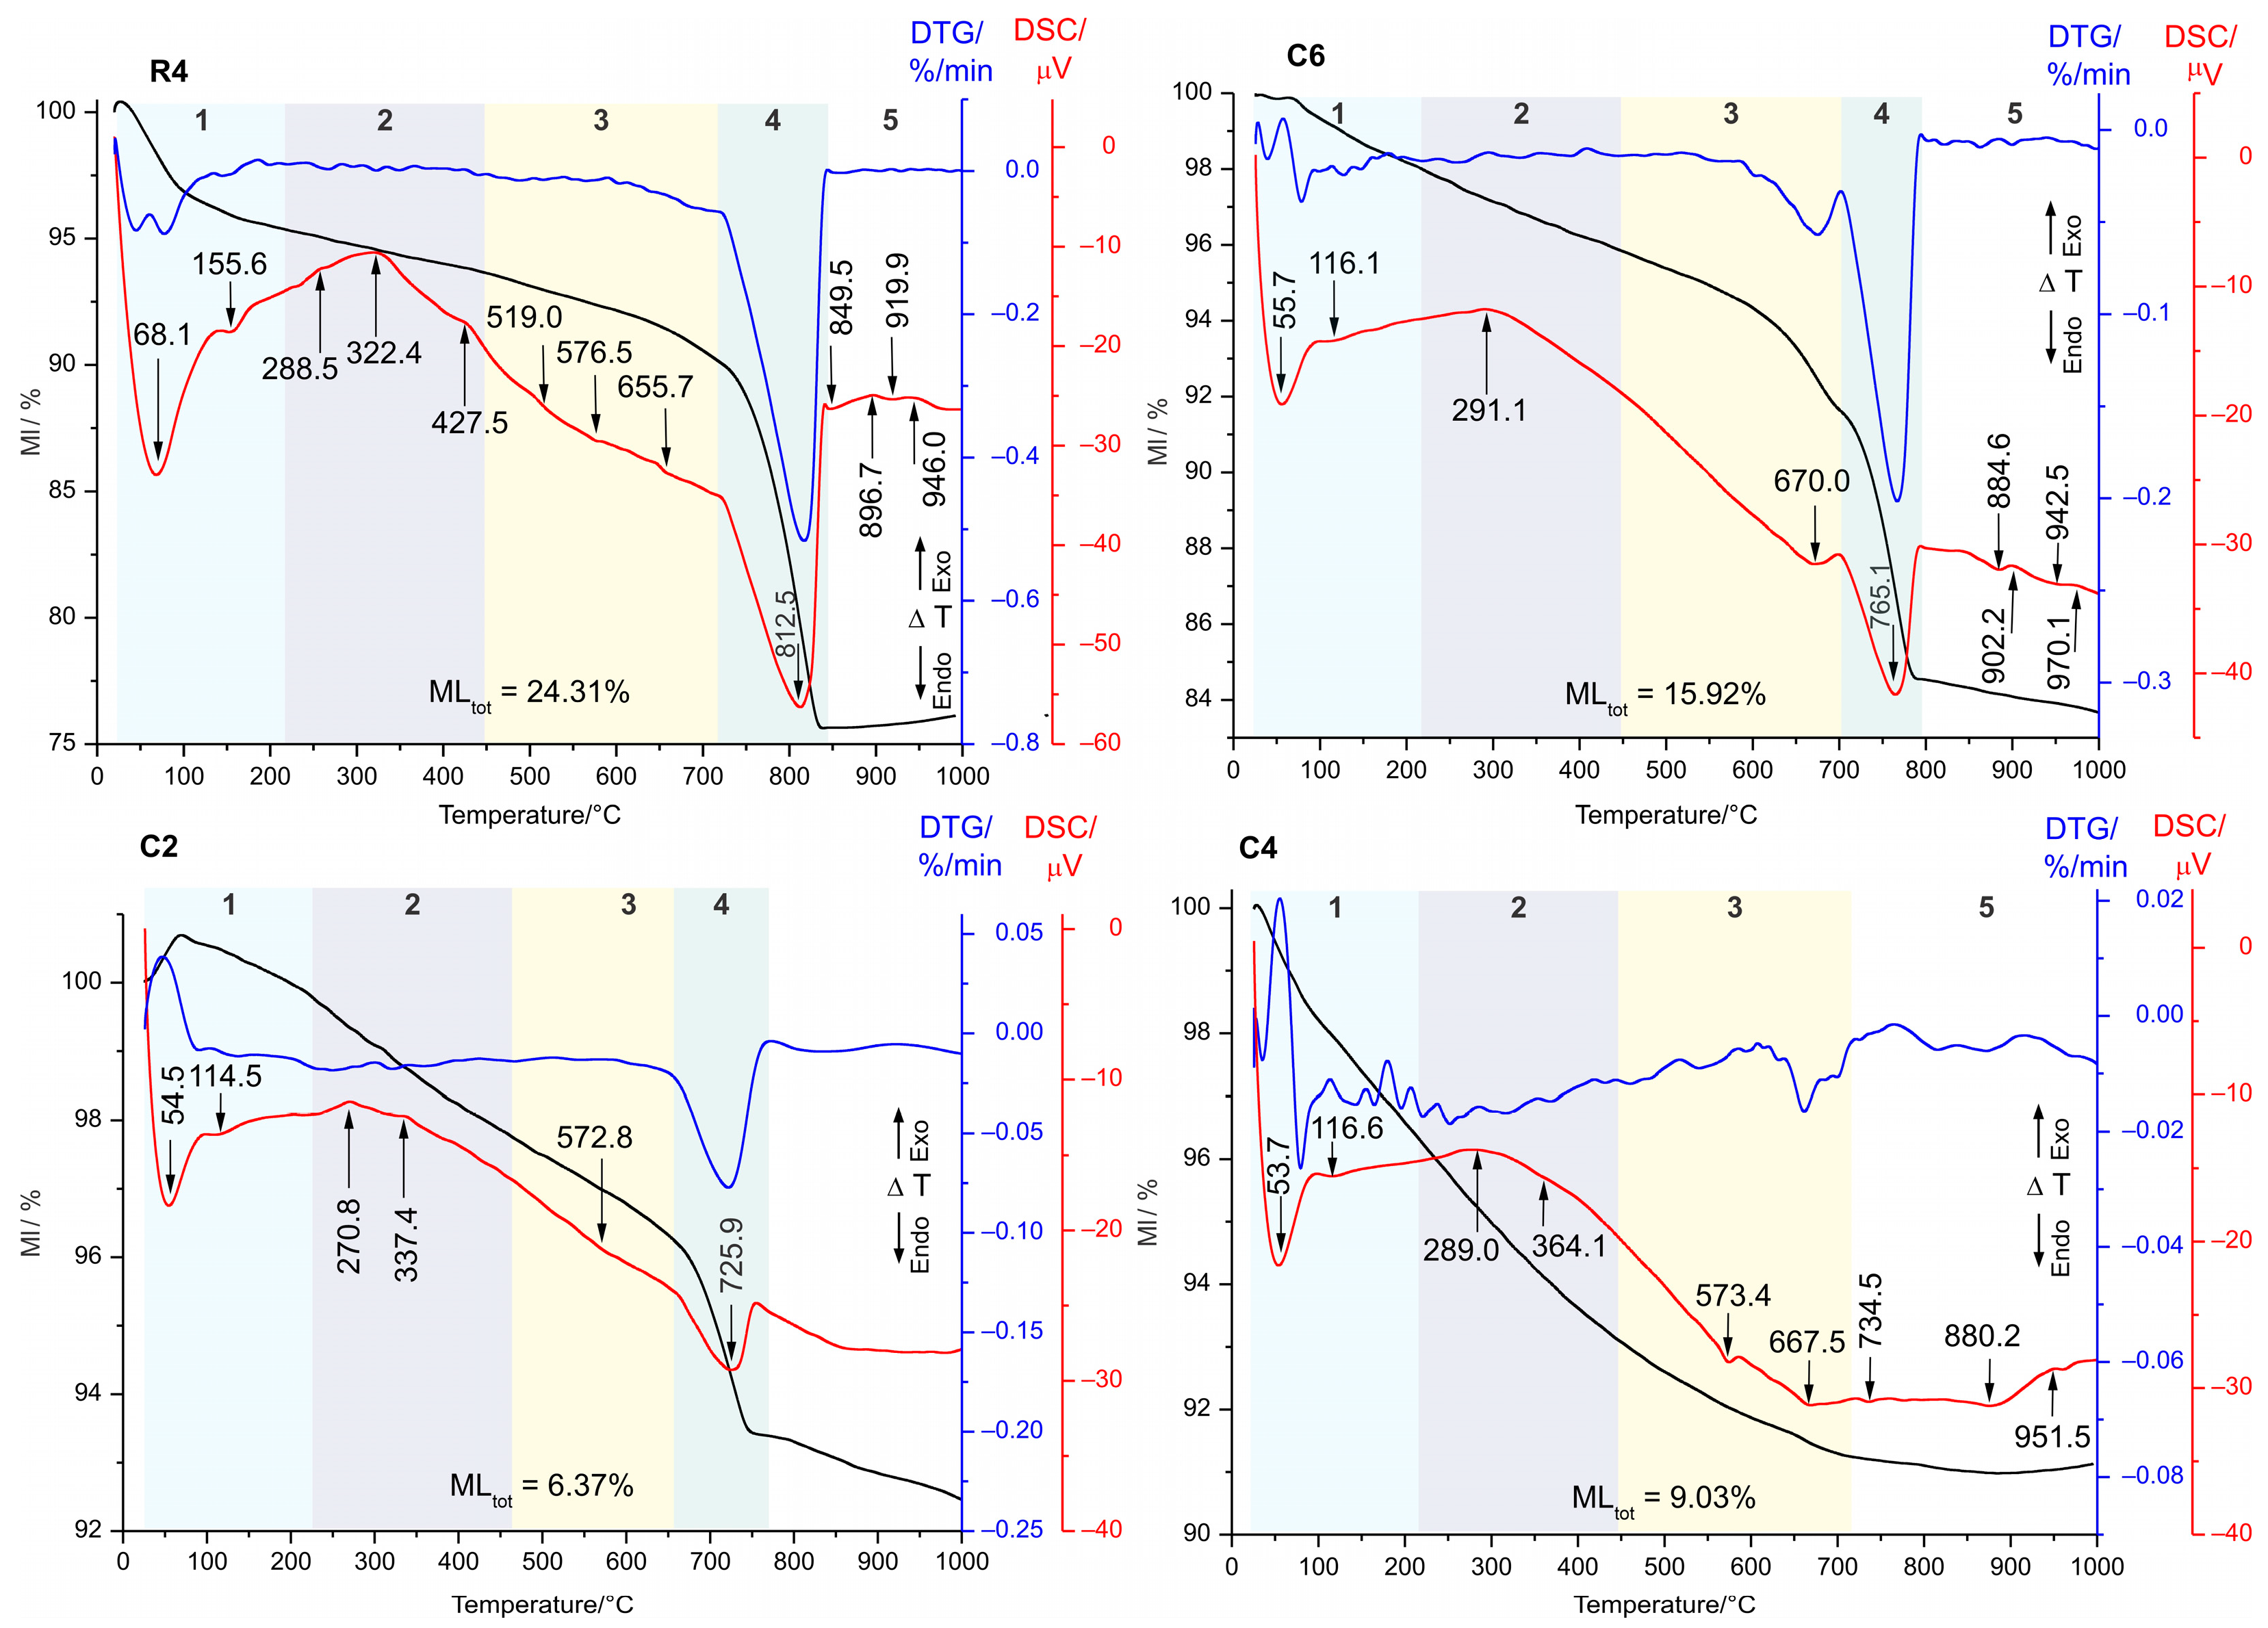
4.4. Thermal Analysis
5. Discussion
5.1. Clay Composition
5.2. Ceramic Provenance
5.3. Equivalent Firing Temperature of Ceramic
5.4. Archaeological Importance
6. Conclusions
- the origin and production technology of fragments C3 and C4;
- opportunities for raw material extraction from locations remote from the sites, controlled both by the ability to transport the extracted clay and by restrictions on land ownership;
- the technology of pottery production in ceramic centers and workshops (raw material and firing conditions) in the Roman and earlier eras in this region;
- relationships between different production centers—possibility of knowledge continuity, trade relations, etc.;
- the possibility of comparing the production in the region with that of other ceramic centers in Bulgaria.
Author Contributions
Funding
Data Availability Statement
Acknowledgments
Conflicts of Interest
Abbreviations
| RT | room temperature |
| XRF | X-ray fluorescence |
| CA | cluster analysis |
| PXRD | powder X-ray diffraction |
| TG | thermogravimetric |
| DTG | differential thermogravimetric |
| DSC | differential scanning calorimetry |
References
- Goffer, Z. Archaeological Chemistry, 2nd ed.; Chemical Analysis; Wiley-Interscience: Hoboken, NJ, USA, 2007. [Google Scholar] [CrossRef]
- Barker, D.; Majewski, T. Ceramic Studies in Historical Archaeology. In The Cambridge Companion to Historical Archaeology; Hicks, D., Beaudry, M.C., Eds.; Cambridge University Press: Cambridge, UK, 2006; pp. 205–232. [Google Scholar] [CrossRef]
- Orser, C.E. Ceramics as Dating Tool in Historical Archaeology. In Encyclopedia of Global Archaeology; Smith, C., Ed.; Springer: New York, NY, USA, 2014; pp. 1291–1292. [Google Scholar] [CrossRef]
- Sánchez Ramos, S.; Bosch Reig, F.; Gimeno Adelantado, J.; Yusá Marco, D.; Doménech Carbó, A. Application of XRF, XRD, Thermal Analysis, and Voltammetric Techniques to the Study of Ancient Ceramics. Anal. Bioanal. Chem. 2002, 373, 893–900. [Google Scholar] [CrossRef] [PubMed]
- Liritzis, I.; Xanthopoulou, V.; Palamara, E.; Papageorgiou, I.; Iliopoulos, I.; Zacharias, N.; Vafiadou, A.; Karydas, A.G. Characterization and Provenance of Ceramic Artifacts and Local Clays from Late Mycenaean Kastrouli (Greece) by Means of p-XRF Screening and Statistical Analysis. J. Cult. Herit. 2020, 46, 61–81. [Google Scholar] [CrossRef]
- Cultrone, G.; Rodriguez-Navarro, C.; Sebastian, E.; Cazalla, O.; De La Torre, M.J. Carbonate and Silicate Phase Reactions during Ceramic Firing. Eur. J. Mineral. 2001, 13, 621–634. [Google Scholar] [CrossRef]
- Liritzis, I.; Laskaris, N.; Vafiadou, A.; Karapanagiotis, I.; Volonakis, P.; Papageorgopoulou, C.; Bratitsi, M. Archaeometry: An overview. Sci. Cult. 2020, 6, 49. [Google Scholar] [CrossRef]
- Harizanov, A. Ceramic Kilns in the Territory of Modern Bulgaria from the 1st to the 6th Century AD. Ph.D. Thesis, National Archaeological Institute with Museum—BAS, Sofia, Bulgaria, 2019; p. 15. [Google Scholar]
- Aladzhov, A.; Dimitrov, Y. Archaeological field survey along the Hemus highway, stages 2 and 3, sections 7 and 8, km 276–327. In Archaeological Discoveries and Excavations 2015; National Archaeological Institute with Museum at the Bulgarian Academy of Sciences (NAIM-BAS): Sofia, Bulgaria, 2016; pp. 837–839. [Google Scholar]
- Todorova, S.; Lalov, C. Rescue archaeological investigations at site 83 near Makariopolsko village, Targovishte region. In Archaeological Discoveries and Excavations 2024; National Archaeological Institute with Museum at the Bulgarian Academy of Sciences (NAIM-BAS): Sofia, Bulgaria, in press.
- Klenina, E.Û. Stolovaâ i Kuhonnaâ Keramika III–VI Vekov iz Nov (Severnaâ Bolgariâ); Novae: Studies and Materials; Instytut Historii Uniwersytetu im. A. Mickiewicza: Sevastopol: Poznań, Poland, 2006. [Google Scholar]
- Philipov, L.; Decheva, A. Geological Maps of Bulgaria, M 1:100,000, Map Sheet Razgrad. M 1:100,000; Geology and Geophysics AD: Sofia, Bulgaria, 1992. [Google Scholar]
- Philipov, L.; Decheva, A. Explanatory Note to the Geological Map of Bulgaria M 1:100,000. Map Sheet Razgrad; Bolid: Sofia, Bulgaria, 1994. [Google Scholar]
- Borisova-Katsarova, I. Handmade Roman pottery—Questions unasked and answers unsought. Stud. Archaeol. Univ. Serdicensis 2021, 7, 153–177. [Google Scholar]
- Peacock, D.P.S. Pottery in the Roman World: An Ethnoarchaeological Approach; Longman Archaeology Series; Longman: London, UK; New York, NY, USA, 1982. [Google Scholar]
- Cardiano, P.; Ioppolo, S.; De Stefano, C.; Pettignano, A.; Sergi, S.; Piraino, P. Study and Characterization of the Ancient Bricks of Monastery of “San Filippo Di Fragalà” in Frazzanò (Sicily). Anal. Chim. Acta 2004, 519, 103–111. [Google Scholar] [CrossRef]
- Martin, A.; Inoue, H.; Yamada, Y.; Kohno, H. Standardless XRF Analysis for LOI-Rich Rock Samples by Scatter Fundamental Parameter Method. Geochim. Cosmochim. Acta Suppl. 2005, 69, A796. Available online: https://goldschmidtabstracts.info/2005/796.pdf (accessed on 12 March 2025).
- Kenkel, J. Analytical Chemistry for Technicians, 4th ed.; Taylor & Francis: London, UK, 2014. [Google Scholar]
- King, B.; Vivit, D. Loss-on-ignition Corrections in the XRF Analysis of Silicate Rocks. X-Ray Spectrom. 1988, 17, 145–147. [Google Scholar] [CrossRef]
- Shaltout, A.A.; Gomma, M.M.; Ali-Bik, M.W. Utilization of Standardless Analysis Algorithms Using WDXRF and XRD for Egyptian Iron Ore Identification. X-Ray Spectrom. 2012, 41, 355–362. [Google Scholar] [CrossRef]
- Pillay, A.E.; Punyadeera, C.; Jacobson, L.; Eriksen, J. Analysis of Ancient Pottery and Ceramic Objects Using X-Ray Fluorescence Spectrometry. X-Ray Spectrom. 2000, 29, 53–62. [Google Scholar] [CrossRef]
- Papageorgiou, I. Ceramic Investigation: How to Perform Statistical Analyses. Archaeol. Anthropol. Sci. 2020, 12, 210. [Google Scholar] [CrossRef]
- Rahman, M.S.; Metselaar, H.S.C.; Bushroa, A.R. XRF Data-Based Statistical Clustering of Ancient Ceramic Artifacts and Analysing Provenance with Thermo-Mineralogical Analysis. Spectrochim. Acta Part B At. Spectrosc. 2025, 224, 107090. [Google Scholar] [CrossRef]
- Liritzis, I.; Zacharias, N. Portable XRF of Archaeological Artifacts: Current Research, Potentials and Limitations. In X-Ray Fluorescence Spectrometry (XRF) in Geoarchaeology; Shackley, M.S., Ed.; Springer: New York, NY, USA, 2011; pp. 109–142. [Google Scholar] [CrossRef]
- Kabekkodu, S.; Dosen, A.; Blanton, T. PDF (Powder Diffraction File); ICDD: Newtown Square, PA, USA, 2001. [Google Scholar]
- Xanthopoulou, V.; Iliopoulos, I.; Liritzis, I. Characterization techniques of clays for the archaeometric study of ancient ceramics: A review. Sci. Cult. 2020, 6, 73–86. [Google Scholar] [CrossRef]
- Bergaya, F. Handbook of Clay Science, 1st ed.; Developments in Clay Science; Elsevier: Amsterdam, The Netherlands; Heidelberg, Germany, 2008. [Google Scholar]
- Ion, R.-M.; Ion, M.-L.; Fierascu, R.C.; Serban, S.; Dumitriu, I.; Radovici, C.; Bauman, I.; Cosulet, S.; Niculescu, V.I.R. Thermal Analysis of Romanian Ancient Ceramics. J. Therm. Anal. Calorim. 2010, 102, 393–398. [Google Scholar] [CrossRef]
- Brown, M.E.; Gallagher, P.K. Handbook of Thermal Analysis and Calorimetry. Vol. 2: Applications to Inorganic and Miscellaneous Materials; Elsevier: Amsterdam, The Netherlands, 2004. [Google Scholar]
- Meyers, K.S.; Speyer, R.F. Thermal analysis of clays. In Handbook of Thermal Analysis and Calorimetry. 2. Applications to Inorganic and Miscellaneous Materials; Brown, M.E., Gallacher, P.K., Eds.; Elsevier: Amsterdam, The Netherlands, 2004. [Google Scholar]
- Földvári, M. Handbook of Thermogravimetric System of Minerals and Its Use in Geological Practice; Occasional papers of the Geological Institute of Hungary; Geological Institute of Hungary: Budapest, Hungary, 2011. [Google Scholar]
- Palanivel, R.; Kumar, U.R. Thermal and Spectroscopic Analysis of Ancient Potteries. Rom. J. Phys. 2011, 56, 195–208. [Google Scholar]
- Labus, M.; Matyasik, I.; Ziemianin, K. Thermal Decomposition Processes in Relation to the Type of Organic Matter, Mineral and Maceral Composition of Menilite Shales. Energies 2023, 16, 4500. [Google Scholar] [CrossRef]
- Xue, H.; Dong, X.; Fan, Y.; Ma, X.; Yao, S. Study of Structural Transformation and Chemical Reactivity of Kaolinite-Based High Ash Slime during Calcination. Minerals 2023, 13, 466. [Google Scholar] [CrossRef]
- Marsh, A.; Heath, A.; Patureau, P.; Evernden, M.; Walker, P. Alkali Activation Behaviour of Un-Calcined Montmorillonite and Illite Clay Minerals. Appl. Clay Sci. 2018, 166, 250–261. [Google Scholar] [CrossRef]
- Hatakeyama, T.; Liu, Z. Handbook of Thermal Analysis; Wiley: Chichester, UK, 2000. [Google Scholar]
- Pei, Z.; Lin, M.; Liu, Y.; Lei, S. Dissolution Behaviors of Trace Muscovite during Pressure Leaching of Hydrothermal Vein Quartz Using H2SO4 and NH4Cl as Leaching Agents. Minerals 2018, 8, 60. [Google Scholar] [CrossRef]
- Kotryová, B.; Ondruška, J.; Štubňa, I.; Bačík, P. Thermoanalytical Investigation of Ancient Pottery. AIP Conf. Proc. 2016, 1752, 040016. [Google Scholar] [CrossRef]
- Hamilton, A.; Hall, C. A Review of Rehydroxylation in Fired-Clay Ceramics. J. Am. Ceram. Soc. 2012, 95, 2673–2678. [Google Scholar] [CrossRef]
- Muller, F.; Drits, V.; Plançon, A.; Robert, J.-L. Structural Transformation of 2:1 Dioctahedral Layer Silicates during Dehydroxylation-Rehydroxylation Reactions. Clays Clay Miner. 2000, 48, 572–585. [Google Scholar] [CrossRef]
- Moropoulou, A.; Bakolas, A.; Bisbikou, K. Characterization of Ancient, Byzantine and Later Historic Mortars by Thermal and X-Ray Diffraction Techniques. Thermochim. Acta 1995, 269–270, 779–795. [Google Scholar] [CrossRef]
- Böke, H.; Akkurt, S.; İpekoğlu, B.; Uğurlu, E. Characteristics of Brick Used as Aggregate in Historic Brick-Lime Mortars and Plasters. Cem. Concr. Res. 2006, 36, 1115–1122. [Google Scholar] [CrossRef]
- Lee, W.E.; Souza, G.P.; McConville, C.J.; Tarvornpanich, T.; Iqbal, Y. Mullite Formation in Clays and Clay-Derived Vitreous Ceramics. J. Eur. Ceram. Soc. 2008, 28, 465–471. [Google Scholar] [CrossRef]
- Pérez-Monserrat, E.M.; Maritan, L.; Garbin, E.; Cultrone, G. Production Technologies of Ancient Bricks from Padua, Italy: Changing Colors and Resistance over Time. Minerals 2021, 11, 744. [Google Scholar] [CrossRef]
- Derkowski, A.; Kuligiewicz, A. Thermal Analysis and Thermal Reactions of Smectites: A Review of Methodology, Mechanisms, and Kinetics. Clays Clay Miner. 2022, 70, 946–972. [Google Scholar] [CrossRef]
- Camara, C.A.; Lopes, G.; Schiavon, N.; Mirão, J.; Beltrame, M. Islamic Middle Ages Pottery from Muge (Portugal), Serradinho Archaeological Site—A Long-Lasting Tradition of Pottery Production. Ceramics 2025, 8, 31. [Google Scholar] [CrossRef]
- Chamley, H. Clay Sedimentology; Springer: Berlin/Heidelberg, Germany, 1989. [Google Scholar] [CrossRef]
- Papadopoulou, D.N.; Lalia-Kantouri, M.; Kantiranis, N.; Stratis, J.A. Thermal and Mineralogical Contribution to the Ancient Ceramics and Natural Clays Characterization. J. Therm. Anal. Calorim. 2006, 84, 39–45. [Google Scholar] [CrossRef]
- Trindade, M.; Dias, M.; Coroado, J.; Rocha, F. Mineralogical Transformations of Calcareous Rich Clays with Firing: A Comparative Study between Calcite and Dolomite Rich Clays from Algarve, Portugal. Appl. Clay Sci. 2009, 42, 345–355. [Google Scholar] [CrossRef]
- Badica, P.; Alexandru-Dinu, A.; Grigoroscuta, M.A.; Burdusel, M.; Aldica, G.V.; Sandu, V.; Bartha, C.; Polosan, S.; Galatanu, A.; Kuncser, V.; et al. Mud and Burnt Roman Bricks from Romula. Sci. Rep. 2022, 12, 15864. [Google Scholar] [CrossRef] [PubMed]
- Khitab, A.; Riaz, M.S.; Jalil, A.; Khan, R.B.N.; Anwar, W.; Khan, R.A.; Arshad, M.T.; Kirgiz, M.S.; Tariq, Z.; Tayyab, S. Manufacturing of Clayey Bricks by Synergistic Use of Waste Brick and Ceramic Powders as Partial Replacement of Clay. Sustainability 2021, 13, 10214. [Google Scholar] [CrossRef]
- El Ouahabi, M.; Daoudi, L.; Hatert, F.; Fagel, N. Modified Mineral Phases During Clay Ceramic Firing. Clays Clay Miner. 2015, 63, 404–413. [Google Scholar] [CrossRef]
- Maniatis, Y.; Tite, M.S. Technological Examination of Neolithic-Bronze Age Pottery from Central and Southeast Europe and from the Near East. J. Archaeol. Sci. 1981, 8, 59–76. [Google Scholar] [CrossRef]
- Kostova, B.; Dumanov, B.; Mihaylova, K. Archaeological bricks and tiles from southeast Bulgaria- determination of raw material and production technology by chemical, phase, and thermal analyses. Mediterr. Archaeol. Archaeom. 2023, 23, 1–22. [Google Scholar] [CrossRef]
- Kostova, B.; Mihaylova, K.; Dumanov, B.; Berberova, R. Archaeometric study of pithoi from Bulgarian archaeological sites. Sci. Cult. 2024, 10, 57–76. [Google Scholar] [CrossRef]
- Pollard, A.M.; Heron, C. Archaeological Chemistry, 2nd ed.; Royal Society of Chemistry: Cambridge, UK, 2008. [Google Scholar]
- Bauer, A.; Velde, B.D. Geochemistry at the Earth’s Surface: Movement of Chemical Elements; Springer: Berlin/Heidelberg, Germany, 2014. [Google Scholar] [CrossRef]
- Kornilov, A.V. Reasons for the Different Effects of Calcareous Clays on Strength Properties of Ceramics. Glass Ceram. 2005, 62, 391–393. [Google Scholar] [CrossRef]
- Aras, A.; Kiliç, S. The Mineralogy and Firing Behaviour of Pottery Clays of the Lake Van Region, Eastern Turkey. Clay Miner. 2017, 52, 453–468. [Google Scholar] [CrossRef]
- Friede, H.; Hejja, A.; Koursaris, A. Arhaeo-metallurgical studies of iron smelting slags from prehistoric sites in Southern Africa. J. S. Afr. Inst. Min. Metall. 1982, 82, 38–48. [Google Scholar]
- Stevens, S.J.; Hand, R.J.; Sharp, J.H. Polymorphism of Silica. J. Mater. Sci. 1997, 32, 2929–2935. [Google Scholar] [CrossRef]
- Bitay, E.; Kacsó, I.; Tănăselia, C.; Toloman, D.; Borodi, G.; Pánczél, S.-P.; Kisfaludi-Bak, Z.; Veress, E. Spectroscopic Characterization of Iron Slags from the Archaeological Sites of Brâncoveneşti, Călugăreni and Vătava Located on the Mureş County (Romania) Sector of the Roman Limes. Appl. Sci. 2020, 10, 5373. [Google Scholar] [CrossRef]
- Traoré, K.; Kabré, T.S.; Blanchart, P. Gehlenite and Anorthite Crystallisation from Kaolinite and Calcite Mix. Ceram. Int. 2003, 29, 377–383. [Google Scholar] [CrossRef]
- Tarhan, İ.; Massa, M.; Tuna, Y.; Şahin, F. An Archaeometric Study of the Konya Basin Metallic Ware through FTIR and XRD Analysis with Chemometrics: Central Anatolian Early Bronze Age Ceramics. Archaeometry 2023, 65, 136–150. [Google Scholar] [CrossRef]
- Zvereva, I.A.; Kuznetsov, V.M.; Zhukov, Y.M.; Mazurkevich, A.N.; Dolbunova, E.V. Thermal Analysis and Multi-Analytical Comparison of Samples of Neolithic Ceramics from Dnepr–Dvina and Low Don Regions. J. Therm. Anal. Calorim. 2019, 138, 1879–1886. [Google Scholar] [CrossRef]
- Dimitrova-Milcheva, A. Luxury ceramic—Import and local production from Thrace and Moesia in the 1st–3rd centuries AD. In Archaeology of the Bulgarian Lands; Ivanov, R., Ed.; Bibliophilia: Ivray, Sofia, 2008; Volume 3, pp. 119–161. [Google Scholar]
- Hunt, A. (Ed.) The Oxford Handbook of Archaeological Ceramic Analysis, 1st ed.; Oxford University Press: Oxford, UK, 2016. [Google Scholar] [CrossRef]


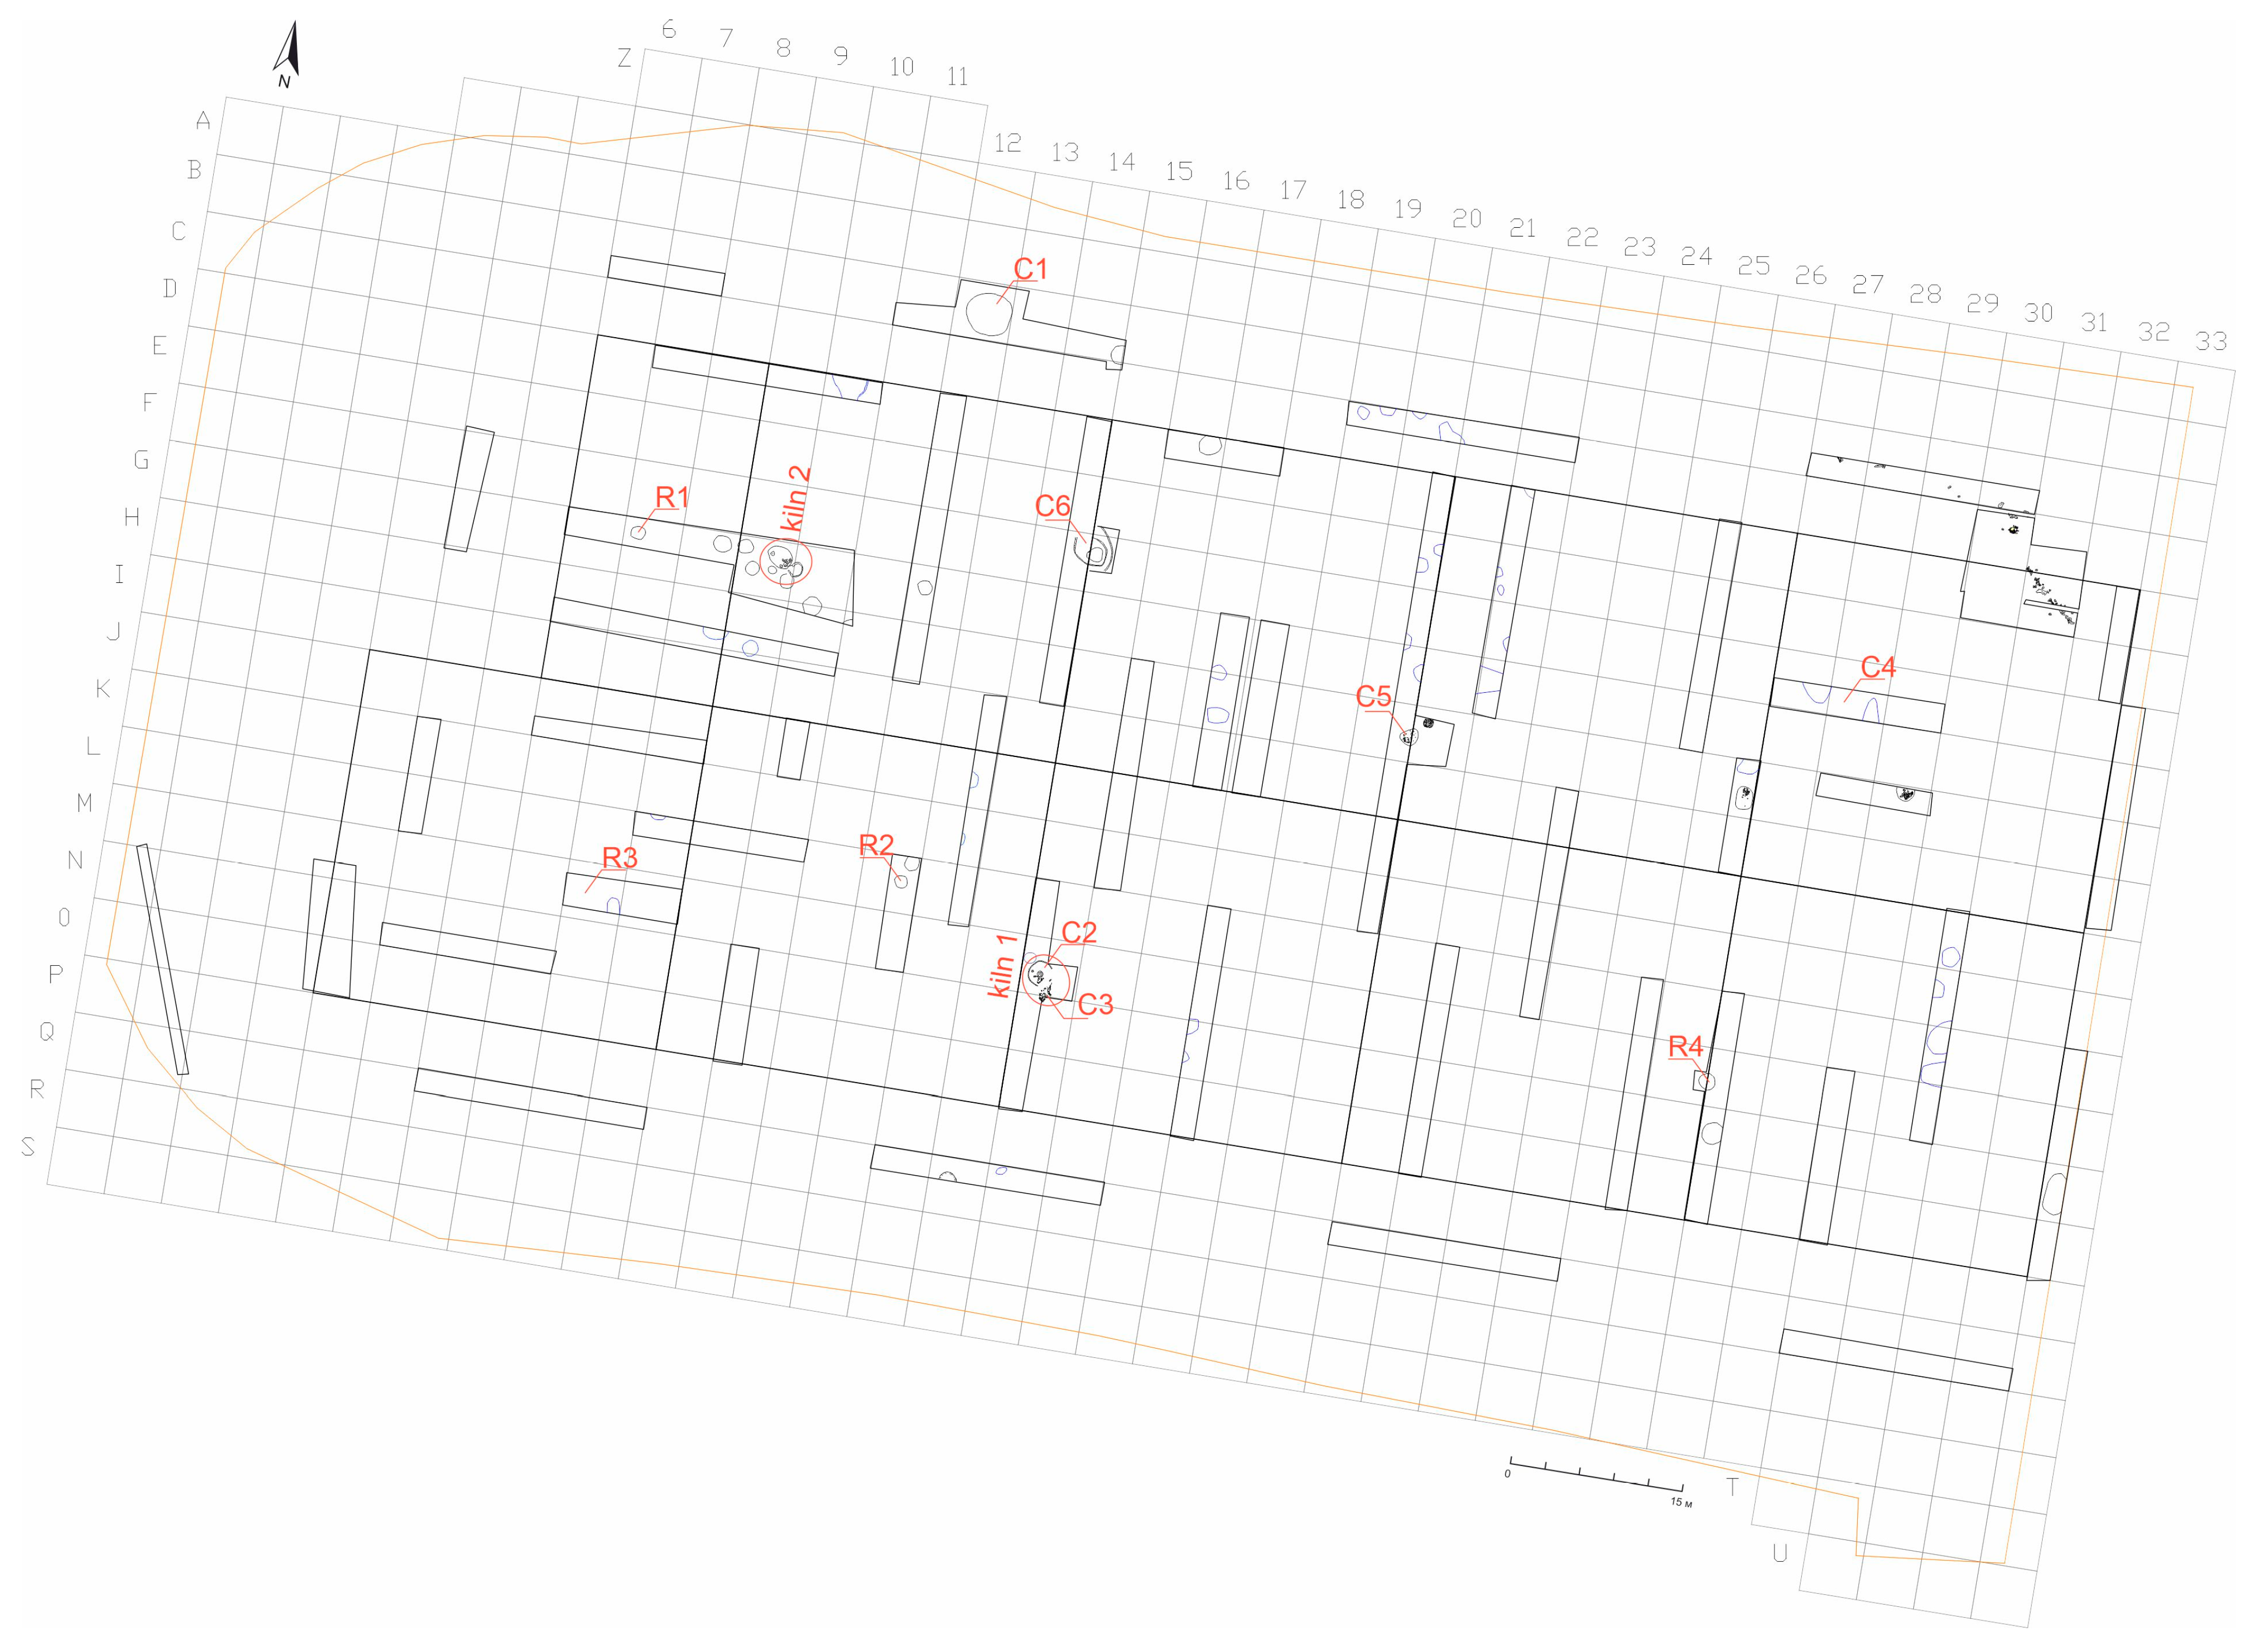
| Sample | Type | Location in the Archaeological Site |
|---|---|---|
| R1 | clay | archaeological sondage 12 |
| R2 | clay | archaeological sondage 18, |
| R3 | clay | archaeological sondage 21 |
| R4 | clay | archaeological sondage 30, structure 14 |
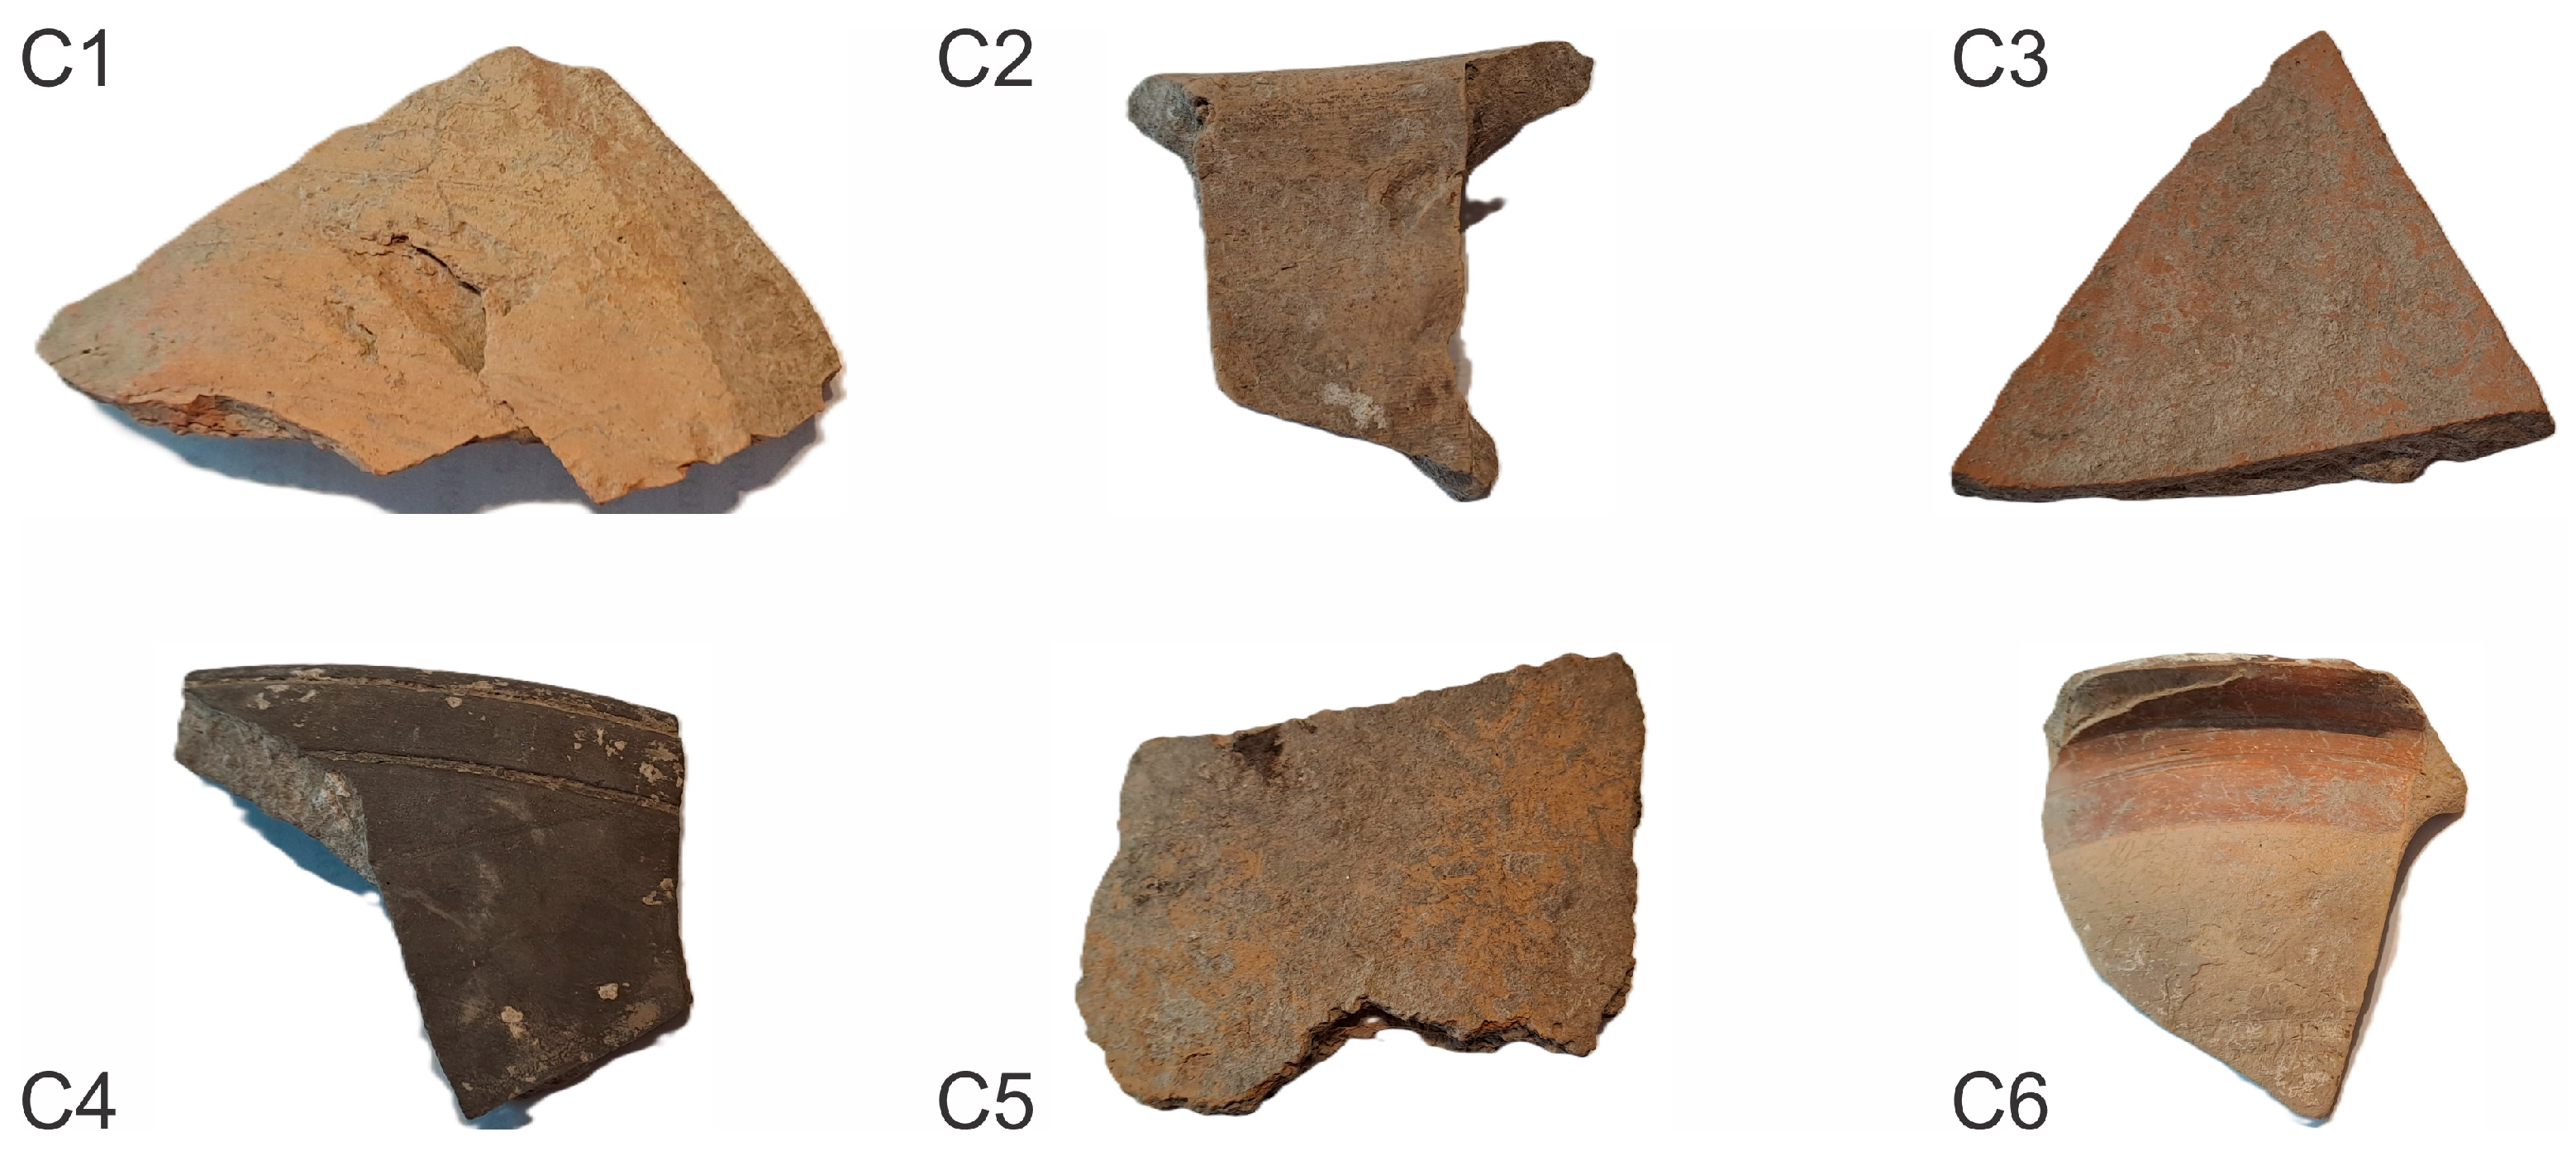
| C1 | amphora(?), fragment of a wall made on a wheel, beige–brown color of the surface, and paste | archaeological sondage 2, structure 1 |
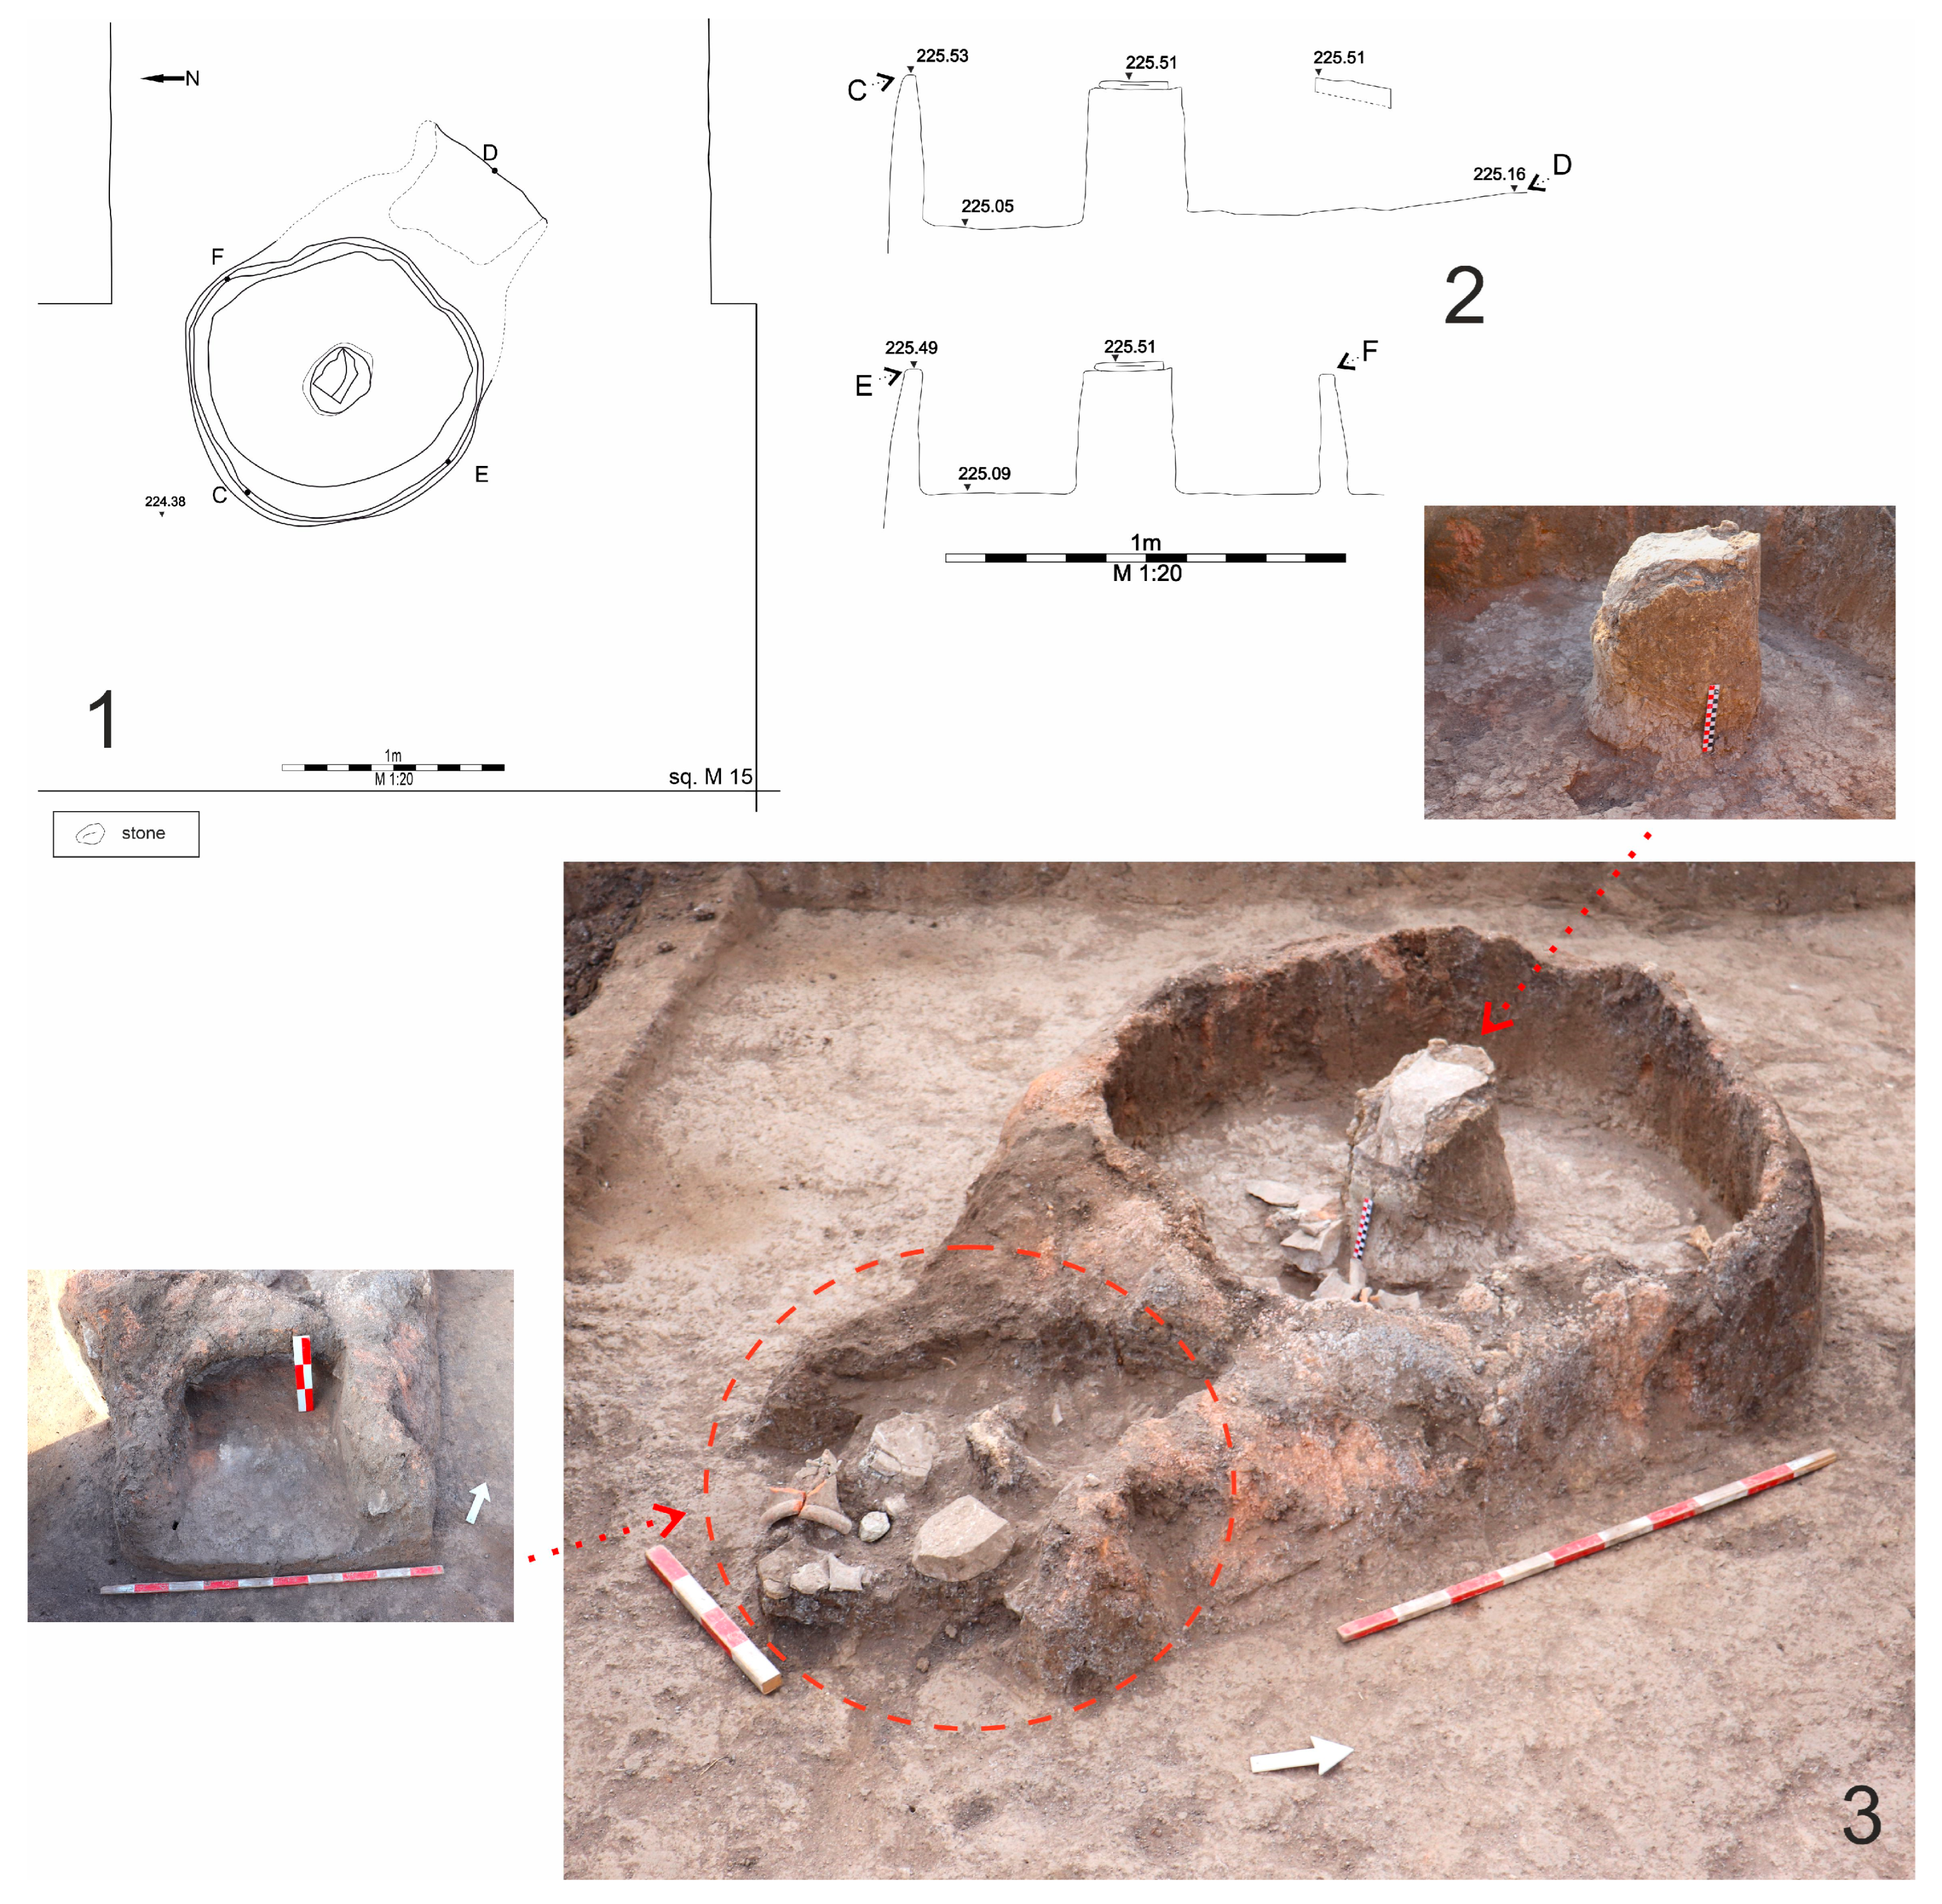
| C2 | vessel made on a wheel, beige color of the surface, and paste | archaeological sondage 24, structure 11, kiln 1 |
| C3 | fragment of a wall made on a wheel, red–brown color of the surface, and paste | archaeological sondage 24, structure 11—stoke pit—kiln 1) |
| C4 | greyware pottery—a bowl, orifice fragment, made on a wheel | archaeological sondage 30 |
| C5 | handmade pottery—pot(?) wall fragment, beige–brown surface and paste | archaeological sondage 36, structure 9 |
| C6 | bowl, orifice fragment, made on a wheel, beige–brown surface and fracture, red poor varnish on the outer surface | archaeological sondage 37, structure 12 |
| Chemical Composition | Sample | ||||||||||
|---|---|---|---|---|---|---|---|---|---|---|---|
| R1 | R2 | R3 | R4 | C1 | C2 | C3 | C4 | C5 | C6 | ||
| Main elements (oxide/wt%) | SiO2 | 24.02 | 34.98 | 23.51 | 32.51 | 42.52 | 44.30 | 59.95 | 57.05 | 41.42 | 35.83 |
| Al2O3 | 6.45 | 10.17 | 6.42 | 9.01 | 16.59 | 16.91 | 17.50 | 18.16 | 13.20 | 13.56 | |
| CaO | 34.37 | 21.57 | 30.11 | 27.50 | 16.23 | 21.24 | 4.46 | 2.31 | 13.83 | 24.48 | |
| MgO | 1.23 | 2.14 | 1.48 | 1.39 | 2.30 | 2.48 | 1.71 | 1.54 | 1.64 | 1.90 | |
| K2O | 1.37 | 2.28 | 1.44 | 1.93 | 4.07 | 2.54 | 4.38 | 3.65 | 2.70 | 3.05 | |
| Na2O | - | - | 1.15 | - | - | - | - | - | - | - | |
| Fe2O3 | 2.91 | 4.83 | 2.73 | 3.96 | 7.57 | 7.52 | 6.59 | 7.79 | 5.76 | 5.56 | |
| TiO2 | 0.38 | 0.70 | 0.33 | 0.56 | 0.86 | 0.91 | 0.88 | 0.93 | 0.71 | 0.70 | |
| LOI | 29.13 | 22.95 | 32.64 | 22.96 | 9.34 | 3.90 | 4.39 | 8.28 | 20.49 | 14.70 | |
| Total | 99.87 | 99.63 | 99.81 | 99.83 | 99.48 | 99.79 | 99.86 | 99.71 | 99.77 | 99.79 | |
| Rare elements (elements/ppm) | V | - | 172.64 | - | - | - | - | - | 28.26 | - | - |
| Cr | - | - | - | 195.56 | - | - | - | - | 155.04 | 181.51 | |
| Mn | 374.87 | 775.73 | 299.96 | 490.44 | 758.29 | 636.34 | 585.70 | 1086.81 | 788.19 | 766.31 | |
| Ni | - | - | - | - | 87.63 | 98.93 | - | 98.75 | - | - | |
| Cu | 87.19 | 120.03 | - | 81.24 | 130.37 | 145.10 | 134.43 | 113.57 | 130.21 | - | |
| Zn | - | 136.38 | 92.28 | - | 199.45 | 186.43 | 135.77 | 191.69 | 139.94 | 181.69 | |
| Rb | - | 115.55 | 76.38 | 94.40 | 198.13 | 181.90 | 177.48 | 165.22 | 101.06 | 131.04 | |
| Sr | 623.24 | 350.52 | 649.34 | 601.29 | 551.96 | 682.60 | 206.16 | 163.65 | 356.34 | 591.46 | |
| Zr | 31.48 | 196.79 | - | 56.46 | 80.54 | 112.41 | 217.30 | 412.84 | 205.43 | 102.30 | |
| Origin | Mineral/Phase | General Formula * | Reference [25] |
|---|---|---|---|
| Raw minerals | quartz | SiO2 | #06-175 |
| kaolinite | Al2Si2O5(OH)4 | #29-1488 | |
| illite | (Si4−xAlx)4(Al2−yMgy)4O10(OH)2(x + y)K+ | #02-0056 | |
| muscovite | (Si3Al)4(Al2)6O10(OH)2K+ | #34-0175 | |
| chlorite | (R2+,R3+)3(Si4−xAlx)O10(OH)2 (R2+ = Mg2+,Fe2+,Mn2+; R3+ = Al3+,Fe3+,Cr3+) | #83-1381 | |
| Raw and recrystallized mineral | calcite | CaCO3 | #06-6528 |
| Raw mineral and new-formed high-temperature phase (?) | anorthite | Ca(Al2Si2O8) | #41-1486 |
| New-formed high-temperature phases | gehlenite | Ca2Al2SiO7 | #04-016-0209 |
| akermanite | Ca2Mg[Si2O7] | #35-0592 |
| Sample | Tinfl Calcite/ T°C | MLCO2/ % | CaOcalcite/wt% Calculated | CaOtotal/wt% Measured | CaOsilicates/amorphous wt% Calculated | Calcite/% Calculated |
|---|---|---|---|---|---|---|
| R1 | 815.2 | 21.47 | 27.32 | 34.37 | 7.05 | 48.63 |
| R2 | 793.5 | 10.42 | 13.26 | 21.57 | 8.31 | 23.60 |
| R3 | 812.5 | 19.48 | 27.79 | 30.11 | 2.32 | 49.47 |
| R4 | 816.5 | 14.53 | 18.49 | 27.50 | 9.01 | 32.91 |
| C1 | 712.7 | 2.40 | 3.05 | 16.23 | 13.18 | 5.43 |
| C2 | 728.9 | 1.53 | 1.94 | 21.24 | 19.03 | 3.45 |
| C3 | 701.1 | 0.65 | 1.45 | 4.46 | 3.01 | 1.45 |
| C4 | - | - | - | 2.31 | 2.31 | - |
| C5 | 787.8 | 3.96 | 5.04 | 13.83 | 8.79 | 8.97 |
| C6 | 766.5 | 7.06 | 8.98 | 24.48 | 15.50 | 15.98 |
Disclaimer/Publisher’s Note: The statements, opinions and data contained in all publications are solely those of the individual author(s) and contributor(s) and not of MDPI and/or the editor(s). MDPI and/or the editor(s) disclaim responsibility for any injury to people or property resulting from any ideas, methods, instructions or products referred to in the content. |
© 2025 by the authors. Licensee MDPI, Basel, Switzerland. This article is an open access article distributed under the terms and conditions of the Creative Commons Attribution (CC BY) license (https://creativecommons.org/licenses/by/4.0/).
Share and Cite
Kostova, B.; Todorova, S.; Mihaylova, K.; Lalov, C.; Berberova, R. A Provenance Study of Ceramic Artifacts from the Area of Makariopolsko Village, NE Bulgaria. Geosciences 2025, 15, 193. https://doi.org/10.3390/geosciences15060193
Kostova B, Todorova S, Mihaylova K, Lalov C, Berberova R. A Provenance Study of Ceramic Artifacts from the Area of Makariopolsko Village, NE Bulgaria. Geosciences. 2025; 15(6):193. https://doi.org/10.3390/geosciences15060193
Chicago/Turabian StyleKostova, Bilyana, Svetlana Todorova, Katerina Mihaylova, Chavdar Lalov, and Ralitza Berberova. 2025. "A Provenance Study of Ceramic Artifacts from the Area of Makariopolsko Village, NE Bulgaria" Geosciences 15, no. 6: 193. https://doi.org/10.3390/geosciences15060193
APA StyleKostova, B., Todorova, S., Mihaylova, K., Lalov, C., & Berberova, R. (2025). A Provenance Study of Ceramic Artifacts from the Area of Makariopolsko Village, NE Bulgaria. Geosciences, 15(6), 193. https://doi.org/10.3390/geosciences15060193