Article

Advancing the Prediction and Evaluation of Blast-Induced Ground Vibration Using Deep Ensemble Learning with Uncertainty Assessment

by
Sinem Bozkurt Keser
1,
Mahmut Yavuz
2 and
Gamze Erdogan Erten
3,*
1
Department of Computer Engineering, Eskisehir Osmangazi University, Eskisehir 26040, Türkiye
2
Department of Mining Engineering, Eskisehir Osmangazi University, Eskisehir 26040, Türkiye
3
Department of Civil and Environmental Engineering, University of Alberta, 921–116 Street NW, Edmonton, AB T6G 1H9, Canada
*
Author to whom correspondence should be addressed.
Geosciences 2025, 15(5), 182; https://doi.org/10.3390/geosciences15050182
Submission received: 4 March 2025 / Revised: 11 May 2025 / Accepted: 13 May 2025 / Published: 19 May 2025

Abstract

:
Ground vibration is one of the most dangerous environmental problems associated with blasting operations in mining. Therefore, accurate prediction and controlling the blast-induced ground vibration are imperative for environmental protection and sustainable development. The empirical approaches give inaccurate results, as evident in the literature. Hence, numerous researchers have started to use fast-growing soft computing approaches that are satisfying in prediction performance. However, achieving high-prediction performance and detecting prediction uncertainty is crucial, especially in blasting operations. This study aims to propose a deep ensemble model to predict the blast-induced ground vibration and quantify the prediction uncertainty, which is usually not addressed. This study used 200 published data from ten granite quarry sites in Ibadan and Abeokuta areas, Nigeria. The empirical equation (United States Bureau of Mines-based approach) was applied for comparison. The comparison of the models demonstrated that the proposed deep ensemble model achieved superior performance, offering more accurate predictions and more reliable uncertainty quantification. Specifically, it exhibited the lowest root mean square error (22.674), negative log-likelihood (4.44), and mean prediction interval width (1.769), alongside the highest R 2   value (0.77) and prediction interval coverage probability (0.95). The deep ensemble model reached the desired coverage of 95%, demonstrating that uncertainty was not underestimated or overestimated.

1. Introduction

Blasting operation is a widely used technique to fragment hard rock in mining and construction activities. Although blasting ensures optimum rock breakage, it also generates several adverse side effects including dust emissions, toxic gases, air overpressure, fly rock, and most importantly, ground vibration [1,2,3,4]. Various studies on blasting operations have revealed that ground vibration is the most destructive result of blasting because it can damage neighboring buildings, roads, the ecology of the surrounding area, and groundwater [5,6,7,8]. From a mining production perspective, ground vibrations may damage the stability of benches and slopes and generate several back breaks in open-pit mines [8]. Although ground vibration is inevitable, it can be mitigated to an acceptable level through accurate prediction and control measures. The accurate prediction of the ground vibration is, therefore, crucial to reducing the adverse effects of the blasting operations as much as possible.
The ground vibration is generally recorded based on two factors: Peak Particle Velocity (PPV) and frequency. PPV is the primary parameter for quantifying ground vibration, typically estimated based on two critical factors: the distance from the blasting site (D) and the charge weight per delay (W) [9]. Several empirical equations have been developed to predict blast-induced PPV [10,11,12,13,14,15,16]. However, studies indicate that these equations often lack generalization capability and exhibit poor accuracy due to their site-specific nature [1,17,18,19]. To address the shortcomings of empirical equations, many researchers have employed soft computing (SC) methods to predict the blast-induced PPV with promising results. SC encompasses a set of computational techniques based on artificial intelligence principles that effectively address the complexities arising from nonlinear relationships among variables affecting PPV prediction. Various methods have been explored to enhance PPV prediction. Table 1 presents a comparative summary of previous studies focusing on the prediction of PPV using various SC methods.
Among the various machine learning (ML) approaches examined in the literature, ANNs and SVMs have been identified as the most commonly used methods due to their superior performance in predicting PPV [42]. Recently, the hyper-parameters of ML algorithms have been optimized using various metaheuristic algorithms, aiming to increase the prediction accuracy [43,44,45,46,47]. On the other hand, the use of deep learning for predicting blast-induced PPV has been gaining popularity in recent years. While SVMs and ANFIS have shown promising results, ANN-based models particularly stand out due to their strong predictive capabilities. For example, a deep neural network (DNN) was developed, and whale, Harris hawks, and particle swarm algorithms were used to optimize the DNN [48]. Results showed that the optimized DNN predicts blast-induced PPV with outstanding accuracy. However, these ANN and deep learning models typically focus on point predictions—providing only a single estimate per input—and are validated using standard statistical error measures, without quantifying the associated uncertainty (i.e., risk or confidence) of the prediction. In other words, these models do not capture how confident the model is confident in its prediction. Evaluating the efficacy and reliability of any artificial intelligence (AI) models before they can be implemented in practice is important because the predictions obtained from such models are subject to model inference errors and noise. Deep learning models are also regarded as black boxes, often yielding overconfident predictions—that is, they underestimate the true uncertainty of the prediction [49,50]. This is an unacceptable feature in risk-sensitive tasks such as blasting in mining operations. Therefore, the prediction uncertainty should be incorporated into the deterministic approximation generated by deep learning models to advance the reliability and credibility of the predictions.
Assessing the quality of predictive uncertainties is difficult as ground truth uncertainty is often not available. A variety of approaches have been proposed for understanding and quantifying uncertainty in a DNN’s prediction. Monte Carlo (MC) dropout [51] and ensemble methods are the most widely used types of uncertainty quantification in the literature [50]. MC dropout is a type of Bayesian approach and makes use of the dropout method to quantify predictive uncertainty. Originally, dropout was used as a regularization method at training time to solve overfitting problems. MC dropout uses it both at training and test time to provide randomness to the prediction process. The data are passed through the network multiple times, with different subsets of parameters being dropped randomly at each run. In the end, the outputs (i.e., a set of predictions) are averaged over the run to yield a predictive distribution in the target domain. While the MC dropout is a simple method, it is slow and requires more time and memory when integrated into a deep architecture [48]. The deep ensemble model, on the other hand, trains a number of different DNNs with randomly initialized parameters (i.e., weights and biases), adds adversarial training, and then combines the predictions from each network to obtain ensemble mean and variance (interpreted as uncertainty). Candidate networks have very different weight values from one another, and, as a result, they lead to diverse predictions, which yield a more accurate predictive distribution. This model has an important potential to make great uncertainty predictions while improving accuracy. Moreover, it is presented as well calibrated and well generalized in both in-distribution data (i.e., samples seen during training) and out-of-distribution data (i.e., new samples unseen during training) [49]. Thus, it would not be site-specific and could be used for approximating blast-induced PPV in each region with high accuracy. Moreover, the deep ensemble model is computationally more efficient than Bayesian-based approaches and tends to perform better in quantifying uncertainty in a variety of tasks in regression and classification [52].
Building on these approaches, this study employs a deep ensemble model to predict blast-induced PPV independently from the region while also quantifying prediction uncertainty. Our specific objectives are as follows:
  • Create a deep ensemble model that accurately predicts blast-induced PPV independent of regional characteristics and maintains high prediction accuracy across diverse quarry sites.
  • Integrate uncertainty quantification into blast-induced PPV estimation and quantitatively assess the uncertainty associated with the model’s predictions, addressing a notable gap in the literature.
  • Validate the performance of the proposed deep ensemble approach with conventional methods—such as the United States Bureau of Mines (USBM) empirical equation and a single DNN model—to verify the effectiveness of DNNs in this application.
  • Provide a robust predictive tool that contributes to engineering solutions aimed at mitigating the severe environmental and structural impacts caused by blasting operations.
To demonstrate and validate our approach, a case study involving ten quarry sites from Nigeria was conducted. It should be noted that although historical PPV data are used for training and evaluation, the primary objective is to develop a model that can predict PPV in future blasting operations using only the known input parameters (D and W).
The rest of the paper is structured as follows. Section 2 describes the materials and methods, including the empirical PPV model, the deep neural network architecture, the uncertainty quantification framework, and the deep ensemble approach. Section 3 presents the proposed deep ensemble model for blast-induced PPV prediction, detailing the dataset and the ensemble training procedure. Section 4 reports the results and discusses their implications. Finally, Section 5 offers the conclusions.

2. Materials and Methods

2.1. Empirical Model

Numerous researchers have developed a number of empirical equations to predict the blast-induced PPV. A literature review showed that the most common and widely applied empirical equation is the USBM [10]; thus, it was included in the present study to predict blast-induced PPV and is defined as follows:
P P V = k   D W β
where k and β are site constants and are defined from the multiple regression analysis. In this study, k = 3619.89 and β = 1.4704 were determined as the optimal values of the USBM empirical equation based on all data pairs for the site constants.
Several empirical PPV laws have been reported beyond the USBM scaled-distance expression (Equation (1)). In the Indian Standard formulation, the explosive charge is normalized by its cube-root, yielding P P V = k D / W 3 β ; this adjustment has been shown to improve PPV estimation for the geomechanical conditions commonly encountered in the Indian sub-continent [53]. The Ambraseys–Hendron relationship adopts half-power scaling of charge weight and permits a negative attenuation exponent, written here as P P V = k D / W 2 n , thereby offering additional flexibility when calibrating vibration data from tunnels and large quarry blasts [11]. The Langefors–Kihlström equation further refines near-field behavior by introducing an offset distance and combining square-root weight with a two-thirds distance exponent: P P V = k W 2 / D 2 / 3 β [12]. A generalized power form, P P V = k D / W m n , subsumes all of the above by allowing both exponents m and n to be fitted independently and is frequently adopted when extensive site characterization data are available [54]. These variants demonstrate how additional predictors—alternative charge-weight exponents, an offset distance, or freely calibrated decay constants—can refine vibration-attenuation trends when the necessary auxiliary measurements (e.g., the burden–spacing ratio, stemming length, rock-mass discontinuity frequency) are recorded. The USBM formulation has nevertheless been retained in the present study because (i) only the distance to the monitoring point and the maximum instantaneous charge are available in the field dataset, (ii) the USBM law remains the reference standard in international blasting guidelines and regulatory limits, and (iii) its simple scale-invariant structure aligns naturally with the proposed deep-ensemble framework, thereby allowing a clear demonstration of the method’s capability while leaving more elaborate models for future work once broader parameter records become accessible.

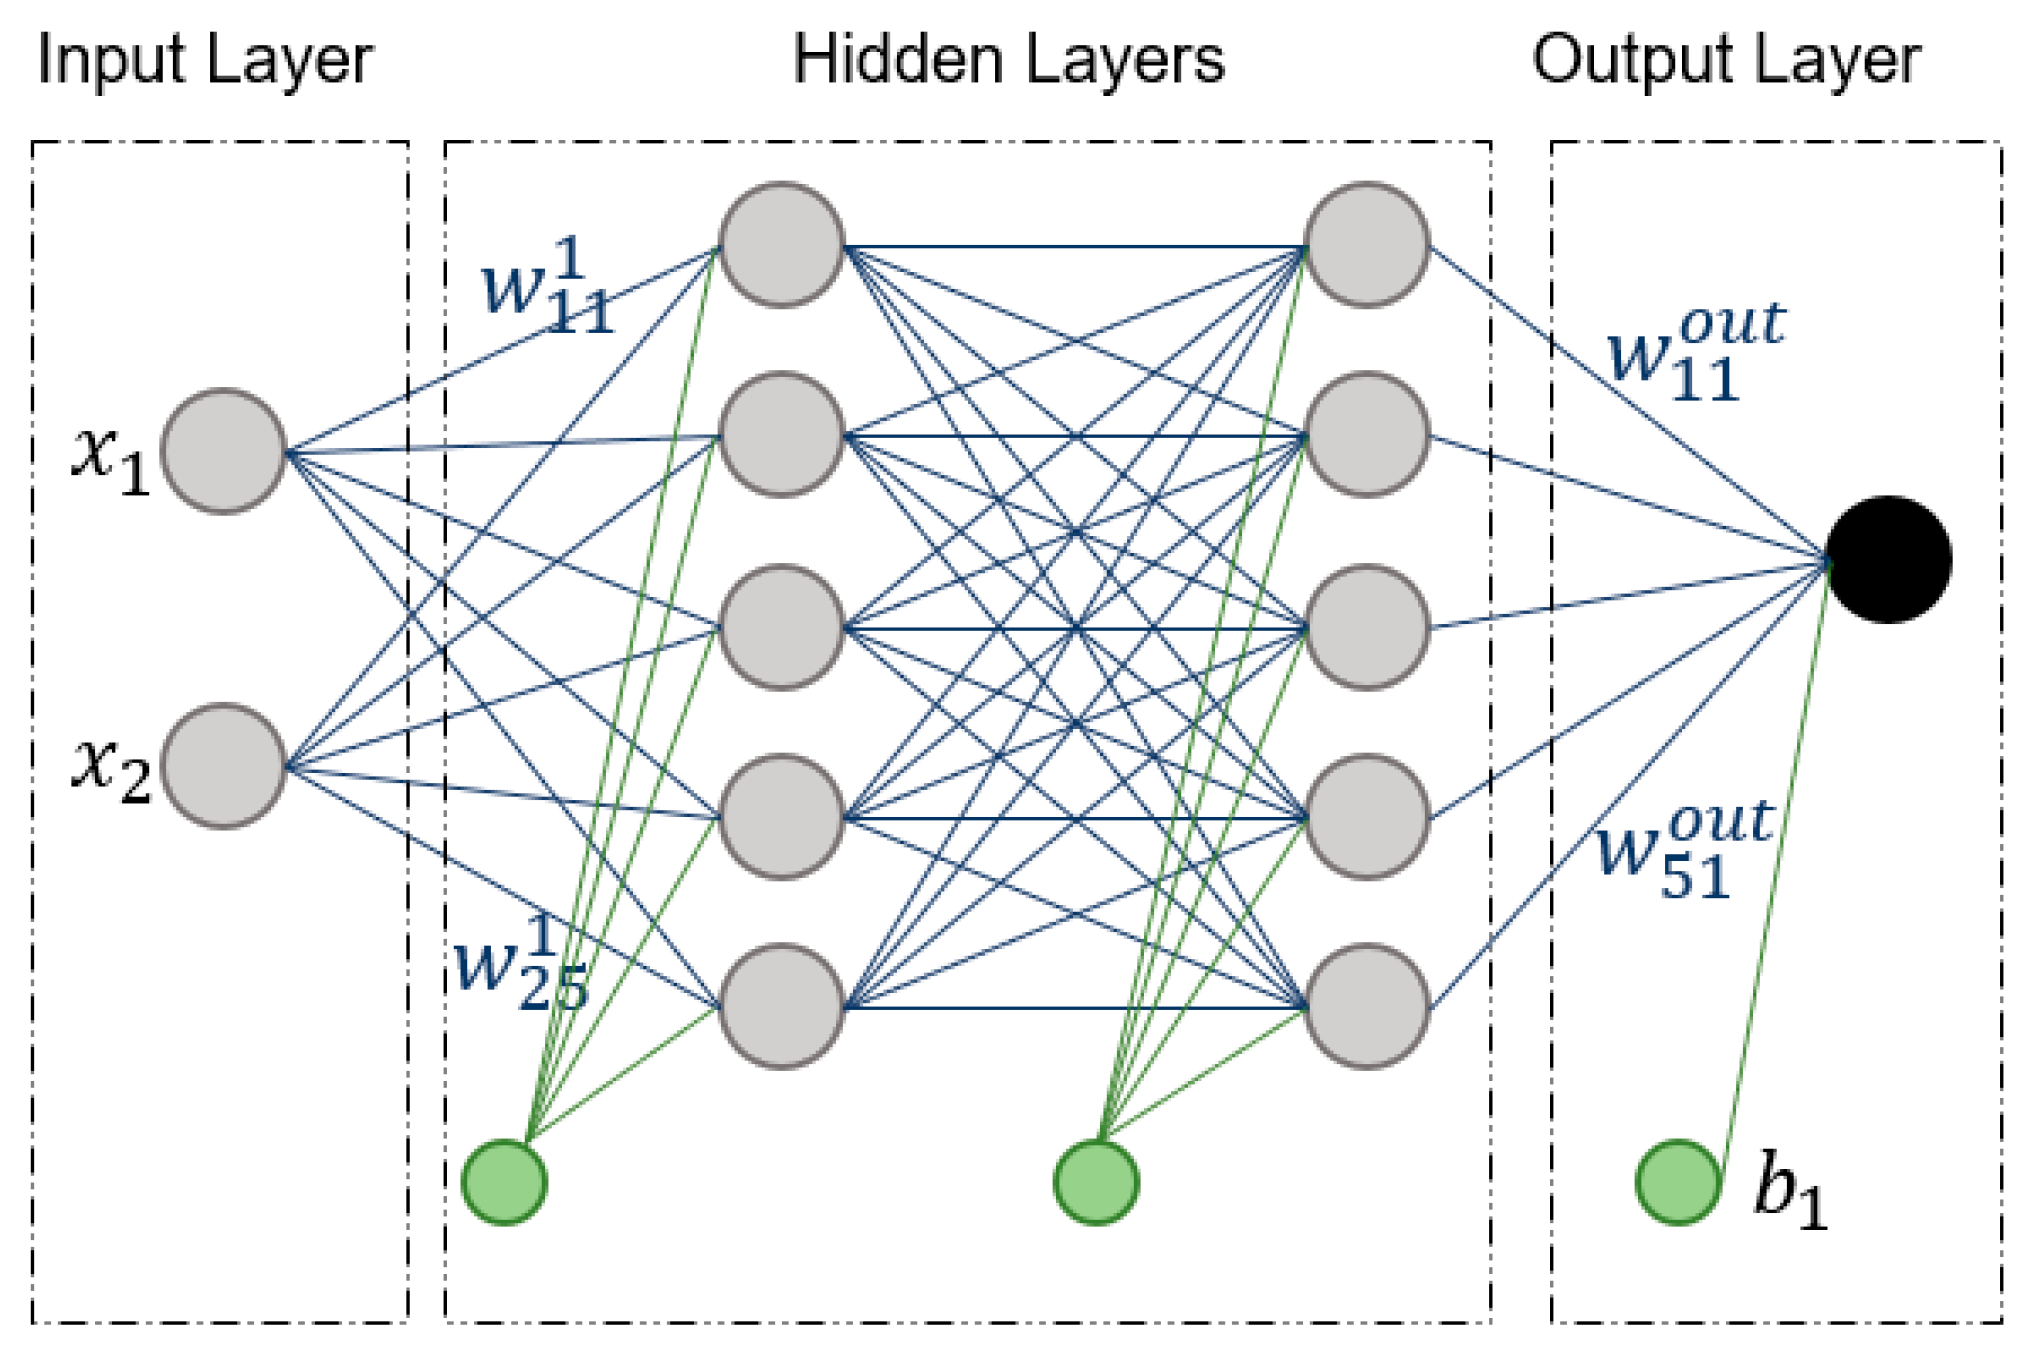
2.2. Deep Neural Network

An ANN attempts to mirror the neural system of a human brain, where neurons are connected to each other in a complicated network [55]. In an ANN, parameters given to the system as input are processed in neurons. The inputs are multiplied by the randomly selected weight coefficients in the first stage, and their sum is computed with a summation function Σ . Then, a constant value (bias) is added to the neuron and an activation function is applied. An activation function manages the threshold at which the neuron is activated and the strength of the output signal. Generally, differentiable nonlinear activation functions such as a sigmoid and a hyperbolic tangent are chosen. The bias term here is used to increase or decrease the input of the activation function and is again chosen randomly in the first stage. The value obtained from the activation function is considered as the output node [56]. A neuron as a computational unit is described by the following equation:
Z = f i = 1 K w i x i + b
where x i is the input features, w i is weight, b is the bias, f ( . ) is the activation function, and Z is the output.
Multi-layer perceptron (MLP) is considered the best type of neural network and comprises an input layer, hidden layer or layers, and an output layer. The neurons in the MLP are trained with the backpropagation algorithm that solves nonlinear problems effectively [57]. The MLP forms the basis of the deep learning that was developed to improve the model performance of the ANNs. An MLP with multiple layers and deep learning techniques is denoted as a DNN [48]. Figure 1 shows an example diagram of a DNN consisting of one input layer with 2 inputs, 2 hidden layers with 5 neurons in each, and one output layer with 1 output.
A general formula for computing predictions in a DNN based on the learned weights and input features is given by the following equation:
f o u t h 2 = 1 H 2 w h 2 ,     m ( o u t ) f h 2 h 1 = 1 H 1 w h 2 ,     h 1 ( 2 ) f h 1 k = 1 K w k ,     h 1 ( 1 ) x k + b k + b h 1 + b h 2
where w h a ,     h b ( H ) is the weight of the link from the neuron h a of the previous layer to the neuron h b in the layer H , w h a ,     m ( o u t ) is the weight of the link from the neuron h a in the last hidden layer and the output m , f h c . is the activation functions for the hidden layers, f o u t ( ) is the activation functions for output layer, m is the index for output, H 1 ,   H 2 are the number of hidden neurons in the first and second layers, K is the number of inputs, and finally b k , b h 1 , and b h 2 are the biases of the layers [58]. In this study, a DNN model is applied to design and develop a deep ensemble model to yield both good predictive performance and reliable uncertainty quantification in blast-induced PPV prediction.

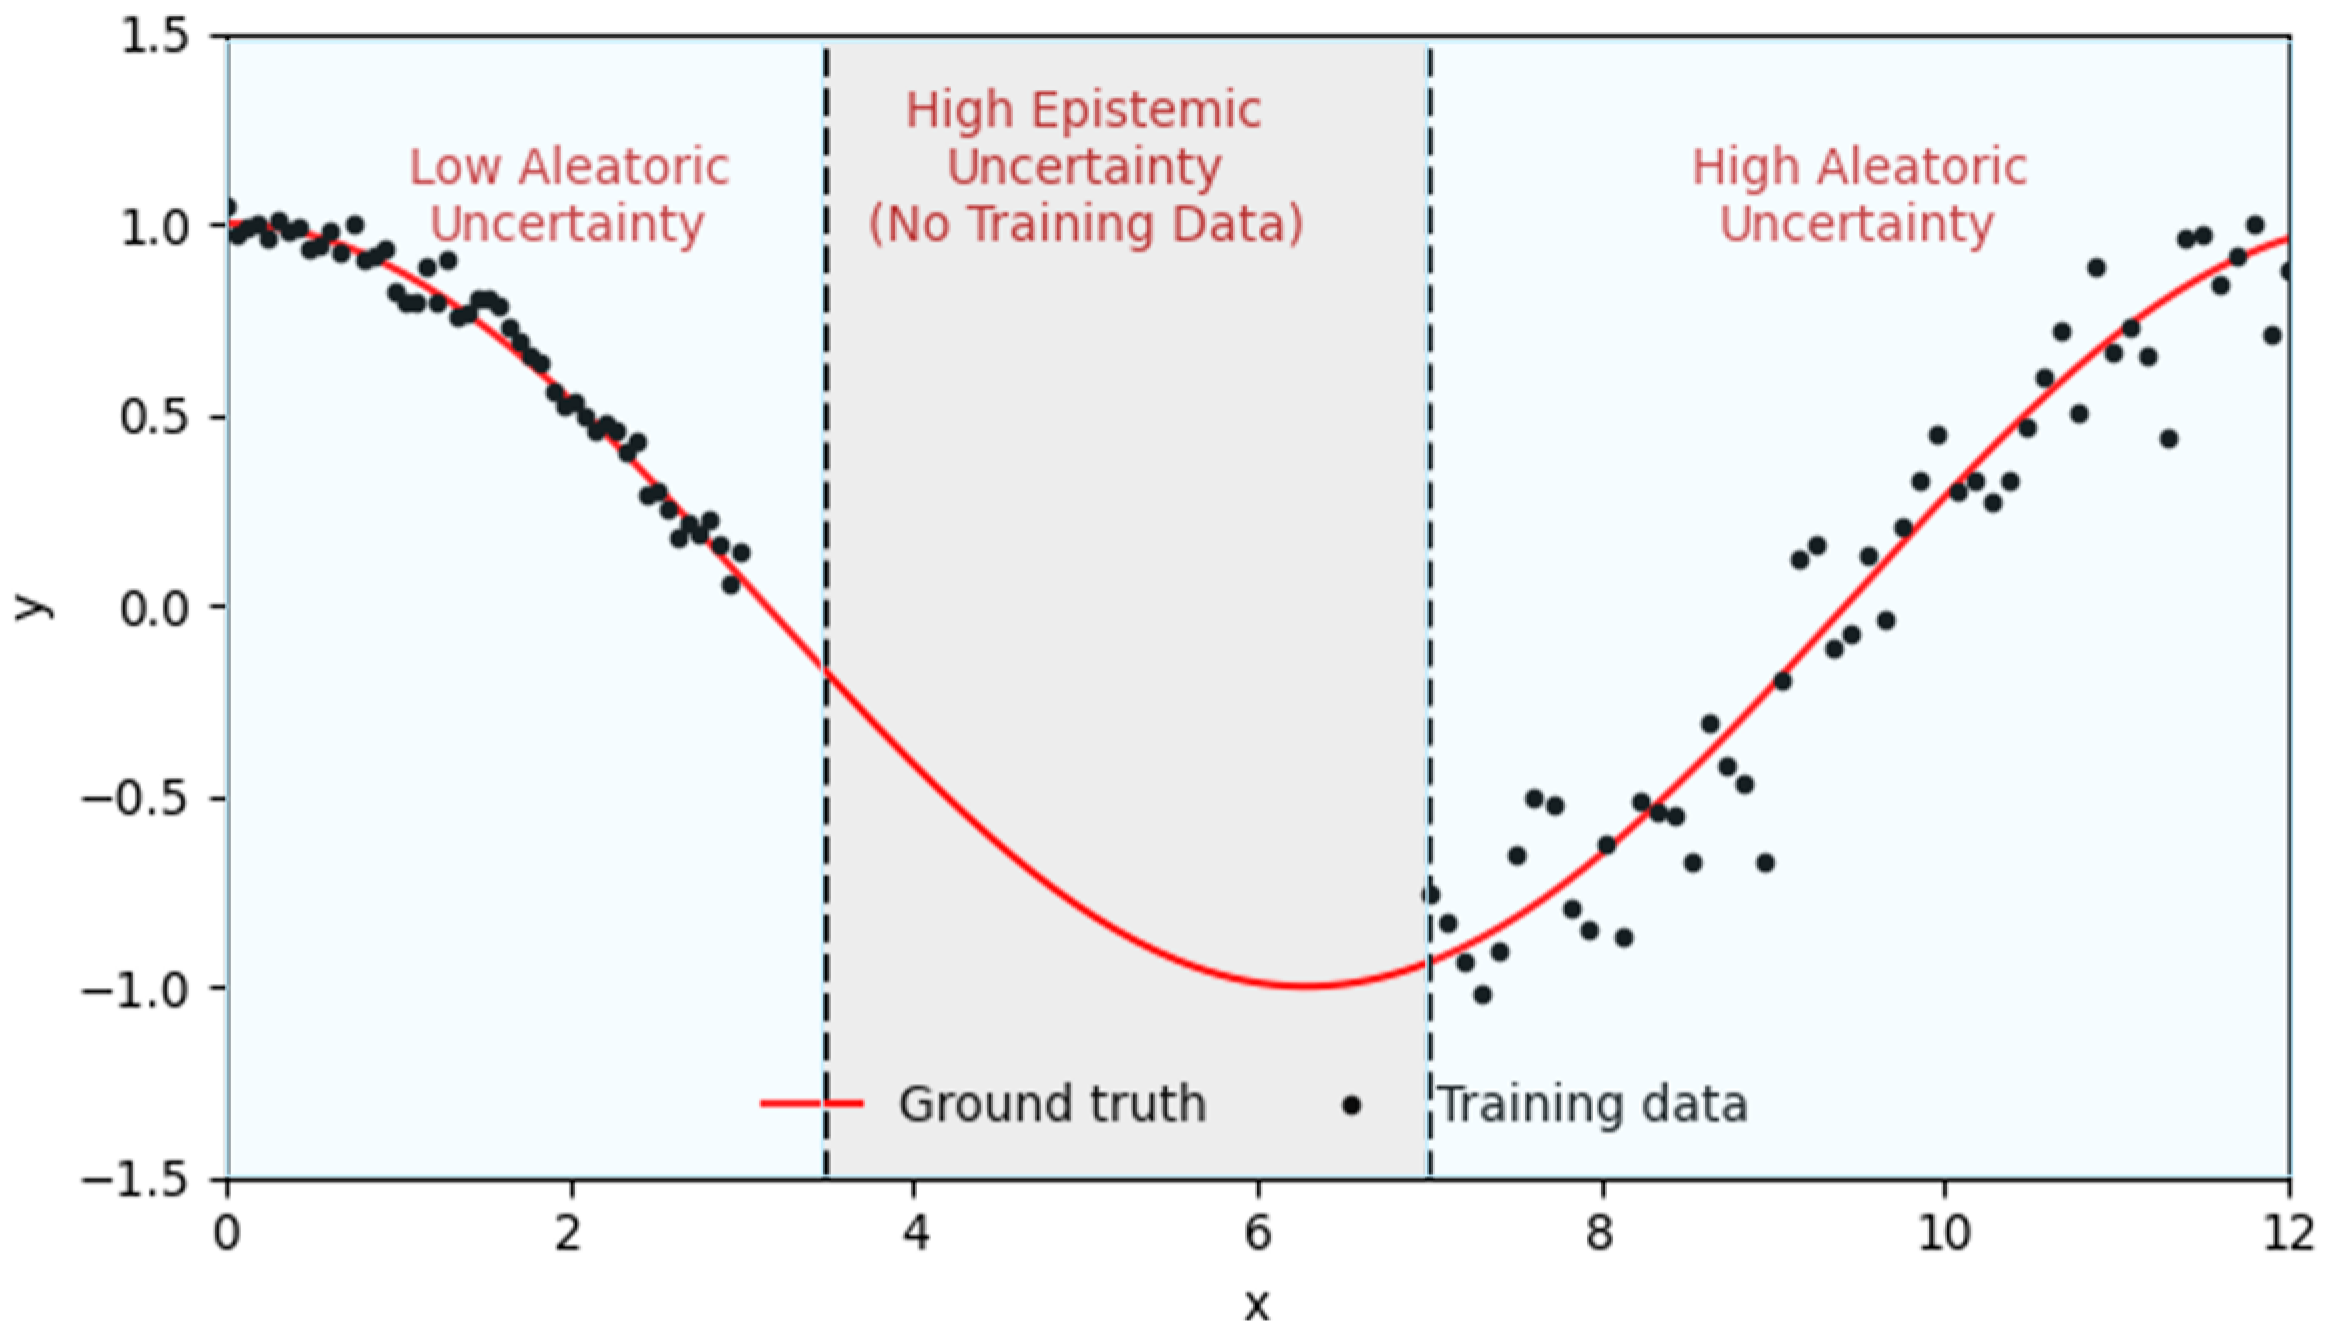
2.3. The Uncertainty Framework
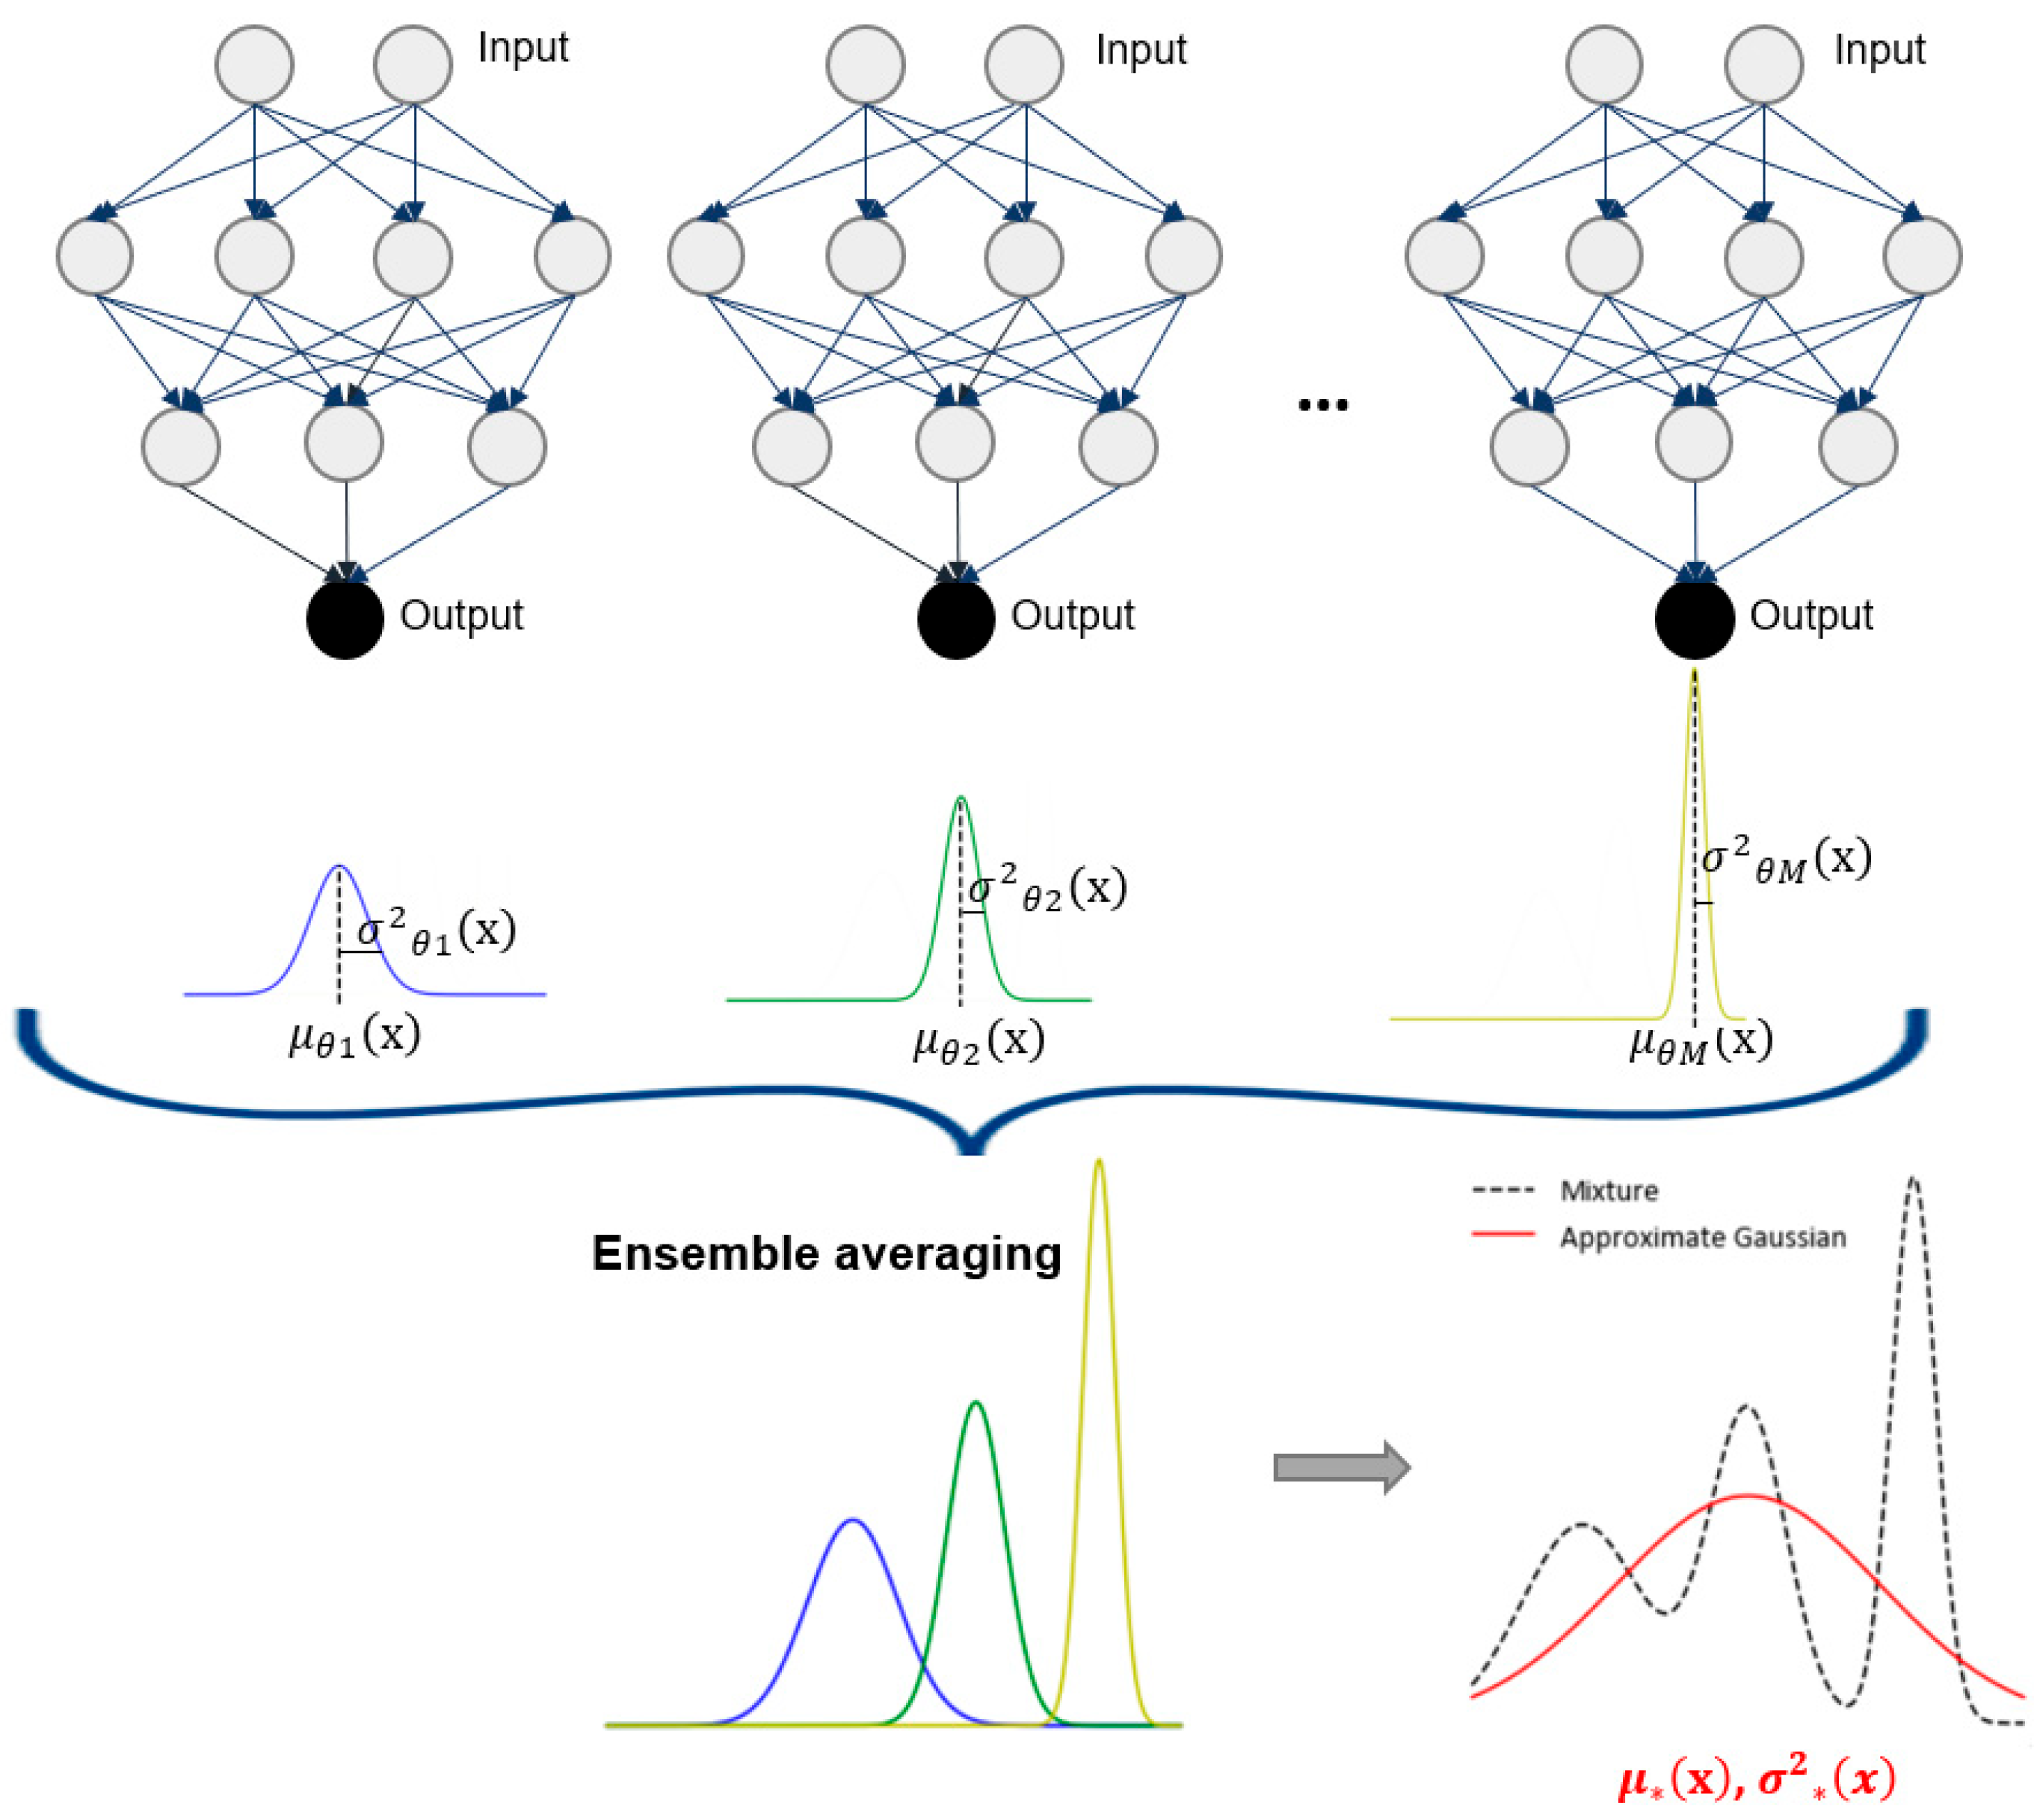
All predictions have some degree of uncertainty since the predictions obtained from the models are subject to noise and model inference errors. For regression problems, in many situations, target values Y are estimated based upon a set of input features X :
Y = f   ( X ) + ϵ
where f is the function defining the relationship between X and Y , and ϵ is an error term that explains all the unmeasured influences on Y . ϵ is mostly termed as data uncertainty (i.e., aleatoric uncertainty) and its mean is assumed to be 0 . As f is not known exactly, statistical models are used to estimate it and Y is predicted from X using the following equation:
Y ^ = f ^ ( X )
where f ^ describes the selected model’s estimate for f , and Y ^ represents the resulting prediction for Y . In general, f ^ will not be the perfect estimate for f and the produced inaccuracy will introduce model uncertainty (i.e., epistemic uncertainty). The two sources of uncertainty, which are aleatoric and epistemic, are summarized in Figure 2 in a linear regression context.
The blue region in Figure 2 has aleatoric uncertainty that occurs due to intrinsic characteristics of the data (i.e., arising from noisy data). As aleatoric uncertainty is caused by the randomness of data, it cannot be reduced by any additional source of information. The epistemic uncertainty, shown as gray regions in Figure 2, on the other hand, comes from inadequate knowledge (i.e., arising from the noisy model) and is reducible by improving the model using additional information. Uncertainty quantification is critical for providing reliable predictions in a wide range of engineering domains. Predictions made without uncertainty quantification are usually considered untrustworthy.

2.4. Deep Ensembles

The deep ensemble model has been proposed as a simple and scalable method to estimate predictive uncertainty estimates from DNNs [59]. This method uses three simple recipes to quantify the uncertainty. In the first recipe, a probabilistic DNN p θ y n x n , where θ denotes network weights and biases of a DNN, is trained using a proper scoring rule. For regression problems, it is common for DNNs to be optimized with the mean square error (MSE) loss, which provides only a point estimate, μ θ x . In order to capture predictive uncertainty, the negative log-likelihood (NLL) loss is adopted, and the final layer is designed to produce two outputs: the predicted mean   μ θ x and predicted σ 2 θ ( x ) > 0 . The observed value is assumed to be sampled from a Gaussian distribution, N ( μ θ x , σ 2 θ ( x ) ) , and NLL function is minimized:
l o g p θ y n x n = log σ 2 θ x 2 + y μ θ x 2 2 σ 2 θ x + c
where c is a constant term that does not influence the loss minimization process. In this way, the model is encouraged to produce calibrated estimates of both the central tendency and the spread (aleatoric uncertainty) of the data. In the second recipe, adversarial training is employed to smooth the predictive distributions and to improve robustness to out-of-distribution samples. New training examples are created by applying small, deliberate worst-case perturbations, and the fast gradient sign method [59] is used to modify the input x as follows:
x = x + ϵ   s i g n ( d d x L ( θ ,   x ,   y ) )
where ϵ is a small step ratio and L is the loss (e.g., the NLL). It has been observed that the contribution of adversarial training may be limited for some regression datasets. In the third recipe, an ensemble of DNNs with the same architecture, but with independent random initializations, is trained on the entire dataset. The ensemble prediction is obtained by averaging the predictions from each network as follows:
p y x = M 1 m = 1 M p θ y x , θ m
where M is the number of DNNs in the ensemble. Since each network outputs a Gaussian distribution, the ensemble prediction is approximated as a Gaussian with mean and variance given by the following equations:
μ * x = M 1 m = 1 M μ θ m x
σ 2 * x = M 1 m = 1 M μ 2 θ m x M 1 m μ θ m x 2 + M 1 m = 1 M σ 2 θ m x
where μ θ m x and σ 2 θ m x are the output of an individual model for input x . In Equation (10), the variance σ 2 * x is calculated by combining the dispersion of the individual predictions (which reflects epistemic uncertainty) with the average of the individual variances (which reflects aleatoric uncertainty). This combined measure is reported as the predictive uncertainty. The overall training procedure of the deep ensemble model is summarized in Figure 3.
This model is easy to implement and readily parallelizable to decrease the computational cost. Moreover, this method can cope with large-scale distributed computation and requires very little hyper-parameter tuning.

3. Proposed Deep Ensemble Model for Predicting Blast-Induced PPV

In this study, a deep ensemble model was developed for predicting the blast-induced PPV together with predictive uncertainty quantification in ten quarry sites (Nigeria). An empirical equation and a DNN model were also produced for comparison with the proposed deep ensemble model. All models were implemented in Python3.7.5 code.

3.1. Dataset Description

In this study, ten measured blast-induced PPV datasets from ten quarry sites in Ibadan (Offa quarry site, 7.38° N, 3.95° E; Ladson quarry site, 7.37° N, 3.97° E; Wetipp quarry site, 7.35° N, 3.87° E; Ratcon quarry site, 7.33° N, 3.87° E and Seedvest quarry site, 7.32° N, 3.92° E) and Abeokuta areas (United quarry site, 7.06° N, 3.33° E; Associated quarry site, 7.05° N, 3.33° E; Equation quarry site, 7.08° N, 3.67° E; Verytaces quarry site, 7.15° N, 3.74° E and Phoenix quarry site, 7.18° N, 3.73° E), Nigeria provided by [60] were used. The quarry sites are shown in Figure 4.
These datasets were recorded during the survey of residential buildings in the neighborhood of the quarry sites. Each dataset involved twenty data and comprised PPV, D, and W values. PPV values were measured using the V9000 Seismograph situated at building-monitored station points in the dwelling areas surrounding each site. D values in datasets were recorded using a global positioning service (GPS). The ammonium nitrate fuel oil (ANFO) was used as the main explosive coupled with the Magnadet detonator for blasting operations at the defined areas. Table 2 gives a summary of the adopted data with their ranges. Moreover, the matrix analysis diagram of the input and output variables is shown in Figure 5.
In Figure 5, the correlation coefficient between the input variables themselves and between the input and output variables are demonstrated. While there is a meaningful nonlinear relationship between D and PPV, other variables do have not any relationship.

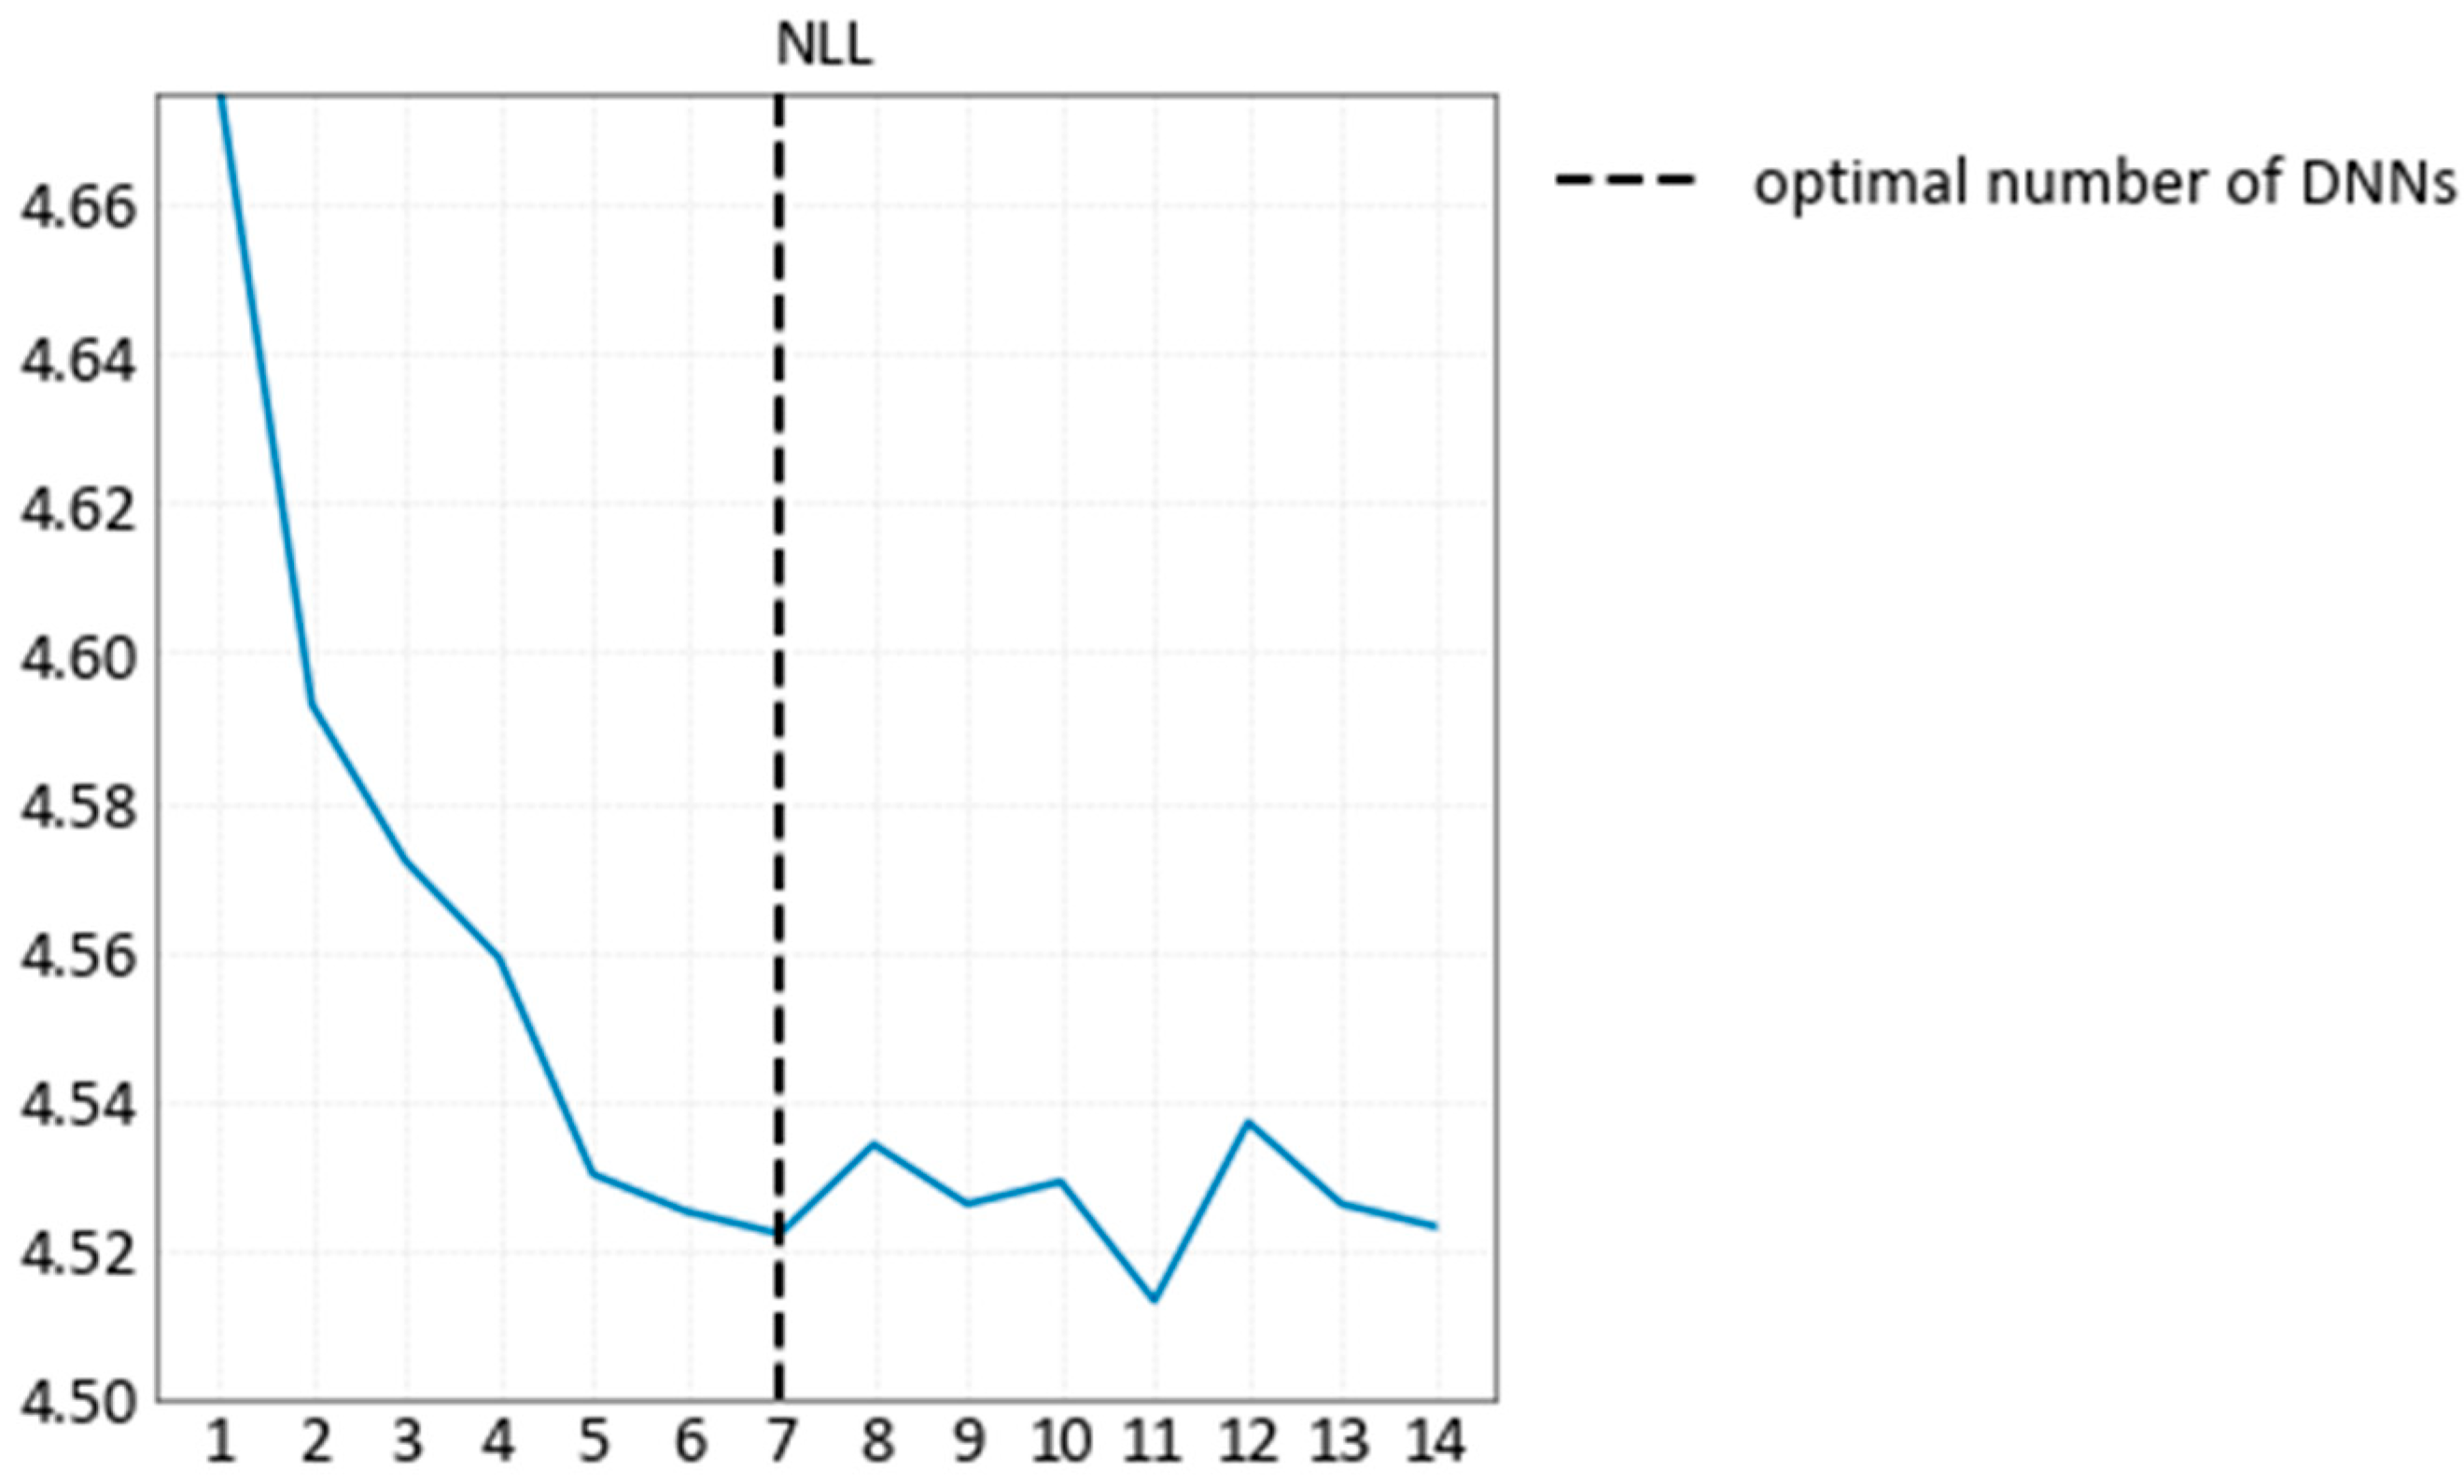
3.2. Deep Ensemble Training Procedure

To train the deep ensemble model, the original dataset was randomly divided into two non-overlapping sections. The first part was randomly selected to be 80% of the whole data (160 blasting cases) to train the models and the remaining 20% (40 blasting cases) in the second part were used to assess the accuracy of the performance of the model. This process was repeated 5 times to consider the random outputs, which depends on the random parameter initialization of the networks. Input and output variables were normalized to zero mean and unit variance using the following equation to improve the accuracy and to avoid the over-fitting of the DNNs:
X n o r m = X X m e a n X s t d
where X is the datasets to be normalized, X m e a n is the mean, X s t d is the standard deviation of the dataset, and X n o r m is the normalized value of the datasets, respectively.
The deep ensemble model uses multiple copies of one network sharing the same structure, each of which is initialized with random parameters. Therefore, a fixed structure was chosen for all networks. The training was performed using the RELU activation function and an ADAM optimizer with a learning rate of 0.03, a learning decay rate of 0.9, a batch size of 100, and epochs of 100. As the deep ensemble model does not require advanced hyper-parameter tuning, this study found the relevant hyper-parameters by building a number of DNN models with various structures. Once the best DNN structure was determined for predicting blast-induced PPV, which has two hidden layers with 30 neurons in each layer, the number of networks in the ensemble was investigated. It was stated in [59] that as the number of networks in the ensemble increases, its performance in terms of NLL increases significantly. Figure 6 proves this statement by evaluating NLL as a function of the number of networks.
For this study, 7 networks in the ensemble were considered as the best in terms of computing time and accuracy for blast-induced PPV prediction. Adversarial training was not been applied in this study as it has a small significant additional effect on regression problems.

4. Results and Discussion

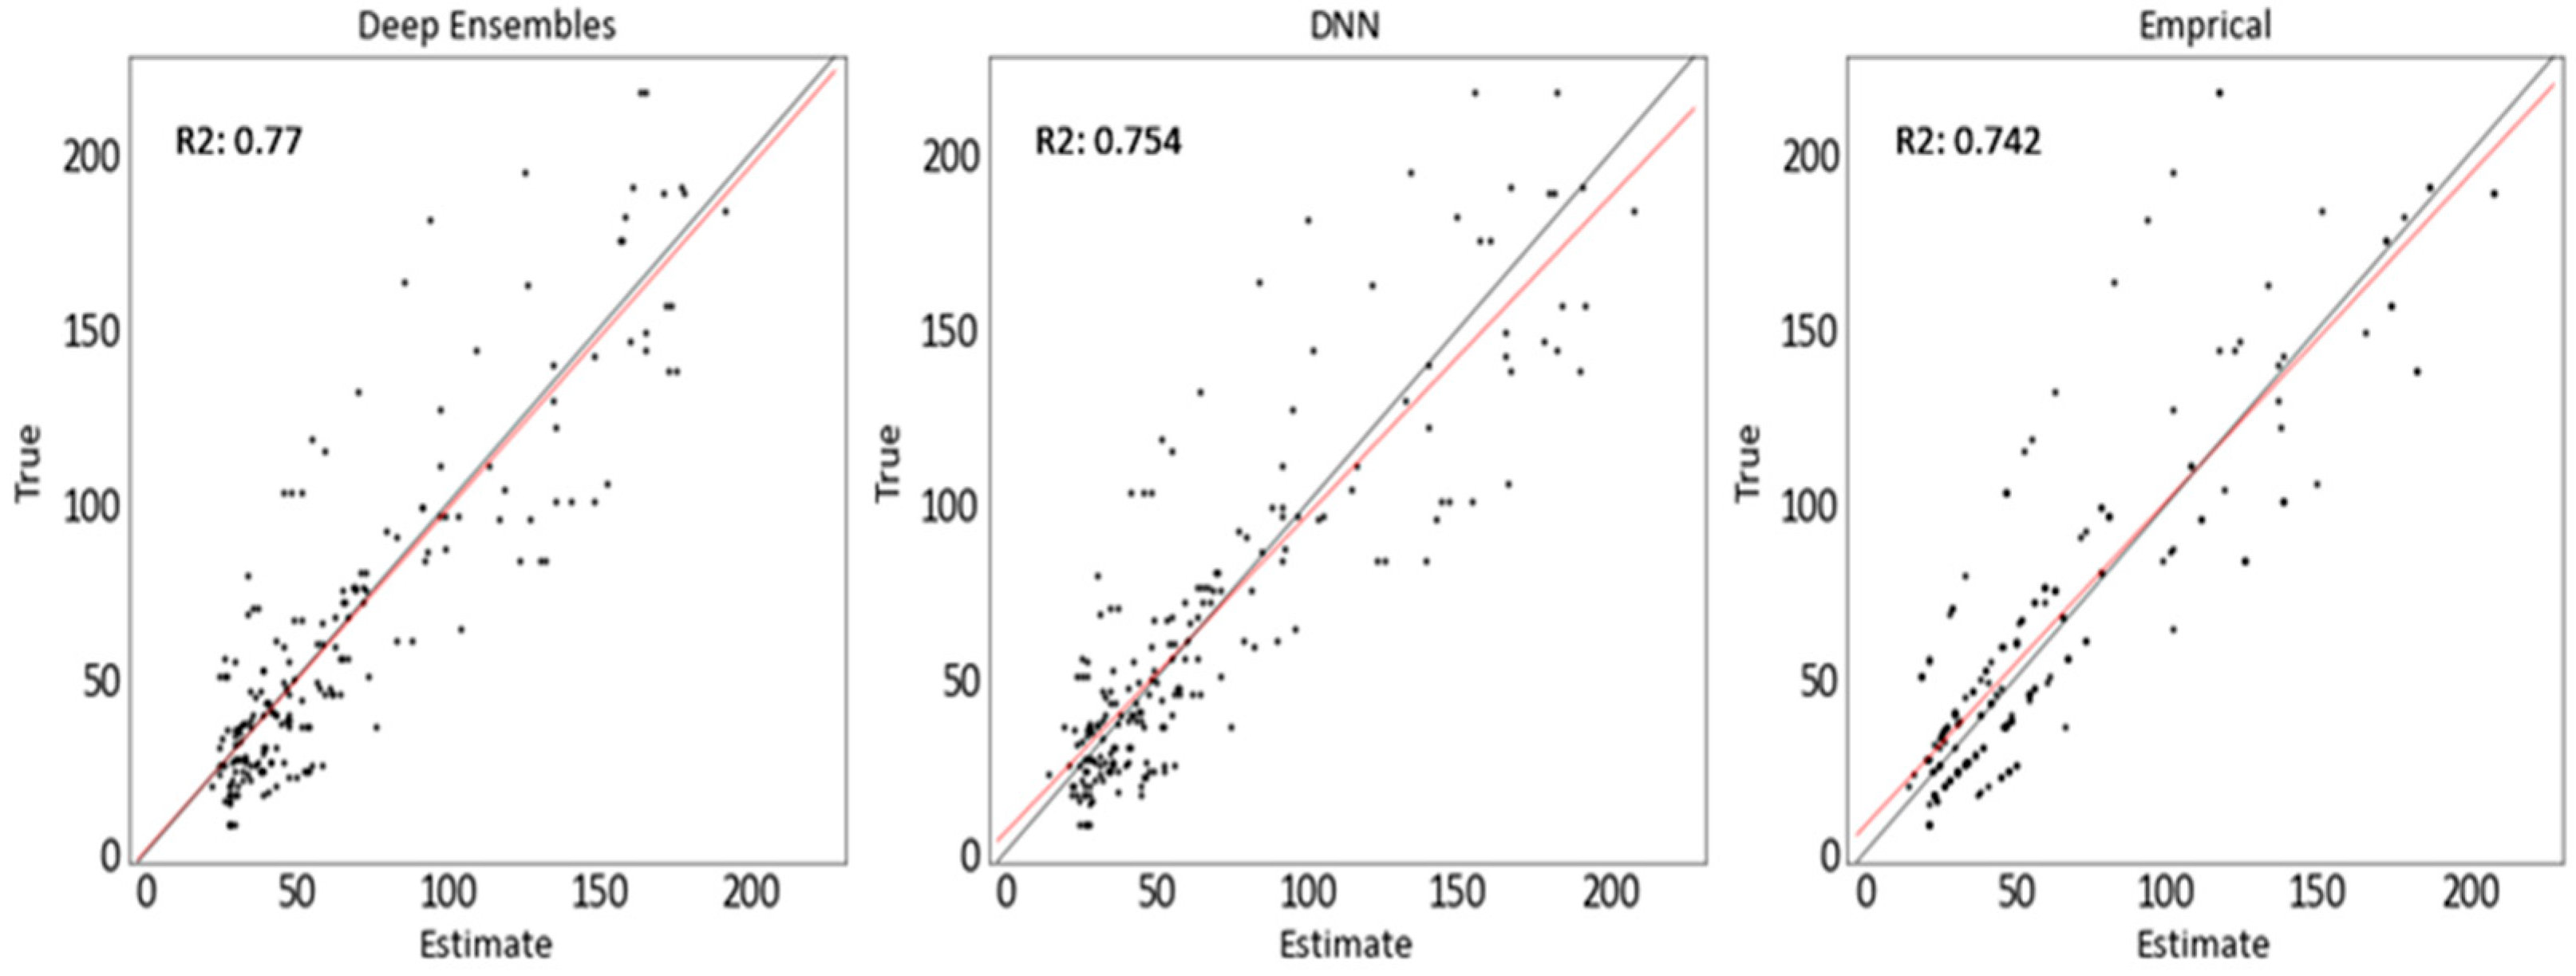
4.1. Model Verification and Evaluation

To validate and measure the performance of the developed blast-induced PPV models, root mean of squared error (RMSE), coefficient of determination R 2 , and NLL (Equation (5)) have been used as performance indices:
R M S E = 1 n   i = 1 n P P V p r e d i c t e d P P V m e a s u r e d 2
R 2 = 1 i = 1 n P P V p r e d i c t e d P P V m e a s u r e d 2 i = 1 n P P V m e a s u r e d P P V m e a n 2
where n represents the number of data, and P P V m e a n denotes the mean values of the true data. While RMSE and R 2 measure how close the measured data are to the predicted values of a model, the NLL evaluates the predictive uncertainty. The lower values of RMSE and NLL represent the better performance of the prediction model. While the expected value of RMSE is 0, the expected value of R 2 is 1 for an accurate prediction model.
In addition to those metrics, prediction intervals (PIs) were evaluated for uncertainty quantification. A PI is a prediction of an interval between lower,   y ^ L , and upper, y ^ U , PI bounds in which a future observation will fall, with a specified degree of confidence level, (1 − α ):
P r ( y ^ L i y i y ^ U i ) = ( 1 α ) ,   1 i n
where n is the number of the samples and α is commonly chosen as 0.01 or 0.05. For the deep ensemble model, PI values were extracted using the method [61] that trims the tails of the deep ensembles’ normal distribution output by the appropriate amount. For the empirical equation which is based on multivariate regression, distributions of input, output, and prediction residuals were assumed as Gaussian, and PIs are calculated as follows:
y ^ i   t 1 α 2 , N 2 .   s e ( e i )
where y ^ i is the produced prediction, e i is the error of the prediction, and s e e i is equal to σ ^ 2 ( e i ) , which is also known as the standard error of the prediction. PIs should be as narrow as possible and some portion of data points should be captured [62,63]. In this regard, the prediction interval coverage probability (PICP) is used to count the number of target values captured by the predicted PIs:
P I C P   : = c n c   : = i = 1 n k i k i = 1 ,   i f   y ^ L i   y i   y ^ U i 0 ,   e l s e                                                  
where k is an n -length vector indicating whether each sample was captured by the predicted PIs; c is the total number of data points captured. There is a direct relationship between PICP and the width of the PIs. Although a reasonably large PICP can be easily obtained by spreading PIs from either side, such PIs are too conservative and less useful in practice, because they do not present the variation in the targets [63]. In this regard, mean prediction interval width (MPIW) is used to quantify how wide the PIs are:
M P I W   : = 1 n i = 1 n ( y ^ U i y ^ L i )
The lower values of MPIW indicate the better performance of the uncertainty prediction.

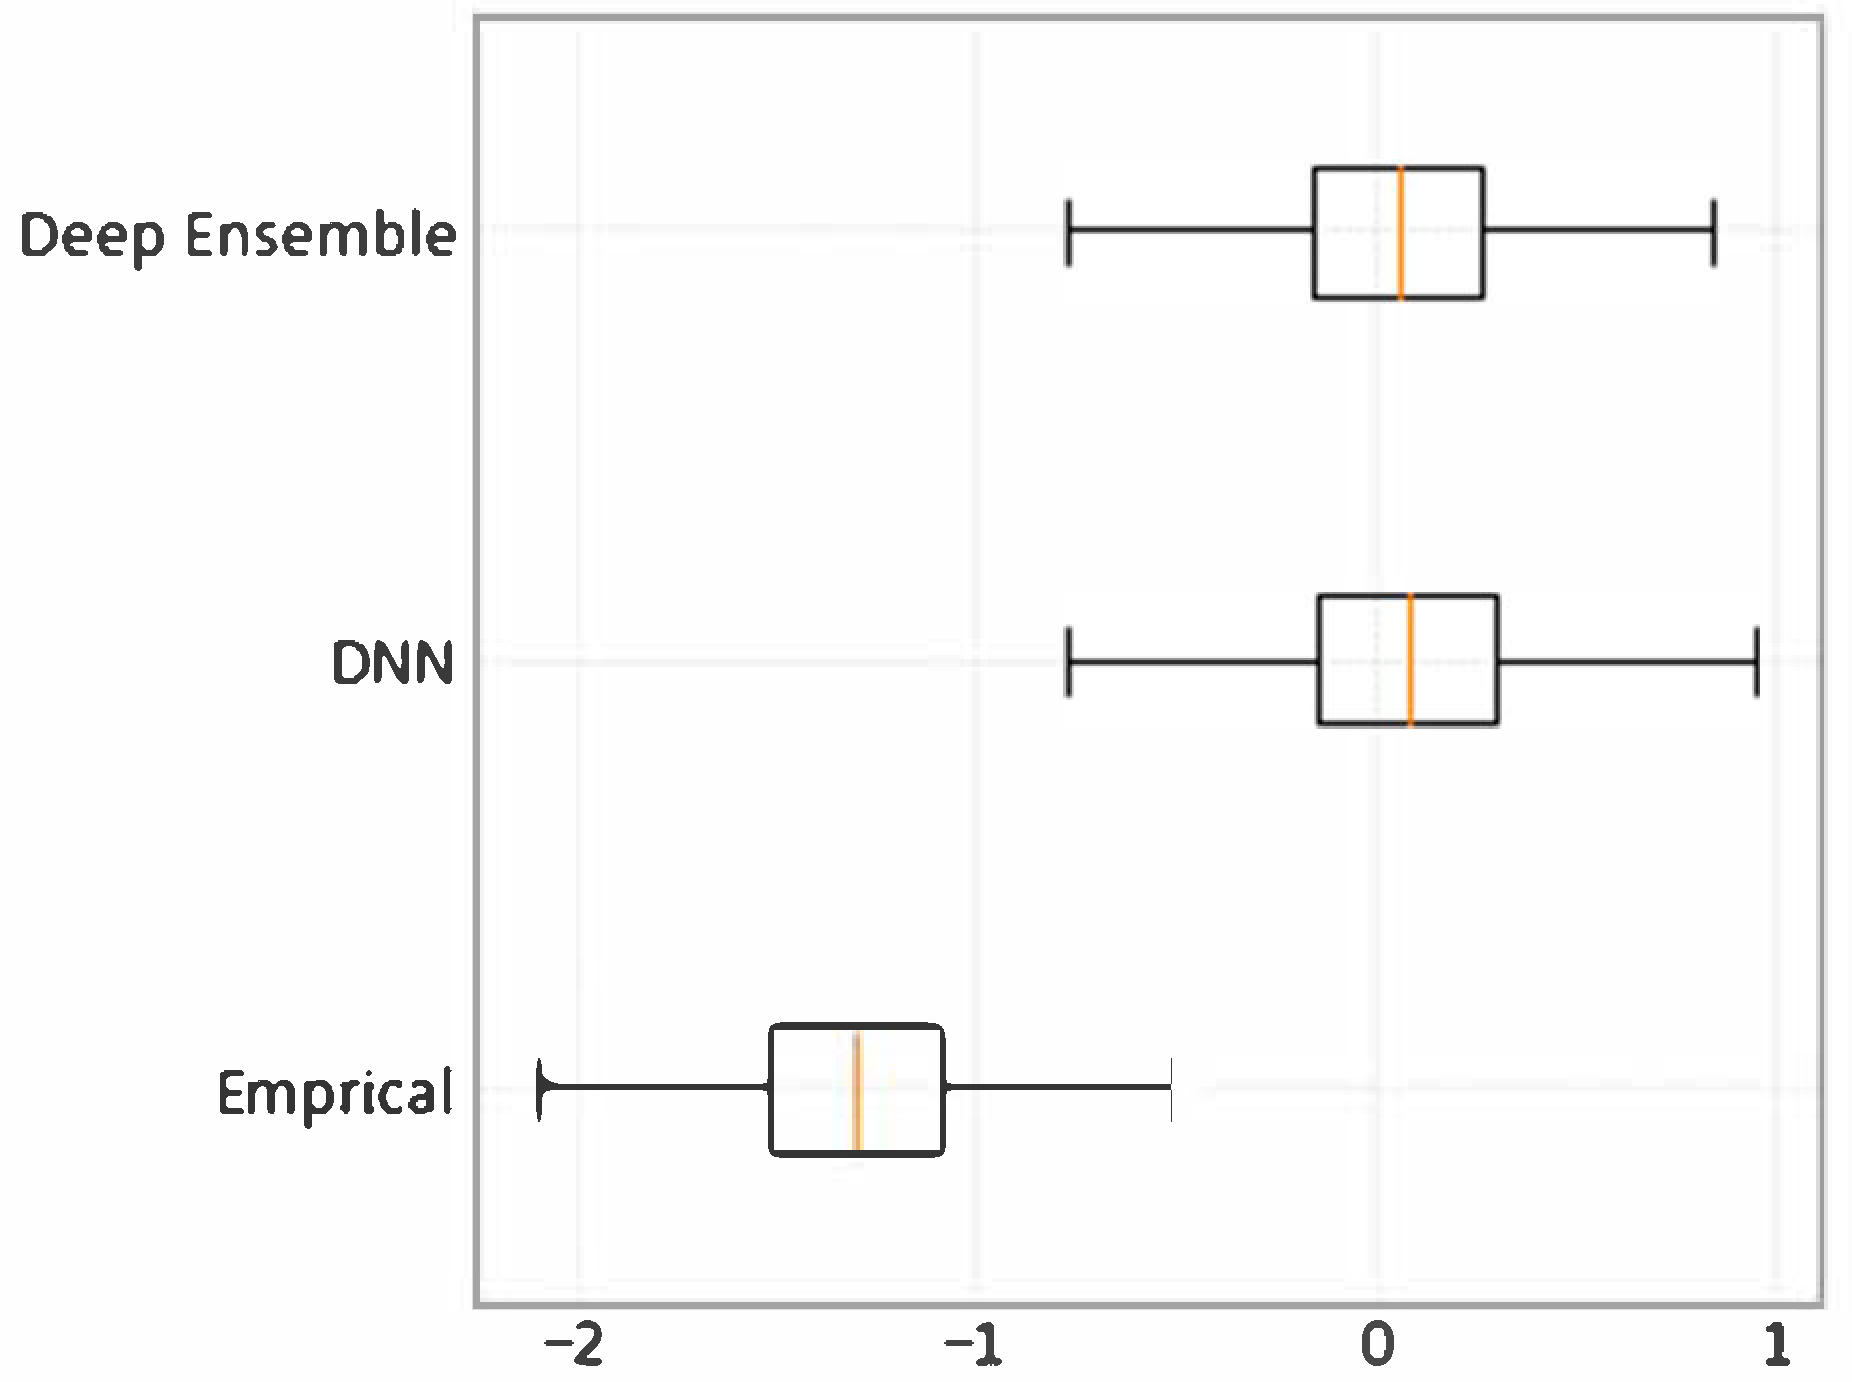
4.2. Evaluating the Developed PPV Predictive Models

The developed blast-induced predictive models were evaluated in terms of, firstly, performance metrics of RMSE, R 2 , and NLL. Then, PICP and MPIW were calculated to assess models in terms of PI performance for prediction uncertainty. During this calculation, α was chosen as 0.05, so a 95% PI for each data point was computed based on Gaussian quantiles using predictive mean and variance. The performance metrics of the developed models are shown in Table 3.
DNN and deep ensemble models provide both prediction and predictive uncertainty on their evaluation metrics, which are demonstrated in Table 3 as mean ± one standard. These models yielded reliable performance in all examined metrics with a low one standard. From Table 3, it is also easy to recognize that the empirical equation showed the worst performance of the three models used in this study, as expected, with an RMSE of 24.67, an R 2 of 0.742, and an NLL of 100.68. The performance of a single DNN model was lower than the deep ensemble model, i.e., an RMSE of 23.566, an R 2 of 0.754, and an NLL of 4.596. On the other hand, with an RMSE of 22.674, an R 2   of 0.77, and an NLL of 4.44, the deep ensemble model was the most powerful of the three models developed in this study. Figure 7 illustrates the measured values and predicted mean blast-induced PPV values of the developed models through scatter plots.
Figure 7 shows that even the measured and predicted values of the deep ensemble model had the best convergence on the regression line, the value of R 2 was low because of noisy and high-variable data, which indicates the need to investigate the uncertainty to evaluate precision. In this regard, PI quality metrics, which are directly related to uncertainty, shown in Table 3 reveal that the deep ensemble model outperformed both the empirical equation and a single DNN model in terms of PICP (0.95) and MPIW (1.769). Moreover, the deep ensemble model achieved the coverage proportion of a 95% target, which describes it as a well-calibrated regressor. Figure 8 illustrates how the deep ensemble model produced PIs and captured an important portion of data.
The models were also validated by analyzing their residuals using a boxplot shown in Figure 9. The negative residuals produced by the empirical equation indicate that it had an underestimation bias compared to the other models. On the other hand, the residuals of the deep ensembles and DNN models had a median close to zero, which denotes that no considerable biases were observed for these models.
The findings of this Section showed that the deep ensemble model is a powerful and useful model to predict blast-induced PPVs. Moreover, the deep ensemble model gave direct predictive uncertainty prediction, which was reliable and well-calibrated. It can be used to filter blast-induced PPV predictions to meet certain accuracy requirements. On the other hand, the performance of the deep ensemble model proposed in this study can be improved by collecting more blast-induced PPV cases, since the performance of deep learning models increases with data size according to a power law as shown in Figure 10 [64].
It is clear from Figure 10 that deep learning benefits from large amounts of data, whereas the performance of traditional machine learning models tends to plateau with increasing data.

5. Conclusions

Uncertainty quantification is essential for safety-critical operations such as the prediction of blast-induced PPV, as it informs when model outputs can be trusted and when additional caution is warranted. In this study, a deep ensemble learning approach was developed for the estimation of blast-induced PPV and the quantification of associated uncertainty across ten quarry sites in the Ibadan and Abeokuta regions of Nigeria.
Both the deep ensemble model and a single DNN demonstrated acceptable estimation performance when benchmarked against the conventional USBM empirical equation. However, the ensemble model exhibited superior accuracy and reliability, achieving the lowest RMSE (22.674), NLL (4.44), and MPIW (1.769), along with the highest R 2 (0.77) and PICP (0.95). These results underscore the advantages of the ensembling methodology in improving both estimation precision and uncertainty quantification. The following key contributions were achieved in this study:
  • A deep ensemble model was developed that accurately estimates blast-induced PPV across diverse geological settings, demonstrating consistency and generalizability.
  • Uncertainty quantification was successfully integrated into the modeling framework, achieving a 95% PICP and providing well-calibrated uncertainty estimates to support informed decision-making in blasting operations.
  • The proposed deep ensemble approach was shown to outperform both the USBM equation and a single DNN model in terms of accuracy and uncertainty representation.
Although this study focused only on the scaled distance parameters D and W due to data availability, the framework is adaptable and can be extended to include additional variables—such as the powder factor, rock mass characteristics, explosive type, burden, spacing, stemming, and the number of rows per delay—to further enhance performance. Moreover, as more data becomes available, future studies could explore the use of additional and more complex empirical models.
These findings hold practical implications for industrial applications. The integration of the proposed deep ensemble model into blast planning and control systems can enable more effective tuning of key parameters—such as charge weight and delay timing—to mitigate excessive ground vibrations. This integration enhances safety by reducing the risk of damage to nearby infrastructure and supports regulatory compliance. Moreover, it promotes operational efficiency and cost savings, ultimately offering a promising tool for safer and more sustainable blasting practices in mining and quarrying operations.

Author Contributions

Conceptualization, G.E.E., S.B.K. and M.Y.; methodology, G.E.E. and S.B.K.; software, G.E.E. and S.B.K.; validation, G.E.E. and S.B.K.; formal analysis, G.E.E. and S.B.K.; investigation, G.E.E., S.B.K. and M.Y.; resources: G.E.E., S.B.K. and M.Y.; writing—original draft preparation, G.E.E. and S.B.K.; writing—review and editing, G.E.E., S.B.K. and M.Y.; visualization, G.E.E., S.B.K. and M.Y. All authors have read and agreed to the published version of the manuscript.

Funding

This research received no external funding.

Data Availability Statement

The data analyzed in the present study were originally published by [60] and are available in the Data in Brief article on ScienceDirect under the Creative Commons Attribution 4.0 International (CC BY 4.0) license (DOI: 10.1016/j.dib.2018.04.103; accessed on 9 May 2025). No new datasets were generated during this study.

Conflicts of Interest

The authors declare that the research was conducted in the absence of any commercial or financial relationships that could be construed as a potential conflict of interest.

Abbreviations

AcronymFull FormFirst Appearance (Page)
SCSoft computing p. 2
PPVPeak Particle Velocity p. 2
DDistance from the blasting site p. 2
WCharge weight per delayp. 3
MLMachine learningp. 3
ABCArtificial Bee Colonyp. 3
ANNArtificial Neural Networksp. 3
AN-FISAdaptive Neural Network Based on The Fuzzy Inference Systemp. 3
CARTClassification and Regression Treep. 3
EOEarthworm Optimizationp. 3
FAFirefly Algorithmp. 3
FCMFuzzy C-Means Clusteringp. 3
FFAFirefly Algorithmp. 3
FSFeature Selectionp. 3
GAGenetic Algorithmp. 3
HHOHarris Hawks Optimizationp. 3
HKMHierarchical K-Means Clusteringp. 3
ICAImperialist Competitive Algorithmp. 3
KNNK-Nearest Neighborsp. 3
MAEMean Absolute Errorp. 3
MAPEMean Absolute Percentage Errorp. 3
MFAModified Firefly Algorithmp. 3
MRMultiple Regressionp. 3
PSOParticle Swarm Optimizationp. 3
DNNDeep neural network p. 3
AIArtificial intelligencep. 4
MCMonte Carlop. 5
USBMUnited States Bureau of Mines p. 6
MLPMulti-layer perceptron p. 6
MSEThe mean square error p. 7
NLLNegative log-likelihood p. 7
GPSGlobal positioning service p. 10
ANFOAmmonium nitrate fuel oil p. 10
RMSERoot mean of squared error p. 12
PIPrediction intervals p. 12
PICPPrediction interval coverage probabilityp. 13
MPIWMean prediction interval widthp. 13

References

  1. Uyar, G.G.; Aksoy, C.O. Comparative Review and Interpretation of the Conventional and New Methods in Blast Vibration Analyses. Geomech. Eng. 2019, 18, 545–554. [Google Scholar] [CrossRef]
  2. Bui, X.-N.; Nguyen, H.; Tran, Q.-H.; Nguyen, D.-A.; Bui, H.-B. Predicting Ground Vibrations Due to Mine Blasting Using a Novel Artificial Neural Network-Based Cuckoo Search Optimization. Nat. Resour. Res. 2021, 30, 2663–2685. [Google Scholar] [CrossRef]
  3. Murlidhar, B.R.; Kumar, D.; Jahed Armaghani, D.; Mohamad, E.T.; Roy, B.; Pham, B.T. A Novel Intelligent ELM-BBO Technique for Predicting Distance of Mine Blasting-Induced Flyrock. Nat. Resour. Res. 2020, 29, 4103–4120. [Google Scholar] [CrossRef]
  4. Ak, H.; Iphar, M.; Yavuz, M.; Konuk, A. Evaluation of Ground Vibration Effect of Blasting Operations in a Magnesite Mine. Soil. Dyn. Earthq. Eng. 2009, 29, 669–676. [Google Scholar] [CrossRef]
  5. Armaghani, D.J.; Momeni, E.; Abad, S.V.A.N.K.; Khandelwal, M. Feasibility of ANFIS Model for Prediction of Ground Vibrations Resulting from Quarry Blasting. Environ. Earth Sci. 2015, 74, 2845–2860. [Google Scholar] [CrossRef]
  6. Dindarloo, S.R. Peak Particle Velocity Prediction Using Support Vector Machines: A Surface Blasting Case Study. J. South. Afr. Inst. Min. Metall. 2015, 115, 637–643. [Google Scholar] [CrossRef]
  7. Khandelwal, M.; Armaghani, D.J.; Faradonbeh, R.S.; Yellishetty, M.; Majid, M.Z.A.; Monjezi, M. Classification and Regression Tree Technique in Estimating Peak Particle Velocity Caused by Blasting. Eng. Comput. 2017, 33, 45–53. [Google Scholar] [CrossRef]
  8. Haghnejad, A.; Ahangari, K.; Moarefvand, P.; Goshtasbi, K. Numerical Investigation of the Impact of Geological Discontinuities on the Propagation of Ground Vibrations. Geomech. Eng. 2018, 14, 545–552. [Google Scholar] [CrossRef]
  9. Singh, T.N.; Singh, V. An Intelligent Approach to Prediction and Controlground Vibration in Mines. Geotech. Geol. Eng. 2005, 23, 249–262. [Google Scholar] [CrossRef]
  10. Duvall, W.I.; Fogelson, D.E. Review of Criteria for Estimating Damage to Residences from Blasting Vibrations; Bureau of Mines: College Park, MD, USA, 1962. [Google Scholar]
  11. Ambraseys, N.H.A. Dynamic Behaviour of Rock Masses; John Wiley and Sons: Hoboken, NJ, USA, 1968. [Google Scholar]
  12. Langefors, U.K.B. The Modern Techniques of Rock Blasting; John Wiely and Sons Inc.: New York, NY, USA, 1978. [Google Scholar]
  13. Ghosh, A.; Daemen, J.K. A Simple New Blast Vibration Predictor of Ground Vibrations Induced Predictor. In Proceedings of the 24th U.S. Symposium on Rock Mechanics (USRMS), College Station, TX, USA, 20–23 June 1983. [Google Scholar]
  14. Roy, P.P. Vibration Control in an Opencast Mine Based on Improved Blast Vibration Predictors. Min. Sci. Technol. 1991, 12, 157–165. [Google Scholar] [CrossRef]
  15. Ak, H.; Konuk, A. The Effect of Discontinuity Frequency on Ground Vibrations Produced from Bench Blasting: A Case Study. Soil. Dyn. Earthq. Eng. 2008, 28, 686–694. [Google Scholar] [CrossRef]
  16. Simangunsong, G.M.; Wahyudi, S. Effect of Bedding Plane on Prediction Blast-Induced Ground Vibration in Open Pit Coal Mines. Int. J. Rock Mech. Min. Sci. 2015, 79, 1–8. [Google Scholar] [CrossRef]
  17. Iphar, M.; Yavuz, M.; Ak, H. Prediction of Ground Vibrations Resulting from the Blasting Operations in an Open-Pit Mine by Adaptive Neuro-Fuzzy Inference System. Environ. Geol. 2008, 56, 97–107. [Google Scholar] [CrossRef]
  18. Mohamadnejad, M.; Gholami, R.; Ataei, M. Comparison of Intelligence Science Techniques and Empirical Methods for Prediction of Blasting Vibrations. Tunn. Undergr. Space Technol. 2012, 28, 238–244. [Google Scholar] [CrossRef]
  19. Monjezi, M.; Ghafurikalajahi, M.; Bahrami, A. Prediction of Blast-Induced Ground Vibration Using Artificial Neural Networks. Tunn. Undergr. Space Technol. 2011, 26, 46–50. [Google Scholar] [CrossRef]
  20. Khandelwal, M. Evaluation and Prediction of Blast-Induced Ground Vibration Using Support Vector Machine. Int. J. Rock Mech. Min. Sci. 2010, 47, 509–516. [Google Scholar] [CrossRef]
  21. Saadat, M.; Khandelwal, M.; Monjezi, M. An ANN-Based Approach to Predict Blast-Induced Ground Vibration of Gol-E-Gohar Iron Ore Mine, Iran. J. Rock Mech. Geotech. Eng. 2014, 6, 67–76. [Google Scholar] [CrossRef]
  22. Hajihassani, M.; Jahed Armaghani, D.; Marto, A.; Tonnizam Mohamad, E. Ground Vibration Prediction in Quarry Blasting through an Artificial Neural Network Optimized by Imperialist Competitive Algorithm. Bull. Eng. Geol. Environ. 2015, 74, 873–886. [Google Scholar] [CrossRef]
  23. Amiri, M.; Bakhshandeh Amnieh, H.; Hasanipanah, M.; Mohammad Khanli, L. A New Combination of Artificial Neural Network and K-Nearest Neighbors Models to Predict Blast-Induced Ground Vibration and Air-Overpressure. Eng. Comput. 2016, 32, 631–644. [Google Scholar] [CrossRef]
  24. Azimi, Y.; Khoshrou, S.H.; Osanloo, M. Prediction of Blast Induced Ground Vibration (BIGV) of Quarry Mining Using Hybrid Genetic Algorithm Optimized Artificial Neural Network. Measurement 2019, 147, 106874. [Google Scholar] [CrossRef]
  25. Taheri, K.; Hasanipanah, M.; Golzar, S.B.; Majid, M.Z.A. A Hybrid Artificial Bee Colony Algorithm-Artificial Neural Network for Forecasting the Blast-Produced Ground Vibration. Eng. Comput. 2017, 33, 689–700. [Google Scholar] [CrossRef]
  26. Shang, Y.; Nguyen, H.; Bui, X.-N.; Tran, Q.-H.; Moayedi, H. A Novel Artificial Intelligence Approach to Predict Blast-Induced Ground Vibration in Open-Pit Mines Based on the Firefly Algorithm and Artificial Neural Network. Nat. Resour. Res. 2020, 29, 723–737. [Google Scholar] [CrossRef]
  27. Bayat, P.; Monjezi, M.; Rezakhah, M.; Armaghani, D.J. Artificial Neural Network and Firefly Algorithm for Estimation and Minimization of Ground Vibration Induced by Blasting in a Mine. Nat. Resour. Res. 2020, 29, 4121–4132. [Google Scholar] [CrossRef]
  28. Nguyen, H.; Drebenstedt, C.; Bui, X.-N.; Bui, D.T. Prediction of Blast-Induced Ground Vibration in an Open-Pit Mine by a Novel Hybrid Model Based on Clustering and Artificial Neural Network. Nat. Resour. Res. 2020, 29, 691–709. [Google Scholar] [CrossRef]
  29. Fişne, A.; Kuzu, C.; Hüdaverdi, T. Prediction of Environmental Impacts of Quarry Blasting Operation Using Fuzzy Logic. Environ. Monit. Assess. 2011, 174, 461–470. [Google Scholar] [CrossRef]
  30. Ghasemi, E.; Ataei, M.; Hashemolhosseini, H. Development of a Fuzzy Model for Predicting Ground Vibration Caused by Rock Blasting in Surface Mining. J. Vib. Control 2013, 19, 755–770. [Google Scholar] [CrossRef]
  31. Hasanipanah, M.; Faradonbeh, R.S.; Amnieh, H.B.; Armaghani, D.J.; Monjezi, M. Forecasting Blast-Induced Ground Vibration Developing a CART Model. Eng. Comput. 2017, 33, 307–316. [Google Scholar] [CrossRef]
  32. Bui, X.-N.; Jaroonpattanapong, P.; Nguyen, H.; Tran, Q.-H.; Long, N.Q. A Novel Hybrid Model for Predicting Blast-Induced Ground Vibration Based on k-Nearest Neighbors and Particle Swarm Optimization. Sci. Rep. 2019, 9, 13971. [Google Scholar] [CrossRef]
  33. Yu, Z.; Shi, X.; Zhou, J.; Chen, X.; Qiu, X. Effective Assessment of Blast-Induced Ground Vibration Using an Optimized Random Forest Model Based on a Harris Hawks Optimization Algorithm. Appl. Sci. 2020, 10, 1403. [Google Scholar] [CrossRef]
  34. Zhou, J.; Asteris, P.G.; Armaghani, D.J.; Pham, B.T. Prediction of Ground Vibration Induced by Blasting Operations through the Use of the Bayesian Network and Random Forest Models. Soil. Dyn. Earthq. Eng. 2020, 139, 106390. [Google Scholar] [CrossRef]
  35. Hasanipanah, M.; Monjezi, M.; Shahnazar, A.; Jahed Armaghani, D.; Farazmand, A. Feasibility of Indirect Determination of Blast Induced Ground Vibration Based on Support Vector Machine. Measurement 2015, 75, 289–297. [Google Scholar] [CrossRef]
  36. Sheykhi, H.; Bagherpour, R.; Ghasemi, E.; Kalhori, H. Forecasting Ground Vibration Due to Rock Blasting: A Hybrid Intelligent Approach Using Support Vector Regression and Fuzzy C-Means Clustering. Eng. Comput. 2018, 34, 357–365. [Google Scholar] [CrossRef]
  37. Chen, W.; Hasanipanah, M.; Nikafshan Rad, H.; Jahed Armaghani, D.; Tahir, M.M. A New Design of Evolutionary Hybrid Optimization of SVR Model in Predicting the Blast-Induced Ground Vibration. Eng. Comput. 2021, 37, 1455–1471. [Google Scholar] [CrossRef]
  38. Ding, Z.; Nguyen, H.; Bui, X.-N.; Zhou, J.; Moayedi, H. Computational Intelligence Model for Estimating Intensity of Blast-Induced Ground Vibration in a Mine Based on Imperialist Competitive and Extreme Gradient Boosting Algorithms. Nat. Resour. Res. 2020, 29, 751–769. [Google Scholar] [CrossRef]
  39. Zhang, X.; Nguyen, H.; Bui, X.-N.; Tran, Q.-H.; Nguyen, D.-A.; Bui, D.T.; Moayedi, H. Novel Soft Computing Model for Predicting Blast-Induced Ground Vibration in Open-Pit Mines Based on Particle Swarm Optimization and XGBoost. Nat. Resour. Res. 2020, 29, 711–721. [Google Scholar] [CrossRef]
  40. Nguyen, H.; Bui, X.-N.; Bui, H.-B.; Cuong, D.T. Developing an XGBoost Model to Predict Blast-Induced Peak Particle Velocity in an Open-Pit Mine: A Case Study. Acta Geophys. 2019, 67, 477–490. [Google Scholar] [CrossRef]
  41. Nguyen, H.; Choi, Y.; Monjezi, M.; Van Thieu, N.; Tran, T.-T. Predicting Different Components of Blast-Induced Ground Vibration Using Earthworm Optimisation-Based Adaptive Neuro-Fuzzy Inference System. Int. J. Min. Reclam. Environ. 2024, 38, 99–126. [Google Scholar] [CrossRef]
  42. Dumakor-Dupey, N.K.; Arya, S.; Jha, A. Advances in Blast-Induced Impact Prediction—A Review of Machine Learning Applications. Minerals 2021, 11, 601. [Google Scholar] [CrossRef]
  43. Zhu, C.; Xu, Y.; Wu, Y.; He, M.; Zhu, C.; Meng, Q.; Lin, Y. A Hybrid Artificial Bee Colony Algorithm and Support Vector Machine for Predicting Blast-Induced Ground Vibration. Earthq. Eng. Eng. Vib. 2022, 21, 861–876. [Google Scholar] [CrossRef]
  44. Yu, Z.; Shi, X.; Zhou, J.; Gou, Y.; Huo, X.; Zhang, J.; Armaghani, D.J. A New Multikernel Relevance Vector Machine Based on the HPSOGWO Algorithm for Predicting and Controlling Blast-Induced Ground Vibration. Eng. Comput. 2022, 38, 1905–1920. [Google Scholar] [CrossRef]
  45. Yuan, H.; Zou, Y.; Li, H.; Ji, S.; Gu, Z.; He, L.; Hu, R. Assessment of Peak Particle Velocity of Blast Vibration Using Hybrid Soft Computing Approaches. J. Comput. Des. Eng. 2025, 12, 154–176. [Google Scholar] [CrossRef]
  46. Nguyen, H.; Bui, X.-N.; Topal, E. Enhancing Predictions of Blast-Induced Ground Vibration in Open-Pit Mines: Comparing Swarm-Based Optimization Algorithms to Optimize Self-Organizing Neural Networks. Int. J. Coal Geol. 2023, 275, 104294. [Google Scholar] [CrossRef]
  47. Qiu, Y.; Zhou, J.; Khandelwal, M.; Yang, H.; Yang, P.; Li, C. Performance Evaluation of Hybrid WOA-XGBoost, GWO-XGBoost and BO-XGBoost Models to Predict Blast-Induced Ground Vibration. Eng. Comput. 2022, 38, 4145–4162. [Google Scholar] [CrossRef]
  48. Abdar, M.; Pourpanah, F.; Hussain, S.; Rezazadegan, D.; Liu, L.; Ghavamzadeh, M.; Fieguth, P.; Cao, X.; Khosravi, A.; Acharya, U.R.; et al. A Review of Uncertainty Quantification in Deep Learning: Techniques, Applications and Challenges. Inf. Fusion. 2021, 76, 243–297. [Google Scholar] [CrossRef]
  49. Dorjsembe, U.; Lee, J.H.; Choi, B.; Song, J.W. Sparsity Increases Uncertainty Estimation in Deep Ensemble. Computers 2021, 10, 54. [Google Scholar] [CrossRef]
  50. Gawlikowski, J.; Tassi, C.R.N.; Ali, M.; Lee, J.; Humt, M.; Feng, J.; Kruspe, A.; Triebel, R.; Jung, P.; Roscher, R.; et al. A Survey of Uncertainty in Deep Neural Networks. Artif. Intell. Rev. 2023, 56, 1513–1589. [Google Scholar] [CrossRef]
  51. Gal, Y.; Ghahramani, Z. Dropout as a Bayesian Approximation: Representing Model Uncertainty in Deep Learning. In Proceedings of the 33rd International Conference on Machine Learning, PMLR, New York, NY, USA, 19–24 June 2016. [Google Scholar]
  52. Lang, N.; Kalischek, N.; Armston, J.; Schindler, K.; Dubayah, R.; Wegner, J.D. Global Canopy Height Regression and Uncertainty Estimation from GEDI LIDAR Waveforms with Deep Ensembles. Remote Sens. Environ. 2022, 268, 112760. [Google Scholar] [CrossRef]
  53. IS-6922; Criteria for Safety and Design of Structures Subjected to under Ground Blast. Bureau of Indian Standards: New Delhi, India, 1973.
  54. Rodríguez, R.; de Marina, L.G.; Bascompta, M.; Lombardía, C. Determination of the Ground Vibration Attenuation Law from a Single Blast: A Particular Case of Trench Blasting. J. Rock Mech. Geotech. Eng. 2021, 13, 1182–1192. [Google Scholar] [CrossRef]
  55. Trippi, R.R.; Turban, E. Neural Networks in Finance and Investing: Using Artificial Intelligence to Improve Real World Performance; McGraw-Hill, Inc.: Chicago, IL, USA, 1992; ISBN 978-1-55738-452-2. [Google Scholar]
  56. Cheng, B.; Titterington, D.M. Neural Networks: A Review from a Statistical Perspective. Statist. Sci. 1994, 9, 2–30. [Google Scholar] [CrossRef]
  57. Haykin, S. Neural Networks and Learning Machines; Pearson Education: Chennai, India, 2009. [Google Scholar]
  58. Kanevski, M.; Timonin, V.; Pozdnukhov, A. Machine Learning for Spatial Environmental Data: Theory, Applications, and Software; EPFL Press: New York, NY, USA, 2009; ISBN 978-0-429-14781-4. [Google Scholar]
  59. Lakshminarayanan, B.; Pritzel, A.; Blundell, C. Simple and Scalable Predictive Uncertainty Estimation Using Deep Ensembles. In Proceedings of the Advances in Neural Information Processing Systems; Curran Associates, Inc.: Red Hook, NY, USA, 2017; Volume 30. [Google Scholar]
  60. Hammed, O.S.; Popoola, O.I.; Adetoyinbo, A.A.; Awoyemi, M.O.; Adagunodo, T.A.; Olubosede, O.; Bello, A.K. Peak Particle Velocity Data Acquisition for Monitoring Blast Induced Earthquakes in Quarry Sites. Data Brief. 2018, 19, 398–408. [Google Scholar] [CrossRef]
  61. Pearce, T.; Brintrup, A.; Zaki, M.; Neely, A. High-Quality Prediction Intervals for Deep Learning: A Distribution-Free, Ensembled Approach. In Proceedings of the 35th International Conference on Machine Learning, PMLR, Stockholm, Sweden, 10–15 July 2018; pp. 4075–4084. [Google Scholar]
  62. Papadopoulos, G.; Edwards, P.J.; Murray, A.F. Confidence Estimation Methods for Neural Networks: A Practical Comparison. IEEE Trans. Neural Netw. 2001, 12, 1278–1287. [Google Scholar] [CrossRef] [PubMed]
  63. Khosravi, A.; Nahavandi, S.; Creighton, D.; Atiya, A.F. Comprehensive Review of Neural Network-Based Prediction Intervals and New Advances. IEEE Trans. Neural Netw. 2011, 22, 1341–1356. [Google Scholar] [CrossRef] [PubMed]
  64. Zhu, X.; Vondrick, C.; Fowlkes, C.C.; Ramanan, D. Do We Need More Training Data? Int. J. Comput. Vis. 2016, 119, 76–92. [Google Scholar] [CrossRef]
  65. Kraus, M.; Feuerriegel, S.; Oztekin, A. Deep Learning in Business Analytics and Operations Research: Models, Applications and Managerial Implications. Eur. J. Oper. Res. 2020, 281, 628–641. [Google Scholar] [CrossRef]
Figure 1. A diagram of a DNN model with two hidden layers, wherein green circles are bias terms attributed to the layers.
Geosciences 15 00182 g001
Figure 2. A schematic view of the uncertainty types.
Geosciences 15 00182 g002
Figure 3. Deep ensemble model with possible networks.
Geosciences 15 00182 g003
Figure 4. Location map of the ten quarries.
Geosciences 15 00182 g004
Figure 5. Scatterplot matrix of PPV dataset. Stars indicate individual observations for each variable pair, and the blue shaded areas show the kernel density estimates of the marginal distributions.
Geosciences 15 00182 g005
Figure 6. Evaluating predictive uncertainty in terms of the number of networks.
Geosciences 15 00182 g006
Figure 7. Performance of the developed models for blast-induced PPV prediction. Points show individual predictions; the red line is the least-squares regression fit; the black line is the 1:1 ideal reference.
Geosciences 15 00182 g007
Figure 8. PIs produced by the deep ensemble model for blast-induced PPV prediction.
Geosciences 15 00182 g008
Figure 9. Residual analysis of the models.
Geosciences 15 00182 g009
Figure 10. The performance of deep learning by the amount of data [65].
Geosciences 15 00182 g010
Table 1. Summary of studies on the prediction of blast-induced ground vibration using SC methods.
ReferencesDatasetMethodLocationResults
Khandelwal, 2010 [20]174 blast vibration recordsSVMJayant opencast mine of Northern Coalfields Limited (NCL)R2 0.960
Saadat et al., 2014 [21]69 blasting operations ANNGol-E-Gohar (GEG) iron mine, IranR2 of 0.957, and MSE of 0.000722
Hajihassani et al., 2015 [22]95 blasting operationsANN-ICAHarapan Ramai granite quarry in Johor, MalaysiaR2 of 0.856
Amiri et al., 2016 [23]75 blasting operationsANN-KNNShur river dam, IranR2 of 0.95, and RMSE of 1.7
Azimi et al., 2019 [24]70 blast vibration eventsGA-ANNSungun Copper Mine site in IranR2 of 0.98, MAPE of 60.01, and RMSE of 3.0471
Taheri et al., 2017 [25]89 blasting eventsABC-ANNMiduk copper mine, IranR2 of 0.95
Shang et al., 2020 [26]83 blasting eventsFA-ANNTan Dong Hiep quarry mine, VietnamRMSE of 0.464, MAE of 0.356, and R2 of 0.966
Bayat et al., 2020 [27]154 blasting eventsANN optimized by FAHozak limestone mine, Alborz state, IranR2 of 0.977
Nguyen et al., 2020 [28]85 blasting eventsHKM–ANN North of VietnamRMSE of 0.554, and R2 of 0.983
Fişne et al., 2011 [29]33 blast eventsFuzzy logic approachAkdaglar Quarry, İstanbul, TürkiyeRMSE of 5.31.
Ghasemi et al., 2013 [30]120 blast events Fuzzy logic modelSarcheshmeh copper mine, IranR2 of 94.59, RMSE of 2.73, and MAPE of 23.25
Hasanipanah et al., 2017 [31]86 blasting eventsCART, MRMiduk copper mine, IranR2 of 0.95, and RMSE of 0.17
Bui et al., 2019 [32]152 blasting eventsPSO-KNNDeo Nai open-pit coal mine, North of VietnamRMSE of 0.797, R2 of 0.977, and MAE of 0.385
Yu et al., 2020 [33]137 blasting eventsHHO-RF Tonglvshan open-cast mine, ChinaR2 of 0.94, MAE of 0.29, and RMSE of 0.34
Zhou et al., 2020 [34]102 blasting operationsFS-RF A blasting mineR2 of 90.32
Hasanipanah et al., 2015 [35]80 blasting operationsSVMBakhtiari Dam, IranR2 of 0.96
Sheykhi et al., 2018 [36]120 blast eventsFCM–SVR Sarcheshmeh copper mine, IranR2 of 0.853, and RMSE of 1.80
Chen et al., 2021 [37]95 blasting operationsMFA–SVRHarapan Ramai granite quarry, Johor, MalaysiaR2 of 0.984, and RMSE of 0.614
Ding et al., 2020 [38]136 blasting eventsXGBoost optimized by ICANui Beo openpit coal mine, VietnamRMSE of 0.736, R2 of 0.988, and MAE of 0.527
Zhang et al., 2020 [39]175 blasting operationsPSO-XGBoost Mine quarry in VietnamRMSE of 0.583, R2 of 0.968, and MAE of 0.346
Nguyen et al., 2019 [40]146 blasting eventsXGBoostDeo Nai open-pit coal mine in VietnamRMSE of 1.742, and R2 of 0.952
Nguyen et al., 2024 [41]200 blasting eventsEO-ANFIS10 quarries in NigeriaRMSE of 2.816, MAPE of 0.398, and R2 of 0.746
ANN: Artificial Neural Networks; SVM: Support Vector Machine; ICA: Imperialist Competitive Algorithm; KNN: K-Nearest Neighbors; GA: Genetic Algorithm; ABC: Artificial Bee Colony; FA: Firefly Algorithm; HKM: Hierarchical K-means Clustering; CART: Classification and Regression Tree; MR: multiple regression; PSO: Particle Swarm Optimization; RF: Random Forest; HHO: Harris Hawks Optimization; FS: Feature Selection; SVR: Support Vector Regression; FCM: Fuzzy C-Means Clustering; MFA: Modified FA; XGBoost: eXtreme Gradient Boosting; ANFIS: Adaptive Neural network based on the Fuzzy Inference System; EO: Earthworm Optimization; RMSE: Root Mean Square Error; MAE: Mean Absolute Error; MAPE: Mean Absolute Percentage Error.
Table 2. Characteristics of the data used.
D (m)W (kg)PPV (mm/s)
mean7751517.6364.17
std289.03353.8948.75
min3006508
25%537.5125028.14
50%775150046.94
75%1012.5180083.89
max12502950247.53
Table 3. Performance of the developed model in predicting blast-induced PPV.
EmpiricalDNNDeep Ensemble
RMSE24.6723.566 0.08422.674 0.056
R 2 0.7420.754 0.0210.77 0.018
NLL100.684.596 0.1484.44 0.092
PICP0.910.9 0.0360.95 0.021
MPIW2.1991.779 0.1971.769 0.085
Disclaimer/Publisher’s Note: The statements, opinions and data contained in all publications are solely those of the individual author(s) and contributor(s) and not of MDPI and/or the editor(s). MDPI and/or the editor(s) disclaim responsibility for any injury to people or property resulting from any ideas, methods, instructions or products referred to in the content.

