Article

Analyzing Recent Tectonic Activity Along the Karak Wadi Al Fayha Fault System Using Seismic, Earthquake, and Remote Sensing Data

by
Mu’ayyad Al Hseinat
1,2,*,
Malek AlZidaneen
1 and
Ghassan Sweidan
3
1
School of Science, Department of Geology, The University of Jordan, Amman 11942, Jordan
2
Arab Company for Laboratories and Soil (ACES), Department of Geophysics, Jeddah 23762, Saudi Arabia
3
Jordanian Seismic Observatory, Ministry of Energy and Mineral Resources (MEMR), Amman 140027, Jordan
*
Author to whom correspondence should be addressed.
Geosciences 2025, 15(5), 177; https://doi.org/10.3390/geosciences15050177
Submission received: 28 February 2025 / Revised: 16 April 2025 / Accepted: 12 May 2025 / Published: 14 May 2025
(This article belongs to the Special Issue Applied Geophysics for Geohazards Investigations)

Abstract

:
The Karak Wadi Al Fayha Fault (KWF) is a major NW-trending intraplate wrench fault system extending over 325 km from Western Karak in Jordan to Wadi Al Fayha in Saudi Arabia. Structurally linked to the Precambrian Najd Fault System, the KWF has been previously mapped using field observations, gravity, magnetic, and reflection seismic methods. However, these approaches lacked the vertical resolution necessary to characterize its shallow structure, leaving its influence on recent deposits and surface topography poorly understood. This study employs reflection seismic sections integrated with a Digital Elevation Model to refine terrain analysis and enhance fault mechanism solutions for determining the regional stress field pattern. Our results provide compelling evidence of the KWF’s upward propagation into the surface, as demonstrated by deformation of the uppermost Cretaceous and Cenozoic successions, distinct geomorphic features in the Digital Elevation Model, alignment of earthquake epicenters along the fault, and active landslides associated with its movement. We suggest that the reactivation of the KWF has been influenced by changing stress fields from the Late Cretaceous (Turonian) to the present. The Northwestern Arabian plate has undergone multiple tectonic stress transitions, including WNW–ESE compression associated with the Syrian Arc Fold-Belt system (Turonian–Plio-Pleistocene) and subsequent NNE–SSW extension linked to Red Sea rifting (Neogene–present). The analysis of fault mechanism solutions suggests that the latest fault movements result from the continued activity of the Irbid Rift event (Eocene) and the Dead Sea Transform Fault since the Miocene.

1. Introduction

Tectonic activity has played a critical role in shaping Earth’s surface, driving the formation of mountains, basins, and other major landforms. Neotectonics or active faults, which examine recent tectonic activity from the Holocene epoch to the present (past 11,000 years), focus on ongoing crustal movements (e.g., [1,2,3,4]). Evidence of neotectonic processes includes sediment accumulation in basins, earthquake activity, the burial or exposure of rocks, and the geomorphological evolution of landscapes [5]. Most earthquakes, however, result from the reactivation of inherited fault systems, which serve as the path of least resistance for strain relief. This study of active faults combines multiple disciplines, including geomorphology, seismology, plate tectonics, geodesy, and remote sensing, playing a crucial role in assessing geological hazard risks.
The Karak Wadi Al Fayha Fault (KWF) is an NW-trending intraplate tectonic structure that was identified by Bender [6], Stern and Johnson [7], and Al Hseinat et al. [8] (Figure 1 and Figure 2). It extends over 325 km from Western Karak in Jordan to Wadi Al Fayha in Saudi Arabia [9,10,11,12] and plays a significant geological role, particularly in the densely populated Karak region. Recent seismic activity, including minor earthquakes and landslides, indicates ongoing neotectonic movement along the fault.
In response, Karak Municipality has evacuated residents from several cracked houses, highlighting the fault’s impact on infrastructure and public safety. Previous geological and geophysical studies have mapped the KWF zone using field observations, gravity, magnetic, and reflection seismic methods [6,8,11,13,14]. However, these methods lacked the vertical resolution necessary to characterize the fault’s shallow structure, limiting our understanding of its influence on recent deposits and surface topography. The under-compacted nature of near-surface deposits and low signal-to-noise ratios in seismic profiles have further hindered the identification of shallow fault boundaries. Notably, no prior study has applied the focal mechanism solution (FMS) technique to analyze faulting processes along the KWF.
To address these limitations, this research combines high-resolution seismic imaging with a Digital Elevation Model (DEM) to improve terrain interpretation—an approach widely utilized in geological and seismic studies (e.g., [15,16,17,18]). Furthermore, Focal Mechanism Solutions (FMS) for selected earthquakes were examined to characterize the prevailing stress field. This technique helps identify fault orientations and the direction of slip, offering critical insights into the regional tectonic stress regime [19].
This study examines the structural evolution and deformation patterns of the KWF, with a focus on its connection to regional tectonic systems. The fault’s kinematics and reactivation history are analyzed in the context of shear stresses associated with the Precambrian Najd Fault System and subsequent tectonic events. Examining these processes is essential for understanding the fault’s role in regional geotectonics and evaluating its potential seismic hazards. Despite its importance, the deformation patterns of the KWF have not been thoroughly examined at this scale, underscoring the need for further investigation.

2. Regional Geological Background

The Precambrian basement underlying Jordan represents the northernmost portion of the Arabian–Nubian Shield, which formed before <600 million years ago [20]. This basement is most prominently exposed in the southern and southeastern parts of the country and is primarily composed of igneous and metamorphic rocks [13,21,22,23,24]. Over time, particularly since the mid-Precambrian, the area has experienced significant uplift and erosion, resulting in the partial removal of the original basement rock. This erosional history is evidenced by the presence of the Precambrian unconformity in Southern Jordan [23,25]. During the later stages of the Precambrian, the Arabian plate became integrated with neighboring tectonic entities along the African plate’s northeastern boundary within Gondwana. This tectonic convergence led to crustal stretching and the formation of the Najd Fault System—a network of major left-lateral strike-slip faults active between 620 and 540 Ma [19,20,26,27]. The earliest phases of this fault system’s activity align with the deposition of the Saramuj Formation, which was later intruded by igneous dikes [24,28] (Figure 3).
As the Early Cambrian began, Jordan and adjacent regions lay along the continental margin of the Afro-Arabian plate, with sedimentation taking place above the Rum Unconformity [20,29]. Subsequent geological periods, such as the Ashgillian glaciation during the Ordovician–Silurian, caused major erosional events in Southern Jordan and Northern Saudi Arabia [30]. These glacial impacts are recorded in the subsurface of Central Jordan, where the Silurian Glacial Unconformity distinctly separates the Upper Ordovician strata from those of the Silurian (Figure 3) [8]. Ice loading and unloading during this time are also thought to have reactivated older geological structures. Between the Middle Silurian and Early Cretaceous, significant uplift affected the Arabian plate, forming highland areas in Central and Southern Jordan. These areas were later subject to extensive erosion, coinciding with European tectonic events like the Caledonian and Hercynian orogenies [8,20,31,32].
In the Late Turonian, the closure of the Meso-Tethys Ocean and the collision between the Afro-Arabian and Eurasian plates caused horizontal compression along the Levant margin [33,34]. This initiated two paleo-stress phases: first, a WNW-ESE compressional regime during the Turonian that produced the Syrian Arc Fold-Belt (Figure 3) [35,36,37,38], and second, a NNE–SSW extensional regime that began in the Neogene and persists today. The latter is linked to Red Sea rifting and sinistral motion along the Dead Sea Transform Fault (DSTF) [39].
Near the DSTF, stress orientations vary, becoming sub-parallel or sub-perpendicular to the fault’s trace [40]. Eyal [38] proposed that these variations stem from the interaction between the Syrian Arc and Dead Sea stress regimes.
During the Late Eocene, the Afar mantle plume uplifted Northeastern Africa, gradually extending its impact into the Levant. This contributed to the development of low-relief landscapes in Jordan, Israel, and Egypt [41,42,43,44,45,46,47]. The combined influence of this plume, the Red Sea rifting, and volcanic activity beneath the lithosphere significantly altered the tectonic character of the region, resulting in the formation of structures like the Irbid Rift and the DSTF.
The N–S extension of the Irbid Rift intersected early development phases of the DSTF during the Early Miocene, and both features continue to shape Jordan’s tectonic landscape today [48,49]. Recent data confirm ongoing N–S extension and localized E–W compression near the DSTF, with older faults adjusting to the evolving stress regime since the Late Cretaceous [39,49,50,51]. While the DSTF accommodates relative motion between the Arabian and African–Sinai plates, it responds to rather than drives the region’s deformation [52]. This study integrates reflection seismic, seismological data, and remote sensing techniques to assess the activity of the KWF and its interactions with the prevailing stress field.

3. Data and Methods

3.1. 2D Reflection Seismic Ad Well Data

In collaboration with the Ministry of Energy and Mineral Resources of Jordan and the University of Jordan, a total of 71 two-dimensional seismic lines were acquired across the study region, spanning an area of ~18,150 km² (Figure 2). The combined length of these profiles reaches 3200 km, with line spacing ranging from 2 to 4 km. Data acquisition was carried out using vibroseis sources operating in the 8–70 Hz frequency range, with signals generated every 100 m. The geophone array consisted of SM-4 10 Hz, LRS 1011, and GEO-10 Hz sensors, connected via land streamers of varying lengths—96 m (48 channels), 200 m (96 channels), and 250 m (120 channels)—with a geophone interval of 2 m. The maximum recording time for each shot was 2.55 s.

3.1.1. Seismic Data Processing and Quality Control

Following the acquisition, the seismic data underwent a series of processing steps to produce time-migrated seismic sections (see Table 1). The processed profiles were then imported into the IHS™ KINGDOM software (v.2018.0) for interpretation and quality assurance, which included addressing mis-ties. These mis-ties—caused by inconsistencies between intersecting seismic lines or between seismic and well datasets—were evaluated through wiggle trace alignment, time correlation, and amplitude matching, following the approach of Bishop and Nunns [53]. Corrections were applied to ensure a coherent time–depth conversion. Additional processing involved refining horizon picks and standardizing amplitude and phase characteristics across the seismic dataset. Any anomalies that could interfere with accurate interpretation were detected and corrected accordingly.

3.1.2. Seismic-Well Correlation

The processed seismic sections were correlated with three exploration wells: Al-Jafr-01 (JF-01) [54], Al-Jafr-02 (JF-02) [55], and Al-Jafr-03 (JF-03) [56], drilled in the Al-Jafr region as part of Jordan’s oil and gas exploration efforts (Figure 2). Figure 4 presents the stratigraphic correlations based on available well data. Multiple seismic lines intersect well locations, allowing for a direct correlation between well lithologies and seismic reflectors (Figure 2).

3.2. Digital Elevation Model (DEM)

High-resolution multispectral data are crucial for digital image processing, enhancing geological lineament extraction [57,58,59,60]. Satellite imagery is widely used to identify geological lineaments, which often indicate subsurface features like fault zones [61,62,63,64]. Analytical hill-shading techniques simulate topography using artificial light from specific angles, making features perpendicular to the light more visible [65,66,67,68]. Multi-illumination methods applied to ALOS/PALSAR hill-shaded images enhance lineaments by using alternative lighting directions. Mark [69] suggested combining relief images from multiple azimuths, while Jenny [70] developed a four-angle method for better relief quality. The ALOS/PALSAR DEM, with a 12.5 m resolution, was developed by the University of Alaska Fairbanks and is freely available. The DEM, acquired on October 4th, 2009, was mosaicked, clipped, and used to generate multi-directional hill-shaded images in ArcGIS 10.8.2.

3.3. Fault Mechanism Solution (FMS)

FMS is essential for understanding the movement along faults during seismic events and is commonly employed to analyze regional stress tensor patterns (e.g., [71,72]). Different styles of faulting—such as normal, strike-slip, and thrust mechanisms—serve as key indicators of tectonic stress conditions and help identify the orientation of the maximum horizontal compressive stress (SHmax). This analytical approach assumes that the focal mechanism’s kinematic axes—namely the pressure (P), null (B), and tension (T) axes—are statistically aligned with the principal stress directions (σ1, σ2, and σ3). Nevertheless, the specific fault plane that ruptures during an earthquake is inherently associated with these kinematic orientations. Consequently, the SHmax direction deduced from FMS is shaped not only by the stress regime but also by the orientation and characteristics of the reactivated fault and the area’s existing structural configuration.
This study analyzed 5 earthquake events that occurred between 1983 and 2024, with local magnitudes (ML) ranging from 2.9 to 3.8. These events were selected based on stringent criteria, including high-quality waveform recordings, a well-distributed seismic station network with good azimuthal coverage, and clear P-wave first-motion polarity data. Although numerous earthquakes were recorded during this timeframe, only those meeting these rigorous standards were chosen to ensure the reliability of the FMS. The seismic waveform data were processed using the “SEISAN 12” earthquake analysis software (v.2021) [73,74,75], applying a systematic analytical approach to determine FMS. The earthquakes included in the analysis were relatively shallow, with focal depths ranging from ~ 7 km to 20 km below the Earth’s surface [76].

4. Results

4.1. Stratigraphic Framework

The seismic stratigraphic framework in this study expands on previous interpretations by incorporating well data from JF-01, JF-02, and JF-03 (see Figure 2), building upon the foundation established by Al Hseinat et al. [8].

4.2. Key Seismic Horizons and Units

Table 2 summarizes the significant seismic horizons identified in this study. Well-log data indicate a prolonged depositional hiatus spanning the Middle Silurian to Lower Cretaceous, suggesting extensive erosion and non-deposition. This stratigraphic gap aligns with regional tectonic uplift and exposure events Figure 4 (e.g., [31]).

4.3. Seismic Characteristics of Key Reflectors

The TPN horizon, the deepest and most continuous reflector, exhibits low- to medium-amplitude, irregular seismic responses (Figure 5, Figure 6 and Figure 7). It defines the acoustic basement, below which no reflections are observed. The overlying upper Precambrian Saramuj Formation presents a distinct seismic signature, truncated at the top by the BCU (Seismic sections).
The BCU reflector is a prominent angular unconformity, displaying a wavy and irregular geometry in the southeast but becoming more uniform to the northwest (Figure 6). This horizon marks the base of the Cambrian Saleb Formation. It aligns with the ‘Rum Unconformity’ identified in Southern Jordan by Powell et al. [29]. Cambrian sedimentary layers attain a maximum thickness of ~2 km, gradually thinning to around 810 m toward the northeast [8]. Key internal seismic reflectors within this sequence align with the bases of the Burj, Umm Ishrin, and Disi formations and are identifiable across the majority of the seismic profiles (Figure 5, Figure 6 and Figure 7).
The Ordovician unit lies above the BO horizon and is capped by the BSU, an irregular and wavy unconformity (Figure 5, Figure 6, Figure 7, Figure 8, Figure 9 and Figure 10). Internal reflectors within this sequence correspond to the Base of Hiswa, Base of Dubaydib, and Base of Mudawwara Formations, which are distinguishable in most seismic profiles. The Silurian unit, confined between the BSU and BLCU, comprises a well-stratified succession with parallel to sub-parallel, strong-amplitude reflections. The BSU is associated with the Silurian Glacial Unconformity, as documented by Al Hseinat et al. [8].
The Lower Cretaceous sequence consists of a relatively thin but uniform unit traceable across the entire study area. The BLCU and BUCU horizons define its base and top, respectively (Figure 5, Figure 6, Figure 7, Figure 8, Figure 9 and Figure 10). Correlation with well-log data suggests the BLCU corresponds to the base of the Kurnub Sandstone Formation (Early Cretaceous). This boundary is characterized by a continuous but irregular/wavy reflector, demarcating the contact between the Silurian and Lower Cretaceous strata. The unconformity represents a significant period of uplift and erosion from the Middle Silurian to the Early Cretaceous (Figure 3) [31].
The Upper Cretaceous deposits exhibit irregular yet continuous reflection patterns. Determining the top boundary of this unit (Figure 5, Figure 6, Figure 7, Figure 8, Figure 9 and Figure 10) and its transition to the overlying BCD deposits is challenging across much of the study area. Where observable, these deposits display a distinct but wavy, continuous reflector (Figure 6, Figure 9 and Figure 10).

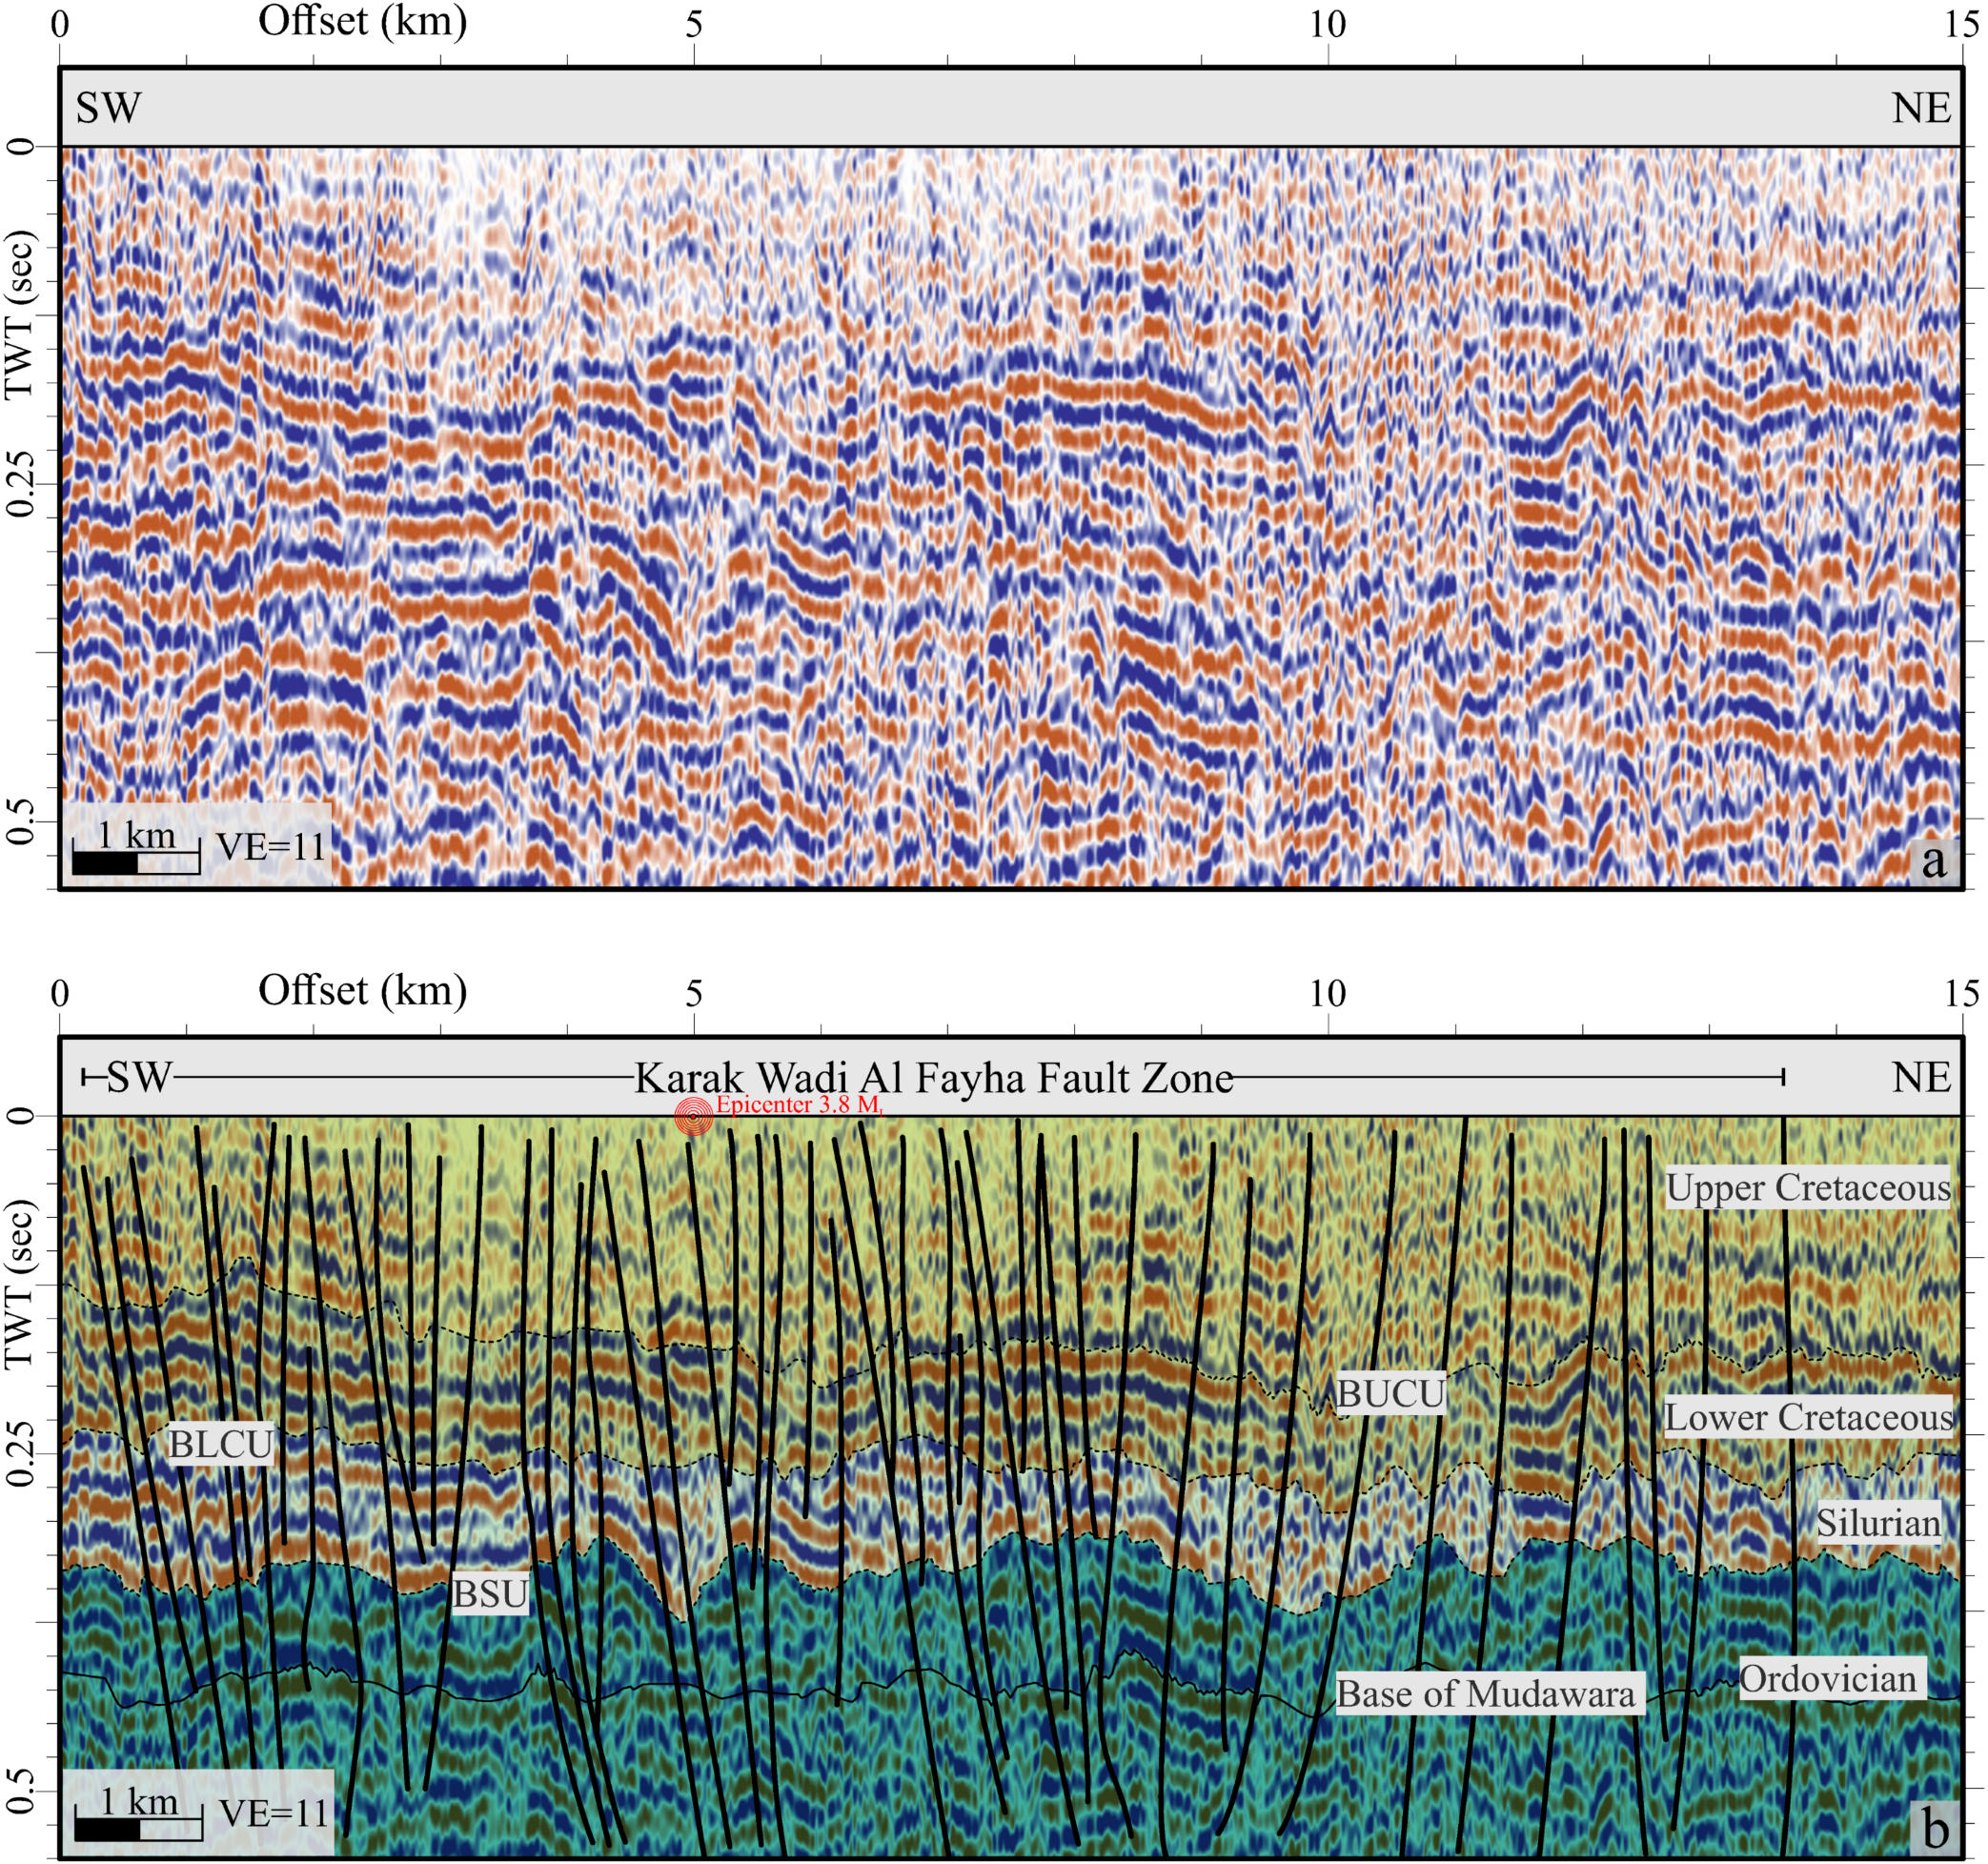
4.4. Subsurface Characteristic of the KWF

4.4.1. Seismo-Tectonic Characteristic

The seismic profiles in Figure 2 cross the KWF extension through the study area, though no profiles are available in the northwest corner. However, several essential seismic sections (Figure 5, Figure 6, Figure 7, Figure 8, Figure 9 and Figure 10) are interpreted to characterize the subsurface structure of the KWF. Figure 5, Figure 6 and Figure 7 provide an overall view, displaying the deformed rock layers from Precambrian igneous formations to the uppermost Cretaceous deposits, while Figure 8, Figure 9 and Figure 10 focus on sedimentary layers ranging from the Cambrian period to recent deposits.
Figure 5 illustrates a structurally complex fault zone in the southeastern portion of the study area, featuring two sub-parallel primary normal faults along with several smaller internal fault segments. These major faults, separated by ~7 km, cut across the full stratigraphic column—from Precambrian to uppermost Cretaceous—demonstrating features of growth strata. The internal faults form a horst-like geometry, suggesting the presence of a negative flower structure. In the section between 7 km and 10 km, the stratigraphic layers spanning from the Cambrian to the uppermost Cretaceous define a graben system.
Toward the northwest, the structure narrows from ~5 km in Figure 6 to 3.5 km in Figure 7, with densely clustered normal faults. These faults significantly impact the entire rock sequence, from Precambrian formations to uppermost Cretaceous deposits, with several extending into recent deposits and reaching surface levels.
Further to the northwest, the upper sections of the seismic profiles reveal highly deformed Cretaceous and Cenozoic successions (Figure 8, Figure 9 and Figure 10), with KWF segments extending to the surface. Seismic sections in Figure 9 and Figure 10 show earthquake epicenters at offsets of 6.5 km and 5 km, corresponding to magnitudes of 3.1 ML and 3.8 ML, respectively.
Near the DSTF in this study’s northwest corner, there are several earthquake epicenters (Figure 11). Four earthquakes, with magnitudes ranging from 3.1 ML to 3.8 ML, align with the surface trace of the KWF.
Figure 11 provides compelling evidence of active landslides in Karak City. Over the past decade, Karak Municipality has been forced to evacuate multiple homes due to severe structural damage caused by these landslides. Notably, eight earthquake epicenters are situated within this active landslide zone, underscoring the strong correlation between seismic activity and ongoing ground instability.

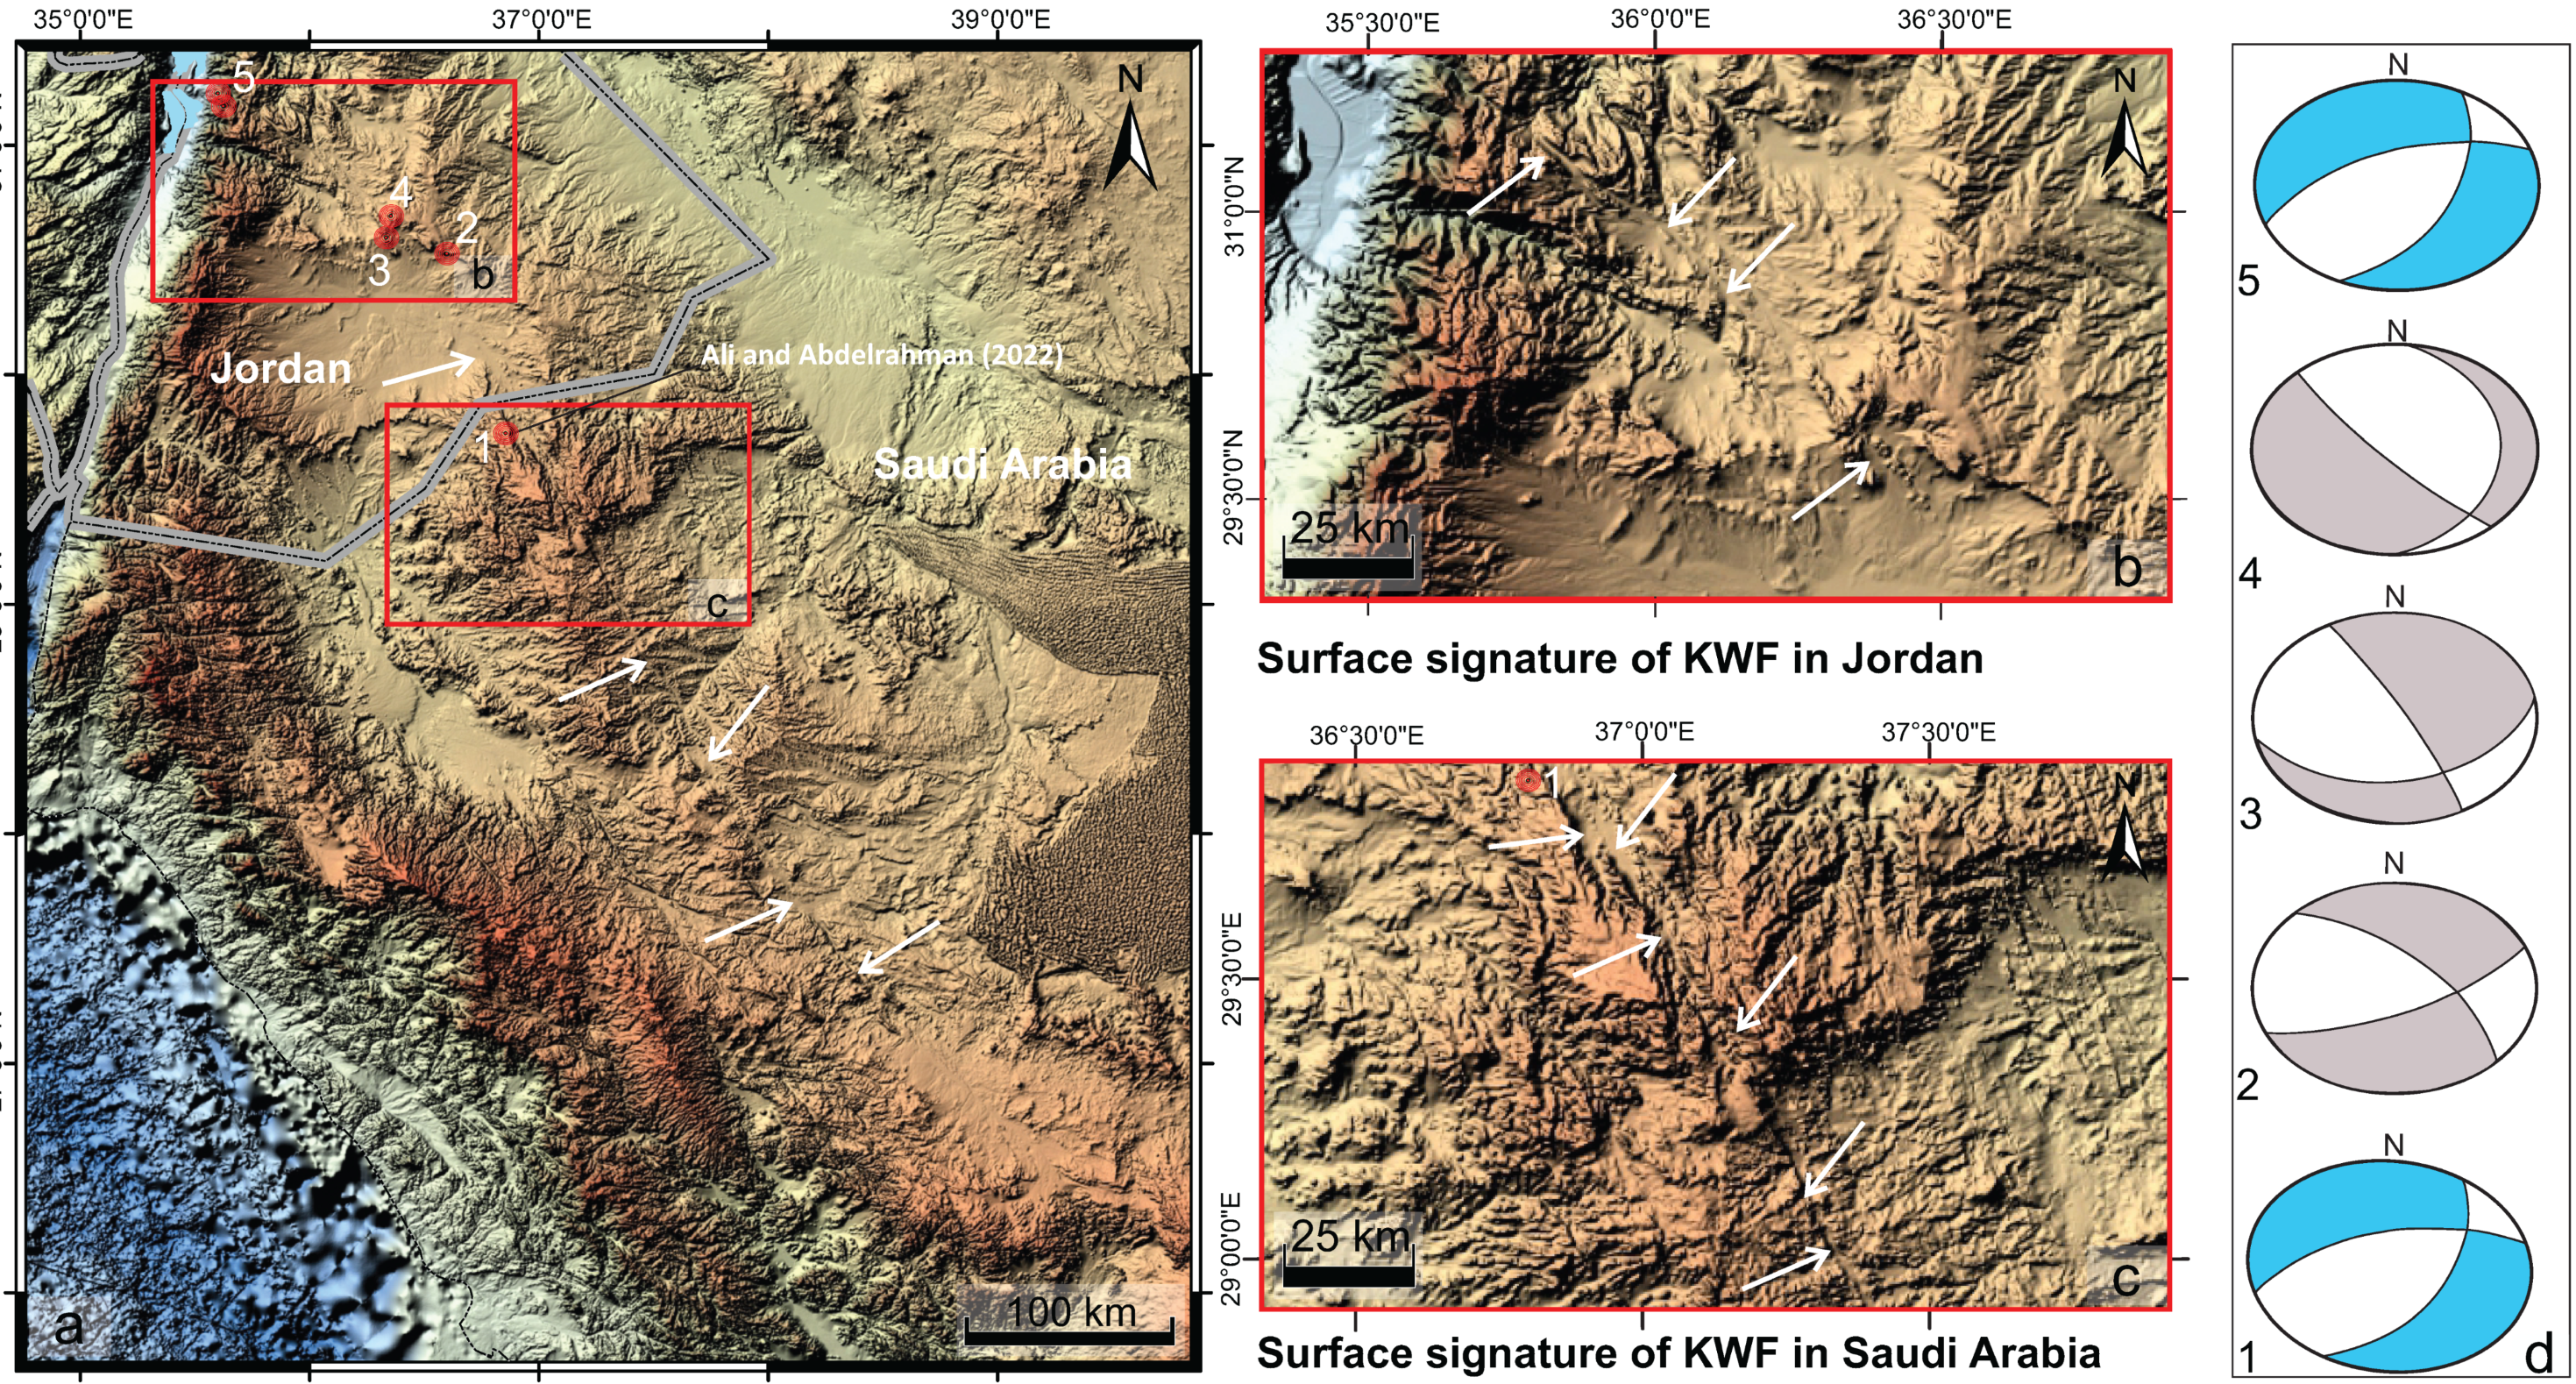
4.4.2. DEM and FMS Results

The multi-illumination hill-shaded images in Figure 12a–c were created by integrating multiple light azimuths, effectively enhancing the visualization of surface relief features oriented in different directions. This technique reveals a distinct pattern of both positive and negative elements. As indicated by the white arrows in Figure 12b,c, the negative relief features primarily correspond to the surface expression of the KWF in Earth’s topography. Conversely, the positive relief elements represent elevated landforms, such as topographic ridges and scarps.
The FMS analysis shown in Figure 12d identifies both strike-slip and oblique-slip faulting. FMS (moment tensors) provide two possible fault motion scenarios, represented by two nodal planes (e.g., [77]), which are essential for accurately interpreting fault behavior during seismic events. To ensure consistency with regional paleo stress analysis, we selected the nodal planes that best align with these findings. Consequently, seismic activity has been classified into two areas based on earthquake distribution, key tectonic structures (DSTF and KWF), and faulting characteristics. Three seismic events along the KWF segments exhibit normal faulting, with nodal planes oriented in the NNE–SSW and NW–SSE directions. In contrast, analysis of two earthquakes at the DSTF–KWF intersection reveals a transtensional mechanism, with nodal planes oriented in the NW–SE and NE–SW directions.

5. Discussion

5.1. Seismo-Stratigraphic Evolution

The stratigraphic evolution of the Central Jordan Region, from Precambrian deposits onward, has been extensively analyzed by Al Hseinat et al. [8]. However, with the available seismic dataset, their interpretation can be extended to include the study area. Accordingly, the stratigraphic evolutionary history from the Precambrian igneous rocks to the most recent deposits can be summarized as follows:
The TPN horizon represents a nonconformity surface that separates the Precambrian basement from the overlying upper Precambrian deposits (Figure 5, Figure 6 and Figure 7). This geological boundary is well recognized in Southern Jordan and near the Jordan–Saudi border [23,25,29].
Well-log data suggest the presence of Saramuj Formation deposits above the TPN, indicating extensive Precambrian rifting and erosion before the Early Cambrian. Seismic analysis reveals that these deposits are truncated by the BCU horizon, representing an angular unconformity comparable to the Rum Unconformity in Southern Jordan [29]. On a broader scale, subsidence linked to the Najd Fault System led to the transgression of the Tethys Ocean into the Eastern Arabian Plate during the earliest Cambrian, with this extension continuing into the late Early Cambrian, ultimately influencing the plate’s western margin [20,26].
The thickest Cambrian and Ordovician deposits in the study area can be attributed to Jordan’s position along the marginal shelf of the African–Arabian plate during the Early Cambrian [27]. Additionally, the gradual subsidence facilitated the accumulation of sediments from the south, maintaining sea-level stability [20,27]. This extended period of shelf conditions persisted until later orogenic events, leading to the substantial thickness of these deposits, as also observed by Al Hseinat et al. [8].
The truncation of uppermost Ordovician reflections against the BSU horizon serves as a key indicator of the Silurian–Ordovician boundary (Figure 6). This interpretation aligns with the work of Al Hseinat et al. [8], who provided a detailed subsurface mapping of this boundary. Seismic profiles reveal a notable absence of sedimentary deposits between the Middle Silurian and the lowermost Cretaceous (Figure 5, Figure 6 and Figure 7), suggesting an extended period of uplift and/or non-deposition. This stratigraphic gap has been previously recognized by Ruban et al. [31], Gvirtzman and Weissbrod [78], and Al-Jallal [79]. According to Ruban et al. [31], this period corresponds to the separation of the Hun Superterrane (Middle Silurian–Devonian), with early Cimmerian subduction dynamics exerting a more direct influence on the region’s tectonic history.
In the aftermath of this major event, the Early Cretaceous saw the extensive deposition of Kurnub Sandstone, which was transported eastward across the Arabian plate [20]. The overlying Upper Cretaceous strata suggest a shallow marine environment characterized by carbonate platforms, chert, and phosphate deposits [80]. The BUCU horizon is identified as an erosional unconformity, reflecting a period of marine regression (seismic lines). Seismo-stratigraphic interpretation of the uppermost layers was challenging due to the low signal-to-noise ratio in the seismic data, making the precise delineation of the base and top of the Cenozoic sediments difficult. However, the BCD horizon was observable in certain seismic sections (Figure 7).

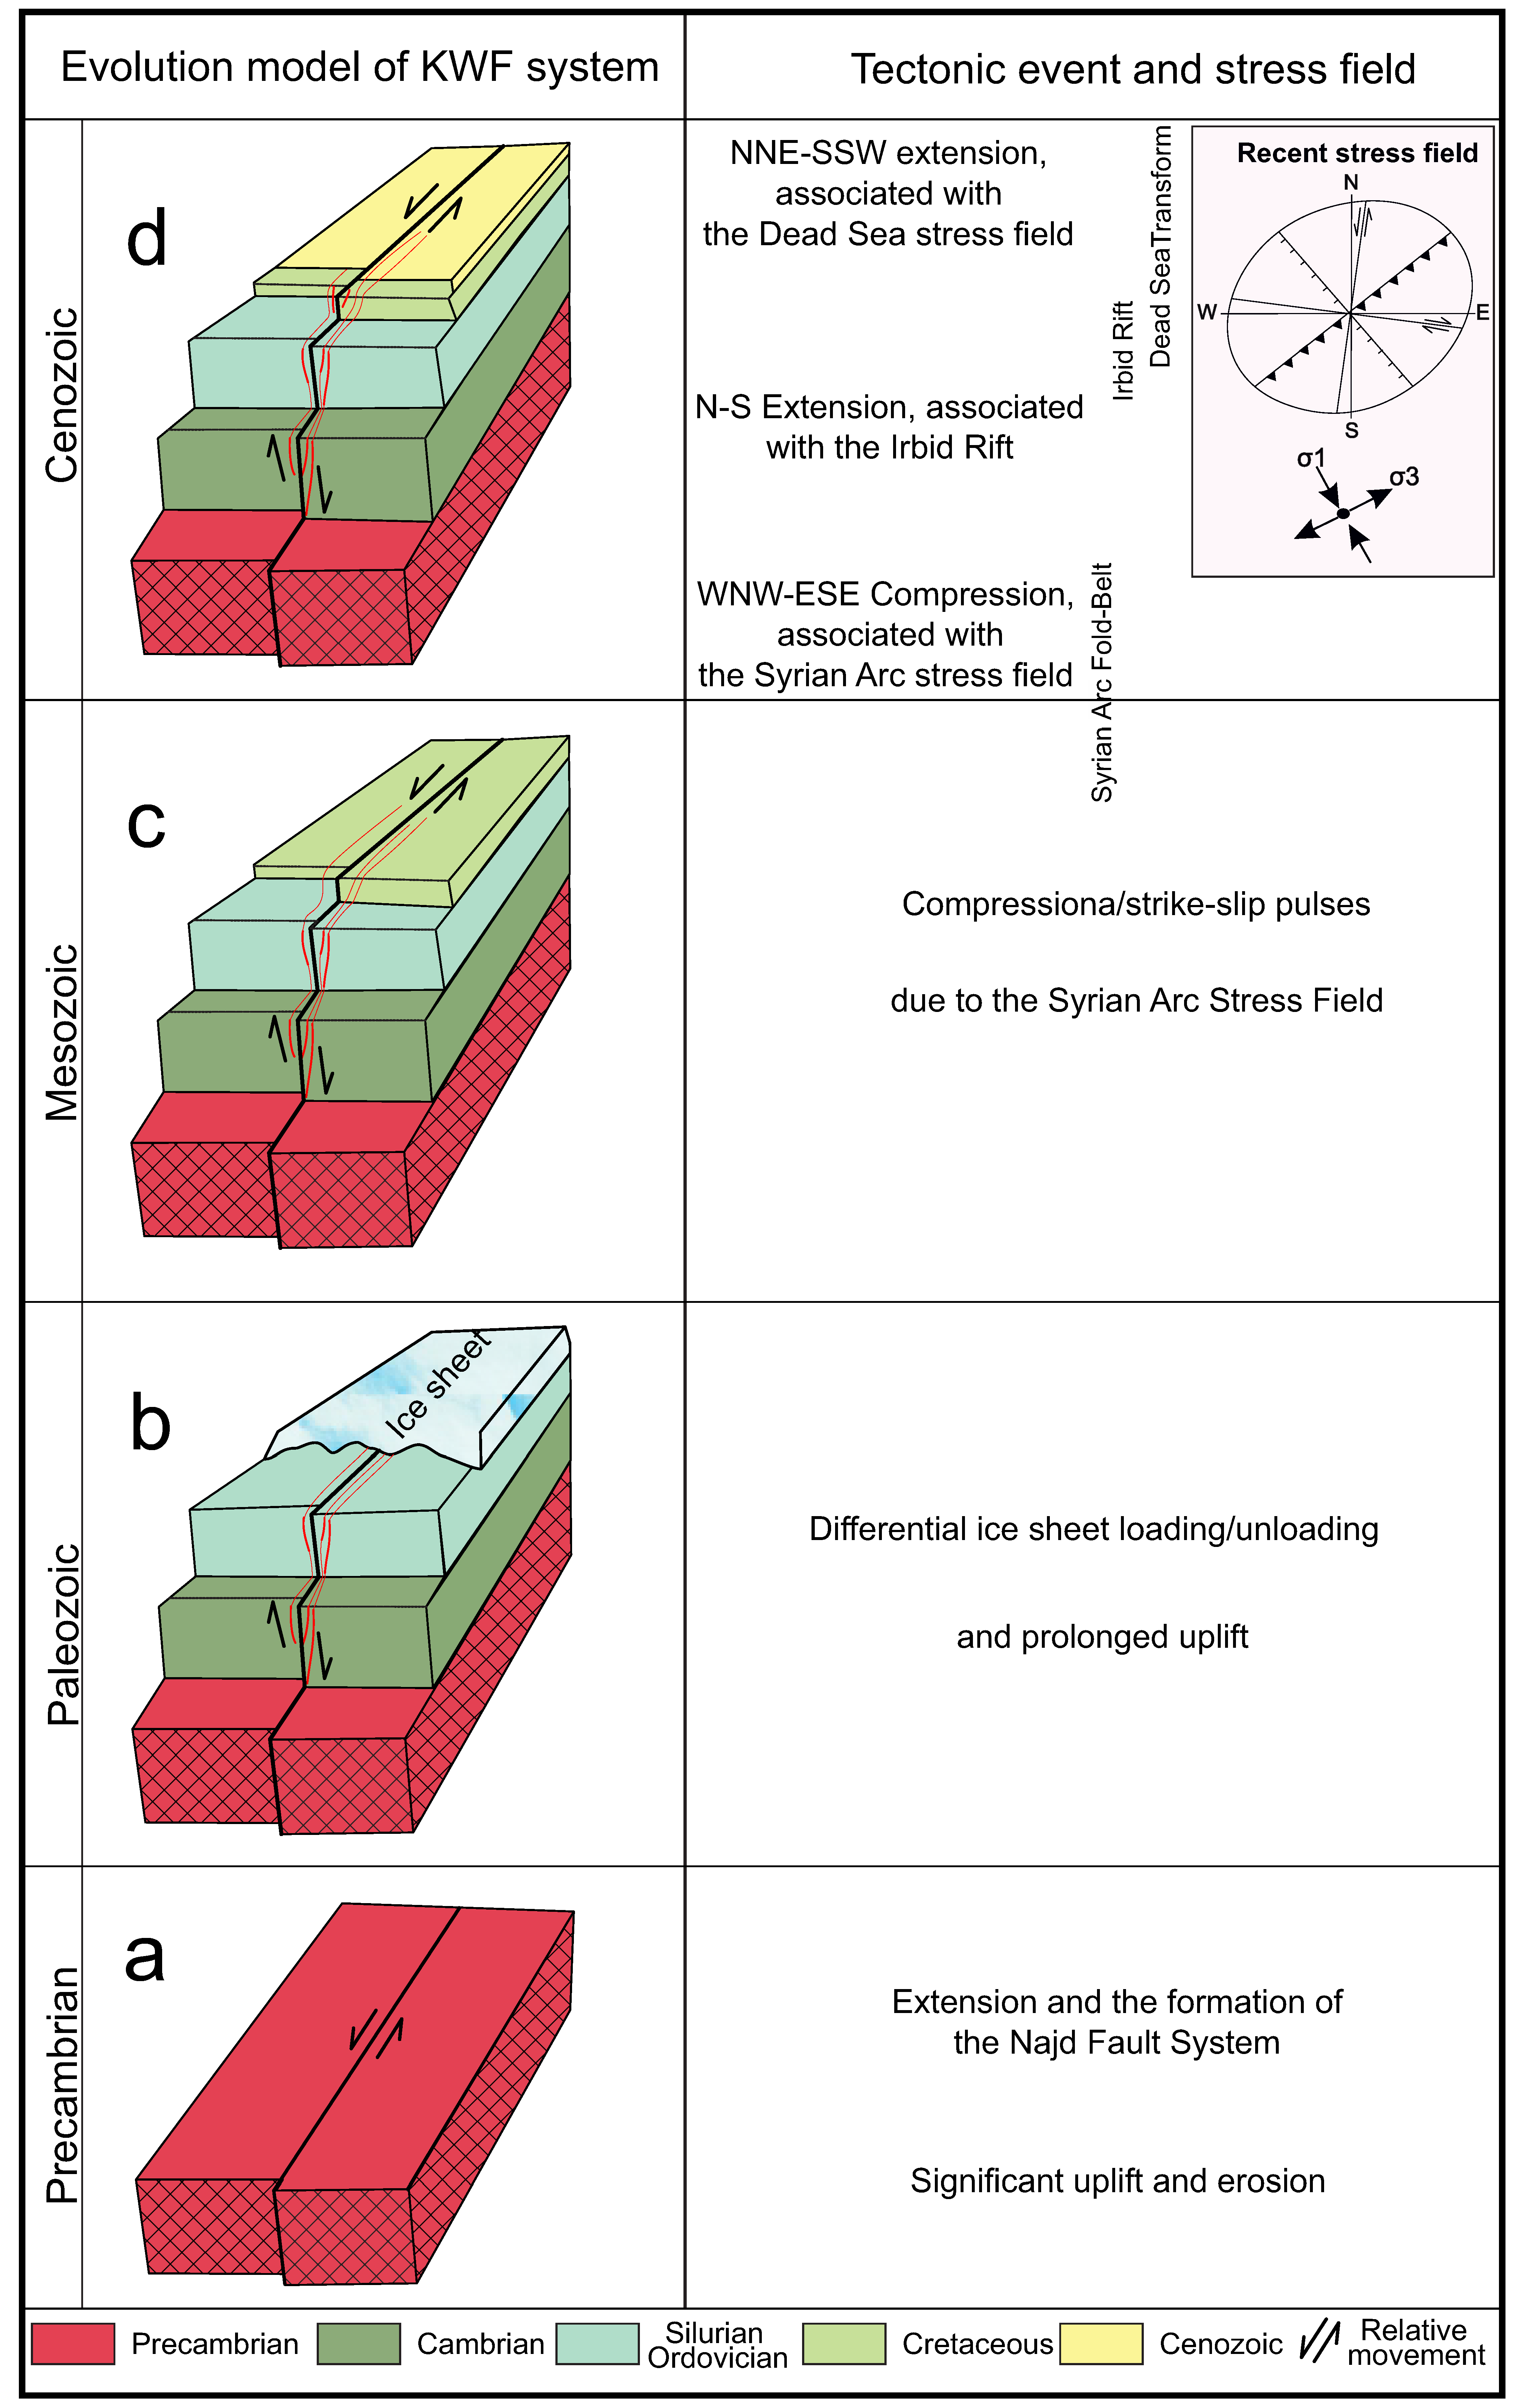
5.2. Seismo-Tectonic Evolution of the KWF

Drawing on the findings from this study, along with insights from previous research, this discussion examines the initiation and reactivation history of the KWF, spanning from the late Precambrian to the present.
Seismic sections spanning the study area from southeast to northwest reveal considerable deformation in post-Precambrian deposits, marked by numerous normal faults that shape a horst–graben system. The subsurface structure of the KWF is segmented, displaying en échelon fault patterns with stepover offsets (Figure 5, Figure 6 and Figure 7). This segmentation forms short fault segments that interconnect adjacent en échelon structures, resulting in a continuous fault zone. Additionally, the presence of flower-like structures indicates a notable strike-slip component.
Calculations of vertical displacement along major fault segments indicate that the most significant movement occurred during the Precambrian era. Additionally, seismic interpretations (Figure 8, Figure 9 and Figure 10) suggest that these fault segments have propagated upward through the Upper Cretaceous deposits, extending to the surface or near-surface. The following discussion explores regional tectonics, with a particular focus on recent tectonic forces that may have contributed to the reactivation of the KWF.

5.3. Late Precambrian–Latest Cretaceous Tectonics

During the late Precambrian, the convergence of the Arabian plate with adjacent tectonic units along the northeastern boundary of the African plate within Gondwana led to crustal extension and initiated the formation of the Najd Fault System [19,20,26]. Within this tectonic framework, the origin of the KWF is interpreted (Figure 13a). This interpretation is consistent with observations by Al Hseinat et al. [8], who identified transtensional stress signatures in the region during this era. These insights also align with Stein’s [19] work, which linked late Precambrian rifting and strike-slip faulting in Northern Afro-Arabia to the development of the Najd system in both time and geography. Regionally, NW–SE-oriented wrench fault systems observed across the Arabian plate have often been associated with the broader Najd Fault System by various researchers (e.g., [26,81,82,83]).
To avoid redundancy, the subsequent tectonic evolution from the late Precambrian to the latest Cretaceous is briefly outlined here, based on the model proposed by Al Hseinat et al. [8]. This includes (i) reactivation of Paleozoic faults linked to variable ice sheet dynamics and prolonged uplift (Figure 13b); (ii) intense faulting driven by compressional and strike-slip tectonics from the Late Cretaceous through the Late Eocene, which also contributed to the development of the Syrian Arc Fold-Belt (Figure 13c); and (iii) ongoing fault activity associated with the DSTF since the Miocene (Figure 13d).

5.4. Recent Tectonic Activity Along the KWF

Field investigations along the northwestern extension of the KWF reveal complex deformation patterns within the exposed Upper Cretaceous strata, most notably marked by the presence of two active landslides (Figure 14). These observations are consistent with the results of Al Hseinat et al. [8], who documented southeast-dipping sedimentary layers oriented toward Karak city—an indicator of displacement associated with fault movement. The link between fault orientation and slope instability is well-established; landslides tend to occur more readily when the slope direction is parallel to the fault strike [84]. Active faults often foster conditions favorable for landslides by reshaping the landscape, creating steep terrain, and weakening the structural integrity of rocks. Earthquakes, frequently generated by these faults, act as common triggers for such slope failures. This connection underscores the importance of assessing active fault zones as potential landslide hazards, particularly in seismically active areas.
Collectively, these findings provide compelling evidence of ongoing fault activity and its direct influence on surface deformation, reinforcing the tectonic significance of the KWF in shaping the regional landscape.
Additionally, DEM analysis identifies a prominent NW–SE-trending lineament, marking the surface expression of the KWF (Figure 12a–c). This structural feature, combined with earthquake records indicating several seismic events over the past century (Figure 2), suggests ongoing fault activity. However, a comprehensive review of seismic data from 1907 to 2025 indicates that the KWF exhibits relatively low seismic activity. Despite this, fault displacement does not always generate detectable seismic waves, as movement can occur through fault creep. This process, which can be continuous or episodic, has been extensively well-known in previous studies (e.g., [85,86,87,88]).
Furthermore, several studies, including Aldersons et al. [89], Abou Elenean et al. [90], Hofstetter et al. [91,92], and Wetzler et al. [93], have consistently shown that earthquakes in this region typically originate at depths shallower than 30 km, within the lower portion of the upper crust. This well-established pattern highlights the predominance of shallow seismicity in the area, lending further support to the observations and conclusions presented in this study.
The preceding discussion raises an important question: What might be the potential underlying cause of the recent tectonic activity?
Since the Turonian, the northwestern segment of the Arabian Plate has been shaped by three primary paleo-stress regimes (e.g., [35,36,37,38]). These include (1) a WNW–ESE compressional regime attributed to the Syrian Arc stress field, which contributed to the formation of the Syrian Arc Fold-Belt (Figure 1); (2) a N–S extensional phase linked to the development of the Irbid Rift, active from the Oligocene (~25–17 Ma) and remains ongoing (Figure 3) [39,44]; and (3) a NNE–SSW extensional regime associated with the Red Sea rifting and left-lateral displacement along the DSTF, reflecting the influence of the Dead Sea stress field from the Late Miocene onward [39,94]. The Syrian Arc stress field has exerted widespread tectonic control throughout the Levant, impacting areas such as Northern Sinai, Israel, Palestine, Jordan, Lebanon, and Syria (e.g., [38,95,96]). The N–S extension associated with the Irbid Rift is also consistent with tectonic activity along the Wadi Sirhan Graben, which experienced renewed movement during the Oligocene and remains tectonically active [50]. This extensional regime has promoted the development of normal faults in Jordan, oriented orthogonal to the σ3 axis [8].
The identification of a flower-structure pattern in the seismic profiles supports the presence of a strike-slip faulting component, likely active during the Late Cretaceous or afterward (see Figure 5 and Figure 6). Tectonic activity during the Early Miocene is associated with major regional events such as the Bitlis–Zagros collision, the initiation of Red Sea rifting, and the evolution of the DSTF (Figure 3) (e.g., [40,97,98]). Around 20 million years ago, the DSTF intersected the Irbid Rift, leading to the deformation of both the Arabian and Sinai subplates, primarily along a north–south trend (e.g., [99,100,101]). This N–S extensional regime continues today near the DSTF, accompanied by localized zones of E–W compression [39]. Importantly, faults generated during earlier tectonic events can become reactivated, regardless of their original orientation relative to newer stress fields (e.g., [102]).
The westernmost portion of the KWF lies within a geologically complex region marked by the convergence of several fault systems [103]. In this zone, tectonic deformation may also be influenced by activity along DSTF, making the interpretation of fault dynamics more challenging. FMS near the junction of the DSTF and KWF indicates a transtensional regime, with nodal planes trending northward and in a northwest–southeast orientation. These patterns are consistent with left-lateral strike-slip faulting, which aligns with the main traces of the DSTF. Transtensional environments typically develop at releasing bends along strike-slip faults or within oblique rift systems [104]. Such settings are often associated with lithospheric thinning and are capable of forming deep sediment-filled depressions, including pull-apart basins.
The subsurface characteristics of the KWF reveal normal faults within a half-graben system that exhibit flower-like structures, suggesting a combination of strike-slip and normal fault components. This interpretation is further reinforced by FMS analysis, which confirms a normal fault mechanism along the KWF and transtensional features at its intersection with the DSTF, reflecting the ongoing activity of both the Irbid Rift and DSTF. On a regional scale, these findings are consistent with those of Ali and Abdelrahman [105] (Figure 12; event No. 1), who identified a dominant transtensional component along the Najd Fault System in Saudi Arabia.
Thus, the rejuvenation of the pre-existing KWF has been driven by shifts in the regional stress field from the Eocene to the present. These findings have potential implications for seismic hazard assessments, particularly in terms of site response, fault behavior, or regional hazard models, especially in regions such as Karak City, which could benefit from further investigation in future work.

6. Conclusions

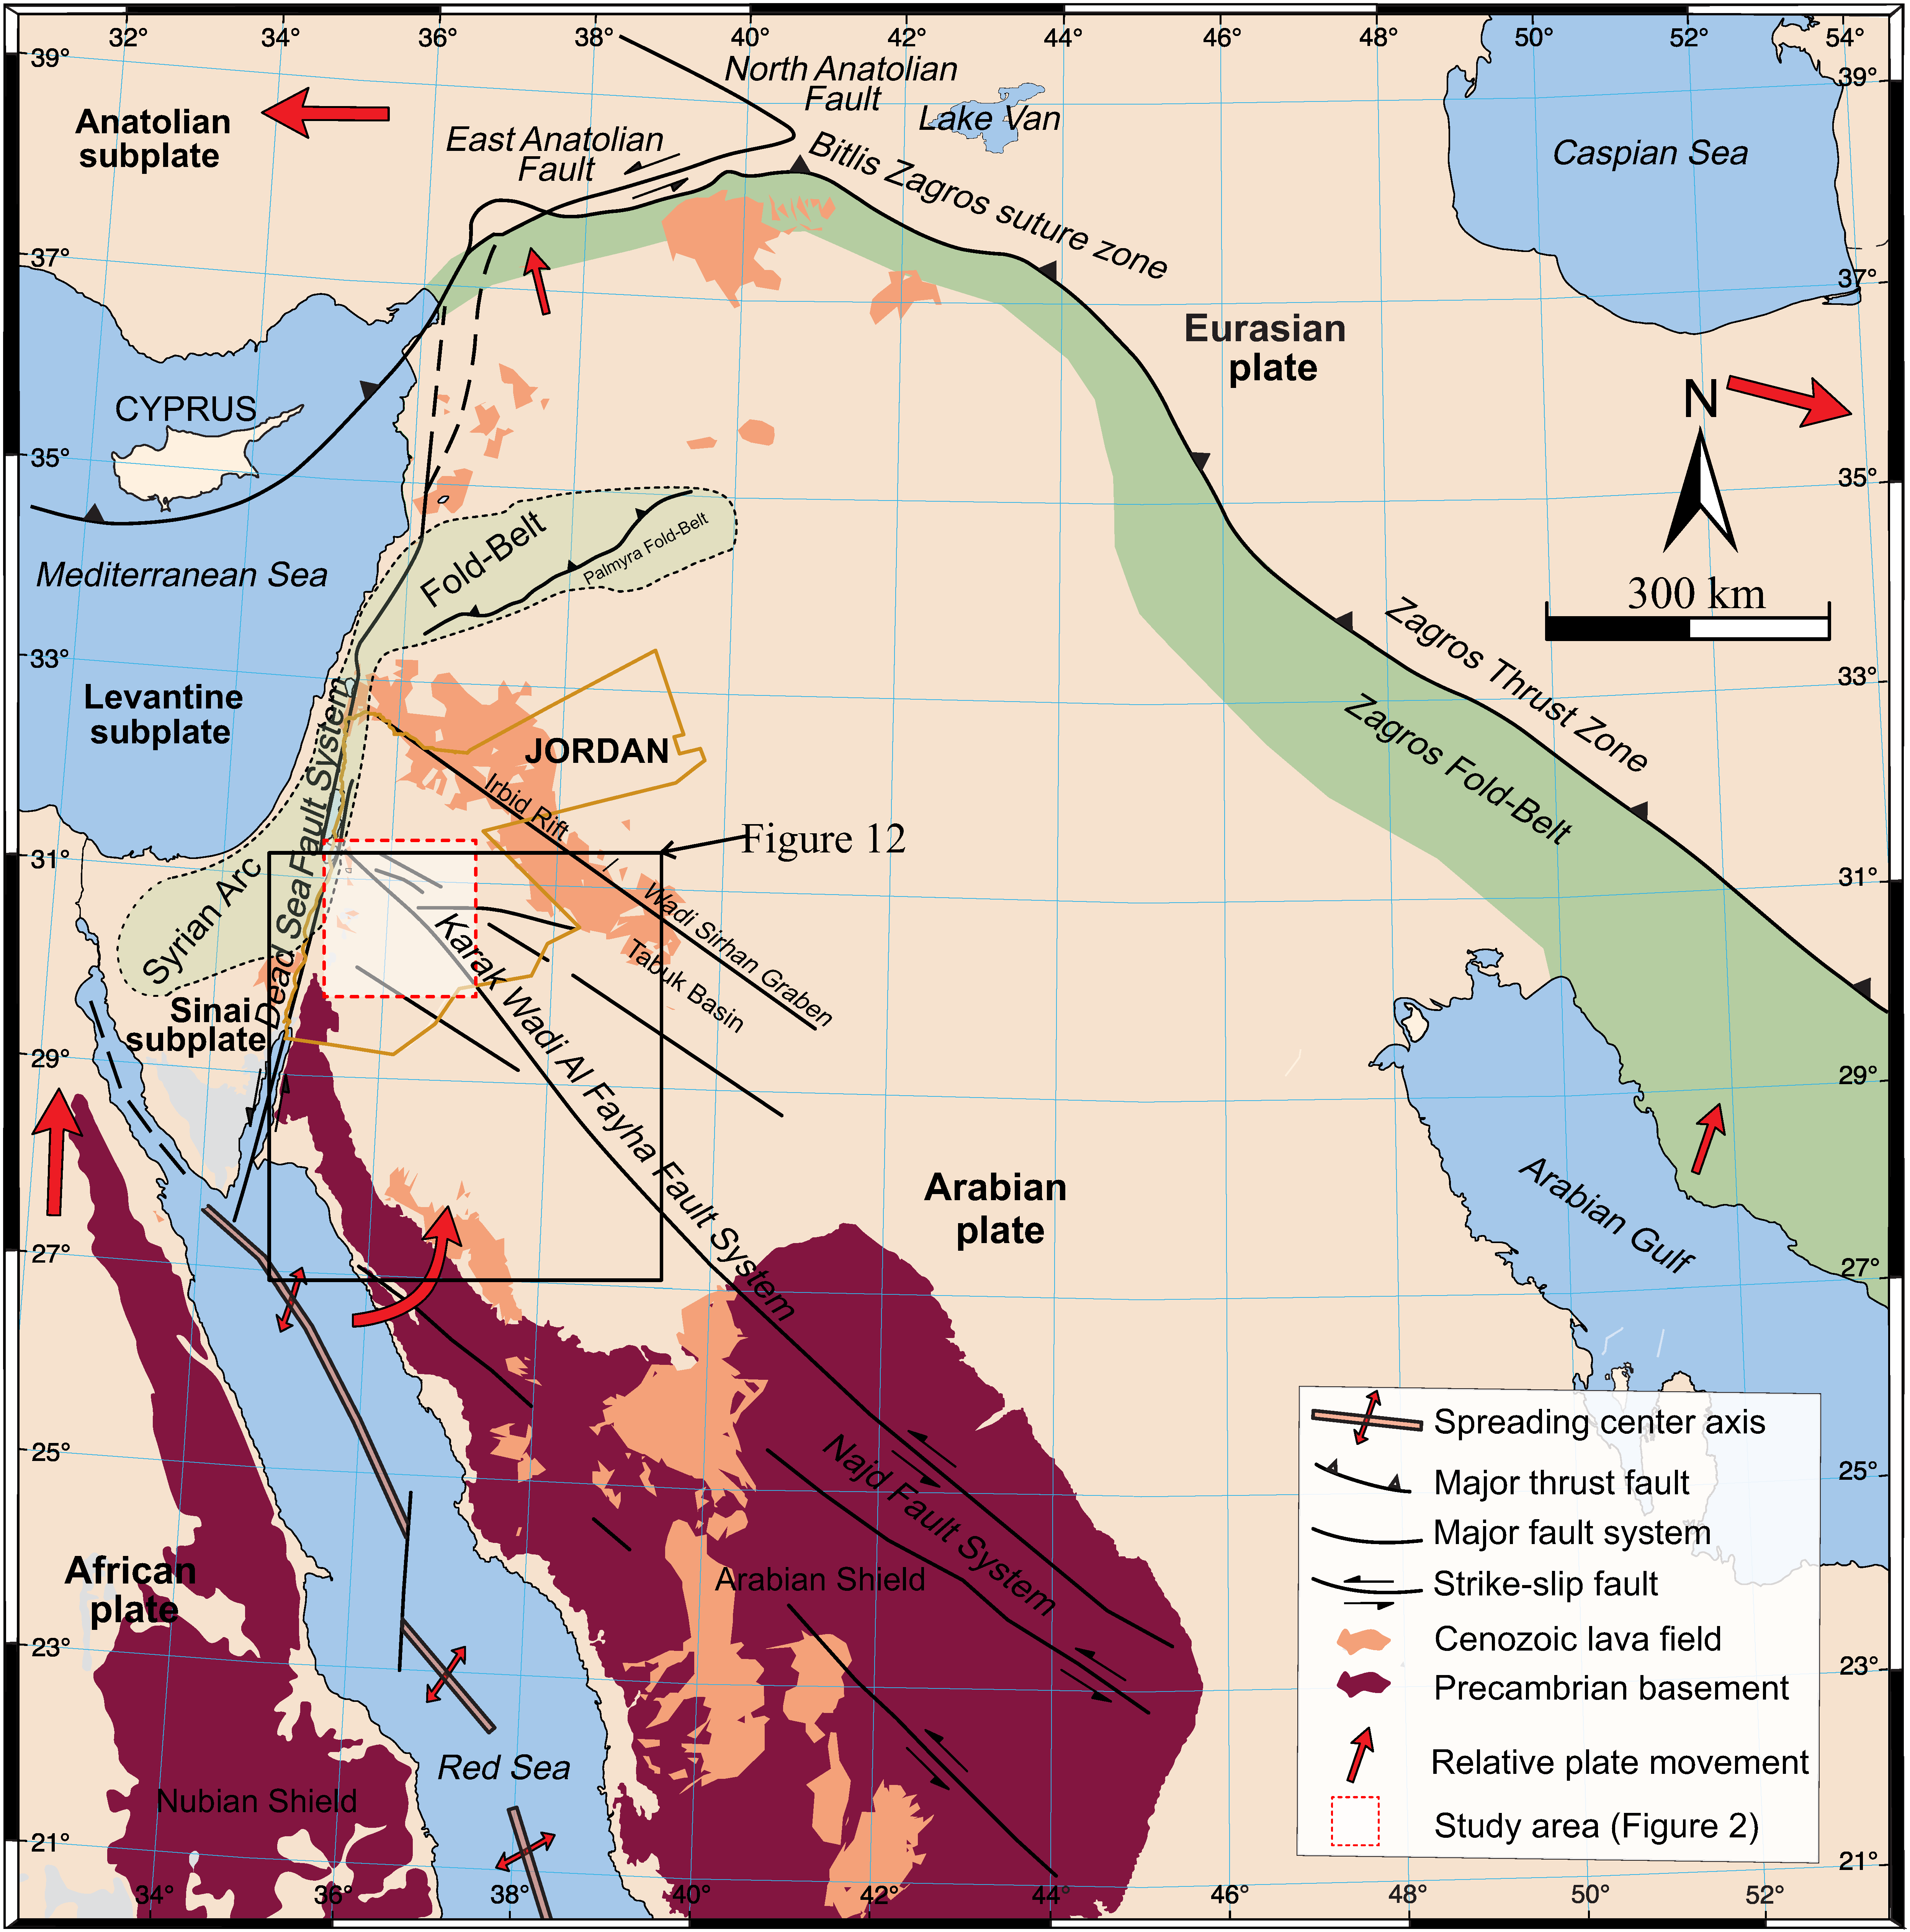
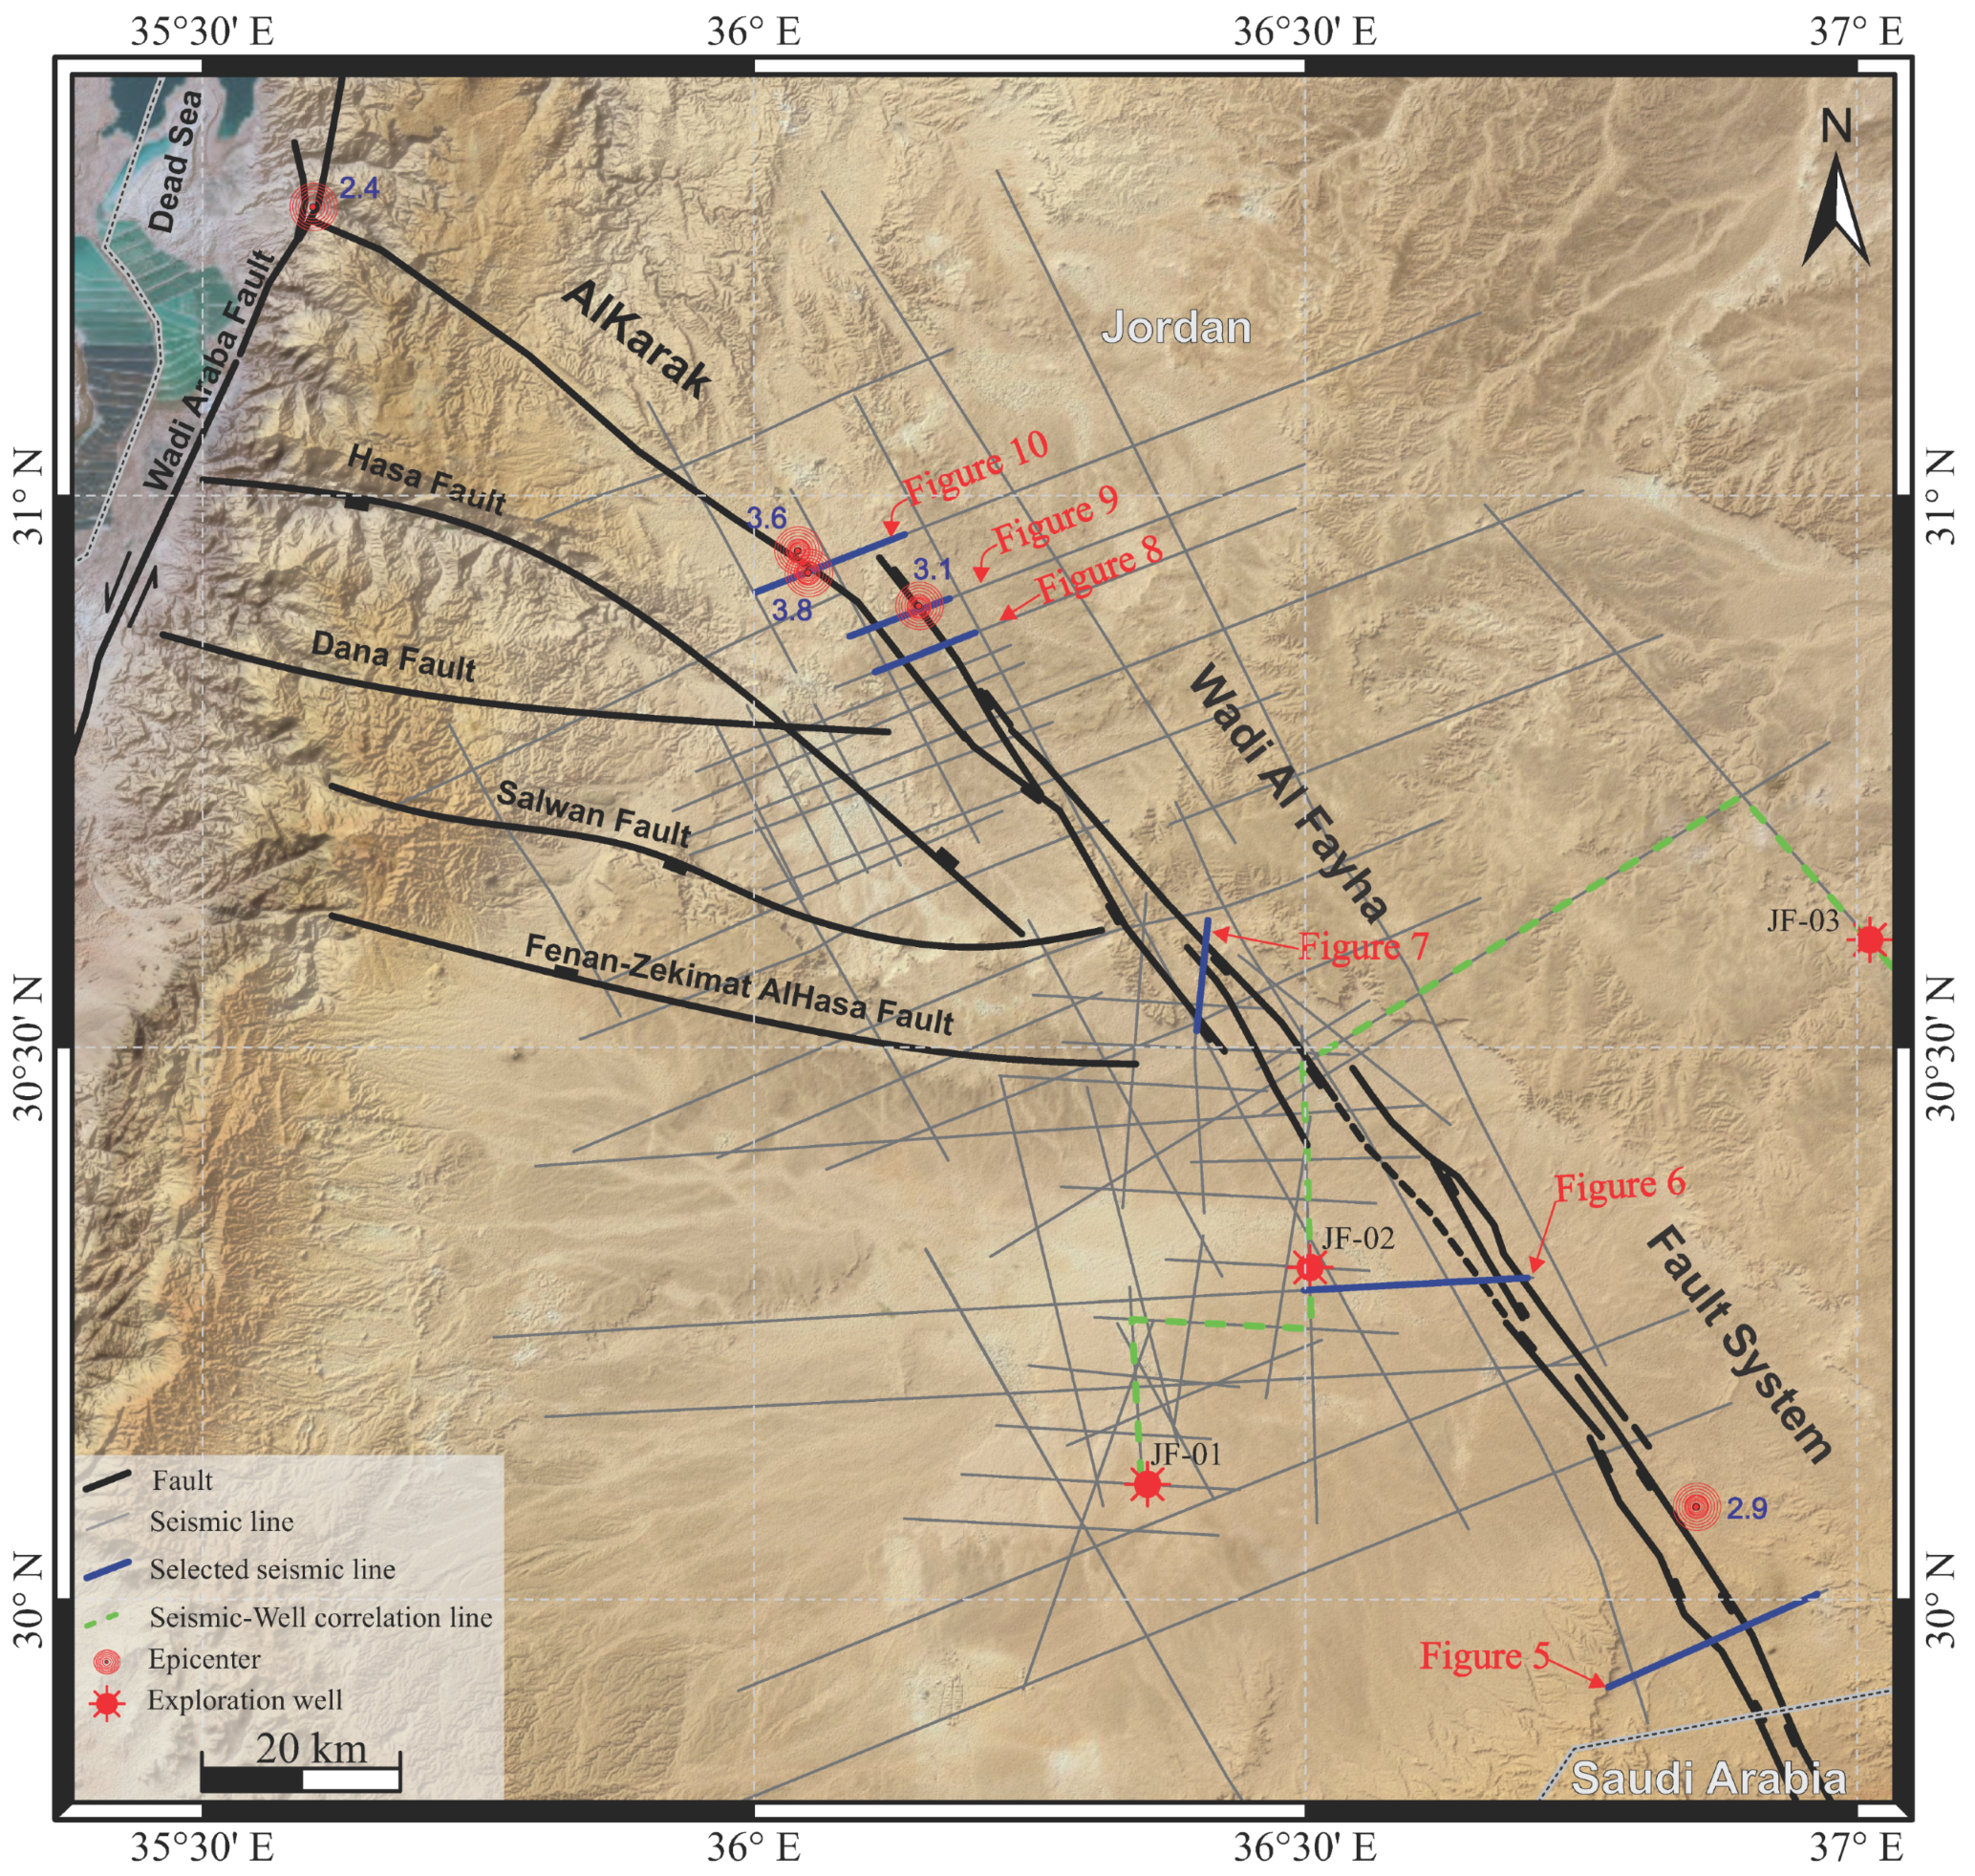
  • The KWF is a prominent NW-trending intraplate fault system extending from Western Karak in Jordan to Wadi Al Fayha in Saudi Arabia. This study integrates reflection seismic profiles with high-resolution DEM analysis to better understand the fault’s structural configuration and its influence on surface morphology. FMS from selected earthquakes were also evaluated to infer the prevailing stress regimes affecting the fault system;
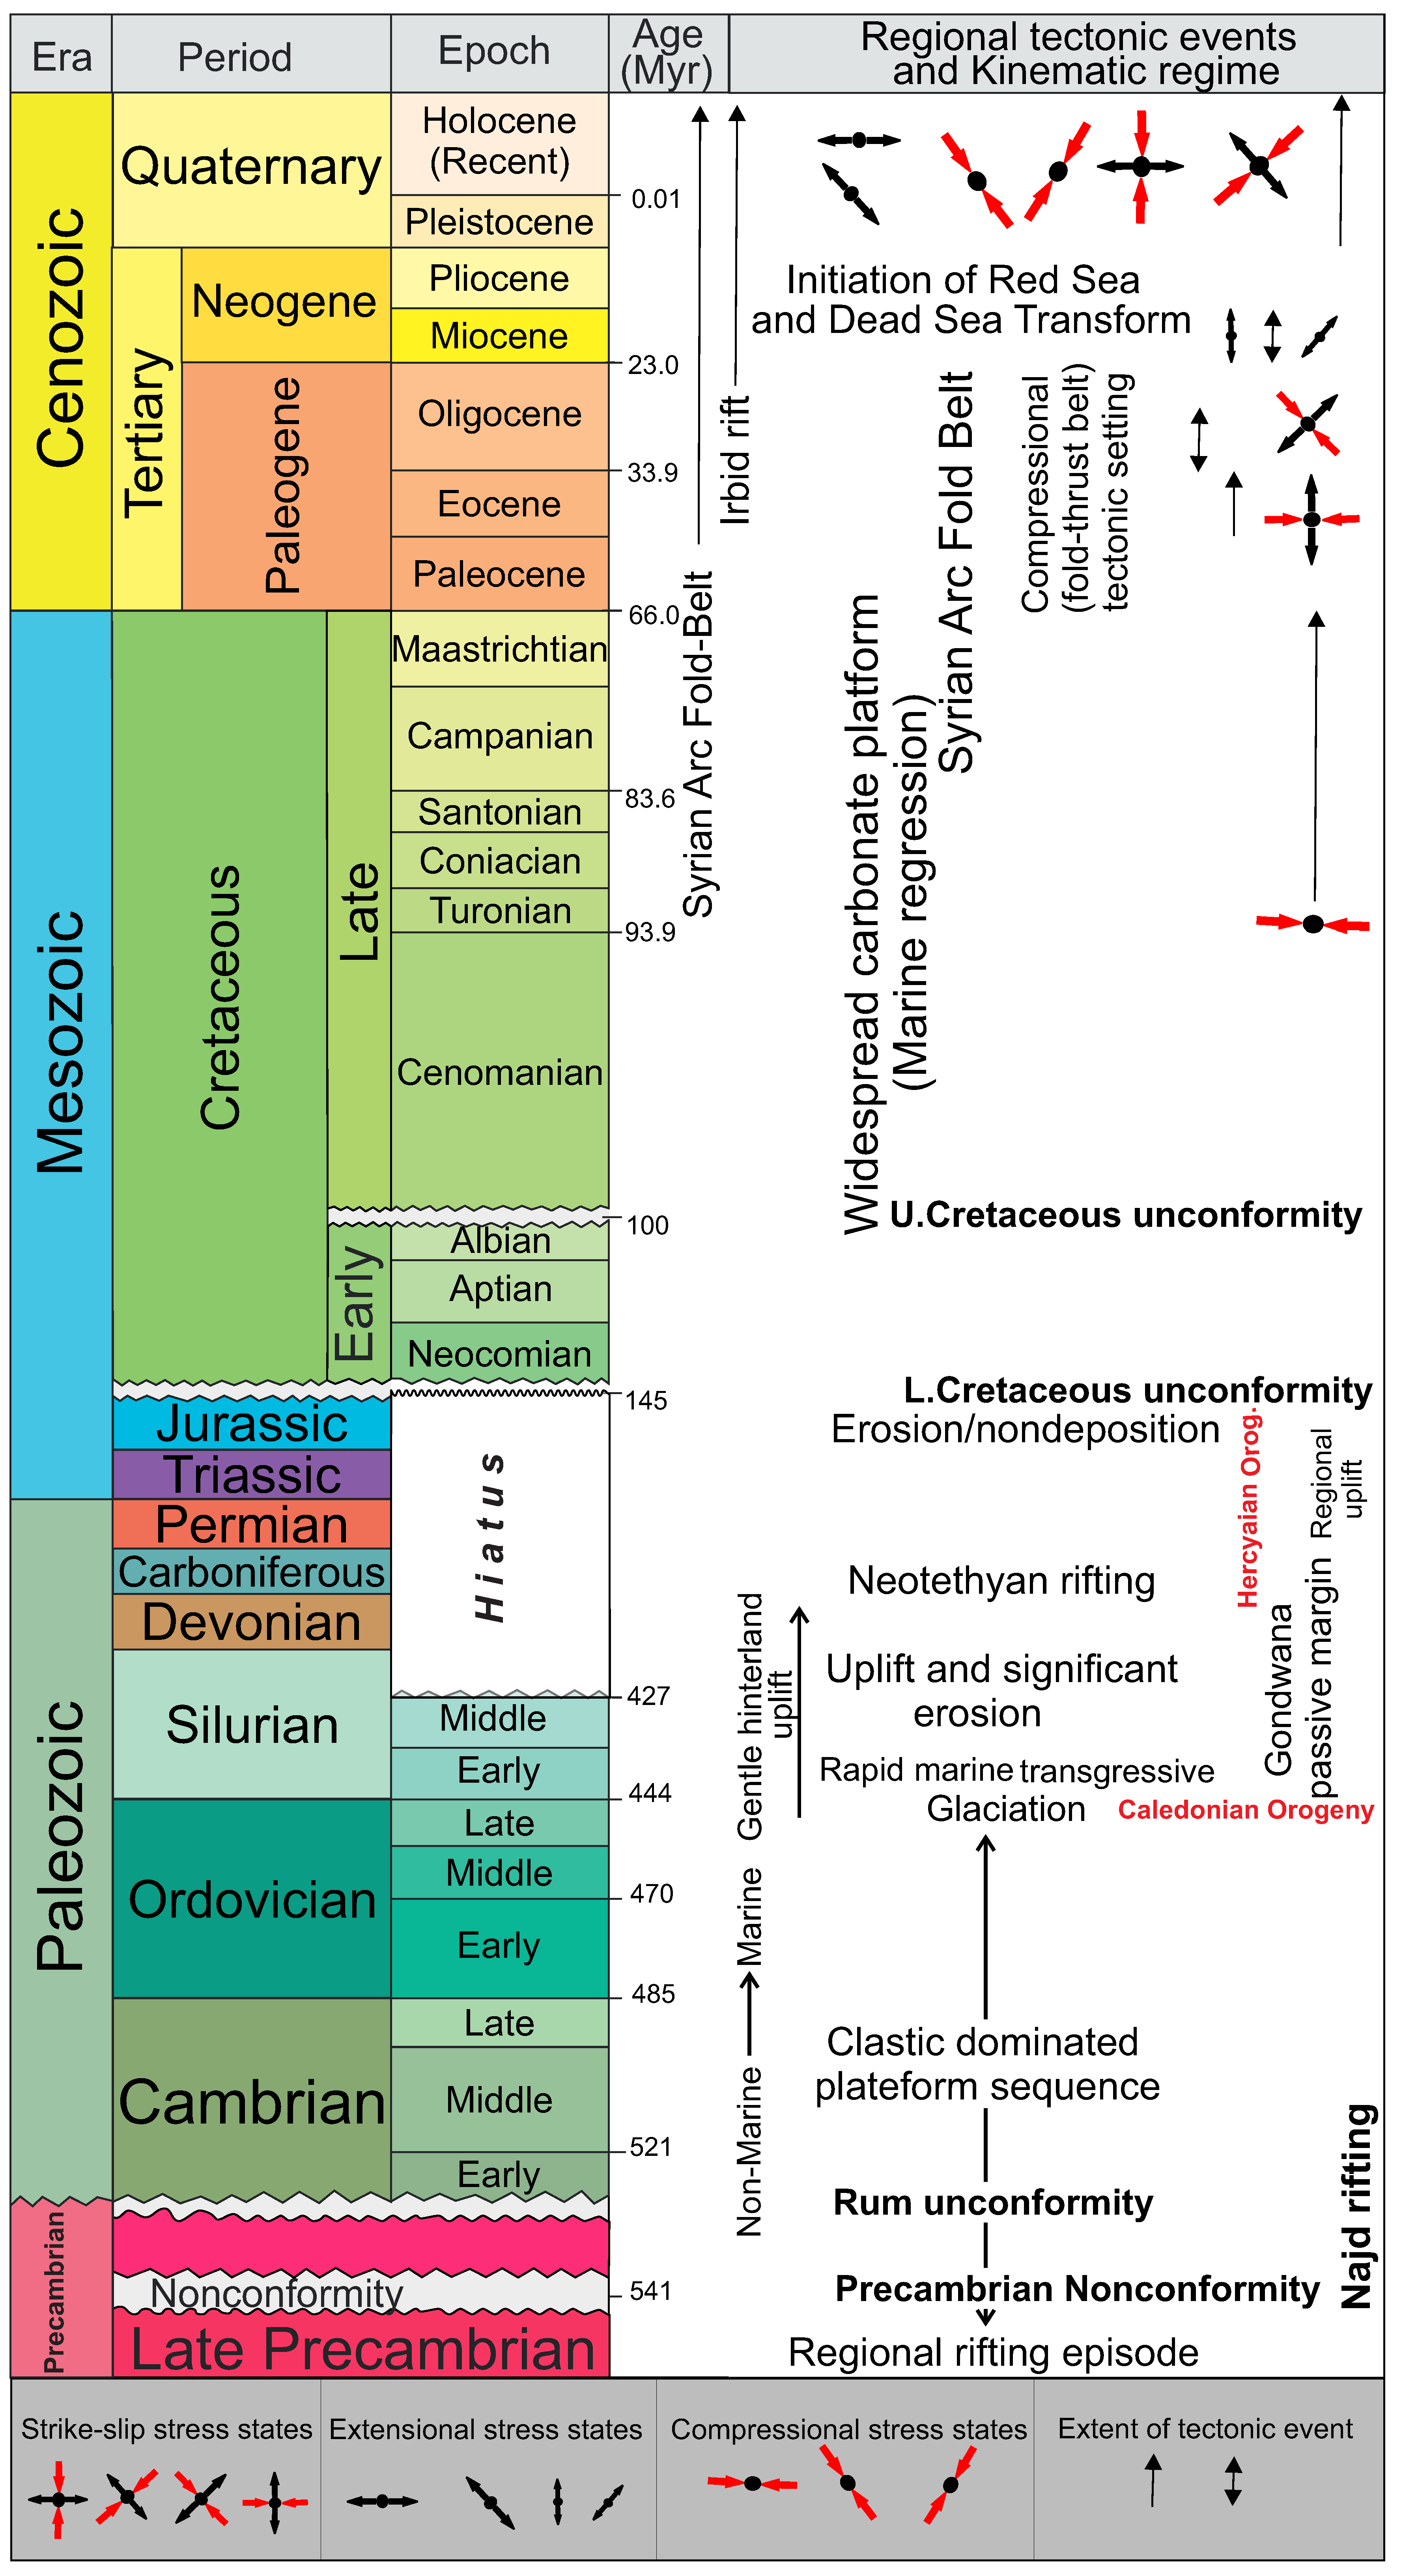
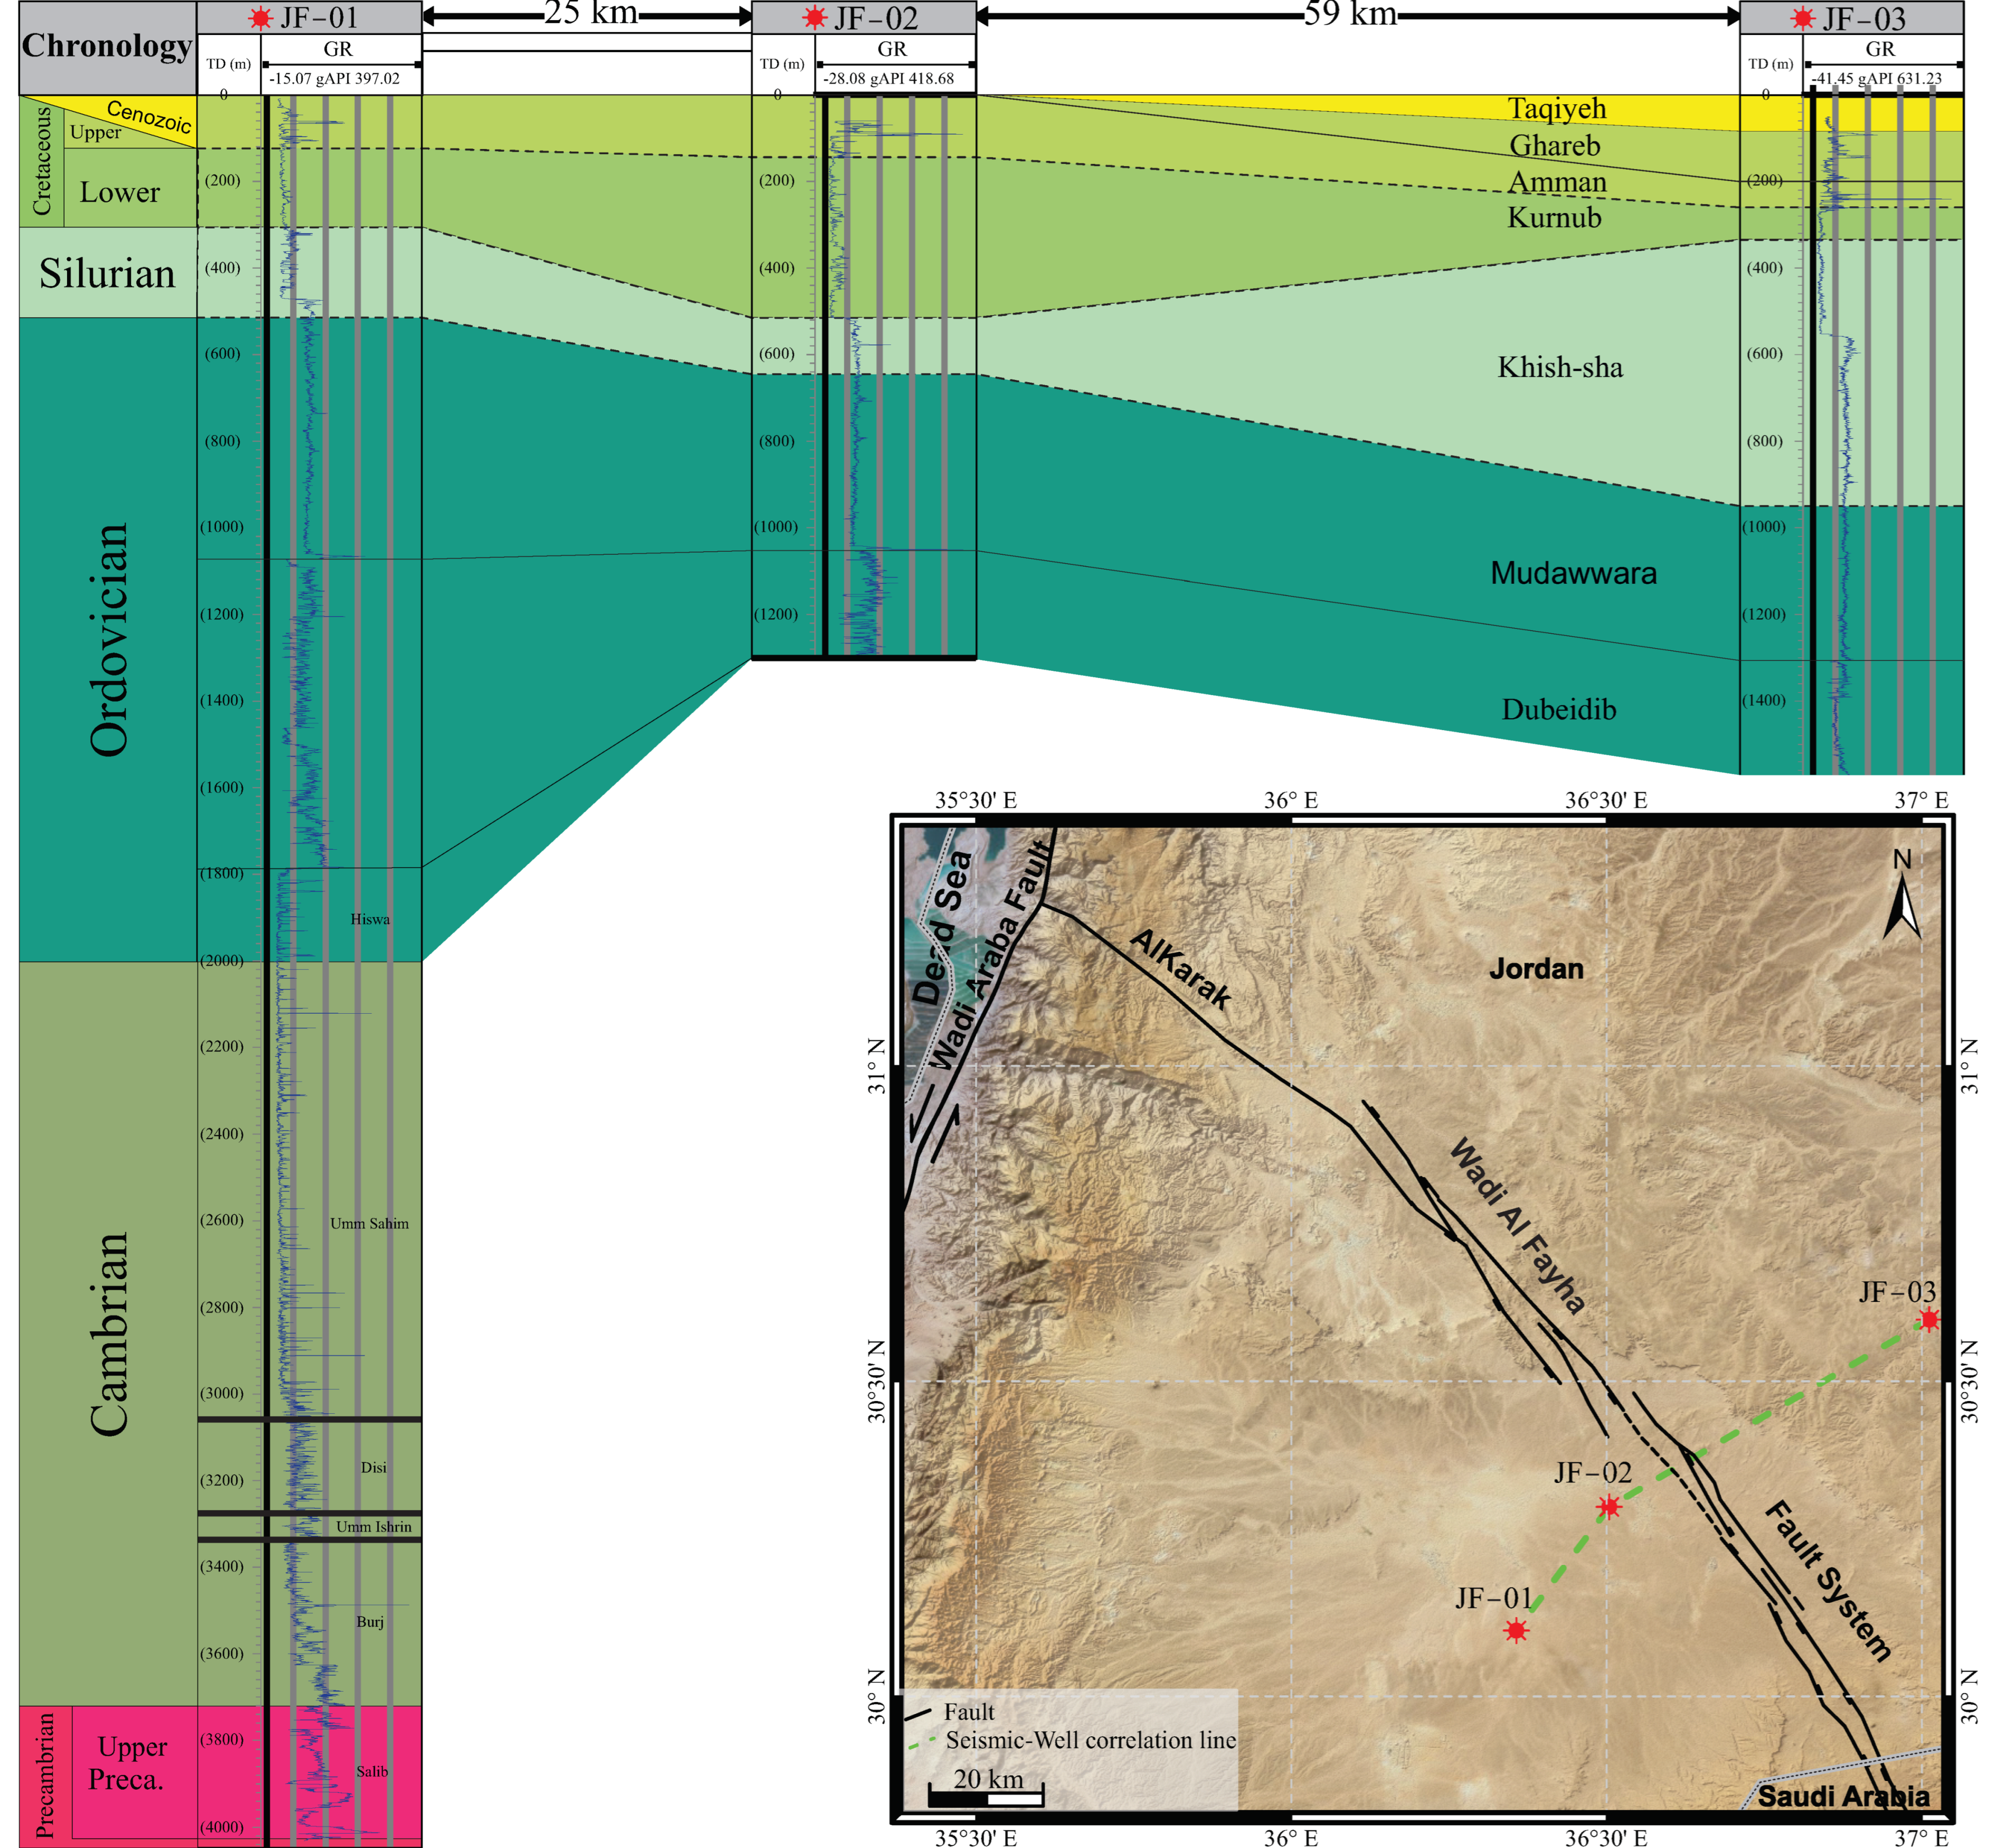
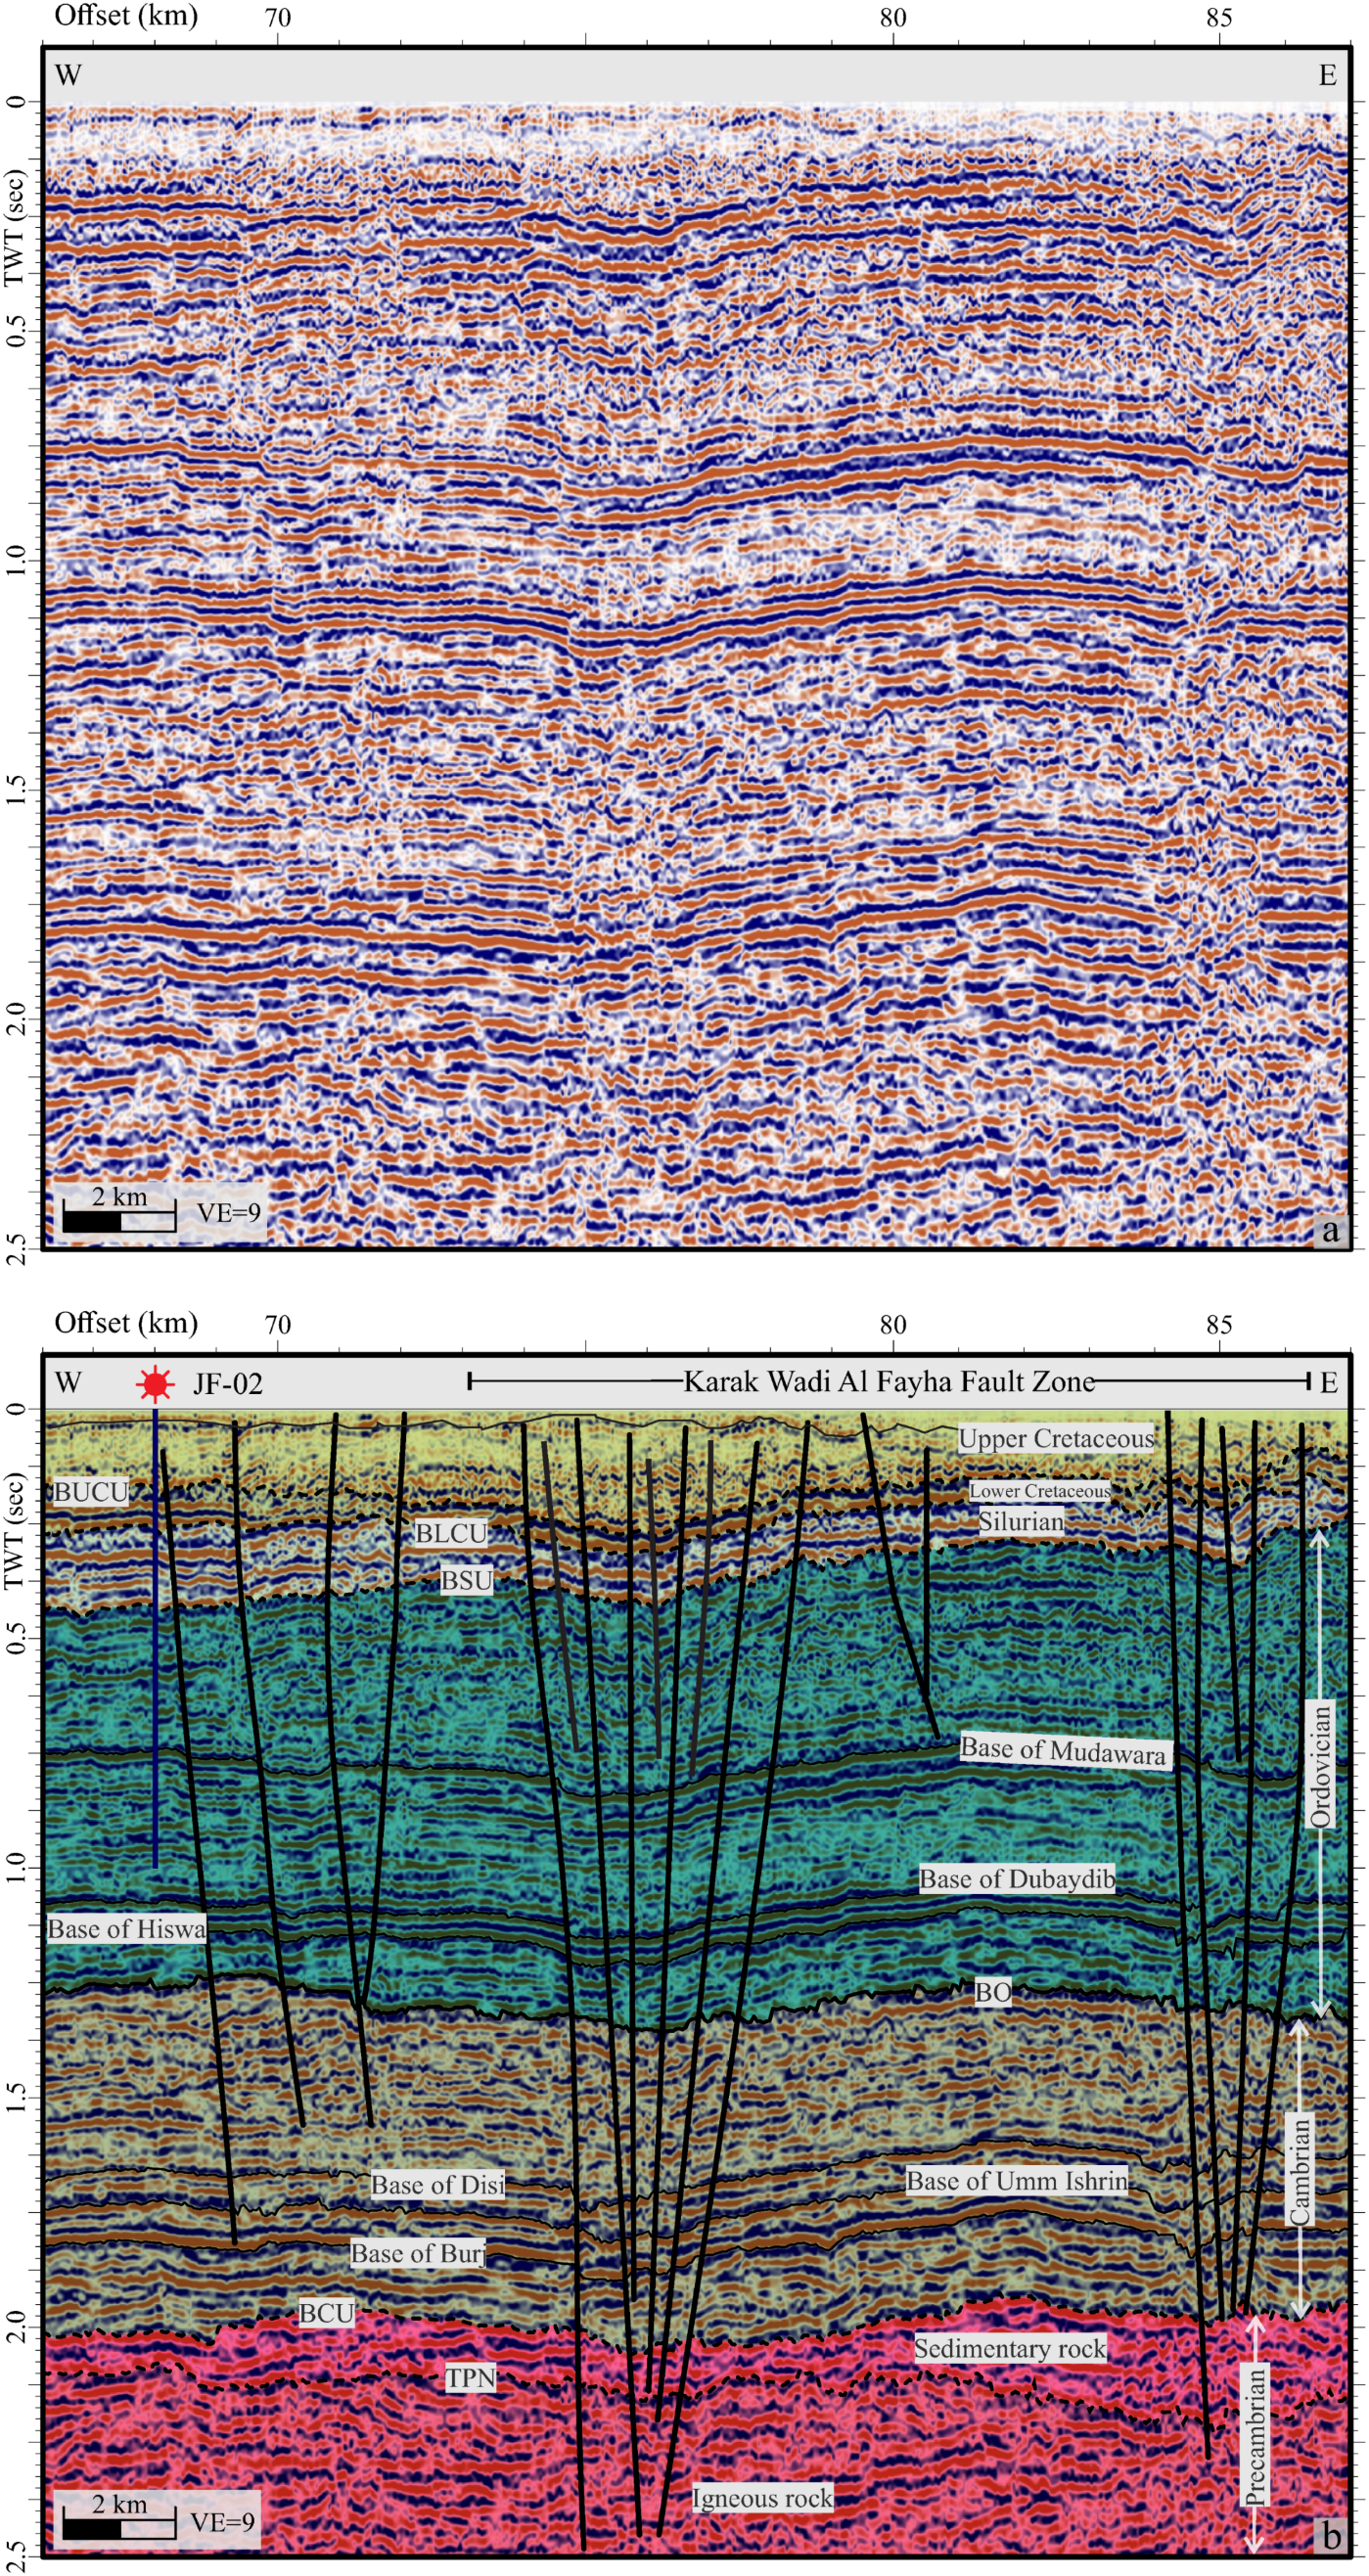
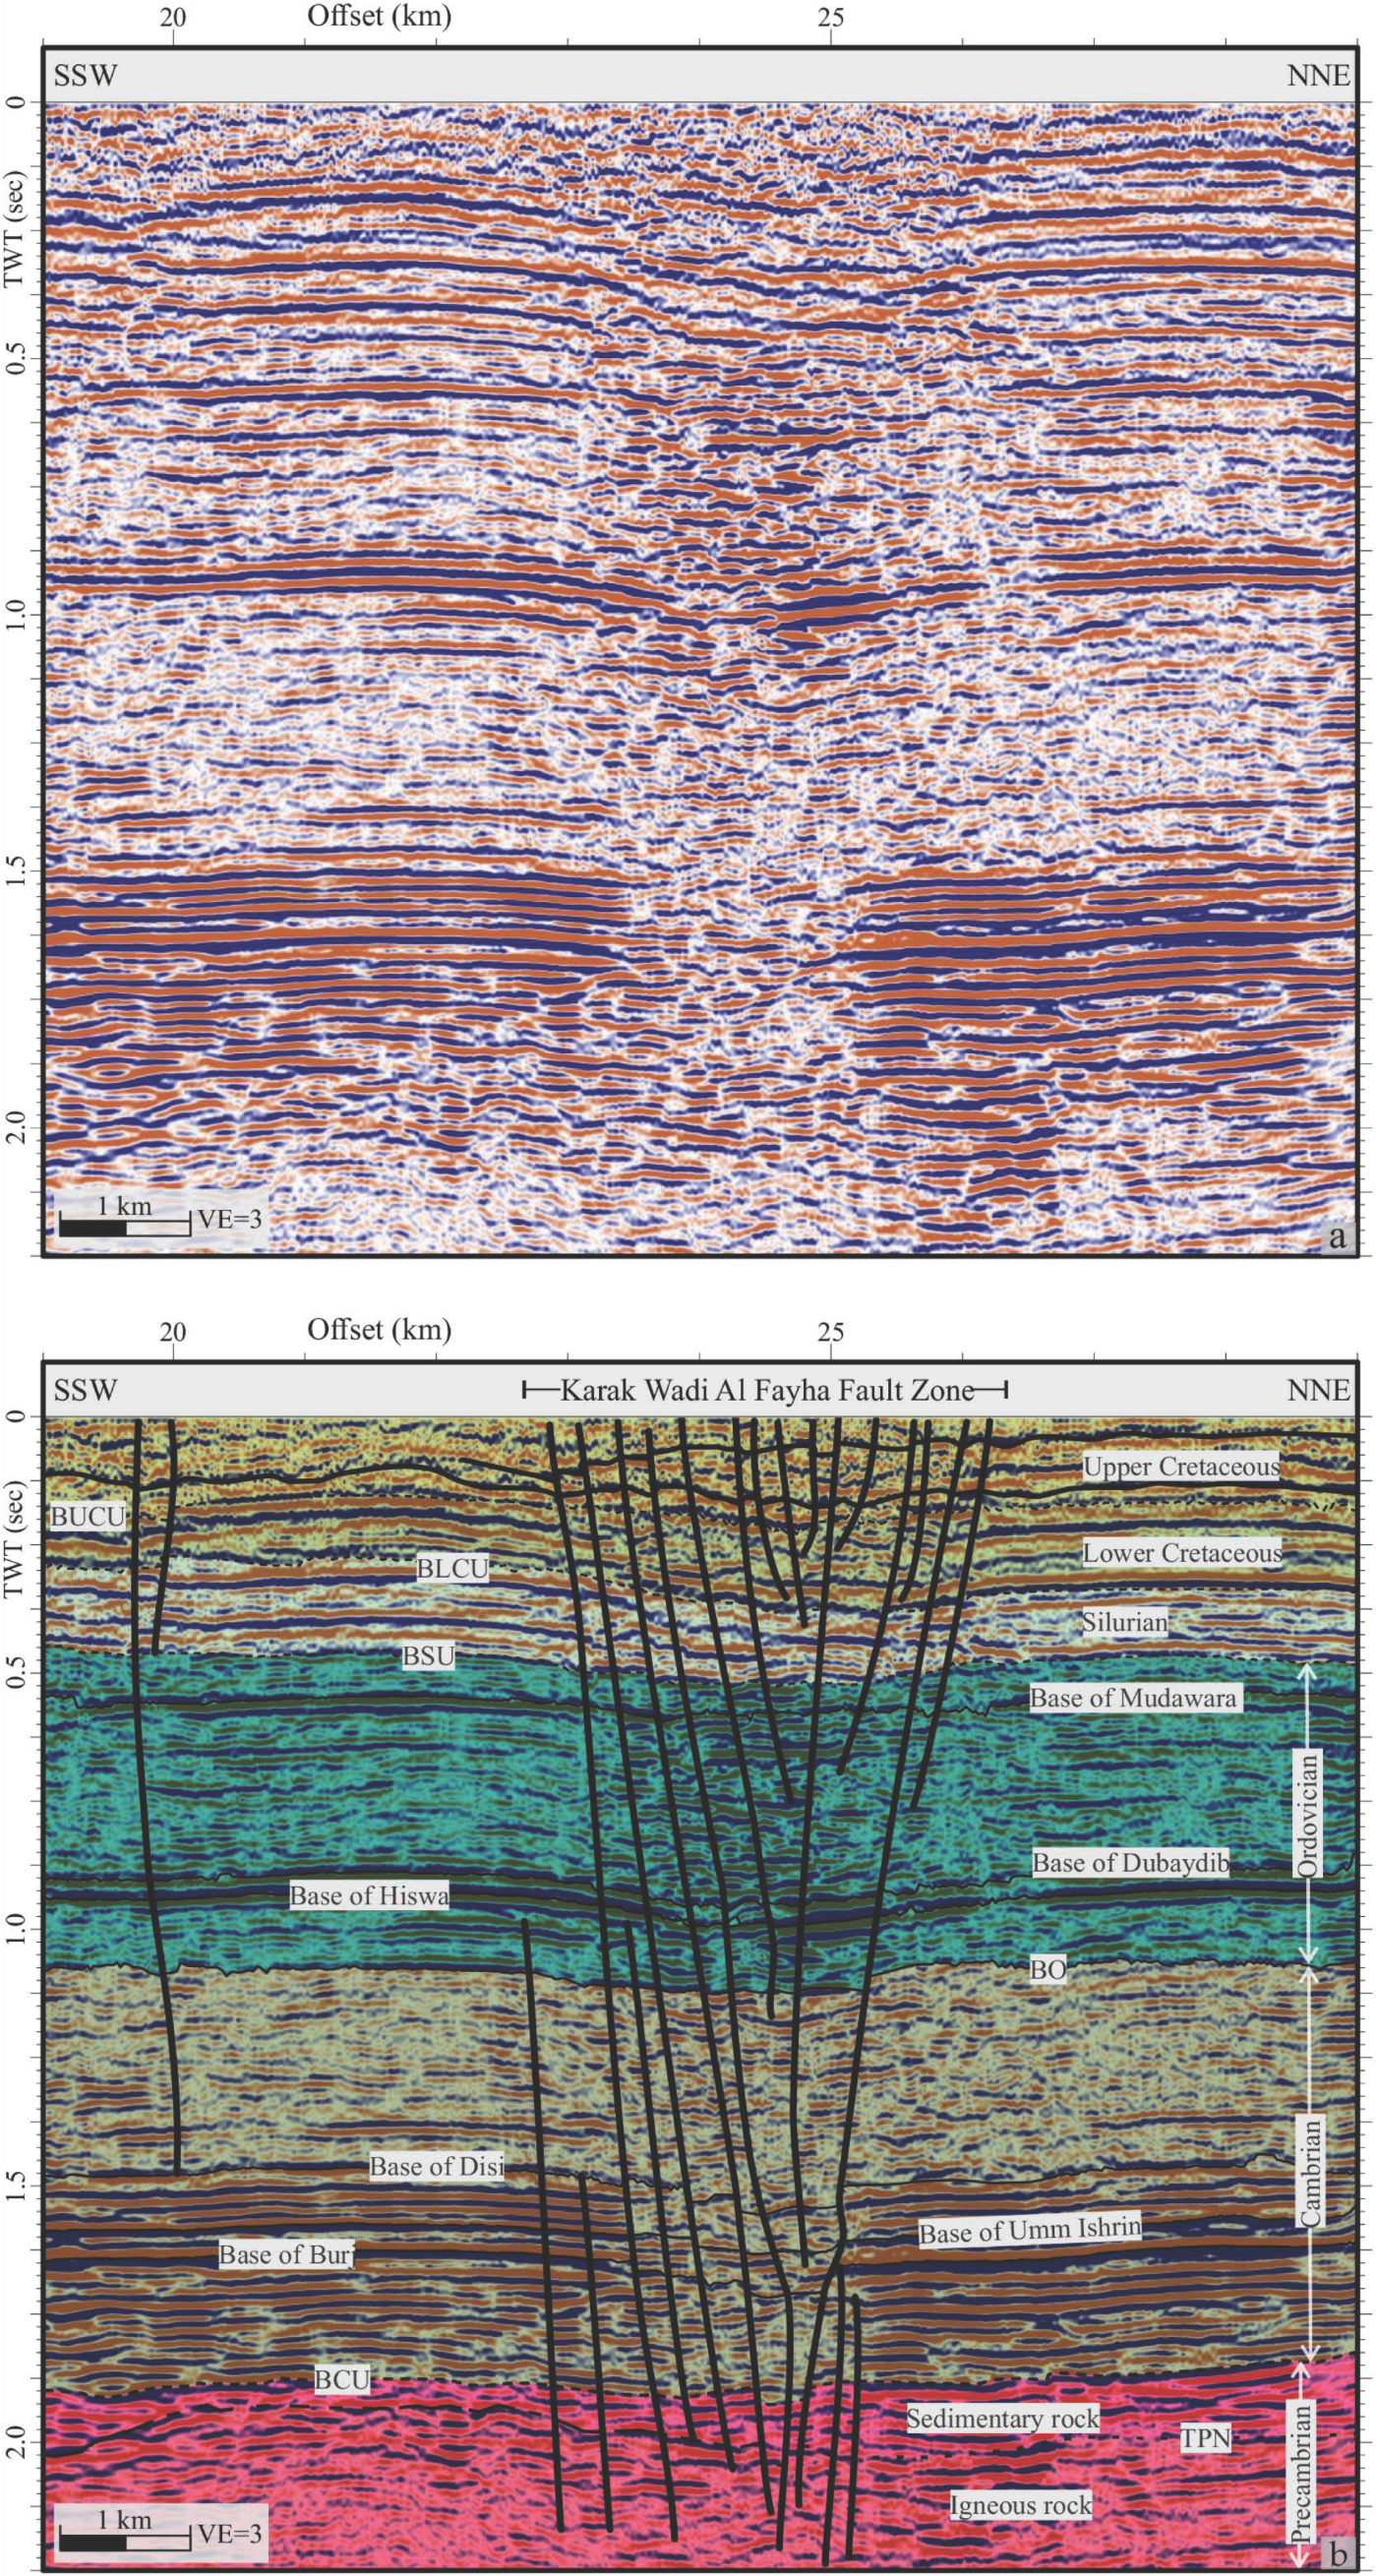
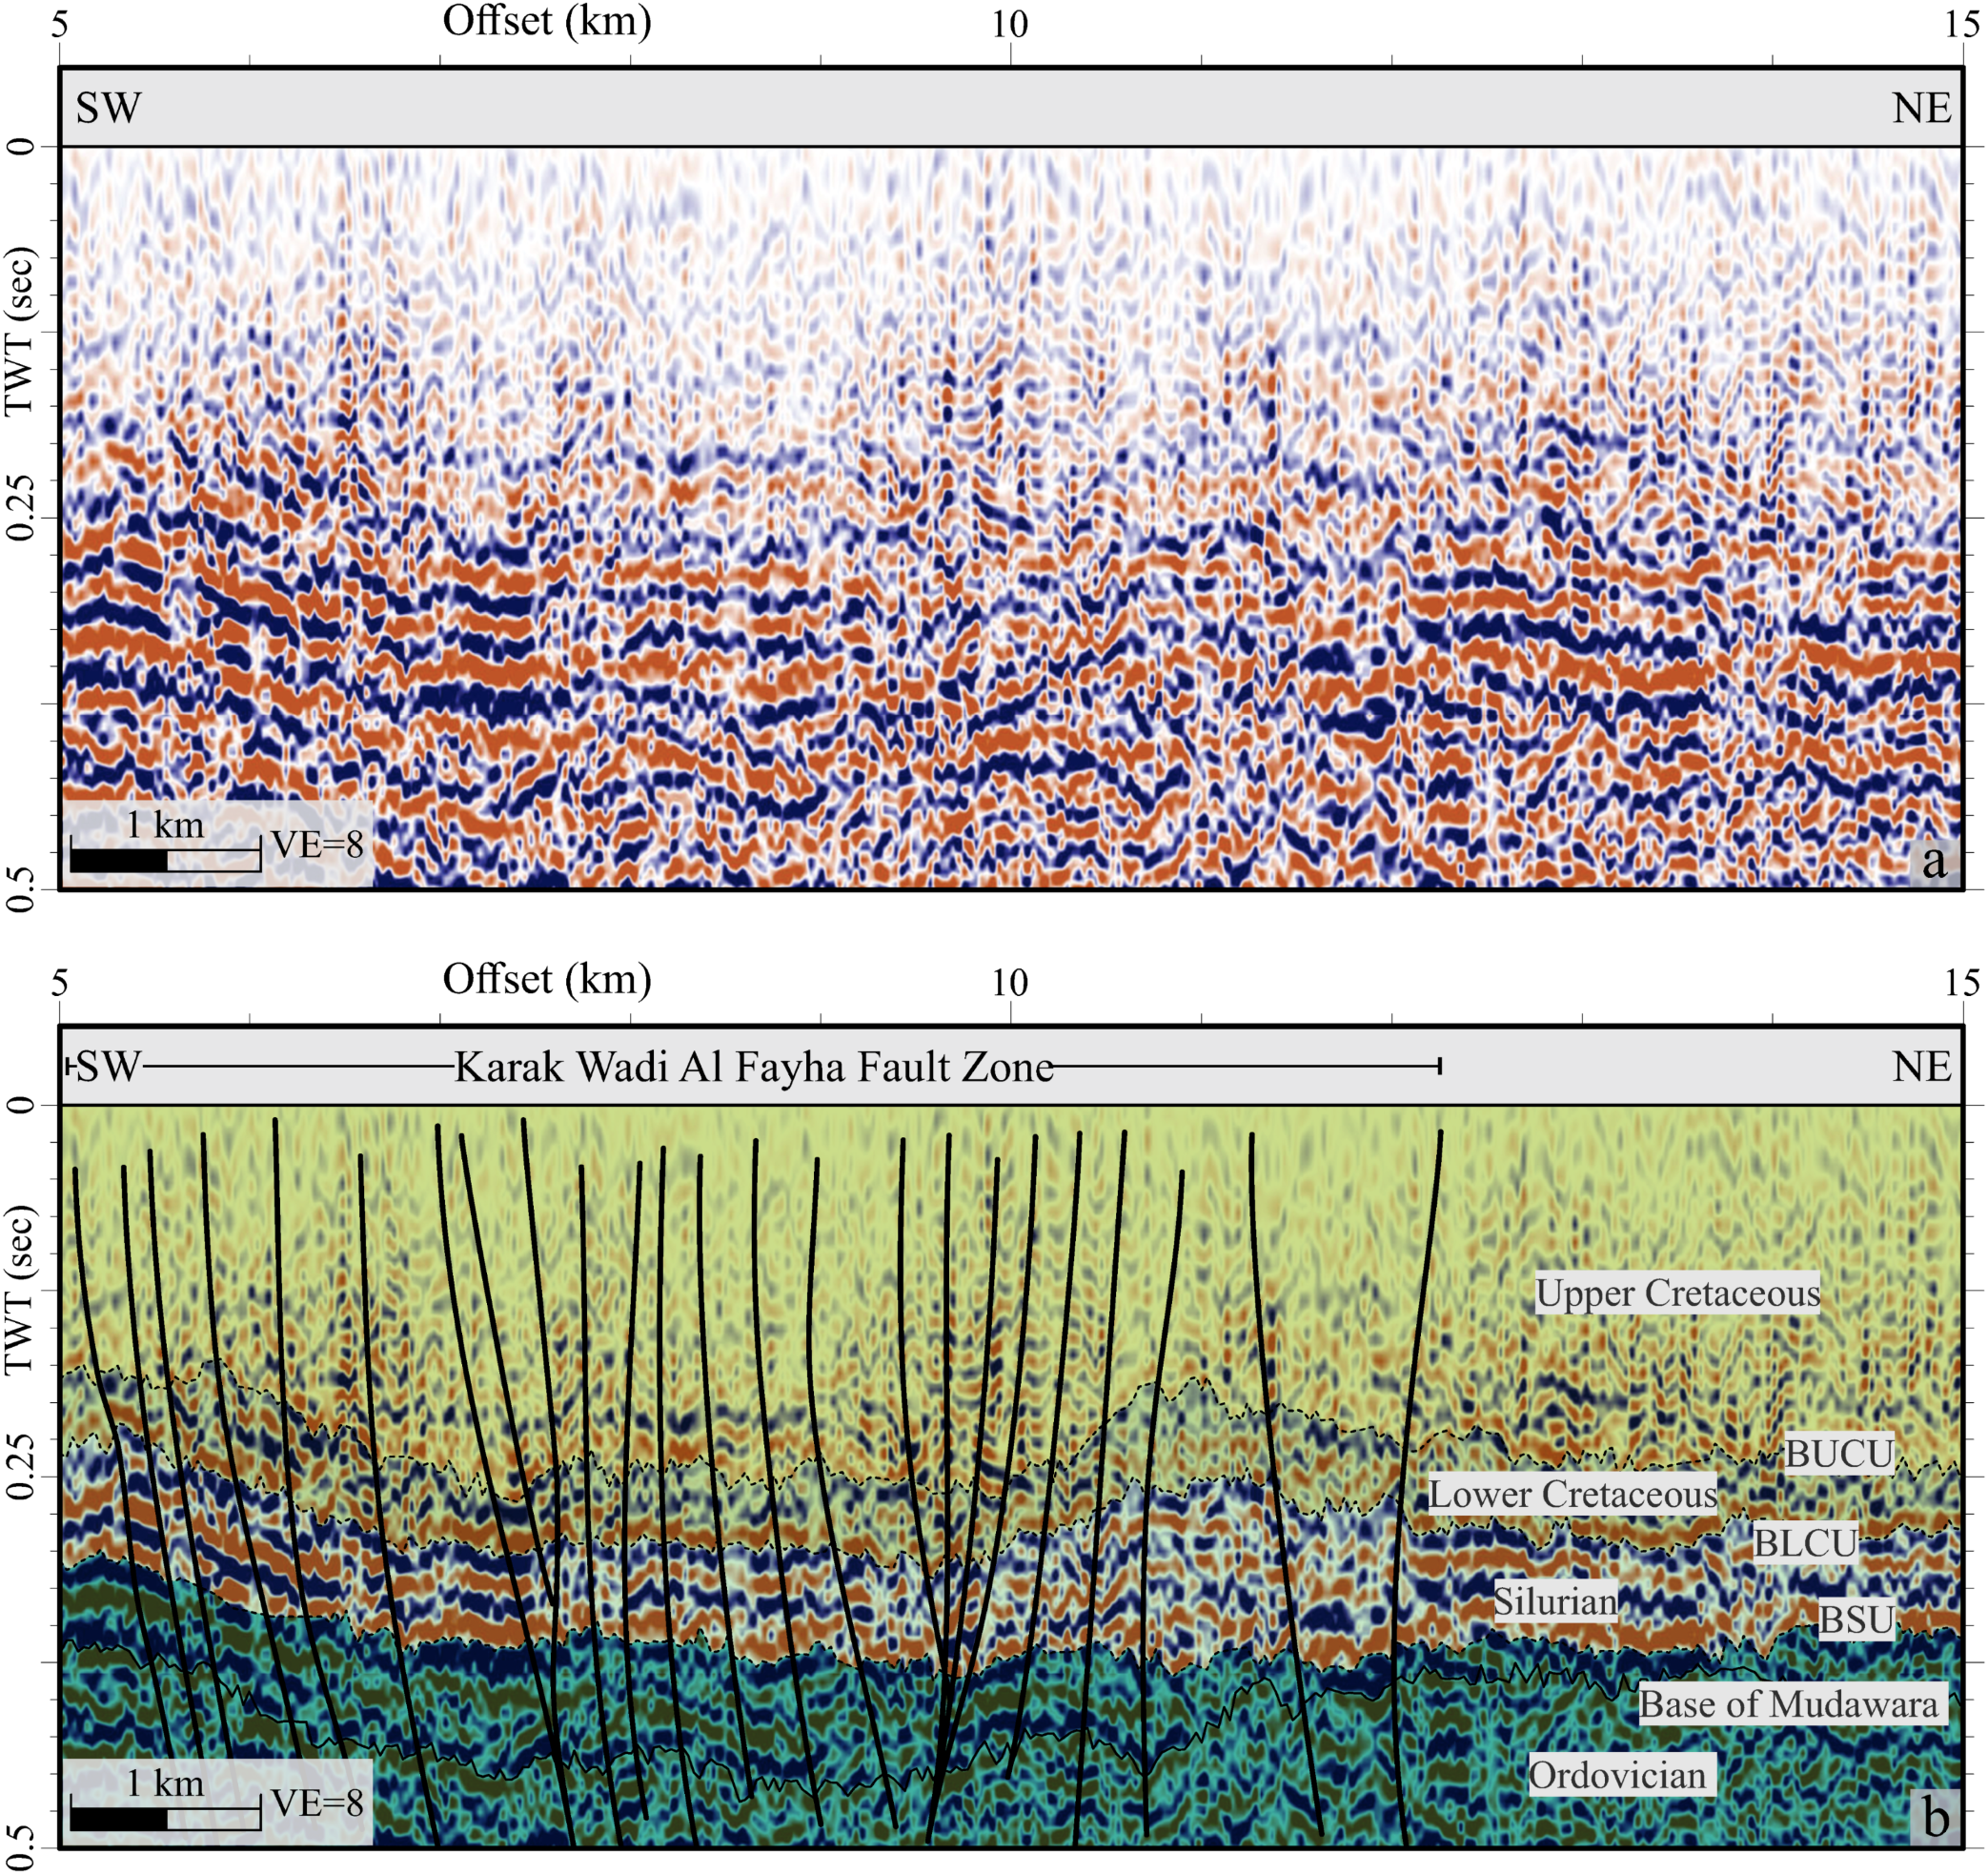
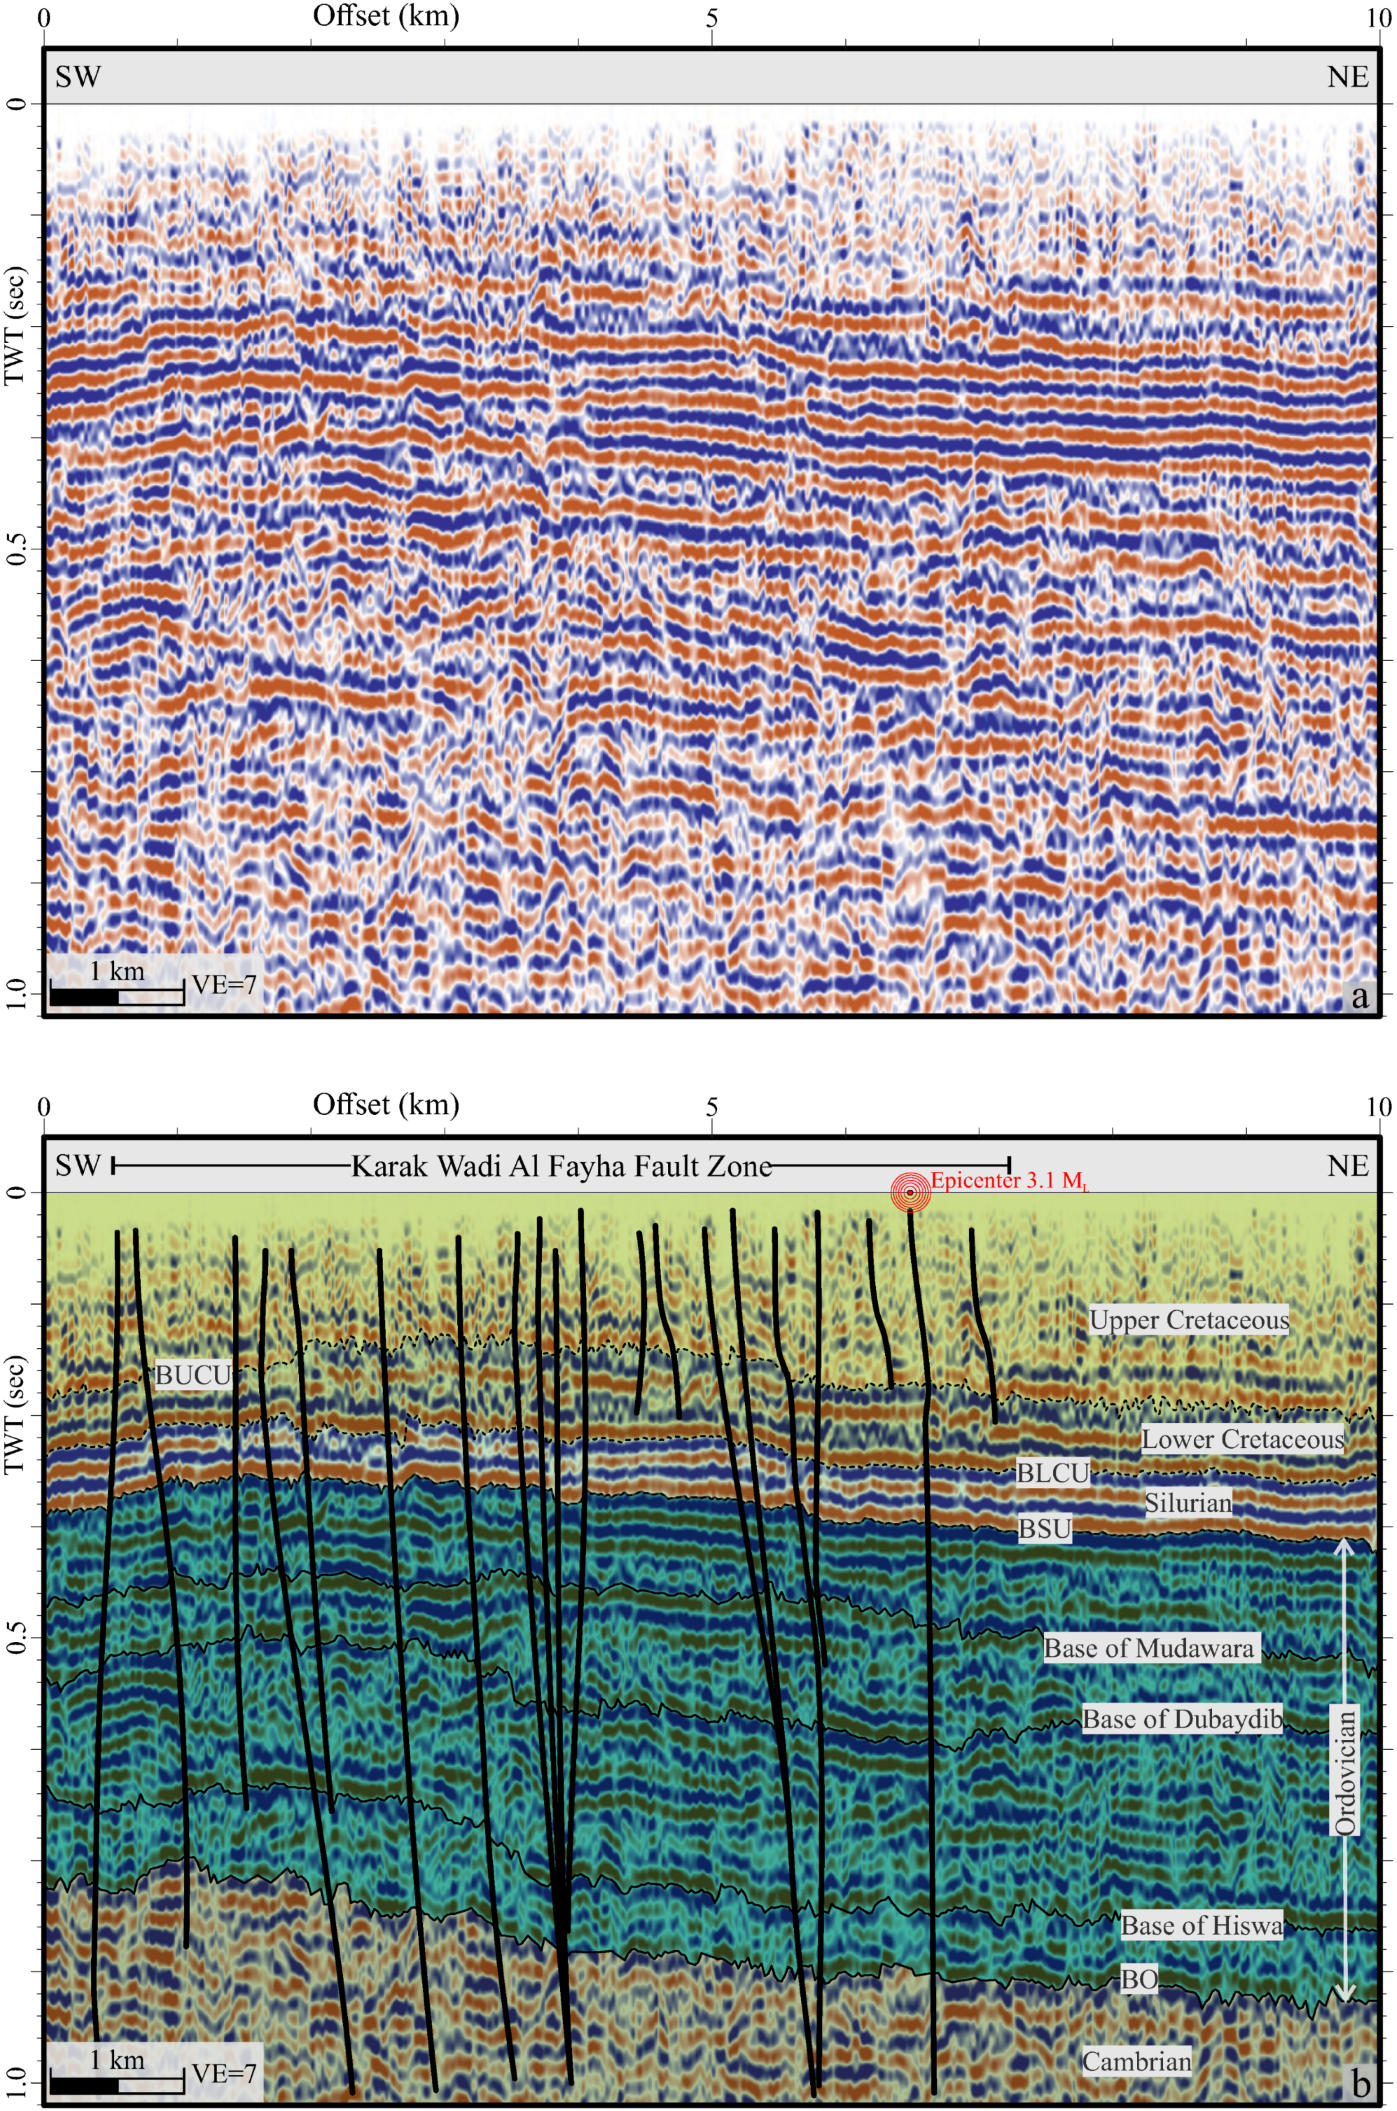
  • Seismic interpretation reveals that the KWF is a deeply rooted structure that originated as part of the Precambrian Najd Fault System. It displays a staircase fault geometry, with displacements extending from the Precambrian basement through to the uppermost Cretaceous strata. Additional fault segments disrupt formations from the Middle Cambrian to the Late Cretaceous, producing a negative flower structure and localized half-graben systems. In some areas, these faults appear to propagate toward the surface, possibly affecting younger deposits;
  • Topographic analysis using multi-illumination hill-shaded DEMs shows a continuous surface expression of the KWF across both Jordan and Saudi Arabia. Field observations document slope instability, particularly in the northwestern sector, where landslides have caused infrastructure damage and led to precautionary evacuations by the Karak Municipality. While such observations may suggest recent deformation, further investigation is needed to confirm ongoing tectonic activity;
  • The tectonic evolution of the KWF reflects a long and complex history. It originated during Precambrian extensional events linked to the Najd Fault System. Paleozoic fault reactivation was likely influenced by glacial loading and unloading processes, along with prolonged regional uplift. During the Mesozoic, especially from the Late Cretaceous to Late Eocene, compressional and strike-slip tectonics associated with the Syrian Arc deformation further reactivated the fault. In more recent geological time, changes in the regional stress field—beginning with the Eocene development of the Irbid Rift and continuing with the Miocene evolution of the DSTF—may have contributed to additional fault reactivation and transtensional deformation;
  • Overall, this study offers new insights into the structural evolution of the KWF, emphasizing its role within the broader tectonic framework of the region. While indications of recent fault-related deformation exist, further detailed geochronological and geodetic studies are necessary to assess the current level of activity and its implications for seismic hazard assessment.

Author Contributions

Conceptualization, M.A.H. and M.A.; Methodology, M.A.H., M.A. and G.S.; Software, M.A.H. and M.A.; Validation, M.A.H. and M.A.; Formal analysis, M.A.H. and M.A.; Investigation, M.A.H. and M.A.; Resources, M.A.H., M.A. and G.S.; Data curation, M.A.H. and M.A.; Writing—original draft, M.A.H. and M.A.; Writing—review & editing, M.A.H. and M.A.; Visualization, M.A.H. and M.A.; Supervision, M.A.H.; Project administration, M.A.H. All authors have read and agreed to the published version of the manuscript.

Funding

This research did not receive any specific grant from funding agencies in the public, commercial, or not-for-profit sectors.

Data Availability Statement

The raw data supporting the conclusions of this article will be made available by the authors upon request.

Acknowledgments

We would like to thank the editorial board for handling the maunscript. The authors would like to thank the Jordanian Ministry of Energy and Mineral Resources for supporting us with the seismic data and well information. We would also like to thank the Jordanian Seismological Observatory (JSO) for supporting us with the data used in this study. Eng. Mothana AlKasassbeh is thanked for supporting the field observation. IHS and ESRI are thanked for providing the “KINGDOMTM” and the “ArcMap” software under an Academic User License Agreement.

Conflicts of Interest

Author Muayyad Al Hseinat was employed by the company Arab Company for Laboratories and soil (ACES). The remaining authors declare that the research was conducted in the absence of any commercial or financial relationships that could be construed as a potential conflict of interest.

Abbreviations

AbbreviationDefinition
DEMDigital Elevation Model
DSTFDead Sea Transform Fault
FMSFault Mechanism Solution
KWFKarak Wadi Al Fayha Fault

References

  1. Gupta, R.P. Delineation of active faulting and some tectonic interpretations in Munich-Milan section of Eastern Alps—Use of Landsat imagery. Tectonophysics 1977, 38, 297–315. [Google Scholar] [CrossRef]
  2. Sen, D.; Sen, S. Post-Neogene tectonism along Aravalli range, Rajasthan, India. Tectonophysics 1983, 93, 75–98. [Google Scholar] [CrossRef]
  3. McCalpin, J.P. Chapter 9 Application of paleoseismic data to seismic hazard assessment and neotectonic research. Int. Geophys. 2009, 95, 1–106. [Google Scholar] [CrossRef]
  4. Field, E.H.; Biasi, G.P.; Bird, P.; Dawson, T.E.; Felzer, K.R.; Jackson, D.D.; Johnson, K.M.; Jordan, T.H.; Madden, C.; Michael, A.J.; et al. A new earthquake forecast for California’s complex fault system. In USGS Open-File Report; U.S. Geological Survey: Reston, VA, USA, 2015; pp. 2015–3009. [Google Scholar] [CrossRef]
  5. Gupta, R.P. Remote Sensing Geology; Springer: Berlin/Heidelberg, Germany, 2003. [Google Scholar]
  6. Bender, F. Geologische Karte Von Jordanien; MaßStab 1: 250,000 (5 Blatter); Geological Survey of the Republic of Germany: Hannover, Germany, 1968. [Google Scholar]
  7. Stern, R.J.; Johnson, P. Continental lithosphere of the Arabian Plate: A geologic, petrologic, and geophysical synthesis. Earth-Sci. Rev. 2010, 101, 29–67. [Google Scholar] [CrossRef]
  8. Al Hseinat, M.A.; AlZidaneen, M.; Jaradat, R.; Al-Rawabdeh, A.; Hübscher, C. Tectono-stratigraphic framework and evolution of the northwestern Arabian plate, Central Jordan. Tectonophysics 2023, 863, 229993. [Google Scholar] [CrossRef]
  9. Bartov, Y. A Structural and Paleogeographical Study of the Central Sinai Faults and Domes. Ph.D. Thesis, Hebrew University, Jerusalem, Israel, 1974. [Google Scholar]
  10. Moh’d, B.K. The Geology of Wadi Al-Buway’ija. Bull 5, Geo. Dir.; Natural Resource Athurity: Amman, Jordan, 1986. [Google Scholar]
  11. Powell, J.H. The Geology of the Karak Area. Bull 5, Geo. Dir.; Natural Resource Athurity: Amman, Jordan, 1988. [Google Scholar]
  12. Shawabkeh, K. The Geology of the Adir Area. Bull 18, Geo. Dir.; Natural Resource Athurity: Amman, Jordan, 1991. [Google Scholar]
  13. Bender, F. Geology of Jordan: Contribution to the Regional Geology of the World; Gebrueder Borntraeger: Stuttgart, Germany, 1974. [Google Scholar]
  14. Al-Zoubi, A.S. The basement faults system in the northwestern Arabian Plate, Jordan. Bull. Geol. Soc. Greece 2007, 40, 251. [Google Scholar] [CrossRef]
  15. Garbrecht, J.; Martz, L. Grid size dependency of parameters extracted from digital elevation models. Comput. Geosci. 1994, 20, 85–87. [Google Scholar] [CrossRef]
  16. Abdullah, A.; Akhir, J.M.; Abdullah, I. Automatic mapping of lineaments using shaded relief images derived from digital elevation model (DEMs) in the Maran—Sungi Lembing area, Malaysia. Electron. J. Geotech. Eng. 2010, 15, 949–957. [Google Scholar]
  17. Radaideh, O.M.A.; Grasemann, B.; Melichar, R.; Mosar, J. Detection and analysis of morphotectonic features utilizing satellite remote sensing and GIS: An example in SW Jordan. Geomorphology 2016, 275, 58–79. [Google Scholar] [CrossRef]
  18. Al Hseinat, M.A.; Al-Rawabdeh, A.; Al-Zidaneen, M.; Ghanem, H.; Al-Taj, M.; Diabat, A.; Jarrar, G.; Atallah, M. New insights for understanding the structural deformation style of the strike-slip regime along the Wadi Shueib and Amman-Hallabat structures in Jordan based on remote sensing data analysis. Geosciences 2020, 10, 253. [Google Scholar] [CrossRef]
  19. Stein, S. Fault plane solutions. In Structural Geology and Tectonics. Encyclopedia of Earth Science; Springer: Berlin/Heidelberg, Germany, 1987. [Google Scholar] [CrossRef]
  20. Sharland, P.R.; Archer, R.; Casey, D.M.; Davies, R.B.; Hall, S.H.; Heward, A.P.; Horbury, A.D.; Simmons, M.D. Arabian Plate sequence stratigraphy. GeoArabia 2001, 9, 199–214. [Google Scholar] [CrossRef]
  21. Bentor, Y.K. The crustal evolution of the AraboNubian Massif with special reference to the Sinai Peninsula. Precambrian Res. 1985, 28, 1–74. [Google Scholar] [CrossRef]
  22. Jarrar, G.; Wachendorf, H.; Zellmer, H. The Saramuj Conglomerate: Evolution of a Pan-African molasse sequence from south-west Jordan. Precambrian Res. 1991, 239, 6–23. [Google Scholar] [CrossRef]
  23. Jarrar, G.; Stern, R.J.; Saffarini, H.; Al-Zubi, H. Late- and post-orogenic Neoproterozoic intrusions of Jordan: Implications for crustal growth in the northernmost segment of the East African Orogen. Precambrian Res. 2003, 123, 295–319. [Google Scholar] [CrossRef]
  24. Powell, J.H.; Abed, A.; Jarrar, G. Ediacaran Araba Complex of Jordan. GeoArabia 2015, 20, 99–156. [Google Scholar] [CrossRef]
  25. Burdon, D. Handbook of the Geology of Jordan; Benham and Co.: Colchester, UK,, 1959. [Google Scholar]
  26. Husseini, M.I. Tectonic and Deposition Model of Late Precambrian-Cambrian Arabian and Adjoining Plates; United States Geological Survey: Reston, VA, USA, 1989. [Google Scholar]
  27. Husseini, M.I. Origin of the Arabian Plate Structures: Amar Collision and Najd Rift. GeoArabia 2000, 5, 527–542. [Google Scholar] [CrossRef]
  28. Radaideh, O.M.A.; Melichar, R. Tectonic paleostress fields in the southwestern part of Jordan: New insights from the fault slip data in the southeastern flank of the Dead Sea Fault Zone. Tectonics 2015, 34, 1863–1891. [Google Scholar] [CrossRef]
  29. Powell, J.H.; Abed, A.; Le Nindre, Y.M. Cambrian stratigraphy of Jordan. GeoArabia 2014, 19, 81–134. [Google Scholar] [CrossRef]
  30. Turner, B.; Makhlouf, I.; Armstrong, H. Late Ordovician (Ashgillian) glacial deposits in southern Jordan. Sediment. Geol. 2005, 181, 73–91. [Google Scholar] [CrossRef]
  31. Ruban, D.A.; Husseini, M.I.; Iwasaki, Y. Review of middle east Paleozoic plate tectonics. GeoArabia 2007, 12, 35–56. [Google Scholar] [CrossRef]
  32. Ziegler, M.A. Evolution of the Arctic-north Atlantic and the western Tethys–a visual presentation of a series of paleogeographic-paleotectonic maps. Memoir 1988, 43, 164–196. [Google Scholar] [CrossRef]
  33. Stampfli, G.M.; Hochard, C. Plate tectonics of the Alpine Realm. Geol. Soc. Lond. Spec. Publ. 2009, 327, 89–111. [Google Scholar] [CrossRef]
  34. Frizon de Lamotte, D.; Raulin, C.; Mouchot, N.; Wrobel-Daveau, J.; Blanpied, C.; Ringenbach, J. The southernmost margin of the Tethys Realm during the Mesozoic and Cenozoic: Initial geometry and timing of the inversion processes. Tectonics 2011, 30, 1–22. [Google Scholar] [CrossRef]
  35. Eyal, Y.; Reches, Z. Tectonic analysis of the Dead Sea Rift region since the Late Cretaceous based on mesostructures. Tectonics 1983, 2, 167–185. [Google Scholar] [CrossRef]
  36. Ron, H.; Eyal, Y. Intraplate deformation by block rotation and mesostructures along the Dead Sea Transform, Northern Israel. Tectonics 1985, 4, 85–105. [Google Scholar] [CrossRef]
  37. Hatzor, Y.; Reches, Z. Structure and paleostresses in the Gilboa’ region, western margins of the Central Dead Sea Rift. Tectonophysics 1990, 180, 87–100. [Google Scholar] [CrossRef]
  38. Eyal, Y. Stress field fluctuations along the Dead Sea rift since the Middle Miocene. Tectonics 1996, 15, 157–170. [Google Scholar] [CrossRef]
  39. Segev, A.; Lyakhovsky, V.; Weinberger, R. Continental transform–rift interaction adjacent to a continental margin: The Levant case study. Earth-Sci. Rev. 2014, 139, 83–103. [Google Scholar] [CrossRef]
  40. Garfunkel, Z. Internal structure of the Dead Sea leaky transform (rift) in relation to plate kinematics. Tectonophysics 1981, 80, 81–108. [Google Scholar] [CrossRef]
  41. Hofmann, C.; Courtillot, V. Timing of the Ethiopian flood basalt event and implications for plume birth and global change. Nature 1997, 389, 838–841. [Google Scholar] [CrossRef]
  42. Ilani, S.; Harlavan, Y.; Tarawneh, K.; Rabba, I.; Weinberger, R.; Ibrahim, K.; Peltz, S.; Steinitz, G. New K-Ar ages of basalts from the Harrat Ash Shaam volcanic field in Jordan: Implications for the span and duration of the upper-mantle upwelling beneath the western Arabian plate. Geology 2001, 29, 171. [Google Scholar] [CrossRef]
  43. Pik, R.; Marty, B.; Carignan, J.; Lavé, J. Stability of the Upper Nile drainage network (Ethiopia) deduced from (U–Th)/He thermochronometry: Implications for uplift and erosion of the Afar plume dome. Earth Planet. Sci. Lett. 2003, 215, 73–88. [Google Scholar] [CrossRef]
  44. Schattner, U.; Ben-Avraham, Z.; Reshef, M.; Bar-Am, G.; Lazar, M. Oligocene–Miocene formation of the Haifa basin: Qishon–Sirhan rifting coeval with the Red Sea–Suez rift system. Tectonophysics 2006, 419, 1–12. [Google Scholar] [CrossRef]
  45. Segev, A.; Rybakov, M. History of faulting and magmatism in the Galilee (Israel) and across the Levant continental margin inferred from potential field data. J. Geodyn. 2011, 51, 264–284. [Google Scholar] [CrossRef]
  46. Avni, Y.; Segev, A.; Ginat, H. Oligocene regional denudation of the northern Afar Dome: Pre- and syn-breakup stages of the Afro-Arabian plate. Geol. Soc. Am. Bull. 2012, 124, 1871–1897. [Google Scholar] [CrossRef]
  47. Faccenna, C.; Becker, T.W.; Jolivet, L.; Keskin, M. Mantle convection in the Middle East: Reconciling Afar upwelling, Arabia indentation, and Aegean trench rollback. Earth Planet. Sci. Lett. 2013, 375, 254–269. [Google Scholar] [CrossRef]
  48. Wald, R. Interpretation of the Lower (Southern) Galilee Tectonic Evolution from Oligocene Truncation to Miocene-Pliocene Deformation Using Geological Geophysical Subsurface Data. Ph.D. Thesis, University of Haifa, Haifa, Israel, 2016; p. 196, (In Hebrew with English abstract). [Google Scholar]
  49. Wald, R.; Schattner, U.; Segev, A.; Ben-Avraham, Z. Structural expression of a fading rift front: A case study from the Oligo-Miocene Irbid rift of northwest Arabia. Solid Earth 2019, 10, 225–250. [Google Scholar] [CrossRef]
  50. Wald, R.; Schattner, U.; Segev, A.; Ben-Avraham, Z. Initiation of Arabian Plate exposure during the Oligocene: Evidence from the Galilee, Israel. In Proceedings of the AAPG International Conference, Istanbul, Turkey, 14–17 September 2014. [Google Scholar]
  51. Al Hseinat, M.; AlZidaneen, M. Restraining bend deformation at the northern termination of the Wadi Araba Fault: Insights from reflection seismic data and focal mechanism solutions. Tectonophysics 2024, 887, 230456. [Google Scholar] [CrossRef]
  52. Bosworth, W.; Huchon, P.; McClay, K. The Red Sea and Gulf of Aden Basins. J. Afr. Earth Sci. 2005, 43, 334–378. [Google Scholar] [CrossRef]
  53. Bishop, T.N.; Nunns, A.G. Correcting amplitude, time, and phase mis-ties in seismic data. Geophysics 1994, 59, 946–953. [Google Scholar] [CrossRef]
  54. Jordan Hunt Oil Company. Jafr-01 exploration well. In Natural Resource Authority Report; Jordan Hunt Oil Company: Amman, Jordan, 1989. [Google Scholar]
  55. Natural Resource Authority. Jafr-02 exploration well. In Natural Resource Authority Report; Natural Resource Authority: Amman, Jordan, 1990. [Google Scholar]
  56. National Petrolum Company. Jafr-03 exploration well. In Natural Resource Authority Report; National Petrolum Company: Amman, Jordan, 2023. [Google Scholar]
  57. Drury, S.A. Image Interpretation in Geology, 2nd ed.; Chapman and Hall: London, UK, 1993. [Google Scholar]
  58. Lillesand, T.M.; Kiefer, R.W. Remote Sensing and Image Interpretation; John Wiley Sons: Hoboken, NJ, USA, 2000. [Google Scholar]
  59. Prasad, N.; Saran, S.; Kushwaha, S.P.S.; Roy, P.S. Evaluation of various image fusion techniques and imaging scales for forest features interpretation. Curr. Sci. 2001, 81, 1218–1224. [Google Scholar]
  60. Marghany, M.; Hashim, M. Lineament mapping using multispectral remote sensing satellite data. Res. J. Appl. Sci. 2010, 5, 126–130. [Google Scholar] [CrossRef]
  61. Hardcastle, K.C. Photolineament Factor: A new computer-aided method for remotely sensing the degree to which bedrock is fractured. Photogramm. Eng. Remote Sens. 1995, 61, 739–747. [Google Scholar]
  62. Masoud, A.; Koike, K. Tectonic architecture through Landsat-7 ETM+/SRTM DEM-derived lineaments and relationship to the hydrogeologic setting in Siwa region, NW Egypt. J. Afr. Earth Sci. 2006, 45, 467–477. [Google Scholar] [CrossRef]
  63. Hashim, M.; Ahmad, S.; Johari, M.A.M.; Pour, A.B. Automatic lineament extraction in a heavily vegetated region using Landsat Enhanced Thematic Mapper (ETM+) imagery. Adv. Space Res. 2012, 51, 874–890. [Google Scholar] [CrossRef]
  64. Pour, A.B.; Hashim, M. Structural mapping using PALSAR data in the Central Gold Belt, Peninsular Malaysia. Ore Geol. Rev. 2014, 64, 13–22. [Google Scholar] [CrossRef]
  65. Batson, R.M.; Edwards, E.; Eliason, E.M. Computer-generated shaded-relief images. J. Res. U.S. Geol. Surv. 1975, 4, 401–408. [Google Scholar]
  66. Horn, B. Hill shading and the reflectance map. Proc. IEEE 1981, 69, 14–47. [Google Scholar] [CrossRef]
  67. Simpson, D.W.; Anders, M.H. Tectonics and topography of the western United States: An application of digital mapping. GSA Today 1992, 2, 117–121. [Google Scholar]
  68. Cooper, G. Feature detection using sun shading. Comput. Geosci. 2003, 29, 941–948. [Google Scholar] [CrossRef]
  69. Mark, R.K. A multi-directional, oblique-weighted, shaded-relief image of the Island of Hawaii. U.S. Geol. Surv. Open-File Rep. 1992, 19, 92–422. Available online: http://pubs.usgs.gov/of/1992/of92-422/ (accessed on 10 May 2025).
  70. Jenny, B. An interactive approach to analytical relief shading. Cartogr. Int. J. Geogr. Inf. Geovis. 2001, 38, 67–75. [Google Scholar] [CrossRef]
  71. Sipkin, S.A. Estimation of earthquake source parameters by the inversion of waveform data: Synthetic waveforms. Phys. Earth Planet. Inter. 1982, 30, 2–3. [Google Scholar] [CrossRef]
  72. Montilla, J.A.P.; Galdeano, C.S.; Cassado, C.L. Use of Active Fault Data versus Seismicity Data in the Evaluation of Seismic Hazard in the Granada Basin (Southern Spain). Bull. Seismol. Soc. Am. 2003, 93, 1670–1678. [Google Scholar] [CrossRef]
  73. Havskov, J.; Ottemöller, L. Seisan earthquake analysis software. Seismol. Res. Lett. 1999, 70, 532–534. [Google Scholar] [CrossRef]
  74. Havskov, J.; Ottemöller, L. SEISAN: The earthquake analysis software for Windows, Solaris, Linux and MACOSX version 8.2 Manual. Seismol. Res. Lett. 2008, 70, 532–534. [Google Scholar] [CrossRef]
  75. Havskov, J.; Voss, P.H.; Ottemöller, L. Seismological Observatory Software: 30 Yr of SEISAN. Seismol. Res. Lett. 2020, 91, 1846–1852. [Google Scholar] [CrossRef]
  76. El-Isa, Z. The instrumental seismicity of the Jordan Dead Sea transform. Arab. J. Geosci. 2017, 10, 203. [Google Scholar] [CrossRef]
  77. Cronin, V. A Primer on Focal Mechanism Solutions for Geologists; Science Education Resource Center, Carleton College: Northfield, MN, USA, 2010. [Google Scholar]
  78. Gvirtzman, G.; Weissbrod, T. The Hercynian Geanticline of Helez and the Late Palaeozoic history of the Levant. Geol. Soc. Lond. Spec. Publ. 1984, 17, 177–186. [Google Scholar] [CrossRef]
  79. Al-Jallal, I.A. The Khuff Formation: Its regional reservoir potential in Saudi Arabia and other Gulf countries: Depositional and stratigraphic approach. In Middle East Geosciences, GEO’94; Al-Husseini, M.I., Ed.; Gulf PetroLink: Manama, Bahrain, 1995; Volume 1, pp. 103–119. [Google Scholar]
  80. Powell, J.H. Stratigraphy and Sedimentation of the Phanerozoic Rocks in Central and South Jordan. Part B Kurnub, Ajlun and Belqa Groups. Bulletin 11; Geological Mapping Division, Natural Resources Authority: Amman, Jordan, 1989; 71p. [Google Scholar]
  81. Stoeser, D.; Camp, V. Pan-African microplate accretion of the Arabian Shield. Geol. Soc. Am. Bull. 1985, 96, 817–826. [Google Scholar] [CrossRef]
  82. Agar, R. The Najd fault system revisited: A two-way strike-slip orogen in the Saudi Arabian Shield. J. Struct. Geol. 1987, 9, 41–48. [Google Scholar] [CrossRef]
  83. Beydoun, Z.R. Arabian Plate hydrocarbon geology and potential—A plate tectonic approach. In American Association of Petroleum Geologists eBooks; GeoScienceWorld: McLean, VA, USA, 1991. [Google Scholar] [CrossRef]
  84. Chen, X.L.; Hui, H.J.; Zhao, Y.H. The relationship between fault properties and landslide distribution: Taking the large-scale landslide in the Wenchuan earthquake as an example. Seismol. Geol. 2014, 36, 358–367. [Google Scholar]
  85. Galehouse, S.J.; Lienkaemper, J.J. Inferences drawn from two decades of alinement array measurements of creep on faults in the San Francisco Bay region. Bull. Seismol. Soc. Am. 2003, 93, 2415–2433. [Google Scholar] [CrossRef]
  86. Lienkaemper, J.J.; McFarland, S.F.; Simpson, W.R.; Bilham, G.R.; Ponce, A.D.; Boatwright, J.J.; Caskey, J.S. Long-term creep rates on the Hayward fault: Evidence for controls on the size and frequency of large earthquakes. Bull. Seismol. Soc. Am. 2012, 102, 31–41. [Google Scholar] [CrossRef]
  87. Al Hseinat, M.; Hübscher, C. Ice-load induced tectonics-controlled tunnel valley evolution—instances from the southwestern Baltic. Quat. Sci. Rev. 2014, 97, 121–135. [Google Scholar] [CrossRef]
  88. Al Hseinat, M.; Hübscher, C.; Lang, J.; Lüdmann, T.; Ott, I.; Polom, U. Triassic to recent tectonic evolution of a crestal collapse graben above a salt-cored anticline in the Glückstadt Graben/North German Basin. Tectonophysics 2016, 680, 50–66. [Google Scholar] [CrossRef]
  89. Aldersons, F.; Ben-Avraham, Z.; Hofstetter, A.; Kissling, E.; Al-Yazjeen, T. Lower-crustal strength under the Dead Sea basin from local earthquake data and rheological modeling. Earth Planet. Sci. Lett. 2003, 214, 129–142. [Google Scholar] [CrossRef]
  90. Abou Elenean, K.; Aldamegh, K.; Zahran, H.; Hussein, H. Regional waveform inversion of 2004 February 11 and 2007 February 09 Dead Sea earthquakes. Geophys. J. Int. 2009, 176, 185–199. [Google Scholar] [CrossRef]
  91. Hofstetter, A.; Dorbath, C.; Dorbath, L. Instrumental Data on the Seismic Activity Along the Dead Sea Transform System; Springer: Berlin/Heidelberg, Germany, 2014; pp. 263–278. [Google Scholar] [CrossRef]
  92. Hofstetter, A.; Dorbath, C.; Dorbath, L.; Braeuer, B.; Weber, M. Stress tensor and focal mechanisms in the Dead Sea basin. J. Seismol. 2016, 20, 669–699. [Google Scholar] [CrossRef]
  93. Wetzler, N.; Sagy, A.; Marco, S. The association of micro-earthquake clusters with mapped faults in the Dead Sea basin. Journal of Geophysical Research. Solid Earth 2014, 119, 8312–8330. [Google Scholar] [CrossRef]
  94. Nuriel, P.; Weinberger, R.; Kylander-Clark, A.; Hacker, B.; Craddock, J. The onset of the Dead Sea transform based on calcite age-strain analyses. Geology 2017, 45, 587–590. [Google Scholar] [CrossRef]
  95. Walley, C.D. Some outstanding issues in the geology of Lebanon and their importance in the tectonic evolution of the Levantine region. Tectonophysics 1998, 298, 37–62. [Google Scholar] [CrossRef]
  96. Hardy, C.; Homberg, C.; Eyal, Y.; Barrier, É.; Müller, C. Tectonic evolution of the southern Levant margin since Mesozoic. Tectonophysics 2010, 494, 211–225. [Google Scholar] [CrossRef]
  97. Hempton, M. Constraints on Arabian plate motion and extensional history of the Red Sea. Tectonics 1987, 6, 687–705. [Google Scholar] [CrossRef]
  98. Lyberis, N.; Yurur, T.; Chorowicz, J.; Kasapoglu, E.; Gundogdu, N. The East Anatolian Fault: An oblique collisional belt. Tectonophysics 1992, 204, 1–15. [Google Scholar] [CrossRef]
  99. Freund, R. A model of the structural development of Israel and adjacent areas since Upper Cretaceous times. Geol. Mag. 1965, 102, 189–205. [Google Scholar] [CrossRef]
  100. Mahmoud, Y.; Masson, F.; Meghraoul, M.; Cakir, Z.; Alchalbi, A.; Yavaoglu, H.; Yönlü, O.; Daoud, M.; Ergintav, S.; Inan, S. Kinematic study at the junction of the East Anatolian fault and the Dead Sea fault from GPS measurements. J. Geodyn. 2013, 67, 30–39. [Google Scholar] [CrossRef]
  101. Al Hseinat, M.; AlZidaneen, M. Tectonic Scenarios and Structural Deformation Patterns at the Northern End of the Wadi Araba Strike-slip System, Jordan Plateau. Geogr. Earth Sci. Environ. Res. Highlights 2024, 2, 116–150. [Google Scholar] [CrossRef]
  102. Bartholomew, M.J.; Stickney, M.C.; Wilde, E.M.; Dundas, R.G. Late Quaternary paleoseismites: Syndepositional features section restoration used to indicate paleoseismicity stress-field orientations during faulting along the main Lima Reservoir fault southwestern Montana In Ancient Seismites; Ettensohn, F.R., Rast, N., Brett, C.E., Eds.; Geological Society of America: Boulder, CO, USA, 2002. [Google Scholar] [CrossRef]
  103. Abou Karaki, N. Synthèse et Carte Sismotectonique des Pays de la Bordure Orientale de la Méditerranée: Sismicité du Système de Failles du Jourdain-Mer Morte. Ph.D. Thesis, Université Louis Pasteur de Strasbourg, Institut de Physique du Globe, Strasbourg, France, 1987. (In French). [Google Scholar]
  104. Mengjia, Z.; Guangzeng, W.; Sanzhong, L.; Yongjiang, L.; Pengcheng, W.; Lingli, G.; Li, Z.; Xingpeng, C.; Taihai, S. An overview of structures associated with bends of strike-slip faults: Focus on analogue and numerical models. Mar. Pet. Geol. 2024, 167, 106983. [Google Scholar] [CrossRef]
  105. Ali, S.M.; Abdelrahman, K. Earthquake occurrences of the major tectonic terranes for the Arabian Shield and their seismic hazard implication. Front. Earth Sci. 2022, 10, 851734. [Google Scholar] [CrossRef]
Figure 1. A regional tectonic map of the Middle East (based on [7]) presents the location of Jordan and the major tectonic structures within (modified from [8]).
Geosciences 15 00177 g001
Figure 2. A Google Earth map depicts the study area, located east of the Dead Sea Transform System (refer to Figure 1 for location). The map displays the distribution of earthquake epicenters, seismic lines, and exploration wells. The locations and extents of major fault systems are adapted from Al Hseinat et al. [8], while earthquake epicenter data are provided by the Jordanian Seismological Observatory. Exploration wells are labeled as follows: JF-01 (Al-Jafr-01), JF-02 (Al-Jafr-02), and JF-03 (Al-Jafr-03).
Geosciences 15 00177 g002
Figure 3. The geological column representing the study area outlines the principal lithologies, stratigraphic groups, formations, and their respective ages based on interpretations adapted from previous works [8,20,27,28].
Geosciences 15 00177 g003
Figure 4. Well-to-well correlation highlighting lithological boundaries across the study area. JF−01: Al-Jafr−01, JF−02: Al-Jafr−02, and JF−03: Al-Jafr−03 exploration wells. The dotted green seismic lines indicate the correlation.
Geosciences 15 00177 g004
Figure 5. (a) An uninterpreted SW-NE seismic section (for location, see Figure 2). (b) Interpreted section in the southeastern corner of the study area. The seismic section illustrates the stratigraphy from Precambrian to recent times. The KWF cuts the strata from the Precambrian into the uppermost Cretaceous. Some segments propagate, penetrating the surface. The fault shows a system of normal faults that form a negative flower structure deformation pattern.
Geosciences 15 00177 g005
Figure 6. (a) An uninterpreted W-E seismic section (for location, see Figure 2). (b) Interpreted section in the southeastern part of the study area. This section exhibits the stratigraphy from Precambrian to recent times.
Geosciences 15 00177 g006
Figure 7. (a) An uninterpreted NNE–SSW seismic section (for location, see Figure 2). (b) Interpreted section in the middle part of the study area. This section also shows the stratigraphy from Precambrian to recent times.
Geosciences 15 00177 g007
Figure 8. (a) An uninterpreted SW-NE seismic section (for location, see Figure 2). (b) Interpreted section illustrating stratigraphy from the Ordovician to recent deposits. The section highlights the significant deformation of Upper Cretaceous and Cenozoic deposits within the KWF zone.
Geosciences 15 00177 g008
Figure 9. (a) An uninterpreted SW-NE seismic section (for location, see Figure 2). (b) Interpreted section illustrating stratigraphy from the Ordovician to recent deposits. The section highlights the significant deformation of Upper Cretaceous and Cenozoic deposits within the KWF zone. The epicenter of an earthquake was located at 7 km offset.
Geosciences 15 00177 g009
Figure 10. (a) An uninterpreted SW-NE seismic section (for location, see Figure 2). (b) Interpreted section illustrating stratigraphy from the Ordovician to recent deposits. The section highlights the significant deformation of Upper Cretaceous and Cenozoic deposits within the KWF zone. The epicenter of an earthquake was located at 5 km offset.
Geosciences 15 00177 g010
Figure 11. Satellite image showing the northwestern part of the study area (for location, see Figure 2). (a) Highlights the surface expression of the KWF in a highly complex region close to the DSTF. (b) Displays the KWF buffer zone, earthquake epicenters, and the site of the landslides impacting Karak City. Black arrows indicate KWF surface expression. DSTF: Dead Sea Transform Fault, KWF: Karak Wadi Al Fayha Fault.
Geosciences 15 00177 g011
Figure 12. (a) Multi-illumination hill-shaded image of the Arabian plate created by integrating multiple light azimuths (for location, see Figure 1). It reveals a distinct pattern of both positive and negative surface elements. (b) Negative relief of the KWF in Jordan (marked by white arrows). (c) Negative relief of the KWF in Saudi Arabia (marked by white arrows). (d) Fault mechanisms of selected earthquakes along the KWF. Events 1 and 5 show left-lateral strike-slip mechanisms associated with normal faulting (transtensional mechanisms). Events 2–4 show a normal mechanism. KWF: Karak Wadi Al Fayha Fault.
Geosciences 15 00177 g012
Figure 13. A conceptual 2D model (not to scale) illustrating the evolutionary stages of the KWF from the Precambrian to the present. (a) Development of the initial basement fault system associated with the Najd Fault System. (b) Reactivation during the Paleozoic, likely influenced by differential loading and unloading due to glacial dynamics, combined with long-term uplift (adapted from Al Hseinat et al. [8]). (c) Renewed activity from the Late Cretaceous to Late Eocene, driven by compressional and strike-slip tectonic events. (d) Continued reactivation from the Latest Cretaceous to the present in response to evolving regional stress regimes.
Geosciences 15 00177 g013
Figure 14. Photographs of landslides triggered by recent fault activity in the northwestern extension of the KWF. Red arrows indicate landslide expression.
Geosciences 15 00177 g014
Table 1. Seismic data processing sequence flow.
Pre-processingDemultiplex
Trace muting (top mute)
Trace amplitude recovery (exponent 4 dB/s from 0.0 to 2.5 s)
Automatic gain control
Band pass
filter F-K filter
Pre-staking processesDeconvolution (Designature: minimum phase input assumed)
Scaling (offset: 201−3750 m) Time: 0−1000 ms)
Velocity Analysis (surface referenced)
Normal Moveout Correction
Datum statics (Datum 650 and 800 m (ASL) Replacement Velocity 2200 m/s)
Common depth point/ straight (fold 30 and 40)
Post-staking processesTime-Variant Filter: time (s) → bandwidth (Hz)
         0.0–0.6  8−40
         1.0    8–45
         2.0    8–35
Spiking Predictive Deconvolution
F-K Migration
Post-migration processes −Trace mixing, Automatic gain control
Table 2. Key seismic horizons interpreted across the study area.
Key horizonDescriptionReflection
Base Cenozoic Deposits (BCD)Identified in localized seismic
sections and corroborated by
JF-03 well data.
Geosciences 15 00177 i001
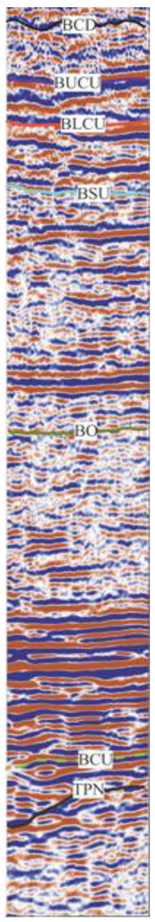
Base Lower Cretaceous
Unconformity (BLCU) and
Base Upper Cretaceous
Unconformity (BUCU)
These major unconformities
delineate the shift from
Paleozoic to Mesozoic
sedimentation.
Base Silurian Unconformity
(BSU)
Indicates a regional erosional
surface truncating underlying
Ordovician units.
Base Ordovician (BO)Represents the transition to
Ordovician sandstone
deposition.
Base Cambrian Unconformity
(BCU)
Separates the Precambrian
Saramuj Formation from the
Cambrian sandstone deposit.
Top Precambrian
Nonconformity (TPN)
Marks the interface between
the crystalline basement and
the overlying sedimentary
sequences.
Disclaimer/Publisher’s Note: The statements, opinions and data contained in all publications are solely those of the individual author(s) and contributor(s) and not of MDPI and/or the editor(s). MDPI and/or the editor(s) disclaim responsibility for any injury to people or property resulting from any ideas, methods, instructions or products referred to in the content.

