Article

Evaluation of the Shear Modulus Degradation by a Modified Hyperbolic Function for Unconventional Geomaterials

by
Hernán Patiño
,
Fausto Molina-Gómez
* and
Rubén Ángel Galindo-Aires
Department of Geotechnical Engineering, Universidad Politécnica de Madrid, Calle Profesor Aranguren 3, 28040 Madrid, Spain
*
Author to whom correspondence should be addressed.
Geosciences 2025, 15(5), 176; https://doi.org/10.3390/geosciences15050176
Submission received: 30 March 2025 / Revised: 9 May 2025 / Accepted: 12 May 2025 / Published: 14 May 2025
(This article belongs to the Section Geomechanics)

Abstract

:
The characterisation of shear modulus degradation is essential for understanding the dynamic response of geomaterials. This article presents a modified hyperbolic model that evaluates the shear modulus for various angular strains and effective confining stresses. The model has been calibrated and validated using data from 108 resonant-column tests conducted on three different types of tailings from the Riotinto mines in Huelva, Spain. These tests were conducted on saturated samples that were consolidated at effective stresses of 50, 100, 150, 200, 250, and 300 kPa, accompanied by various combinations of torsional excitations to induce distinct angular strains. The results show that the hyperbolic model effectively predicts the shear modulus degradation in unconventional geomaterials, characterising the shear modulus under the testing conditions for the three types of Riotinto tailings. Additionally, the model can identify and confirm both the initial (or maximum) shear modulus and the reference angular strain as functions of the effective confining stress. The findings and model presented in this article contribute to enhancing the stability and resilience of geotechnical structures, including tailings storage facilities, that are subjected to dynamic loading, leading to safer designs and improved infrastructure performance.

1. Introduction

The evaluation of shear modulus (G) for different levels of angular strain ( γ ) is fundamental for the dynamic analysis of the ground response and geotechnical structures, such as retaining walls, foundations, and tailings storage facilities (TSFs). The stress–strain behaviour of geomaterials tends to be non-linear since their stiffness may decay with strain [1,2,3]. However, assessing the relationship between G and γ experimentally is challenging since the dynamic response varies for different soils and is influenced by various factors [4,5].
The refined model considering the degradation of G at different γ levels holds considerable promise for geotechnical and earthquake engineering applications. It enhances the reliability of site response analyses and the soil–structure interaction, facilitates more accurate seismic design of infrastructure on or near TSFs, and contributes to improved performance-based assessments of geotechnical structures subjected to dynamic loading [6]. This is particularly vital in light of several recent TSF failures worldwide, which have highlighted the pressing need for more robust and material-specific modelling of tailings behaviour [7]. Additionally, the proposed formulation supports advanced numerical simulations (e.g., finite element or finite difference methods) by providing a material-specific, strain-dependent modulus degradation function that can be directly incorporated into dynamic analyses [8].
In the laboratory, the resonant-column (RC) test is the standard method to assess the dynamic behaviour of geomaterials at small to medium strains [9]. The results can be described using non-linear equations, which provide a comprehensive understanding of the degradation of G. Researchers worldwide have developed and proposed various equations in this context, particularly emphasising hyperbolic functions to obtain the curve describing the degradation of G. The earliest hyperbolic function documented in the literature is attributed to Davidenkov [10], which outlines a symmetric and non-linear hysteresis loop. Subsequently, Kondner [11] introduced an empirical hyperbolic function that predicts the stress–strain behaviour of soils. The G degradation curve follows the following general form:
G = G 0 1 + γ γ r e f
In this expression, G 0 represents the initial (small-strain) shear modulus, and γ r e f denotes the reference strain at which G reduces to half of G 0 , which must be experimentally estimated. Over the years, several researchers have proposed modifications and extensions of this model to improve its applicability across various soil types and stress conditions, including Hardin and Richart [12], Hardin and Drnevich [13], Iwasaki et al. [14], Kokusho [15], Ishibashi and Zhang [16], Wichtmann and Triantafyllidis [17], and more recently, Patiño et al. [18]. To simplify formulations for greater practicality and ease of application, particularly in numerical simulation models, the hyperbolic equation requires adaptations based on various factors, such as confinement, plasticity, particle size distribution, and the fabric and structure of the geomaterial under analysis [19,20,21,22]. Patiño et al. [23] examined two cooper tailings, observing that a generalised hyperbolic equation (i.e., the normalised functions proposed by Ishibashi and Zhang [16]) cannot accurately describe the G degradation curve in tailings due to the specific characteristics of each material.
To overcome the aforementioned limitations, this study presents a refined hyperbolic function to characterise the G degradation curve. The model has been calibrated using experimental results from 108 RC tests conducted on three different tailings from the Riotinto mines (Spain). The key novelty of this model lies in its enhanced adaptability to unconventional geomaterials, such as mine tailings, which often exhibit complex mechanical behaviour that deviates from traditional soil and rock models. This method enhances predictive modelling in geotechnical and earthquake engineering by providing a more precise representation of the dynamic properties of tailings, thereby contributing to the safety of TSFs. Hence, this study contributes to both the scientific understanding and practical engineering tools required to improve the resilience and safety of infrastructure built on unconventional geomaterials, under seismic and dynamic loading conditions.

2. Materials and Methods

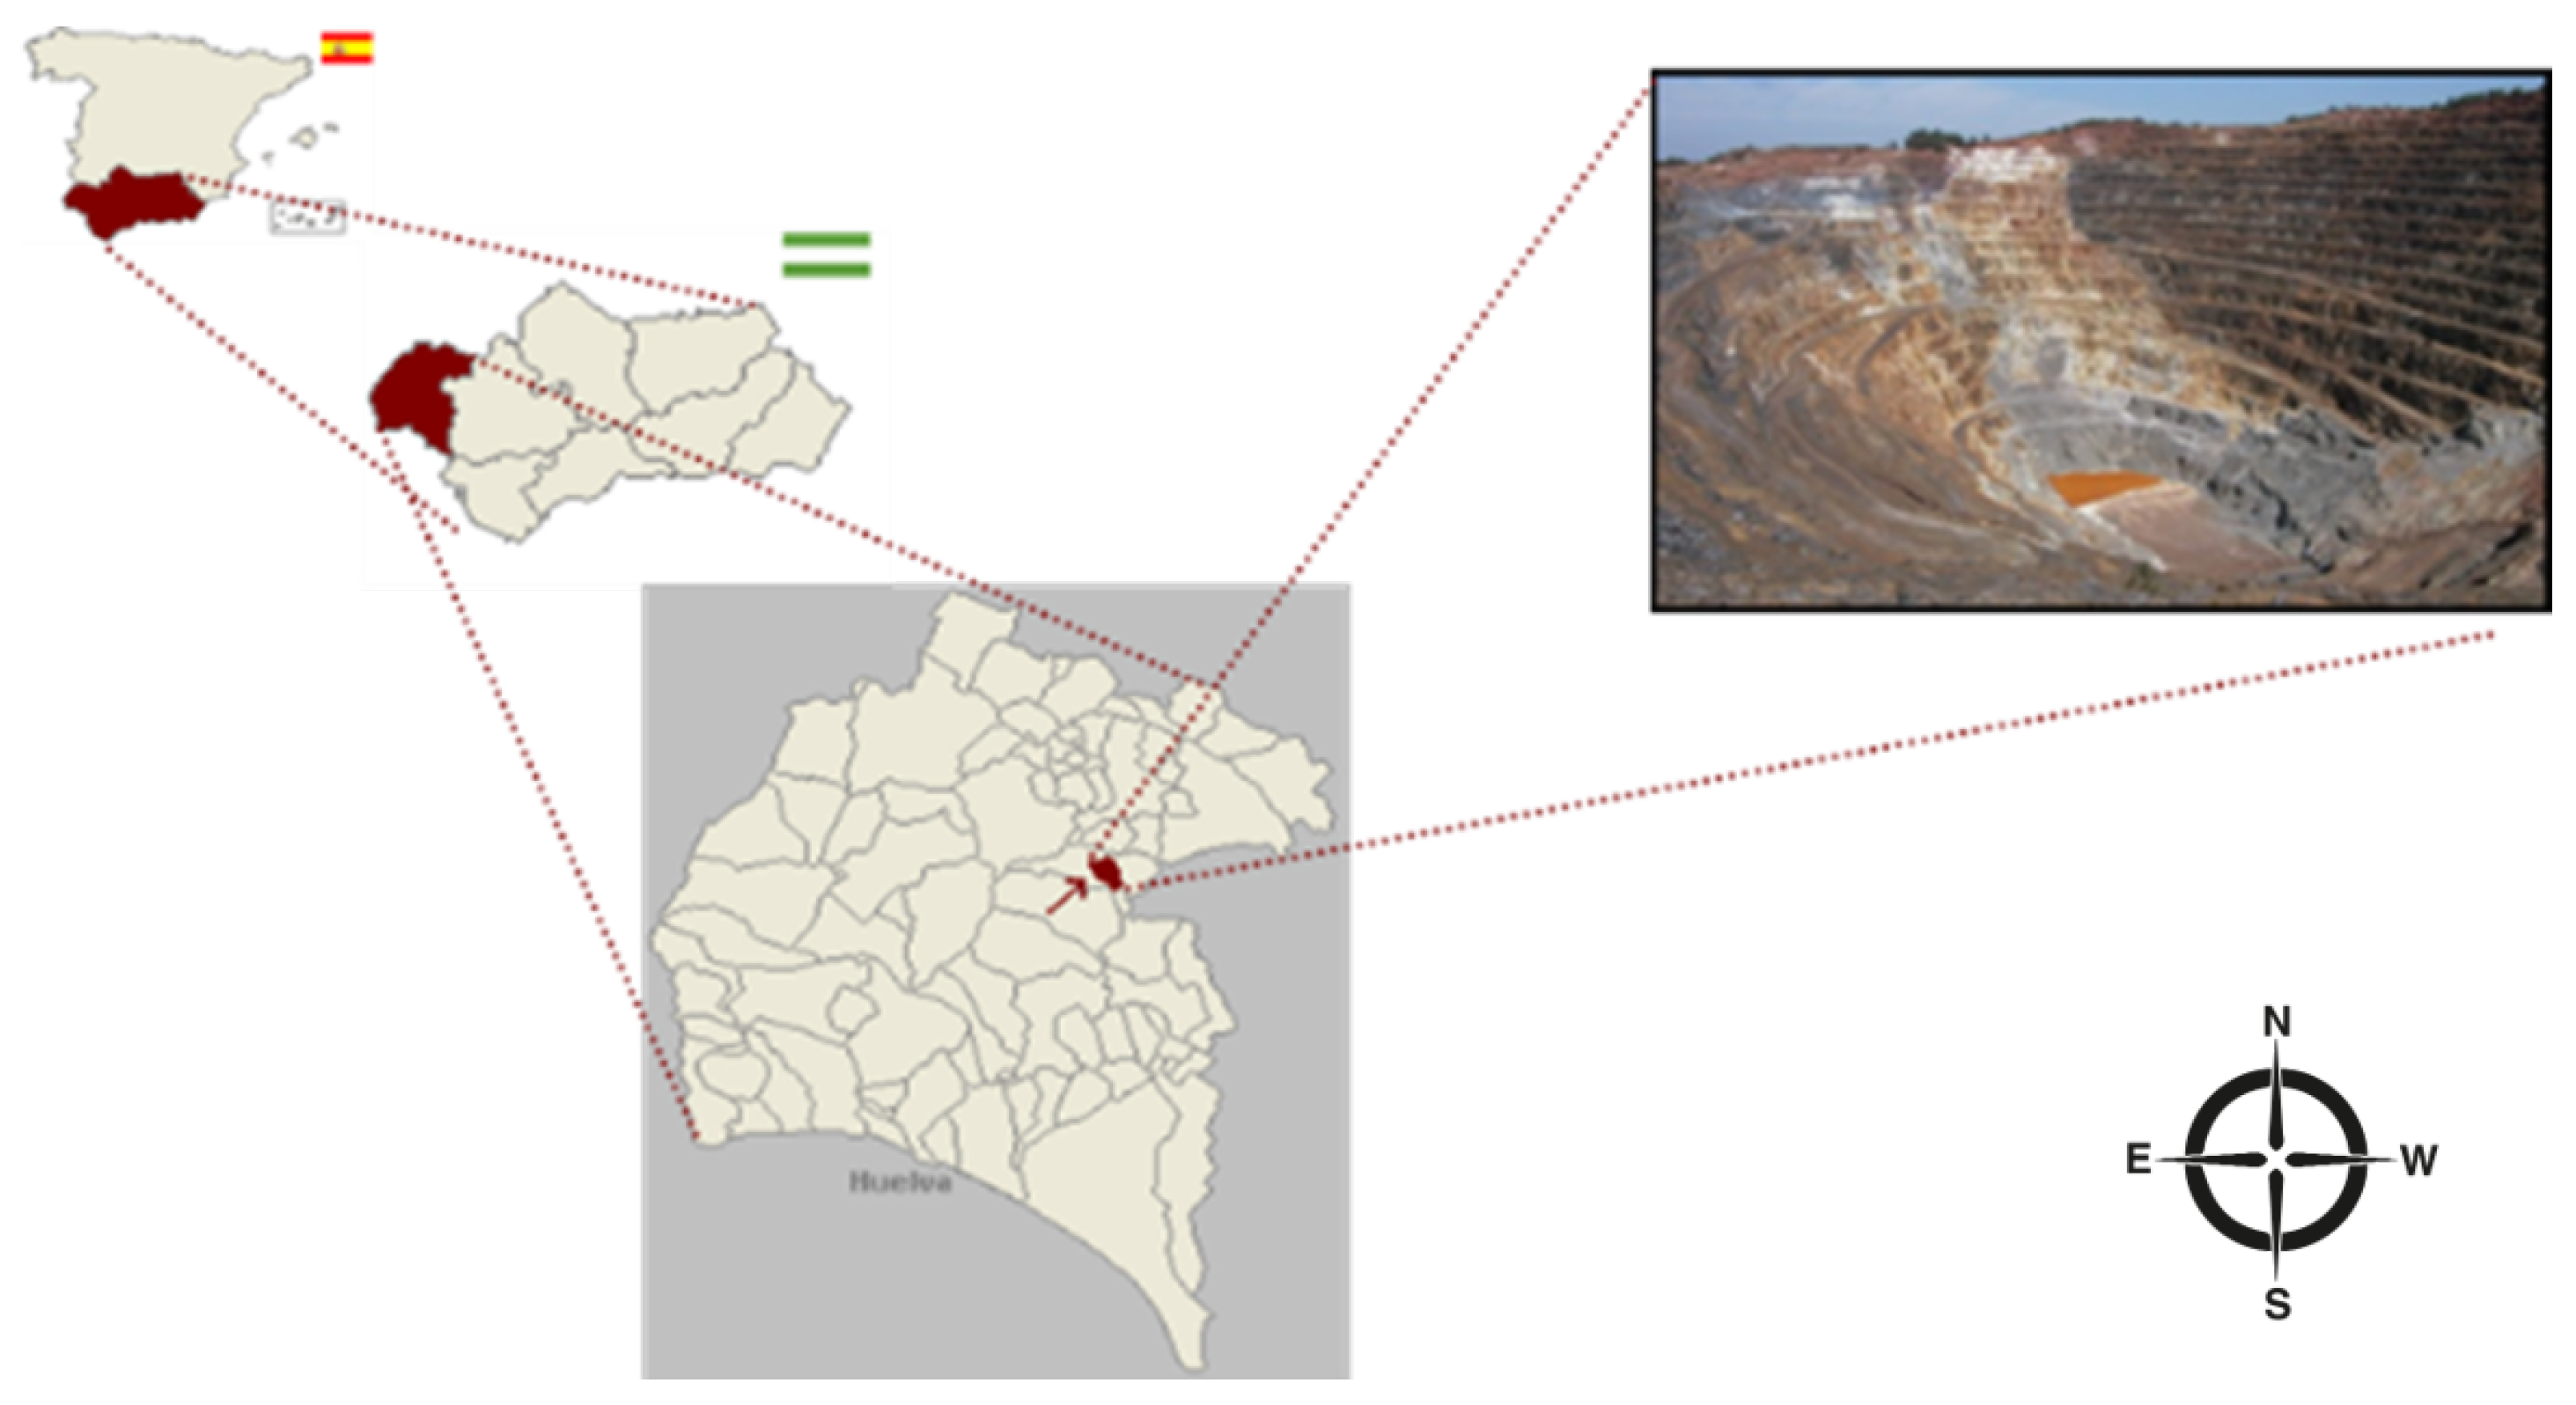
2.1. Description of Investigated Geomaterials

The unconventional geomaterials used in this research correspond to three tailings, which were collected from the TSFs of the Riotinto mines located in the Huelva region, Spain (see Figure 1). The TSFs at Riotinto hold the largest deposits of copper, silver, and gold in Spain, which have historically influenced the local population since ancient times. Evidence indicates that such deposits attracted the area’s first settlers as early as 2000 B.C. [24]. Exploiting the Riotinto mines has resulted in the creation of numerous tailings dams covering an area of approximately 1200 hectares. Currently, these structures are of geotechnical interest, particularly regarding the dynamic behaviour of the dams constructed in this region with moderate to high seismic activity.
The geomaterials were collected from the surface. The three materials were named according to the mine site: “Cerro Salomón sand” (CSS), “high-density sludge” (HDS), and “copper lamas” (CL). Table 1 presents the index properties of the three materials, including the natural moisture ( ω n ), fines content (FC), liquid limit (LL), plastic limit (PL), plastic index (PI), density of solid particles ( ρ s ), and dry density ( ρ d ). On the other hand, X-ray fluorescence tests were performed in these geomaterials to identify the dominant minerals, i.e., quartz, phyllosilicates, and metallic minerals (see Table 2). These analyses also identified the oxides of various elements, resulting in diverse chemical components, as detailed in Table 3.

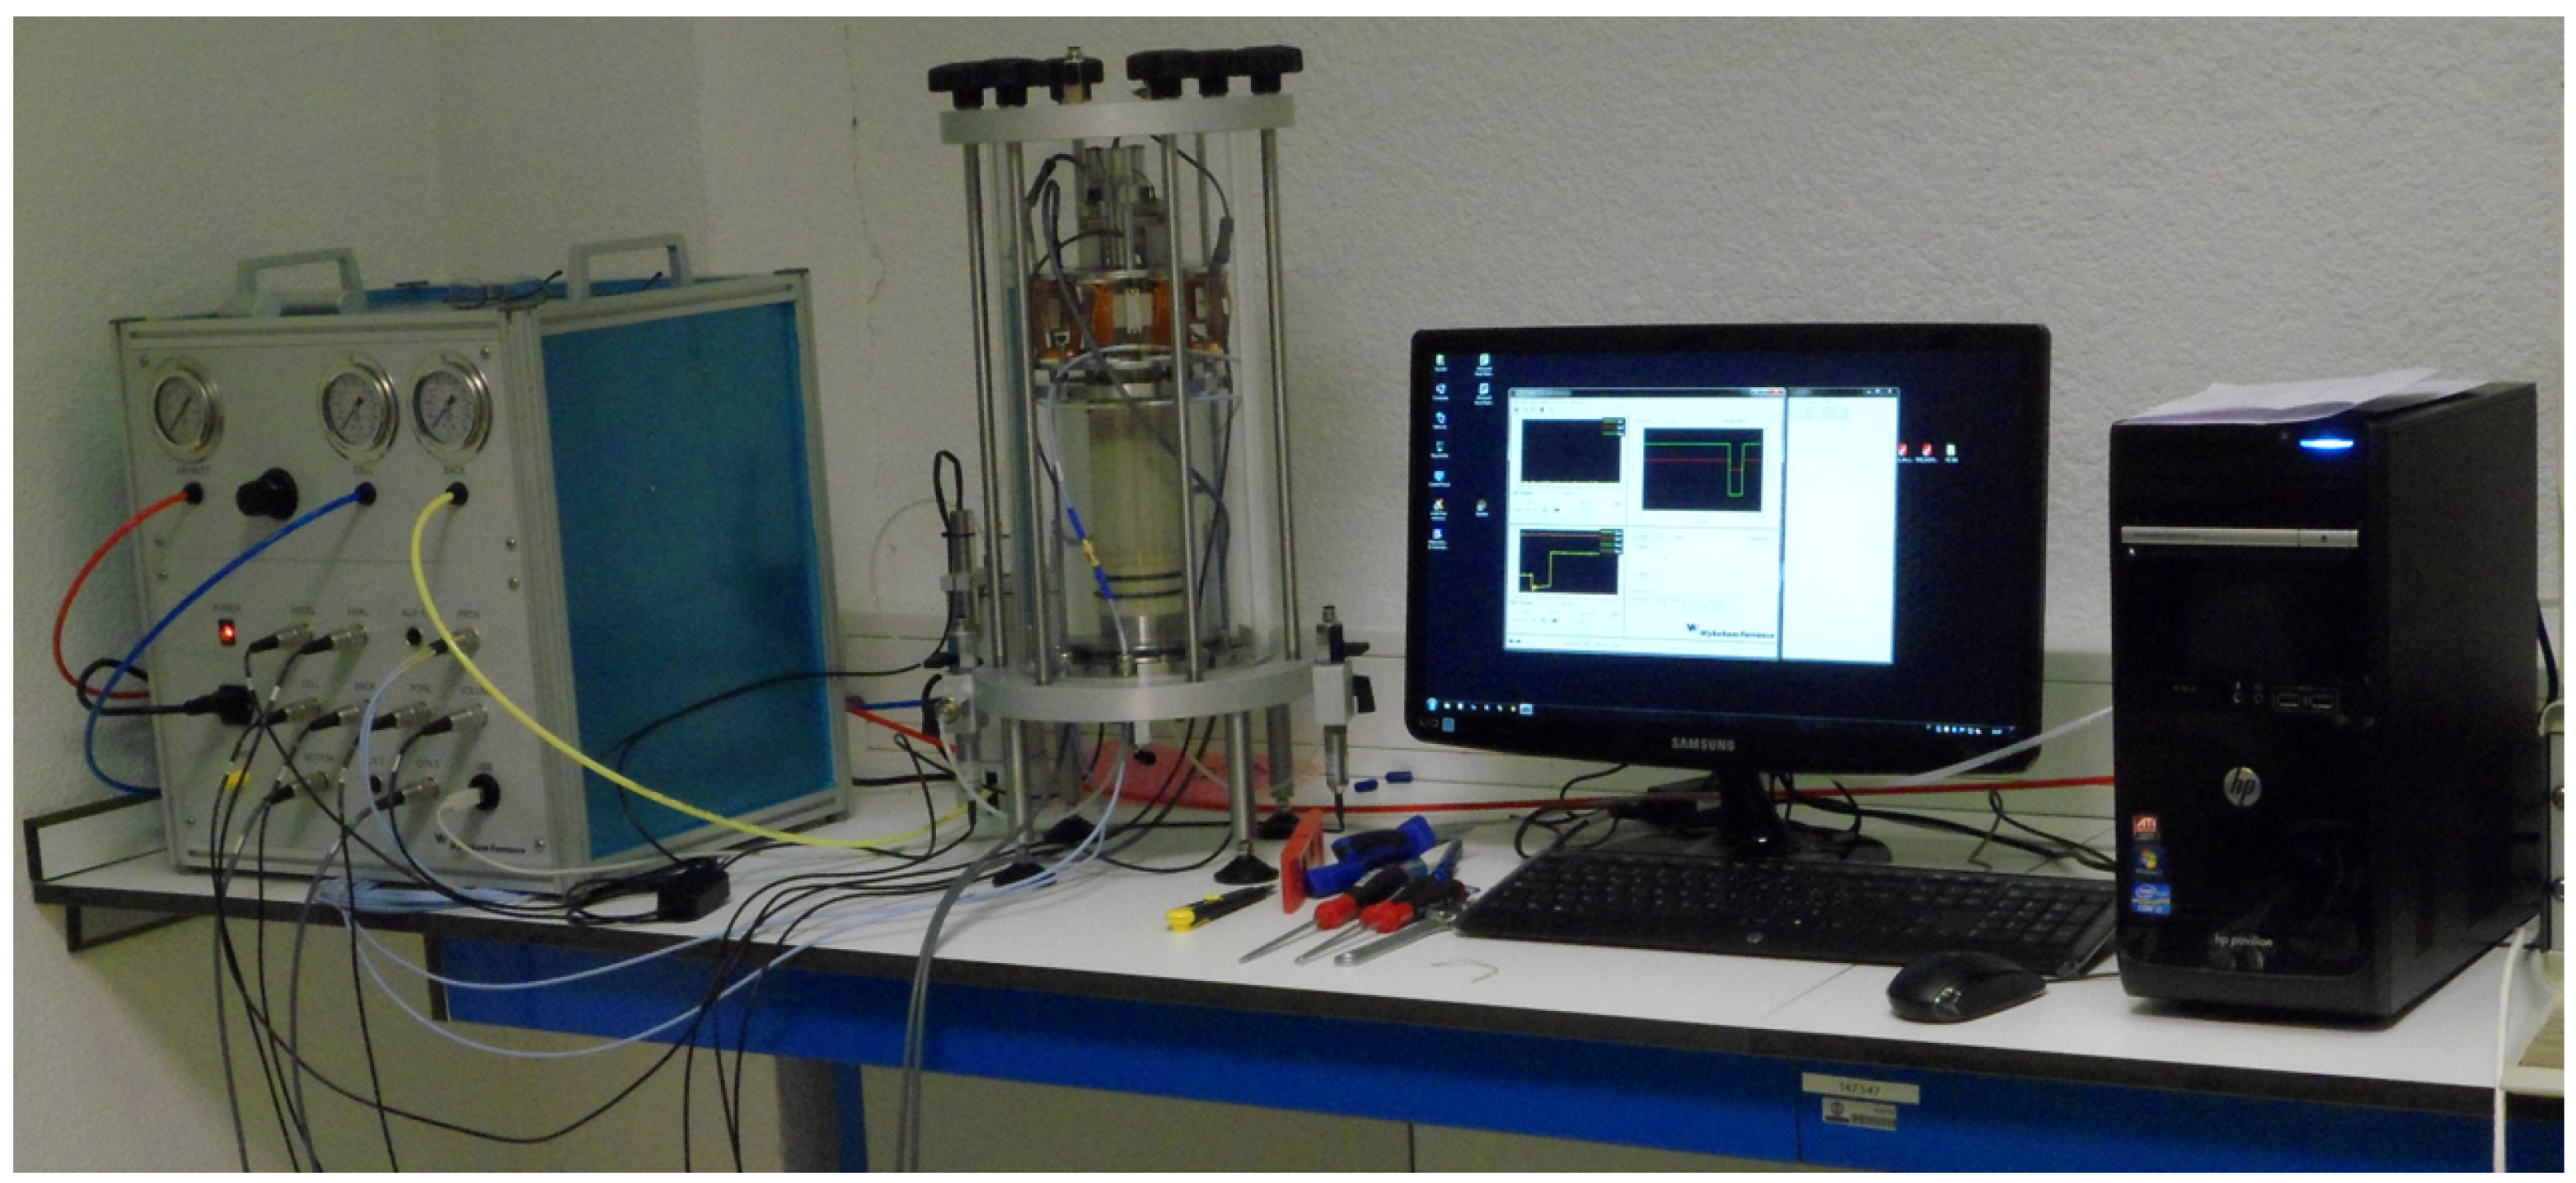
2.2. Description of Resonant-Column Apparatus

The resonant-column (RC) apparatus used herein features a bottom-fixed bottom and top-free assembling, characteristic of an RC Stokoe-type configuration. The equipment consists of two polycarbonate hollow cylindrical cells. The internal cell allows for consolidating the specimen by pressurised water while keeping the electronic components above water. The external cell is designed to apply confining pressure to the fluid using a pneumatically operated system. The RC apparatus includes two proximity sensors that measure angular/shear displacements, two mini accelerometers, three pressure sensors to take measurements of the chamber pressure (CP), the back pressure (BP), and the pore water pressure (u), a volume gauge for monitoring volume changes, and an Linear Variable Displacement Transducer to estimate axial deformations.
This apparatus applies torsional vibrations to a cylindrical specimen to characterise the dynamic response of geomaterials. These vibrations are generated by an internal floating structure connected to a series of coils, which are operated by a digital system installed on a laptop for RC equipment control and data acquisition. This system covers both a signal generator and an oscilloscope, capable of producing numerous signal combinations at different frequencies and voltage amplitudes. It also controls two electric pneumatic pressure regulators that allow for the automatic application of cell and back pressures during testing while providing real-time visualisation of all sensors. Figure 2 displays the RC apparatus.

2.3. Testing Procedures and Experimental Program

A comprehensive experimental plan comprising 108 RC tests was performed in the Geotechnical Laboratory of the Escuela de Caminos, Canales y Puertos at the Universidad Politécnica de Madrid. Specimens were reconstituted in the laboratory to replicate the same γ d of the three tailings in the TSF. The dimensions of the specimens—diameter (D) and height (H)—for RC testing were as follows: for the CSS and HDS tailings, H and D were 100 mm and D = 50 mm, respectively, while for the CL tailings, H and D were 110 mm and 50 mm. The specimen preparation required the design and fabrication of novel accessories that guaranteed the vertical positioning of the active free-top and the cylindrical shape of the specimens. Patiño et al. [25] deliver an in-depth and enlightening guide on specimen preparation and equipment assembly.
All specimens were saturated with de-aired water by applying an automatic increment of CP and BP under a positive difference of 20 kPa. The increment stopped when a BP of 400 kPa was achieved. This phase lasted for over 24 h to ensure complete dissolution of air in the water. Skempton’s B-values above 0.98 were obtained in this RC testing program, validating the full saturation conditions. After confirming that full saturation was achieved, the samples were isotropically consolidated under effective confining stress ( σ c ) of 50, 100, 150, 200, 250, and 300 kPa. Following this, resonant-column (RC) tests were conducted by exciting the coils attached to the top cap with a sine sweep signal. This signal maintained a constant voltage amplitude ranging from 0.025 to 0.8 V, with frequencies spanning from 20 to 130 Hz, in order to evaluate the G degradation.

3. Analysis of Results and Discussion

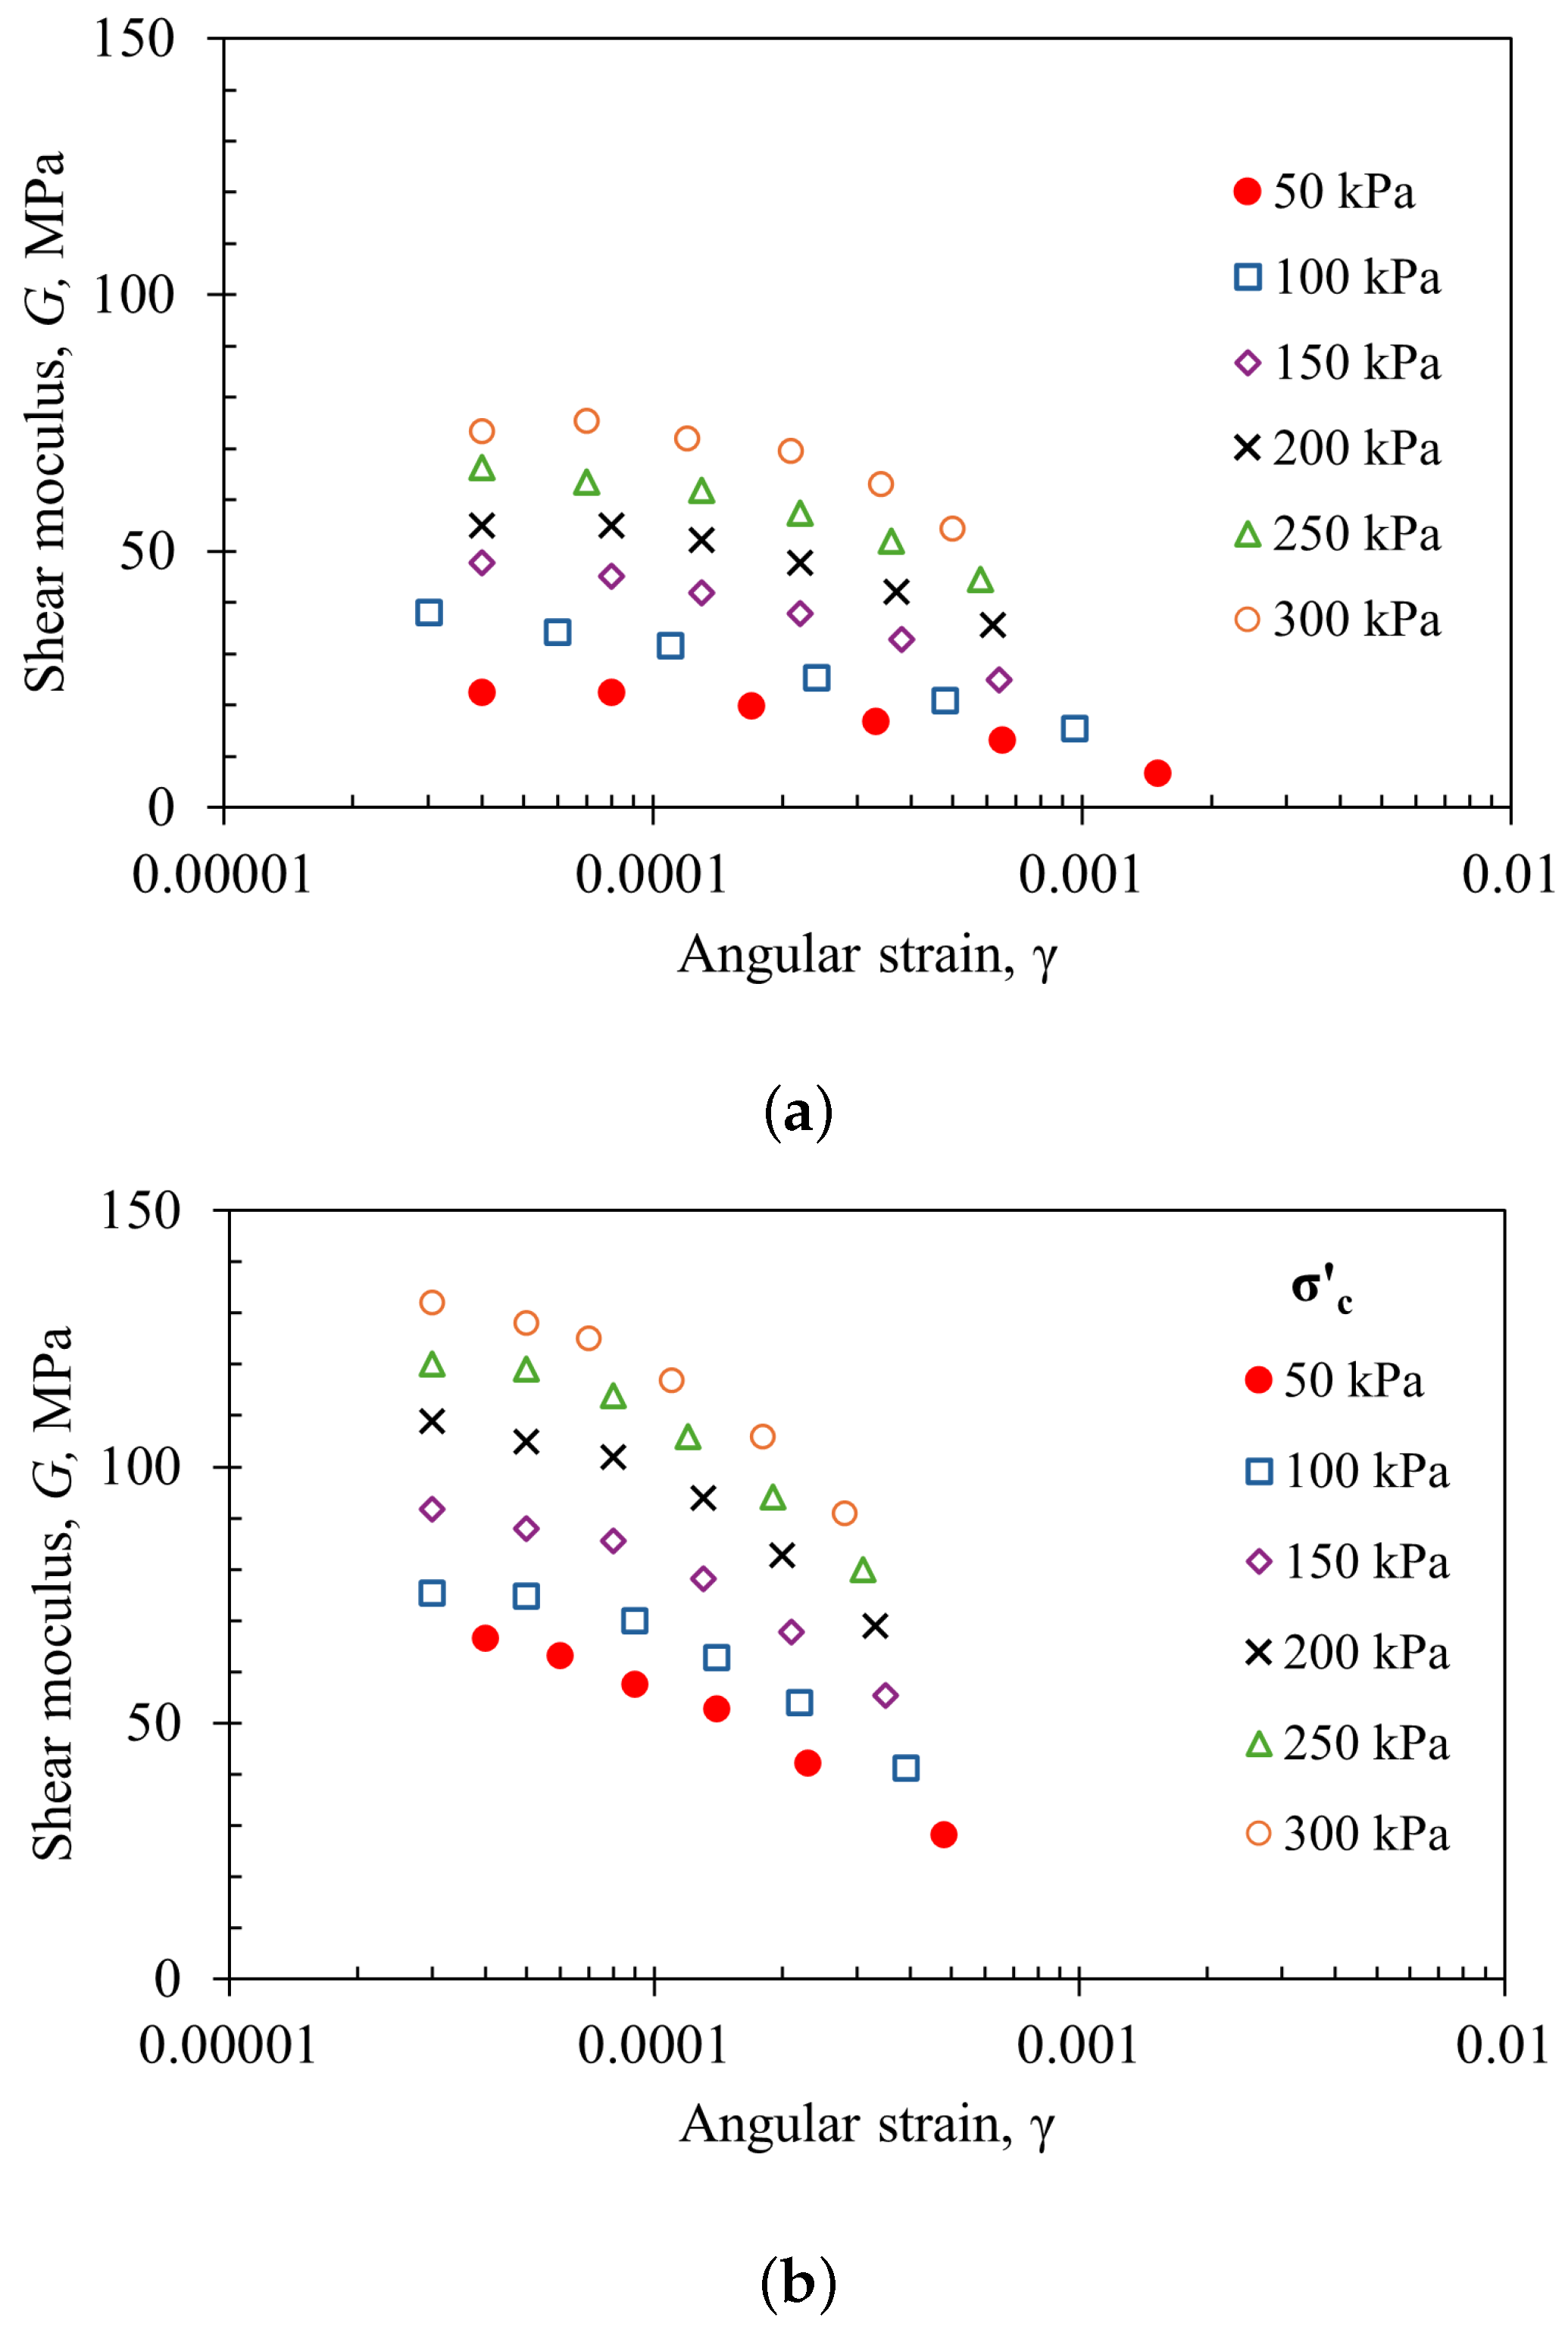
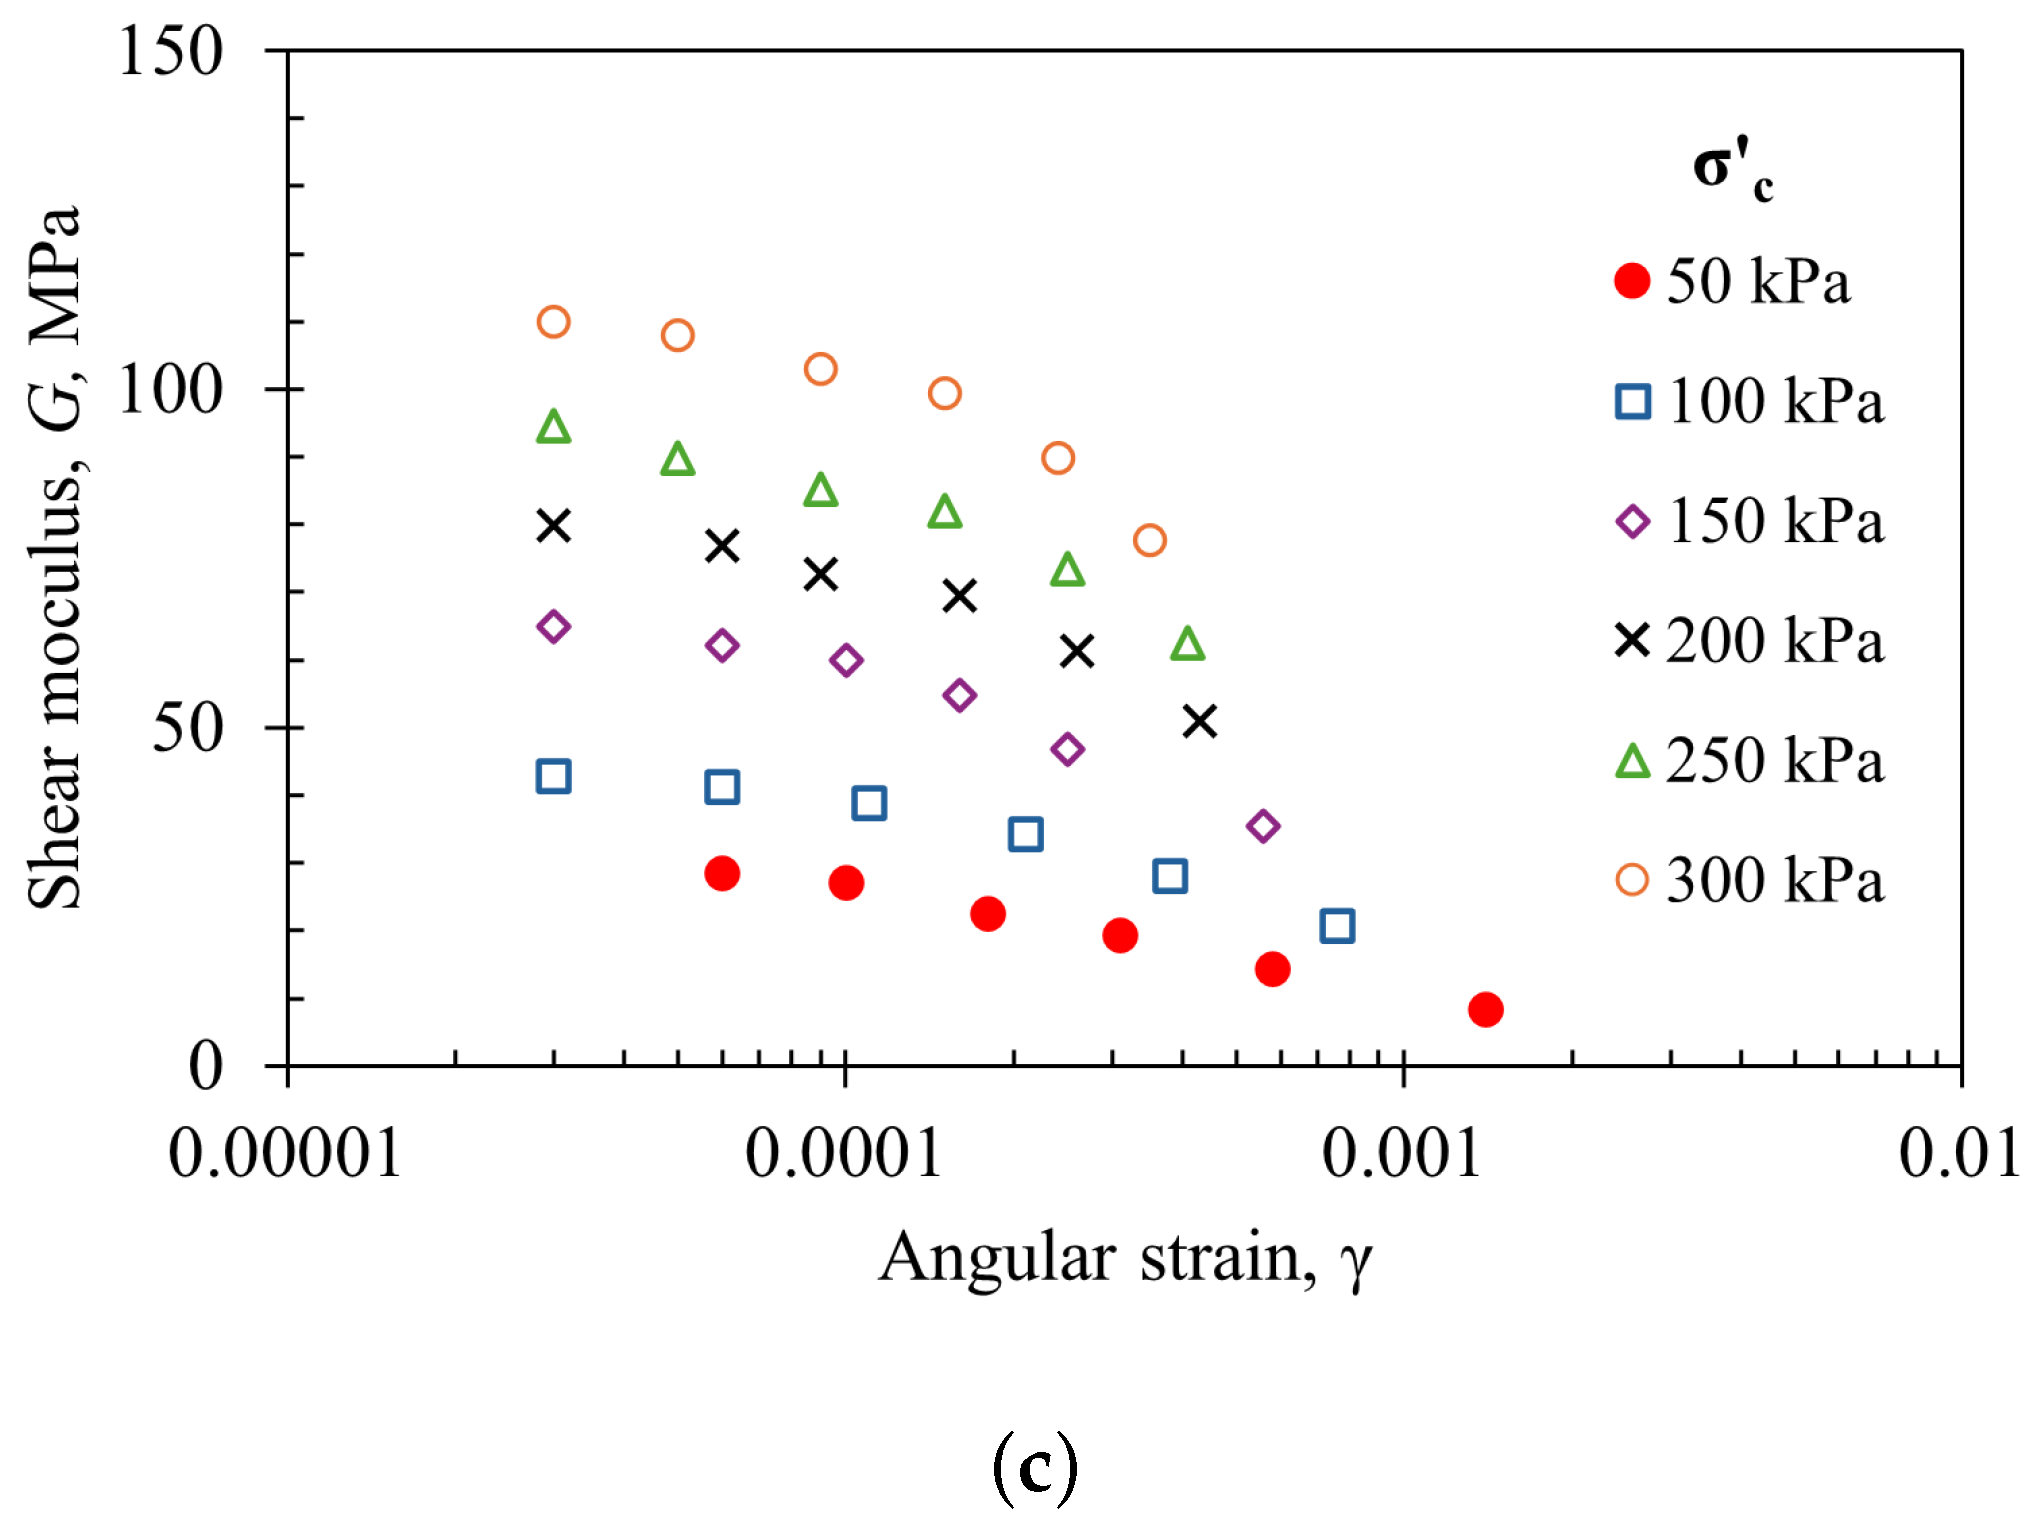
3.1. Shear Modulus Degradation

Table 4 presents the results of the RC tests, which include the resonant frequency ( F r ), shear wave velocity ( V S = G / ρ ), shear modulus (G), and angular strain ( γ ). Figure 3 displays the relationship between shear modulus (G) and γ based on data obtained from RC tests performed on three different types of tailings under σ c .
As expected from the dynamic response observed in various natural soils [2,26], the Riotinto tailings exhibited a notable dependence of G on γ , with values ranging from 10 5 to 10 3 . The results highlighted a significant influence of σ c on G across all three types of tailings. Although these materials are non-plastic, the fines content (FC) impacts G significantly. Specifically, for the same γ and σ c , the shear modulus values for high-density tailings (HDS) were found to be double those of coarse sandy tailings (CSS). While both HDS and CSS originate from the same source, their shear moduli differ due to variations in FC. The experimental results revealed that HDS tailings exhibited the highest G values, while CSS tailings exhibited the lowest. On the other hand, Figure 3 suggests that HDS tailings experience a more significant degradation. These findings can also be attributed to the mineral composition of the tailings studied, as HDS is comprised of 92% quartz, a mineral known for its low compressibility and high elastic modulus [27].

3.2. Proposed Function

Based on the results from the resonance comparison (RC), a function can be established to describe how the shear modulus (G) varies with the parameter γ under different conditions of effective confining stress ( σ c ). This function incorporates essential elements, including the equation proposed by Hardin and Black [12], which calculates the shear wave velocity ( V S ) based on the system’s resonance frequency ( F r ). The value of F r is controlled by the polar moment of inertia of the excitation mechanism ( I 0 ) with respect to the symmetry axis, the polar moment of inertia of the sample (I), and the height of the specimen (H). The relationship is given by
2 π F r H V S tan 2 π F r H V S = I I 0
Equation (2) can be solved using various methods, including numerical iterations [18], as illustrated in the graphical representation in Figure 4.
From the wave propagation theory, the stiffness of the soil can be estimated by correlating G with V S and the mass density ( ρ ) through
V S = G ρ
Estimating the maximum shear modulus ( G 0 ) in geotechnical engineering presents significant challenges due to the non-linear stress–strain behaviour of geomaterials. Laboratory methods like RC testing are often complemented with bender element (BE) tests [28]. This combination provides experimental insights into soil stiffness at small-strain levels but requires robust mathematical frameworks to interpret the results accurately. In this research, BE tests were unfortunately not performed. Therefore, the mathematical approach proposed by Hardin and Drnevich [13] is utilised to estimate G 0 as follows:
1 G = 1 G 0 1 + γ γ r e f
where γ r e f is the elastic threshold of the geomaterial. Figure 5 presents the results of Equation (4). Results in Figure 5 show a series of linear tendencies, which shift up with the increment in σ c . Following these findings, the intersections of the representative linear regression lines correspond to the different values of the parameter 1 / G 0 in the Hardin and Drnevich model [13]. In contrast, the slopes of these lines correspond to the inverse of the maximum shear stress (i.e., 1 / τ m a x ). This relationship enables the determination of the parameter 1 / γ r e f , characterising the strain at which the modulus decreases by about half of G 0 . The computed values of these parameters, along with the determination coefficient ( R 2 ) values, can be seen in Table 5.
Based on the curve fitting results in Figure 5, a power stress-dependency equation for G 0 has been derived. This equation effectively represents the effect of skeletal shear stiffness on the applied effective confining stresses due to the nature of inter-particle contacts [21]. Figure 6 illustrates the relationship between G 0 and σ c . The curve fitting in this figure indicates that the contacts between the particles in CSS and CL behave similarly to granular soil, while the contacts in HDS are more representative of fine soils. This conclusion can be validated by comparing these results with the database compiled by Cha et al. [29]. Additionally, it is noteworthy that CL tailings exhibit the highest stiffness compared to the other types of tailings.
Based on the values of the correlation coefficients R 2 , presented in Table 5, it can be concluded that the variation trend of 1 / γ r e f also changes with s i g m a c , following a potential type trend, as indicated in Figure 7.
By using power equations indicated in Figure 5 and Figure 7, the G degradation curve can be described by the following function:
G = A ( σ c ) B 1 + C γ ( σ c ) D
In this context, A, B, C, and D represent the fitting coefficients, which can be found in Table 6.
Equation (5) corresponds to the modified hyperbolic function proposed to evaluate the G degradation curve, as a function of γ , for various σ c . This formulation aims to provide a more accurate representation of the non-linear stress–strain behaviour of geomaterials, incorporating key factors influencing soil stiffness degradation. To validate the accuracy and representativeness of Equation (5), Figure 8 compares the computed results with the experimental data. Such a comparison demonstrates a strong agreement between the predicted and measured results, capturing the characteristic trend of G degradation with increasing γ . The model effectively describes the strain-dependent softening behaviour observed in the laboratory tests, reinforcing its applicability for geotechnical analyses.

4. Conclusions and Outlook

This research investigated the dynamic behaviour of three materials derived from the TSFs of the Riotinto in Huelva (Spain): “Cerro Salomón” sands (CSS), high-density sludge (HDS), and copper “Lamas” (CL). These materials have different physical properties and chemical components. The study comprised an experimental plan based on several resonant-column tests. The main conclusions drawn from the analysis are as follows:
  • The CSS and HDS geomaterials are predominantly granular, with a high content of non-plastic fines, while the CL material is classified as low-plasticity clay based on consistency limits and plasticity chart positioning. The presence of heavy minerals resulted in unusually high specific gravities for all three materials, deviating from standard reference values.
  • Despite the non-plastic nature of the fines in CSS (32%) and HDS (48%), their content significantly influenced the shear modulus (G) as a function of confining stress ( σ c ). Under the same conditions of σ c and angular strain ( γ ), the G values for HDS were nearly twice those of CSS, despite both being granular materials originating from the same mining process.
  • The dynamic stiffness modulus (G) exhibited a substantial reduction with decreasing confining stress ( σ c ), reinforcing its dependency on stress conditions. The variation of G as a function of angular strain ( γ ) for different σ c followed a clear trend, which follows a hyperbolic function. Moreover, the maximum shear modulus ( G 0 ) varied with σ c following a power–law relationship, with high correlation coefficients ( R 2 ).
  • The inverse of G (i.e., 1 / G ) demonstrated a linear variation with angular strain ( γ ) for different effective confining stresses ( σ c ), also exhibiting correlation coefficients ( R 2 ) close to unity. However, the inverse of the reference strain parameter ( γ ref ) from the Hardin and Drnevich model varied with effective σ c according to a power–law trend, with correlation coefficients ( R 2 ) between 0.84 and 0.99.
  • A new simplified mathematical model is proposed to evaluate G based solely on angular strain ( γ ), effective confining stress ( σ c ), and four empirical constants. This model allows for the determination of G with a low amount of tests by using three torsional excitations and various σ c , requiring only nine tests.
  • To enhance practicality in numerical simulations and simplify the application of complex formulations, this research introduces a generalisation of the hyperbolic model. This novel formulation depends on only two factors and four empirical constants, making it adaptable for a wide range of soil types with minimal testing requirements.
These findings provide valuable insights into the mechanical behaviour of mining tailings and offer a practical framework for evaluating soil stiffness in applications concerning the dynamic response and stability of TSFs, while significantly reducing testing demands without compromising accuracy. By addressing the challenges associated with modelling the non-linear dynamic behaviour of unconventional geomaterials, this study provides engineers with a simplified yet reliable tool for predicting shear stiffness degradation. This directly contributes to solving real-world engineering problems, such as seismic risk assessment, TSF stability design, and the development of predictive models for site-specific conditions, ultimately enhancing the resilience and safety of geotechnical systems in challenging environments.

Author Contributions

Conceptualisation, H.P.; methodology, H.P.; software, H.P. and R.Á.G.-A.; validation, R.Á.G.-A. and F.M.-G.; formal analysis, H.P., R.Á.G.-A., and F.M.-G.; investigation, H.P.; resources, H.P.; data curation, H.P.; writing—original draft preparation, H.P.; writing—review and editing, R.Á.G.-A. and F.M.-G.; visualisation, R.Á.G.-A. and F.M.-G.; supervision, R.Á.G.-A. and F.M.-G.; project administration, H.P.; funding acquisition, H.P. All authors have read and agreed to the published version of the manuscript.

Funding

This publication is part of the project PID2022-139202OB-I00, Neural networks and optimization techniques for the safe design and maintenance of transport infrastructure: volcanic rock geotechnics and Slope Stability (IA-Pyroslope), funded by the State Research Agency of the Ministry of Science, Innovation and Universities and the European Regional Development Fund, MCIN/AEI/10.13039/501100011033/ERDF, EU.

Data Availability Statement

Data generated or analysed during this study are available from the corresponding author upon reasonable request.

Acknowledgments

To the José Entrecanales Ibarra Foundation for donating the equipment necessary to carry out this research, among which the resonant column stands out. To EPTISA Engineering Services for sponsoring the research through an agreement signed with the Agustín de Betancourt Foundation.

Conflicts of Interest

The authors declare no conflicts of interest.

References

  1. Vucetic, M. Cyclic Threshold angular strains in Soils. J. Geotech. Eng. 1994, 120, 2208–2228. [Google Scholar] [CrossRef]
  2. Oztoprak, S.; Bolton, M.D. Stiffness of sands through a laboratory test database. Géotechnique 2013, 63, 54–70. [Google Scholar] [CrossRef]
  3. del Pilar Ortiz-Pulido, M.; Gaitán-Serrano, J.F.; Camacho-Tauta, J. Modelo unificado de curvas de degradación del módulo cortante en arenas del río Guayuriba. DYNA 2014, 81, 77–84. [Google Scholar]
  4. Ishihara, K. Soil Behaviour in Earthquake Geotechnics, 1st ed.; Clarendon Press: Oxford, UK, 1996. [Google Scholar]
  5. Kramer, S.L. Geotechnical Earthquake Engineering, 1st ed.; Pretince Hall: Upper Saddle River, NJ, USA, 1996. [Google Scholar]
  6. Arnold, C.; Macedo, J. A novel experimental database on the cyclic response of mine tailings. Earthq. Spectra 2024, 40, 828–846. [Google Scholar] [CrossRef]
  7. Santamarina, J.C.; Torres-Cruz, L.A.; Bachus, R.C. Why coal ash and tailings dam disasters occur. Science 2019, 364, 526–528. [Google Scholar] [CrossRef]
  8. Ubilla, J.; Sáez, E. Numerical Analysis of Radiation Damping in Tailings Dams. J. Earthq. Eng. 2024, 29, 589–609. [Google Scholar] [CrossRef]
  9. ASTM D4015; Standard Test Methods for Modulus and Damping of Soils by Resonant-Column. ASTM International: West Conshohocken, PA, USA, 2021.
  10. Davidenkov, N.N. On energy dissipation upon vibrations. Zh. Tekh. Fiz. 1938, 8, 483–499. [Google Scholar]
  11. Kondner, R.L. Hyperbolic Stress-Strain Response: Cohesive Soils. J. Soil Mech. Found. Div. 1963, 89, 115–143. [Google Scholar] [CrossRef]
  12. Hardin, B.O.; Black, W.L. Vibration Modulus of Normally Consolidated Clay. Soil Mech. Found. Div. 1968, 94, 353–370. [Google Scholar] [CrossRef]
  13. Hardin, B.O.; Drnevich, V.P. Shear modulus and damping in soils: Design equations and curves. Soil Mech. Found. Div. 1972, 98, 667–692. [Google Scholar] [CrossRef]
  14. Iwasaki, T.; Tatsuoka, F.; Takagi, Y. Shear Moduli of Sands under Cyclic Torsional Shear Loading. Soil Found. 1978, 18, 39–56. [Google Scholar] [CrossRef]
  15. Kokusho, T. Cyclic Triaxial Test of Dynamic Soil Properties for Wide Strain Range. Soil Found. 1980, 20, 45–60. [Google Scholar] [CrossRef]
  16. Ishibashi, I.; Zhang, X. Unified dynamic shear moduli and damping patios of sand and clay. Soil Found. 1993, 33, 182–191. [Google Scholar] [CrossRef]
  17. Wichtmann, T.; Triantafyllidis, T. Influence of the Grain-Size Distribution Curve of Quartz Sand on the Small Strain Shear Modulus Gmax. J. Geotech. Geoenviron. Eng. 2009, 135, 14041418. [Google Scholar] [CrossRef]
  18. Patiño, H.; Martínez, E.; Galindo, R. Dynamic Behavior of a Granular Medium Subjected to Resonant Column Tests: Application to Ottawa Sand. Geotech. Test. J. 2020, 43, 14041418. [Google Scholar] [CrossRef]
  19. Wichtmann, T.; Triantafyllidis, T. Effect of Uniformity Coefficient on G/Gmax and Damping Ratio of Uniform to Well-Graded Quartz Sands. J. Geotech. Geoenviron. Eng. 2013, 139, 59–72. [Google Scholar] [CrossRef]
  20. Payan, M.; Khoshghalb, A.; Senetakis, K.; Khalili, N. Effect of particle shape and validity of Gmax models for sand: A critical review and a new expression. Comput. Geotech. 2016, 72, 28–41. [Google Scholar] [CrossRef]
  21. Molina-Gómez, F.; Viana da Fonseca, A.; Ferreira, C.; Camacho-Tauta, J. Dynamic properties of two historically liquefiable sands in the Lisbon area. Soil Dyn. Earthq. Eng. 2020, 132, 106101. [Google Scholar] [CrossRef]
  22. Sarkar, D.; Goudarzy, M.; Wichtmann, T. Influence of particle size on the small-strain stiffness in granular soils: Experimental observations and micromechanical interpretation. Géotechnique 2024, 74, 920–934. [Google Scholar] [CrossRef]
  23. Patiño, H.; Molina-Gómez, F.; Galindo, R.; Viana da Fonseca, A. Stiffness Degradation of Non-Plastic Copper Ore Tailings. Géotechnique Lett. 2025, in press. [Google Scholar] [CrossRef]
  24. Palomero, F.G. Rio Tinto deposits—Geology and geological models for their exploration and ore-reserve evaluation. In Sulphide Deposits—Their Origin and Processing; Gray, P.M.J., Bowyer, G.J., Castle, J.F., Vaughan, D.J., Warner, N.A., Eds.; Springer: Dordrecht, Germany, 1990. [Google Scholar]
  25. Patiño, H.; Molina-Gómez, F.; Galindo, R.; Viana da Fonseca, A. Integrated evaluation of stiffness degradation by combining Resonant-Column, Cyclic Triaxial and Cyclic Simple Shear Tests: Application to Riotinto mine tailings. Geomech. Energy Environ. 2025, 41, 100652. [Google Scholar] [CrossRef]
  26. Ciancimino, A.; Cosentini, R.M.; Foti, S.; Lanzo, G.; Pagliaroli, A.; Pallara, O. The PoliTO–UniRoma1 database of cyclic and dynamic laboratory tests: Assessment of empirical predictive models. Bull. Earthq. Eng. 2023, 21, 2569–2601. [Google Scholar] [CrossRef]
  27. Li, X.S.; Yang, W.L.; Shen, C.K.; Wang, W.C. Energy-Injecting Virtual Mass Resonant Column System. J. Geotech. Geoenviron. Eng. 1998, 124, 428–438. [Google Scholar] [CrossRef]
  28. Camacho-Tauta, J.F.; Reyes-Ortiz, O.J.; Jiménez Álvarez, J.D. Comparison between resonant-column and bender element tests on three types of soils. DYNA 2013, 80, 163–172. [Google Scholar]
  29. Cha, M.; Santamarina, J.C.; Kim, H.-S.; Cho, G.-C. Small-Strain Stiffness, Shear-Wave Velocity, and Soil Compressibility. J. Geotech. Geoenviron. Eng. 2014, 140, 06014011. [Google Scholar] [CrossRef]
Figure 1. Riotinto TSF location [25].
Geosciences 15 00176 g001
Figure 2. Resonant-column apparatus of UPM.
Geosciences 15 00176 g002
Figure 3. Shear modulus variation for various angular strains and effective confining stresses: (a) HDS tailings; (b) CSS tailings; (c) CL tailings.
Geosciences 15 00176 g003aGeosciences 15 00176 g003b
Figure 4. Representation of the implicit function.
Geosciences 15 00176 g004
Figure 5. Variation trends of the inverse shear modulus ( 1 / G ) for various angular strains and effective confining stresses: (a) HDS tailings; (b) CSS tailings; (c) CL tailings.
Geosciences 15 00176 g005
Figure 6. Variation of the maximum shear modulus for various angular strains and effective confining stresses: (a) HDS tailings; (b) CSS tailings; (c) CL tailings.
Geosciences 15 00176 g006
Figure 7. Variation of the parameter 1 / γ r e f for various angular strains and effective confining stresses: (a) HDS tailings; (b) CSS tailings; (c) CL tailings.
Geosciences 15 00176 g007
Figure 8. Comparison between the experimental results and the values obtained using the modified function (model fitting in continuous lines): (a) HDS tailings; (b) CSS tailings; (c) CL tailings.
Geosciences 15 00176 g008
Table 1. Properties of tested tailings.
Material ω n (%)FC (%)LL (%)PL (%)PI (%) ρ s ( g/cm 3 ) ρ d ( g/cm 3 )
CSS8.132.7---3.021.60
HDS14.348.5---2.991.65
CL38.585.926.919.972.831.65
Table 2. Mineral content.
MineralCSSHDSCL
Quartz (%)928223
Phyllosilicates (%)8667
Metallic minerals (%)0120
Table 3. Chemical components from XRD tests.
ConstituentsHDS (%)CSS (%)CL (%)
Al 2 O 3 1.035.946.49
CaO0.040.470.25
Fe 2 O 3 13.0610.4115.78
K 2 O0.121.740.49
MgO0.010.292.97
Na 2 O0.030.150.11
P 2 O 5 0.040.070.053
SO 3 19.484.710.04
SiO 2 53.4366.4213.45
TiO 2 0.090.2951.97
Loss of ignition12.679.517.80
Table 4. Results of the 108 RC tests.
ConditionsCSSHDSCL
σ c (kPa) T e (V) Fr (Hz) V S (m/s) G (MPa) γ Fr (Hz) V S (m/s) G (MPa) γ Fr (Hz) V S (m/s) G (MPa) γ
500.0255011422.40.000048719466.60.000045511728.50.00006
500.055011422.40.000088518963.20.0000653114270.00010
500.14710719.80.000178118057.50.000094910422.40.00018
500.2439916.90.000337817352.70.00014459719.30.00031
500.4388713.20.000656915542.20.00023398314.40.00058
500.827626.70.001505712728.30.0004830638.30.00140
1000.0256514838.10.000039120675.30.000036714442.80.00003
1000.056114134.30.000069120574.70.000056614141.20.00006
1000.15913531.50.0001188199700.000096413738.90.00011
1000.25312125.40.000248418862.80.000146012834.20.00021
1000.44811020.90.000487717453.90.0002254116280.00038
1000.8419515.50.000966815241.20.000394710020.70.00076
1500.0257216647.80.0000410022791.80.0000383177650.00003
1500.057016145.10.000089822287.90.000058117362.10.00006
1500.16715541.90.000139721985.60.0000880170600.00010
1500.26414837.80.000229221078.20.000137616354.70.00016
1500.46013832.80.000388619567.80.000217015046.70.00025
1500.852120250.000647817655.40.000356113135.50.00056
2000.02577178550.000041082471090.000039219779.90.00003
2000.057717855.10.000081062431050.000059019376.80.00006
2000.17517352.10.000131052401020.000088818872.70.00009
2000.27216647.80.00022100230940.000138618469.60.00016
2000.46715642.10.000379421582.70.000208117361.40.00026
2000.86214335.70.000628619768.90.0003374157510.00043
2500.0258419666.40.000041132591200.0000310021494.70.00003
2500.058219163.50.000071122581190.000059720989.90.00005
2500.18118961.80.000131102531140.000089520385.20.00009
2500.27818257.50.000221062431060.000129319982.10.00015
2500.475173520.0003610023094.10.000198818973.50.00025
2500.86916044.60.000589221279.90.000318117462.50.00041
3000.0258820673.50.000041182721320.000031082311100.00003
3000.059020975.50.000071172681280.000051072291080.00005
3000.188204720.000121152651250.000071042231030.00009
3000.28620069.60.000211122561170.0001110221999.40.00015
3000.48219163.20.000341062441060.000189720989.90.00024
3000.87617754.40.0005098226910.000289019477.70.00035
Table 5. Results of the mathematical approach proposed by Hardin and Drnevich [13] for the investigated tailings.
σ c (MPa) 1 / τ max ( MPa 1 ) 1 / γ ref ( - ) G 0 (MPa) R 2
CCS
0.0573.702229631.150.98
0.1040.0081465.536.630.99
0.1531.223159351.020.99
0.2017.5861028.458.480.99
0.2513.343920.268.970.99
0.3010.562838.379.370.95
HDS
0.0546.8333602.576.920.99
0.1031.9452730.385.470.99
0.1522.9492294.91000.99
0.2018.2852151.2117.650.99
0.2515.4112001.4129.870.99
0.3013.2611867.7140.850.99
CL
0.0563.2351969.931.150.99
0.1034.1771532.644.840.99
0.1524.7651696.268.490.99
0.2017.4711468.284.030.99
0.2513.699133097.090.99
0.3011.161282.8114.940.98
Table 6. Fitting coefficients of Equation (5).
TailingsABCD
CSS159.790.61496.39−0.48
HDS206.30.351194.50−0.36
CL274.740.741006.60−0.22
Disclaimer/Publisher’s Note: The statements, opinions and data contained in all publications are solely those of the individual author(s) and contributor(s) and not of MDPI and/or the editor(s). MDPI and/or the editor(s) disclaim responsibility for any injury to people or property resulting from any ideas, methods, instructions or products referred to in the content.

