Article

Closed-System Magma Degassing and Disproportionation of SO2 Revealed by Changes in the Concentration and δ34S Value of H2S(g) in the Solfatara Fluids (Campi Flegrei, Italy)

1
STEAM Srl, I-56121 Pisa, Italy
2
CNR, Istituto di Geoscienze e Georisorse, I-56124 Pisa, Italy
3
INGV—Istituto Nazionale di Geofisica e Vulcanologia, Osservatorio Vesuviano, I-80124 Napoli, Italy
4
INGV—Istituto Nazionale di Geofisica e Vulcanologia, Sezione di Pisa, I-56125 Pisa, Italy
*
Author to whom correspondence should be addressed.
Geosciences 2025, 15(5), 162; https://doi.org/10.3390/geosciences15050162
Submission received: 27 February 2025 / Revised: 24 April 2025 / Accepted: 24 April 2025 / Published: 1 May 2025
(This article belongs to the Special Issue Geochemistry in the Development of Geothermal Resources)

Abstract

:
The use of a conceptual model of reference and modelling of relevant processes is mandatory to correctly interpret chemical and isotopic data. Adopting these basic guidelines, we have interpretated the unprecedented increase in the H2S(g) concentration and the concurrent unexpected decrease in the δ34S value of H2S(g) recorded since 2018 in the fumarolic effluents of the Bocca Grande fumarolic vent at Solfatara, Campi Flegrei caldera, in the framework of our conceptual model of the Solfatara magmatic–hydrothermal system. Assuming that the magma chamber situated at depths ≥ 8 km was filled at the end of the 1982–1984 bradyseismic crisis and no refilling episodes took place afterwards, as suggested by gas geochemistry, the concentration and the δ34S value of H2S(g) of the Bocca Grande fumarolic effluents are controlled by closed-system degassing of the melt at depths ≥ 8 km and disproportionation of SO2 in the deep hydrothermal reservoir (6.5–7.5 km depth) hosted in carbonate rocks where H2S equilibrates. These processes have been active during the last 40 years, but 41.1% (±6.4%) of the sulfur initially stored in the melt (2200 mg/kg) was lost in the 4-year period of April 2018–April 2022. This marked loss of S from the melt in 2018–2022 might be due to the high solubility of sulfur in the melt, which caused its preferential separation during the late degassing stages. These findings are of utmost importance for the surveillance of the Solfatara magmatic–hydrothermal system during the ongoing bradyseismic crisis.

1. Introduction

Sulfur isotope fractionation during magmatic degassing chiefly depends on redox conditions of both the melt and the gases separated from it, e.g., [1,2,3,4,5,6], due to the remarkable difference in the oxidation state of the main S species in silicate melts, SO42−(m) and S2−(m), and magmatic gases, SO2(g) and H2S(g). Magmatic degassing under oxidizing conditions is controlled by SO42−(m) in the melt and SO2(g) in the gas phase, whereas magmatic degassing under reducing conditions is governed by S2−(m) in the melt and H2S(g) in the gas phase, e.g., [7,8,9,10]. Consequently, the S isotopes in the melt will gradually become heavier due to equilibrium magma degassing under oxidizing conditions and become lighter owing to equilibrium magma degassing under reducing conditions [4,5,6,11,12]. In addition to magmatic degassing, another process that can cause a considerable fractionation of sulfur isotopes is SO2 disproportionation, as recognized in numerous studies of both active magmatic–hydrothermal systems and their past analogues, which are represented by different types of ore deposits [6,13]. Thus, sulfur isotopes of volcanic rocks and magmatic and hydrothermal fluids are effective indicators of the extent of both magmatic degassing and SO2 disproportionation. These processes can be modeled considering a conceptual model of reference and the temperature and pressure in the environments where they occur. This approach was used in this work to correctly interpret the sulfur isotope data of Solfatara fumaroles at Campi Flegrei.
Since 1950, the Campi Flegrei caldera has been affected by four positive bradyseismic episodes, the last of which began in 2005 and is still occurring. As reported in several studies, as that of Giudicepietro et al. [14] and references therein, ground movements are accompanied by both shallow seismic activity and increasing emission of fumarolic fluids from the Solfatara-Pisciarelli, the most important manifestations in the Campi Flegrei caldera. In particular, an unprecedented increase in the H2S(g) concentration and the concurrent unexpected decrease in the δ34S value of H2S(g) have been recorded since 2018 in the fumarolic effluents of the Bocca Grande fumarolic vent at Solfatara, in the Campi Flegrei caldera. Incidentally, we recall that the δ34S value is defined by the following relation:
δ 34 S = S 34 S 32 X S 34 S 32 S t d S 34 S 32 S t d · 1000  
in which subscripts X and Std identify the sample and the reference standard, respectively. The reference standard of sulfur isotopes is the Vienna Canyon Diablo Troilite (VCDT). The increase in the H2S(g) concentration and the concurrent decrease in the δ34S value of H2S(g) recorded since 2018 in the Bocca Grande fumarolic effluents have been attributed to decompression-driven degassing of mafic magma at ≥6 km depth, along with some extent of sulfur remobilization from hydrothermal minerals by Caliro et al. [15].
However, taking as interpretation framework the conceptual model of the Solfatara magmatic–hydrothermal system proposed by Marini et al. [16], it is reasonable to attribute these changes to closed-system degassing of the magma positioned at depths ≥ 8 km and disproportionation of SO2 in the deep hydrothermal reservoir (6.5–7.5 km depth) hosted in carbonate rocks. In this paper, we intend to explore this alternative interpretation.

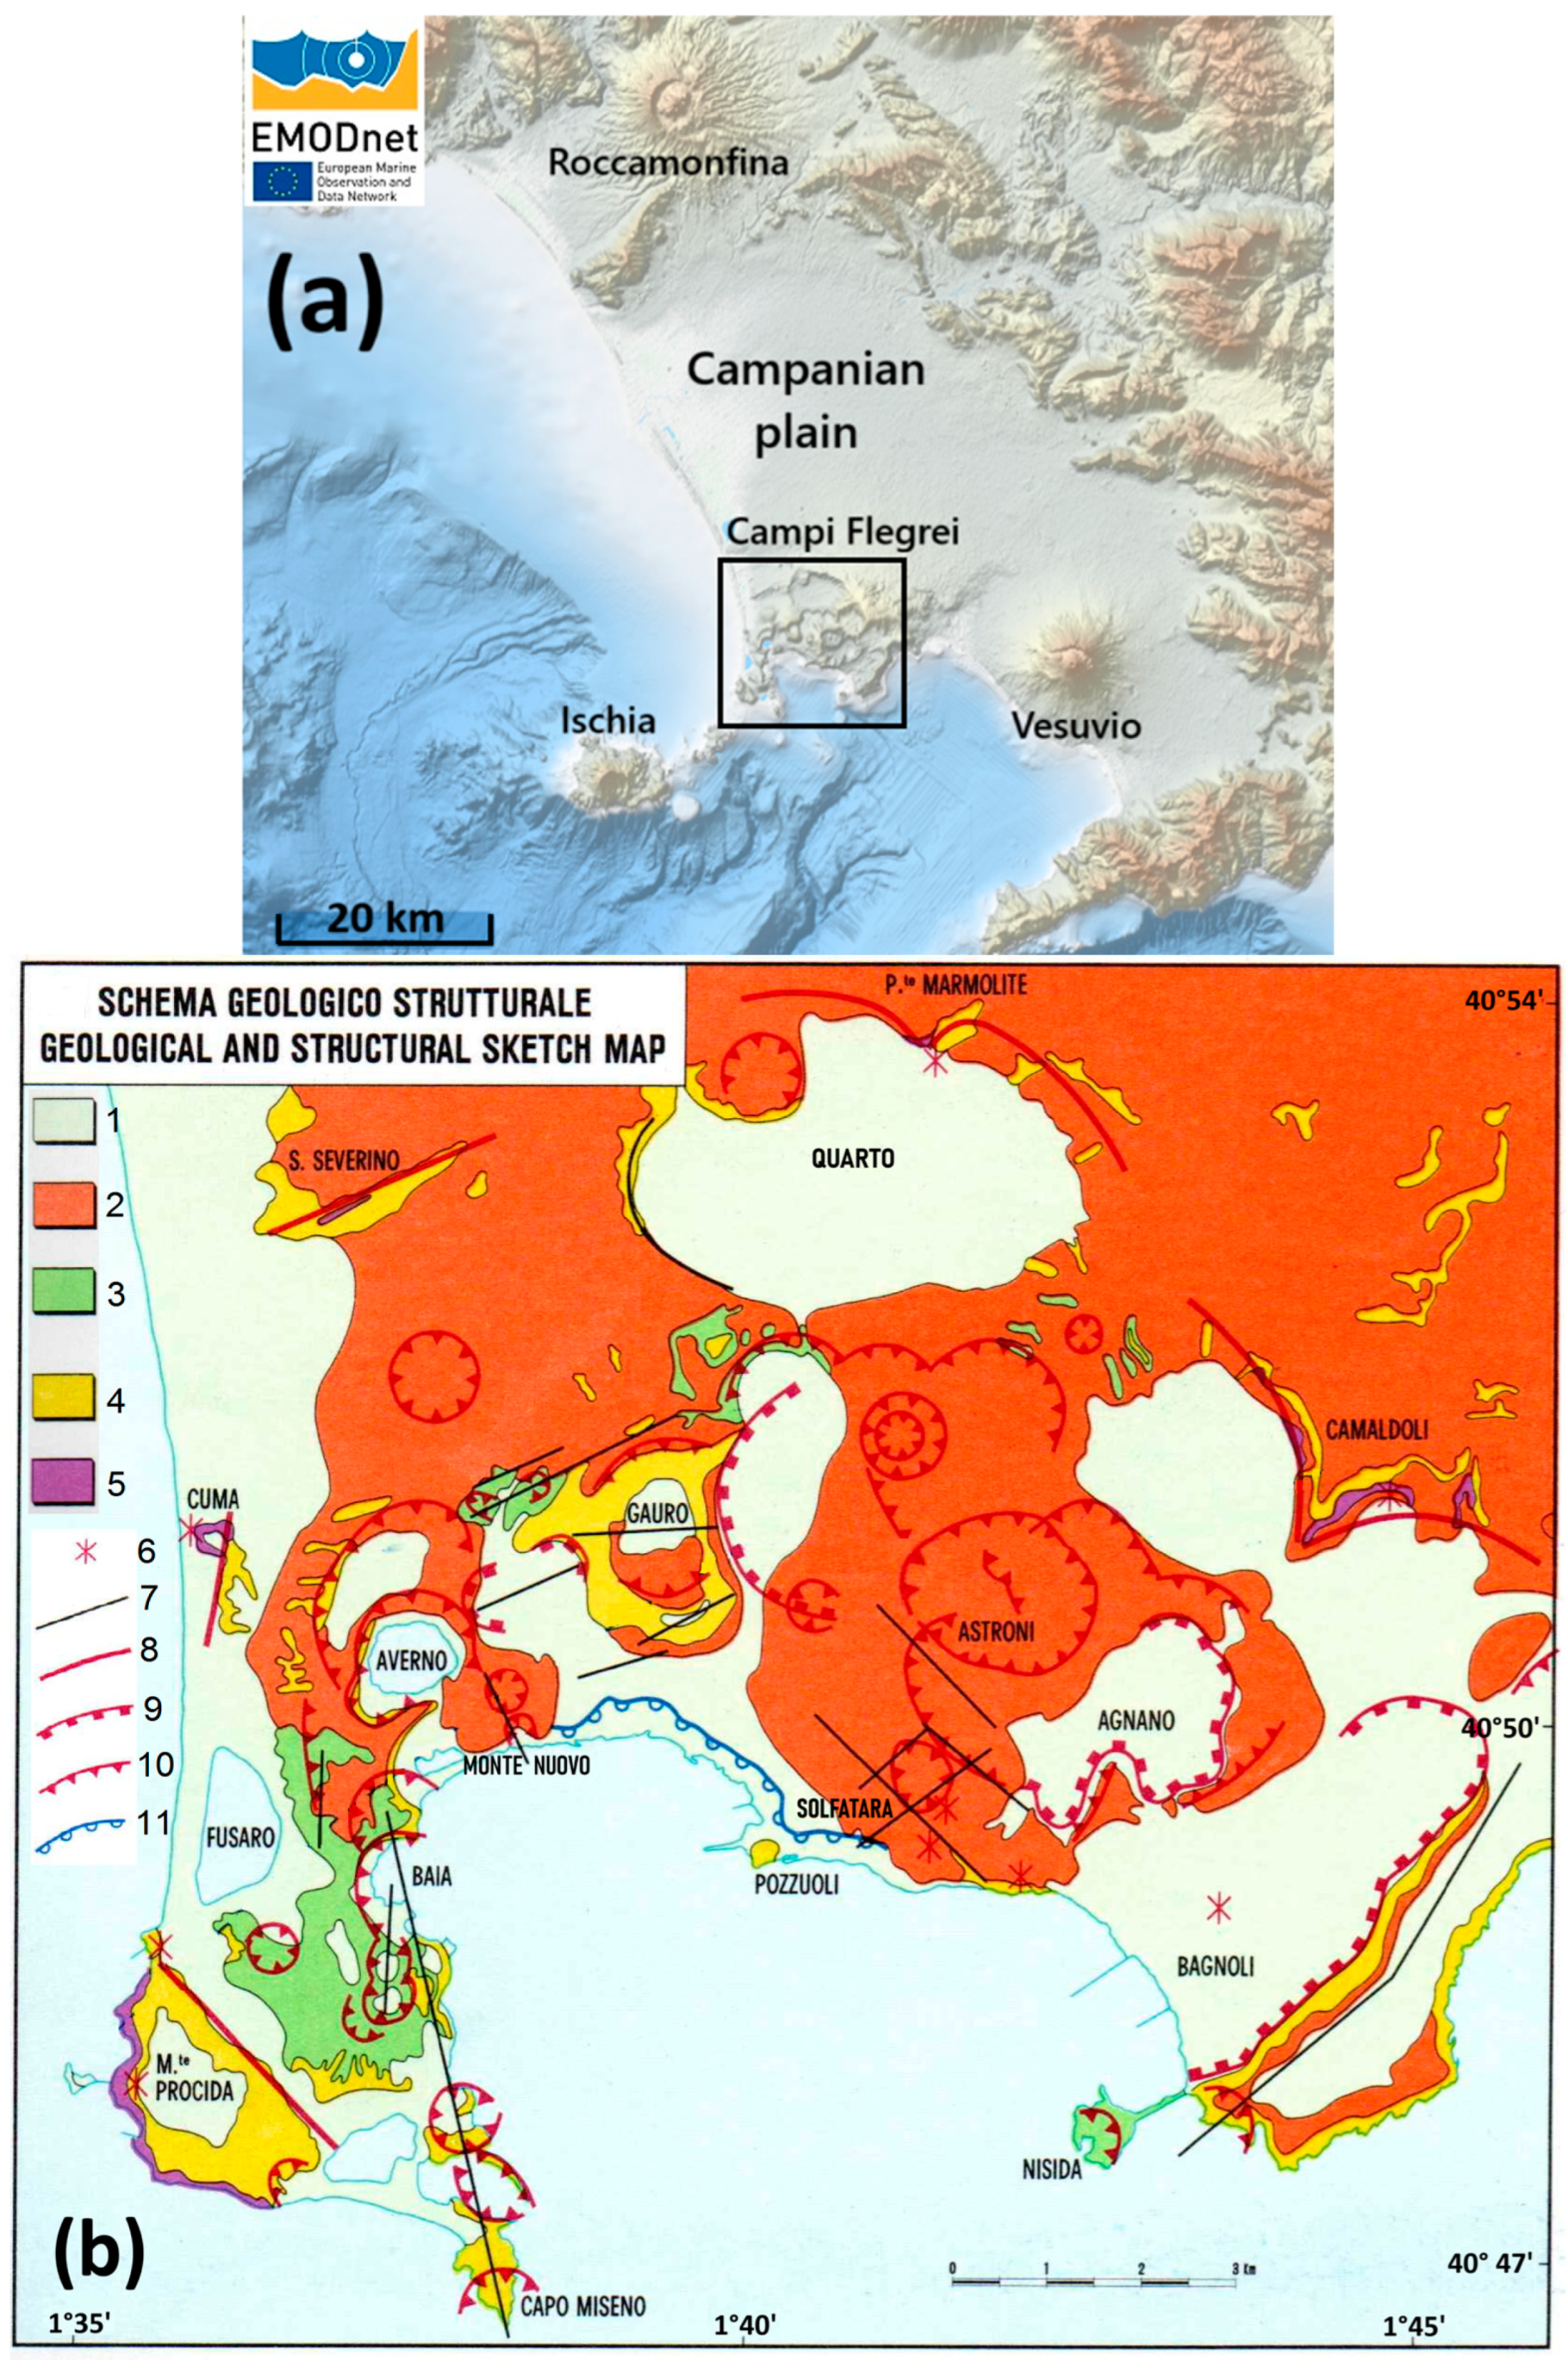
2. Geological Background

The present knowledge of the Campi Flegrei geology is mainly founded on the surface studies by Rosi et al. [17], the subsurface information provided by the deep geothermal wells drilled by AGIP-ENEL in the 1970s–1980s [18], and the synthesis of geological information with inland and offshore gravimetric and aeromagnetic data analyses [19] performed by Barberi et al. [20]. The numerous scientific studies performed more recently have ameliorated some aspects of the geological knowledge of Campi Flegrei, providing further details, but some controversial points still remain (see below). The Campi Flegrei is situated inside the Campanian Plain (Figure 1a), a Neogene graben filled by clastic and volcanoclastic sediments and volcanic rocks overlying the Mesozoic carbonate basement, which is found at depths ≥ 4 km [19,21].
The Campi Flegrei evolution has been subdivided into different phases comprising several eruptive episodes, both explosive and effusive, including two large-scale, caldera-forming eruptions [17] (Figure 1b). The most significant event of this last type is known as the Campanian Ignimbrite (CI) eruption, which took place 39.85 ± 0.14 ka BP [24], and produced either a single caldera [17] or a nested caldera [20,25]. The second most important caldera-forming eruption, known as Neapolitan Yellow Tuff (NYT) eruption, occurred 14.9 ± 0.4 ka BP [26] from several vents, and it either generated a new caldera [27] or reactivated the inner CI caldera [20] or reactivated both compartments of the nested CI caldera [25]. In the interval of time between the CI and the NYT eruptions, submarine volcanic activity took place, whereas chiefly subaerial volcanic activity occurred after the NYT eruption [17]. Most volcanic products of the Campi Flegrei are pyroclastics, whereas lava flows and domes are small in volume and were chiefly erupted during the pre-caldera period [28]. Volcanic rocks range in composition from trachybasalts to peralkaline phonolitic trachytes, with intermediate compositions represented by latites, trachytes, and alkali trachytes [28,29]. Trachybasalts are very rare and are separated from latites by a compositional gap, whereas the series between latites and the trachytic varieties is complete [29]. Trachytic rocks are much more voluminous than latites [29]. Based on melt inclusion evidence, trachybasalts are the most mafic volcanic products at Campi Flegrei, and therefore, the most representative of the parental melts of mantle provenance, as pointed out by Caliro et al. [15] and references therein.
A controversial aspect concerns the Solfatara edifice. According to some authors [30,31,32], it was generated by a pyroclastic eruption that emitted a basal phreatomagmatic coarse breccia, above which there are few meters of stratified pyroclastic surges. In contrast, according to Principe [33], the basal breccia is a purely hydrothermal debris flow—without any magma involvement—and the overlying deposits come from the younger Astroni volcanic center. Irrespective of the nature of the event, it possibly occurred about 4200–4400 ka BP [34].
The last volcanic eruption in the Campi Flegrei began on September 29th, 1538, and had the duration of one week [35]. It consisted in a small phreatomagmatic event that involved a highly differentiated peralkaline phonolitic–trachytic magma and produced the ash and scoria edifice of Monte Nuovo [17]. The eruption was preceded by a fast and local uplift in that the vent site was affected by a sudden uprise of ca. 6 m in the 36 h before the eruption [35,36].
The fast and local uplift preceding the Monte Nuovo eruption is completely different from the slow vertical ground movements known as bradyseism, which have affected the whole Campi Flegrei caldera since Roman times or even before, as suggested by the presence of different orders of terraces known as Starza terraces, dating back to at least 12 ka ago [37]. The bradyseism comprises cycles of inflation or uplift and deflation or subsidence [36]. The Campi Flegrei bradyseism has had a wide echo in the scientific world since the 19th century, since it was described by Charles Lyell in his famous “Principles of Geology” [38]. The last uplift cycle started in 1950, brought about maximum uplifts of 1.77 m in 1969–1972 and further 1.79 m in 1982–1984, both followed by periods of limited subsidence, the last of which terminated in 2005, when the still ongoing uplift phase began [39,40,41] reaching 1.43 m in March 2025 [42]. In the scientific literature, there is a lack of consensus on the processes controlling the bradyseism, with some authors suggesting the magma ascent, e.g., D’Auria, L. [43] or the pressurization of the magma chamber, e.g., Barberi et al. [20], and other authors invoking the pressurization of the overlying hydrothermal system, e.g., Marini et al. [16], whereas a combination of both factors was proposed in other studies, e.g., Todesco [44].

3. Materials and Methods

Use of a conceptual model of reference and modeling of relevant processes are mandatory actions to correctly interpret the H2S(g) concentration data and the δ34S values of H2S(g) of Bocca Grande fumarolic effluents. Therefore, the adopted conceptual model and the relevant process are discussed in the next section, before presenting the calculation methods used in this work.

3.1. The Conceptual Model of the Solfatara Magmatic–Hydrothermal System

The conceptual model of the Solfatara magmatic–hydrothermal system proposed by Marini et al. [16] comprises the following units (Figure 2):
(1)
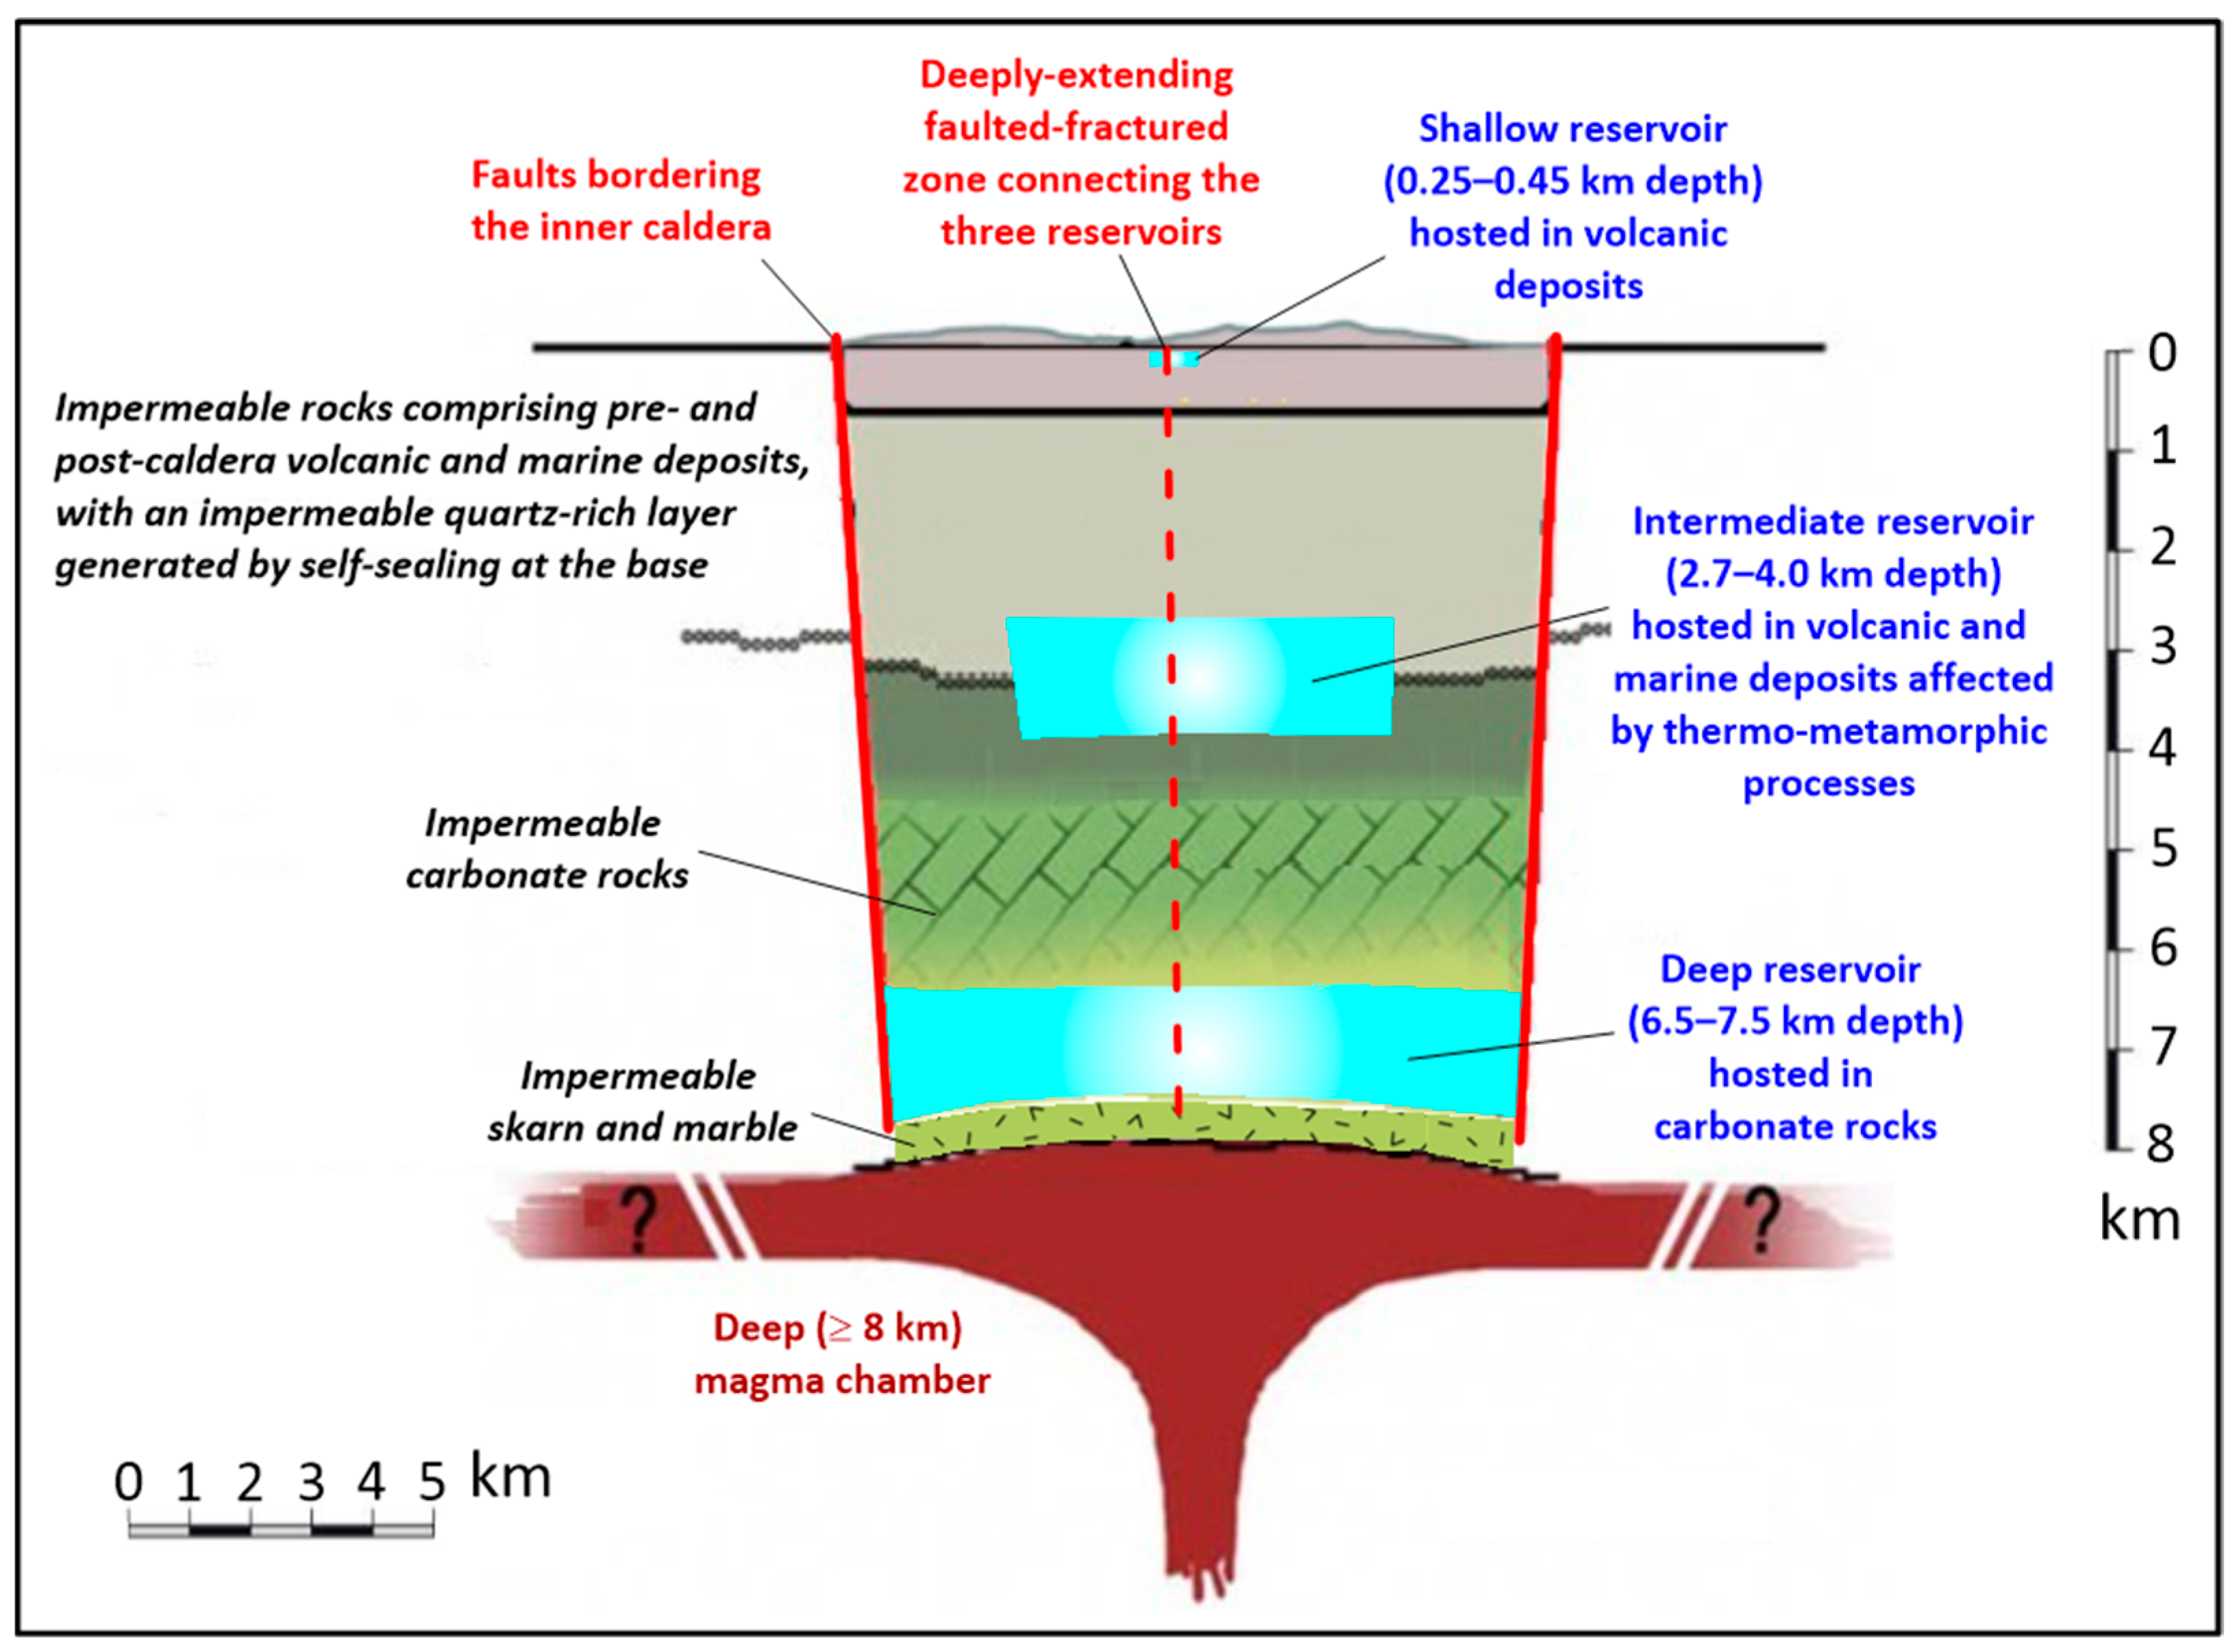
The cover of the shallow hydrothermal reservoir (0–0.25 km depth), made up of volcanic deposits influenced by advanced argillic hydrothermal alteration close to the surface and by argillic hydrothermal alteration away from it [18,45]. Its area is around 1 km2, as indicated by the Solfatara diffuse degassing structure [46,47].
(2)
The shallow hydrothermal reservoir (0.25–0.45 km depth), a steam and gas pocket hosted in volcanic deposits. It has the same area as its cover and a small volume, ~0.2 km3.
(3)
An impermeable unit (0.45–2.7 km depth), including volcanic and marine deposits, influenced by phyllitic hydrothermal alteration in the upper portion and by propylitic hydrothermal alteration in the lower part, with an impermeable quartz-rich layer generated by self-sealing at the bottom [18,45]. The area of this impermeable unit corresponds to that of the inner caldera block of Barberi et al. [20].
(4)
The intermediate hydrothermal reservoir (2.7–4.0 km depth) hosted in volcanic and marine deposits modified by thermometamorphic hydrothermal alteration. According to several studies, e.g., [21,48,49,50,51,52,53], over-pressurized supercritical fluids are stored in the intermediate hydrothermal reservoir, which, consequently, is the engine of the ground uplift and the associated shallow seismicity. Again, the area of the intermediate hydrothermal reservoir matches that of the inner caldera block of Barberi et al. [20]. Nevertheless, the intermediate hydrothermal reservoir might be constituted by distinct compartments rather than a unique aquifer, as indicated by the piecemeal collapse of the inner caldera [54] and the distribution of seismic events during the last years of the ongoing unrest (https://terremoti.ov.ingv.it/gossip/flegrei/index.html, last accessed 14 February 2025).
(5)
A thick carbonate sequence (4.0–6.5 km depth), behaving as aquiclude evidently due to nil to negligible dissolution and fracturing, similar to what was found by the deep geothermal well Nisyros-1 [55], which intersected an 830 m thick pile of impermeable carbonate rocks overlying a diorite intrusion and the associated thermometamorphic rocks.
(6)
The deep hydrothermal reservoir (6.5–7.5 km depth) hosted in fractured carbonate rocks, also affected by dissolution–precipitation processes and/or gas–solid reactions governed by acidic magmatic fluids and/or gases. Its area is the same as that of the underlying units.
(7)
An impermeable unit made up of skarn and marble (7.5–8.0 km depth) generated by thermometamorphic and metasomatic processes and behaving as an aquiclude due to their nil porosity [56].
(8)
The melt zone (depths ≥ 8 km) in which a trachybasaltic magma is presumably stored [57]. Its area corresponds to that of the whole outer caldera of Barberi et al. [20].

3.2. Temperature and Pressure Conditions

Temperature and pressure conditions are based on the gas-geoindicators of Marini et al. [58] calibrated for the decompression path of a NaCl brine in equilibrium with a vapor phase and the geochemical data of Bocca Grande fumarolic fluids, from June 1983 to December 2023 [15,57,59,60,61,62,63,64,65,66,67,68,69,70,71,72]. The obtained indications are as follows:
(i)
CO equilibrated in the shallow hydrothermal reservoir at nearly constant temperature, 217 ± 9 °C, and total fluid pressure, 24.5 ± 3.9 bar.
(ii)
CH4 attained thermochemical equilibrium in the intermediate hydrothermal reservoir at temperature and total fluid pressure increasing with time, from 235 °C and 31.1 bar in March 1984 to peak values of 609 °C and 1340 bar in September 2023.
(iii)
H2S achieved the equilibrium condition in the deep hydrothermal reservoir at temperature and total fluid pressure incrementing with time, from 618 °C and 1120 bar in July 1984 to maximum values of 1040 °C and 3280 bar in October 2019. These temperatures are in satisfactory agreement with those of 880–1020 °C obtained by extrapolating the geothermal gradient of ca. 134 °C/km measured in the deepest levels of the San Vito 1 well [58].

3.3. Processes Controlling the Concentration and the δ34S of H2S(g)

On the one hand, H2S(g) is the only S species present in relevant concentrations in the Solfatara fluids, 600–6000 μmol/mol, and is the third gaseous species, in order of decreasing importance, after H2O(g), 689,000–873,000 μmol/mol, and CO2(g), 125,000–309,000 μmol/mol [15,57,59,60,61,62,63,64,65,66,67,68,69,70,71,72]. Other detectable gaseous S species, such as COS(g), CS2(g), and CH3SH(g), have low concentrations [73], whereas SO2(g) is virtually absent in Solfatara fluids [58]. On the other hand, both H2S(g) and SO2(g) are present in significant concentrations in the fluids separated from the melt at depths ≥ 8 km, according to Caliro et al. [15]. Therefore, to explain the presence of H2S(g) and the absence of SO2(g) in fumarolic fluids, first, it must be taken into account that there is no process capable to quantitatively convert SO2(g) into H2S(g), and second, it is necessary to invoke either SO2(g) disproportionation, which is able to convert up to one-quarter of magma-sourced SO2(g) into H2S(g) (see Appendix A, Appendix A.1) or magmatic gas scrubbing [74,75], which removes all SO2(g) and some H2S(g) from magmatic gases. Between these two options, we consider SO2(g) disproportionation more likely than magmatic gas scrubbing because fumarolic fluids are superheated (with discharge temperatures of 150–165 °C at Bocca Grande and 135–154 °C at Bocca Nuova [58]), which makes the inflow of external water and/or steam condensation, necessary conditions for magmatic gas scrubbing occurrence, unlikely.
Based on the adopted conceptual model and previous considerations, we have assumed that the processes controlling the concentration of H2S(g) and its δ34S value in the Bocca Grande fumarolic gases are as follows:
(1)
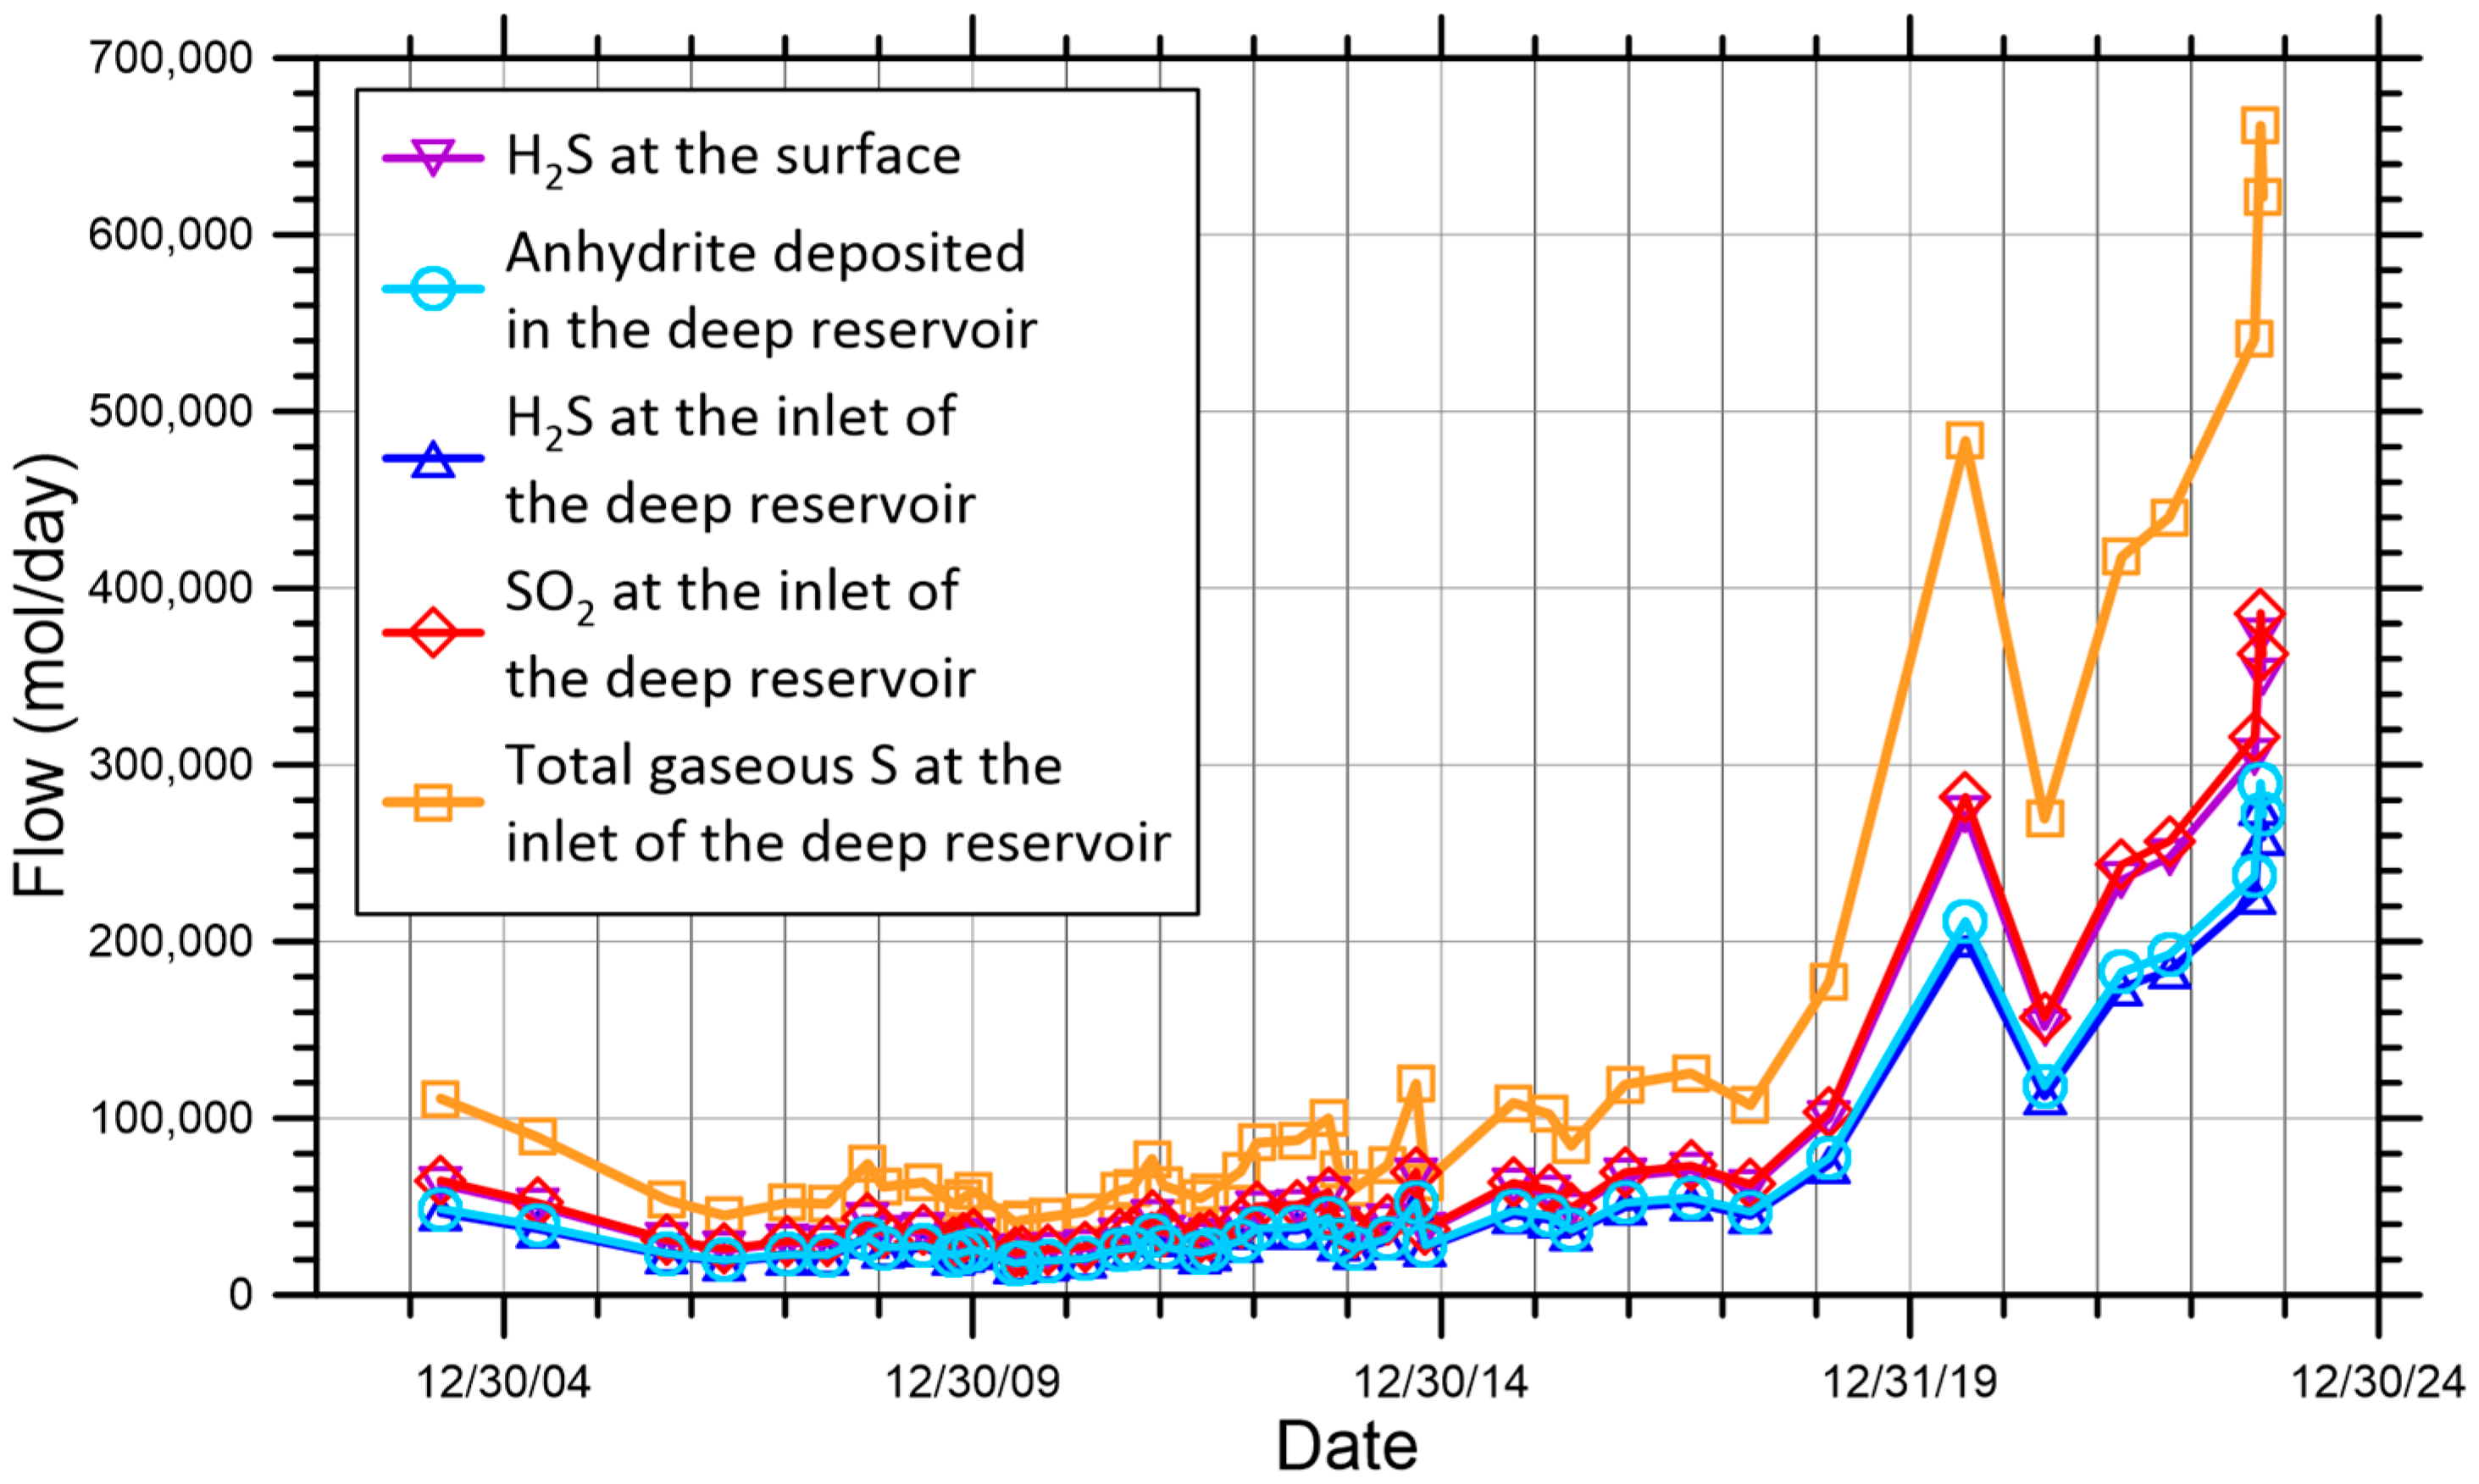
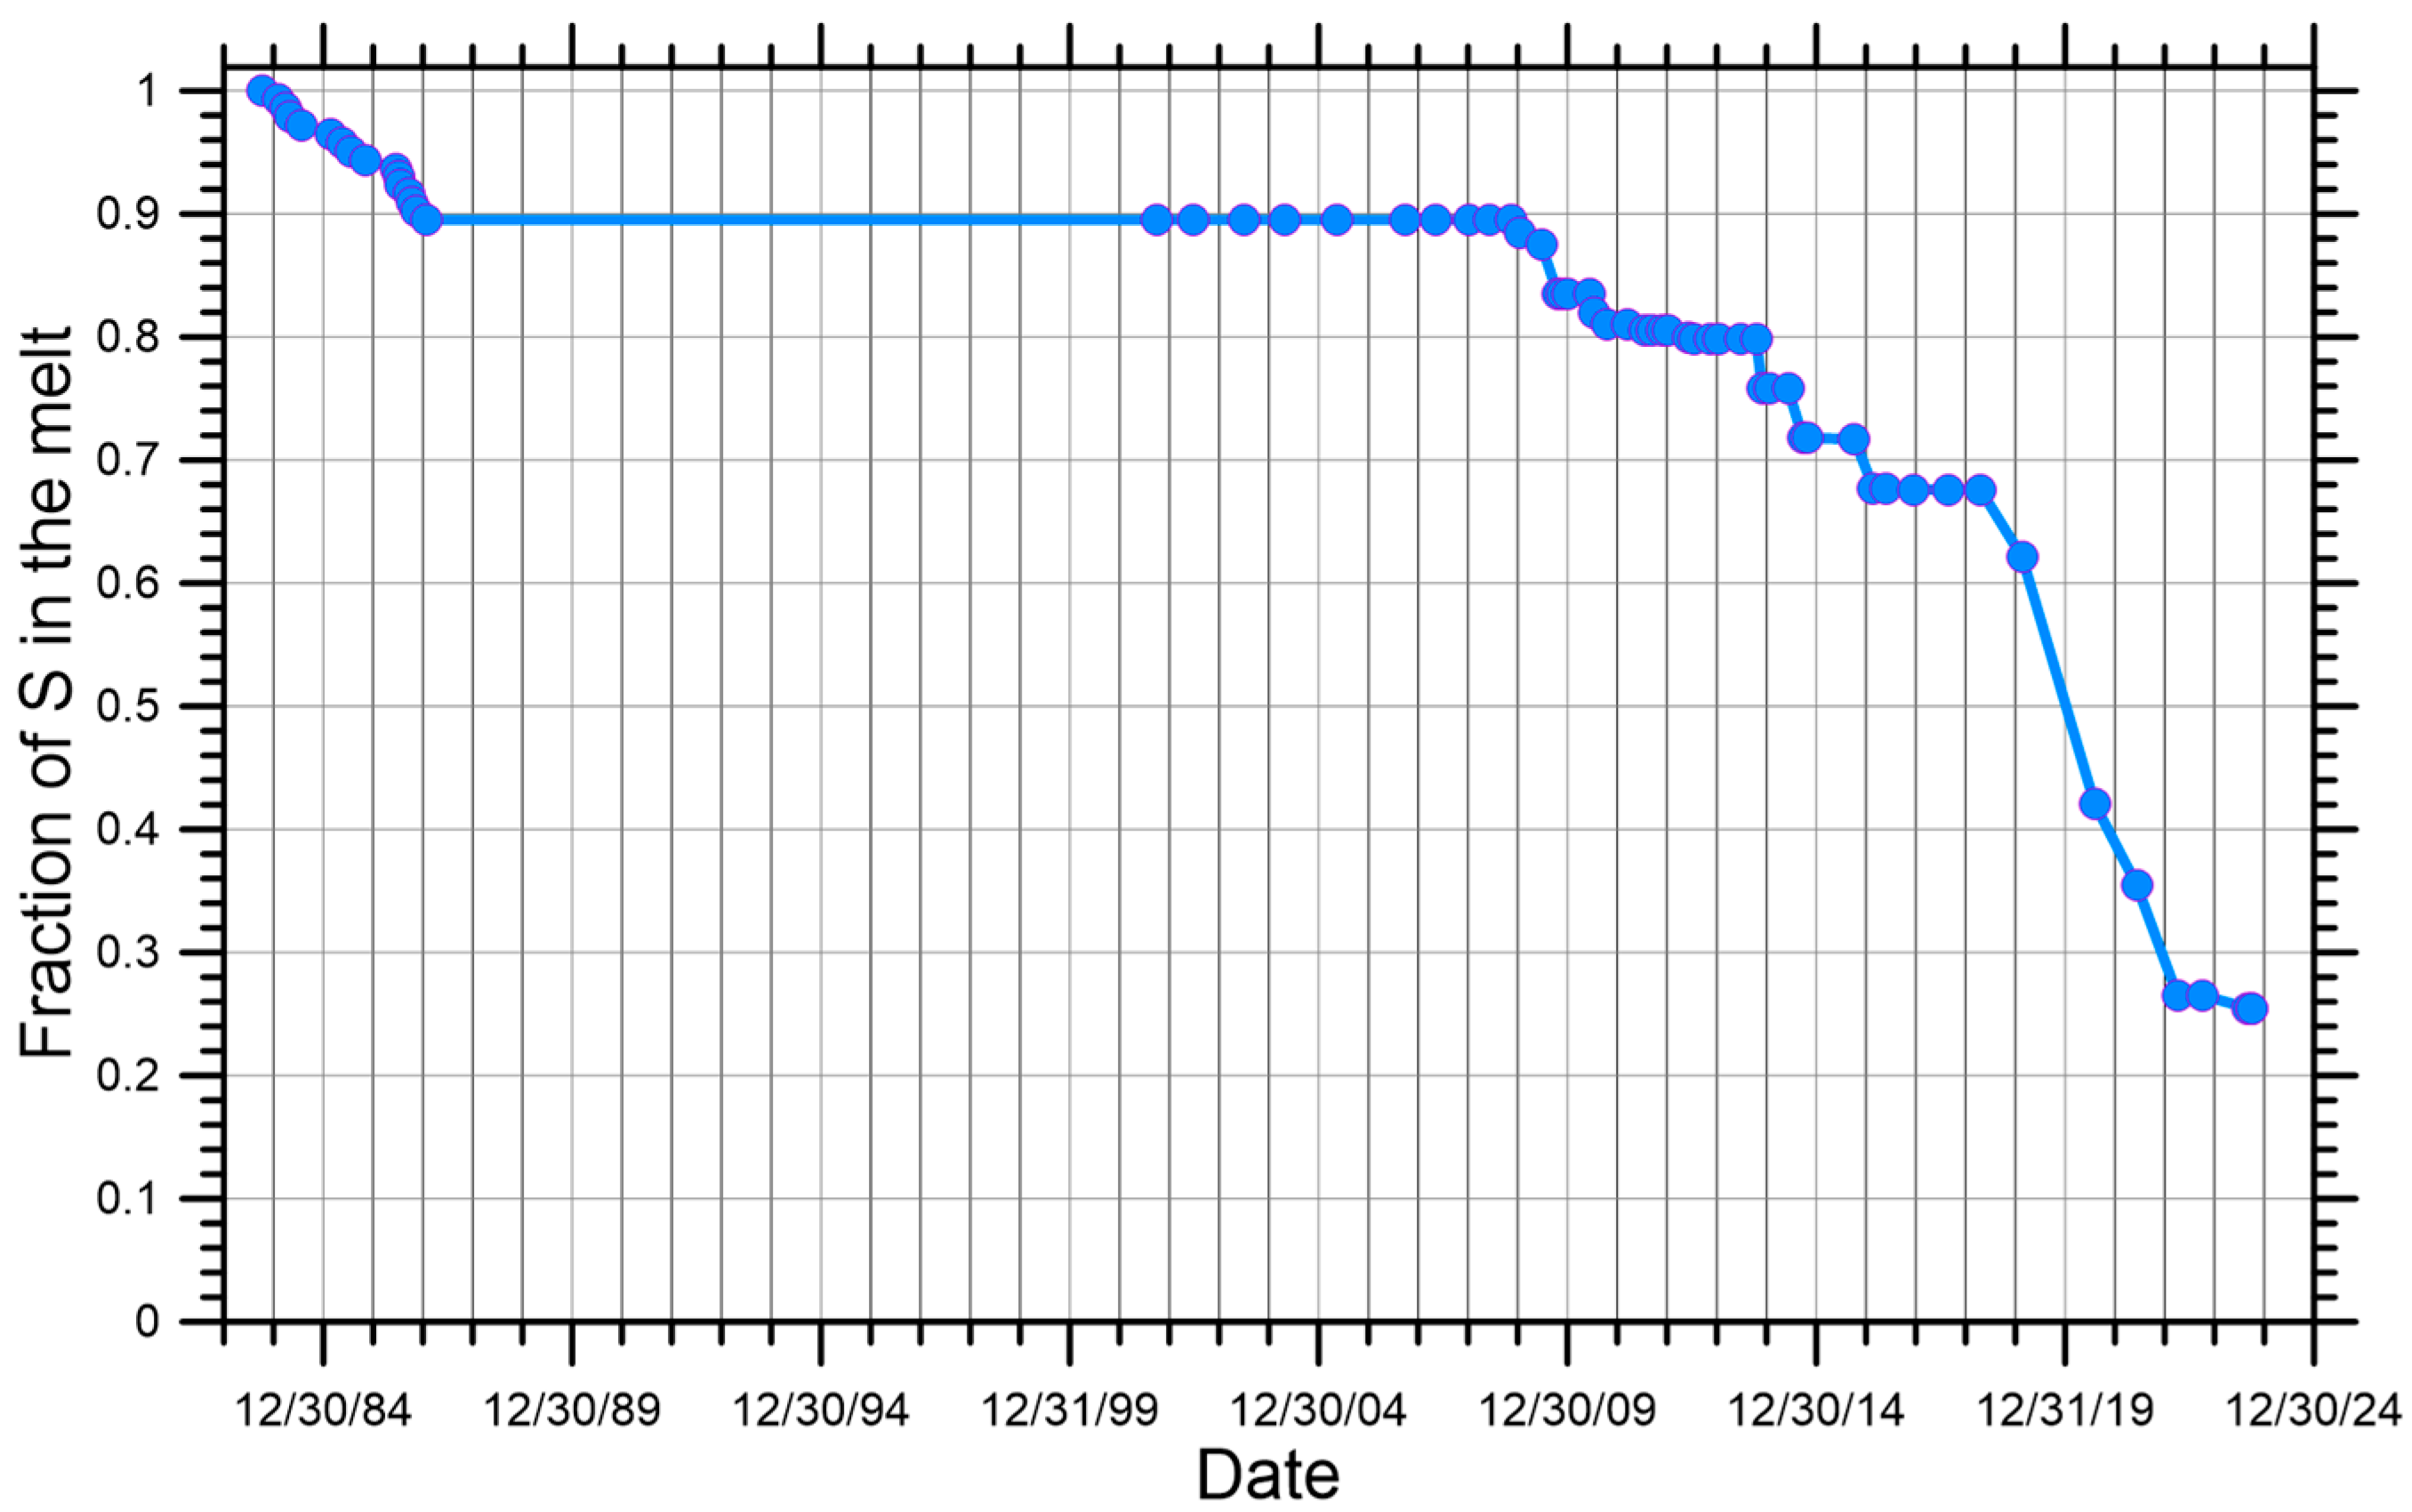
The separation of SO2(g)- and H2S(g)-bearing magmatic gases from the melt, occurring in the melt zone, at depths ≥ 8 km, under closed-system conditions;
(2)
The SO2 disproportionation reaction occurring in the deep hydrothermal reservoir and the related production of anhydrite.
Conversely, the reactions involving pyrite do not control the H2S concentration of Solfatara fluids, as discussed in Appendix A, Appendix A.3. It is not excluded that other processes may take place between the deep hydrothermal reservoir outlet and the surface, such as the formation or destruction of S-bearing solid phases identified at the surface in the Solfatara-Pisciarelli area and/or in the cores from the deep geothermal wells Mofete 1, Mofete 5, and San Vito 1 [45,76], e.g., elemental sulfur, sulfides and bisulfides (e.g., pyrrhotite, pyrite, galena, and sphalerite), and sulfates (e.g., anhydrite and alunite). Nevertheless, it is reasonable to assume that they have a nil to negligible impact on the concentration of H2S(g) and its δ34S value, at least during the last years, due to the prolonged heating of the Solfatara magmatic–hydrothermal system and the considerable temperatures attained by both the intermediate and deep hydrothermal reservoirs (see above). In contrast, by analogy with what was suggested by Giggenbach [77], it is probable that elemental sulfur or sulfur stored in S-bearing minerals was remobilized and entered the magmatic–hydrothermal gases during the early heating phase of the Solfatara magmatic–hydrothermal system when temperatures were much lower, as already recognized by Allard et al. [78].

3.4. Modeling of Magma Degassing

Modeling of magma degassing is based on the hypothesis that the magma chamber positioned at depths ≥ 8 km was filled at the end of the 1982–1984 bradyseismic crisis, and no refilling episodes took place afterwards, as suggested by gas geochemistry [57]. On the other hand, there is no geophysical evidence indicating the occurrence of refilling episodes of the magma chamber situated at depths ≥ 8 km because magma transfer occurs in the absence of earthquakes in this portion of the lower crust with ductile behavior, as pointed out by Buono et al. [79].
The trachybasaltic melt stored in the magma chamber was assumed to be at constant temperature T = 1120 °C and constant pressure P t o t = 2879 bar [57,58], as well as at constant redox conditions defined by log f O 2 = −8.28, corresponding to ΔNNO = 0.254 and ΔQFM = 0.974, according to the following relations (T in K):
NNO = log f O 2 9.36 + 24,930 / T
QFM = log f O 2 8.29 + 24,441.9 / T .
Equations (2) and (3) are from Huebner and Sato [80] and Myers and Eugster [81], respectively. At these redox conditions, the melt is undersaturated with Fe sulfides [15], meaning that the decrease in the S concentration of the melt is controlled by degassing. Constant redox conditions result in a constant molar fraction of sulfate in the total ionic S dissolved in the melt, y S O 4 2 , m e l t , which was computed using the equation [9]:
y S O 4 2 , m e l t = X S O 4 2 , m e l t / X S O 4 2 , m e l t + X S 2 , m e l t = 1 / 1 + 10 ( 2.1 2 · Q F M )
The gas phase coexisting at equilibrium with the melt was assumed to be under the same redox conditions as the melt, and the molar fraction ratio X S O 2 / X H 2 S was calculated using the relation (T in K):
log X S O 2 / X H 2 S = 27377 / T 3.986 log f H 2 O + 1.5 · log f O 2
Equation (5) was obtained by Marini et al. [5] from the log K of the equilibrium reaction:
H2S(g) + 1.5 O2(g) = SO2(g) + H2O(g),
considering the thermodynamic data of Stull et al. [82] and assuming that the fugacity coefficients of H2S and SO2 have the same value. This is a reasonable assumption in that the critical temperature and pressure of H2S, 373.6 K and 88.9 bar, are relatively close to the critical properties of SO2, 430.4 K and 77.7 bar. Indeed, there is a small difference between the fugacity coefficients of H2S and SO2, φ H 2 S = 1.680 and φ S O 2 = 1.795, at T = 1120 °C and P t o t = 2879 bar, computed by Caliro et al. [15] using the code Sulfur_X [83]. Knowing the X S O 2 / X H 2 S ratio, the SO2 molar fraction in total gaseous S is readily obtained utilizing the equation:
y S O 2 , g a s = X S O 2 / X S O 2 + X H 2 S = 1 / X H 2 S / X S O 2 + 1
The fugacity of water to be plugged in Equation (5) was obtained from the relation:
f H 2 O = P t o t · X H 2 O · φ H 2 O
using the average values of the molar fraction of water, X H 2 O = 0.433 (±0.002), and the fugacity coefficient of H2O, φ H 2 O = 1.008 (±0.000), at T = 1120 °C and P t o t = 2879 bar, in the three preferred degassing models by Caliro et al. [15] for CO2 = 2 wt%.
Owing to the mantle provenance of the trachybasaltic melt, its initial δ34S value was set equal to the pristine mantle value, 0 ‰, as observed in many hydrothermal–magmatic systems and ore deposits [6,84]. The initial sulfur concentration of the trachybasaltic melt is considered to be 2200 mg/kg [15]. The variations in the δ34S value of the melt caused by isothermal degassing under closed-system conditions were computed utilizing the following equation [4,5,6]:
δ 34 S m e l t , f = δ 34 S m e l t , i + F 1 · ε g a s m e l t
in which subscripts melt,f and melt,i identify the final and initial states of the melt, respectively; F refers to the fraction of S remaining in the melt; and ε g a s m e l t is the gas–melt equilibrium enrichment factor of S isotopes, which is related to the corresponding equilibrium fractionation factor, α g a s m e l t , by the relation:
ε g a s m e l t = 1000 · α g a s m e l t 1
The gas–melt fractionation factor was calculated using the fractionation factors experimentally determined by Fiege et al. [85] because they filled a gap in knowledge since the only previous experimental study performed at magmatic T (800–1000 °C) on the fractionation pairs S O 4 2 S 2 and S O 4 2 H 2 S was carried out utilizing molten salts, i.e., Na2SO4 and Na2S [86]. Fiege et al. [85] proposed the following relation:
α g a s m e l t = A · α S O 2 , g a s S O 4 2 m e l t + B · α H 2 S , g a s S 2 , m e l t + C · α S O 2 , g a s S 2 , m e l t + D · α H 2 S , g a s S O 4 2 m e l t
with:
A = y S O 2 , g a s   I F   y S O 2 , g a s y S O 4 2 , m e l t   E L S E   A = y S O 4 2 , m e l t
B = y H 2 S , g a s   I F   y H 2 S , g a s y S , 2 m e l t   E L S E   B = y S , 2 m e l t
C = 0   I F   y S O 2 , g a s y S O 4 2 , m e l t   E L S E   C = y S O 2 , g a s y S O 4 2 , m e l t
D = 0   I F   y H 2 S , g a s y S , 2 m e l t   E L S E   D = y H 2 S , g a s y S , 2 m e l t
The fluid–melt S isotope fractionation factors of Fiege et al. [85] are:
α S O 2 , g a s S O 4 2 m e l t = 0.9985 ± 0.0007 ,   α H 2 S , g a s S 2 , m e l t = 1.0067 ± 0.0023 ,
α S O 2 , g a s S 2 , m e l t = 1.0090 ± 0.0025 ,   and   α H 2 S , g a s S O 4 2 m e l t = 0.9962 ± 0.0002 .
However, the experiments of Fiege et al. [85] were carried out on andesitic melts at 1030 °C and f O 2 varying from QFM + 0.8 to QFM + 4.2 log units, while the melt of interest is a trachybasalt at 1120 °C. Therefore, we used the fractionation factors of Fiege et al. [85] and the temperature dependence of the S O 2 H 2 S , S 2 S O 4 2 , and H 2 S S 2 enrichment factors of Taylor [3] to compute the fluid–melt S isotope fractionation factors at 1120 °C. The obtained values, α S O 2 , g a s S O 4 2 m e l t = 0.99759 , α H 2 S , g a s S 2 , m e l t = 1.00662 , α S O 2 , g a s S 2 , m e l t = 1.00864 , and α H 2 S , g a s S O 4 2 m e l t = 0.99557 , were adopted in melt degassing modeling.
At each degassing step, the δ34S value of the gas separated from the melt is obtained from the relation:
δ 34 S g a s = δ 34 S m e l t + ε g a s m e l t
Finally, the δ34S values of SO2(g) and H2S(g) are calculated using the equations:
δ 34 S H 2 S ( g ) = δ 34 S g a s ε S O 2 H 2 S · y S O 2 , g a s
δ 34 S S O 2 ( g ) = ε S O 2 H 2 S + δ 34 S H 2 S ( g )
The SO2-H2S enrichment factor is computed utilizing the relation ([87]; T in K):
ε S O 2 H 2 S = 4.7 · 1000 / T 2 0.5
Strictly speaking, Equation (19) is valid in the temperature range 350–1050 °C, but it was extrapolated to 1120 °C to obtain the ε S O 2 H 2 S value with acceptable approximation.

3.5. Modeling the SO2 Disproportionation Reaction in the Deep Hydrothermal Reservoir

The temperature of the deep hydrothermal reservoir was calculated using the H2S-CO2 gas-geothermometer of Marini et al. [58], calibrated for the saturation decompression path of Solfatara fluids involving a vapor phase and a brine containing 33.5 wt% NaCl. The obtained temperature of the deep hydrothermal reservoir was then used to compute the δ34S values of SO2(g) and H2S(g) in the gas mixture entering the deep hydrothermal reservoir using again Equations (17)–(19).
We assume that the chemical effects caused by the SO2 disproportionation reaction (further details in Appendix A, Appendix A.1) consist of the conversion of one-quarter of the SO2 into H2S and the remaining three-quarters into sulfate ion or sulfuric acid, as dictated by the stoichiometry of reaction (A1). Thus, they are described by the relations:
y H 2 S , D R = 1 y S O 2 , g a s + y S O 2 , g a s / 4
y S O 4 2 , D R = 3 / 4 · y S O 2 , g a s
in which y S O 2 , g a s is the value given by Equation (7). Equations (20) and (21) were used to compute the molar fractions of H2S and S O 4 2 in the deep hydrothermal reservoir.
The isotopic effects brought about by SO2 disproportionation are defined by the equation:
δ 34 S H 2 S , D R , o u t = δ 34 S g a s ε S O 4 2 H 2 S · y S O 4 2 , D R
The S O 4 2 -H2S enrichment factor is calculated using the relation ([88]; T in K):
ε S O 4 2 H 2 S = 2.119 · 10 4 · 1000 / T 6 + 9.332 · 10 3 · 1000 / T 4 0.8910 · 1000 / T 3 + 9.104 · 1000 / T 2 2.222 · 1000 / T + 0.6131
which holds in the temperature interval 0–2000 °C.
Following Marini et al. [16,58], we assume that the gas mixture leaving the deep hydrothermal reservoir does not experience any significant change in the concentration and δ34S value of H2S(g) along the ascent path towards the surface discharge (see Section 3.1). Therefore, δ 34 S H 2 S D R , o u t value is expected to be the same as the δ 34 S H 2 S value measured in the Bocca Grande fumarolic effluents. This equality condition is considered in our calculation strategy (see Section 3.6).
Similarly, the assumption of S conservation along the transit from the deep hydrothermal reservoir to the surface was adopted to calculate the concentrations of H2S, SO2, and total gaseous S at the inlet of deep hydrothermal reservoir, based on the measured H2S concentration, X H 2 S , B G , using the relations:
X H 2 S , D R , i n = X H 2 S , B G / 1 + ¼ · y S O 2 , g a s / 1 y S O 2 , g a s
X S O 2 , D R , i n = X H 2 S , D R , i n · y S O 2 , g a s / 1 y S O 2 , g a s
X S t o t , D R , i n = X H 2 S , D R , i n + X S O 2 , D R , i n

3.6. Calculation Strategy

As already recalled in Section 3.4, the melt at depths ≥ 8 km was assumed to be at constant temperature, T = 1120 °C; constant pressure, P t o t = 2879 bar; and constant log f O 2 = −8.28, at all degassing steps, while the initial δ34S value of the melt was assumed to be 0 ‰, which is the pristine mantle value. Therefore, the only unknown, at each degassing step, is the fraction of S remaining in the melt, F. Thus, the data of Caliro et al. [15], apart from the 10 data of the period August 1998–March 2001, and the data of Allard et al. [78] were ordered by sampling date, from the oldest to the most recent, and the value of F, at each degassing step, was changed iteratively until the δ 34 S H 2 S at the outlet of the deep hydrothermal reservoir given by Equation (22) resulted in being equal to the corresponding δ 34 S H 2 S value measured in the Bocca Grande fumarolic effluents, within analytical uncertainty. For F ≤ 0.7, the error on F ranges between 0.129 and 0.038 units, with an average value of 0.064 units. For F > 0.7, the error is higher and difficult to define due to the considerable oscillations of the analytical δ 34 S H 2 S values.
The ten δ 34 S H 2 S data of the period August 1998–March 2001 (range +1.2 to +2.8‰) were disregarded, as was also done by Caliro et al. [15], because they were at variance with all the other available data (range −1.26 to +0.80‰), probably because they were affected by sample conservation and/or analytical issues. The chemical data of Allard et al. [78], for the period March 1984–January 1987, give H2S equilibrium temperatures varying between 502 and 773 °C. These values contrast with the H2S equilibrium temperatures of 714–761 °C, which are computed using the chemical data of Cioni et al. [59,60] and Caliro et al. [62]. Therefore, the H2S equilibrium temperatures for the period March 1984–January 1987 were computed by interpolation between 714 and 761 °C. Input data and results are reported in the Supplementary Material File.

4. Results and Discussion

There is generally good agreement, within analytical uncertainty, between the δ 34 S H 2 S values at the outlet of the deep hydrothermal reservoir given by Equation (22) and the corresponding δ 34 S H 2 S values measured in the Bocca Grande fumarolic effluents (Figure 3).
Exceptions are mostly samples from the time interval 1983–1987, all but one collected by Allard et al. [78], which have δ 34 S H 2 S values lower than predicted by the model, and the sample obtained on June 11th, 2008, which has a δ 34 S H 2 S value slightly higher than that computed by the model. As already noted above, for the early samples, it is probable that elemental S or the S stored in sulfide/bisulfide and/or sulfate minerals was remobilized and entered the magmatic–hydrothermal gas flow due to heating of the Solfatara magmatic–hydrothermal system [77,78]. Accepting this explanation for the discrepancies between the modeled and measured δ 34 S H 2 S values of early samples, it can be concluded that magma degassing and SO2 disproportionation in the deep hydrothermal reservoir satisfactorily explain the sulfur isotope data of Bocca Grande fumarolic effluents.
Further details on the results of our model are shown in the diagram of Figure 4, in which the fraction of S remaining in the melt is used as a reference variable because it describes the extent of the magma degassing process.
The diagram shows the evolution of the sulfur isotope data predicted by the model for the melt and the gas mixture in different points of the Solfatara magmatic–hydrothermal system, namely, the δ34S value of:
(i)
Total ionic S dissolved in the melt, which decreases from 0.00 to −2.40‰ and has a perfect linear relationship with F, as dictated by Equation (9).
(ii)
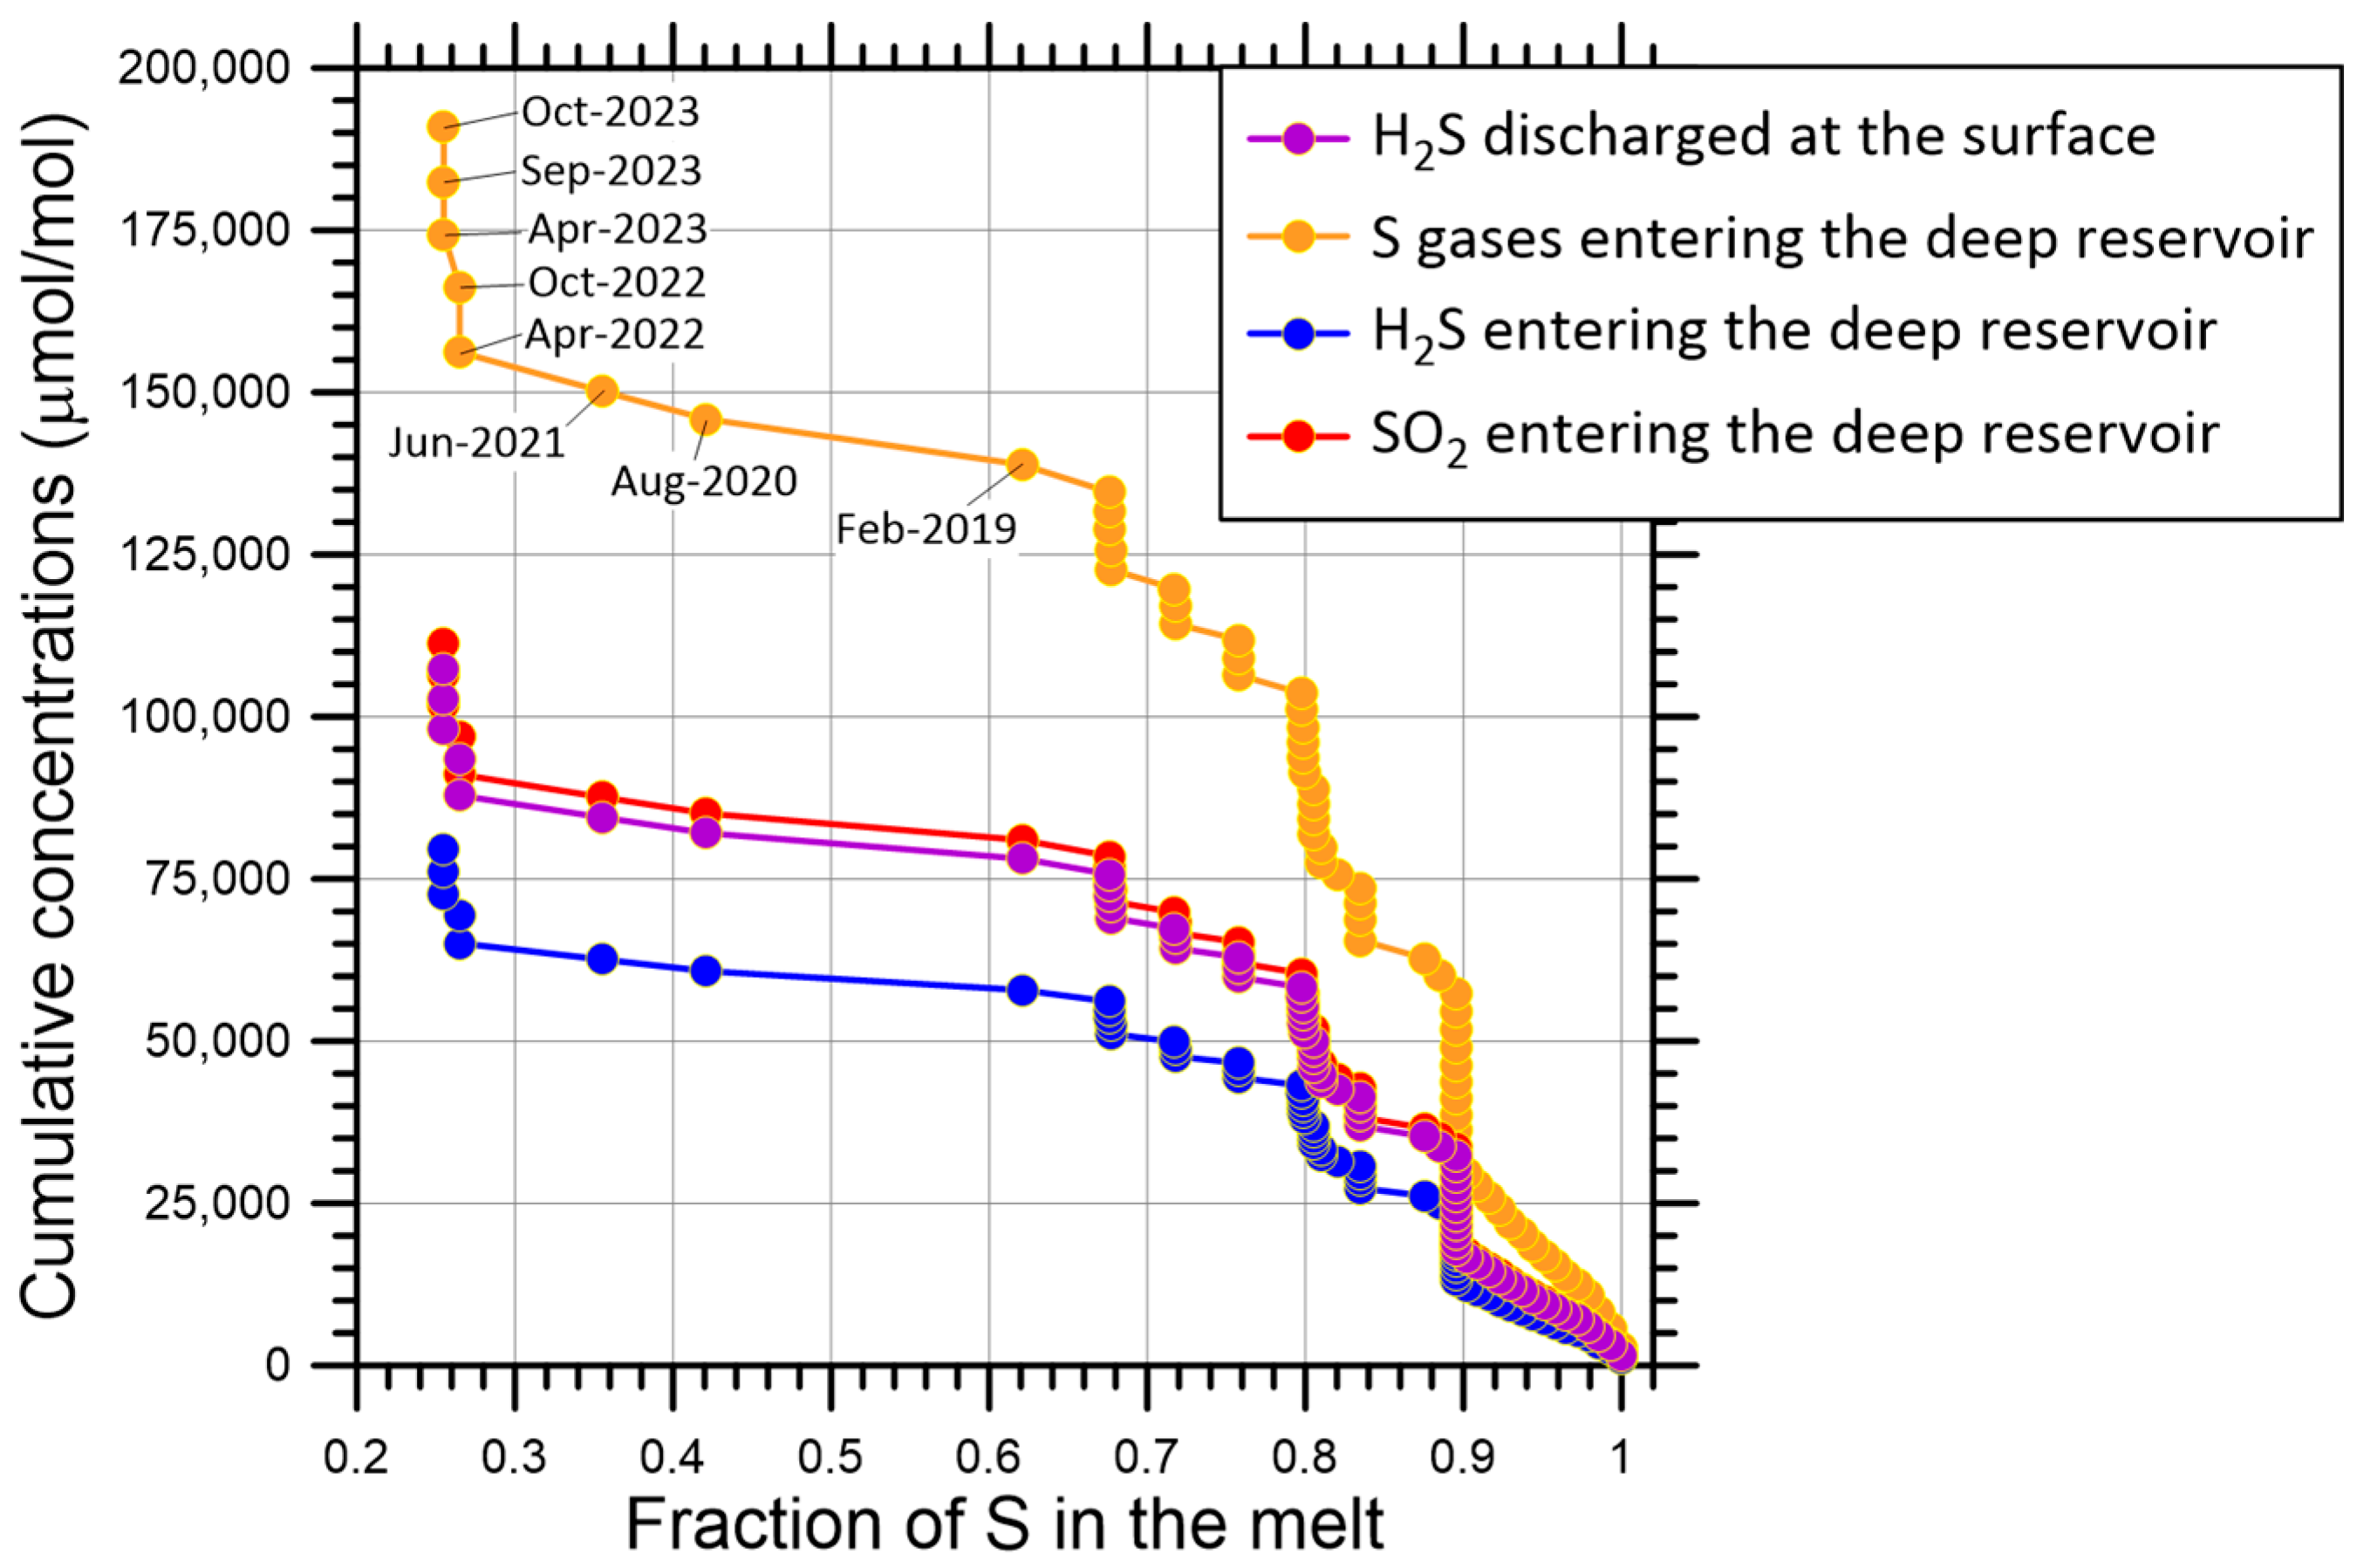
Total gaseous S in the gas mixture separated from the melt, which declines from +3.22 to +0.82‰ and, again, has an exact linear relationship with F, constrained by Equations (9) and (16).
(iii)
Sulfur dioxide in the gas mixture separated from the melt, which diminishes from +4.02 to +1.62‰ and, again, has a perfect linear relationship with F, defined by Equations (9) and (16)–(18).
(iv)
Hydrogen sulfide in the gas mixture separated from the melt, which decreases from +2.10 to −0.30‰ and has an exact linear relationship with F, constrained by Equations (9), (16) and (17).
(v)
Sulfur dioxide in the gas mixture at the inlet of the deep hydrothermal reservoir, which declines from +5.21 to +1.90‰, describing a non-linear trend with a weak upward curvature and several small oscillations. These are due to the joint effects of magma degassing and SO2 disproportionation. It is worth noting that magma degassing, in the absence of other processes, would determine a linear trend, as in previous points. Moreover, SO2 disproportionation is responsible for the deviations from linearity because of the temperature changes in the deep hydrothermal reservoir from 671 to 1022 °C.
(vi)
Hydrogen sulfide in the gas mixture at the inlet of the deep hydrothermal reservoir, which oscillates from +0.94 to −0.83‰, delineating a generally decreasing, non-linear trend with a weak downward curvature and numerous little fluctuations due to the combined influences of magma degassing and SO2 disproportionation, similar to the previous point.
(vii)
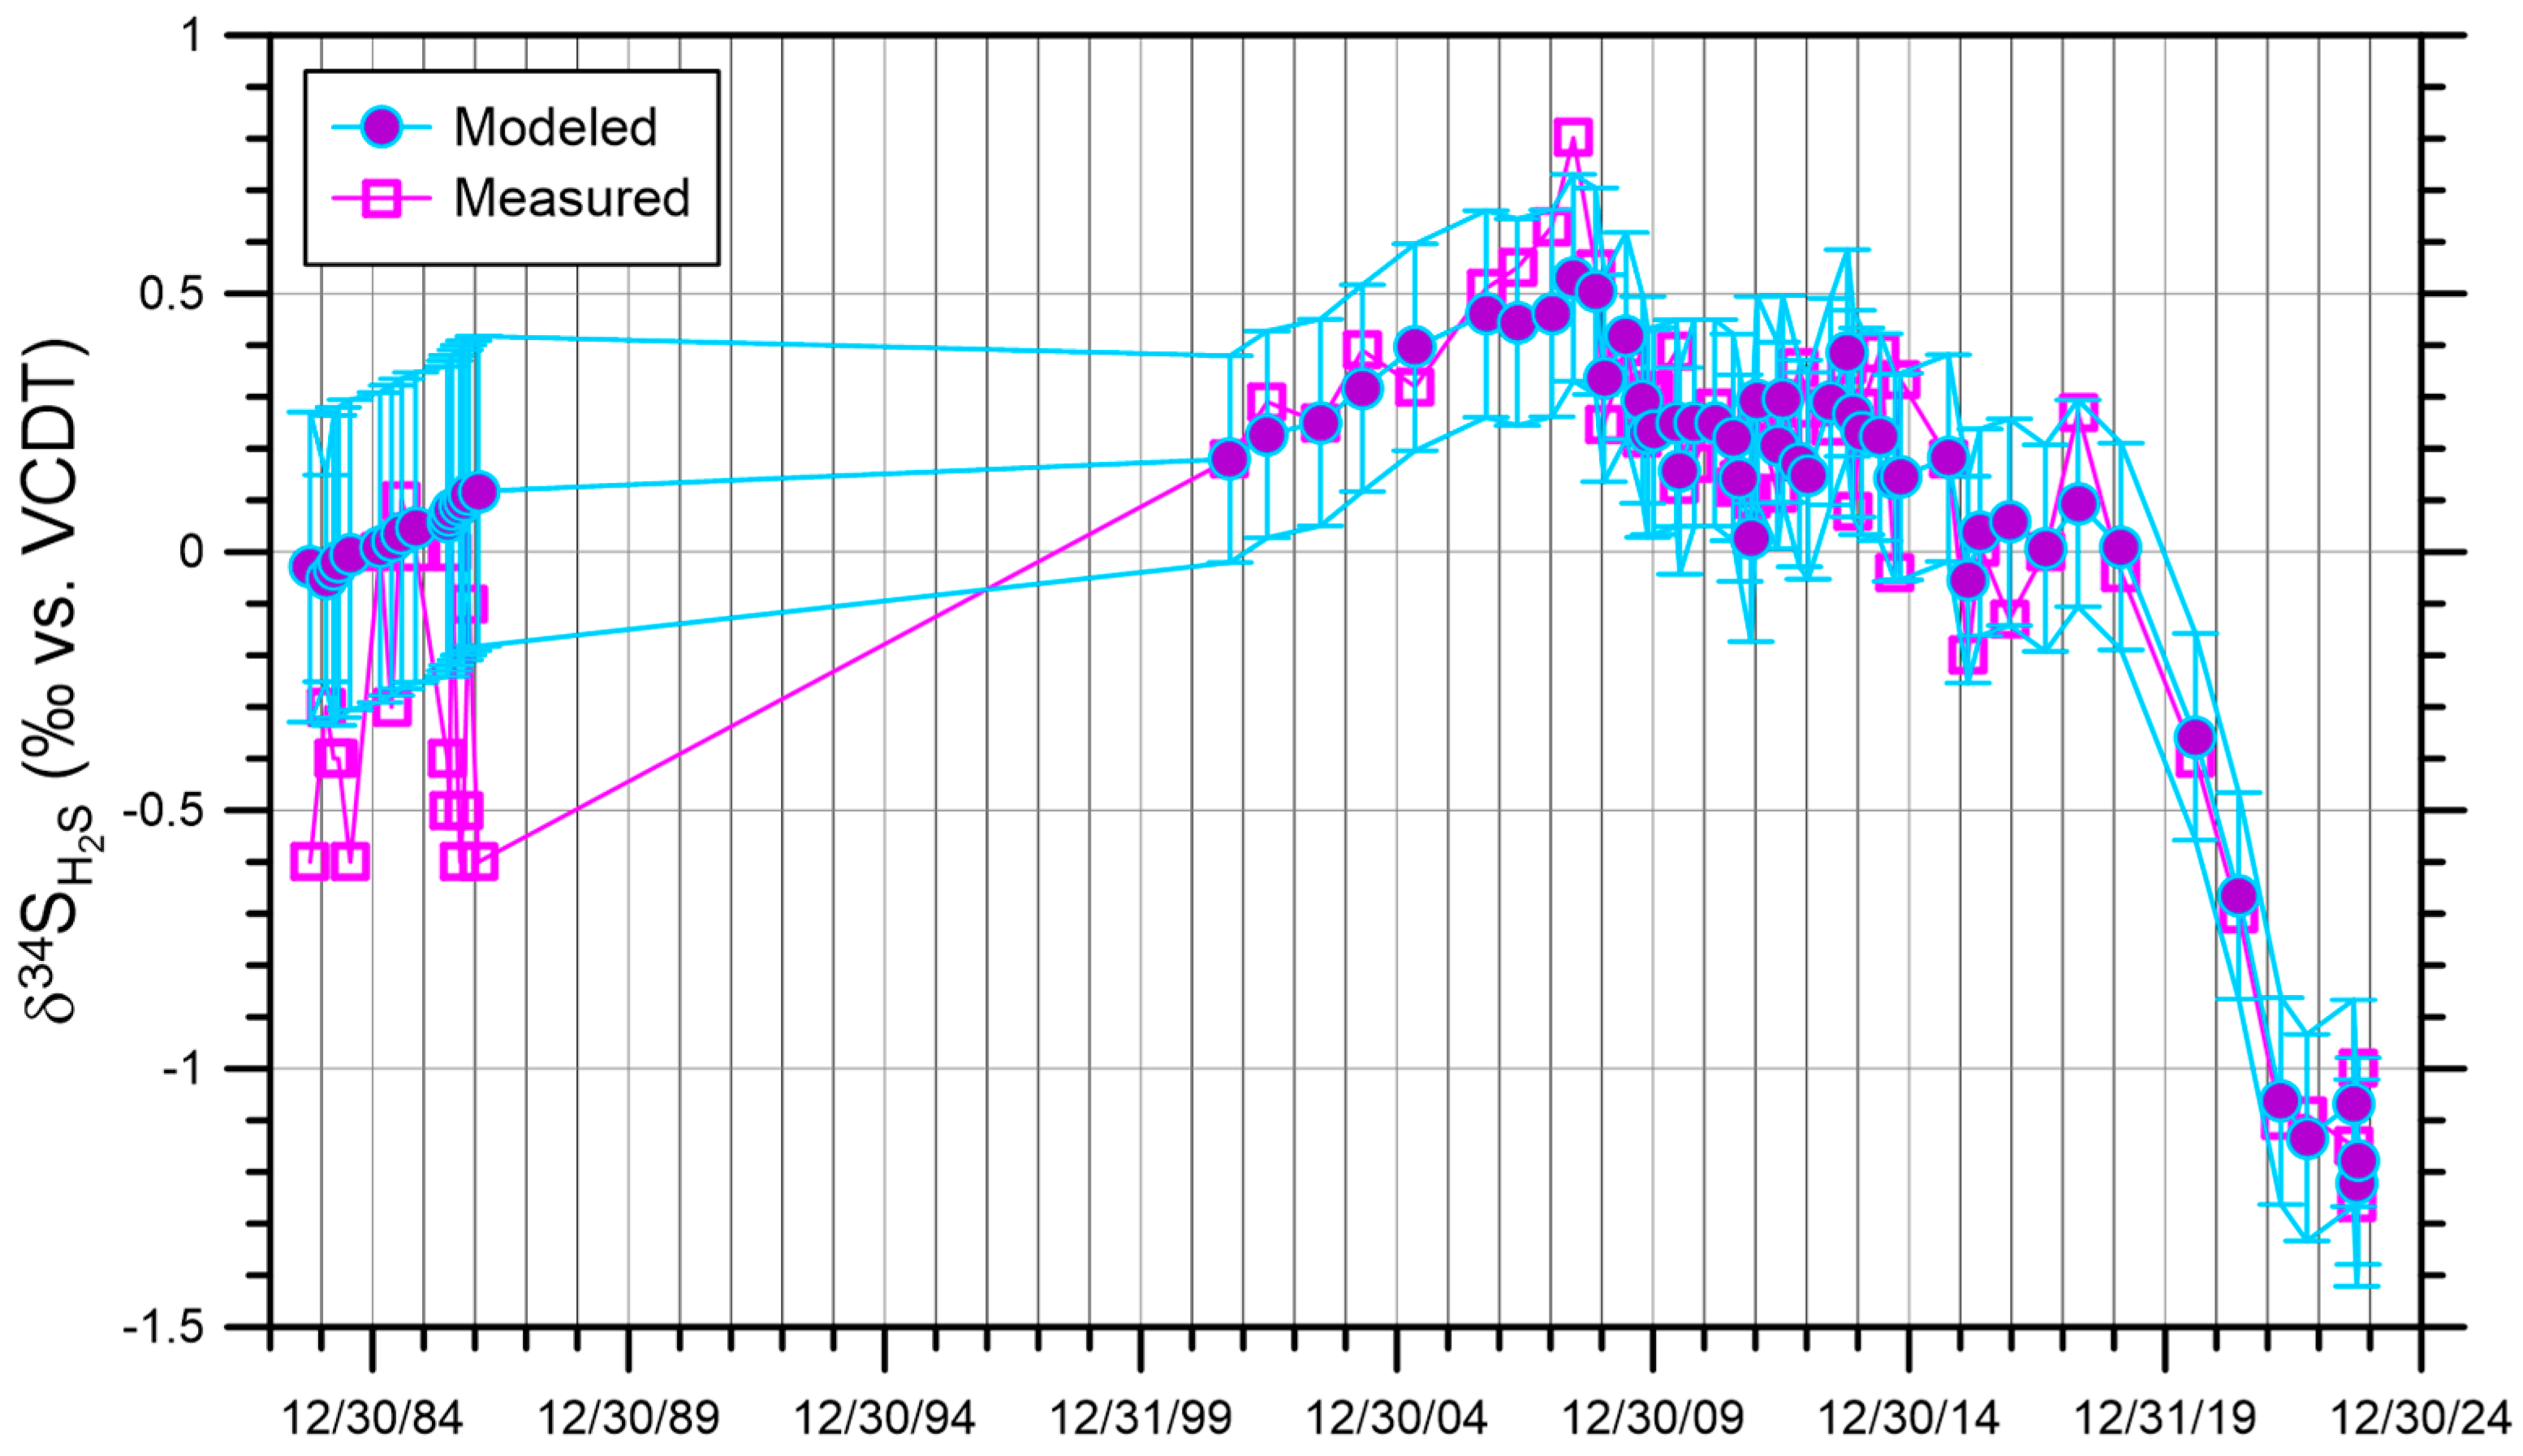
Hydrogen sulfide in the gas mixture at the outlet of the deep hydrothermal reservoir, which varies from +0.53 to −1.22‰, outlining a trend similar to that of the previous point but shifted downward by 0.46–0.37‰ units, corresponding to the difference ε S O 2 H 2 S · y S O 2 , g a s ε S O 4 2 H 2 S · 3 / 4 · y S O 2 , g a s .
It is worth noting that the analytical data, apart from the early ones, are distributed close to the trend of H2S(g) in the gas mixture at the outlet of the deep hydrothermal reservoir, as already observed in Figure 3. Last but not least, the major decrease in F, from 0.676 to 0.265, occurred in 4 years only, from April 2018 to April 2022, with a loss of 41.1% (±6.4%) of the sulfur initially stored in the melt, which amounts to 2200 mg/kg according to Caliro et al. [15]. Afterwards, from April 2022 to October 2023, F experienced a very small decrement, from 0.265 to 0.255, even if this evidence is based on a limited observation time.
Since the fraction of S remaining in the melt is a cumulative parameter, it is advisable to contrast it with the measured cumulative concentrations of H2S discharged at the surface (rather than the individual values) and to also consider the cumulative concentrations of H2S, SO2, and total gaseous S entering the deep hydrothermal reservoir predicted by the model (Figure 5). The cumulative concentrations of H2S measured at the surface are higher than those of H2S entering the deep hydrothermal reservoir (i.e., released from the melt) by a factor 1.35; however, the cumulative concentrations of both total gaseous S and SO2 entering the deep hydrothermal reservoir are higher than those of H2S measured at the surface by a factor 1.78 and 1.04, respectively, indicating that most S released from the melt is converted into sulfate by the SO2 disproportionation reaction and is sequestered as anhydrite in the deep hydrothermal reservoir (see Appendix A, Appendix A.1 and Appendix A.3).
Using the H2S flow data at the surface for the time interval April 2004–October 2023 [15] as well as the results of our model, we have computed the flows of H2S, SO2, and total gaseous S entering the deep hydrothermal reservoir using simple proportions between flows and concentrations, as well as the flow of anhydrite deposited in the deep hydrothermal reservoir, by difference between the flow of total gaseous S entering the deep hydrothermal reservoir and the flow of H2S leaving it (Figure 6).
It is evident that a marked increase in all flows occurred from April 2018 to October 2023, including the flow of anhydrite deposited in the deep hydrothermal reservoir, which varied from a minimum value of 46,999 mol/day in April 2018 to a maximum value of 289,448 mol/day in September 2023. The last two figures, corresponding to 6.4 and 39.4 metric tons/day, contrast with the assertion on the rarity of anhydrite in the Solfatara magmatic–hydrothermal system [15], which is based on the occurrence of anhydrite in the geothermal wells drilled in the Campi Flegrei, as reported in Piochi et al. [45]. This topic is further discussed in Appendix A and Appendix A.3.
Apart from the early years, whose data are not representative (see above), the S loss experienced by the melt was negligible before 2008, moderate from 2009 to April 2018 (with some fluctuations), very high from April 2018 to April 2022, and returned to be moderate afterwards, from April 2022 to October 2023 (Figure 7). Thus, magma degassing has caused a considerable decrease in the fraction of sulfur remaining in the melt, from the initial value of 1 in October 1983 to the final value of 0.255 in October 2023, which is the end of the considered 40-year time interval. Nevertheless, the major decrement in F, from 0.676 to 0.265, has occurred in 4 years only, from April 2018 to April 2022, with a loss of 41.1% (±6.4%) of the sulfur initially stored in the melt, as already noted above. This marked S loss in 2018–2022 might be explained by the high solubility of sulfur in the melt, causing its preferential separation during late degassing stages, as suggested by the simplified fluid–melt partitioning and solubility relations of Giggenbach [89,90], although degassing of real magmas is undoubtedly more complicated, and a rigorous thermodynamic model is needed to describe S behavior in silicate melts [91,92,93]. Interestingly, the marked S loss by magma degassing in the years 2018–2022 was accompanied by simultaneous peak values of temperature and fluid pressure in both the deep and intermediate hydrothermal reservoirs [16].

5. Conclusions

Closed-system degassing of the melt stored in the magma chamber, located at depths ≥ 8 km, and disproportionation of SO2 in the deep hydrothermal reservoir, positioned at 6.5–7.5 km depth (and hosted in carbonate rocks where H2S equilibrates), explain the concentration and the δ34S value of H2S(g) of the Bocca Grande fumarolic effluents. In simple words, melt degassing transfers both SO2 and H2S to the separated gas phase. Then, due to SO2 disproportionation in the deep hydrothermal reservoir, three-quarters of SO2 is converted into H2SO4 and sequestered as anhydrite, while one-quarter of SO2 is converted into H2S. The production of anhydrite in the deep hydrothermal reservoir hosted in carbonate rocks, up to 6.4 and 39.4 metric tons/day in the period April 2018–October 2023, is supported by its abundance in the carbonate–evaporite geothermal systems of Central Italy and its stability under the temperature and pressure conditions in the deep hydrothermal reservoir.
We reached these conclusions referring to the conceptual model of the Solfatara magmatic–hydrothermal system of Marini et al. [16] and assuming that the magma chamber was filled at the end of the 1982–1984 crisis and there were no subsequent refilling episodes, as suggested by gas geochemistry [57]. This way, we contextualized magma degassing and SO2 disproportionation, the two most important and common processes controlling S isotope fractionation in active magmatic–hydrothermal systems and ore deposits which are the past analogues of magmatic–hydrothermal systems [6,13]. Furthermore, the sulfur isotope data of the Bocca Grande fumarolic effluents suggest that 41.1% (±6.4%) of the S initially dissolved in the melt (2200 mg/kg, according to Caliro et al. [15]) was lost through degassing from April 2018 to April 2022. This marked S loss might be due to the high solubility of sulfur in the melt, which brings about its preferential separation during the late degassing stages. These findings improve forecasting and hazard assessment at Solfatara and similar magmatic–hydrothermal systems.

Supplementary Materials

The following supporting information can be downloaded at: https://www.mdpi.com/article/10.3390/geosciences15050162/s1.

Author Contributions

Conceptualization, L.M.; data curation, L.M.; formal analysis, M.L. and C.P.; investigation, L.M., M.L. and C.P.; methodology, L.M.; software, L.M.; supervision, L.M.; validation, M.L.; visualization, L.M.; writing—original draft, L.M.; writing—review and editing, M.L. and C.P. All authors have read and agreed to the published version of the manuscript.

Funding

This research received no external funding.

Data Availability Statement

The data presented in this study are available in reference number [15].

Acknowledgments

The Guest Editors Giovanni Vespasiano, Marco Taussi, Carmine Apollaro, and Ilaria Fuoco are acknowledged for inviting us to write this manuscript. We are indebted to the Academic Editor for handling our manuscript and to the three anonymous reviewers for their constructive and appreciated comments that helped us improve it.

Conflicts of Interest

Author Luigi Marini was employed by the company STEAM Srl. The remaining authors declare that the research was conducted in the absence of any commercial or financial relationships that could be construed as a potential conflict of interest.

Appendix A. Relevant Reactions Involving Anhydrite and Pyrite

Appendix A.1. SO2 Disproportionation and Anhydrite Formation

As recognized long ago by Holland [94], virtually all magmatic SO2(g) reacts to form H2SO4 and H2S or S or both, through the following disproportionation reactions:
4   SO 2(aq) + 4   H 2 O (l)     H 2 S 2(aq)   +   3   H 2 SO 4(aq) ,
3   SO 2(aq) + 2   H 2 O (l)     S (s,l)   +   2   H 2 SO 4(aq) ,
upon dissolution either in groundwater or in the liquid phase formed through condensation of magmatic gases. In the following years, the widespread occurrence of these reactions was supported by observations in different magmatic–hydrothermal systems, such as Krafla, Iceland [95], White Island, New Zealand [77], and Nevado del Ruiz, Colombia [96,97], as well as by reaction path modeling of magmatic gas scrubbing [74,75,98,99,100]. These geochemical modeling exercises also pointed out that the H2SO4(aq) generated by reactions (A1) and (A2) is quickly neutralized by reaction with Al-silicate rocks, with production of alunite at low pH values, in the range of 2.0–3.0 (e.g., [74]):
3   Al 2 O 3(rock) + K 2 O (rock) + 4   H 2 SO 4(aq) + 2   H 2 O (l)     2   KAl 3 (OH) 6 (SO 4 ) 2(s)
and by precipitation of anhydrite at higher pH values (e.g., [74]):
CaO (rock) + H 2 SO 4(aq)     CaSO 4(s) + H 2 O (l) .
Alternatively, SO2 disproportionation may take place through the following heterogeneous gas–solid reaction, in subvolcanic “dry” environments:
3   CaAl 2 Si 2 O 8(s) + 4   SO 2(g) + H 2 O (g)     3   CaSO 4(s) + 3   Al 2 Si O 5(s) + 3   SiO 2(s) + H 2 S (g)
based on the results of high-temperature laboratory experiments [101,102,103]. At increasingly high temperatures, andalusite (Al2SiO5) may be substituted by sillimanite (Al2SiO5), while mullite (Al4+2xSi2−2xO10−x with x = 0.17 to 0.59) or corundum (Al2O3) may become stable in Al-rich systems. Reaction (A5) is initiated by chemisorption of polar SO2(g) molecules onto the Al-silicate surface [102,104] and proceeds via diffusion of Ca2+ ions from the Al-silicate substrate to its surface [101,102,104,105,106]. In subvolcanic “dry” environments, rocks are exposed to high-temperature, low-density magmatic gas mixtures containing significant concentrations of SO2(g) for long intervals of time, and the anhydrite-forming reactions may have a more substantial impact [102,107,108,109].
In systems hosted in carbonate rocks, after SO2 dissolution and disproportionation according to reactions (A1) and (A2), H2SO4(aq) is rapidly neutralized through the following reaction:
CaCO 3(s) + H 2 SO 4(aq)     CaSO 4(s) + CO 2(aq,g) + H 2 O (l) ,
causing the conversion of calcite into anhydrite.
Alternatively, SO2 disproportionation may take place through the following heterogeneous gas–solid reaction:
3   CaCO 3(s) + 4   SO 2(g) + H 2 O (g)     3   CaSO 4(s) + 3   CO 2(g) + H 2 S (g)
A similar SO2(g) disproportionation reaction, but with production of S2(g) instead of H2S(g), was studied by Saadatfar et al. [110] through exposure of Carrara Marble to SO2(g) for 15 days at 600 to 750 °C and one atmosphere. Saadatfar et al. [110] showed that reaction is initiated by the anisotropic thermal expansion of the calcite grains of the highly compacted Carrara Marble to produce high inter-grain permeability. Then, a fast gas–solid reaction occurs, producing a network of porous anhydrite layers between grains.
The upper limit of all anhydrite-forming reactions recalled above is given by the thermal decomposition of anhydrite to CaO and SO3, which becomes appreciable at temperatures of ca. 1200 °C [111] or >1100 °C [112].
Summing up, the stoichiometry of the process comprising SO2 disproportionation according to reaction (A1) and interaction with Al-silicate rocks or carbonate rocks brings about the consumption of 4 moles of SO2 and the production of 3 moles of anhydrite and 1 mole of H2S, irrespective of the reaction path, either SO2 disproportionation in the aqueous phase and subsequent water-rock interaction or heterogeneous gas–solid reaction. Thus, irrespective of the reaction path and the rock type, the chemical effects of SO2 disproportionation are defined by Equations (20) and (21), whereas its isotopic fractionation effects are described by Equation (22).

Appendix A.2. Reactions Involving Pyrite

The H2S(aq) produced by reactions (A1) and the H2S(g) generated by reactions (A5) and (A7), or part of it, may react with silicates or Al-silicates of bivalent iron, here indicated as FeO(rock), according to the following sulfidation reactions:
FeO (rock) + H 2 S (aq,g)     FeS (s) + H 2 O (l,g)
FeO (rock) + 2   H 2 S (aq,g)     FeS 2(s) + H 2(aq,g) + H 2 O (l,g) .
with production of pyrrhotite [FeS(s)] and pyrite [FeS2(s)], respectively. It is worth noting that reactions (A8) and (A9) may occur under both dry and wet conditions. Since the formal oxidation state of S is −2 in H2S and −1 in pyrite, the two S atoms are oxidized in the redox reaction (A9). Consequently, two H atoms are reduced, with the generation of H2, which is among the products of the redox reaction (A9).
Reaction path modeling of andesite alteration by initially acidic magmatic fluids [74,98,99] gives different results on the fate of pyrite, alunite, and anhydrite. According to Reed [98], the three minerals are ephemeral solid phases, with alunite occurring at low water/rock ratios (corresponding to acidic conditions) and anhydrite and pyrite occurring in a large interval of water/rock ratios (corresponding to acidic to neutral conditions). According to Symonds et al. [74], pyrite begins to precipitate under acidic conditions (pH < 2) and is a stable mineral product upon complete neutralization of the aqueous solution, whereas both alunite and anhydrite are ephemeral solid phases. According to Marini et al. [99], pyrite and alunite form under acidic conditions and are ephemeral minerals, whereas anhydrite begins to precipitate under acidic conditions (pH < 2), persists upon neutralization of the aqueous solution, and is part of the stable (final) mineral assemblage. Formation of pyrite and S sequestration in its lattice causes a considerable decrease in H2S concentration and a moderate decrease in sulfate concentration according to the disproportionation reaction [74]:
7 H 2 S ( g ) + S O 4 ( a q ) 2 + 2 H ( a q ) + + 4 F e O ( r o c k ) 4 F e S 2 ( s ) + 8 H 2 O ( l ) .
Incidentally, the reverse of reaction (A10), that is, the pyrite disproportionation reaction taking place in water or a hydrothermal brine, should be written as follows:
4 F e S 2 ( s ) + 6 H ( a q ) + + 4 H 2 O ( l ) 4 F e ( a q ) 2 + + S O 4 ( a q ) 2 + 7 H 2 S ( a q )
Reaction (A11) must be considered to evaluate the effects of S isotope fractionation instead of the corresponding half-reactions. In fact, as reported by Clark [113], “at the basis of isotope partitioning is the difference in rate at which two isotopes of the same molecular species will react in a thermodynamic reaction”, not in a half-reaction.
Upon heating in dry systems, pyrite decomposes to pyrrhotite and gaseous sulfur, according to different reactions, such as the following one:
FeS 2 ( s )     FeS ( s ) + S 2 ( g )
which was investigated experimentally in several studies, such as that of Hong and Fegley [114] and references therein. At a given temperature, pyrite decomposition in H2S-H2 gas mixtures is several times faster than pyrite thermal decomposition in inert gases, probably due H2 attack [115]:
FeS 2 ( s ) + H 2 ( g )     FeS ( s ) + H 2 S ( g )
Summing up, pyrite has a relatively high reactivity due to its tendency to disproportionate or to decompose upon heating.

Appendix A.3. The Distribution and Role of Pyrite and Anhydrite in the Solfatara Magmatic–Hydrothermal System

Direct observations on the distribution and characteristics of pyrite, anhydrite, and other S-bearing minerals in the Solfatara magmatic–hydrothermal system are limited to the surface, in the Solfatara-Pisciarelli area, and to depths ≤ 3 km, in the deep geothermal wells Mofete 1 (total depth 1606 m), Mofete 5 (total depth 2700 m), and San Vito 1 (total depth 3046 m) [18,45,58,76]. The distribution of pyrite and anhydrite at greater depths must be based on general models of magmatic–hydrothermal systems, such as that of Fournier [116], and hypotheses that cannot be verified by direct observations. However, it is reasonable to assume what follows:
(i)
The temperature and pressure conditions are probably constrained by the coexistence, at equilibrium, of a vapor phase and a high-salinity sodium-chloride brine, because the other possible conditions are highly unlikely [16]. In fact, the occurrence of a single liquid phase at relatively low temperatures and high pressures is at variance with the large heat flow released from the deep melt zone and transferred to the overlying hydrothermal portion of the system, whereas the occurrence of a single vapor phase coexisting with solid NaCl (which is typical of depressurized vapor-cored magmatic systems [117]) is at variance with the current pressurization of the intermediate hydrothermal reservoir of the Solfatara hydrothermal–magmatic system and related ground uplift, shallow seismicity, and increasing emission of fluids from the Solfatara-Pisciarelli fumaroles [14]. The related implication is that SO2 disproportionation occurring in the deep hydrothermal reservoir follows the wet path described by reaction (A1).
(ii)
Accepting that the deep hydrothermal reservoir is hosted in Ca-rich, Fe-poor carbonate rocks, it is likely that the H2SO4 generated by reaction (A1) is neutralized by reaction (A6), causing the conversion of calcite into anhydrite, whereas it is unlikely that H2SO4 neutralization is controlled by reaction (A10). The occurrence of reaction (A6) is supported by the abundance of calcite and anhydrite, as vein minerals, in the carbonate–evaporite geothermal systems of Central Italy [118], such as the Latera geothermal system, where both anhydrite and calcite are very abundant secondary minerals, even in the contact-metasomatism assemblage close to the magma chamber [119], which was penetrated for >350 m by deep geothermal drilling, being positioned at ~2 km depth [120].
(iii)
Furthermore, anhydrite is stable at the temperatures of 618–1040 °C estimated for the deep hydrothermal reservoir using the H2S-CO2 gas geothermometer [16,58], whereas pyrite is expected to decompose rapidly at these temperatures (see Appendix A.2). Calcite and anhydrite are the two solid phases controlling the H2S-CO2 gas geothermometer, which is based on the following heterogeneous equilibrium reaction:
CaSO 4 ( s ) + CO 2 ( g ) + 4   H 2 ( g )     CaCO 3 ( s ) + H 2 S ( g ) 3   H 2 O ( g )
occurring in the deep hydrothermal reservoir. In this gas geothermometer, calibrated by Marini et al. [58] and applied by Marini et al. [16], Equation (A14) is treated as an equilibrium reaction. Therefore, anhydrite was not considered to be a potential source of H2S by Marini et al. [16], as erroneously reported in Caliro et al. [15]. Indeed, as discussed in Appendix A.1, anhydrite is a sink of H2S and is not a source of H2S.
(iv)
The hydrothermal S-bearing mineral most commonly encountered in drilled geothermal systems is pyrite [121,122,123,124]. Not surprisingly, pyrite is stable at almost all depths and temperatures, up to 350 °C, in wells Mofete 1 and 2 [125]. In general, pyrrhotite is much less abundant than pyrite in drilled geothermal systems, and in wells Mofete 1 and 2, pyrrhotite is present only in the propylitic and thermometamorphic zones, at temperatures of 250–350 °C [125]. Based on this evidence, Marini et al. [58] calibrated the gas geothermometers pyrite-pyrrhotite, pyrite-fayalite-quartz, pyrite-magnetite, and pyrite-hematite, considering deviations from ideality, but the equilibrium temperatures computed by these pyrite-bearing gas geothermometers resulted in being at variance with the CH4 equilibrium temperature for the Solfatara fumarolic fluids, suggesting that the H2S concentration of Solfatara fluids is not controlled by reactions involving pyrite. Therefore, pyrite and reactions involving it were disregarded in this work.

References

  1. Sakai, H.; Casadevall, T.J.; Moore, J.G. Chemistry and isotope ratios of sulfur in basalts and volcanic gases at Kilauea volcano, Hawaii. Geochim. Cosmochim. Acta 1982, 46, 729–738. [Google Scholar] [CrossRef]
  2. Ueda, A.; Sakai, H. Sulfur isotope study of Quaternary volcanic rocks from the Japanese Islands Arc. Geochim. Cosmochim. Acta 1984, 48, 1837–1848. [Google Scholar] [CrossRef]
  3. Taylor, B.E. Magmatic volatiles—Isotopic variation of C, H, and S. Rev. Mineral. 1986, 16, 185–225. [Google Scholar]
  4. Marini, L.; Paiotti, A.; Principe, C.; Ferrara, G.; Cioni, R. Isotopic ratio and concentration of sulfur in the undersaturated alkaline magmas of Vulture Volcano (Italy). Bull. Volcanol. 1994, 56, 487–492. [Google Scholar] [CrossRef]
  5. Marini, L.; Chiappini, V.; Cioni, R.; Cortecci, G.; Dinelli, E.; Principe, C.; Ferrara, G. Effect of degassing on sulfur contents and δ34S values in Somma-Vesuvius magmas. Bull. Volcanol. 1998, 60, 187–194. [Google Scholar] [CrossRef]
  6. Marini, L.; Moretti, R.; Accornero, M. Sulfur isotopes in magmatic-hydrothermal systems, melts, and magmas. Rev. Mineral. Geochem. 2011, 73, 423–492. [Google Scholar] [CrossRef]
  7. Carroll, M.R.; Rutherford, M.J. Sulfur speciation in hydrous experimental glasses of varying oxidation-state—Results from measured wavelength shifts of sulfur X-rays. Am. Mineral. 1988, 73, 845–849. [Google Scholar]
  8. Wallace, P.; Carmichael, I.S.E. Sulfur in basaltic magmas. Geochim. Cosmochim. Acta 1992, 56, 1863–1874. [Google Scholar] [CrossRef]
  9. Jugo, P.J.; Wilke, M.; Botcharnikov, R.E. Sulfur K-edge XANES analysis of natural and synthetic basaltic glasses: Implications for S speciation and S content as function of oxygen fugacity. Geochim. Cosmochim. Acta 2010, 74, 5926–5938. [Google Scholar] [CrossRef]
  10. Baker, D.R.; Moretti, R. Modeling the solubility of sulfur in magmas: A 50-year old geochemical challenge. Rev. Mineral. Geochem. 2011, 73, 167–213. [Google Scholar] [CrossRef]
  11. Mandeville, C.W.; Sasaki, A.; Saito, G.; Faure, K.; King, R.; Hauri, E. Open-system degassing of sulfur from Krakatau, magma. Earth Planet. Sci. Lett. 1998, 160, 709–722. [Google Scholar] [CrossRef]
  12. Burgisser, A.; Scaillet, B. Redox evolution of a degassing magma rising to the surface. Nature 2007, 445, 194–197. [Google Scholar] [CrossRef] [PubMed]
  13. Rye, R.O. A review of the stable-isotope geochemistry of sulfate minerals in selected igneous environments and related hydrothermal systems. Chem. Geol. 2005, 215, 5–36. [Google Scholar] [CrossRef]
  14. Giudicepietro, F.; Avino, R.; Bellucci Sessa, E.; Bevilacqua, A.; Bonano, M.; Caliro, S.; Francesco Casu, F.; De Cesare, W.; De Luca, C.; De Martino, P.; et al. Burst-like swarms in the Campi Flegrei caldera accelerating unrest from 2021 to 2024. Nature Commun. 2025, 16, 1548. [Google Scholar] [CrossRef] [PubMed]
  15. Caliro, S.; Chiodini, G.; Avino, R.; Carandente, A.; Cuoco, E.; Di Vito, M.A.; Minopoli, C.; Rufino, F.; Santi, A.; Lages, J.; et al. Escalation of caldera unrest indicated by increasing emission of isotopically light sulfur. Nat. Geosci. 2025, 18, 167–174. [Google Scholar] [CrossRef]
  16. Marini, L.; Principe, C.; Lelli, M. Time changes during the last 40 years in the Solfatara magmatic-hydrothermal system (Campi Flegrei, Italy): New conceptual model and future scenarios. EGUsphere 2024, 1–25. [Google Scholar] [CrossRef]
  17. Rosi, M.; Sbrana, A.; Principe, C. The Phlegraean Fields: Structural evolution, volcanic history and eruptive mechanisms. J. Volcanol. Geotherm. Res. 1983, 17, 273–288. [Google Scholar] [CrossRef]
  18. Chelini, W.; Sbrana, A. Subsurface Geology. In Phlegrean Fields, Progetto Finalizzato ‘Geodinamica’, Monografie Finali; Quaderni de “La Ricerca Scientifica”; Rosi, M., Sbrana, A., Eds.; Consiglio Nazionale delle Ricerche: Roma, Italy, 1987; Volume 9, pp. 94–103. [Google Scholar]
  19. Cassano, E.; La Torre, P. Geophysics. In Phlegrean Fields, Progetto Finalizzato ‘Geodinamica’, Monografie Finali; Quaderni de “La Ricerca Scientifica”; Rosi, M., Sbrana, A., Eds.; Consiglio Nazionale delle Ricerche: Roma, Italy, 1987; Volume 9, pp. 103–131. [Google Scholar]
  20. Barberi, F.; Cassano, E.; La Torre, P.; Sbrana, A. Structural evolution of Campi Flegrei caldera in light of volcanological and geophysical data. J. Volcanol. Geotherm. Res. 1991, 48, 33–49. [Google Scholar] [CrossRef]
  21. Zollo, A.; Maercklin, N.; Vassallo, M.; Dello Iacono, D.; Virieux, J.; Gasparini, P. Seismic reflections reveal a massive melt layer feeding Campi Flegrei caldera. Geophys. Res. Lett. 2008, 35, L12306. [Google Scholar] [CrossRef]
  22. EMODnet Consortium. Available online: https://www.emodnet-bathymetry.eu/ (accessed on 12 April 2025).
  23. Principe, C.; Rosi, M.; Sbrana, A.; Zan, L. Geological and gravimetric map of Phlegrean Fields, scale 1:15,000. In Phlegrean Fields, Progetto Finalizzato ‘Geodinamica’, Monografie Finali; Quaderni de “La Ricerca Scientifica”; Rosi, M., Sbrana, A., Eds.; Consiglio Nazionale delle Ricerche: Roma, Italy, 1987; Volume 9. [Google Scholar]
  24. Giaccio, B.; Hajdas, I.; Isaia, R.; Deino, A.; Nomade, S. High-precision 14C and 40Ar/39Ar dating of the Campanian Ignimbrite (Y-5) reconciles the timescales of climatic-cultural processes at 40 ka. Sci. Rep. 2017, 7, 45940. [Google Scholar] [CrossRef]
  25. Acocella, V. Activating and reactivating pairs of nested collapses during caldera-forming eruptions: Campi Flegrei (Italy). Geophys. Res. Lett. 2008, 35, L17304. [Google Scholar] [CrossRef]
  26. Deino, A.L.; Orsi, G.; de Vita, S.; Piochi, M. The age of the Neapolitan Yellow Tuff caldera-forming eruption (Campi Flegrei caldera-Italy) assessed by 40Ar/39Ar dating method. J. Volcanol. Geotherm. Res. 2004, 133, 157–170. [Google Scholar] [CrossRef]
  27. Lirer, L.; Luongo, G.; Scandone, R. On the volcanological evolution of Campi Flegrei. EOS Trans. Am. Geophys. Union. 1987, 68, 226–234. [Google Scholar] [CrossRef]
  28. Rosi, M.; Sbrana, A. Petrography. In Phlegrean Fields, Progetto Finalizzato ‘Geodinamica’, Monografie Finali; Quaderni de “La Ricerca, Scientifica”; Rosi, M., Sbrana, A., Eds.; Consiglio Nazionale delle Ricerche: Roma, Italy, 1987; Volume 9, pp. 60–80. [Google Scholar]
  29. Armienti, P.; Barberi, F.; Bizojard, H.; Clocchiatti, R.; Innocenti, F.; Metrich, N.; Rosi, M.; Sbrana, A. The Phlegraean Fields: Magma evolution within a shallow chamber. J. Volcanol. Geotherm. Res. 1983, 17, 289–311. [Google Scholar] [CrossRef]
  30. Rosi, M.; Sbrana, A. Description of mapped products. In Phlegrean Fields, Progetto Finalizzato ‘Geodinamica’, Monografie Finali; Quaderni de “La Ricerca, Scientifica”; Rosi, M., Sbrana, A., Eds.; Consiglio Nazionale delle Ricerche: Roma, Italy, 1987; Volume 9, pp. 39–60. [Google Scholar]
  31. Cipriani, F.; Marianelli, P.; Sbrana, A. Studio di una sequenza piroclastica del vulcano della Solfatara (Campi Flegrei). Considerazioni vulcanologiche e sul sistema di alimentazione. Atti Soc. Tosc. Sci. Nat. Mem. Serie A 2008, 113, 39–48. [Google Scholar]
  32. Isaia, R.; Vitale, S.; Di Giuseppe, M.G.; Iannuzzi, E.; D’Assisi, T.F.; Troiano, A. Stratigraphy, structure, and volcano-tectonic evolution of Solfatara maar-diatreme (Campi Flegrei, Italy). Geol. Soc. Am. Bull. 2015, 127, 1485–1504. [Google Scholar] [CrossRef]
  33. Principe, C. Managing different eruptive scenarios at Phlegraean Fields and Vesuvius. In Proceedings of the EGU General Assembly, EGU24-22302. Vienna, Austria, 14–19 April 2024. EGU24-22302. [Google Scholar] [CrossRef]
  34. Smith, V.C.; Isaia, R.; Pearce, N.J.G. Tephrostratigraphy and glass compositions of post-15 kyr Campi Flegrei eruptions: Implications for eruption history and chronostratigraphic markers. Quat. Sci. Rev. 2011, 30, 3638–3660. [Google Scholar] [CrossRef]
  35. Guidoboni, E.; Ciuccarelli, C. The Campi Flegrei caldera: Historical revision and new data on seismic crises, bradyseisms, the Monte Nuovo eruption and ensuing earthquakes (twelfth century 1582 AD). Bull. Volcanol. 2011, 73, 655–677. [Google Scholar] [CrossRef]
  36. Parascandola, A. I fenomeni bradisismici del Serapeo di Pozzuoli; Genovese, G., Ed.; Guida Editori: Napoli, Italy, 1947; pp. 1–156. [Google Scholar]
  37. Sbrana, A.; Marianelli, P.; Pasquini, G. The Phlegrean Fields volcanological evolution. J. Maps 2021, 17, 545–558. [Google Scholar] [CrossRef]
  38. Lyell, C. Principles of Geology; Murray, J., Ed.; Penguin Classics: London, UK, 1830; Volume 1, pp. 489–498. [Google Scholar]
  39. Del Gaudio, C.; Aquino, I.; Ricciardi, G.P.; Ricco, C.; Scandone, R. Unrest episodes at Campi Flegrei: A reconstruction of vertical ground movements during 1905–2009. J. Volcanol. Geotherm. Res. 2010, 195, 48–56. [Google Scholar] [CrossRef]
  40. De Martino, P.; Tammaro, U.; Obrizzo, F. GPS time series at Campi Flegrei caldera (2000–2013). Ann. Geophys. 2014, 57, 0213. [Google Scholar] [CrossRef]
  41. Tramelli, A.; Godano, C.; Ricciolino, P.; Giudicepietro, F.; Caliro, S.; Orazi, M.; De Martino, P.; Chiodini, G. Statistics of seismicity to investigate the Campi Flegrei caldera unrest. Sci. Rep. 2021, 11, 7211. [Google Scholar] [CrossRef] [PubMed]
  42. INGV—Osservatorio Vesuviano, Bollettino di Sorveglianza, Campi Flegrei, Marzo 2025. Available online: https://www.ov.ingv.it/index.php/monitoraggio-e-infrastrutture/bollettini-tutti/bollett-mensili-cf/anno-2025-3/1754-bollettino-mensile-campi-flegrei-2025-03/file (accessed on 12 April 2025).
  43. D’Auria, L.; Pepe, S.; Castaldo, R.; Giudicepietro, F.; Macedonio, G.; Ricciolino, P.; Tizzani, P.; Casu, F.; Lanari, R.; Manzo, M.; et al. Magma injection beneath the urban area of Naples: A new mechanism for the 2012–2013 volcanic unrest at Campi Flegrei caldera. Sci. Rep. 2015, 5, 13100. [Google Scholar] [CrossRef]
  44. Todesco, M. Signals from the Campi Flegrei hydrothermal system: Role of a “magmatic” source of fluids. J. Geophys. Res. Solid. Earth 2009, 114, B05201. [Google Scholar] [CrossRef]
  45. Piochi, M.; Mormone, A.; Balassone, G.; Strauss, H.; Troise, C.; De Natale, G. Native sulfur, sulfates and sulfides from the active Campi Flegrei volcano (southern Italy): Genetic environments and degassing dynamics revealed by mineralogy and isotope geochemistry. J. Volcanol. Geotherm. Res. 2015, 304, 180–193. [Google Scholar] [CrossRef]
  46. Chiodini, G.; Frondini, F.; Cardellini, C.; Granieri, D.; Marini, L.; Ventura, G. CO2 degassing and energy release at Solfatara volcano, Campi Flegrei, Italy. J. Geophys. Res. 2001, 106, 16213–16222. [Google Scholar] [CrossRef]
  47. Cardellini, C.; Chiodini, G.; Frondini, F.; Avino, R.; Bagnato, E.; Caliro, S.; Lelli, M.; Rosiello, A. Monitoring diffuse volcanic degassing during volcanic unrests: The case of Campi Flegrei (Italy). Sci. Rep. 2017, 7, 6757. [Google Scholar] [CrossRef]
  48. Zollo, A.; Judenherc, S.; Auger, E.; D’Auria, L.; Virieux, J.; Capuano, P.; Chiarabba, C.; de Franco, R.; Makris, J.; Michelini, A.; et al. Evidence for the buried rim of Campi Flegrei caldera from 3-d active seismic imaging. Geophys. Res. Lett. 2003, 30. [Google Scholar] [CrossRef]
  49. Judenherc, S.; Zollo, A. The Bay of Naples (southern Italy): Constraints on the volcanic structures inferred from a dense seismic survey. J. Geophys. Res. Solid. Earth 2004, 109, B10312. [Google Scholar] [CrossRef]
  50. Vanorio, T.; Virieux, J.; Capuano, P.; Russo, G. Three-dimensional seismic tomography from P wave and S wave microearthquake travel times and rock physics characterization of the Campi Flegrei Caldera. J. Geophys. Res. Solid. Earth 2005, 110. [Google Scholar] [CrossRef]
  51. Chiarabba, C.; Moretti, M. An insight into the unrest phenomena at the Campi Flegrei caldera from Vp and Vp/Vs tomography. Terra Nova 2006, 18, 373–379. [Google Scholar] [CrossRef]
  52. Battaglia, J.; Zollo, A.; Virieux, J.; Dello Iacono, D. Merging active and passive data sets in traveltime tomography: The case study of Campi Flegrei caldera southern Italy. Geophys. Prospect. 2008, 56, 555–573. [Google Scholar] [CrossRef]
  53. De Siena, L.; Chiodini, G.; Vilardo, G.; Del Pezzo, E.; Castellano, M.; Colombelli, S.; Tisato, N.; Ventura, G. Source and dynamics of a volcanic caldera unrest: Campi Flegrei, 1983–1984. Sci. Rep. 2017, 7, 8099. [Google Scholar] [CrossRef]
  54. Capuano, P.; Russo, G.; Civetta, L.; Orsi, G.; D’Antonio, M.; Moretti, R. The active portion of the Campi Flegrei caldera structure imaged by 3-D inversion of gravity data. Geochem. Geophys. Geosyst. 2013, 14, 4681–4697. [Google Scholar] [CrossRef]
  55. Ambrosio, M.; Doveri, M.; Fagioli, M.T.; Marini, L.; Principe, C.; Raco, B. Water–rock interaction in the magmatic-hydrothermal system of Nisyros Island (Greece). J. Volcanol. Geotherm. Res. 2010, 192, 7–68. [Google Scholar] [CrossRef]
  56. Kerrick, D.M. The genesis of zoned skarns in the Sierra Nevada, California. J. Petrol. 1977, 18, 144–181. [Google Scholar] [CrossRef]
  57. Caliro, S.; Chiodini, G.; Paonita, A. Geochemical evidences of magma dynamics at Campi Flegrei (Italy). Geochim. Cosmochim. Acta 2014, 132, 1–15. [Google Scholar] [CrossRef]
  58. Marini, L.; Principe, C.; Lelli, M. The Solfatara Magmatic-Hydrothermal System: Geochemistry, Geothermometry and Geobarometry of Fumarolic Fluids; Springer Nature: Cham, Switzerland, 2022; p. 375. [Google Scholar]
  59. Cioni, R.; Corazza, E.; Marini, L. The gas/steam ratio as indicator of heat transfer at the Solfatara fumaroles, Phlegraean Fields (Italy). Bull. Volcanol. 1984, 47, 295–302. [Google Scholar] [CrossRef]
  60. Cioni, R.; Corazza, E.; Fratta, M.; Guidi, M.; Magro, G.; Marini, L. Geochemical precursors at Solfatara Volcano, Pozzuoli (Italy). In Volcanic Hazards; Latter, J.H., Ed.; Springer: Berlin, Germany, 1989; Volume 1, pp. 384–398. [Google Scholar]
  61. Chiodini, G.; Marini, L. Hydrothermal gas equilibria: The H2O-H2-CO2-CO-CH4 system. Geochim. Cosmochim. Acta 1998, 62, 2673–2687. [Google Scholar] [CrossRef]
  62. Caliro, S.; Chiodini, G.; Moretti, R.; Avino, R.; Granieri, D.; Russo, M.; Fiebig, J. The origin of the fumaroles of La Solfatara (Campi Flegrei, south Italy). Geochim. Cosmochim. Acta 2007, 71, 3040–3055. [Google Scholar] [CrossRef]
  63. Chiodini, G. CO2/CH4 ratio in fumaroles a powerful tool to detect magma degassing episodes atn quiescent volcanoes. Geophys. Res. Lett. 2009, 36, L02302. [Google Scholar] [CrossRef]
  64. Chiodini, G.; Caliro, S.; Cardellini, C.; Granieri, D.; Avino, R.; Baldini, A.; Donnini, M.; Minopoli, C. Long-term variations of the Campi Flegrei, Italy, volcanic system as revealed by the monitoring of hydrothermal activity. J. Geophys. Res. Solid. Earth 2010, 115, B03205. [Google Scholar] [CrossRef]
  65. Chiodini, G.; Avino, R.; Caliro, S.; Minopoli, C. Temperature and pressure gas geoindicators at the Solfatara fumaroles (Campi Flegrei). Ann. Geophys. 2011, 54, 151–160. [Google Scholar] [CrossRef]
  66. Chiodini, G.; Caliro, S.; De Martino, P.; Avino, R.; Gherardi, F. Early signals of new volcanic unrest at Campi Flegrei caldera? Insights from geochemical data and physical simulations. Geology 2012, 40, 943–946. [Google Scholar] [CrossRef]
  67. Chiodini, G.; Vandemeulebrouck, J.; Caliro, S.; D’Auria, L.; De Martino, P.; Mangiacapra, A.; Petrillo, Z. Evidence of thermal-driven processes triggering the 2005–2014 unrest at Campi Flegrei caldera. Earth Planet. Sci. Lett. 2015, 414, 58–67. [Google Scholar] [CrossRef]
  68. Chiodini, G.; Paonita, A.; Aiuppa, A.; Costa, A.; Caliro, S.; De Martino, P.; Acocella, V.; Vandemeulebrouck, J. Magmas near the critical degassing pressure drive volcanic unrest towards a critical state. Nat. Commun. 2016, 7, 13712. [Google Scholar] [CrossRef]
  69. Chiodini, G.; Selva, J.; Del Pezzo, E.; Marsan, D.; De Siena, L.; D’Auria, L.; Bianco, F.; Caliro, S.; De Martino, P.; Ricciolino, P.; et al. Clues on the origin of post-2000 earthquakes at Campi Flegrei caldera (Italy). Sci. Rep. 2017, 7, 4472. [Google Scholar] [CrossRef]
  70. Chiodini, G.; Giudicepietro, F.; Vandemeulebrouck, J.; Aiuppa, A.; Caliro, S.; De Cesare, W.; Tamburello, G.; Avino, R.; Orazi, M.; D’Auria, L. Fumarolic tremor and geochemical signals during a volcanic unrest. Geology 2017, 45, 1131–1134. [Google Scholar] [CrossRef]
  71. Chiodini, G.; Caliro, S.; Avino, R.; Bini, G.; Giudicepietro, F.; De Cesare, W.; Ricciolino, P.; Aiuppa, A.; Cardellini, C.; Petrillo, Z.; et al. Hydrothermal pressure-temperature control on CO2 emissions and seismicity at Campi Flegrei (Italy). J. Volcanol. Geotherm. Res. 2021, 414, 107245. [Google Scholar] [CrossRef]
  72. Buono, G.; Caliro, S.; Paonita, A.; Pappalardo, L.; Chiodini, G. Discriminating carbon dioxide sources during volcanic unrest: The case of Campi Flegrei caldera (Italy). Geology 2023, 51, 397–401. [Google Scholar] [CrossRef]
  73. Lelli, M.; Caliro, S.; Dallara, E.; Chiodini, G.; Marini, L. Sulphur trace components in La Solfatara and Vulcano volcanic gases: Searching for suitable new geo-indicators. In Proceedings of the EGU General Assembly, Vienna, Austria, 23–28 April 2023. EGU-4492. [Google Scholar] [CrossRef]
  74. Symonds, R.B.; Gerlach, T.M.; Reed, M.H. Magmatic gas scrubbing: Implications for volcano monitoring. J. Volcanol. Geotherm. Res. 2001, 108, 303–341. [Google Scholar] [CrossRef]
  75. Marini, L.; Gambardella, B. Geochemical modeling of magmatic gas scrubbing. Ann. Geophys. 2005, 48, 739–753. [Google Scholar] [CrossRef]
  76. Piochi, M.; Cantucci, B.; Montegrossi, G.; Currenti, G. Hydrothermal alteration at the San Vito area of the Campi Flegrei geothermal system in Italy: Mineral review and geochemical modeling. Minerals 2021, 11, 810. [Google Scholar] [CrossRef]
  77. Giggenbach, W.F. Redox processes governing the chemistry of fumarolic gas discharges from White Island, New Zeland. Appl. Geochem. 1987, 2, 143–161. [Google Scholar] [CrossRef]
  78. Allard, P.; Maiorani, A.; Tedesco, D.; Cortecci, G.; Turi, B. Isotopic study of the origin of sulfur and carbon in Solfatara fumaroles, Campi Flegrei caldera. J. Volcanol. Geotherm. Res. 1991, 48, 139–159. [Google Scholar] [CrossRef]
  79. Buono, G.; Paonita, A.; Pappalardo, L.; Caliro, S.; Tramelli, A.; Chiodini, G. New insights into the recent magma dynamics under Campi Flegrei caldera (Italy) from petrological and geochemical evidence. J. Geophys. Res. Solid. Earth 2022, 127, e2021JB023773. [Google Scholar] [CrossRef]
  80. Huebner, J.S.; Sato, M. The oxygen fugacity-temperature relationships of manganese oxide and nickel oxide buffers. Am. Mineral. 1970, 55, 934–952. [Google Scholar]
  81. Myers, J.T.; Eugster, H.P. The system Fe-Si-O: Oxygen buffer calibrations to 1,500 K. Contrib. Mineral. Petrol. 1983, 82, 75–90. [Google Scholar] [CrossRef]
  82. Stull, D.R.; Westrum, E.F.; Sinke, G.C. The Chemical Thermodynamics of Organic Compounds; Wiley: New York, NY, USA, 1969; p. 882. [Google Scholar]
  83. Ding, S.; Plank, T.; Wallace, P.J.; Rasmussen, D.J. Sulfur_X: A model of sulfur degassing during magma ascent. Geochem. Geophys. Geosystems 2023, 24, e2022GC010552. [Google Scholar] [CrossRef]
  84. Hutchison, W.; Finch, A.A.; Boyce, A.J. The sulfur isotope evolution of magmatic-hydrothermal fluids: Insights into ore-forming processes. Geochim. Cosmochim. Acta 2020, 288, 176–198. [Google Scholar] [CrossRef]
  85. Fiege, A.; Holtz, F.; Shimizu, N.; Mandeville, C.W.; Behrens, H.; Knipping, J.L. Sulfur isotope fractionation between fluid and andesitic melt: An experimental study. Geochim. Cosmochim. Acta 2014, 142, 501–521. [Google Scholar] [CrossRef]
  86. Miyoshi, T.; Sakai, H.; Chiba, H. Experimental-study of sulfur isotope fractionation factors between sulfate and sulfide in high-temperature melts. Geochem. J. 1984, 18, 75–84. [Google Scholar] [CrossRef]
  87. Ohmoto, H.; Rye, R.O. Isotopes of sulfur and carbon. In Geochemistry of Hydrothermal Ore Deposits, 2nd ed.; Barnes, H.L., Ed.; Wiley: New York, NY, USA, 1979; pp. 509–567. [Google Scholar]
  88. Eldridge, D.L.; Guo, W.; Farquhar, J. Theoretical estimates of equilibrium sulfur isotope effects in aqueous sulfur systems: Highlighting the role of isomers in the sulfite and sulfoxylate systems. Geochim. Cosmochim. Acta 2016, 195, 171–200. [Google Scholar] [CrossRef]
  89. Giggenbach, W.F. Chemical composition of volcanic gases. In Monitoring and Mitigation of Volcano Hazards; Scarpa, R., Tilling, R.I., Eds.; Springer: Berlin, Germany, 1996; pp. 221–256. [Google Scholar]
  90. Giggenbach, W.F. The origin and evolution of fluids in magmatic-hydrothermal systems. In Geochemistry of Hydrothermal Ore Deposits, 3rd ed.; Barnes, H.L., Ed.; Wiley: New York, NY, USA, 1997; pp. 737–796. [Google Scholar]
  91. Moretti, R.; Ottonello, G. Polymerization and disproportionation of iron and sulfur in silicate melts: Insights from an optical basicity-based approach. J. Non-Cryst. Solids 2003, 323, 111–119. [Google Scholar] [CrossRef]
  92. Moretti, R.; Ottonello, G. A polymeric approach to the sulfide capacity of silicate slags and melts. Metall. Mater. Trans. 2003, 34, 399–410. [Google Scholar] [CrossRef]
  93. Moretti, R.; Ottonello, G. Solubility and speciation of sulfur in silicate melts: The Conjugated Toop-Samis-Flood-Grjotheim (CTSFG) model. Geochim. Cosmochim. Acta 2005, 69, 801–823. [Google Scholar] [CrossRef]
  94. Holland, H.D. Some applications of thermochemical data to problems of ore deposits. II. Mineral assemblages and the composition of ore forming fluids. Econ. Geol. 1965, 60, 1101–1166. [Google Scholar] [CrossRef]
  95. Ármannsson, H.; Gíslason, G.; Hauksson, T. Magmatic gases in well fluids aid the mapping of the flow pattern in a geothermal system. Geochim. Cosmochim. Acta 1982, 46, 167–177. [Google Scholar] [CrossRef]
  96. Sturchio, N.C.; Williams, S.N.; Garcia, N.P.; Londono, A.C. The hydrothermal system of Nevado del Ruiz volcano, Colombia. Bull. Volcanol. 1988, 50, 399–412. [Google Scholar] [CrossRef]
  97. Williams, S.N.; Sturchio, N.C.; Mendez, R.; Londoño, A.; García, N. Sulfur dioxide from Nevado del Ruiz volcano, Colombia: Total flux and isotopic constraints on its origin. J. Volcanol. Geotherm. Res. 1990, 42, 53–68. [Google Scholar] [CrossRef]
  98. Reed, M.H. Hydrothermal alteration and its relationship to ore fluid composition. In Geochemistry of Hydrothermal Ore Deposits, 3rd ed.; Barnes, H.L., Ed.; Wiley: New York, NY, USA, 1997; pp. 303–366. [Google Scholar]
  99. Marini, L.; Gambardella, B.; Principe, C.; Arias, A.; Brombach, T.; Hunziker, J.C. Characterization of magmatic sulfur in the Aegean Island arc by means of the δ34S values of fumarolic H2S, elemental S, and hydrothermal gypsum from Nisyros and Milos Islands. Earth Planet. Sci. Lett. 2002, 200, 15–31. [Google Scholar] [CrossRef]
  100. Marini, L.; Yock Fung, A.; Sanchez, E. Use of reaction path modeling to identify the processes governing the generation of neutral Na-Cl and acidic Na-Cl-SO4 deep geothermal liquids at Miravalles geothermal system, Costa Rica. J. Volcanol. Geotherm. Res. 2003, 128, 363–387. [Google Scholar] [CrossRef]
  101. Ayris, P.M.; Lee, A.F.; Wilson, K.; Kueppers, U.; Dingwell, D.B.; Delmelle, P. SO2 sequestration in large volcanic eruptions: High-temperature scavenging by tephra. Geochim. Cosmochim. Acta 2013, 110, 58–69. [Google Scholar] [CrossRef]
  102. Henley, R.W.; King, P.L.; Wykes, J.L.; Renggli, C.J.; Brink, F.J.; Clark, D.A.; Troitzsch, U. Porphyry copper deposit formation by sub-volcanic sulphur dioxide flux and chemisorption. Nat. Geosci. 2015, 8, 210–215. [Google Scholar] [CrossRef]
  103. Renggli, C.J.; King, P.L.; Henley, R.W.; Guagliardo, P.; McMorrow, L.; Middleton, J.P.; Turner, M. An experimental study of SO2 reactions with silicate glasses and supercooled melts in the system anorthite–diopside–albite at high temperature. Contrib. Mineral. Petrol. 2019, 174, 3. [Google Scholar] [CrossRef]
  104. Delmelle, P.; Wadsworth, F.B.; Maters, E.C.; Ayris, P.M. High temperature uptake of volcanic gases on ash in eruption plumes. Rev. Mineral. Geochem. 2018, 84, 285–308. [Google Scholar] [CrossRef]
  105. Maters, E.C.; Delmelle, P.; Rossi, M.J.; Ayris, P.M. Reactive uptake of sulfur dioxide and ozone on volcanic glass and ash at ambient temperature. J. Geophys. Res. Atmos. 2017, 122, 10077–10088. [Google Scholar] [CrossRef]
  106. Renggli, C.J.; King, P.L. SO2 gas reactions with silicate glasses. Rev. Mineral. Geochem. 2018, 84, 229–256. [Google Scholar] [CrossRef]
  107. Henley, R.W.; Brink, F.J.; King, P.L.; Leys, C.; Ganguly, J.; Mernagh, T.; Middleton, J.; Renggli, C.J.; Sieber, M.; Troitzsch, U.; et al. High temperature gas–solid reactions in calc–silicate Cu–Au skarn formation; Ertsberg, Papua Province, Indonesia. Contrib. Mineral. Petrol. 2017, 172, 106. [Google Scholar] [CrossRef]
  108. Henley, R.W.; Seward, T.M. Gas–solid reactions in arc volcanoes: Ancient and modern. Rev. Mineral. Geochem. 2018, 84, 309–350. [Google Scholar] [CrossRef]
  109. Henley, R.W.; Fischer, T.P. Sulfur sequestration and redox equilibria in volcanic gases. J. Volcanol. Geotherm. Res. 2021, 414, 107181. [Google Scholar] [CrossRef]
  110. Saadatfar, M.; Brink, F.; Latham, S.; King, P.; Middleton, J.; Troitzsch, U.; Turner, M.; Henley, R.W. High resolution 3D mapping of grain kinematics during high temperature sequestration of SO2 from flue gas by carbonate aggregates. Sci. Rep. 2020, 10, 2201. [Google Scholar] [CrossRef] [PubMed]
  111. Newman, E.S. Behavior of calcium sulfate at high temperatures. J. Res. Nat. Bur. Stand. 1941, 27, 191–196. [Google Scholar] [CrossRef]
  112. Krejsová, J.; Kužel, R.; Keppert, M.; Scheinherrová, L.; Vimmrová, A. New insight into the phase changes of gypsum. Mater. Struct. 2024, 57, 128. [Google Scholar] [CrossRef]
  113. Clark, I.D. Isotope fractionation. In Encyclopedia of Geochemistry. Marshall, C.P., Fairbridge, R.W., Eds; Springer: Dordrecht, The Netherlands, 1998; pp. 354–357. [Google Scholar] [CrossRef]
  114. Hong, Y.; Fegley, B., Jr. The kinetics and mechanism of pyrite thermal decomposition. Berichte Bunsenges. Phys. Chem. 1997, 101, 1870–1881. [Google Scholar] [CrossRef]
  115. Schwab, G.M.; Philinis, J. Reactions of iron pyrite: Its thermal decomposition, reduction by hydrogen and air oxidation. J. Am. Chem. Soc. 1947, 69, 2588–2596. [Google Scholar] [CrossRef]
  116. Fournier, R.O. Hydrothermal processes related to movement of fluid from plastic into brittle rock in the magmatic-epithermal environment. Econ. Geol. 1999, 94, 1193–1211. [Google Scholar] [CrossRef]
  117. Reyes, A.G.; Giggenbach, W.F.; Saleras, J.R.; Salonga, N.D.; Vergara, M.C. Petrology and geochemistry of Alto Peak, a vapor-cored hydrothermal system, Leyte Province, Philippines. Geothermics 1993, 22, 479–519. [Google Scholar] [CrossRef]
  118. Marini, L.; Chiodini, G. The role of carbon dioxide in the carbonate-evaporite geothermal systems of Tuscany and Latium (Italy). Acta Vulcanol. 1994, 5, 95–104. [Google Scholar]
  119. Cavarretta, G.; Gianelli, G.; Scandiffio, G.; Tecce, F. Evolution of the Latera geothermal system II: Metamorphic, hydrothermal mineral assemblages and fluid chemistry. J. Volcanol. Geotherm. Res. 1985, 26, 337–364. [Google Scholar] [CrossRef]
  120. Turbeville, B.N. Sidewall differentiation in an alkalic magma chamber: Evidence from syenite xenoliths in tuffs of the Latera caldera, Italy. Geol. Mag. 1993, 130, 453–470. [Google Scholar] [CrossRef]
  121. Browne, P.R.L.; Ellis, A.J. The Ohaaki-Broadlands hydrothermal area, New Zealand: Mineralogy and related geochemistry. Am. J. Sci. 1970, 269, 97–131. [Google Scholar] [CrossRef]
  122. Kristmannsdóttir, H. Alteration of basaltic rocks by hydrothermal activity at 100–300 °C. In International Clay Conference 1978, Proceedings of the VI International Clay Conference 1978, Oxford, UK, 10–14 July, 1978; Mortland, M.M., Farmer, V.C., Eds.; Elsevier: Amsterdam, The Netherlands, 1979; Volume 27, pp. 359–367. [Google Scholar]
  123. Browne, P.R.L. Hydrothermal alteration in active geothermal fields. Annu. Rev. Earth. Pl. Sc. 1978, 6, 229–248. [Google Scholar] [CrossRef]
  124. Reyes, A.G. Petrology of Philippine geothermal systems and the application of alteration mineralogy to their assessment. J. Volcanol. Geotherm. Res. 1990, 43, 279–309. [Google Scholar] [CrossRef]
  125. Balducci, S.; Chelini, W. Hydrothermal equilibria in the active Mofete geothermal system, Phlegraean Fields, Naples, Italy. Acta Vulcanol. 1992, 2, 17–34. [Google Scholar]
Figure 1. (a) The regional digital elevation model of the Campanian Plain by the EMODnet consortium [22]. The square delimits the area of the map in (b). (b) Geological and structural sketch map of Campi Flegrei. Legend 1 = quaternary undifferentiated deposits, areas of strong anthropization, soil cover; 2 = products of the post-caldera subaerial recent activity; 3 = products of the post-caldera mainly subaerial ancient activity; 4 = products of the post-caldera mainly submarine activity (Neapolitan Yellow Tuff deposits); 5 = products of the subaerial pre-caldera activity; 6 = volcanic vents; 7 = main faults and fractures; 8 = Campi Flegrei caldera rim; 9 = post-caldera volcano-tectonic collapses; 10 = craters; 11 = Starza marine terrace. [23], modified.
Geosciences 15 00162 g001
Figure 2. The conceptual model cross-section of the Solfatara magmatic–hydrothermal system at Campi Flegrei caldera, showing its component units. From Marini et al. [16], licensed under a Creative Commons Attribution 4.0 CC BY International License.
Geosciences 15 00162 g002
Figure 3. The time plot showing the δ34S values of H2S predicted by our model at the outlet of the deep hydrothermal reservoir of the Solfatara magmatic–hydrothermal system and the δ34S values of H2S measured in the Bocca Grande fumarolic effluents.
Geosciences 15 00162 g003
Figure 4. The fraction of S remaining in the melt is contrasted with the δ34S values predicted by our model for the melt, for H2S, SO2, and total gaseous S in the gas separated from the melt and at the inlet of the deep hydrothermal reservoir, as well as for H2S at the outlet of the deep hydrothermal reservoir of the Solfatara magmatic–hydrothermal system. Also shown are the δ 34 S H 2 S values measured in the Bocca Grande fumarolic effluents.
Geosciences 15 00162 g004
Figure 5. The fraction of S remaining in the melt is contrasted with the cumulative concentration of H2S at the surface and the cumulative concentrations of H2S, SO2, and total gaseous S at the inlet of the deep hydrothermal reservoir of the Solfatara magmatic–hydrothermal system.
Geosciences 15 00162 g005
Figure 6. The time plot of the flow of H2S at the surface, the flows of H2S, SO2, and total gaseous S at the inlet of the deep hydrothermal reservoir, and the flow of anhydrite deposited in the deep hydrothermal reservoir of the Solfatara magmatic–hydrothermal system.
Geosciences 15 00162 g006
Figure 7. The time plot of the fraction of sulfur remaining in the melt situated at depths ≥ 8 km in the Solfatara magmatic–hydrothermal system.
Geosciences 15 00162 g007
Disclaimer/Publisher’s Note: The statements, opinions and data contained in all publications are solely those of the individual author(s) and contributor(s) and not of MDPI and/or the editor(s). MDPI and/or the editor(s) disclaim responsibility for any injury to people or property resulting from any ideas, methods, instructions or products referred to in the content.

