Technical Note

EGMStream Webapp: EGMS Data Downstream Solution

by
Francesco Becattini
1,
Camilla Medici
1,
Davide Festa
2 and
Matteo Del Soldato
1,*
1
Earth Sciences Department, University of Firenze, Via G. La Pira 4, 50121 Firenze, Italy
2
Department of Geodesy and Geoinformation, Vienna University of Technology, 1040 Vienna, Austria
*
Author to whom correspondence should be addressed.
Geosciences 2025, 15(4), 154; https://doi.org/10.3390/geosciences15040154
Submission received: 26 February 2025 / Revised: 14 April 2025 / Accepted: 16 April 2025 / Published: 17 April 2025

Abstract

:
The European Ground Motion Service (EGMS), part of the Copernicus Land Monitoring Service (CLMS), provides free pan-European ground motion data to support local and regional ground deformation analyses. To enhance the accessibility and usability of EGMS products, a new webapp, EGMStream, has been developed using Python and JavaScript for downloading and converting EGMS data. This revised and updated version improves the functionality and performance of the original R-based desktop tool, avoiding the need for a standalone software installation. Users can now simply access the webapp with an internet connection. In addition, the web version enhances data processing by leveraging high-performance server-side computing without relying on personal computer resources. The EGMStream webapp offers advanced features, including the parallel processing of large datasets and extraction of converted EGMS data for areas of interest (AoI) in various GIS-compatible formats. The transition from standalone software to a cloud-based system streamlines the integration of EGMS data into existing workflows, broadens user accessibility, and supports large-scale geospatial analysis. Consequently, this shift promotes the dissemination of these relevant and free available measurement data to a wider audience, including non-expert users.

Graphical Abstract

1. Introduction

The European Ground Motion Service (EGMS) is one of the services provided under the Copernicus Land Monitoring Service (CLMS) managed by the Environmental European Agency (EEA) of the European Union (EU) [1]. The EGMS allows the dissemination of Interferometric Synthetic Aperture Radar (InSAR) data, which is now well recognised as fundamental data by European and international scientific communities working on geohazard investigation and management as well as on remote sensing applications [2]. The primary goal of the programme is to support the health of the planet and its environment, benefiting European citizens using data collected by radar satellites for Earth Observation by the European Space Agency (ESA).
The development of the EGMS has been preceded by several national Ground Motion Services (GMSs), which laid the groundwork for this pan-European initiative. Among these, Italy played a pioneering role by launching the first GMS in 2007 at a national scale covering the period 1992–2016 [3]: the Italian Special Plan of Remote Sensing of the Environment [4]. This service relies on data from three satellite constellations: (i) ERS1/2 and (ii) Envisat, both operating in C-band (5.6 cm of wavelength) and launched by the ESA, and (iii) the COSMO-SkyMed constellation operating in the X-band (3.1 cm of wavelength) and managed by the Italian Space Agency (ASI). The Italian GMS has been the precursor of further-developed GMSs based on the Sentinel-1 constellation including the regional scale monitoring programme over the Tuscany Region [5], which in 2016 became the first satellite radar continuous monitoring service worldwide. The same initiatives have been developed in the following years by two other Italian regions [6]: Valle d’Aosta and Veneto.
In the following years, other European countries followed suit by developing similar services. Norway [7,8] and Germany, for example, launched their GMS at a national scale in 2018 [9]. Additionally, the Agency for Data Supply and Efficiency (SDFE) of Denmark worked on a WebGIS platform to provide InSAR data [10] processed using the SqueeSAR algorithm [11]. Meanwhile, in 2017, the Netherlands began implementing its own national GMS, leveraging the availability of Sentinel-1 satellite imagery.
The growing diffusion of GMSs demonstrates that the deployment of the Sentinel-1 constellation has significantly enhanced the possibility for the scientific community and for the end users, such as land managers, to identify and monitor geohazards. This advancement is attributed to the constellation nature of the background mission, its short revisit times, global coverage, and free data access. Extensive studies have highlighted its applications in landslide detection [12,13,14,15], characterisation [16,17,18] and monitoring [19,20,21], subsidence analysis [22,23,24,25,26], infrastructure monitoring [27,28,29,30], and the assessment of mining instability [31,32,33,34].
Building on the advancements of national GMSs, the EGMS has been initiated to address the growing demand for free and accessible InSAR data at a continental scale. Since November 2022, the service provides InSAR data covering the Copernicus participating countries, with yearly updates. The first dataset available, spanning 2015–2021, has been subsequently updated year by year with two releases so far: i) 2018–2022 and ii) 2019–2023. The last release comprises approximately 15 billion points, amounting to around 10 TB of downloadable data, exemplifying the scale and richness of the service for monitoring and analysing geohazards throughout Europe. Sentinel-1 data for this service are processed using four algorithms [35]: PSP-IFSAR [36,37,38], SqueeSAR [11], GSAR-GTSI [39,40], and PSI (Persistent Scatterer Interferometry), through an Integrated Wide Area Processor (IWAP) [41,42]. Nowadays, the two most recent datasets, covering 5 years each, are available, while the first dataset (2015–2022) is no longer accessible.
Specifically, the EGMS provides InSAR data at three increasing processing levels [43]: basic (L2a), GNSS-calibrated (L2b), and Ortho (L3). The L2a data deliver relative InSAR velocity and displacement information along the Line of Sight (LoS) for each Measurement Point (MP), tied to a stable reference point. The L2b data are an advanced product, offering absolute deformation maps thanks to the combination [44] with the velocities recorded by the GNSS network across Europe by the EUREF Permanent Network Densification Product Portal [45]. The L3 Ortho products provide vertical and horizontal (east–west) velocity components derived from the L2b data sampled on a regular grid with a resolution of 100 m.
On the EGMS Explorer [46], only data from the last release are available for visualization, while data from both of the last two releases are downloadable in ZIP format, which includes a CSV (Comma-Separated Values) file (.csv), after logging into the EU portal [47]. Nevertheless, the huge volume of data is hard and impractical to handle in Geographic Information System (GIS) environments, highlighting the need for a semi-automated and user-friendly approach to download and convert the data. To address this issue, the standalone software EGMStream [48] was developed in 2022, which features a visual interface to automatically download, convert, and crop data into smaller and more manageable subsets. This first version of EGMStream has been developed as a desktop application based on R and by using the Shiny package [49,50].
The increasing volume of available data, the growing number of users due to the diffusion of the EGMS, and the expanding range of potential applications have highlighted some limitations of the desktop version. Specifically, the need for local software installations and the consequent reliance on personal computer performances for downloading and processing large datasets posed significant challenges. To address these issues, a new version has been developed featuring a server-based architecture accessible through a flexible and user-friendly webapp platform interface by the link https://egmstream.unifi.it. This new approach requires only an internet connection, eliminating the need for high-performance local hardware.
The EGMStream webapp has been built in Python (version 3.13.2) and JavaScript (ECMAScript 2023) and developed using Docker (version 28.0.1) [51]. This new version introduces a scalable architecture accessible via a web browser, not requiring any user-side software installations and making EGMS data and ground deformation analysis capabilities widely accessible worldwide. Moreover, the EGMStream webapp significantly enhances data processing efficiency by enabling the parallel processing of large datasets and introducing new features.

2. Materials and Methods

The upgrading of EGMStream from the R-based desktop application to a web application involved a complete redesign of the software architecture, aimed at enhancing accessibility and operational efficiency. This transformation also improved scalability, enabling the system to support an increasing number of users and process larger datasets seamlessly by leveraging web-based and cloud resources, ensuring robust performance even under high demand. The EGMStream webapp has been developed using a client-server architecture, where the backend and frontend collaborate to deliver effective and interactive data management. Specifically, the webapp is structured into two main components: the backend, which handles all functionalities and processes, and the frontend, serving as the interface between the backend and the user, ensuring a smooth and user-friendly experience.
An additional enhancement has been made through the use of a Docker container. Docker is a software platform that enables developers to build, deploy, and run applications within lightweight, portable containers [52]. These containers encapsulate everything needed for an application to run, including code, runtime, libraries, and dependencies, ensuring consistency across different environments, from local development to cloud servers. By isolating applications within containers, Docker eliminates dependency conflicts and ensures that applications behave consistently, regardless of the host system. Containers are more resource-efficient than virtual machines, starting quickly and consuming fewer resources, making them ideal for scalable deployment. Furthermore, Docker enhances security by isolating applications, thereby reducing the risk of interference or vulnerabilities spreading between them. In essence, Docker streamlines the development and deployment process, providing a reliable, portable, and efficient framework for managing applications.
The core functionality of the EGMStream has been enhanced while maintaining its user-friendly nature and minimising the number of user inputs required. Indeed, the webapp structure involves downloading a textual (.txt) file from the EGMS Explorer and configuring several parameters to initiate the extraction and conversion of EGMS data. Once the process is completed, the user receives an email for downloading the converted data (Figure 1).

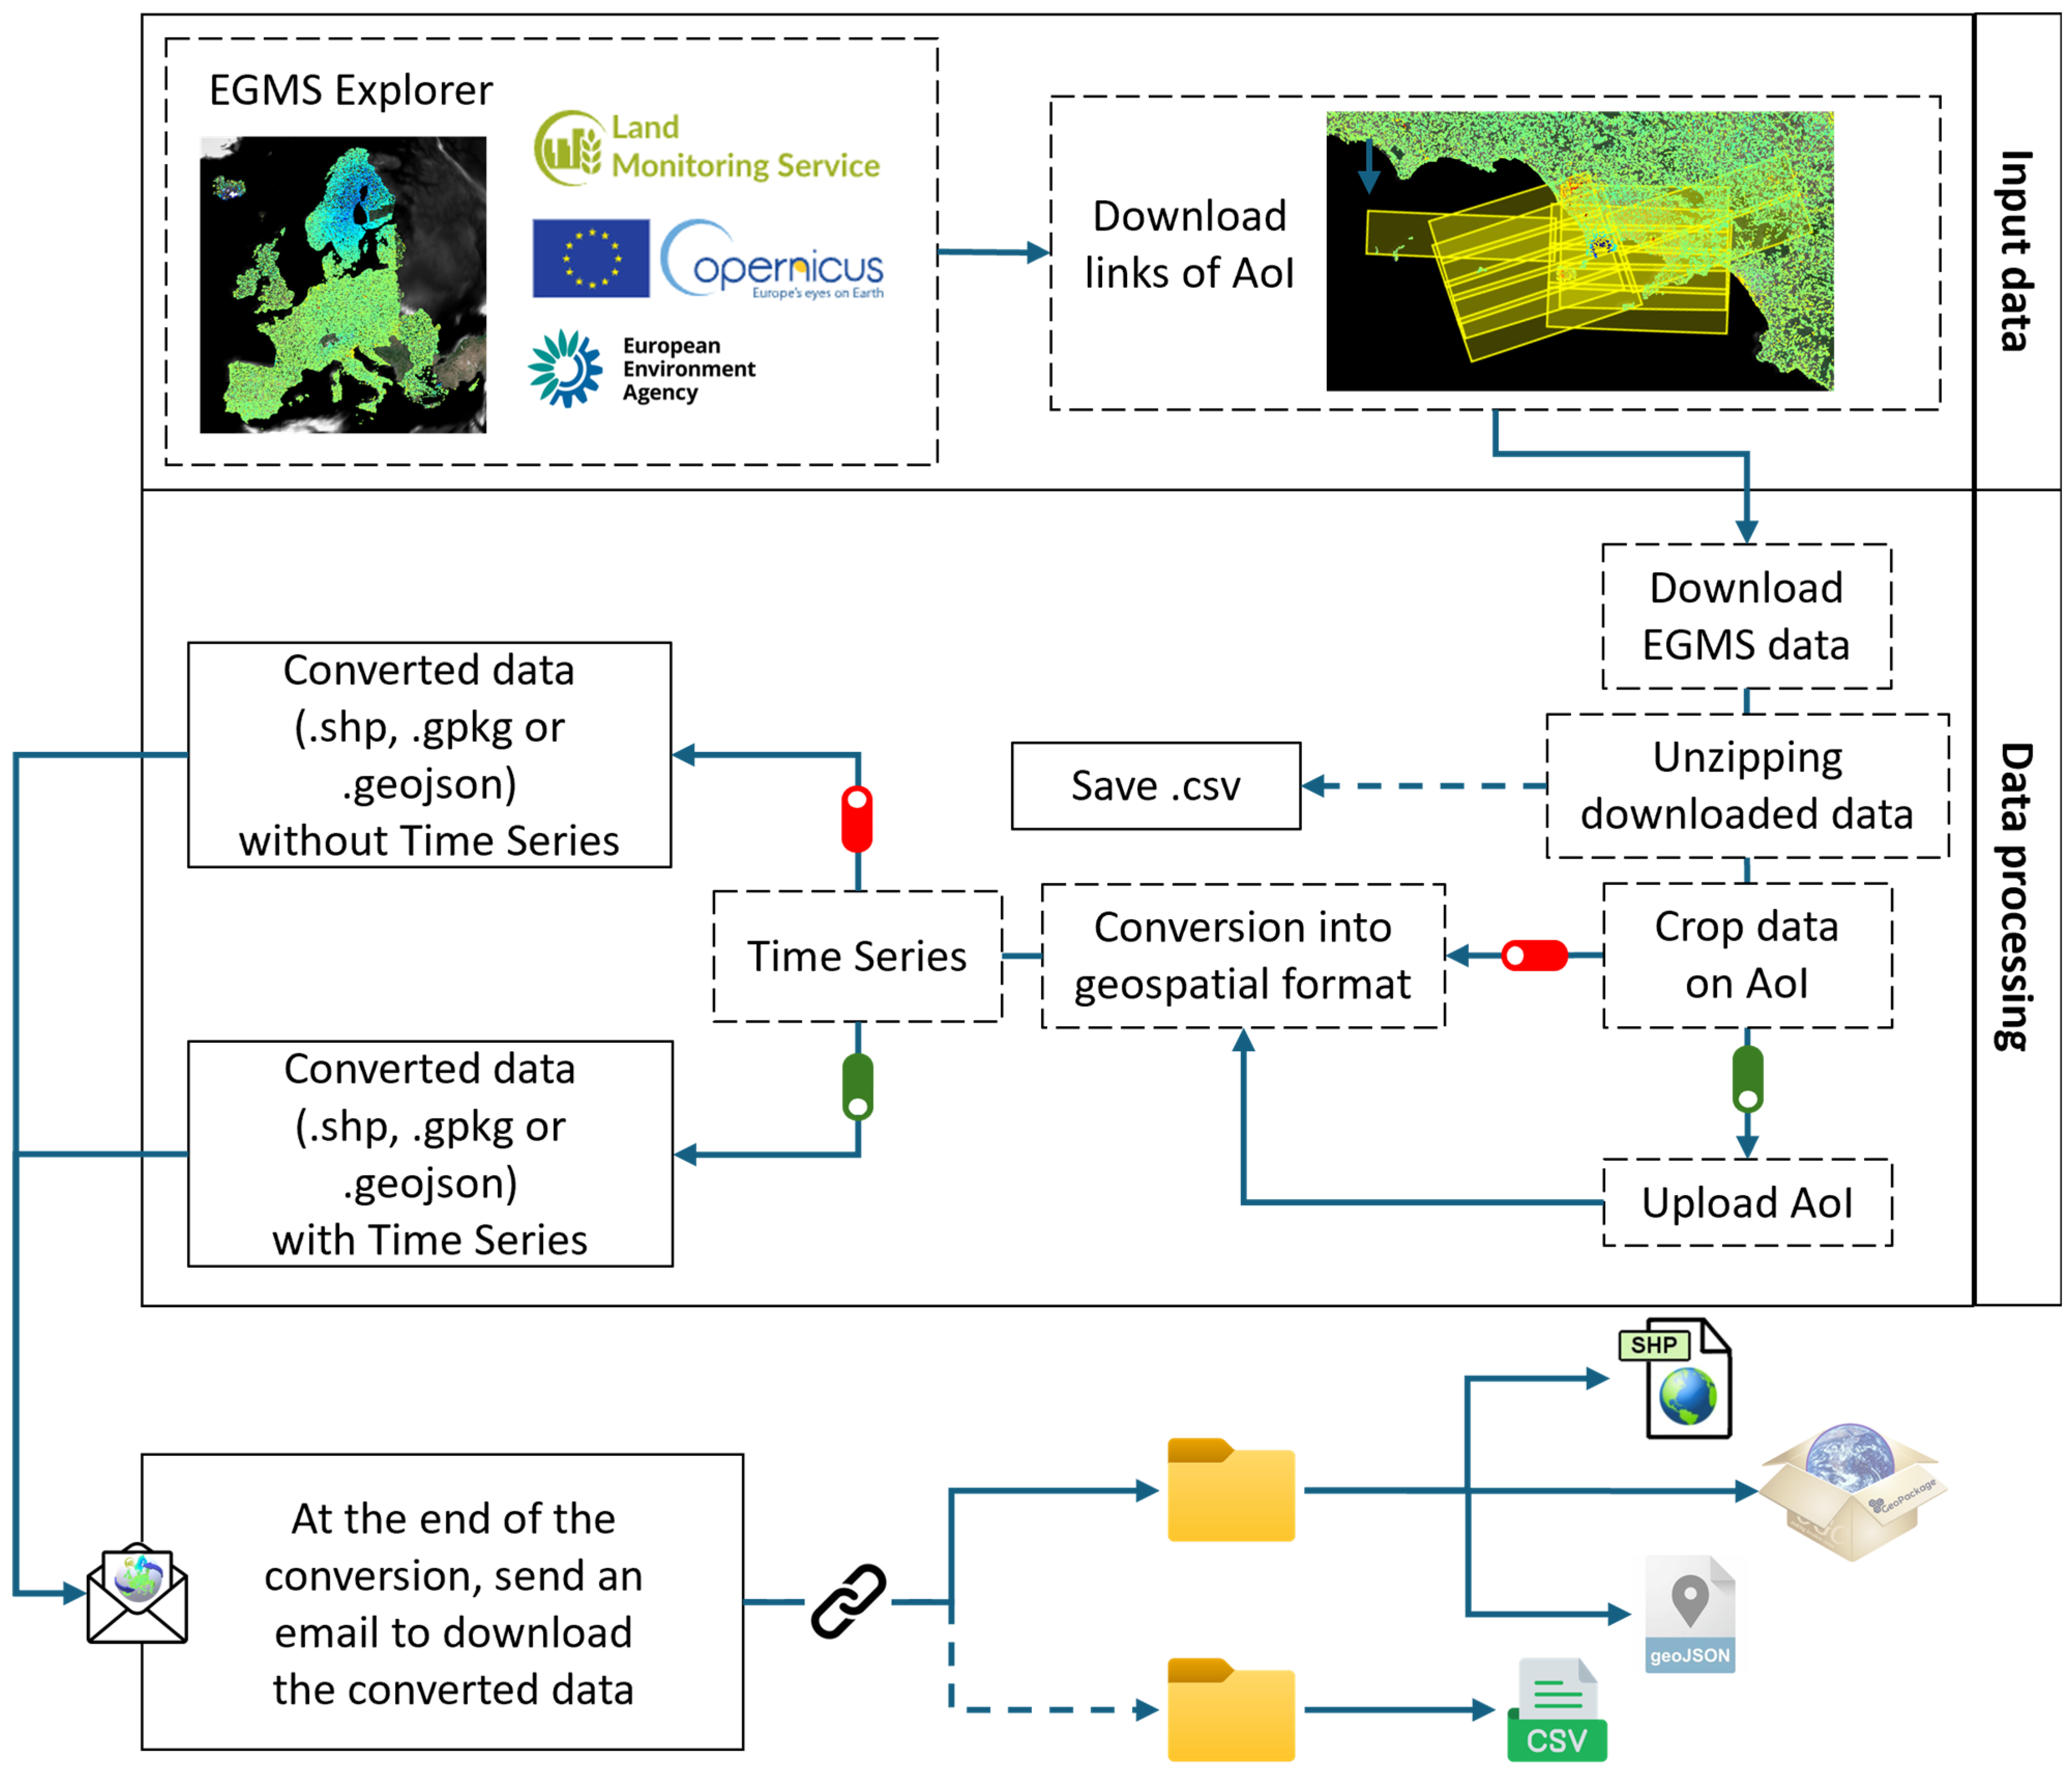
2.1. Mandatory and Optional Input Data

The application accepts two distinct types of input files to initiate the data processing workflow: (i) a mandatory input file containing links to EGMS data and (ii) an optional input file specifying the area of interest (AoI).
The mandatory file is a textual file (.txt), downloadable from the EGMS Explorer. The file contains one or more links with information on the tiles (for L3 products) or burst (for L2 data) over the area selected by the user.
The EGMS Explorer [46] can be easily accessed directly through the ‘EGMS Explorer’ button on the EGMStream webapp interface. After the registration and authentication on the EU portal, users can draw an area and choose between all the available datasets on the Explorer. To avoid downloading too much data in a single session, a limitation on area selection is imposed by the system: the spatial area must not exceed a width of 3 degrees. Once the area is selected, users have to specify the desired product type (L2a, L2b, or L3) and time of interest (2018–2022 or 2019–2023), and then clicking the ‘Download Links’ button, the system generates the .txt file containing hyperlinks to the selected products for bulk download. Each link comprises the following:
-
the link to the EEA server where the link is stored;
-
the product level, track, and internal EEA number referring to the selected tile or burst;
-
a randomly generated (non-replicable) ID token, which allows the validity of each download link only for an hour.
Even though the token is valid for one hour from the start of the download of the text file, if the download process is in progress, the token remains valid until the end of the download [53]. If the token time validity has expired, the application will be unable to start the download and data conversion cannot proceed. In this case, the user will need to download a new .txt file with updated links. The EGMStream webapp is designed to process the file downloaded from the EGMS Explorer directly. An upload control ensures that the contained links correspond to the EGMS data, and in case the uploaded .txt file contains invalid text or links, a red warning will appear, prompting the user to upload the correct file.
The webapp also allows users to crop data to a specific area by uploading an optional geospatial file. This possibility significantly enhances the flexibility and accuracy of the data clipping process. Users can define the AoI by uploading pre-existing files in widely used geospatial formats supported by Google Earth, i.e., Keyhole Markup Language (.kml), Keyhole Markup Language Zipped (.kmz), and GIS (Geographic Information System), i.e., ESRI shapefile (.shp). The shapefile (.shp) format must be uploaded in a .zip folder containing the .shp file along with the associated files (.dbf, .shx, and .prj).

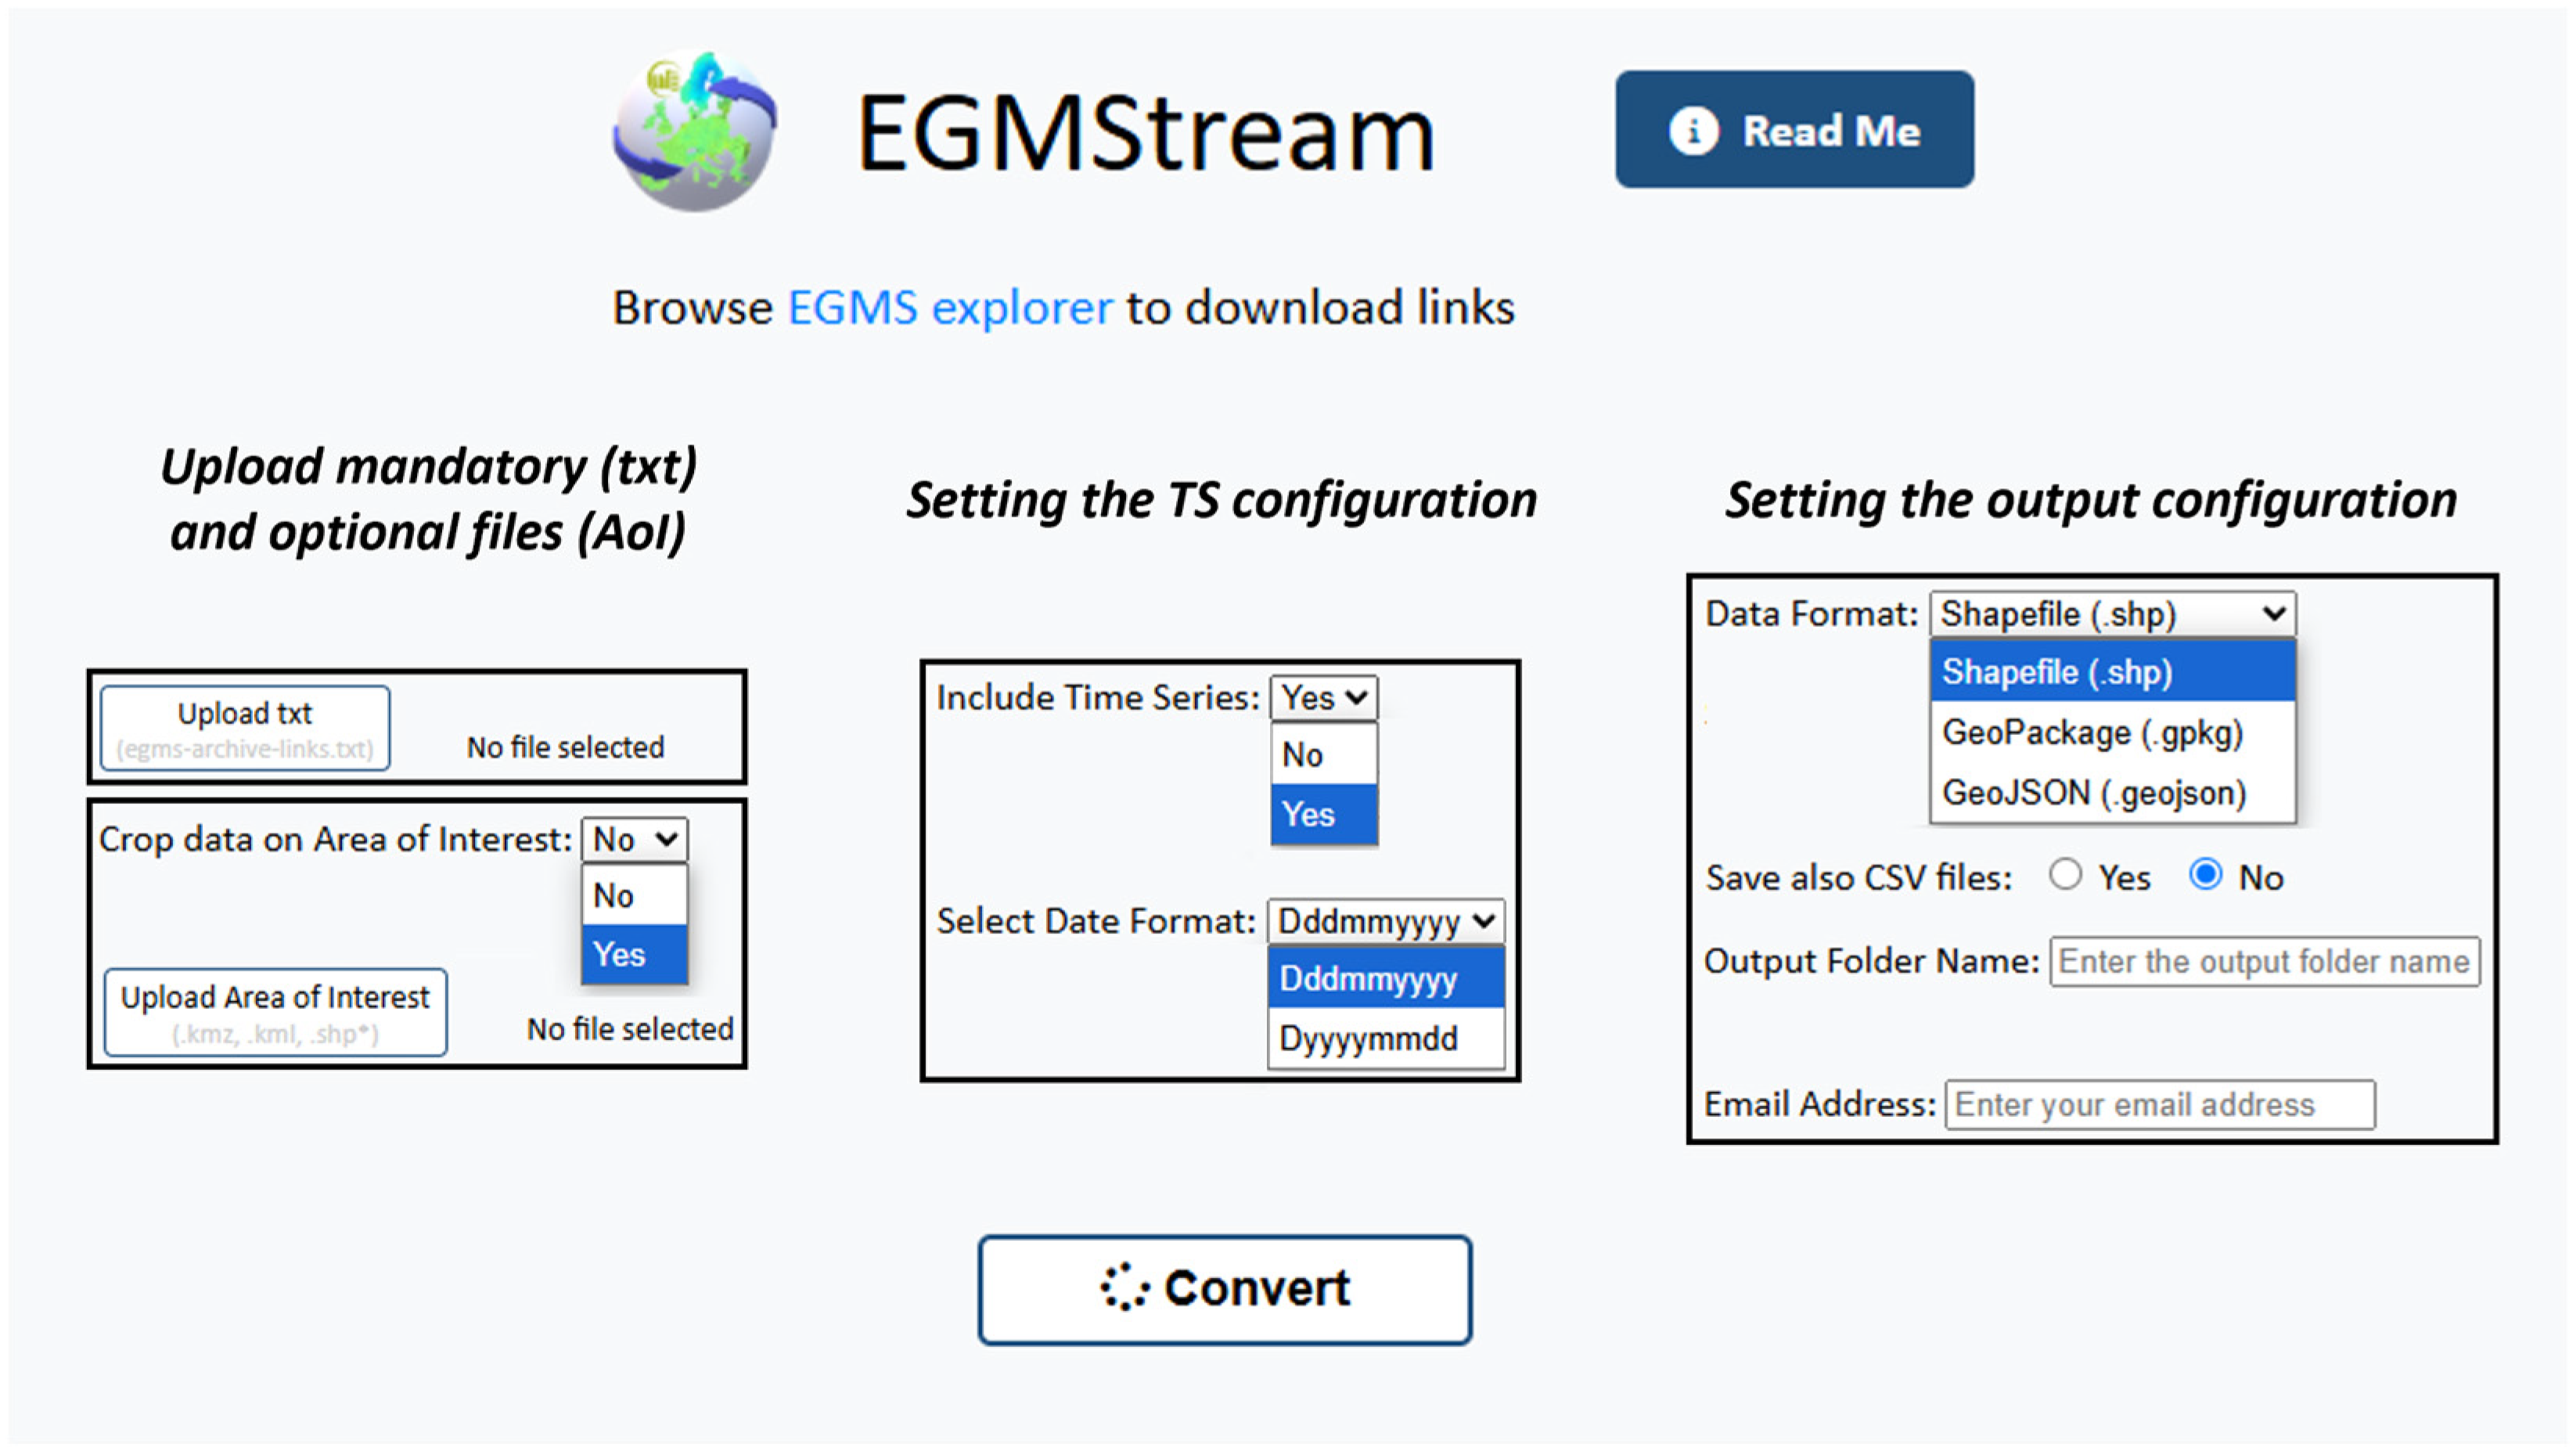
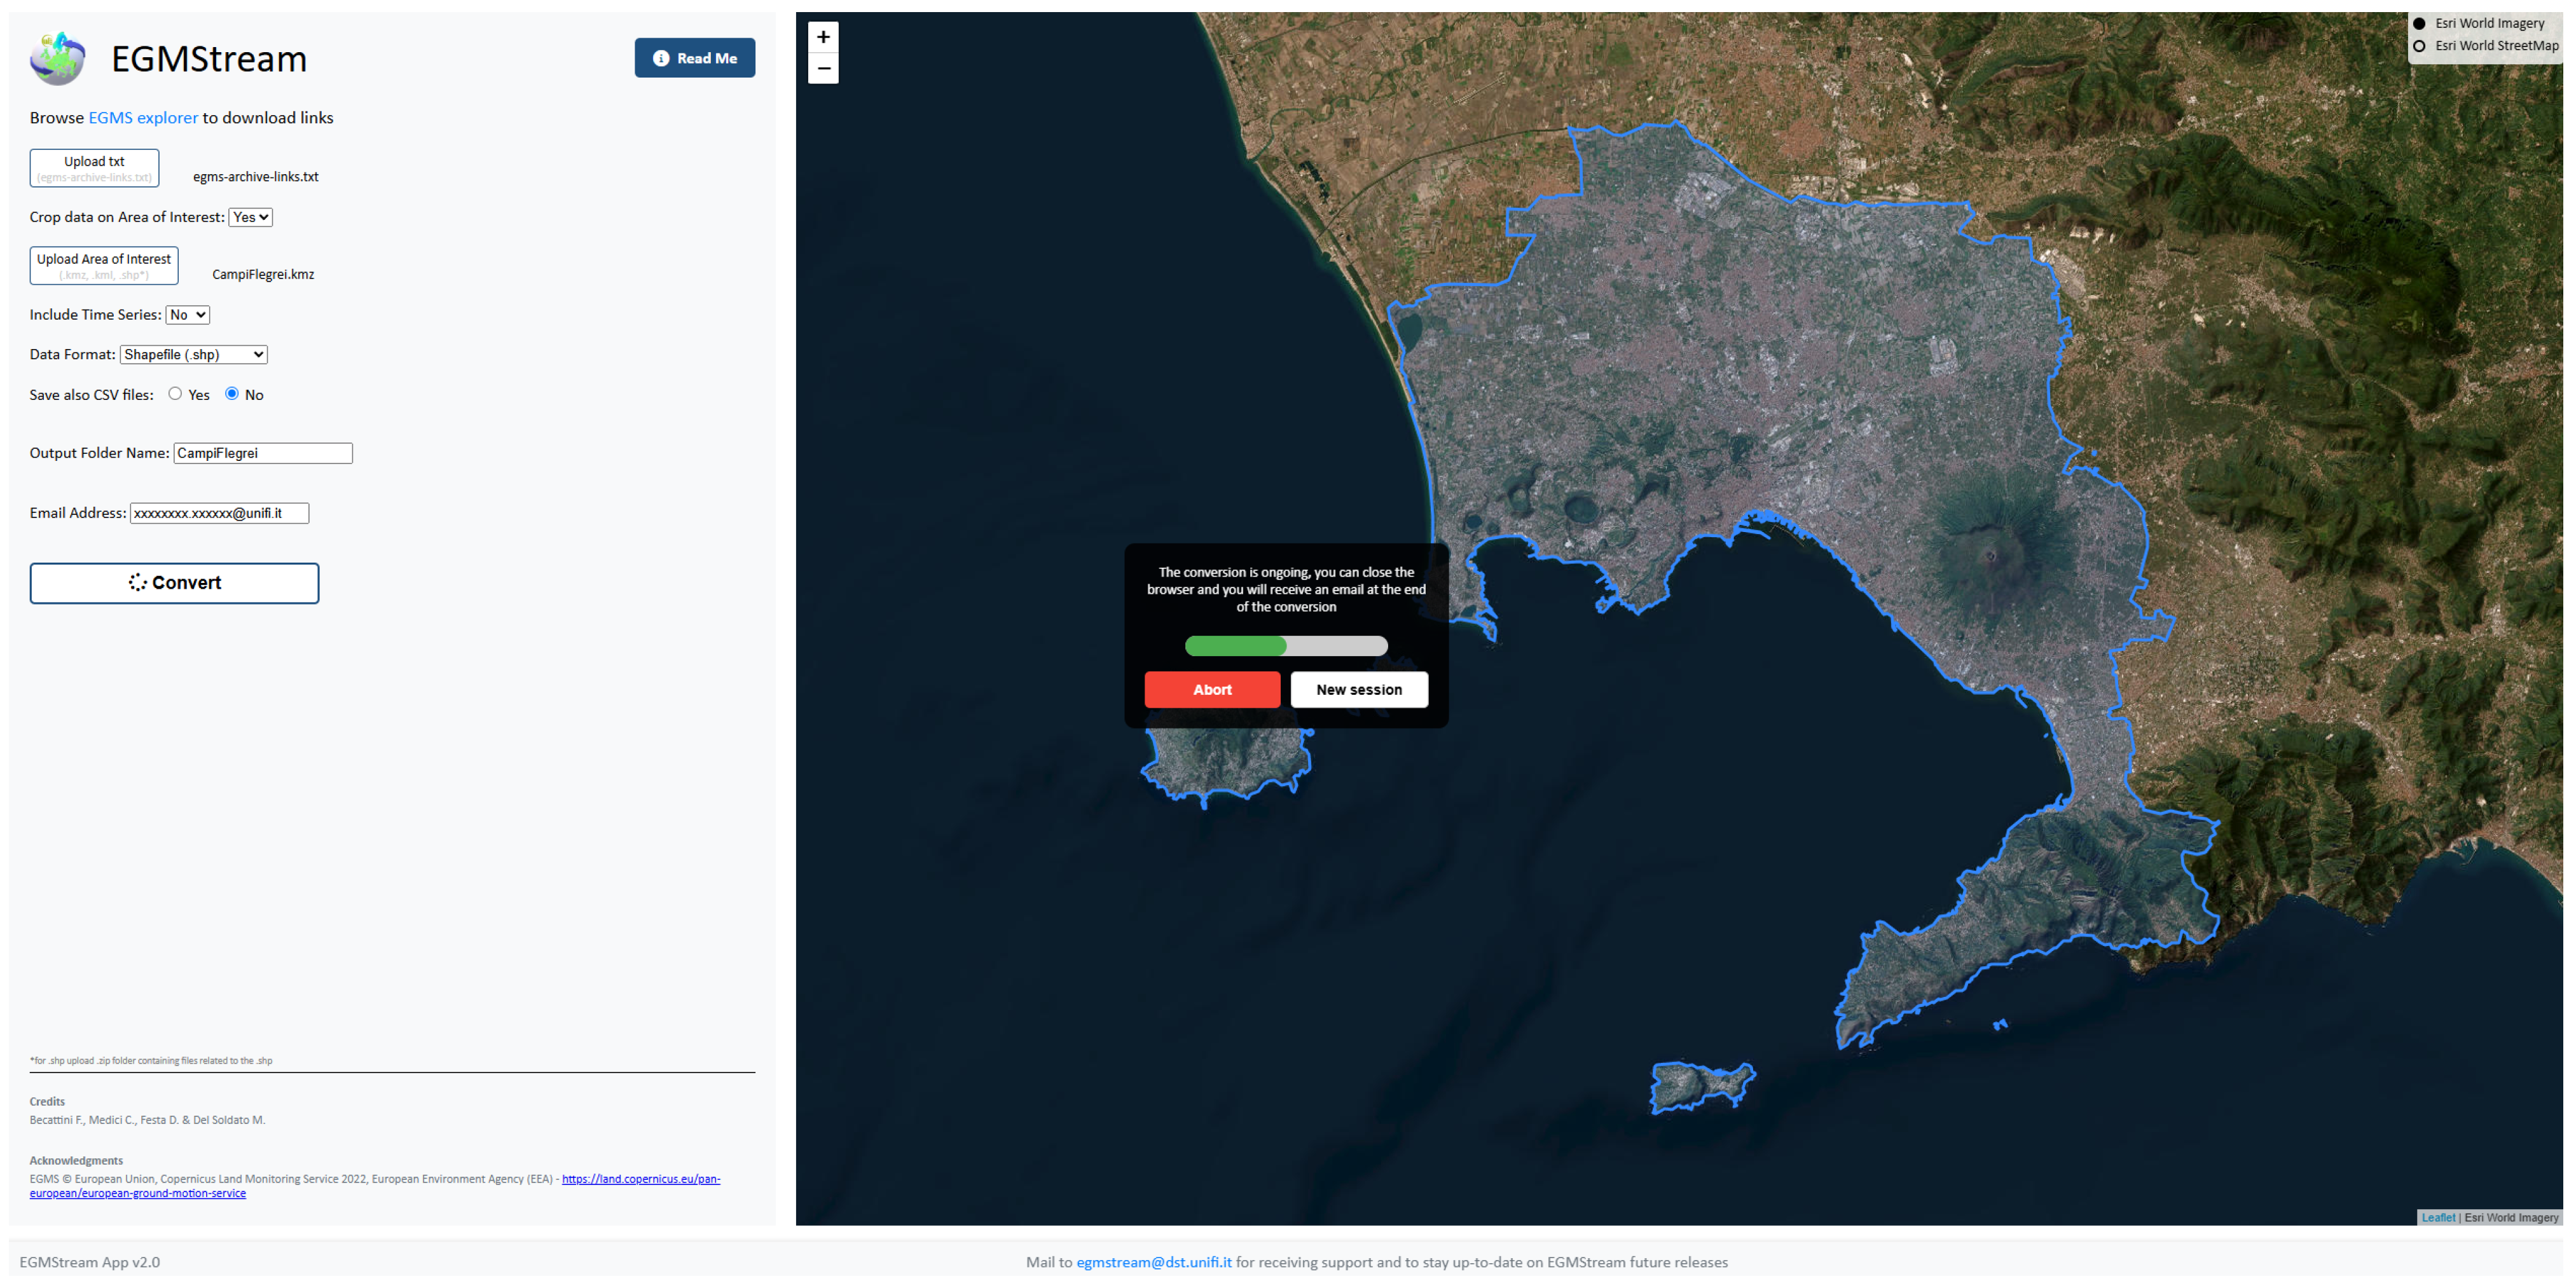
2.2. Webapp Interface and Relative Command in the Backend

The frontend serves as the user-facing interface of the system, designed to facilitate interactions between the user and the backend functionalities of the application. Built using HTML (Hypertext Markup Language), CSS (Cascading Style Sheets), and JavaScript languages, the interface provides an intuitive platform that is accessible via any web browser. By allowing users to make specific selections through the interface, the webapp provides flexibility, enabling users to obtain tailored results.
The backend, which is the core engine of the application, manages the application logic, data processing, and user requests. Developed using Python and the Flask framework [54], the backend ensures efficient performance by supporting asynchronous requests and facilitating multiuser interactions. This robust architecture enables real-time data processing, while Java-based parallel processing optimizes computationally demanding tasks, delivering high performance and scalability for managing large geospatial datasets.
The interface of the webapp consists of two main panels:
(i)
the left panel, where users can upload mandatory and optional input files and set parameters to customise the data conversion (Figure 2);
(ii)
the right panel, which is an interactive map displaying the uploaded AoI, if provided.
The first box of the left panel is dedicated to uploading the mandatory .txt file containing the EGMS hyperlinks. Through the “Upload txt” button, users can browse their personal computer directories to select the previously stored .txt file. The file upload functionality is implemented in Python, employing the “pandas” package [55,56], a robust and flexible open-source package used for reading the text file and organizing the URLs into a structured DataFrame [57]. Subsequently, the ”request” package [58,59] allows for managing the HTTP library, issuing HTTP GET requests [60] for downloading the assorted files and saving them in a designated directory with a name derived from their corresponding URLs.
The second configuration option, “Crop Data on Area of Interest”, allows users to define the optional input file specifying the AoI. If the user selects “Yes”, an additional section appears, enabling the upload of a geospatial file in .zip (containing all the files of a shapefile), .kml, or .kmz (Google Earth file) formats. The handling of AoI file uploads is implemented in Python, leveraging the “geopandas” [61] and “shapely” [62] packages for efficient processing of geospatial data.
If the user decides not to crop data, the process can continue with the “Include Time Series” option to determine whether time series data should be included in the final products. By default, the “No” option is selected. By selecting “Yes”, an additional setting is displayed, allowing users to define the date format, namely day, month, year (choosing ”Dddmmyyyy”) or year, month, day (choosing “Dyyyymmdd”).
In the end, the format of the converted products can be defined by choosing between the following: (i), Shapefile (.shp), an ESRI geospatial format [63]; (ii) GeoPackage (.gpkg), an open format of geospatial datasets [64]; and (iii) GeoJSON (Geospatial Javascript Object Notation—.geojson) [65]. The GeoJSON format was introduced considering that it is a more compact format, reducing data transfer times over networks and improving system efficiency, especially in bandwidth-constrained environments. Temporal data can be easily structured in GeoJSON format, allowing more intuitive and flexible access to time series of ground displacements. Moreover, the Shapefile format has a size limitation of a maximum of 2 Gb. If the dataset exceeds this limit, it is automatically divided into smaller parts according to specific rules selected after several attempts:
-
5,000,000 points for products without time series;
-
300,000 points for products with time series.
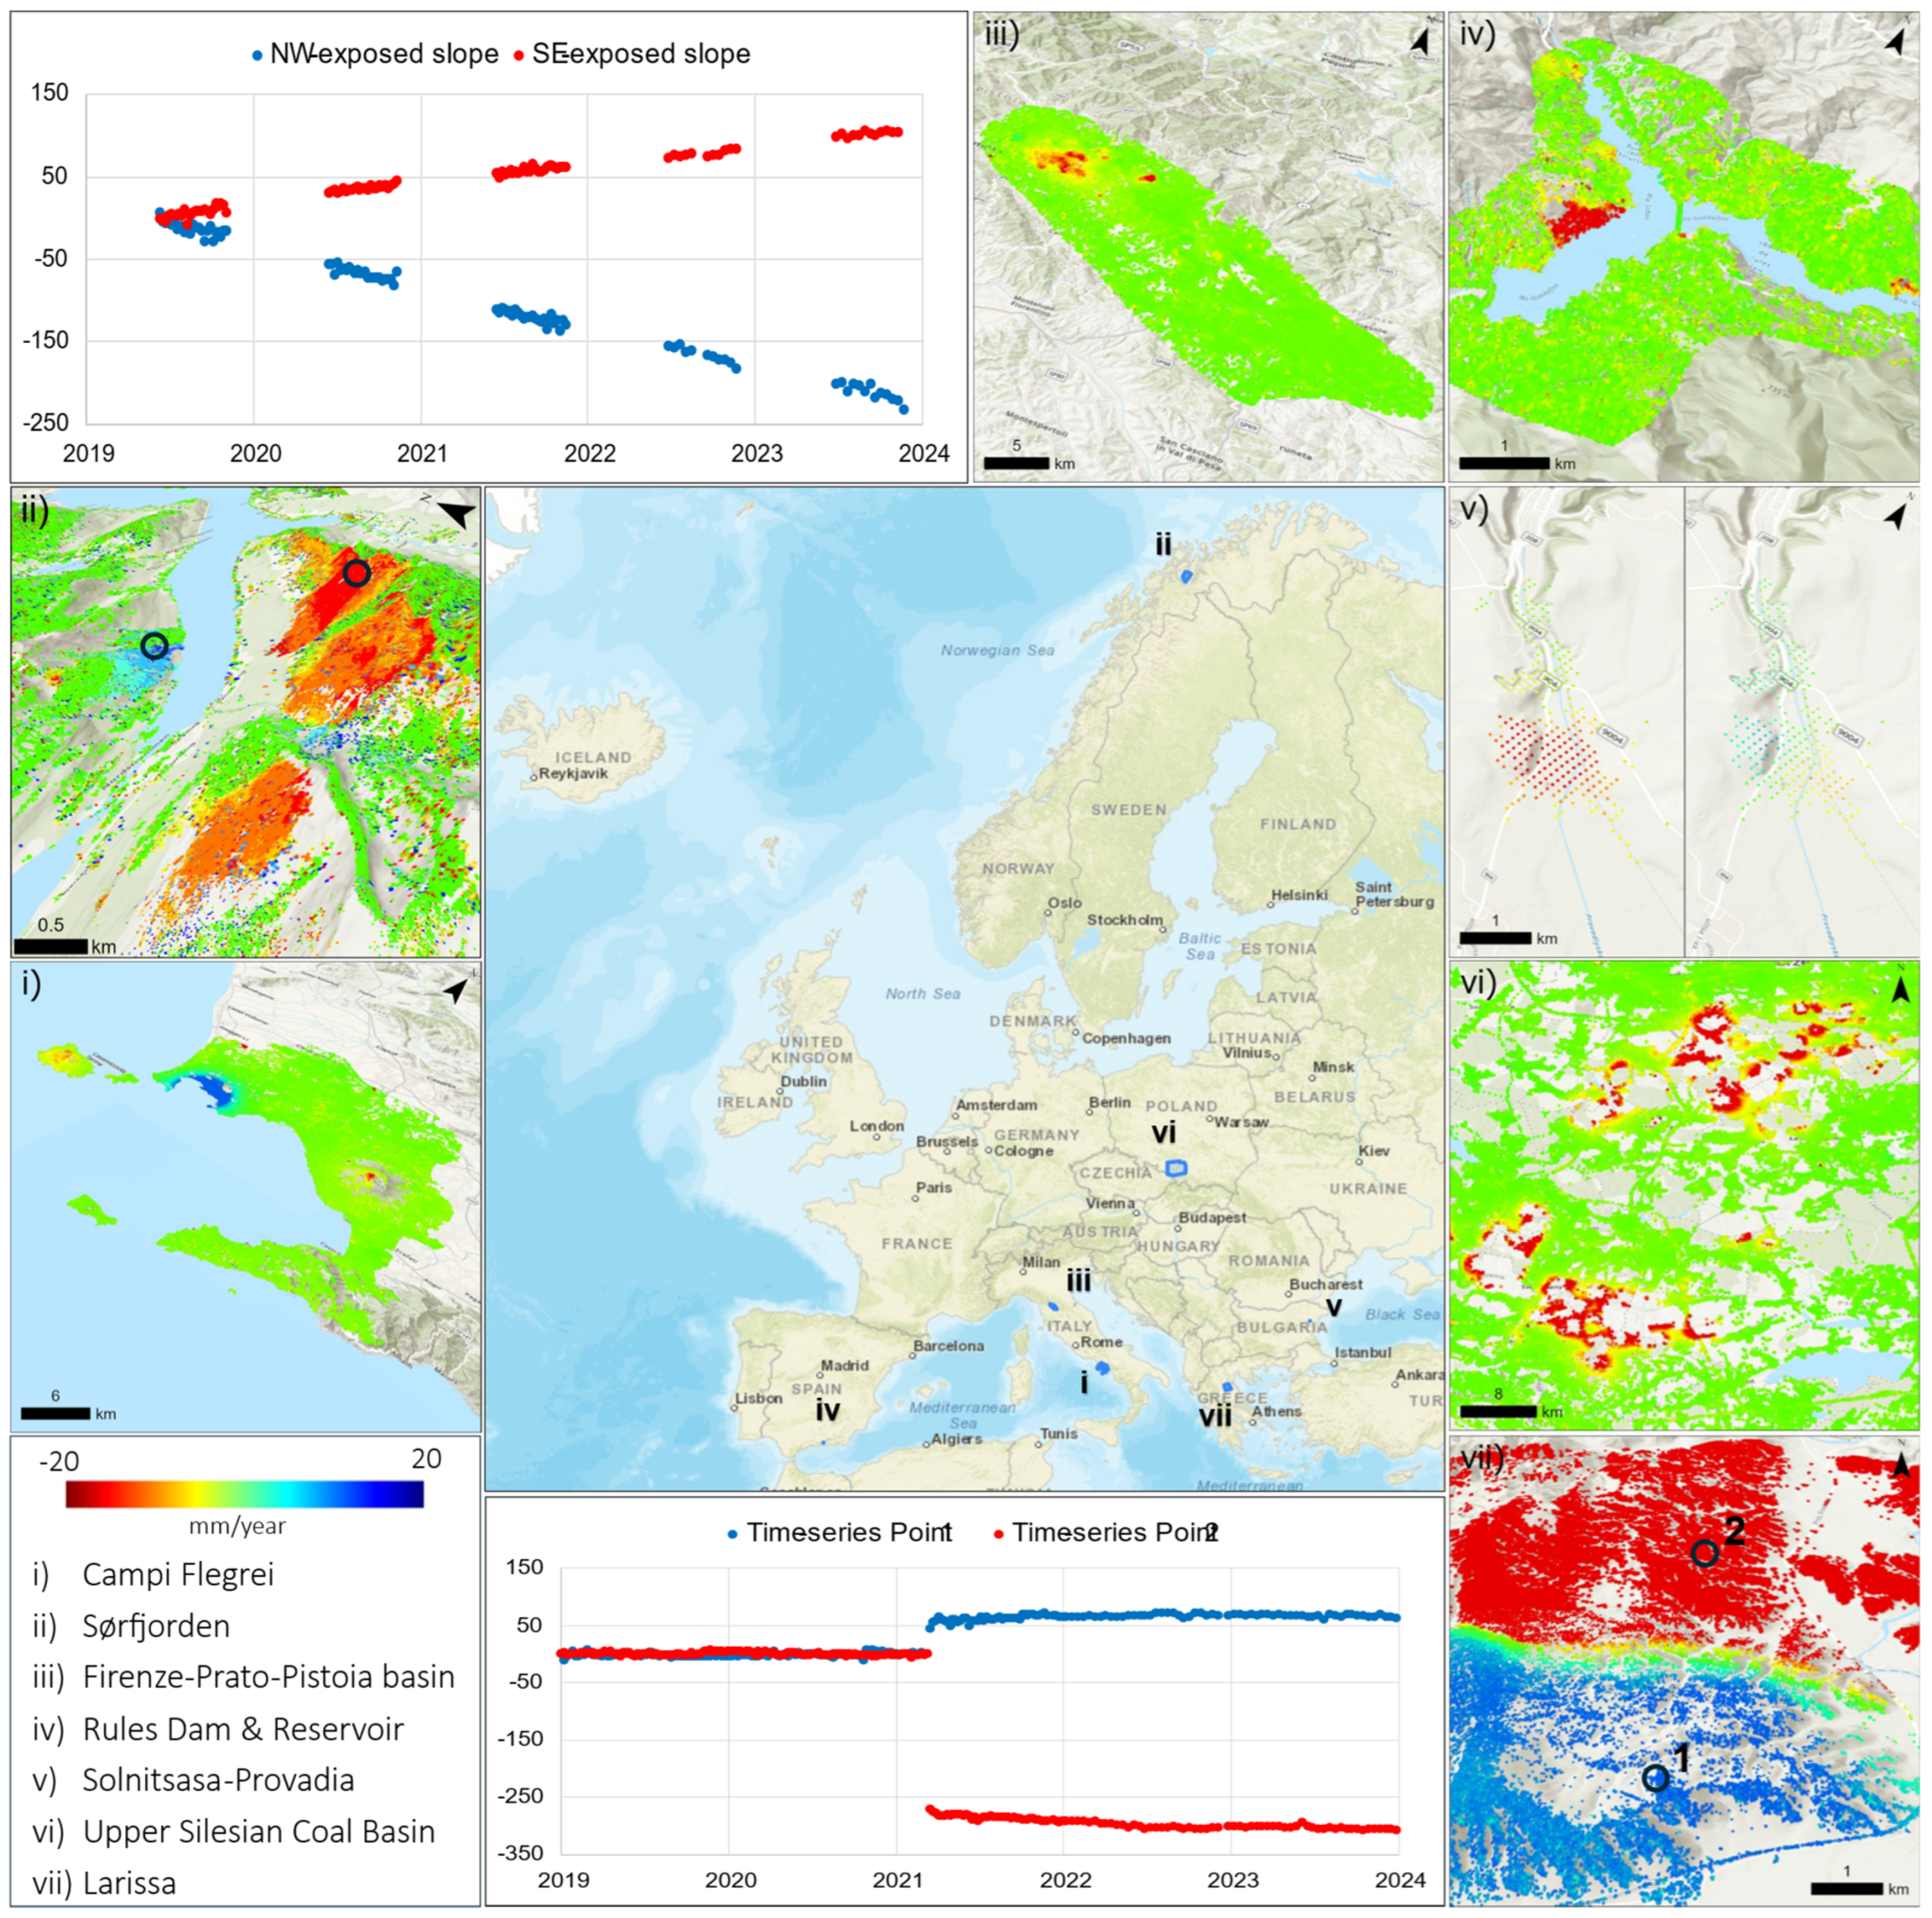
For the GeoPackage and GeoJSON formats, the size limit is overcome by 600,000 points for products with time series and 5,000,000 points for products without time series.
The last choice relates to the download option referring to maintaining or not the .csv files, alongside the converted products by selecting either “Yes” or “No” (default) in the ‘Also save CSV files’ option.
Each setting selected triggers specific backend operations, where specific parts of code are activated or bypassed using a “for“ loop or conditional statements like “if“ and “else” [66].
Finally, users must specify a name for the output folder to store the converted file on the EGMStream server (“Output folder Name”) and a valid email (“Email address”) to which received the communication of conversion completed. The email will also contain the link to the output folder, enabling users to download the converted data, including the .csv files, if required.
Once all settings are configured and the required information is provided, users can start the conversion process by the “Convert” button, starting the process from the download of data to the sending of the email. Therefore, the first operation after the download involves the unzipping of data using the “zipfile” module [67,68], which facilitates creating, reading, writing, appending, and listing the contents of the ZIP file. The unzipped data are stored as CSV (.csv) files containing all data and their information as a table in columns separated by commas.
At this point, depending on the user choices, parts of the code are either activated or bypassed. If the user decides to crop the data on the uploaded AoI, a clipping function is executed after the download process. The clipping function, along with the subsequent data conversion process, relies on the “pandas” [55], “geopandas” [61], and “shapely” [62] modules for handling spatial data and geodatabases.
The data conversion process adapts to user choices regarding the inclusion of time series (TS) and the desired output format, generating a Shapefile (.shp), Geopackage (.gpkg), or GeoJSON (.geojson) data file.
The three parts allowing the functionality of the EGMStream webapp, Python, HTML, and JavaScript, are deployed within a Docker container. A key benefit of web applications is that they do not require the app or computer to be actively running, ensuring data conversion continues even when the app is not in use. Furthermore, the webapp facilitates the reception of email notifications containing the converted data upon the completion of the conversion process. The “flask-mail” module provides tools for configuring and sending email with the download link for the converted data via an SMTP server [69].
The link received by email linking to the folder with the converted data remains active on the server for three days, ensuring sufficient temporary storage space for further processing tasks while maintaining an efficient archive system. Space management and automatic folder deletion after the expiry period are handled using the “os’”, “time”, and “shutil” modules [70]. These modules enable interaction with the file system, retrieval of the current time, and deletion of directories and their contents.
Users can obtain detailed information on input requirements, parameter settings, and user instructions via the “Read me” tab, which provides access to the EGMStream webapp user manual.

3. Results

This section illustrates how EGMStream enhances the ease and speed of processing and deploying EGMS products. To show the outputs that can be obtained using the webapp, data from the following seven different areas [71] were downloaded and converted:
(i)
the volcanic area of Campi Flegrei, Gulf of Naples (Italy);
(ii)
the landslide-prone slopes of southern Sørfjorden, Tromsø municipality (Norway);
(iii)
the subsiding area of the Firenze–Prato–Pistoia basin (central Italy);
(iv)
the Rules Dam and Reservoir, Granada province (Spain);
(v)
the archaeological site of Solnitsata-Provadia, Varna province (Bulgaria);
(vi)
the mining subsidence in the Upper Silesian Coal Basin (Czech Republic).
(vii)
the 2021 Larissa earthquake area, Thessaly region (Greece).
The first example, Campi Flegrei, is a large volcanic system characterised by an active caldera formed approximately 39,000 years ago following the eruption of the Campanian Ignimbrite, one of the largest eruptions in the Mediterranean area [72]. This complex consists of numerous craters, fumaroles, thermal springs, and pyroclastic deposits, evidence of prolonged volcanic and hydrothermal activity. Geomorphologically, the area includes volcanic-origin hills shaped by significant ground uplift and subsidence, a phenomenon known as bradyseism, which has deeply influenced the landscape and human settlement over millennia [73]. The current volcanic activity is closely monitored, as the caldera is one of the most hazardous volcanic systems in Europe.
The second sample refers to the slopes of southern Sørfjorden, located about 50 km South of the Tromsø city. Both the west- and east-facing slopes are very steep and susceptible to landslides due to geological and geomorphological conditions [74].
The third case is the Firenze–Prato–Pistoia basin in Central Italy, which is well-known for ground subsidence identified in the northern portion. The phenomenon was initially identified using ERS data [75,76], and is primarily due to extensive agricultural and flower nursery activities in the Pistoia province, which require significant groundwater extraction, as well as the leather factories in the Prato province. A subsequent analysis with ENVISAT [77] and Sentinel-1 [78] data confirmed ground deformation in the northern portion of the basin. In the Prato province, a velocity inversion was recorded, indicating an uplift phenomenon related to the rebound of the water table following the relocation of leather factories abroad.
The fourth case study concerns an infrastructure and its effects in southern Spain. The Rules Dam and Reservoir are relevant for water supply in the Granada area for both agricultural and domestic needs [79]. Several portions of the reservoir slopes are prone to landslides, with some areas actively affected by slope instability. This issue was also relevant during the construction of the Rules Viaduct, which crosses a right branch of the reservoir in a north–south direction.
The fifth example is the archaeological site of Solnitsasa-Provadia (Bulgaria), discovered in 2005 and excavated until 2023. In prehistoric times, the area was dedicated to salt extraction through water boiling, and it has been recognised as the oldest salt production centre, with settlements dating back to 5500-4200 BCE [80]. In the mid-20th century, the area underwent intensive industrial salt extraction by the injection of pressurised water, leading to the formation of underground dissolution chambers [81]. This also contributed to increased seismicity in the area starting from the 1970s [81,82].
The second-to-last sample is the mining Upper Silesian Coal Basin, located between Poland and Czech Republic, which is affected by induced-mining subsidence. The mining area covers approximately 7500 km2 and involves underground excavation using the chamber-and-pillar method, which causes the collapse of the overlying rock layers. As early as the mid-19th century, more than 70 coal mines were documented, and coal extraction remained active well into the 21st century, with significant production recorded in 2014 [83]. Beyond its economic importance, the environmental impacts are considerable, including tremors, groundwater contamination, waste issues [84], and extensive ground deformation [85,86,87,88].
The last example of the webapp use for downloading EGMS data is the area of Larissa province, which was struck by a Mw 6.3 earthquake on 3 March 2021 [89]. The earthquake caused relevant damage and partial collapses of buildings in several villages in the North of Larissa main town (i.e., Damasi, Koutsochero, Tyrnavos, Vlachogianni, Mesochori, Amouri, and Verdikousia), and the estimated economic losses were considerable [90]. Aftershocks continued to affect the area for more than a month, causing further damage to infrastructure and buildings [89].
As an example of the procedure adopted to download and convert the data across all areas, the conversion parameters chosen for the Campi Flegrei area are reported in Figure 3. The area of interest was uploaded as .kmz format, visible on the interactive map on the right side of the interface, and the inclusion of the TS in the “Dddddmmyyyy” format and the conversion of the interferometric data into the shapefile format was chosen.
Starting the conversion process, a pop-up message appears on the webapp with the text “The conversion is ongoing, you can close the browser and you will receive an email at the end of the conversion (Figure 4)”. This message indicates that the server-side computation has begun, and below it, two buttons are available: (i) “Abort” to stop the process; (ii) “New session” to refresh the web page for further use of the webapp. At the end of the conversion, an email is sent to the user containing the link to download a zipped folder, containing one or two subfolders: one for the geospatial files (“shp_files” in the sample case) and another for the .csv files (“csv_files”), if the corresponding option has been selected. In this latter case, if the user has not specified an AoI, the original .csv files are provided; otherwise, the .csv files are clipped to the selected AoI.
The Shapefile, GeoJSON, or GeoPackage downloaded for the different areas from the received link was subsequently loaded into a GIS environment for interpretation and further post-processing analysis [91]. The converted data have been visualised in ArcGIS Pro, where both LoS and vertical velocity values were classified based on their mean annual velocity (mm/year) (Figure 4). The analysis of the vertical component between January 2019 and December 2023 over the Campi Flegrei area highlighted a significant uplift in the central portion, with velocities exceeding 60 mm/year, represented in purple in Figure 4i. This uplift aligns with the active geohazards in the area, emphasising the importance of continuous monitoring.
The LoS EGMS data (January 2019–December 2023) over the flanks of the southern Sørfjorden (Figure 4ii) show velocities ranging from a few mm/year up to more than 150 mm/year. Both landslides and time-series of deformation display a linear trend. More in detail, the northern flank shows negative velocities up to −54 mm/year and positive values up to 28 mm/year, in ascending and descending geometries, respectively. Conversely, the southern slope, where more landslides can be recognised, shows positive velocities up to 54 mm/year and negative values, better identified considering the slope orientation, exceeding −150 mm/year in ascending and descending orbits, respectively.
The vertical velocities recorded in the Firenze-Prato-Pistoia (Figure 4iii) basin for the period January 2018–December 2022 show a continuous vertical deformation in the northern portion of the basin, with a maximum subsidence rate of −20 mm/year. Additionally, a relevant subsidence bowl, reaching a vertical velocity of approximately −49 mm/year, is evident in the eastern central portion of the basin due to the groundwater overexploitation in the industrial area of the Montemurlo municipality [92]. Outside these two areas, InSAR data show general stability, with only a few localised uplift zones exceeding the stable range by a few mm/year.
L2A data were investigated over the Rules Dam and Reservoir to identify and monitor the ongoing deformation (Figure 4iv). Ground deformation maps from both ascending and descending datasets reveal an area on the left flank with velocities of approximately −30 mm/year and 10 mm/year, respectively. Additionally, deformation patterns in the northern branch appear in single geometries due to the combination of slope exposure and LoS orientation, requiring further investigation.
The InSAR velocity components recorded over the archaeological site of Solnitsasa-Provadia for the period 2019–2023 show a radial vertical subsiding displacement from approximately −10 mm/year in the external part to −37 mm/year in the centre. Meanwhile, the horizontal component exhibits positive values up to 19 mm/year in the eastern portion and negative values of around −13 mm/year in the western one (Figure 4v). The time series of displacement in both components shows a linear trend with no acceleration or decelerations.
Mining-induced subsidence in the Upper Silesian Coal Basin shows vertical displacement reaching approximately 200 mm in the period 2018–2022, with velocities up to 48 mm/year. Due to land cover and land use conditions, InSAR data coverage is not continuous across the entire area. Several circular-shaped subsidence bowls with peak displacements at their centres have been identified (Figure 4vi).
L2A data from the Larissa earthquake show clear displacements in both ascending and descending datasets. In the ascending datasets, there is a clear transition from positive to negative values moving from west to east, while in descending ones, the pattern is reversed. A notable feature in the time series is a clear discontinuity coinciding with the occurrence of earthquakes (Figure 4vii).
The EGMStream webapp offers a solid foundation for in-depth spatial and temporal analysis while greatly simplifying the integration and administration of converted data within GIS or WebGIS systems.
Stress tests conducted on a Dell server equipped with a 20-core Xeon CPU and 512 GB of RAM have demonstrated that the application is capable of simultaneously handling over five active users without a notable impact on performance.
A series of tests were conducted to verify the reliability and speed of the study. Table 1 reports the time required for downloading data of the samples area shown in Figure 4. For each area, the table indicates the format to which the downloaded data were converted, the EGMS product requested, and the spatial extent of the area. The reported times refer to both the download and conversion processes performed via the EGMStream webapp and the dedicated server.

4. Discussion

The increasing availability of EGMS data and their critical role in monitoring and analysing ground deformation require solutions capable of overcoming technical barriers, allowing even non-expert users to access these datasets with ease. The development of the EGMStream webapp addresses the growing need within the scientific and professional communities for intuitive, scalable, and high-performance tools to manage complex geospatial datasets.
The migration from a desktop application (the first version of EGMStream [48]) to a web-based architecture represents a significant advancement in accessibility, performance, and scalability. By eliminating the need for local installations and high-performance hardware, the EGMStream webapp ensures universal access through a user-friendly interface that can be used from any internet-connected device. This transition enables a much larger audience, including public entities, local administrations, and stakeholders involved in the analysis of geological, infrastructural, and environmental phenomena, to benefit from its advanced features. Furthermore, the web-based platform allows for faster and more efficient processing of large geospatial datasets, making the application a versatile tool for diverse user needs.
A crucial improvement was the integration of Docker, a technology that enables the isolation of applications within portable containers. This solution ensures that the software operates consistently across different platforms, overcoming compatibility and dependency issues. Additionally, Docker allows for the implementation of a scalable cloud-based architecture capable of handling a high number of simultaneous requests without compromising performance. Parallel processing, made possible by this architecture, significantly reduces the time required for data downloading and format conversion, improving the system efficiency.
Centralized data management represents another significant advancement over the previous desktop version. While the R-based version required users to download and convert EGMS data locally, introducing limitations related to hardware resources and storage capacity, the web application transfers the computational load to the server. Converted data are sent directly to the user email, ensuring quick and organized access while simplifying the workflow and enabling remote data retrieval. Additionally, the possibility for users to close the browser or turn off their device during the data conversion, thanks to server-side computation, enhances practicality and flexibility. This ability, combined with an automated temporary data management system on a server offering up to 10 TB of available space and automatic deletion after three days, ensures optimal resource management without compromising the user experience.
Another distinctive feature of the webapp is the flexible management of areas of interest by allowing users to upload geospatial files in standard formats such as Google Earth format and shapefile, by compressed ZIP with all accessory files. The definition of a customized AoI significantly reduces the time required for data conversion, eliminating the need for additional manual clipping or filtering operations and allowing more efficient handling of large datasets.
The inclusion of the GeoJSON format, in addition to shapefile and geopackage (already present in [48]), as an output option represents a significant improvement that enhances the application compatibility with real-time analysis and visualization platforms. This format facilitates faster and more efficient data transfer, even in bandwidth-constrained environments, thanks to its lightweight nature and JSON-based structure. GeoJSON is particularly valued for its ability to integrate spatial data with web applications and API (Application Programming Interface) services, enabling the immediate and interactive visualization of information.
The EGMStream webapp significantly simplifies the integration and management of converted data within GIS or WebGIS platforms, providing a robust starting point for detailed spatial and temporal analyses. The ability to generate deformation maps and time series not only facilitates the mapping of potentially risky areas but also enables continuous monitoring. These capabilities are essential for supporting urban planning, risk assessment, and civil protection measures. Moreover, the streamlined workflow, server-side computation, and automated delivery of results make the EGMStream webapp a powerful tool for researchers, professionals, and public entities involved in geospatial analysis and geohazard monitoring.

5. Future Developments

Several enhancements are planned to further refine and expand the capabilities of the EGMStream webapp. In the short term, to streamline the data import process, drag-and-drop functionality will be introduced, simplifying the upload of both the text file containing download links and the AoI file. These additions are expected to simplify the user experience, thereby reducing the setup time and increasing the efficiency of data handling.
Additionally, a drawing tool will be integrated, allowing users to define the AoI by drawing it directly within the webapp. This feature will eliminate the need for an external file, permitting the quick and intuitive drawing of the AoI on the interactive map.
Mid- to long-term objectives will focus on enhancing data visualization and post-processing capabilities within the platform. For instance, the progress bar will be enhanced to provide real-time feedback on the data processing tasks, including detailed status information and estimated completion times, ensuring transparency on the conversion times. Furthermore, additional functionalities will be added to incorporate the in-app visualization of the downloaded and clipped data within the AoI, allowing users to view and verify converted data directly on the platform. Finally, the EGMStream webapp will evolve into a more comprehensive analytical environment by incorporating post-processing tools. These tools could be support the detailed examination and interpretation of ground deformation data, providing users with advanced capabilities for geospatial and geological analysis.
These potential developments aim to establish the EGMStream webapp as a robust and versatile tool, meeting the evolving requirements of the research and professional communities involved in ground deformation and geospatial analysis.

6. Conclusions

The EGMStream webapp is an innovative platform designed to enhance the accessibility, efficiency, and flexibility of analysing data provided by the European Ground Motion Service (EGMS). Developed as a web application utilizing modern technologies such as Python, JavaScript, and Docker, the EGMStream webapp excels in managing large geospatial datasets, addressing the increasing needs of the scientific and technical community. By combining a user-friendly interface with a scalable cloud-based architecture, the platform enables users to easily access EGMS data without the need for complex software or hardware setups.
The modular structure of the EGMStream webapp, with its separation of the backend, frontend, and database components, simplifies the development, maintenance, and implementation of new features, ensuring continuous updates and improvements. Additionally, Docker integration ensures consistent performance across any infrastructure, supporting efficient processing even under high user loads.
Compared to its previous desktop version, the EGMStream webapp delivers significant advantages in terms of accessibility and performance. The requirement for local installations and high-performance hardware has been eliminated, thanks to the adoption of a scalable cloud architecture. Features such as parallel processing and the delivery of converted data via email in standardized GIS formats (Shapefile, GeoPackage, GeoJSON) have made the system more efficient and user-friendly. Notably, the inclusion of the GeoJSON format further enhances the platform versatility, enabling seamless integration with web-based workflows and real-time analysis applications.
In conclusion, the EGMStream webapp represents a significant advancement for scientific and professional communities utilizing EGMS data. Its combination of accessibility, scalability, and advanced performance makes it a useful tool for large-scale geospatial analysis. Future developments aim to introduce automated analysis capabilities, real-time visualization features, and cloud storage solutions, further addressing the growing needs of research and professional stakeholders. These innovations will further strengthen EGMStream’s position as a reference platform for ground motion data analysis.

Author Contributions

Conceptualization and methodology, F.B., C.M. and M.D.S.; software, F.B., C.M. and D.F.; writing—original draft preparation, F.B., C.M. and M.D.S.; writing—review and editing D.F.; supervision and project administration, M.D.S. All authors have read and agreed to the published version of the manuscript.

Funding

This research received no external funding.

Data Availability Statement

The EGMStream webapp is freely available at https://egmstream.unifi.it. To remain updated about future releases or to receive further support, please contact the authors at egmstream@dst.unifi.it.

Acknowledgments

The authors would like to thank Gabriele Scaduto, IT technician of the Earth Sciences Department at the University of Florence, for his IT support provided in the development of the webapp. In addition, the first author also acknowledges the European Union–NextGenerationEU–Mission 4 “Education and Research”–Component 2 “From Research to Business”–Investment 3.1 “Fund for the realization of an integrated system of research and innovation infrastructures”–Project IR0000037–GeoSciences IR–CUP I53C22000800006 for funding his PhD fellowship. Finally, the authors would like to thank the Section Managing Editor of the journal for the opportunity to publish without fees.

Conflicts of Interest

The authors declare no conflicts of interest.

References

  1. Crosetto, M.; Solari, L.; Mróz, M.; Balasis-Levinsen, J.; Casagli, N.; Frei, M.; Oyen, A.; Moldestad, D.A.; Bateson, L.; Guerrieri, L.; et al. The Evolution of Wide-Area DInSAR: From Regional and National Services to the European Ground Motion Service. Remote Sens. 2020, 12, 2043. [Google Scholar] [CrossRef]
  2. Costantini, M.; Minati, F.; Trillo, F.; Ferretti, A.; Novali, F.; Passera, E.; Dehls, J.; Larsen, Y.; Marinkovic, P.; Eineder, M.; et al. European Ground Motion Service (EGMS). In Proceedings of the 2021 IEEE International Geoscience and Remote Sensing Symposium IGARSS, Brussels, Belgium, 12–14 July 2021; IEEE: Piscataway, NJ, USA, 2021; pp. 3293–3296. [Google Scholar]
  3. Di Martire, D.; Paci, M.; Confuorto, P.; Costabile, S.; Guastaferro, F.; Verta, A.; Calcaterra, D. A Nation-Wide System for Landslide Mapping and Risk Management in Italy: The Second Not-Ordinary Plan of Environmental Remote Sensing. Int. J. Appl. Earth Obs. Geoinf. 2017, 63, 143–157. [Google Scholar] [CrossRef]
  4. WebGIS of the PST-A Project. Available online: http://www.pcn.minambiente.it/viewer/ (accessed on 10 November 2024).
  5. Raspini, F.; Bianchini, S.; Ciampalini, A.; Del Soldato, M.; Solari, L.; Novali, F.; Del Conte, S.; Rucci, A.; Ferretti, A.; Casagli, N. Continuous, Semi-Automatic Monitoring of Ground Deformation Using Sentinel-1 Satellites. Sci. Rep. 2018, 8, 7253. [Google Scholar] [CrossRef] [PubMed]
  6. Confuorto, P.; Del Soldato, M.; Solari, L.; Festa, D.; Bianchini, S.; Raspini, F.; Casagli, N. Sentinel-1-Based Monitoring Services at Regional Scale in Italy: State of the Art and Main Findings. Int. J. Appl. Earth Obs. Geoinf. 2021, 102, 102448. [Google Scholar] [CrossRef]
  7. Bredal, M.; Dehls, J.; Larsen, Y.; Marinkovic, P.; Lauknes, T.R.; Stødle, D.; Moldestad, D.A. The Norwegian National Ground Motion Service (InSAR. No): Service Evolution. In Proceedings of the AGU Fall Meeting Abstracts, InSAR Norway WebGIS, San Francisco, CA, USA, 9–13 December 2019; p. G13C-0559. [Google Scholar]
  8. Dehls, J.F.; Larsen, Y.; Marinkovic, P.; Lauknes, T.R.; Stodle, D.; Moldestad, D.A. INSAR.No: A National Insar Deformation Mapping/Monitoring Service In Norway—From Concept To Operations. In Proceedings of the IGARSS 2019—2019 IEEE International Geoscience and Remote Sensing Symposium, Yokohama, Japan, 28 July–2 August 2019; IEEE: Piscataway, NJ, USA, 2019; pp. 5461–5464. [Google Scholar]
  9. Kalia, A.C.; Frei, M.; Lege, T. A Copernicus Downstream-Service for the Nationwide Monitoring of Surface Displacements in Germany. Remote Sens. Environ. 2017, 202, 234–249. [Google Scholar] [CrossRef]
  10. Bischoff, C.A.; Ferretti, A.; Novali, F.; Uttini, A.; Giannico, C.; Meloni, F. Nationwide Deformation Monitoring with SqueeSAR® Using Sentinel-1 Data. Proc. IAHS 2020, 382, 31–37. [Google Scholar] [CrossRef]
  11. Ferretti, A.; Fumagalli, A.; Novali, F.; Prati, C.; Rocca, F.; Rucci, A. A New Algorithm for Processing Interferometric Data-Stacks: SqueeSAR. IEEE Trans. Geosci. Remote Sens. 2011, 49, 3460–3470. [Google Scholar] [CrossRef]
  12. Barra, A.; Monserrat, O.; Mazzanti, P.; Esposito, C.; Crosetto, M.; Scarascia Mugnozza, G. First Insights on the Potential of Sentinel-1 for Landslides Detection. Geomat. Nat. Hazards Risk 2016, 7, 1874–1883. [Google Scholar] [CrossRef]
  13. Intrieri, E.; Raspini, F.; Fumagalli, A.; Lu, P.; Del Conte, S.; Farina, P.; Allievi, J.; Ferretti, A.; Casagli, N. The Maoxian Landslide as Seen from Space: Detecting Precursors of Failure with Sentinel-1 Data. Landslides 2018, 15, 123–133. [Google Scholar] [CrossRef]
  14. Mantovani, M.; Bossi, G.; Marcato, G.; Schenato, L.; Tedesco, G.; Titti, G.; Pasuto, A. New Perspectives in Landslide Displacement Detection Using Sentinel-1 Datasets. Remote Sens. 2019, 11, 2135. [Google Scholar] [CrossRef]
  15. Kalia, A.C. Landslide Activity Detection Based on Sentinel-1 PSI Datasets of the Ground Motion Service Germany—The Trittenheim Case Study. Landslides 2023, 20, 209–221. [Google Scholar] [CrossRef]
  16. Lanari, R. From ERS-1 TO SENTINEL-1: A Big Data Challenge for 25 Years of DInSAR Observations. In Proceedings of the 2015 IEEE International Geoscience and Remote Sensing Symposium (IGARSS), Milan, Italy, 26–31 July 2015; IEEE: Piscataway, NJ, USA, 2015; pp. 1460–1463. [Google Scholar]
  17. Mirmazloumi, S.M.; Wassie, Y.; Navarro, J.A.; Palamà, R.; Krishnakumar, V.; Barra, A.; Cuevas-González, M.; Crosetto, M.; Monserrat, O. Classification of Ground Deformation Using Sentinel-1 Persistent Scatterer Interferometry Time Series. Gisci. Remote Sens. 2022, 59, 374–392. [Google Scholar] [CrossRef]
  18. Confuorto, P.; Casagli, N.; Casu, F.; De Luca, C.; Del Soldato, M.; Festa, D.; Lanari, R.; Manzo, M.; Onorato, G.; Raspini, F. Sentinel-1 P-SBAS Data for the Update of the State of Activity of National Landslide Inventory Maps. Landslides 2023, 20, 1083–1097. [Google Scholar] [CrossRef]
  19. Dai, K.; Li, Z.; Tomás, R.; Liu, G.; Yu, B.; Wang, X.; Cheng, H.; Chen, J.; Stockamp, J. Monitoring Activity at the Daguangbao Mega-Landslide (China) Using Sentinel-1 TOPS Time Series Interferometry. Remote Sens. Environ. 2016, 186, 501–513. [Google Scholar] [CrossRef]
  20. Beladam, O.; Balz, T.; Mohamadi, B.; Abdalhak, M. Using PS-InSAR with Sentinel-1 Images for Deformation Monitoring in Northeast Algeria. Geosciences 2019, 9, 315. [Google Scholar] [CrossRef]
  21. Raspini, F.; Bianchini, S.; Ciampalini, A.; Del Soldato, M.; Montalti, R.; Solari, L.; Tofani, V.; Casagli, N. Persistent Scatterers Continuous Streaming for Landslide Monitoring and Mapping: The Case of the Tuscany Region (Italy). Landslides 2019, 16, 2033–2044. [Google Scholar] [CrossRef]
  22. Ferretti, A.; Colombo, D.; Fumagalli, A.; Novali, F.; Rucci, A. InSAR Data for Monitoring Land Subsidence: Time to Think Big. Proc. IAHS 2015, 372, 331–334. [Google Scholar] [CrossRef]
  23. Solari, L.; Del Soldato, M.; Bianchini, S.; Ciampalini, A.; Ezquerro, P.; Montalti, R.; Raspini, F.; Moretti, S. From ERS 1/2 to Sentinel-1: Subsidence Monitoring in Italy in the Last Two Decades. Front. Earth Sci. 2018, 6, 149. [Google Scholar] [CrossRef]
  24. Edalat, A.; Khodaparast, M.; Rajabi, A.M. Detecting Land Subsidence Due to Groundwater Withdrawal in Aliabad Plain, Iran, Using ESA Sentinel-1 Satellite Data. Nat. Resour. Res. 2020, 29, 1935–1950. [Google Scholar] [CrossRef]
  25. Hakim, W.L.; Achmad, A.R.; Eom, J.; Lee, C.-W. Land Subsidence Measurement of Jakarta Coastal Area Using Time Series Interferometry with Sentinel-1 SAR Data. J. Coast. Res. 2020, 102, 75–81. [Google Scholar] [CrossRef]
  26. Raspini, F.; Caleca, F.; Del Soldato, M.; Festa, D.; Confuorto, P.; Bianchini, S. Review of Satellite Radar Interferometry for Subsidence Analysis. Earth-Sci. Rev. 2022, 235, 104239. [Google Scholar] [CrossRef]
  27. Luo, Q.; Li, J.; Zhang, Y. Monitoring Subsidence over the Planned Jakarta–Bandung (Indonesia) High-Speed Railway Using Sentinel-1 Multi-Temporal InSAR Data. Remote Sens. 2022, 14, 4138. [Google Scholar] [CrossRef]
  28. Shami, S.; Azar, M.K.; Nilfouroushan, F.; Salimi, M.; Reshadi, M.A.M. Assessments of Ground Subsidence along the Railway in the Kashan Plain, Iran, Using Sentinel-1 Data and NSBAS Algorithm. Int. J. Appl. Earth Obs. Geoinf. 2022, 112, 102898. [Google Scholar] [CrossRef]
  29. Bakon, M.; Czikhardt, R.; Papco, J.; Barlak, J.; Rovnak, M.; Adamisin, P.; Perissin, D. remotIO: A Sentinel-1 Multi-Temporal InSAR Infrastructure Monitoring Service with Automatic Updates and Data Mining Capabilities. Remote Sens. 2020, 12, 1892. [Google Scholar] [CrossRef]
  30. Ramirez, R.A.; Lee, G.-J.; Choi, S.-K.; Kwon, T.-H.; Kim, Y.-C.; Ryu, H.-H.; Kim, S.; Bae, B.; Hyun, C. Monitoring of Construction-Induced Urban Ground Deformations Using Sentinel-1 PS-InSAR: The Case Study of Tunneling in Dangjin, Korea. Int. J. Appl. Earth Obs. Geoinf. 2022, 108, 102721. [Google Scholar] [CrossRef]
  31. Nam, B.X.; Van Anh, T.; Bui, L.K.; Long, N.Q.; Le Thu Ha, T.; Goyal, R. Mining-Induced Land Subsidence Detection by Persistent Scatterer InSAR and Sentinel-1: Application to Phugiao Quarries, Vietnam. In Proceedings of the International Conference on Innovations for Sustainable and Responsible Mining, Hanoi, Vietnam, 15–17 October 2020; Lecture Notes in Civil Engineering; Tien Bui, D., Tran, H.T., Bui, X.-N., Eds.; Springer International Publishing: Cham, Switzerland, 2021; Volume 108, pp. 18–38. ISBN 978-3-030-60268-0. [Google Scholar]
  32. Dang, V.K.; Nguyen, T.D.; Dao, N.H.; Duong, T.L.; Dinh, X.V.; Weber, C. Land Subsidence Induced by Underground Coal Mining at Quang Ninh, Vietnam: Persistent Scatterer Interferometric Synthetic Aperture Radar Observation Using Sentinel-1 Data. Int. J. Remote Sens. 2021, 42, 3563–3582. [Google Scholar] [CrossRef]
  33. Mehrabi, A.; Derakhshani, R.; Nilfouroushan, F.; Rahnamarad, J.; Azarafza, M. Spatiotemporal Subsidence over Pabdana Coal Mine Kerman Province, Central Iran Using Time-Series of Sentinel-1 Remote Sensing Imagery. Episodes 2023, 46, 19–33. [Google Scholar] [CrossRef]
  34. Mura, J.C.; Gama, F.F.; Paradella, W.R.; De Oliveira, C.G.; Rodrigues, T.G. Ground Displacements Revealed by A-DInSAR Analysis in the Germano Iron Mining Complex before and after the Fundão Dam Collapse Using Sentinel-1 Data. J. Appl. Rem. Sens. 2021, 15, 034513. [Google Scholar] [CrossRef]
  35. Ferretti, A.; Passera, E.; Capes, R. Algorithm Theoretical Basis Document. Available online: https://land.copernicus.eu/user-corner/technical-library/egms-algorithm-theoretical-basis-document (accessed on 15 November 2024).
  36. Costantini, M.; Falco, S.; Malvarosa, F.; Minati, F. A New Method for Identification and Analysis of Persistent Scatterers in Series of SAR Images. In Proceedings of the IGARSS 2008—2008 IEEE International Geoscience and Remote Sensing Symposium, Boston, MA, USA, 7–11 July 2008; IEEE: Piscataway, NJ, USA, 2008; pp. II-449–II-452. [Google Scholar]
  37. Costantini, M.; Bignami, C.; Falco, S.; Malvarosa, F.; Moro, M.; Saroli, M.; Stramondo, S. New Results on Post-Seismic Deformations over L’Aquila, Italy, by High Resolution PSP SAR Interferometry. In Proceedings of the 2013 IEEE International Geoscience and Remote Sensing Symposium—IGARSS, Melbourne, Australia, 21–26 July 2013; IEEE: Piscataway, NJ, USA, 2013; pp. 1850–1852. [Google Scholar]
  38. Costantini, M.; Falco, S.; Malvarosa, F.; Minati, F.; Trillo, F.; Vecchioli, F. Persistent Scatterer Pair Interferometry: Approach and Application to COSMO-SkyMed SAR Data. IEEE J. Sel. Top. Appl. Earth Obs. Remote Sens. 2014, 7, 2869–2879. [Google Scholar] [CrossRef]
  39. Sansosti, E.; Berardino, P.; Manunta, M.; Serafino, F.; Fornaro, G. Geometrical SAR Image Registration. IEEE Trans. Geosci. Remote Sens. 2006, 44, 2861–2870. [Google Scholar] [CrossRef]
  40. Prats-Iraola, P.; Scheiber, R.; Marotti, L.; Wollstadt, S.; Reigber, A. TOPS Interferometry With TerraSAR-X. IEEE Trans. Geosci. Remote Sens. 2012, 50, 3179–3188. [Google Scholar] [CrossRef]
  41. Yague-Martinez, N.; Prats-Iraola, P.; Rodriguez Gonzalez, F.; Brcic, R.; Shau, R.; Geudtner, D.; Eineder, M.; Bamler, R. Interferometric Processing of Sentinel-1 TOPS Data. IEEE Trans. Geosci. Remote Sens. 2016, 54, 2220–2234. [Google Scholar] [CrossRef]
  42. Eineder, M. Efficient Simulation of Sar Interferograms of Large Areas and of Rugged Terrain. IEEE Trans. Geosci. Remote Sens. 2003, 41, 1415–1427. [Google Scholar] [CrossRef]
  43. Capes, R.; Passera, E. Product Description and Format Specification. Available online: https://land.copernicus.eu/user-corner/technical-library/egms-product-description-document (accessed on 7 November 2024).
  44. Larsen, Y.; Marinkovic, P.; Kenyeres, A.; To’th, S. EGMS Documentation—GNSS Calibration Report. Available online: https://land.copernicus.eu/user-corner/technicallibrary/egms-gnss-calibration-report (accessed on 10 January 2025).
  45. EUREF Permanent Network. Available online: https://epnd.sgo-penc.hu/ (accessed on 19 December 2024).
  46. EGMS Explorer. Available online: https://egms.land.copernicus.eu/ (accessed on 19 December 2024).
  47. EU Portal. Available online: https://european-union.europa.eu/index_en (accessed on 12 January 2025).
  48. Festa, D.; Del Soldato, M. EGMStream, a Desktop App for EGMS Data Downstream. Remote Sens. 2023, 15, 2581. [Google Scholar] [CrossRef]
  49. Racine, J.S. RStudio: A Platform-Independent IDE for R and Sweave. Available online: https://www.jstor.org/stable/41337225 (accessed on 14 January 2025).
  50. R Foundation for Statistical Computing. A Language and Environment for Statistical Computing. Available online: http://www.R-project.org/ (accessed on 10 November 2024).
  51. Docker Platform. Available online: https://www.docker.com/ (accessed on 21 December 2024).
  52. Mouat, A. Using Docker: Developing and Deploying Software with Containers; O’Reilly Media, Inc.: Sebastopol, CA, USA, 2015; ISBN 978-1-4919-1576-9. [Google Scholar]
  53. Larsen, Y.; Marinkovic, P.; Dehls, J.; Stødle, D. User Interface Manual. Available online: https://land.copernicus.eu/user-corner/technical-library/egms-end-user-interface-manual (accessed on 20 November 2024).
  54. Dwyer, G.; Aggarwal, S.; Stouffer, J. Flask: Building Python Web Services; Packt Publishing: Birmingham, UK, 2017; ISBN 978-1-787-12432-3. [Google Scholar]
  55. McKinney, W. Pandas: A Foundational Python Library for Data Analysis and Statistics. Python High. Perform. Sci. Comput. 2011, 14, 1–9. [Google Scholar]
  56. Pandas. Available online: https://pandas.pydata.org/ (accessed on 19 December 2024).
  57. Chen, D.Y. Pandas for Everyone: Python Data Analysis; Addison-Wesley Professional: Boston, MA, USA, 2017; ISBN 978-0-13-454693-3. [Google Scholar]
  58. Chandra, R.V.; Varanasi, B.S. Python Requests Essentials; Packt Publishing: Birmingham, UK, 2015; ISBN 978-1-78439-541-2. [Google Scholar]
  59. Request. Available online: https://pypi.org/project/requests/ (accessed on 20 October 2024).
  60. Sarker, M.F.; Washington, S. Learning Python Network Programming; Packt Publishing Ltd.: Birmingham, UK, 2015; ISBN 978-1-78439-918-2. [Google Scholar]
  61. Shanmugapriyaa, D.; Sujithra, M.; Senthilkumar, B.; Kumar, V.S.; Sanjai, R. Introduction to Geospatial Data and Python Programming. In Geospatial Application Development Using Python Programming; IGI Global: Hershey, PA, USA, 2024; pp. 1–38. [Google Scholar]
  62. Gillies, S. The Shapely User Manual. Available online: https://pypi.org/project/Shapely (accessed on 10 October 2024).
  63. Mamatov, I.; Galety, M.G.; Alimov, R.; Sriharsha, A.V.; Rofoo, F.F.H.; Sunitha, G. Geospatial Data Storage and Management. In Ethics, Machine Learning, and Python in Geospatial Analysis; IGI Global: Hershey, PA, USA, 2024; pp. 150–167. [Google Scholar]
  64. Rashidan, M.H.; Musliman, I.A.; Rahman, A.A. Geopackage data format for collaborativemapping of geospatial datain limited networkenvironments. Int. Arch. Photogramm. Remote Sens. Spat. Inf. Sci. 2016, XLII-4/W1, 15–21. [Google Scholar] [CrossRef]
  65. GeoJSON Format. Available online: https://stevage.github.io/geojson-spec/ (accessed on 25 November 2024).
  66. Harper, R. Practical Foundations for Programming Languages; Cambridge University Press: Cambridge, UK, 2016; ISBN 978-1-107-15545-6. [Google Scholar]
  67. Hellmann, D. The Python Standard Library by Example; Addison-Wesley Professional: Boston, MA, USA, 2011; ISBN 978-0-321-76734-9. [Google Scholar]
  68. Zipfile—Work with ZIP Archives. Available online: https://docs.python.org/3/library/zipfile.html (accessed on 10 October 2024).
  69. Gaspar, D.; Stouffer, J. Mastering Flask Web Development: Build Enterprise-Grade, Scalable Python Web Applications; Packt Publishing Ltd.: Birmingham, UK, 2018; ISBN 978-1-78862-162-8. [Google Scholar]
  70. Advanced Python. In Python Scripting for Computational Science; Texts in Computational Science and Engineering; Langtangen, H.P., Ed.; Springer: Berlin/Heidelberg, Germany, 2008; Volume 3, pp. 319–449. ISBN 978-3-540-73915-9. [Google Scholar]
  71. Crosetto, M.; Solari, L. Satellite Interferometry Data Interpretation and Exploitation; Elsevier: Amsterdam, The Netherlands, 2023; ISBN 978-0-443-13397-8. [Google Scholar]
  72. Sparice, D.; Pelullo, C.; De Vita, S.; Arienzo, I.; Petrosino, P.; Mormone, A.; Di Vincenzo, G.; Marfè, B.; Cariddi, B.; De Lucia, M.; et al. The Pre-Campi Flegrei Caldera (>40 Ka) Explosive Volcanic Record in the Neapolitan Volcanic Area: New Insights from a Scientific Drilling North of Naples, Southern Italy. J. Volcanol. Geotherm. Res. 2024, 455, 108209. [Google Scholar] [CrossRef]
  73. Silleni, A.; Giordano, G.; Ort, M.H.; Isaia, R. Transport and Deposition of the 39.8 Ka Campanian Ignimbrite Large-Scale Pyroclastic Density Currents (Italy). Geol. Soc. Am. Bull. 2024, 136, 4877–4895. [Google Scholar] [CrossRef]
  74. Petley, D.N. Landslides and Engineered Slopes: Protecting Society through Improved Understanding. In Proceedings of the 11th International and 2nd North American Symposium on Landslides and Engineered Slopes, Banff, AB, Canada, 3–8 June 2012; International Symposium on Landslides, Ed.; CRC Press: Leiden, The Netherlands, 2012. ISBN 978-0-415-62123-6. [Google Scholar]
  75. Canuti, P.; Casagli, N.; Farina, P.; Marks, F.; Ferretti, A.; Menduni, G. Land Subsidence in the Arno River Basin Studied through SAR Interferometry. In Proceedings of the 7th International Symposium on Land Subsidence, Shanghai, China, 23–28 October 2005; pp. 407–4016. [Google Scholar]
  76. Colombo, D.; Farina, P.; Moretti, S.; Nico, G.; Prati, C. Land Subsidence in the Firenze-Prato-Pistoia Basin Measured by Means of Spaceborne SAR Interferometry. In Proceedings of the IGARSS 2003—2003 IEEE International Geoscience and Remote Sensing Symposium. Proceedings (IEEE Cat. No.03CH37477), Toulouse, France, 21–25 July 2003; IEEE: Piscataway, NJ, USA, 2003; Volume 4, pp. 2927–2929. [Google Scholar]
  77. Rosi, A.; Agostini, A. Subsidence Analysis in the Cornia River Basin (Southern Tuscany, Italy) by Using PSInSAR Technique. Rend. Online Soc. Geol. Ital 2013, 24, 276–278. [Google Scholar]
  78. Del Soldato, M.; Farolfi, G.; Rosi, A.; Raspini, F.; Casagli, N. Subsidence Evolution of the Firenze–Prato–Pistoia Plain (Central Italy) Combining PSI and GNSS Data. Remote Sens. 2018, 10, 1146. [Google Scholar] [CrossRef]
  79. Bergillos, R.J.; Ortega-Sánchez, M. Assessing and Mitigating the Landscape Effects of River Damming on the Guadalfeo River Delta, Southern Spain. Landsc. Urban. Plan. 2017, 165, 117–129. [Google Scholar] [CrossRef]
  80. Nikolov, V. The Prehistoric Salt-Production and Urban Center of Provadia-Solnitsata, Northeastern Bulgaria. J. Mediterr. Geogr. 2016, 126, 71–78. [Google Scholar] [CrossRef]
  81. Paskaleva, I.; Nikolova, S.; Dimitrova, L.; Georgieva, G. Monitoring Networks—Way for Improving Risk Assessment from Natural and Manmade Hazards: Case Study Salt Mine Provadia (NE Bulgaria). Acta Geod. Geophys. Hung. 2010, 45, 388–402. [Google Scholar] [CrossRef]
  82. Stoyanov, S. Provadia Region in Bulgaria—Natural or Induced Seismicity. Rep. Geod. 2006, 5, 247–255. [Google Scholar]
  83. Dulias, R. The Impact of Mining on the Landscape: A Study of the Upper Silesian Coal Basin in Poland; Environmental Science and Engineering Series; Springer International Publishing AG: Cham, Switzerland, 2016; ISBN 978-3-319-29539-8. [Google Scholar]
  84. Cabala, J.M.; Cmiel, S.R.; Idziak, A.F. Environmental impact of mining activity in the upper silesian coal basin (Poland). Geol. Belg. 2004, 7, 225–229. [Google Scholar]
  85. Perski, Z. InSAR and POLinSAR for Land Subsidence Monitoring—User Perspective; ESA: Frascati, Italy, 2003; pp. 321–326. [Google Scholar]
  86. Sopata, P.; Stoch, T.; Wójcik, A.; Mrocheń, D. Land Surface Subsidence Due to Mining-Induced Tremors in the Upper Silesian Coal Basin (Poland)—Case Study. Remote Sens. 2020, 12, 3923. [Google Scholar] [CrossRef]
  87. Przyłucka, M.; Herrera, G.; Graniczny, M.; Colombo, D.; Béjar-Pizarro, M. Combination of Conventional and Advanced DInSAR to Monitor Very Fast Mining Subsidence with TerraSAR-X Data: Bytom City (Poland). Remote Sens. 2015, 7, 5300–5328. [Google Scholar] [CrossRef]
  88. Lazecký, M.; Hatton, E.; González, P.J.; Hlaváčová, I.; Jiránková, E.; Dvořák, F.; Šustr, Z.; Martinovič, J. Displacements Monitoring over Czechia by IT4S1 System for Automatised Interferometric Measurements Using Sentinel-1 Data. Remote Sens. 2020, 12, 2960. [Google Scholar] [CrossRef]
  89. Sarhosis, V.; Giarlelis, C.; Karakostas, C.; Smyrou, E.; Bal, I.E.; Valkaniotis, S.; Ganas, A. Observations from the March 2021 Thessaly Earthquakes: An Earthquake Engineering Perspective for Masonry Structures. Bull. Earthq. Eng. 2022, 20, 5483–5515. [Google Scholar] [CrossRef]
  90. Lekkas, E.; Mavroulis, S.; Mavrouli, M.; Carydis, P.; Agorastos, K. The March 2021 Thessaly Earthquakes and Their Impact through the Prism of a Multi-Hazard Approach in Disaster Management. Geosociety 2021, 58, 1. [Google Scholar] [CrossRef]
  91. Festa, D.; Novellino, A.; Hussain, E.; Bateson, L.; Casagli, N.; Confuorto, P.; Del Soldato, M.; Raspini, F. Unsupervised Detection of InSAR Time Series Patterns Based on PCA and K-Means Clustering. Int. J. Appl. Earth Obs. Geoinf. 2023, 118, 103276. [Google Scholar] [CrossRef]
  92. Medici, C.; Del Soldato, M.; Fibbi, G.; Bini, L.; Confuorto, P.; Mannori, G.; Mucci, A.; Pellegrineschi, V.; Bianchini, S.; Raspini, F.; et al. InSAR Data for Detection and Modelling of Overexploitation-Induced Subsidence: Application in the Industrial Area of Prato (Italy). Sci. Rep. 2024, 14, 17950. [Google Scholar] [CrossRef]
Figure 1. EGMStream webapp workflow. The diagram illustrates the sequential steps of the EGMStream webapp, using red labels for negative responses (No) and green labels for positive responses (Yes), representing the possible choices made by users. Users are prompted to upload the EGMS data in .txt format and optionally the area of interest (AoI) file in .kml, .kmz, or .shp format. The webapp then downloads the EGMS data, extracts the necessary files, and converts the data. At the end of the conversion, users receive an email for downloading the converted data.
Geosciences 15 00154 g001
Figure 2. Possible user settings within the webapp interface.
Geosciences 15 00154 g002
Figure 3. Parameters set for downloading and converting the EGMS data over the sample volcanic area in the Gulf of Naples.
Geosciences 15 00154 g003
Figure 4. Visualisation of the EGMS products, converted using the webapp and displayed through a GIS platform, for different areas of interest affected by various geohazards, both anthropogenic and natural: (i) the volcanic area of Campi Flegrei, Gulf of Naples (Italy); (ii) the landslide in the southern Sørfjorden, Tromsø municipality (Norway); (iii) the subsiding area of Firenze-Prato-Pistoia basin (central Italy); (iv) the Rules Dam and Reservoir, Granada province (Spain); (v) the archaeological site of Solnitsata-Provadia, Varna province (Bulgaria); (vi) the mining subsidence in the Upper Silesian Coal Basin (Czech Republic); (vii) the 2021 Larissa earthquake, Thessaly region (Greece). For the cases of southern Sørfjorden and the Larissa earthquake, time series are shown for the points marked with black circles.
Geosciences 15 00154 g004
Table 1. Processing times for different EGMS product levels and output formats, with and without time series.
Case StudyData FormatEGMS ProductTime SeriesArea (km2)Time
(i)Gulf of NaplesSHPORTHO
(2019–2023)
NO1085.24<1 min
(ii)Southern
Sørfjorden
GEOJSONBASIC
(2019–2023)
YES292.172 h
(iii)Firenze–Prato–Pistoia basinGPKGORTHO
(2018–2022)
NO515.98<1 min
(iv)Rules Dam and ReservoirSHPBASIC
(2019–2023)
NO17.7314 min
(v)Solnitsata-ProvadiaGEOJSONORTHO
(2019–2023)
NO12.65<1 min
(vi)Upper Silesian Coal BasinGEOJSONORTHO
(2018–2022)
NO4849.342 min
(vii)Larissa
earthquake
GPKGBASIC
(2019–2023)
YES988.946 h 28 min
Disclaimer/Publisher’s Note: The statements, opinions and data contained in all publications are solely those of the individual author(s) and contributor(s) and not of MDPI and/or the editor(s). MDPI and/or the editor(s) disclaim responsibility for any injury to people or property resulting from any ideas, methods, instructions or products referred to in the content.

