Abstract
Understanding the in situ stress state and mechanical properties of rock masses is essential for ensuring the stability and safety of quarrying operations. This study aims to estimate the natural stress state of rock using the CSIRO HI (Hollow Inclusion) triaxial overcoring method; we also conducted numerical modelling by applying the Distinct Element Method (DEM) for stability assessments in quarry environments. The investigation provided comprehensive insights into the geomechanical properties of the rock mass and the stability of quarry fronts. Precise measurements and analyses of in situ stress contributed to a detailed understanding of stress distribution within the rock. Additionally, biaxial compression tests further characterized the mechanical behavior of the rock, which was essential for accurate modelling and simulation. Numerical modelling using DEM facilitated an in-depth stability analysis, allowing evaluation of potential failure mechanisms and proposal of effective mitigation strategies. The 3D numerical model was calibrated using in situ measurements from CSIRO HI data and was employed to simulate future excavations. DEM modelling was particularly crucial because of the fractured nature of the rock mass, which necessitated thorough stability verification in excavation design simulations. This research advances the scientific understanding of stress distribution and mechanical behavior in jointed rock masses, ultimately contributing to the development of safer and more efficient quarrying practices.
1. Introduction
This study reports the results of an investigation focused on estimating in situ stress states and conducting numerical modelling to provide scientific insights and perform stability checks on a marble quarry in the Apuan Alps, Italy [1,2,3,4]. The investigation used an integrated approach, combining direct in situ measurements with advanced numerical simulations. We used the CSIRO (Commonwealth Scientific and Industrial Research Organization) Hollow Inclusion (HI) triaxial cell method, a technique that has been extensively validated for measuring the natural stress state of rock masses [5]. The method is based on measuring elastic deformation in a cavity embedded in the rock outcrop and provides high-precision data on stress orientation [6].
The CSIRO HI method offers several advantages over traditional techniques for measuring in situ stress; these include overcoring, hydraulic fracturing and strain gauge monitoring. For example, overcoring, which involves extracting a rock core to measure its stress state, can disturb the natural stress field, reducing the reliability of the results. Additionally, the need to drill into the rock limits its application in fragile or highly fractured materials, where measurements may not be representative of the surrounding rock. In contrast, the CSIRO HI method measures elastic rock deformations thanks to a cell directly inserted into the cavity drilled in the rock, minimizing disturbance to the natural stress field and allowing precise data collection without compromising the surrounding conditions [7]. Hydraulic fracturing, another commonly used technique, involves injecting fluids into a cavity to create fractures and measure the stress induced. This more invasive technique may be ineffective in compact or highly fractured materials where fluid injections cannot induce significant fractures. Furthermore, it only provides information on stress at the induced fractures, limiting the ability to obtain a comprehensive assessment of the stress state of the rock mass [8]. The CSIRO HI method, on the other hand, provides a continuous precise assessment of the in situ stress state, enabling direct measurement of the principal stress components and their orientation. This ability to simultaneously measure the principal stresses without disturbing the natural stress field makes it an innovative and particularly advantageous method compared to other techniques that only focus on local deformations or require invasive modifications to the rock material [9,10].
The specific objectives of the research were as follows:
- Estimation of the in situ stress state using CSIRO HI tests, which determine the natural stress state by measuring the deformation of the rock surrounding the sensor cavity [11];
- Measurement of the biaxial deformability of rock samples, focusing on their response to mechanical stresses. This data is critical for the mechanical characterization of rock and for determining the elastic moduli necessary to calibrate the numerical models [12];
- Advanced numerical modelling by the 3D Distinct Element Method (DEM) to simulate the behavior of the rock mass and to evaluate the stability of the excavation fronts, including the potential impacts of future extraction activities [13].
The study area is the Colubraia Formignacola quarry on the eastern slope of Monte Focoletta (altitude 1677 m a.s.l.) in the municipality of Vagli di Sotto (Lucca, Italy). The quarry features sub-vertical faces created by previous marble extraction operations and includes overhanging walls exceeding 20 m in height relative to the adjacent yards. The excavation surfaces are intersected by fractures that exhibit persistence which can be observed in outcrops at decametric and plurimetric scales. These fractures and structural discontinuities directly affect the stability of the quarry walls, making quantitative and qualitative descriptions of the rock mass discontinuities essential [14]. Engineering-geological analysis is crucial for understanding the stability of the rock mass, as its mechanical behavior depends on various interacting factors, including excavation geometry, in situ stress state and presence of structural discontinuities such as joints and faults [15]. These structural elements influence the propagation of internal stresses which can lead to instability hazards [16]. Joint aperture, orientation and persistence are crucial factors that must be precisely assessed to design safe and effective excavation plans [17]. In this case study, the in situ geomechanical survey, integrated with data from technical reports provided by the ownership [18,19], allowed characterization of the rock mass by the classification methods of Bieniawski [20], Hoek [21] and Romana [22,23]. We also used the CSIRO Triaxial HI method to determine the principal stress components and identify the direction of principal stresses that affect rock behavior [24]. The data obtained from the CSIRO HI tests was used as input for 3D numerical modelling (DEM) [25], which is particularly effective for simulating the behavior of discontinuous rock masses [26]. DEM is valuable for analyzing the stability of quarry faces as it accounts for rupture and sliding along discontinuity surfaces, accurately simulating the behavior of rocks subjected to complex and non-linear loads [27]. To evaluate the stress state of the quarry, both in its current and its projected future state—including the entrance to underground sections—three-dimensional numerical modelling was carried out using 3DEC v.7 software [28]. The geometries of the model and the underground cavities were derived by integrating data from drone-based aerial photogrammetric surveys, a regional 3D point cloud obtained from an aerial flight using LiDAR (Light Detection and Ranging) technology, and detailed topographic information of the area. The results obtained from modelling and calibration with CSIRO HI tests allowed assessment of the current and projected quarry stress states and are therefore useful for addressing potentially critical areas in a direct and precise manner, and thereby continuing extraction activities safely.
2. Geological and Geomorphological Setting
The Colubraia Formignacola quarry is located in the eastern part of the Apuan Alps, specifically on the hydrographic left of Fosso Tambura, which flows into the Arnetola Valley and thence into Lake Vagli (Figure 1).
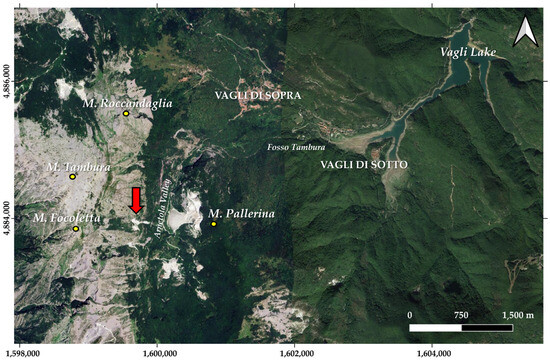
Figure 1.
Location of the study area (red arrow indicates the Colubraia Formignacola quarry). The map was created using the satellite basemap of ESRITM ArcGIS Pro software (version 3.2).
Since 2017, the extraction area has been authorized for mixed cultivation as follows:
- Open-pit mining, which involves lowering the main platform to an elevation of 1168.5 m a.s.l.
- Underground mining, which includes sub-orthogonal exploration tunnels, creating two independent yards between elevations of 1191.5 and 1186.5 m a.s.l.
The extraction area is delimited to the east by steep roads and to the west by the excavation fronts that show differences in elevation ranging from 30 to 80 m. The marble is currently extracted using the multiple step-back method with steps ranging in elevation from 3 to 6 m. At the northwest limit, at 1186.6 m a.s.l., there is an underground test pit approximately 3.2 m high and 6 m deep, while in the southern sector, two exploration tunnels, 6 m high, extend tens of meters in southwest and southeast directions (Figure 2).
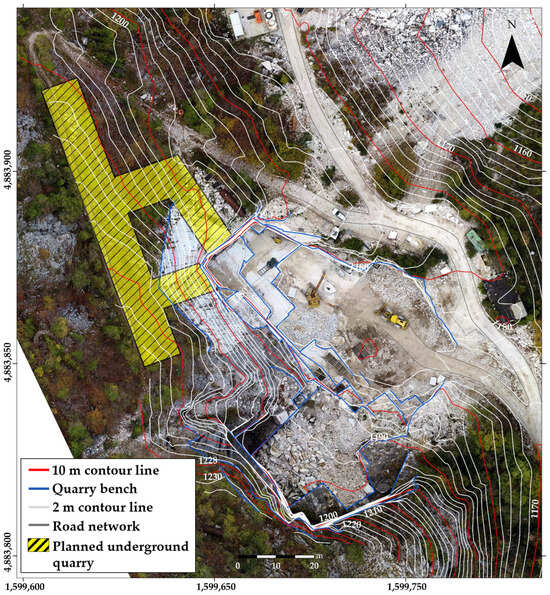
Figure 2.
Orthophotomosaic of the Colubraia Formignacola quarry from the UAV photogrammetric survey, with the planned underground excavation sites highlighted in yellow.
Of particular importance is the current mining plan, which includes underground mining activities. Specifically, it is planned to open the new tunnels, indicated in yellow in Figure 2, in the northwestern sector of the current quarry, specifically at the base of the northernmost exploration test pit. The plan involves constructing several exploratory branches and a secondary exit adjacent the main entrance with tunnels having a constant height of about 6 m. The plan includes leaving a ~12 × 18 m pillar between the two accesses.
The entire area of the Colubraia Formignacola quarry lies within the San Viviano Syncline, a fold related to the D2 tectonic event that modified the original Arni Syncline from the D1 phase [29]. This fold completely affects the Marble Formation, which includes white, grey and ivory-colored marbles with thin layers of muscovite marble and occasionally greenish grey calcschists, as indicated in the Regional Geological Map, section 249070 [30]. Locally, the marbles are interbedded with carbonate phyllites, dolomites and dolomitic marbles. Metamorphic monogenic breccias, composed of marble elements ranging from centimeters to meters in size, are also sometimes present.
The quarry is characterized by the commercial variety “Arnetola Arabescato Marble” as highlighted in Figure 3, which shows an extract from ornamental stone map no. 49 “Minucciano Massa” [31]. This variety consists of breccia with white clasts ranging in size from 5 to 50 cm, featuring flat schistosity surfaces and predominantly calcareous cement, grey in color due to the presence of microcrystalline pyrite (Figure 3B). The geological age is attributed to the Lower Lias.
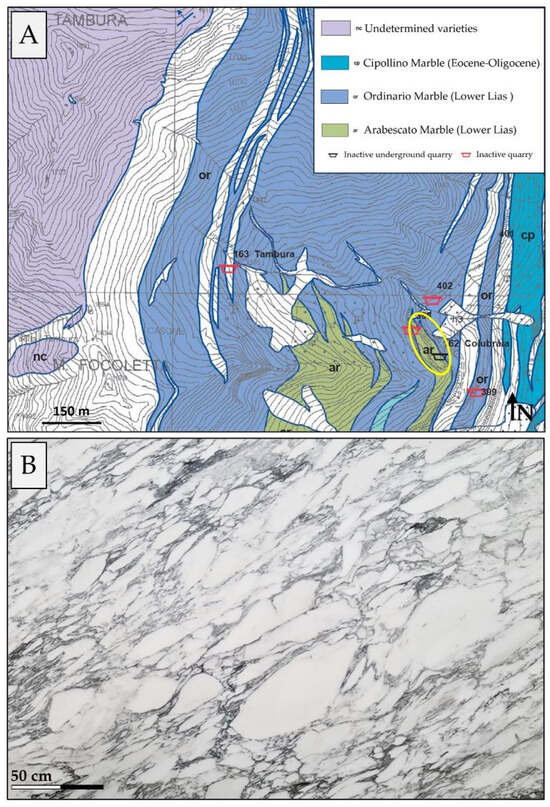
Figure 3.
Ornamental stone map no. 49 “Minucciano Massa” (modified from [31]) with the quarry highlighted by a yellow ellipse (A); example of Arnetola Arabescato Marble (B).
3. Materials and Methods
3.1. Topographic and Cartographic Survey
Due to the considerable height of the quarry walls in the Apuan Alps and the legal requirement of annual mapping, the use of UAVs (Unmanned Aerial Vehicles or drones) for surveys and 3D modelling by aerial photogrammetry has become widespread. Over the years, this need has led to the production of substantial data, also used in research contexts [32,33,34].
The aim of this research was to acquire and generate a 3D point cloud using drone-based aerial photogrammetry, and after accurate georeferencing, to produce the corresponding orthophotomosaic. Artificial targets on the ground were used to georeference the photos; Ground Control Points (GCPs) were measured using geodetic GNSS (Global Navigation Satellite System) receivers in NRTK (Network Real Time Kinematic) mode and the coordinates obtained were projected on national cartographic system Monte Mario Italy 1 coordinate system (EPSG: 3003).
To better illustrate the workflow of the study, Figure 4 shows a flowchart summarizing the main phases of the topographic and cartographic survey, from data acquisition by drone survey to georeferencing and 3D modelling.
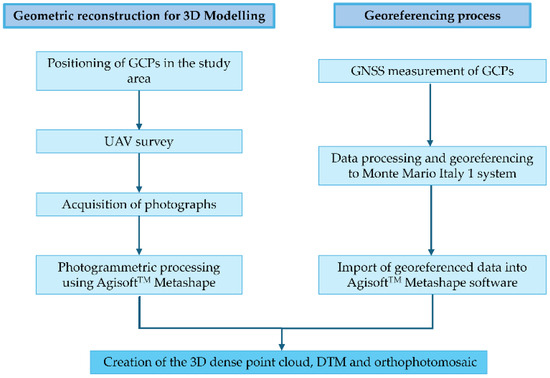
Figure 4.
Workflow showing the main phases of the topocartographic survey.
In this case study, the photogrammetric survey was conducted by the company Spaziottantatre using a DJI Phantom 4 Pro 2.0 drone, equipped with a 1-inch CMOS sensor with a photographic resolution of 20 MP. To georeference the cartographic survey into the EPSG: 3003 reference system, ten GCPs were measured using a TopconTM Hiper VR GNSS receiver in NRTK mode with measurements averaged over 10 epochs, corrected differentially using permanent stations from the NetGeo network. The initial ellipsoidal coordinates were transformed into geoidal coordinates using the ThoposTM code and IGM gk2 grids. The flight mission allowed us to acquire 545 photographs, which were subsequently processed using Agisoft MetashapeTM v. 2.0.2 software which employs Structure from Motion [35] and Multi-View Stereo (MVS) [36,37,38] techniques to align photographic images. This enabled the creation of the dense 3D point cloud, the Digital Terrain Model (DTM), and the orthophotomosaic of the study area.
3.2. Geotechnical Characterization of the Rock Mass
3.2.1. Intact Rock Properties
The physical and mechanical properties of the intact rock were primarily obtained from technical reports provided by the quarry owner [19]. The values of the elastic parameters (i.e., Young’s modulus “E” and Poisson’s ratio “ν”) were determined by biaxial compression tests conducted in situ as part of this study. These tests were essential for evaluating the rock’s response to stress under realistic conditions. According to [19], the geomechanical data on intact rock are from the Catalog of Commercial Varieties of Apuan Marbles [39]. The catalog provides comprehensive information on the various Apuan marble types including their physical and mechanical properties. The characteristics derived from these sources are summarized in Table 1.

Table 1.
Geomechanical parameters of the intact rock.
3.2.2. Characteristics of Discontinuities
In order to create the 3D model of the quarry for assessing the stress states, as done by other authors for similar purposes [40,41,42], it was necessary to characterize the discontinuities affecting the rock mass under study. The in situ engineering–geological survey involved measuring and defining the following characteristics for each discontinuity: type, dip and dip direction, spacing, length, persistence, termination, aperture, surface roughness (JRC—Joint Roughness Coefficient), weathering, presence of water and intact rock and Joint wall Compressive Strength (JCS). To obtain accurate measurements, standard geological survey techniques were employed, including a geological compass to measure dip and dip direction, and measuring tapes to determine joint spacing and length. Surface roughness was estimated using Barton’s comb, an instrument that measures asperities and irregularities along the discontinuity plane’s maximum gradient line and enables calculation of JRC. Aperture of joints was measured using calipers. Weathering was assessed by visual inspection, while moisture conditions and potential water flow along discontinuity planes were assessed. Intact rock and joint wall compressive strength were estimated using a Schmidt hammer, which assesses surface hardness as a proxy for strength.
3.2.3. Rock Mass Classification
For characterization of the rock mass, the following classification methods were used: Bieniawski’s RMR (Rock Mass Rating) [20,43,44], Hoek’s GSI (Geological Strength Index) [15,21,45], and Romana’s SMR (Slope Mass Rating) [22,23]. These methods were essential for evaluating the quality and the stability of the rock mass in the study area.
The slopes used for SMR are oriented approximately NE–SW and NW–SE (Figure 5) and their dip direction and dip are 141°/86° and 54°/86°, respectively. These orientations were selected because they are expected to be directly affected by future quarrying operations.
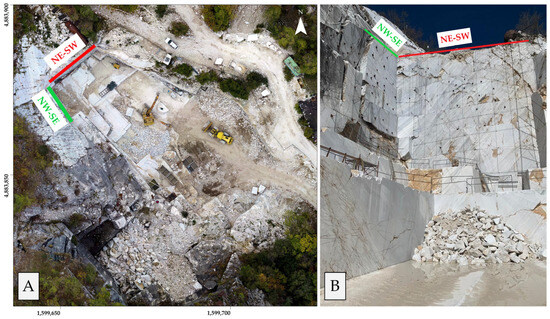
Figure 5.
Green and red lines indicate the slopes considered for the SMR (A,B). Perspective view of the northern sector of the quarry with evidence of anchors and reinforcement nets used to ensure safety for the workers (B).
3.3. CSIRO HI Triaxial Cell Tests
Three measurements of the stress state of the rock were conducted on the NE–SW and NW–SE walls of the quarry (Figure 5) at depths ranging from 1.09 to 7.89 m. The stress measurements involved three overcoring tests using the CSIRO HI CELL technique [46,47,48], performed in specifically created sub-horizontal boreholes in the quarry walls (Figure 6). Table 2 summarizes the size, orientation and depth of each borehole.
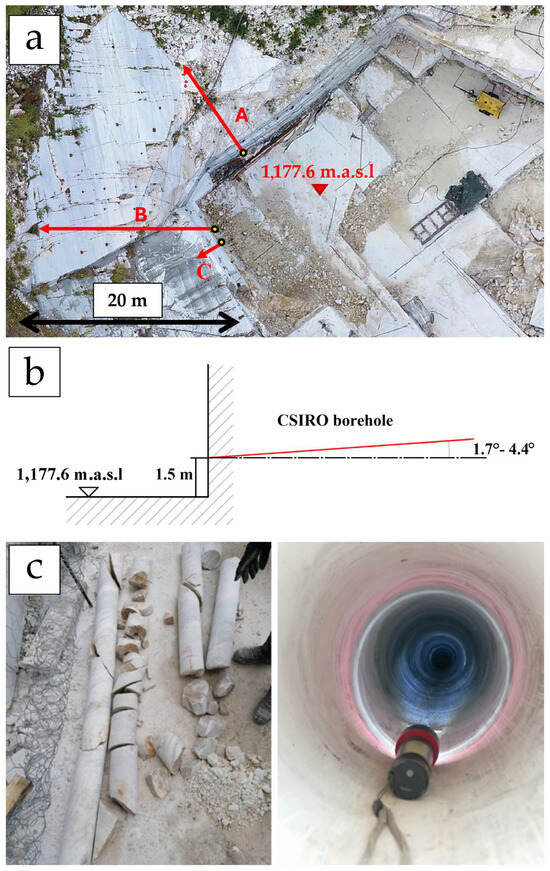
Figure 6.
Map of the CSIRO HI cell test location (a); capital letters A, B and C indicate the orientation and depth of boreholes as shown in Table 2. Scheme of the borehole geometric characteristics (b); example of marble samples extracted from a borehole (c).
Table 2.
Size, orientation and depth of boreholes.
During overcoring, two of the three boreholes crossed a joint that caused breakage of the cores. Radial compression tests using a Hoek–Franklin pressure cell to determine the elastic parameters of the material cannot generally be performed on irregularly shaped rock cores. The classic interpretative procedure for stress release tests is based on analytical formulations that assume a regularly shaped cylindrical sample [48,49]. However, in highly fractured rock masses, such as the present, overcoring may intercept a discontinuity, causing the extracted sample to break. A recent paper by De Lucia et al. [50] demonstrated the possibility of overcoming the challenges posed by irregularly shaped cores so that tests on fractured cores can be interpreted and the elastic parameters of the rock determined. We therefore followed the procedure of [50].
3.4. Distinct Element Numerical Modelling
The formulation and development of the Distinct Element Method were introduced by Cundall in 1971 [25] for the mechanical analysis of rocks. In a distinct element model, it is possible to simulate the mechanical response of a system composed of discrete blocks or particles under static or dynamic loads [25]. According to this approach, blocks are the fundamental unit of the model structure, while discontinuity surfaces are regarded as boundary conditions. We used 3DEC version 7 software [28] to simulate the response of the rock mass under static conditions. The procedure for constructing the model involved several operational phases:
- geometric modelling: creation of a 3D model composed of distinct elements;
- definition of constitutive models and material properties for the rock matrix and discontinuities;
- assignment of initial stresses and boundary conditions to the model;
- solving process for stress analysis and rock mass behavior monitoring.
The first step in building the 3D numerical model was to upload the geometries of the external morphology (Figure 7), created by integrating 3D dense point clouds from drone-based photogrammetry and aerial scanning data from regional LiDAR surveys. With a spatial resolution of 1 m, the latter includes multiple signal returns, allowing the data to be filtered so as to extract only geometric information related to the topographic surface. Thus, plants, trees and man-made structures unrelated to the terrain were excluded.
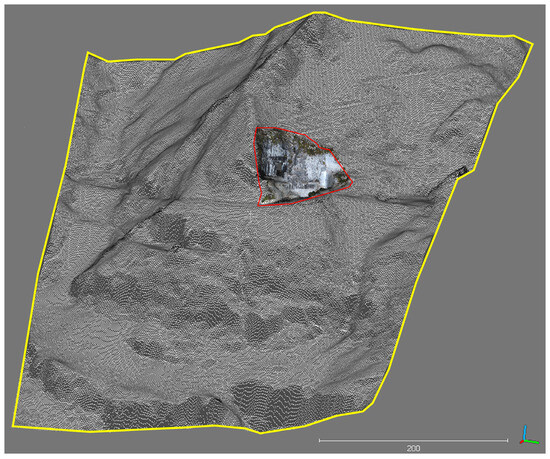
Figure 7.
3D dense point cloud of the topographic surface. The red line encloses the point cloud from drone-based photogrammetry; the yellow line encloses the point cloud from aerial LiDAR.
Using Agisoft MetashapeTM [51] v.2.0.2 and RhinocerosTM [52] v.8 software, the 3D dense point cloud was interpolated to create a digital model in mesh format. Figure 8 shows the mesh representing the current state of excavation, reflecting the actual condition of the site. Figure 9 illustrates the planned state of the Colubraia Formignacola quarry after the underground excavations. In the latter, the underground tunnels were modelled using Rhinoceros™ software with topographic data from the project state map, ensuring consistency with the planned excavation characteristics outlined in [19]. Additionally, data related to the discontinuity sets, obtained from traditional engineering–geological surveys and the map of joints [19], were both incorporated in the 3D model to accurately simulate the degree of fracturing.
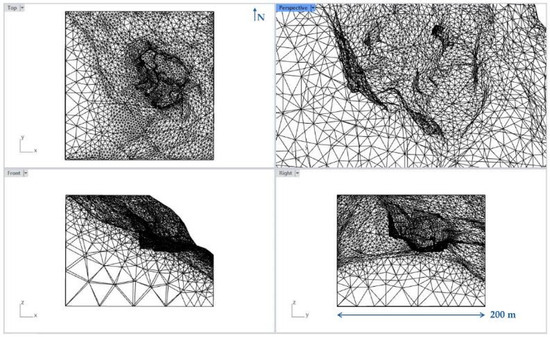
Figure 8.
Non-rendered mesh of the current state of the quarry (snapshot from Rhinoceros™).
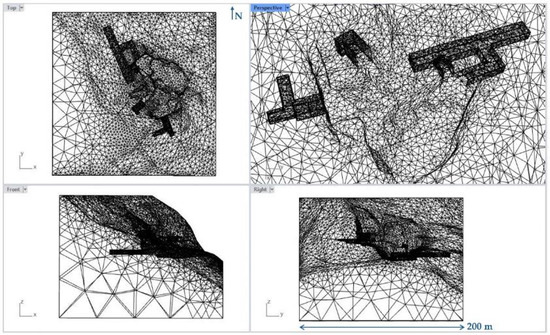
Figure 9.
Non-rendered mesh of the quarry project (snapshot from Rhinoceros™).
The mesh of the model was carefully optimized, using a finer mesh in critical areas such as tunnels and fractures, and a coarser mesh in less sensitive regions to balance accuracy and computational efficiency.
Data related to the discontinuity sets, obtained by traditional engineering-geological surveys and the joint map [19], properly georeferenced to ensure their exact locations using real-world coordinates, was also incorporated in the 3D model. This inclusion of planes representing the main discontinuities of the area further enhanced the geological accuracy of the model. Note that since the main schistosity represents the texture of the marble but does not amount to a weakness, it was not implemented as a discontinuity in the 3D numerical modelling.
The final geometry of the model (“current state” from which the geometries were subsequently excavated to obtain the “projected state”), imported into the 3DEC v.7 software for the purposes of DEM analysis, can be observed in Figure 10, which also shows the main discontinuities mapped.
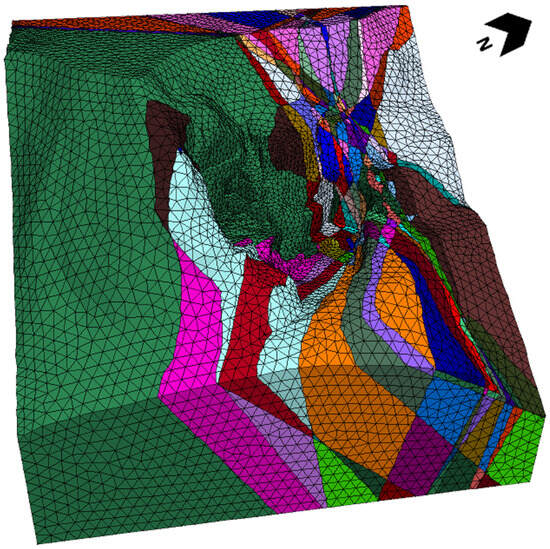
Figure 10.
3D model used for numerical analysis. Different colors represent discrete blocks separated by discontinuities.
To represent the behavior of the entire rock mass during the simulation, it is necessary to assign the appropriate physical and mechanical properties to the intact rock (“Marmo Arabescato Arnetola”) and to the discontinuity surfaces. This was achieved by application of suitable constitutive models. Firstly, the modelling procedure involved assigning a constitutive model to the intact rock. Since it was decided to use the Mohr–Coulomb constitutive model [53] and deformable blocks, the following parameters were assigned to the intact rock (see Table 1 for details): density (kg/m3), Young’s modulus (MPa), Poisson’s ratio (-), cohesion (MPa) and friction angle (°).
The Coulomb sliding model [54] was used for the discontinuity surfaces. This application involves defining the mechanical behavior of the discontinuities using the following parameters: friction angle (°) and stiffness (Pa/m) with respect to normal and shear stress, namely normal stiffness and shear stiffness, respectively. The friction angle of discontinuities is reported in [19] while normal stiffness and shear stiffness resulted from processing data from this study concerning Barton’s formula [55].
Finally, the boundary conditions were assigned to the model to approximate its behavior to real conditions. In particular, a 3D zero velocity was applied to the lower, lateral and back limits of the model to avoid unreal deformations and displacements. The stress regime was calibrated using point stress values as measured in situ by the CSIRO HI cell tests as described in [4].
4. Results
4.1. Topographic and Cartographic Data
More than 500 photos acquired by drones were processed using Agisoft MetashapeTM software to produce the dense 3D point cloud shown in Figure 11. Consisting of more than 9,700,000 points, the point cloud was subsequently used to build a DTM (Figure 11) with a spatial resolution of 10 cm/pixel, and an orthophotomosaic with a Ground Sampling Distance (GSD) of 3 cm. The products were georeferenced to the Monte Mario Italy 1 coordinate system, using 10 GCPs spatially well distributed in the area. The positioning errors, expressed as Root Mean Square Error (RMSE), for these GCPs are provided in Table 3, which also indicates the total number of GCPs used and their corresponding errors.
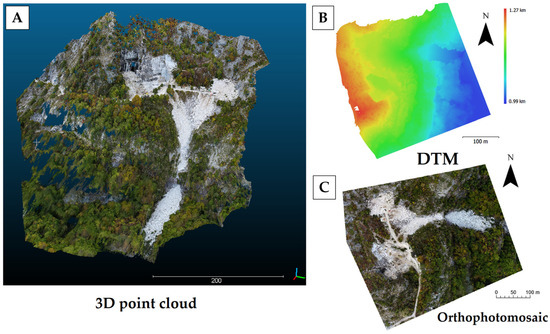
Figure 11.
Products of the photogrammetric process: 3D dense point cloud (A); DTM (B); orthophotomosaic (C).
Table 3.
Summary of positioning errors (RMSE) relative to the GCPs.
4.2. Rock Mass Classification
The geomechanical survey focused on the primary working fronts of the quarry (Figure 5). The intensity of fracturing is evident from direct examination of these fronts. The many anchors and reinforcement nets demonstrate the need for remediation work to ensure worker safety.
Integration of data from the engineering-geological survey with existing project data [18,19] facilitated a comprehensive characterization of the rock mass. This extensive dataset enabled identification of the primary discontinuity systems in the study area. Figure 12 illustrates the orientations of the discontinuities observed during the field survey, plotted by the Schmidt equal-area method (lower hemisphere). Four distinct sets, including joints and schistosity, can be identified. The average dips and dip directions of these systems are summarized in Table 4.
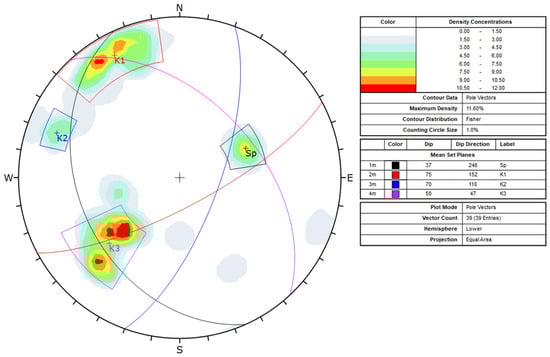
Figure 12.
Stereogram of the discontinuities measured during the traditional engineering–geological survey and the sets identified (K1,…Kn); the stereonet includes the main schistosity (Sp). Data is in terms of dip and dip direction, right-hand rule, using the Schmidt equal-area method (lower hemisphere). Grey shades indicate different density concentrations.
Table 4.
Average characteristics of the discontinuity sets identified.
Analysis of the discontinuity data allowed classification of the rock mass according to the RMRb index [21]. The index was quantified by summing the five partial indices of uniaxial compressive strength (A1), rock quality designation (RQD) and Jv (volumetric joint count) (A2), spacing of discontinuities (A3), condition of discontinuities (A4) and groundwater conditions (A5). Table 5 shows the values of each parameter.
Table 5.
Values of partial indices used to classify the rock mass in the RMRb system.
The RMRb index of the rock mass was 68.65, which, lying in the range 61 to 80 according to Bieniawski [20] indicates a rock mass of good quality (Class II).
The RMRb was then correlated with the GSI [45] using the following empirical formula:
GSI = RMRb − 5 = 68.65 − 5 = 63.65
Since, as recommended by [56], the GSI value should not be regarded as rigid, we defined a range that comprehensively describes the state of the rock mass. The results suggest that the GSI of the rock mass in the study area falls reasonably in the range 60–70, indicating medium to low quality. To assess the relationship between slope orientation and discontinuities, we applied the SMR classification method [22,23] to the NE–SW and NW–SE slopes as shown in Figure 5. The analysis included planar sliding, toppling and wedge failure phenomena. Since the minimum SMR value was estimated to be 10.30 for both planar and wedge failures, the rock mass was classified in class V, which indicates very poor quality with possible instability phenomena and need of slope reprofiling.
4.3. Results from CSIRO HI Cell Tests
Each of the three CSIRO tests provided a point measurement of the existing three-dimensional stress state of the rock (Table 6).
Table 6.
Summary of CSIRO HI cell test results (± indicates 68% confidence limits). E: Young’s modulus; ν: Poisson’s ratio; σ1, σ2, σ3: maximum, intermediate and minimum principal stresses (+ indicates compression); σv: vertical component of stress tensor (+ indicates compression).
4.4. Results from Distinct Element Numerical Modelling
Applying the geomechanical characteristics of the rock, summarized in Table 7, and those of the discontinuities shown in Table 8, the displacements, maximum principal stresses (σ1), minimum principal stresses (σ3) and maximum shear stress (τmax) were calculated based on the 3D numerical model of the Colubraia Formignacola quarry.
Table 7.
Summary of the mechanical characteristics assigned to the intact rock for creation of the numerical model.
Table 8.
Mechanical characteristics assigned to the discontinuities for creation of the numerical model according to the Coulomb sliding criterion [54].
Elastic modulus (Ei) and shear modulus (Gi) of the intact rock, elastic modulus (Em) and shear modulus (Gm) of the rock mass, as well as joint spacing (L), were used to calculate normal stiffness (Kn) and shear stiffness (Ks) of the discontinuities according to [55] (Table 8).
Figure 13 shows the results of the current-state cultivation model in terms of displacements (Figure 13A) and maximum shear stress τmax (Figure 13B). Of the various parameters analyzed, it was decided to show τmax because it is directly correlated with deviatoric stress (σ1−σ3), which in relation to the threshold values (see Discussion), allows an approximate estimation of rock mass strength.
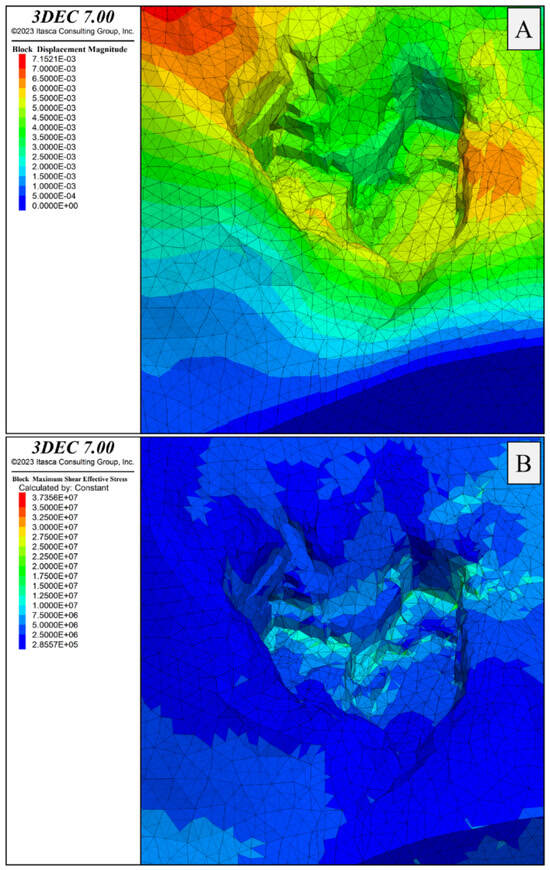
Figure 13.
Detail of quarry walls showing the distribution of displacement values in meters (A) and maximum shear stress τmax in Pascal (B) in the current excavation state.
For a better analysis of the results and a focus on the areas that will be influenced by the project, three sections, traced in Figure 14 and labelled AA’, BB’ and CC’, were created. They precisely intersect the positions of the overcoring tests.
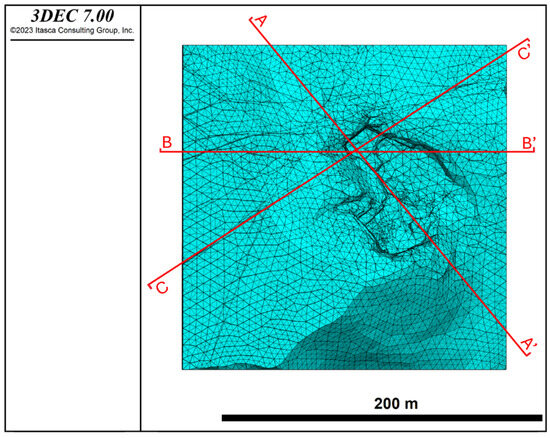
Figure 14.
Plan of the 3D model with sections AA’, BB’, and CC’ indicated in red.
Figure 15, Figure 16 and Figure 17 show the values of displacement and maximum shear stress τmax for sections AA’, BB’ and CC’, respectively. To summarize the results, only images related to maximum shear stress are shown, while information on σ1 and σ3 is provided at the end of the section.
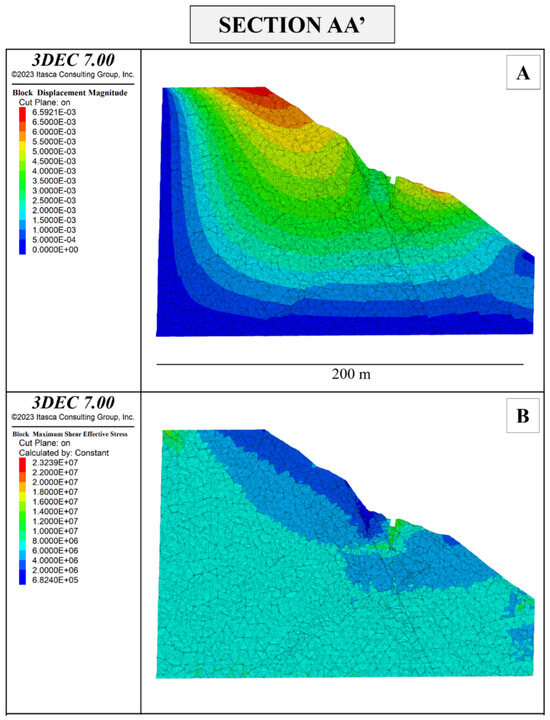
Figure 15.
Displacement magnitude in meters (A) and maximum shear stress τmax in Pascal (B) of section AA’ of the Colubraia Formignacola quarry in its current state of excavation.
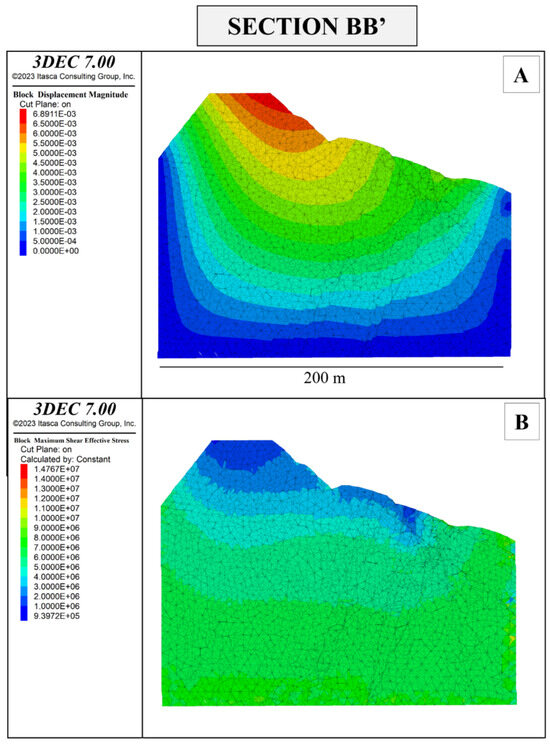
Figure 16.
Displacement magnitude in meters (A) and maximum shear stress τmax in Pascal (B) of Section BB’ of the Colubraia Formignacola quarry in its current state of excavation.
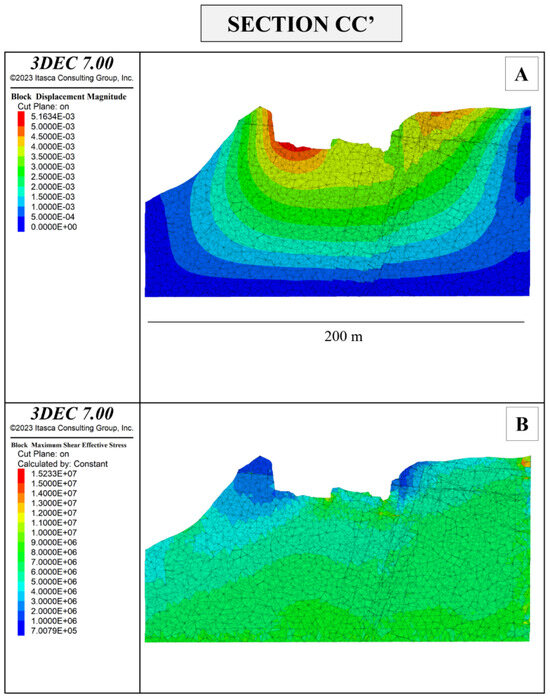
Figure 17.
Displacement magnitude in meters (A) and maximum shear stress τmax in Pascal (B) of section CC’ of the Colubraia Formignacola quarry in its current state of excavation.
Once the relevant information for estimating the stresses acting in the current state of excavation had been determined by the 3D numerical model, using data on the geometry of the planned underground extraction site (Figure 18) from project topography, it was possible to simulate evolution of stresses after completion of the underground work.
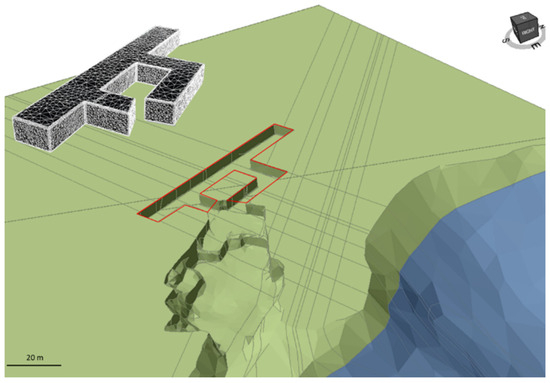
Figure 18.
Three-dimensional model of the future underground site according to the project.
Figure 19A shows displacement magnitude and Figure 19B the maximum shear stress τmax resulting from the project. Figure 20, Figure 21 and Figure 22 show the displacements and maximum shear stresses τmax in sections AA’, BB’ and CC’, respectively.
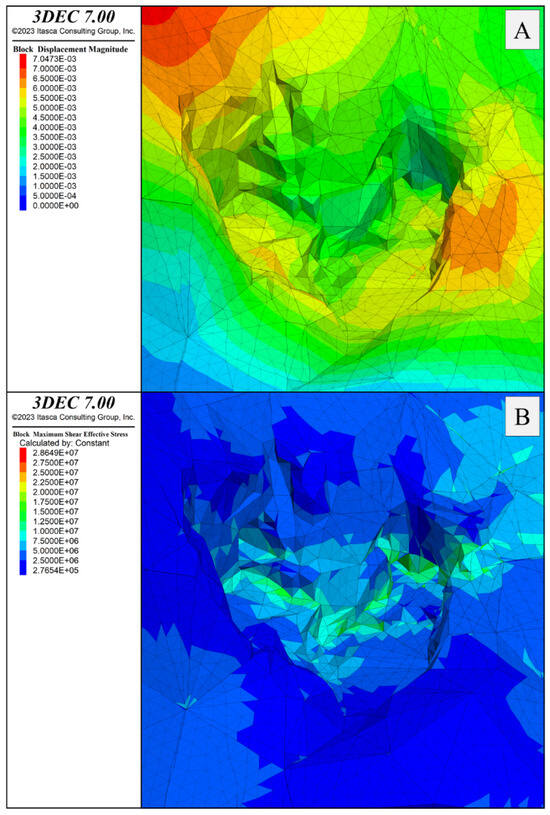
Figure 19.
Detail of the quarry faces showing the distribution of displacement values in meters (A) and maximum shear stress τmax in Pascal (B) resulting from the project.
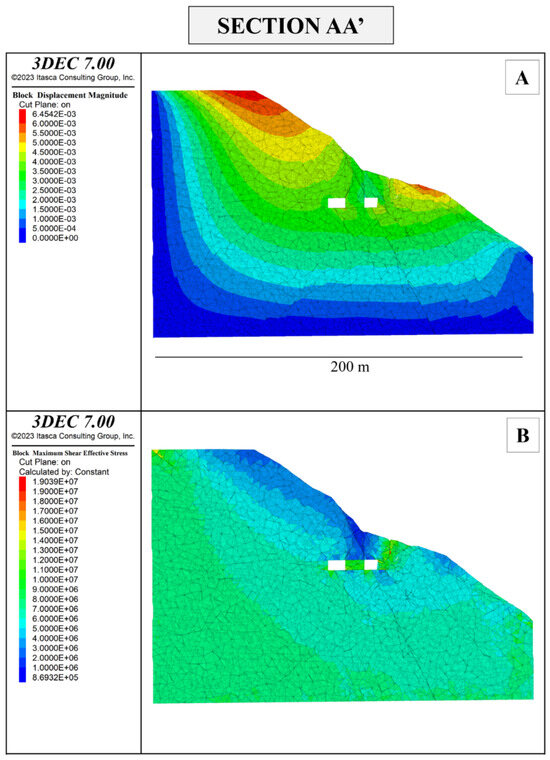
Figure 20.
Section AA’ shows block displacement magnitudes in meters (A) and maximum shear stress τmax in Pascal (B) resulting from the project.
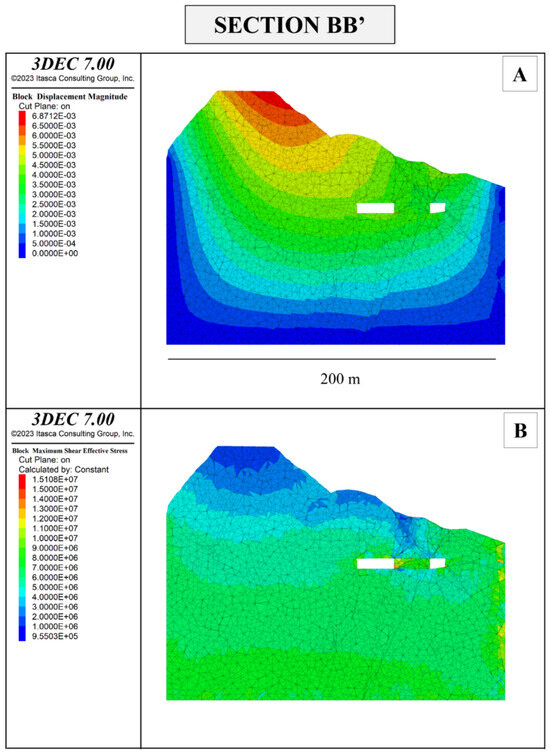
Figure 21.
Section BB’ shows block displacement magnitudes in meters (A) and maximum shear stress τmax in Pascal (B) resulting from the project.
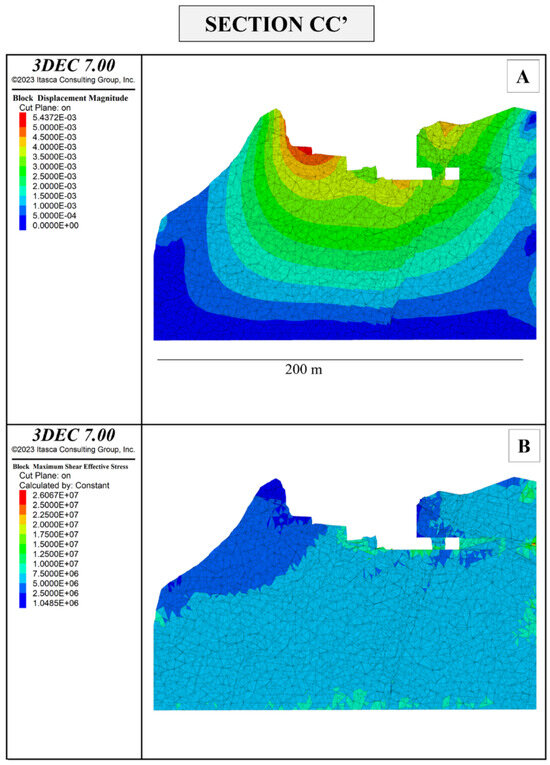
Figure 22.
Section CC’ shows block displacement magnitude in meters (A) and maximum shear stress τmax in Pascal (B) resulting from the project.
Considering the model representing the current state of the quarry, the maximum principal stress σ1 in the excavation area ranges from approximately −0.7 to 40 MPa. The minimum principal stress σ3 ranges from about −5 to 13 MPa. The maximum shear stress τmax is 16 MPa. Not dissimilar information can be extracted from the model representing the projected state. In the immediate surroundings of the future underground tunnels, the maximum principal stress σ1 ranges from −6 to 47 MPa, the minimum principal stress σ3 ranges from −10 to 15 MPa, while maximum shear stress τmax is 15 MPa. Similarly, the maximum observed displacements are 4 mm in the current state and approximately 5 mm in the projected state.
5. Discussion
Geological study of the Colubraia Formignacola quarry highlights a complex geological–structural framework due to numerous discontinuities with highly variable characteristics and orientations. This condition made the in situ geomechanical survey, integrated with existing data from previous surveys [18,19], a fundamental tool for interpreting and modelling the behavior of the rock mass. The measured data identified four main discontinuity systems: Sp (dip direction 246°/dip 37°), K1 (152°/75°), K2 (110°/70°) and K3 (47°/50°).
Using the results of the geomechanical survey, rock mass quality was classified by the methods of Bieniawski [20], Hoek & Brown [45] and Romana [22,23]. Although the RMRb method and the GSI indicate good to fair rock mass quality, further classification with Romana’s SMR method showed that critical conditions may also be present in relation to the orientation of slopes. The K2 and K3 discontinuity sets, which have a SMR of 10.30, are prone to instability with large planar failures and/or to roto-translational collapses and need consolidation and reinforcement as already implemented on the quarry walls.
Integration of the discontinuity data with 3D point clouds from drone-based photogrammetry and regional aerial surveys was crucial for building a three-dimensional numerical model of the quarry. This approach, inspired by previous studies using DEM for stability analysis in similar Apuan Alps contexts [57,58,59], has highlighted that the non-elastic behavior of intact rock may be limited and have little influence on the results. Discontinuities play a more important role with significant variations in stress states along the quarry fronts, both in current and future excavation states.
In the current extraction areas, maximum compressive stress values are up to 40 MPa, which is significantly below the rock’s compressive strength of 126 MPa (Table 1). Similarly, in the projected excavation state, maximum compressive stress reaches 50 MPa. Tensile stresses in the current excavation zones are minimal, around −5 MPa. Specific sections, such as AA’, show localized σ1 stress values up to approximately −2.5 MPa, while in section CC’ σ1 values of −5 MPa occur. Although these values are below the rock’s tensile strength limit (−8 MPa, Table 1), discontinuities intersecting excavation surfaces may locally exceed this threshold.
In the projected excavation state, compressive and tensile stress magnitudes are generally below the rock’s strength: in certain confined areas of section BB’, σ3 values around −5 MPa were detected, particularly in the “pillar” area between the two future tunnels. Section CC’ shows σ1 values around −2 MPa and σ3 values around −5 MPa. Only a few places in the excavation walls of section AA’ show tensile stress levels related to σ1 around −5 MPa, while σ3 reaches approximately −10 MPa.
Shear stress τmax reaches a maximum of 16 MPa in the current state and approximately 15 MPa in the projected state. Both values are below the rock’s shear strength limit of 20 MPa (Table 1).
With reference to Mohr’s circle [60], a direct relationship exists between deviatoric stress (σ1−σ3) and maximum shear stress τmax: the latter corresponds to the circle radius, then to the semi-difference between the principal stresses σ1 and σ3, i.e.:
According to Mohr’s circle principles, given the maximum shear stress τmax, the deviatoric stress (τd) acting on the quarry can be calculated with the following formula:
Since τmax is equal to 16 MPa in the current excavation state, the deviatoric stress τd can be computed as 2⋅16 = 32 MPa. Similarly, with τmax equal to 15 MPa in the projected excavation state, the deviatoric stress τd is equal to 2⋅15 = 30 MPa. To critically evaluate the sustainability of the deviatoric stress values obtained during numerical modelling, we therefore used the Hoek & Brown failure criterion [61] according to the following equation:
where
- σc denotes the uniaxial compressive strength of the rock,
- mb and s are empirical constants.
Referring to [62], a fractured rock mass undergoes new fractures when the deviatoric stress σ1−σ3 exceeds the Hoek & Brown criterion [61] starting from values of mb = 0 and s = 0.11. In this case, the failure criterion becomes
It can therefore be stated that in the case of the Colubraia Formignacola quarry, where the uniaxial compressive strength of Arabescato Marble is 126 MPa, the rock may exhibit critical conditions in areas where the deviatoric stress exceeds the threshold of
The deviatoric stress near the excavation fronts in the current and projected excavation states is below the critical value calculated by [61] (τd = 32 and 30 MPa, respectively).
For a more conservative approach, the results can also be evaluated with respect to the deviatoric stress limit proposed for Carrara Marble by [42], which is formulated as follows:
In this case, the deviatoric stress values obtained by our modelling for current and projected states exceed the calculated threshold. However, the calculated maximum stress values refer primarily to corner zones where localized stress concentration is evident. Furthermore, these stress values are expected to decrease after installation of stabilization measures, already present in significant numbers in the highest areas of the NE–SW and NW–SE quarry fronts. Note that since the area around the pillar between the two future tunnels shows higher deviatoric stress values, it will require particular attention. Further 3D numerical modelling, which incorporates the stabilization measures, is in progress.
Finally, an important comment is warranted on the CSIRO tests: although carried out at non-significant depths due to the high joint intensity of the rock mass, they allowed calibration of the 3D model according to the procedure described in [4] and therefore assessment of the current and projected quarry stress states. The results are useful for the safe continuation of extraction activities since they directly and precisely address potentially critical areas.
6. Conclusions
The geological and geomechanical analysis of the Colubraia Formignacola quarry unveiled several critical insights into rock mass stability. By integration of in situ geomechanical surveys with pre-existing data, significant variations in stress states and rock mass quality were identified, particularly due to the complex system of discontinuities.
A key strength of this study was the integration of 3D point clouds and LiDAR data, which were essential for developing a highly accurate numerical model using the Distinct Element Method. This model, calibrated with in situ stress measurements, allows stress analysis at any point in the rock mass, significantly enhancing the accuracy and reliability of slope stability assessment. The results demonstrate that while the maximum compressive stresses are below the rock’s failure threshold, localized tensile and shear stresses can approach critical levels.
Although the overall deviatoric stress τd is within the acceptable limits defined by [61,62], it exceeds the more conservative threshold proposed by [42] for Carrara Marble, particularly near the pillar that will remain after the planned underground excavation. This suggests that although general stability is maintained, localized stress concentrations could pose risks that must be considered.
The high-resolution model developed in this study offers an invaluable tool for ensuring worker safety, as it enables real-time monitoring and precise prediction of stress conditions across the quarry. The ability to assess the stress distribution of the rock mass everywhere provides a proactive means for managing risk during excavation.
The methods and techniques employed can be extended beyond the specific context of the Apuan Alps, for example to other quarries or underground projects in regions with similar geological conditions. The integration of in situ surveys, laboratory tests and numerical modelling allows results generalized to similar contexts, both natural and artificial, where understanding the behavior of the rock mass and discontinuities is crucial. These approaches, based on established geomechanical principles, provide valuable insights for improving practice and decision-making in the design and management of extraction sites and underground infrastructure.
The results of this study suggest that additional stabilization measures are needed to effectively manage localized stress concentrations. It is therefore essential to continue implementing advanced stabilization techniques and to enhance geotechnical and topographic monitoring systems. Adopting these measures will be crucial for ensuring worker safety and long-term stability as excavation progresses.
In future, the proposed model could be used to optimize the design of tunnels and galleries, improve long-term management of discontinuities and stresses, and predict rock mass behavior under extreme stress scenarios or seismic events. Additionally, the method developed could be applied to the design of support and stabilization systems for excavation procedures, contributing to the safety and sustainability of underground work.
Author Contributions
R.S. is the Unit Project Coordinator for the University of Siena; R.S. was involved in the review and supervision of the study. D.G. and D.M. coordinated research activities on behalf of the UOC Ingegneria Mineraria—USL Toscana Nord-Ovest, Tuscany Region; V.D.L., R.S., and A.E. carried out engineering–geological surveys and contributed writing and editing to this manuscript. V.D.L. contributed to the analysis, processing, validation, and care of the data. V.D.L. performed 3D modeling and rock slope stability analysis using 3DEC©; S.G. performed in situ stress tests using the CSIRO HI cells and data analysis. All authors have read and agreed to the published version of the manuscript.
Funding
This research was funded by Tuscany Region through the UOC Ingegneria Mineraria—USL Toscana Nord-Ovest.
Data Availability Statement
Data is contained within the article.
Acknowledgments
We would like to thank the company Spaziottantatre for providing the aerial photogrammetric survey data from drones, which were essential for this study. Their contribution has been instrumental in ensuring the accuracy and reliability of our research. This publication was produced while A.E. was attending the PhD program in PhD Space Science and Technology at the University of Trento, Cycle XXXIX, with the support of a scholarship financed by the Ministerial Decree no. 118 of 2 March 2023, based on the NRRP—funded by the European Union—NextGenerationEU—Mission 4 “Education and Research”, Component 1 “Enhancement of the offer of educational services: from nurseries to universities”—Investment 4.1 “Extension of the number of research doctorates and innovative doctorates for public administration and cultural heritage”—CUP E66E230001100001.
Conflicts of Interest
Author Stefano Guido was employed by the company SIAL.TEC Engineering S.R.L. The remaining authors declare that the research was conducted in the absence of any commercial or financial relationships that could be construed as a potential conflict of interest.
References
- Iabichino, G.; Cravero, M. Geomechanical measurements and computations at an open pit marble quarry. In Proceedings of the 12th International conference of IACMAG (International Association for Computer Methods and Advances in Geomechanics), Goa, India, 1–6 October 2008; pp. 1–6. [Google Scholar]
- Oreste, P.; Soldano, S. Static and dynamic analyses of the stability of mining wastes (Ravaneti) in the Carrara Marble area (Apuan Alps, Italy). Arch. Min. Sci. 2012, 58, 667–686. [Google Scholar] [CrossRef]
- Perazzelli, P.; Rotonda, T.; Graziani, A. Stability analysis of an active marble quarry by DEM modelling. In Proceedings of the International Conference on Rock Joints and Jointed Rock Masses, Tucson, AZ, USA, 7–8 January 2009; pp. 1–9. [Google Scholar] [CrossRef]
- Salvini, R.; Ermini, A.; De Lucia, V.; Beltramone, L.; Silvestri, D.; Rindinella, A.; Guido, S.; Marchetti, D.; Gullì, D. Stress–strain investigation of the rock mass based on overcoring with CSIRO HI cell test and numerical modeling: A case study from an Italian underground marble quarry. Geosciences 2022, 12, 441. [Google Scholar] [CrossRef]
- Sjöberg, J.; Christiansson, R.; Hudson, J.A. ISRM suggested methods for rock stress estimation—Part 2: Overcoring methods. Int. J. Rock Mech. Min. Sci. 2003, 40, 999–1010. [Google Scholar] [CrossRef]
- Brady, B.H.G.; Brown, E.T. Rock Mechanics for Underground Mining, 3rd ed.; Springer: Dordrecht, The Netherlands, 2004; pp. 242–270. [Google Scholar]
- Huasheng, L.; Joung, O.; Masoumi, H.; Ismet, C.; Chengguo, Z. A review of in-situ stress measurement techniques. Geotech. Test. J. 2018, 43, 95–102. [Google Scholar]
- Subrahmanyam, D.S. Evaluation of hydraulic fracturing and overcoring methods to determine and compare the in-situ stress parameters in porous rock mass. Geotech. Geol. Eng. 2019, 116, 13–22. [Google Scholar] [CrossRef]
- Li, Y.; Fu, S.; Qiao, L.; Liu, Z.; Zhang, Y. Development of Twin Temperature Compensation and High-Level Biaxial Pressurization Calibration Techniques for CSIRO In-Situ Stress Measurement in Depth. Rock Mech. Rock Eng. 2019, 52, 1115–1131. [Google Scholar] [CrossRef]
- Jin, Z.; Li, Y.; Li, Q.; Liu, Z.; Wu, S.; Wang, Z. Modification of the CSIRO method in the long-term monitoring of slope-induced stress. Front. Earth Sci. 2022, 10, 981470. [Google Scholar] [CrossRef]
- Zoback, M.D. Reservoir Geomechanics; Cambridge University Press: Cambridge, CA, USA, 2007; pp. 266–298. [Google Scholar] [CrossRef]
- Goodman, R.E. Introduction to Rock Mechanics, 2nd ed.; John Wiley & Sons: New York, NY, USA, 1989. [Google Scholar]
- Cundall, P.A.; Strack, O.D.L. A discrete numerical model for granular assemblies. Geotechnique 1980, 29, 47–65. [Google Scholar] [CrossRef]
- Barton, N.; Choubey, V. The shear strength of rock joints in theory and practice. Rock Mech. Rock Eng. 1977, 14, 573–582. [Google Scholar] [CrossRef]
- Hoek, E.; Kaiser, P.K.; Bawden, W.F. Support of Underground Excavations in Hard Rock; AA Balkema: Rotterdam, The Netherlands, 1995; p. 300. [Google Scholar]
- Guzzetti, F.; Carrara, A.; Cardinali, M.; Reichenbach, P. Landslide hazard evaluation: A review of current techniques and their application in a multi-scale study, Central Italy. Geomorphology 2002, 48, 1–9. [Google Scholar] [CrossRef]
- Wyllie, D.C.; Mah, C.W. Rock Slope Engineering, 4th ed.; Spon Press: London, UK, 2004. [Google Scholar]
- Onymar Quarries S.r.l. Integrazioni al Progetto di Coltivazione della Cava “Colubraia Formignacola” (Vagli di Sotto); Prot. Azienda USL n°17169 del 12.01.2021—Studio Geostrutturale di dettaglio di corredo; Massa, Italy, 2021; 27p (Private comminication).
- Del Nero, G. Integrazioni Ottobre 2022 Relazione di Stabilità dei Fronti, degli Scavi e delle Tecchie. Piano di Coltivazione ai Sensi dell’Art. 23 Comma 1 L.R. 35/15 e S.M.I.; Cava Colubraia Formignacola Bacino N°7 PIT/PPR Colubraia e Monte Pallerina—Comune di Vagli di Sotto—Provincia di Lucca—Regione Toscana; 2022; p. 122 (Private communication). [Google Scholar]
- Bieniawski, Z.T. Engineering Rock Mass Classifications: A Complete Manual for Engineers and Geologists in Mining, Civil, and Petroleum Engineering; John Wiley & Sons: New York, NY, USA, 1989. [Google Scholar]
- Hoek, E. Strength of rock and rock masses. Int. Soc. Rock Mech. News J. 1994, 2, 4–16. [Google Scholar]
- Romana, M. New adjustment ratings for application of Bieniawski classification to slopes. In Proceedings of the International Symposium on the Role of Rock Mechanics in Excavations for Mining and Civil Works, International Society of Rock Mechanics, Zacatecas, Mexico, 2–5 September 1985; pp. 49–53. [Google Scholar]
- Romana, M. SMR classification: Romana. In Proceedings of the 7th ISRM International Congress on Rock Mechanics, Aachen, Germany, 10–13 May 1993; pp. 16–20. [Google Scholar]
- Hudson, J.A.; Harrison, J.P. Engineering Rock Mechanics: An Introduction to the Principles; Pergamon Press: Oxford, UK, 2000. [Google Scholar]
- Cundall, P.A. The measurement and analysis of acceleration in rock slopes. Ph.D. Thesis, University of London, London, UK, 1971. [Google Scholar]
- Potyondy, D.O.; Cundall, P.A. A bonded-particle model for rock. Int. J. Rock Mech. Min. Sci. 2004, 41, 1329–1364. [Google Scholar] [CrossRef]
- Itasca Consulting Group, Inc. FLAC3D: Fast Lagrangian Analysis of Continua in 3 Dimensions, version 6.0; Itasca Consulting Group, Inc.: Minneapolis, MN, USA, 2016; pp. 1–30. [Google Scholar]
- Itasca Consulting Group, Inc. 3DEC, 3-Dimensional Distinct Element Code User’s Guide. Available online: https://www.itascacg.com/3dec (accessed on 10 September 2024).
- Carmignani, L.; Kligfield, R. Crustal extension in the Northern Apennines: The transition from compression to extension in the Alpi Apuane core complex. Tectonics 1990, 9, 1275–1303. [Google Scholar] [CrossRef]
- Carta Geologica Della Toscana-CARG in Scala 1:10.000 Sezione 249070, Regione Toscana. 2012. Available online: https://www502.regione.toscana.it/geoscopio/cartoteca.html (accessed on 9 October 2024).
- Regione Toscana. BD PIOR, Tavola 49 “Minucciano Massa”. 2012. Available online: https://www502.regione.toscana.it/geoscopio/cartoteca.html (accessed on 9 October 2024).
- Rossi, P. Monitoring of a Marble Quarry with UAV Photogrammetry. Bollettino SIFET 2018, 1. Available online: https://www.sifet.org/bollettino/index.php/bollettinosifet/article/download/2170/4290/4347 (accessed on 26 March 2025).
- Lanciano, C.; Salvini, R. Monitoring of strain and temperature in an open pit using Brillouin distributed optical fiber sensors. Sensors 2020, 20, 1924. [Google Scholar] [CrossRef] [PubMed]
- Licciardello, I.C. Airborne and Spaceborne Remote Sensing Data Integration for 3D Monitoring of Complex Quarry Environments. In Italian Conference on Geomatics and Geospatial Technologies; Springer: Cham, Switzerland, 2021; pp. 405–422. [Google Scholar]
- Ullman, S. The interpretation of structure from motion. Proc. Royal Soc. London Series B. Biol. Sci. 1979, 203, 405–426. [Google Scholar] [CrossRef]
- Gallup, D.; Frahm, J.M.; Mordohai, P.; Yang, Q.; Pollefeys, M. Real-time plane-sweeping stereo with multiple sweeping directions. In Proceedings of the 2007 IEEE Conference on Computer Vision and Pattern Recognition, Minneapolis, MN, USA, 17–22 June 2007; IEEE: New York, NY, USA, 2007; pp. 1–8. [Google Scholar]
- Goesele, M.; Snavely, N.; Curless, B.; Hoppe, H.; Seitz, S.M. Multi-view stereo for community photo collections. In Proceedings of the 2007 IEEE 11th International Conference on Computer Vision, Rio de Janeiro, Brazil, 14–21 October 2007; IEEE: New York, NY, USA, 2007; pp. 1–8. [Google Scholar]
- Jancosek, M.; Shekhovtsov, A.; Pajdla, T. Scalable multi-view stereo. In Proceedings of the 2009 IEEE 12th International Conference on Computer Vision Workshops, Kyoto, Japan, 27 September–4 October 2009; IEEE: New York, NY, USA, 2009; pp. 1526–1533. [Google Scholar]
- ERTAG Regione Toscana. I Marmi Apuani; Nuova Grafica Fiorentina: Florence, Italy, 1980; p. 126. [Google Scholar]
- Arslan, A.T.; Kahraman, B.; Özfırat, M.K.; Frühwirt, T.; Yıldızdağ, K.; Köse, H. A parametric study using numerical modelling to assess the stability of marble quarries. Procedia Eng. 2017, 191, 646–655. [Google Scholar] [CrossRef]
- Ferrero, A.M.; Migliazza, M.; Segalini, A.; Gullì, D. In situ stress measurements interpretations in large underground marble quarry by 3D modeling. Int. J. Rock Mech. Min. Sci. 2013, 60, 103–113. [Google Scholar] [CrossRef][Green Version]
- Gullì, D.; Pellegri, M.; Marchetti, D. Mechanical behaviour of Carrara marble rock mass related to geo-structural conditions and in-situ stress. In Proceedings of the 8th South American Congress on Rock Mechanics, Integrating Innovations of Rock Mechanics, Buenos Aires, Argentina, 15–18 November 2015; IOS Press: Amsterdam, The Netherlands, 2015; pp. 1–7. [Google Scholar]
- Bieniawski, Z.T. Geomechanics classification of rock masses and application in tunneling. In Proceedings of the 3rd Congress of the International Society of Rock Mechanics, Denever National Academy of Sciences, Washington, DC, USA, 1–7 September 1974; pp. 27–32. [Google Scholar]
- Bieniawski, Z.T. Classification of rock masses for engineering: The RMR system and future trends. In Rock Testing and Site Characterization; Pergamon Press: Oxford, UK, 1993; pp. 553–573. [Google Scholar]
- Hoek, E.; Brown, E.T. Practical estimates of rock mass strength. Int. J. Rock Mech. Min. Sci. 1997, 34, 1165–1186. [Google Scholar] [CrossRef]
- Lee, M.F.; Mollison, L.J.; Mikula, P.; Pascoe, M. In-situ rock stress measurements in western Australia’s Yilgarn Craton. In Proceedings of theInternational Symposium on In-Situ Rock Stress, Trondheim, Norway, 19–21 June 2006; Routledge: Oxfordshire, UK, 2006; pp. 35–42. [Google Scholar]
- Ask, D.; Cornet, F.H.; Stephansson, O. Integration of CSIR- and CSIRO-type of overcoring rock stress data at the Zedex Test Site, Äspö HRL, Sweden. In Proceedings of the 10th International Congress on Rock Mechanics, Johannesburg, South Africa, 8–12 September 2003; pp. 63–68. [Google Scholar]
- Wortonincki, G. CSIRO triaxial stress measurement cell. In Comprehensive Rock Engineering: Principles, Practice & Projects; Hudson, J.A., Ed.; Pergamon: London, UK, 1993; pp. 329–394. [Google Scholar]
- Ask, D. Measurement-related uncertainties in overcoring data at the Äspö HRL, Sweden. Part 2: Biaxial tests of CSIRO HI overcore samples. Int. J. Rock Mech. Min. Sci. 2006, 43, 127–138. [Google Scholar] [CrossRef]
- De Lucia, V.; Ermini, A.; Guido, S.; Marchetti, D.; Gullì, D.; Salvini, R. Investigations using CSIRO HI Triaxial Cells for measuring the stress states of rock masses subject to mining extraction: Numerical modelling of in-situ extracted core samples. Ital. J. Eng. Geol. Environ. 2024, 1, 95–103. [Google Scholar] [CrossRef]
- Agisoft LLC. Agisoft Metashape Professional Edition, version 2.0.2; Agisoft LLC: St. Petersburg, Russia, 2024. Available online: https://www.agisoft.com/ (accessed on 10 January 2025).
- Robert McNeel & Associates. Rhinoceros, version 8.0; Robert McNeel & Associates: Seattle, WA, USA, 2024. Available online: https://www.rhino3d.com/ (accessed on 10 January 2025).
- Coulomb, C.A. Essai sur une application des règles des maximis et minimis à quelques problèmes de statique relatifs à l’architecture. Mem. Acad. Roy. Div. Sav. 1776, 7, 343–387. [Google Scholar]
- Jiao, Y.; Zhao, J.; Ge, X. New formulation and validation of the three-dimensional extension of a static relaxation method. Adv. Eng. Softw. 2004, 35, 317–323. [Google Scholar] [CrossRef]
- Barton, N.R. A model study of rock joint deformation. Int. J. Rock Mech. Sci. 1972, 9, 579–602. [Google Scholar] [CrossRef]
- Hoek, E.; Carranza-Torres, C.; Corkum, B. Hoek-Brown failure criterion-2002 edition. Proc. NARMS-TAC 2002, 1, 267–273. [Google Scholar]
- Francioni, M.; Salvini, R.; Stead, D.; Litrico, S. A case study integrating remote sensing and distinct element analysis to quarry slope stability assessment in the Monte Altissimo area, Italy. Eng. Geol. 2014, 183, 290–302. [Google Scholar] [CrossRef]
- Francioni, M.; Salvini, R.; Stead, D.; Giovannini, R.; Riccucci, S.; Vanneschi, C.; Gullì, D. An integrated remote sensing-GIS approach for the analysis of an open pit in the Carrara marble district, Italy: Slope stability assessment through kinematic and numerical methods. Comput. Geotech. 2015, 67, 46–63. [Google Scholar] [CrossRef]
- Salvini, R.; Vanneschi, C.; Garattoni, A. Modellazione Stocastica Della Fratturazione (Metodo Discrete Fracture Network) a Supporto Della Stima Previsionale di Resa All’interno di Bacini Estrattivi di Pietre Ornamentali. Geol. Tecn. Ambient. 2020, 29, 29–46. Available online: http://www.cngeologi.it/wp-content/uploads/2020/12/GTA03-2020low.pdf (accessed on 20 January 2025).
- Mohr, O. Welche Umstände bedingen die Elastizitätsgrenze und den Bruch eines Materials? Zeit. Ver. Deut. Ing. 1900, 44, 1524–1530. [Google Scholar]
- Hoek, E.; Brown, E.T. Underground Excavations in Rock, 2nd ed.; London Institution of Mining and Metallurgy: London, UK, 1980; p. 527. [Google Scholar]
- Martin, C.D.; Kaiser, P.K.; McCreath, D.R. Hoek-Brown parameters for predicting the depth of brittle failure around tunnels. Can. Geotech. J. 1999, 36, 136–151. [Google Scholar] [CrossRef]
Disclaimer/Publisher’s Note: The statements, opinions and data contained in all publications are solely those of the individual author(s) and contributor(s) and not of MDPI and/or the editor(s). MDPI and/or the editor(s) disclaim responsibility for any injury to people or property resulting from any ideas, methods, instructions or products referred to in the content. |
© 2025 by the authors. Licensee MDPI, Basel, Switzerland. This article is an open access article distributed under the terms and conditions of the Creative Commons Attribution (CC BY) license (https://creativecommons.org/licenses/by/4.0/).