Article

Assessing Shallow Groundwater Depth and Electrical Conductivity in the Brazilian Semiarid: A Geostatistical Analysis

by
Thayná Alice Brito Almeida
1,
Luiz Carlos da Silva Boaventura
1,
Marcos Vinícius da Silva
2,*,
Carolyne Wanessa Lins de Andrade Farias
3,
Aline Maria Soares das Chagas
1,
Rodrigo Soares da Costa
4,
Cláudio Vinícius de Souza Moura
1 and
Abelardo Antônio de Assunção Montenegro
1
1
Department of Agricultural Engineering, Federal Rural University of Pernambuco State, Recife CEP 52171-900, Pernambuco, Brazil
2
Departamento de Engenharia Agrícola, Centro de Ciências Agrárias e Ambientais (CCAA), Universidade Federal de Maranhão, BR-222, Chapadinha CEP 65500-000, Maranhão, Brazil
3
Department of Geosciences, Federal University of Paraíba State, João Pessoa CEP 58051-900, Paraíba, Brazil
4
Academic Unit of Belo Jardim, Federal Rural University of Pernambuco, Belo Jardim CEP 56909-535, Pernambuco, Brazil
*
Author to whom correspondence should be addressed.
Geosciences 2025, 15(4), 136; https://doi.org/10.3390/geosciences15040136
Submission received: 28 February 2025 / Revised: 1 April 2025 / Accepted: 2 April 2025 / Published: 4 April 2025

Abstract

:
The Brazilian semiarid region faces water scarcity, with alluvial aquifers playing a crucial role in agricultural water security. This study assesses the spatiotemporal variability of groundwater quantity and salinity, analyzing natural and anthropogenic impacts, including post-pandemic trends. The investigation was developed in the Mimoso Alluvial Valley (MAV), Pernambuco State, mainly used for communal irrigation supply. The spatiotemporal dynamics of land use (LUC) was performed based on data provided by Mapbiomas for the years 2012, 2016, 2019, and 2023. Geostatistical analysis was applied for mapping water table levels and salinity. Changes in LUC suggest possible forest regeneration influenced by climatic factors and anthropogenic pressure alleviation. Electrical conductivity (EC) and groundwater level (GWL) exhibited medium to high variability. Temporal trends highlight climatic influences, groundwater abstraction, and recharge/discharge dynamics. Pre-2019 years were classified as dry, whereas the 2019–2023 years ranged from rainy to extremely rainy, leading to lower EC and GWL variability in 2023. Additionally, the COVID-19 pandemic temporarily reduced agriculture, lowering salinity and aiding groundwater recovery. The spatial analysis revealed critical distribution patterns, highlighting the interaction between natural processes and human activities. These findings provide valuable insights for optimizing irrigation and environmental strategies, supporting long-term groundwater sustainability in semiarid regions.

1. Introduction

Semiarid regions face significant water challenges due to climatic variability, land use changes, and an increasing reliance on groundwater for supply and irrigation [1]. The combination of low rainfall and high evapotranspiration rates in these regions results in a negative water balance, highlighting the need for effective groundwater management strategies [2]. Shallow groundwater in phreatic aquifers at alluvial valleys is highly influenced by anthropogenic activities, being dependent on land use at the contributing watershed and climate forcing [3]. In Brazil, alluvial aquifers play a crucial role in the semiarid region, ensuring water security for rural communities, acting as natural reservoirs during prolonged droughts [4]. Additionally, alluvial valleys in semiarid regions offer substantial potential for small-scale irrigation [5].
In the Mimoso Alluvial Valley (MAV), located in the semiarid region of northeastern Brazil, groundwater recharge is directly influenced by seasonal rainfall patterns, leading to significant fluctuations in water table levels and water quality for irrigation [6]. Recent studies emphasize the importance of alluvial aquifers for irrigated agriculture in the Brazilian semiarid region while also highlighting their vulnerability to salinization and overexploitation [7]. These aquifers are particularly susceptible to salt accumulation in both saturated and unsaturated zones due to the spatial distribution of their hydraulic properties [5]. The spatial and temporal variability of water table levels and water quality can compromise the long-term sustainability of these systems, especially given increasing water demand and the impacts of climate and land use changes [7,8].
Groundwater quality in alluvial valleys, particularly regarding salinity, exhibits seasonal variations influenced by hydrological and climatic conditions [9]. These fluctuations result from either the dilution of salt due to rainfall recharge or their concentration due to intense evaporation [10]. Beyond overexploitation, extreme weather events and land use changes further impact groundwater quantity and quality [11]. For instance, deforestation leads to increased surface runoff, erosion, and river sedimentation while reducing infiltration, percolation, and aquifer recharge [12].
Changes in precipitation variability and intensity have intensified extreme droughts and floods, further diminishing soil, aquifer, and reservoir water storage capacity. Pereira et al. [13] point out the water crisis in Brazil due to climate-and human-induced impacts, which requires management alternatives to be implemented in the near future. This issue is not exclusive to Brazil. In Morocco, another semiarid country, groundwater aquifers have been subjected to overexploitation, exacerbated by low recharge rates and rising average temperatures. The resulting aquifer depletion has led to saltwater intrusion and nitrate contamination, underscoring the urgent need for policies aimed at preserving these resources [14]. These challenges closely resemble those faced in the Brazilian semiarid region, where inadequate groundwater management threatens future availability. In addition to overexploitation, extreme weather events and changes in land use dynamics also impact on both the quantity and quality of groundwater. Changes in precipitation variability and intensity amplify the occurrence of extreme droughts and floods, further decreasing the water storage capacity in soils, aquifers, and reservoirs. During the COVID-19 pandemic, a temporary improvement in water quality was observed across various water systems due to reduced human activity, highlighting the direct impact of anthropogenic actions on water quality degradation [15].
Groundwater quantity and quality monitoring has also been a focus of studies in Beijing, where overexploitation has led to a progressive decline in water table levels over recent decades. However, the implementation of management measures, such as redistributing water supply sources and improving water-use efficiency, has helped stabilize groundwater depletion trends in the region [16]. An integrated management approach for aquifer conservation is particularly relevant for Brazil, especially in semiarid areas. Pereira et al. [17], in evaluating the relationship between human behavior and droughts in semiarid regions, highlight that adopting a holistic approach that considers the multiple dimensions of hydro-social interactions can pave the way for more sustainable and inclusive water management practices in semiarid regions worldwide. The first step in this process is understanding the variability of this resource.
Advanced spatiotemporal analysis methods are essential for assessing the impacts of groundwater exploitation, climate variability, and land use changes on alluvial aquifers. Geostatistics is one of the primary tools used to map spatial patterns of salinity and potentiometric levels, offering a detailed understanding of groundwater dynamics [10]. Techniques such as kriging are widely applied to interpolate hydrochemical data and predict future variations, making them indispensable for sustainable water-use planning [18]. The application of these methodologies enables the identification of critical areas and degradation trends, guiding more effective and scientifically based water management strategies [19]. Despite the large number of studies focused on the spatiotemporal dynamics of groundwater potential and the risks associated with water table depletion, investigations on recent patterns of variability, particularly in semiarid areas, are still lacking.
Given this context, this study aims to assess the spatiotemporal variability of groundwater quantity and quality in the Mimoso Alluvial Valley by (i) using statistical analyses to map the distribution of potentiometry and salinity across recent climatic periods and (ii) analyzing the spatiotemporal dynamics of land use within the MAV’s contributing area for the years 2012, 2016, 2019, and 2023. Piezometers and large-diameter wells were monitored in three four-year periods (quadrennium): 2012 to 2015; 2016 to 2019; and 2020 to 2023, a post-pandemic period, considering seasonal and interannual variations related to changes in precipitation patterns and groundwater exploitation. The findings of this study are expected to support the updated development plans for sustainable groundwater management strategies, contributing to water security and the sustainability of irrigated agriculture in the Brazilian semiarid region.

2. Materials and Methods

2.1. Study Area

The study was conducted in the Mimoso Alluvial Valley (MAV) (Figure 1), in the Mimoso stream basin, sub-basin of the Alto Ipanema, Agreste Region of the State of Pernambuco, Brazil. The MAV is part of the springs of the Ipanema River, a tributary of the São Francisco River Basin, one of the biggest river basins in Brazil. The main watercourse of the basin is the Mimoso River, which is connected to the aquifer along its entire length [5].
According to the Köppen classification, the region’s climate is classified as BSsh, characterized as extremely hot and semiarid, with an average annual temperature of 23 °C. The region receives an average annual precipitation of 630 mm [7], but rainfall is highly irregular. During the study period, precipitation exhibited a standard deviation of 230 mm, with a maximum of 1050 mm and a minimum of 144 mm. These low and variable annual totals result in limited surface water availability, restricting aquifer recharge processes and hindering vegetation development. The most important economic activity in the MAV is irrigated agriculture. The primary crops cultivated in the plots were carrot (Daucus carota L.), cabbage (Brassica oleracea L. var. capitata L.), bell pepper (Capsicum annum), tomato (Lycopersicon esculentum), watermelon (Citrullus lanatus), coriander (Coriandrum sativum), gherkin (Cucumis anguria), and maize (Zea mays).

2.2. Hydrogeologic Framework

The MAV has a shallow unconfined aquifer with an average thickness of around 10 m, about 3 km in length, and 300 m in width, with a natural slope of approximately 0.3% (West–East) [5]. The valley slopes have shallow soils over fractured crystalline basement rocks, with groundwater occurring in fissured and weathered granite zones and, more significantly, in the alluvial deposits along the river [7]. Quartz fragments vary in size from 2 to 10 mm, with coarse sand comprising up to 30% of the soil material. The predominant minerals in the region include biotite, muscovite, and gneiss. In contrast, the northern boundary features granite, syenite, and gabbro, forming a granite complex that may contribute to the presence of quartz fragments in the alluvial fans [20]. Figure 2 presents six transversal transects, illustrating the texture profiles at different depths and the corresponding transect locations. For S1 to S4, profile 1 is at the left boundary. For S5 and S6, profile 1 is at the right boundary.
Monitoring of the saturated zone within the alluvial deposit, conducted using piezometers [21], indicates that the water table depth varies between 2.0 m in the rainy season and 4.0 m in the dry period. During the installation of 50 piezometers in 1995, slug tests [22] and infiltration tests were performed to determine the hydraulic conductivity of the aquifer in its saturated state and the basic soil infiltration rate, respectively. The hydraulic conductivity values ranged from 0.1 to 125 m day−1, with an arithmetic mean of 23.4 m day−1 and a geometric mean of 4.8 m day−1 [23]. The infiltration rate varied between 0.1 and 93 m day−1, with an arithmetic mean of 7.1 m day−1 [4]. The piezometers, each 5 m deep, were installed along transects in 1995, with an additional set of 30 units added in 2005. A regular spacing of approximately 30 m was maintained to facilitate geostatistical analyses of the spatial variability in hydraulic properties.
The dominant soil type in the area is Fluvic Neosol, characterized by heterogeneous deposits with a medium to high silt content. On the adjacent slopes, other soil classes such as Fluvisols, Regosols, Lithosols, Litholic and Regolitic Neosols, and Argisols are also present [24].

2.3. Groundwater Level and Electrical Conductivity Data

For the present study, samples collected from 37 piezometers and 29 large-diameter pumping wells, with diameters varying between 2 and 3.5 m, were used in the months of January, June, and October of the years 2012, 2015, 2019, and 2023. Water level measurements were taken manually each month using a water level meter, while electrical conductivity was measured in water samples taken from the same piezometers and wells during the same time period as the piezometric levels. The first water sample from the piezometers was discarded, and a second sample was collected for analysis to improve representativeness. Electrical conductivity (EC) was measured using a conductivity meter (HANNA-HI 9835, EMIN, Ha Noi City, Vietnam), calibrated to the sample temperature. The measurement uncertainty is ±1% of the reading. To estimate water exploitation for irrigation in the MAV, the actual consumption was taken into account for each farm and its respective farmers based on the water requirements of the irrigated crops [7].
The water table fluctuation (WTF) method was applied to estimate direct natural recharge using the water balance (WB) methodology in MAV [8]. The specific yield (Sy) of the alluvial aquifer was determined through pumping tests conducted during piezometer installation, with an average value of 10% used for the WTF method in this study [25]. For recharge estimation in 2020 and 2021, when field measurements were unavailable due to the pandemic, a simulation was performed based on the relationship between total precipitation and estimated recharge, as per Equation (1), with an R2 of 0.85, based on 20 years’ time series data of monthly values for rainfall and water table levels, and using the water table fluctuation method:
G W L = 0.54 × R 258.5
where G W L = groundwater level and R = observed monthly rainfall.

2.4. Meteorological Data

The meteorological data were collected using a Campbell Scientific automatic weather station installed in the MAV from 2012 to 2023. This station provided daily records of air temperature, relative humidity, global solar radiation, atmospheric pressure, wind speed and direction, and rainfall. Reference evapotranspiration was obtained from the climatological data recorded in the automatic station and calculated using the FAO Penman–Monteith method [26].

2.5. Agricultural Land Cover Change Analysis

The analysis of the spatiotemporal dynamics of land use was performed considering the contributing area to the Alluvial Valley (i.e., Mimoso stream basin), from the data provided by the annual mapping project of land use and coverage in Brazil (Mapbiomas), which provides annual land use maps for all Brazilian watersheds (1985–2022), with a spatial resolution of 30 m (https://mapbiomas.org/, accessed on 17 January 2025). Maps were collected for the years 2012, 2016, 2019, and 2023 (collection 9) as well as transition maps between the years, using the Google Earth Engine (GEE, https://earthengine.google.com/, accessed on 17 January 2025) tool. The manipulation of the data was conducted through the QGIS tool version 3.16.0. Seven classes were found in the Mimoso stream basin: forest formation, savanna formation (i.e., caatinga), pasture, mosaic of uses, urban area, other non-vegetated areas, water (river, lake, and ocean), and other temporary crops.

2.6. Data Analysis

The analysis of climate data, recharge estimates, groundwater level, and electrical conductivity was grouped into four-year periods: P1 (2012–2015), P2 (2016–2019), and P3 (2020–2023). For spatial analyses, the years 2012, 2016, 2019, and 2023 were selected.

2.6.1. Geostatistical Framework

Data statistical distribution was evaluated according to the normal distribution, using the Kolmogorov–Smirnov test, at a probability level of 0.05. According to the coefficient of variation (CV) values, variability was classified as low (CV ≤ 12%), medium (12 < CV ≤ 60%), and high variability (CV > 60%) [27].
Outliers were filtered by considering data below the lower limit (Li) or above the upper limit (Ls). However, during the kriging process, outliers were also considered [28]. Such points, although deviating from the mean, were deemed representative of actual field conditions, thereby enhancing the accuracy of the resulting maps.
For geostatistical analysis, the GEOEAS [29] geostatistical tool was used. The spatial dependence of groundwater levels and salinity was analyzed using the classic semivariogram constructed from the semivariance estimate given by Equation (2) [30].
γ ^ h = 1 2 N h i = 1 n Z X i + h Z X i 2
where γ ^ h = the estimated value of the semivariance of the experimental data; Z X i + h and Z X i = the observed values of the regionalized variable; and N h = the number of pairs of measured values, separated by a distance h.
With the experimental semivariogram in hand, the data were fitted into a theoretical model and the exponential, Gaussian, and spherical models were tested. The mathematical adjustment made it possible to define the following parameters: nugget effect (C0), range (A), and sill (C0 + C1). The model that presented the best adjustment to the experimental values was chosen, according to the leave-one-out cross-validation technique [31], in which each of the measured values is interpolated by the kriging method, and the measured values are then replaced by the estimated value and then the distribution of standardized errors is calculated, which should present a mean close to zero and a unitary standard deviation.
The degree of spatial dependence (DSD) was calculated according to the ratio between the nugget effect and the threshold of theoretical semivariograms [32]. This criterion establishes a strong dependence when a given ratio is less than 25%, moderate for a ratio between 25% and 75%, and weak when the ratio is greater than 75%. After validating the semivariogram, universal kriging of the data was performed, and spatial distribution maps were created using the Surfer software for Windows (version 8.0) [33].

2.6.2. Trend Test

The Mann–Kendall test [34,35] and Sen’s slope method [36] were used to analyze trends in groundwater level (GLW) and electrical conductivity (EC) from 2012 to 2023. Since the Mann–Kendall test assumes independent data, autocorrelation in hydrometeorological and hydrological time series—common in aquifers—can affect trend significance [7]. To mitigate this, the seasonal and trend decomposition using the LOESS (STL) method was applied. STL is a time series decomposition technique that employs locally weighted regression for smoothing. This method separates the data into trend, seasonal, and residual components, where the trend reflects long-term variations, the seasonal component captures periodic fluctuations, and the residuals account for irregular disturbances [37].

3. Results and Discussion

3.1. Climatic Conditions and Rainfall Temporal Distribution

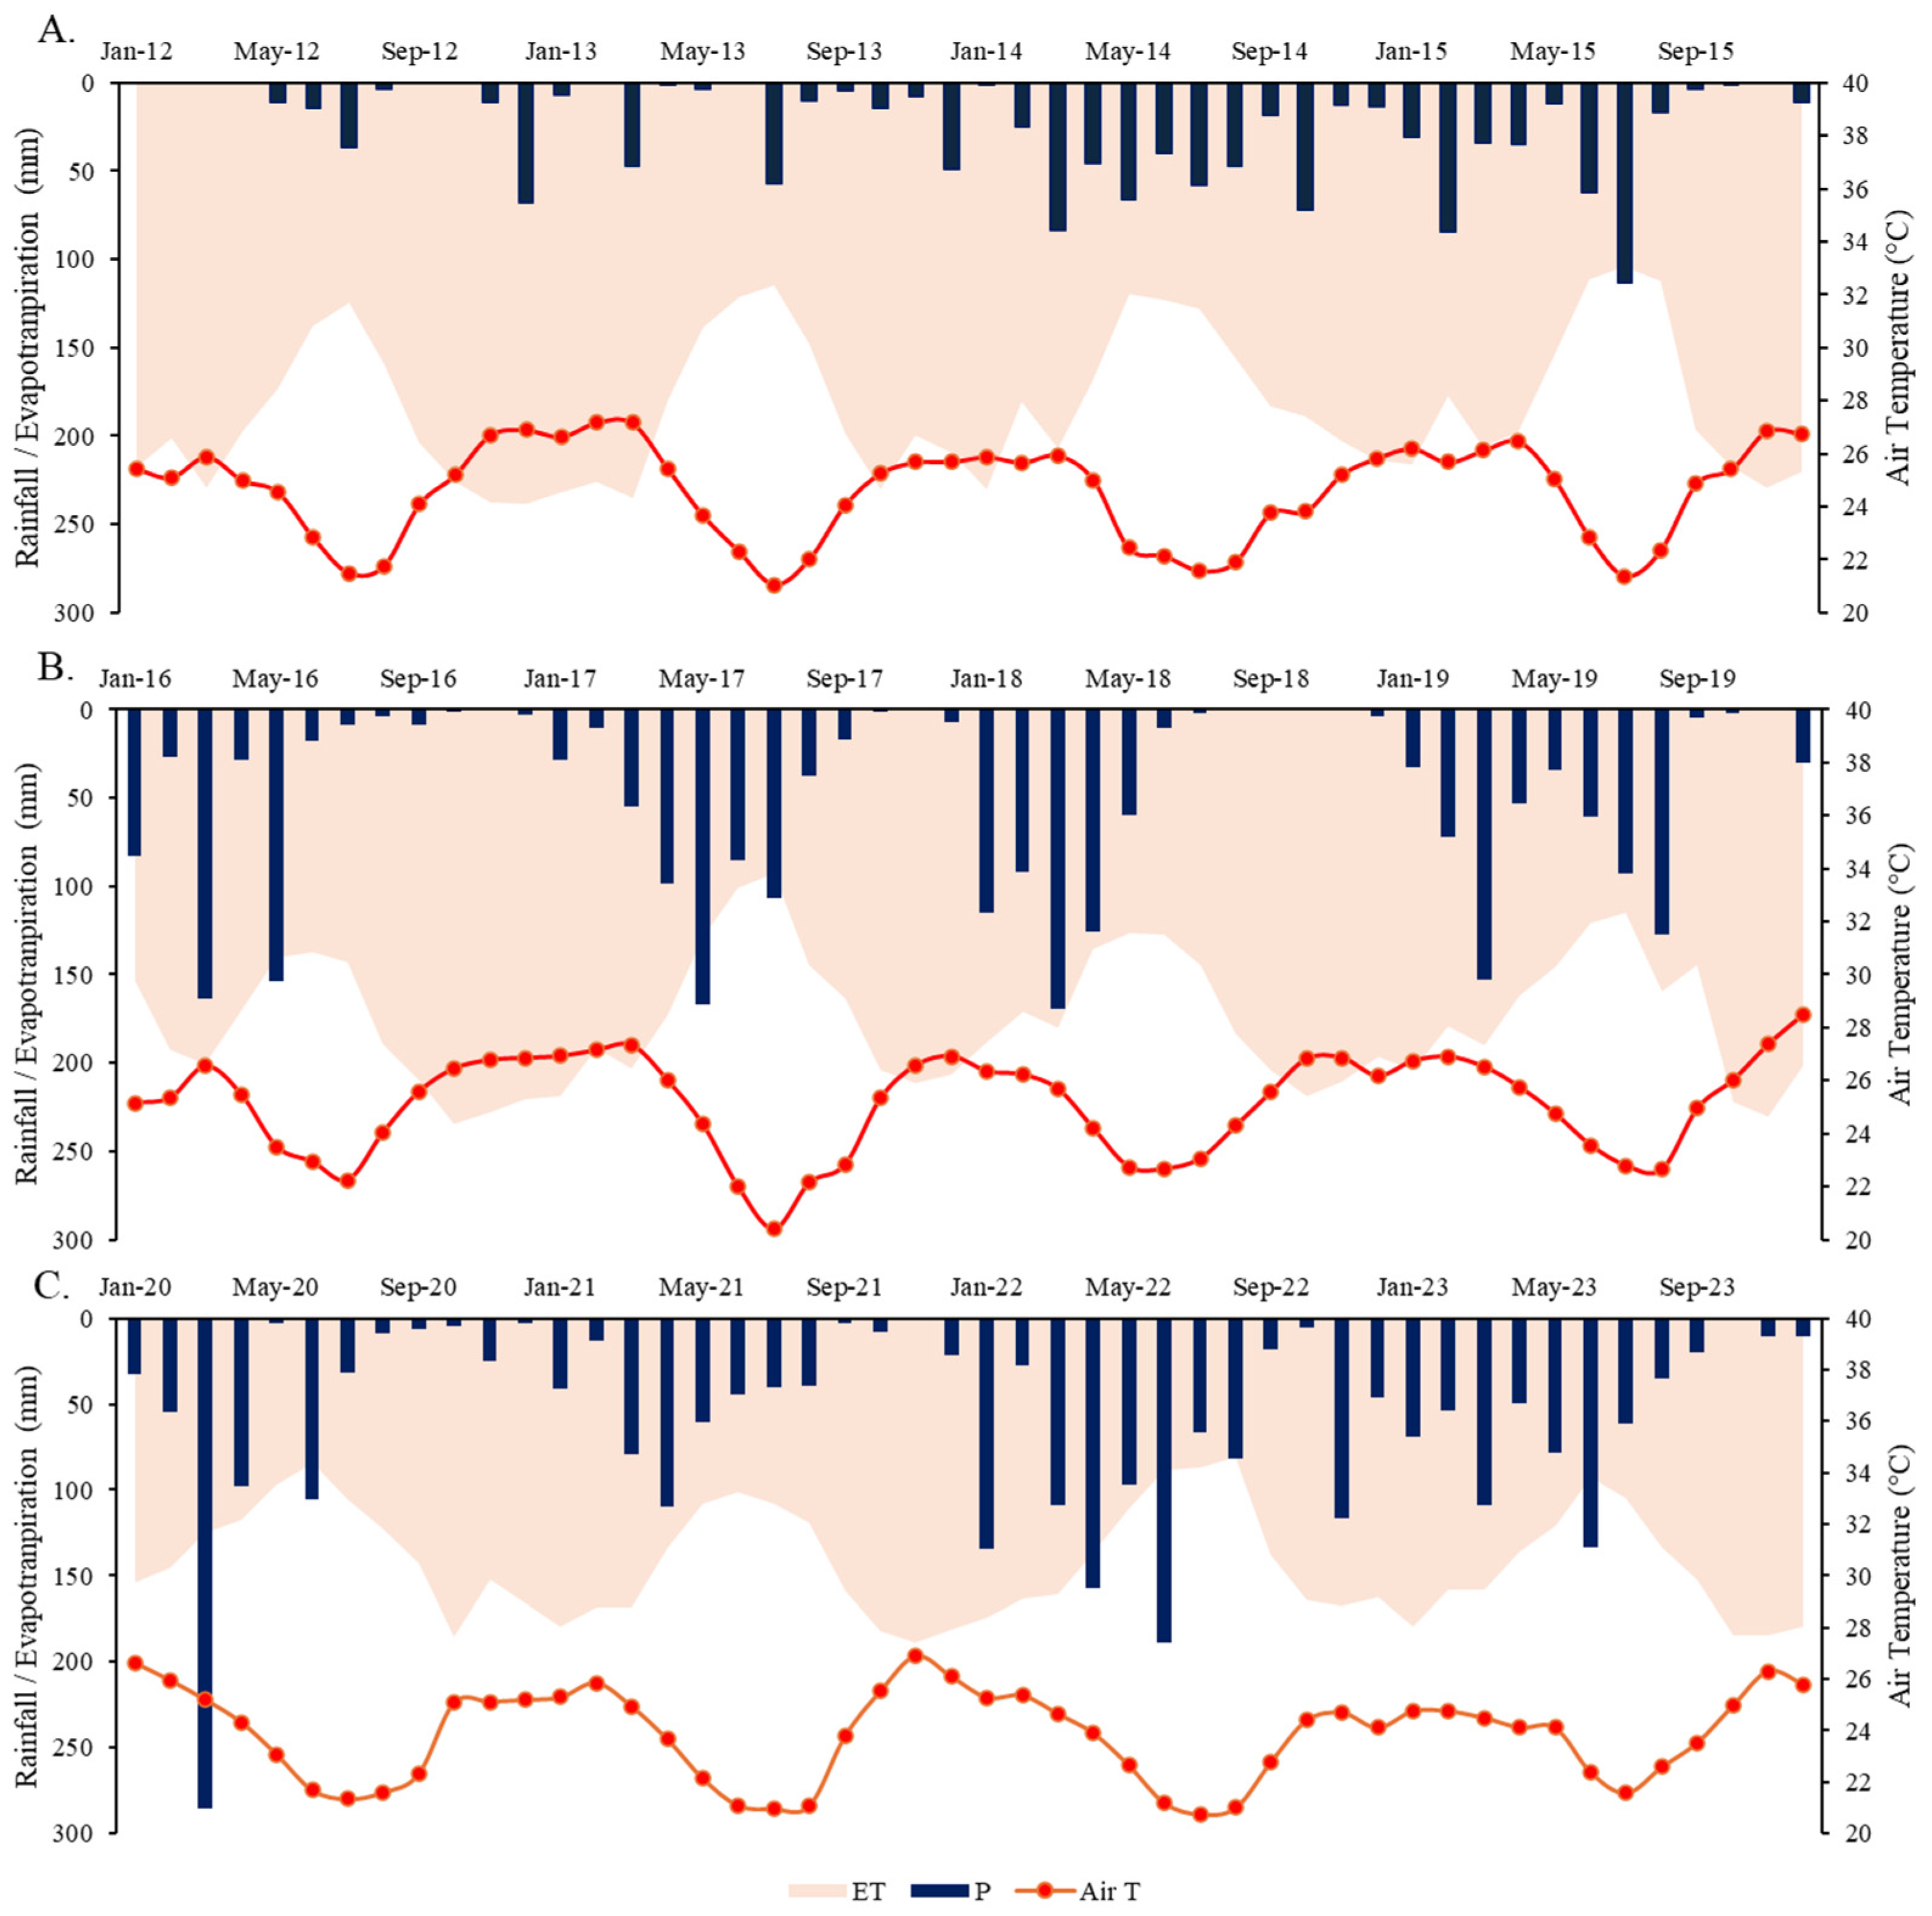
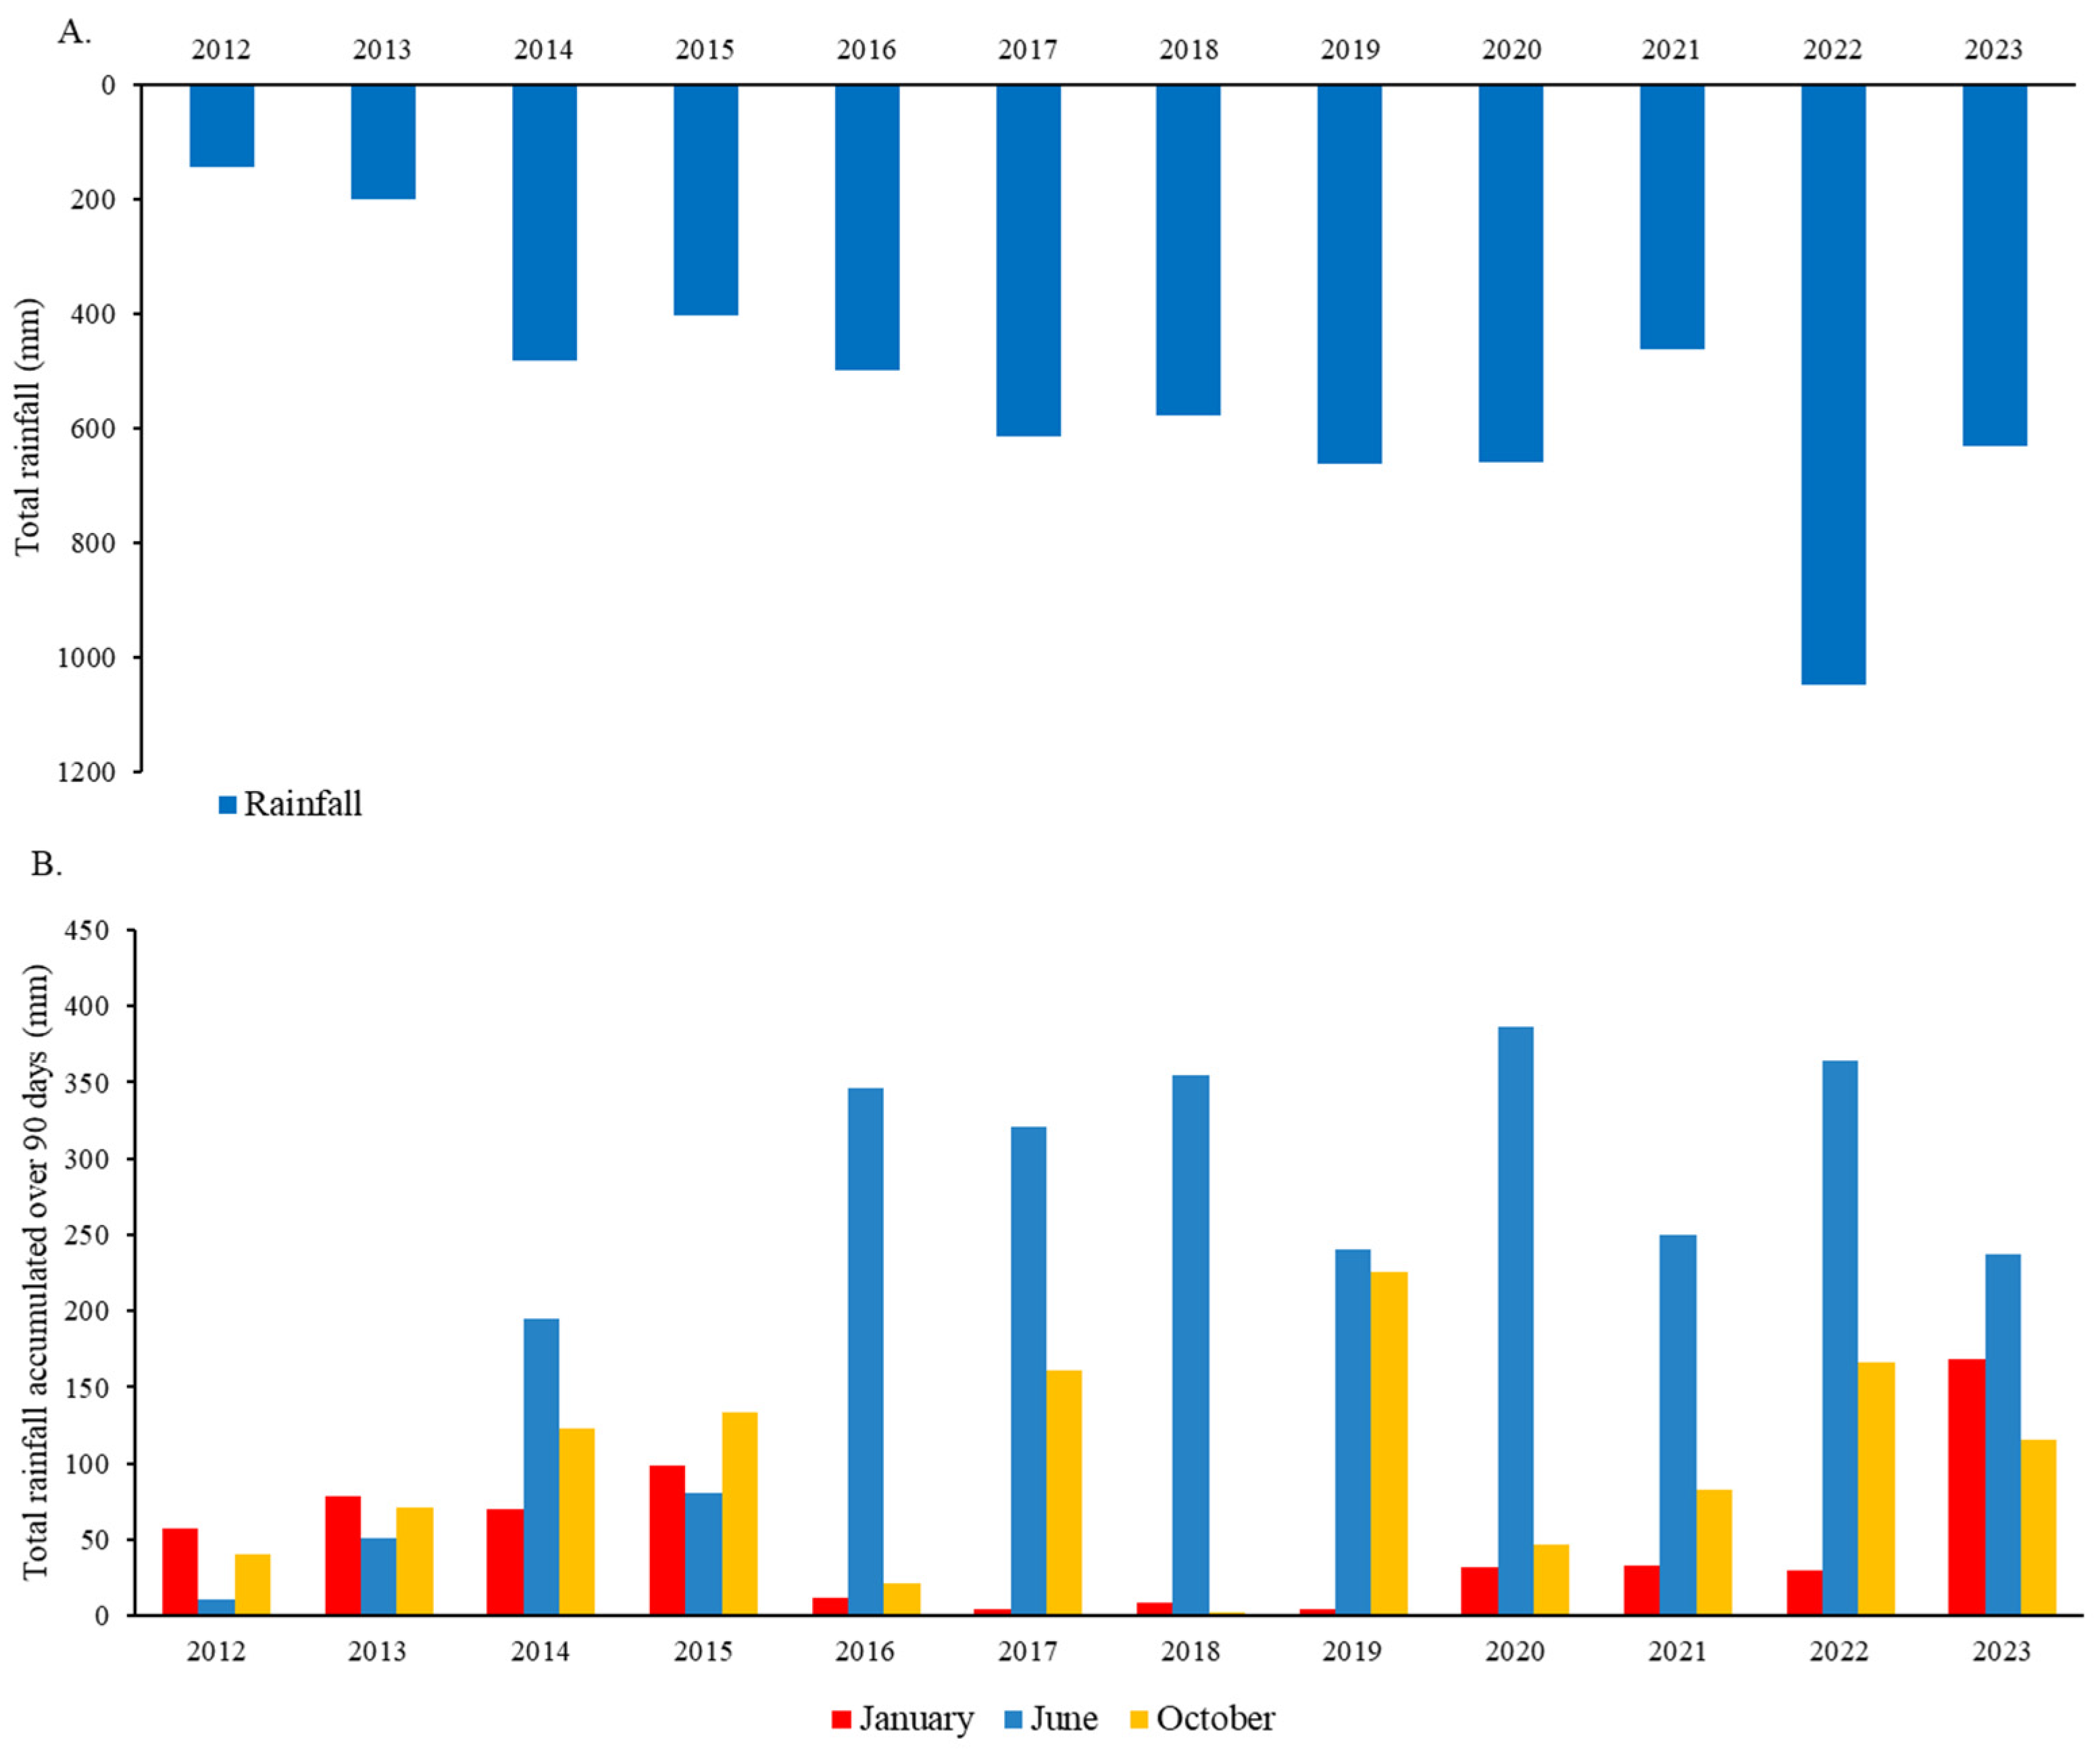
Figure 3 presents the recorded precipitation, evapotranspiration, and air temperature data for the Mimoso Alluvial Valley. The observed data indicate an average annual precipitation of 592.8 mm over the evaluated period (2012–2023). The highest accumulated rainfall was recorded in 2022, with 1049.7 mm, followed by 2011 with 722.62 mm. In contrast, 2012 had the lowest recorded precipitation (143.70 mm), followed by 2015 (404.50 mm).
When analyzing the annual precipitation behavior across the four-year periods, it is observed that the first quadrennium (2012–2015) exhibited low rainfall levels, with particularly dry years in 2012 and 2013. Similar drought conditions were reported during this period, significantly impacting water availability and agricultural productivity [38]. A total of 46 rainy days were recorded, predominantly concentrated between May and August. In 2014 and 2015, a total of 52 rainy days were recorded, indicating an increase in precipitation compared to previous years. Although rainfall was mainly concentrated between May and August, there was also a noticeable presence of precipitation during the transition periods between the dry and wet seasons [39].
For the second quadrennium (2016–2019), precipitation variability increased, with more frequent rainfall events compared to the previous period (Figure 3A). However, dry years, such as 2016, still predominated. In the 2020–2023 period, rainfall volumes were higher than in the preceding quadrennium, with 2022 standing out as the year with the highest recorded precipitation in the series. The increase in precipitation depths observed in 2020–2023 is consistent with recent findings on climate variability and its impact on rainfall intensification [40]. In general, most rainfall events occurred between May and August, defining this as the rainy season, while the period from September to November was characterized as the dry season. The months between December and May represent a transition period between dry and wet seasons. During this transition period, the most significant rainfall events in the valley were recorded, particularly in April 2011 (105.40 mm) and April 2022 (82.30 mm).
Evapotranspiration (ET) maintained a seasonal pattern across all three periods, with values ranging from 104.13 to 238.07 mm between 2012 and 2015, 92.44 to 234.68 mm between 2016 and 2019, and 80.85 to 189 mm from 2020 to 2023. The mean air temperature in the MAV exhibited an inverse relationship with precipitation, closely mirroring ET trends. This inverse relationship between precipitation and temperature has been documented in similar climatic zones, where increased cloud cover and soil moisture during rainy periods contributes to lower air temperatures [38]. Lower temperatures were observed during the rainy season, while higher temperatures occurred in the dry and transition periods [41]. The minimum recorded temperature was 20.45 °C in July 2017, whereas the maximum temperature was 28.51 °C in December 2019. The first quadrennium (2012–2015) exhibited relatively stable temperature values with similar seasonal fluctuations. However, in the second (2016–2019) and third (2020–2023) quadrennium, air temperature showed an increasing trend, with more pronounced peaks during the hottest months. The upward trend in air temperatures aligns with global warming projections, which indicate an increase in extreme temperature events over the past decades [42].
Regarding seasonal distribution of precipitation, Figure 4 illustrates the interannual variability of accumulated rainfall over 90 days for January, June, and October between 2012 and 2023, highlighting the alternation between dry and wet years. Higher rainfall generally occurs in June, with peaks in 2016, 2018, 2020, and 2022, favoring aquifer recharge and reducing groundwater salinity. October exhibits intermediate variability while the lowest rainfall levels tend to occur in January, reflecting a drier period with minimal contribution to water recharge. The shift between dry years (2012–2015 and 2021) and years of high precipitation directly impacts groundwater availability and quality, with wetter periods promoting aquifer replenishment and salt dilution, whereas drier years intensify salinization due to reduced recharge and increased evapotranspiration [43]. The recent trend of increased precipitation in some years suggests possible shifts in climatic patterns and underscores the need for continuous monitoring to assess the impacts on water resources and the sustainability of irrigation in the semiarid region [40], which is subject to high uncertainties in rainfall patterns.
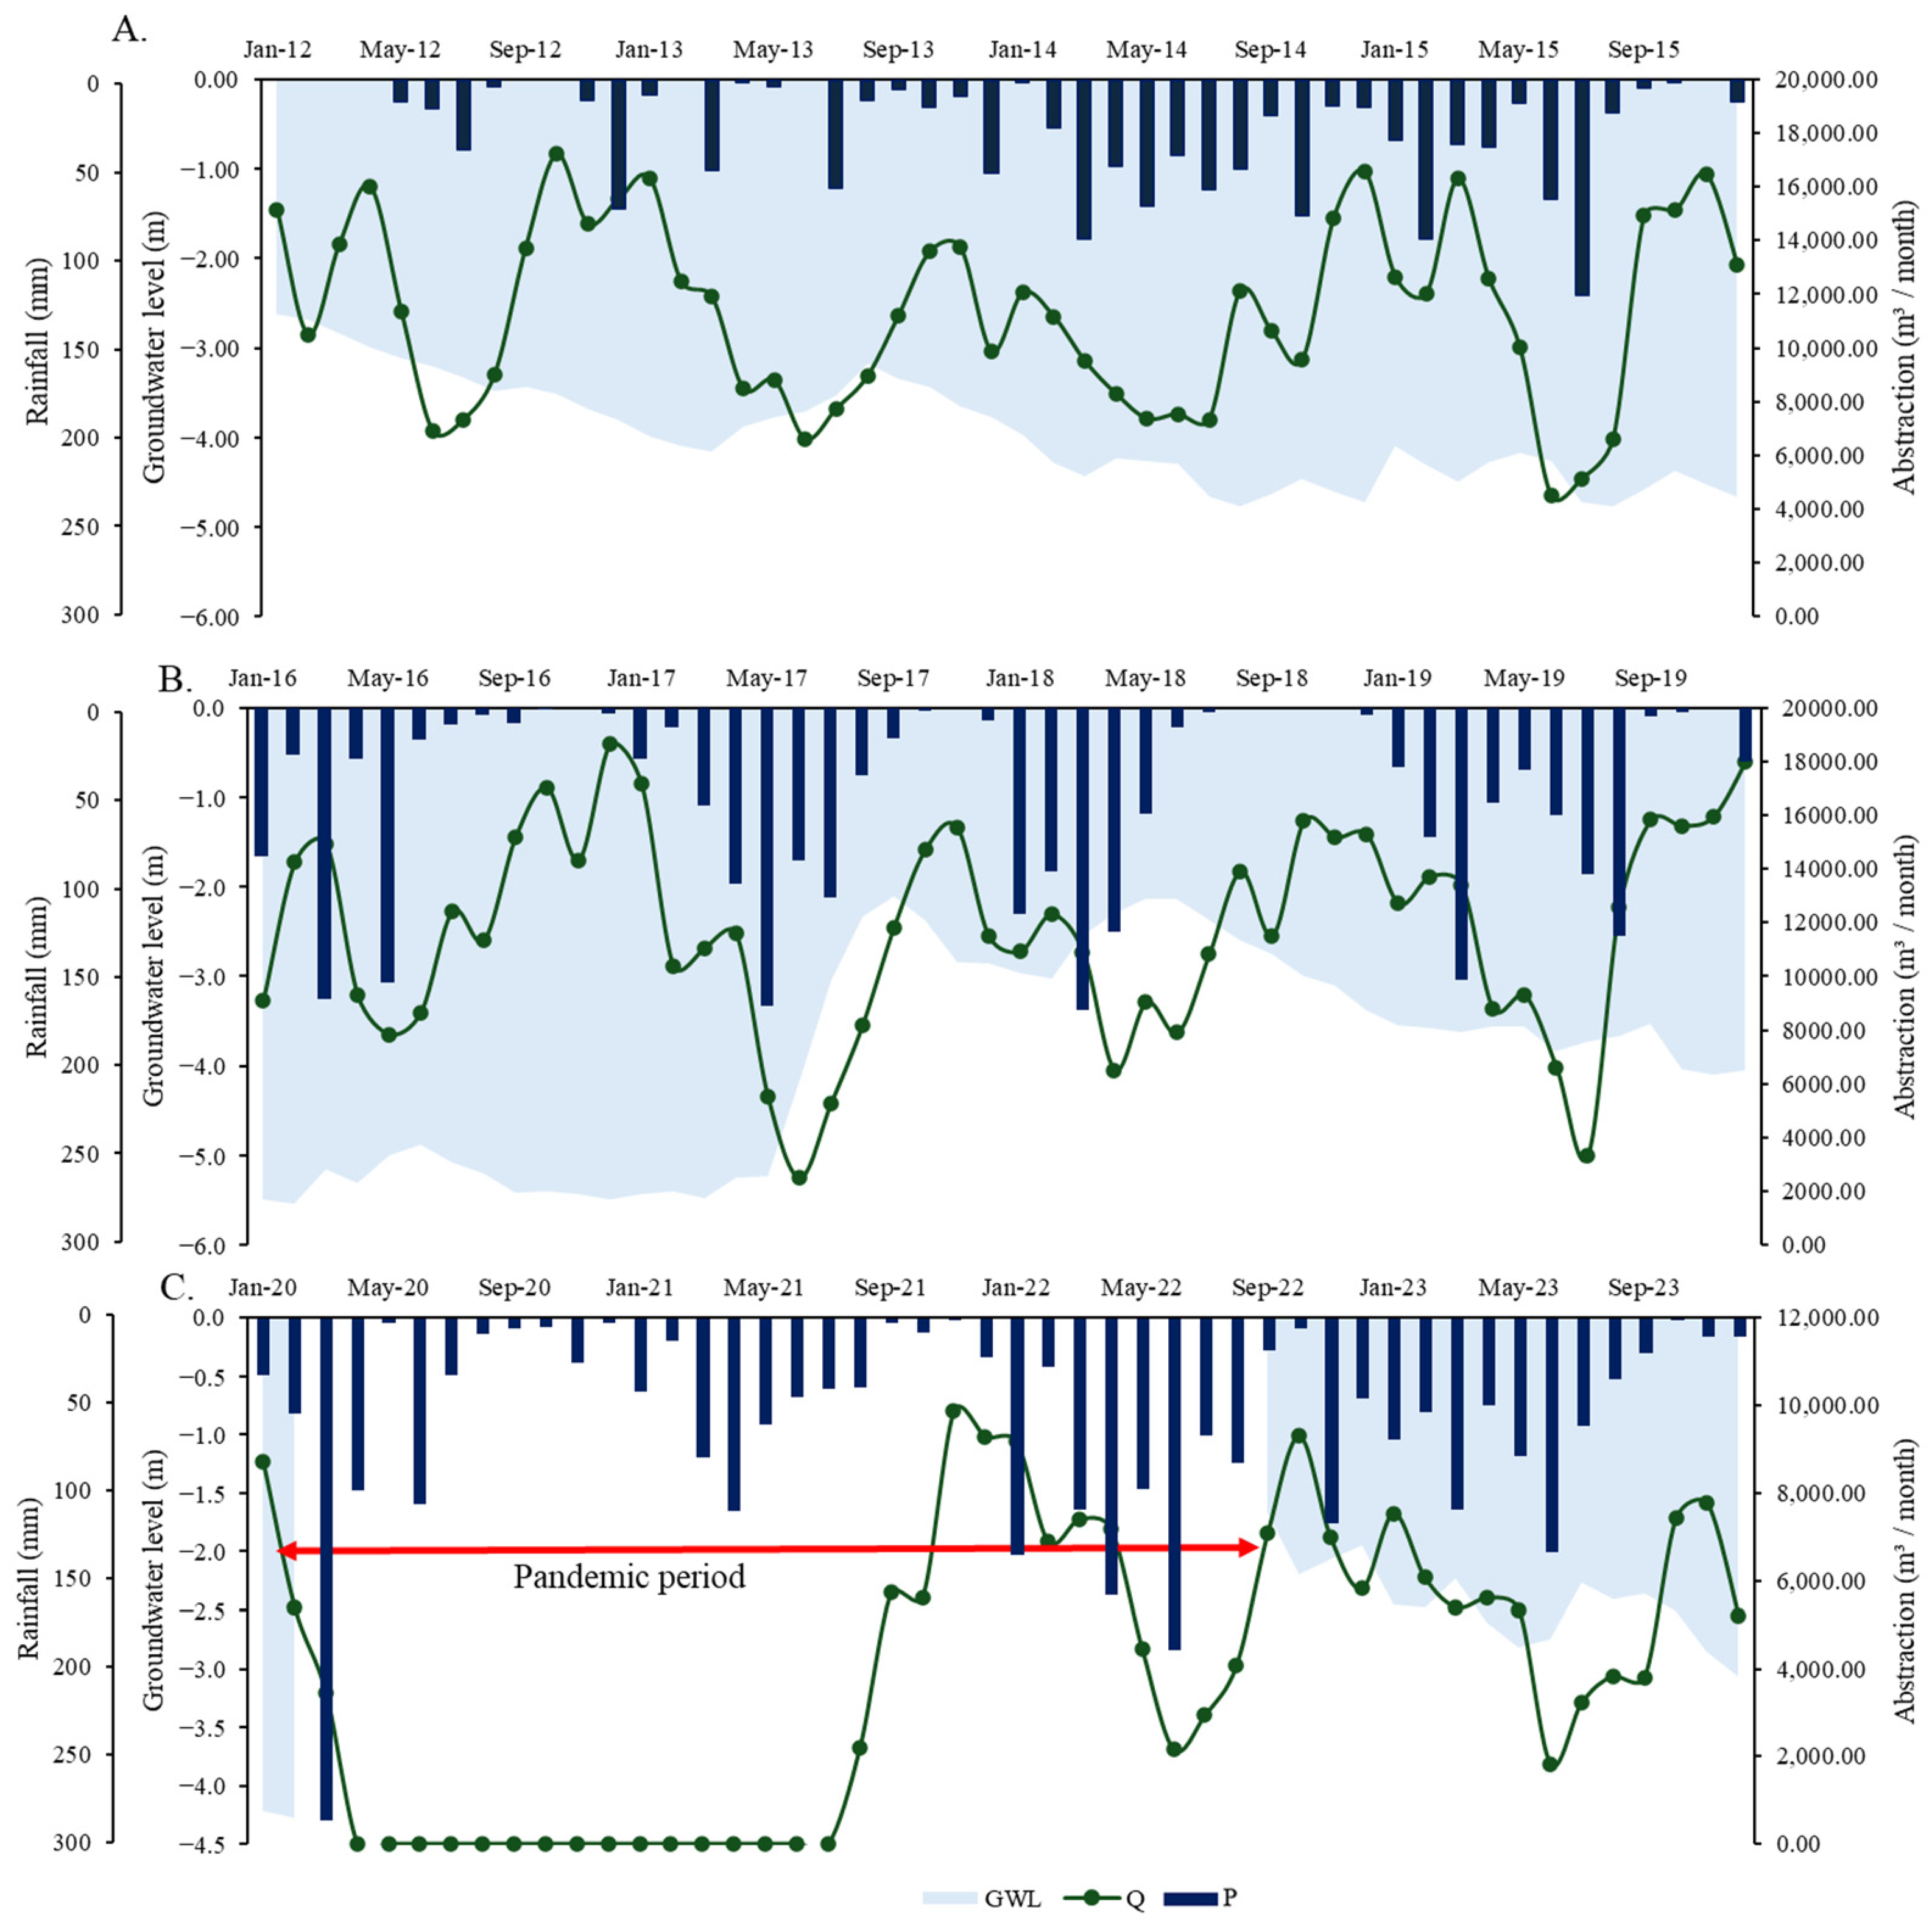
Variations in water availability can be observed through fluctuations in groundwater levels and the need for water extraction to irrigate agricultural crops, which is the main activity in the MAV, as shown in Figure 5. The average monthly variations between all groundwater levels (GWL) and water abstraction for irrigation in all pumping wells (Q) across the three evaluated periods are influenced by both climatic conditions and anthropogenic activities.
In the first period (2011–2014), a declining trend in groundwater levels is observed, particularly between 2012 and 2013, years marked by severe droughts. This behavior suggests reduced recharge of the aquifer, while the demand for irrigation continues to rise. Similar drought conditions were reported in semiarid regions during this period, significantly reducing groundwater recharge and intensifying water scarcity [37]. Between 2015 and 2018, groundwater fluctuations became more variable, indicating alternating periods of recharge. Fluctuations in groundwater levels during this period align with previous findings, which indicate that seasonal variations in recharge and continuous extraction for irrigation drive groundwater depletion [7]. Studies have shown that during prolonged dry periods, increased irrigation demand intensifies groundwater extraction, exacerbating aquifer depletion [16].
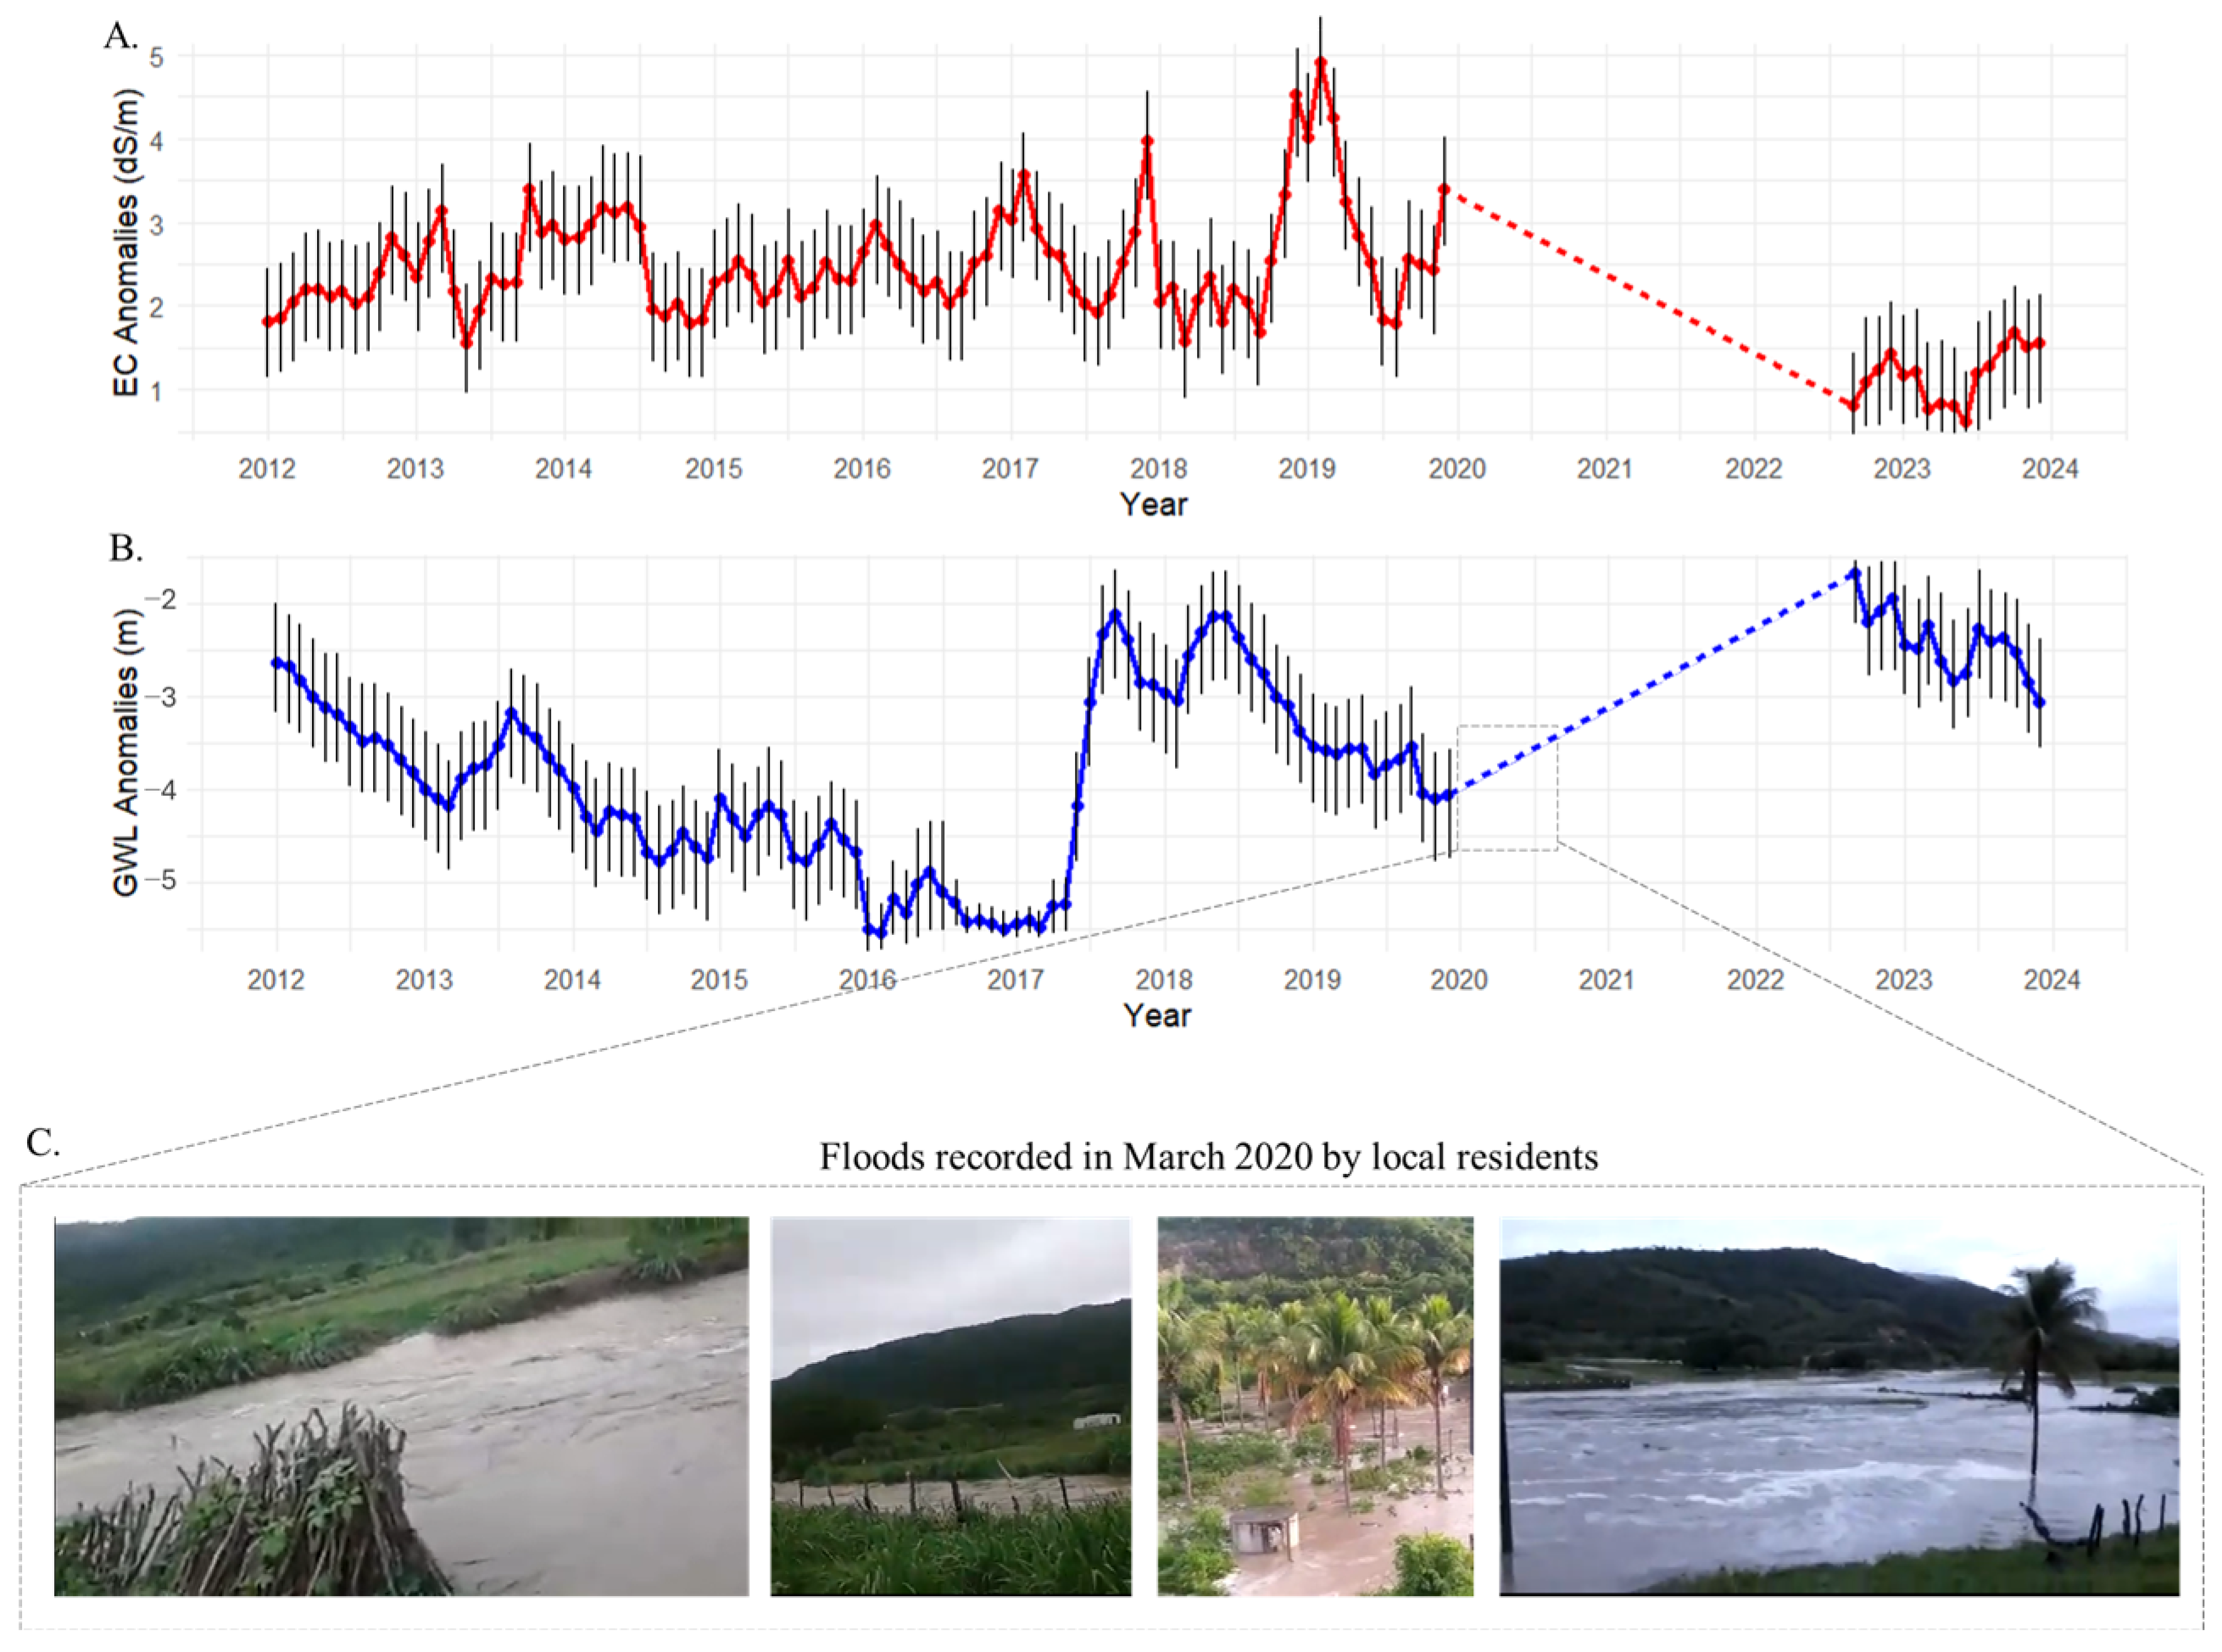
Regarding the last period analyzed (2019–2023), there was a data gap between 2020 and 2021 due to interruptions in monitoring caused by the COVID-19 pandemic. During this time, in addition to the flooding recorded in 2020, many agricultural activities were disrupted by social distancing measures, and financial assistance was provided. However, starting in 2022, when monitoring resumed, a recovery in GWL was detected, associated with increased natural recharge, while water abstraction also decreased. Previous research has shown that periods of reduced groundwater abstraction, combined with sufficient rainfall, can lead to partial aquifer recovery over time [16].
Figure 6 shows the accumulated recharge over the evaluated periods and the monthly precipitation over 12 years. It is observed that there was no recharge in 2012 due to the extremely dry conditions of that year. Recharge in the aquifer began in April 2013, reaching approximately 400 mm by the end of 2015. In the following four years, a total accumulated recharge of 730 mm was observed, reflecting the increased water availability in the region.
The years 2020 and 2023 were classified as hydrologically wet and extremely wet years, respectively, coinciding with low water extraction. This allowed for a significant recovery of the GLW, with recharge exceeding 800 mm, with 2022 standing out as the year with the highest recharge. These variations highlight the dependence of precipitation and evapotranspiration on the sustainability of the alluvial valley, as the recharge of the aquifer is directly related to the region’s water conditions [43]. However, the influence of land management and land use practices play an important role [11]. The observation of variable recharge, such as the lack of recharge in dry years (2012) and significant recharge in wet years (2020 and 2023), generally contrasts with the extraction of water for agricultural purposes. During drier periods, the volume of water extracted is higher, as observed in Figure 3. Furthermore, the combination of different land uses can alter the soil’s ability to store water and influence evapotranspiration rates. Soil cover type, compaction, cultivation of specific crops, and the presence of conservation practices, such as vegetative cover or water conservation techniques, can significantly impact the efficiency of recharge [11].

3.2. Land Use Dynamics in the Mimoso Stream Basin and Its Influence on Groundwater Flows

Figure 7 presents land use maps for the years 2012 (a), 2016 (b), 2019 (c), and 2023 (d) in the Mimoso stream basin. It is observed that the central areas of the basin have greater occurrence of savanna formation (caatinga), while in the areas northwest and southeast of the basin, the presence of pasture stands out. Throughout the Mimoso Alluvial Valley area there is also the presence of pasture, as well as urban areas, highlighting the development of anthropic activities associated with water availability conditions. It is possible to see that over time, pasture areas were converted into savanna formation (caatinga), mainly in the southwest portion of the basin. It is also possible to highlight the increase in the mosaic of uses class in 2023 in the north-central portion of the basin, when compared to previous years, this class was occupied by native vegetation. Pasture also stood out in this region in previous years, when compared to the most recent year. This dynamic of increasing areas of agriculture and livestock activities in the region may be associated with the increase in rainfall rates that occurred mainly in previous years, such as the accumulated rainfall in 2011 (647.1 mm) and 2022 (800.8 mm).
Precipitation has a strong influence on other variables in the hydrological cycle, such as surface runoff and groundwater flows, and in semiarid basins this relationship is even more visible when there are intermittent and ephemeral rivers. Andrade et al. [44] highlighted that in future climate scenarios with reduced precipitation in a semiarid basin of the Brazilian Northeast (NEB), there will be a reduction in baseflow. This climate dynamic often governs the form of land use (along with other factors) and impacts hydrological variables. There is, in fact, a complex relationship between land use and hydrological processes, where all elements are in constant interaction and influence each other. Previous studies about the dynamics between land use and hydrological processes in the Mimoso stream basin found that native vegetation and human activities have a strong influence on hydrological processes, mainly on soil water infiltration and soil moisture increase. For the reforestation scenario, the authors found increases of 6% to 20% in recharge and soil water storage of 9% to 28% [12].
Table 1 presents the land use classes and their respective areas for the years 2012, 2016, 2019, and 2023 in the Mimoso stream basin. Analyzing the land use dynamics over the years, it was observed that the pasture area has decreased 16.94 km2 in 10 years. Another class that decreased over time was temporary crops, with a reduction of 0.03 km2 in 2019 and 2023 compared to 2016. On the other hand, urban areas showed gradual growth over time, with 0.18 km2 in 2012 to 0.27 km2 in 2023. These results point to increased anthropogenic pressure on the region’s water resources, since there is an increase in impermeable surfaces, contributing to higher surface runoff and sediment yield, and consequently lower infiltration and recharge rates for aquifers [45,46].
Observing the savanna formation (caatinga) classes, it can be seen that a process of forest regeneration is taking place, since there was a considerable increase in the savanna formation, from 68.87 km2 in 2012 to 82.67 km2 in 2023, representing an increase of 20%, which may be related to climatic factors, such as accumulated rainfall. Annual rainfall data for the Mimoso stream basin in 2012 reveal that there was only 304.3 mm of precipitation, making this year one of the driest in recent years in the semiarid region of Northeast Brazil (NEB). According to Marengo et al. [47], the drought that occurred in the semiarid region from 2012 to 2015 had an intensity and impact not seen in several decades, increasing social vulnerability in this region, especially for small farmers. In this context, alluvial valleys, such as Mimoso, play an important role in supplying the population, especially during the dry season, and the extreme water deficit conditions existing in the semiarid region accentuate the low infiltration of water into the soil, which threatens aquifers [9,48]. In the following years, precipitation values gradually increased in the region, going from 474.3 mm in 2016 to 499.3 mm in 2019, and finally 800.8 mm in 2022. This climate dynamic may have contributed to the regeneration of the savanna formation (caatinga). Another explanation for the regeneration of the caatinga in the Mimoso stream basin is that there was a slowdown in the loss of its natural areas between 2000 and 2018, with a reduction of 17,165 km2 between 2000 and 2010, and 1604 km2 between 2016 and 2018, according to the Brazilian Institute of Geography and Statistics (IBGE).
Lins et al. [49], evaluating the impacts of climate change and land use on soil moisture and hydrological processes in a small basin adjacent to the Mimoso stream basin, found that the increase in vegetation, considering the incorporation of Permanent Preservation Areas (PPAs) with arboreal caatinga, led to an increase in actual evapotranspiration, since there is greater availability of water for transpiration through the canopy of the trees. The authors also found that the greater amount of tree vegetation influenced the increase in baseflow in almost all climate scenarios evaluated, and pointed out that the water absorbed and transported by the vegetation contributes to increased infiltration into the soil, facilitating the percolation and recharge to the aquifer.
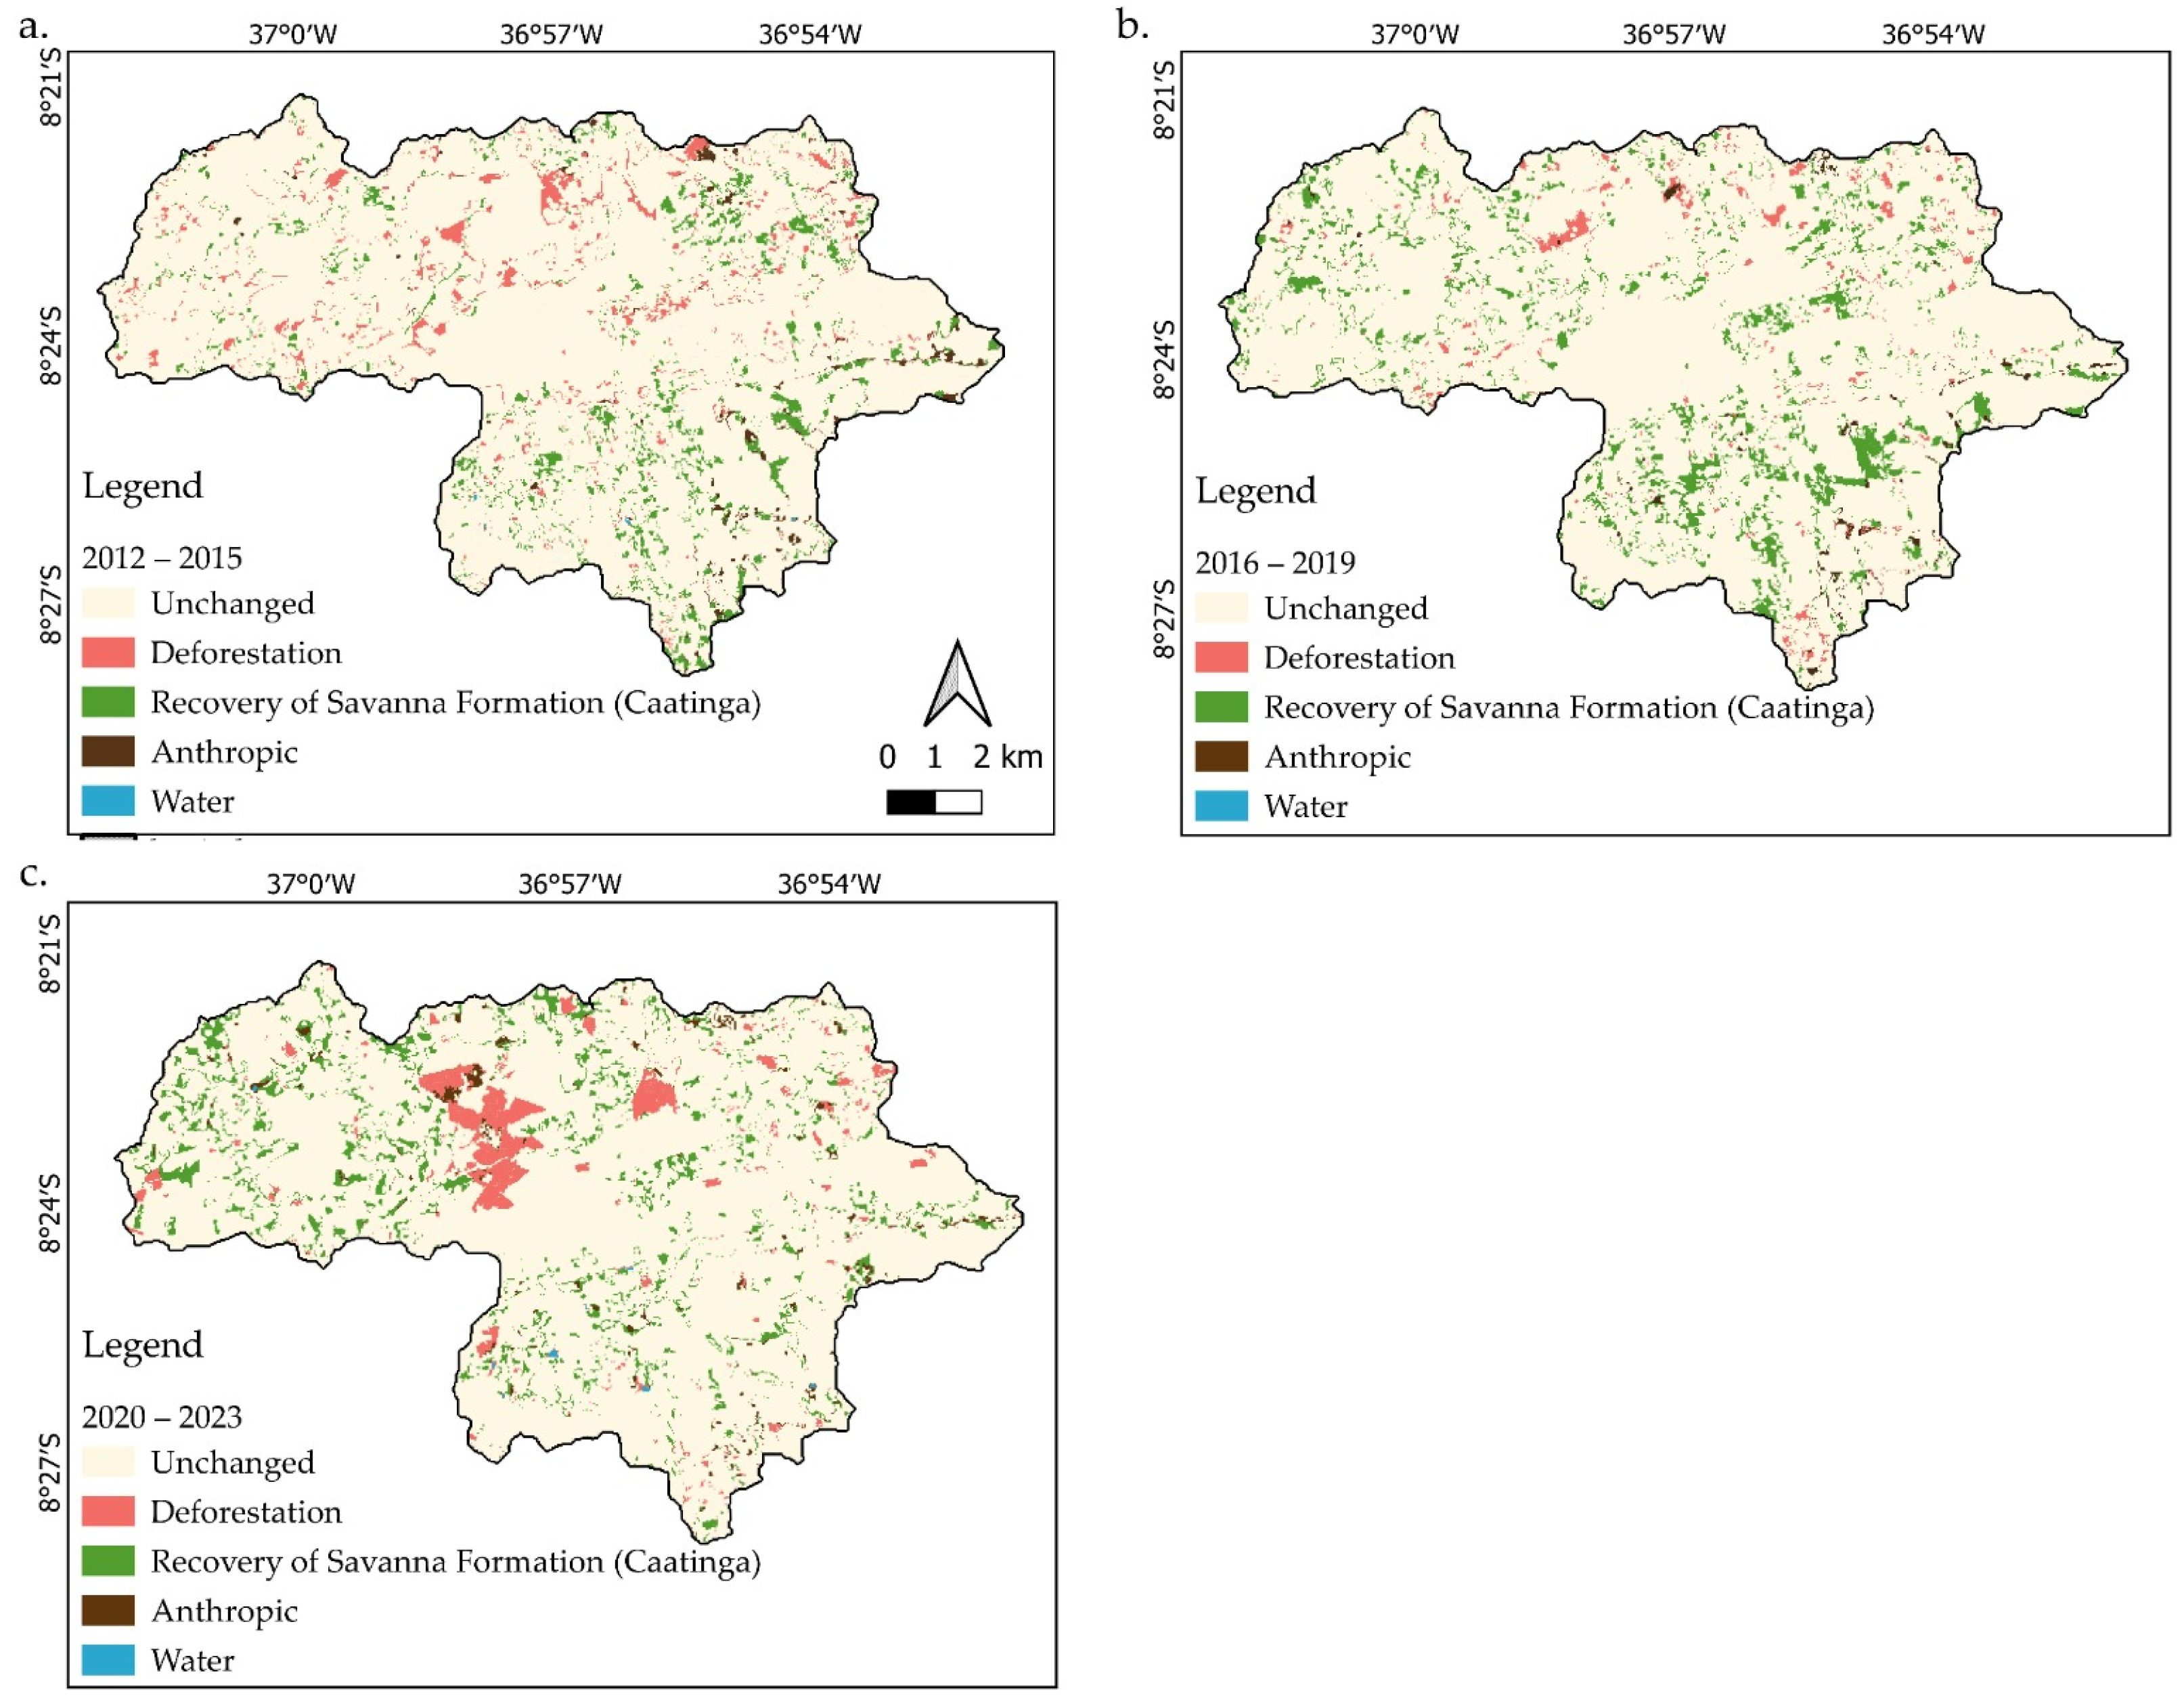
The land use transition maps among the four-year periods 2012–2015, 2016–2019, and 2020–2023 in the Mimoso basin are presented in Figure 8. During the first four-year period from 2012 to 2015, deforestation was prominent in the northwest region of the basin. In contrast, the southern and eastern areas experienced notable recovery of caatinga. This trend of vegetation regeneration continued in the following four years, from 2016 to 2019, becoming increasingly apparent throughout the basin, with a widespread return of plant cover. In the most recent four-year period analyzed, from 2020 to 2023, there was significant recovery of native vegetation, particularly in the western part of the basin. However, in the north-central portion, there was also a marked increase in deforestation driven by agricultural expansion. Despite these changes, certain areas remained unchanged throughout the entire study period. This dynamic land cover changes over the specified period emphasizes the increased recovery of vegetation and shows that agricultural practices are the main cause of deforestation.
Table 2 presents the land use transition classes and their respective areas, highlighting the changes that occurred over the four-year periods in the Mimoso stream basin. Approximately 90% of the basin area remained unchanged over the three four-year periods, with the last four-year period presenting a smaller area without changes (86%). Thus, in this last four-year period (2020–2023), greater changes occurred, such as a larger area of deforestation (5.62 km2) and the second largest area of recovery of natural vegetation (9.47 km2). The areas affected by anthropogenic changes were more pronounced in the last four-year period (2020–2023), when compared to the others, with a value of 1.53 km2. These results reinforce the risks associated with human action, such as unplanned occupation, which can cause a series of environmental impacts, such as increased surface runoff, soil erosion risks, reduced soil water retention capacity and reduced groundwater recharge [50]. Despite the occurrence of changes such as increased deforestation and anthropogenic areas, the water class showed an increase in the first four-year period (0.14 km2), since despite this period being extremely dry, the year 2012 presented even more critical precipitation values than the other years (2013 to 2015). In the following four-year periods, there was also an increase in water in the basin, but in smaller proportions. This water supply represents a factor that may have contributed to the regeneration of the caatinga and consequently may have favored the recharge of water to the aquifer, demonstrating the essential role of vegetation in maintaining groundwater supplies.

3.3. Groundwater Availability and Quality Temporal Distribution

Figure 9 presents a time series of electrical conductivity (EC) anomalies and groundwater level (GWL) anomalies over time, with an interpolated period due to a monitoring interruption during the COVID-19 pandemic. The presence of error bars indicates variability in the observed data. EC does not exhibit a uniform distribution pattern, showing fluctuations with periods of decline and increase throughout the observed timeframe. These variations may be influenced by seasonal changes as well as specific recharge and extraction events. In general, EC tends to rise gradually in certain periods, suggesting salt concentration processes. Subsequently, declines are observed, indicating dilution events that reduce water salinity.
The GWL shows a gradual decreasing trend during much of the recorded period (from 2012 to 2017 and from 2018 to 2020), likely due to intensive groundwater extraction, reduced recharge, or adverse climatic conditions, such as droughts (as discussed in the previous section). In some occasions, a recovery in groundwater levels is observed, which may be associated with rainfall events, improved water resource management, or reduced pumping, all of which are linked to land use impacts. Although the interruption in monitoring prevents a precise assessment of events between 2020 and 2021, flooding events were recorded in MAV in 2020, as shown in Figure 9C. Flooding significantly alters groundwater dynamics by increasing recharge rates, promoting the dilution of dissolved salts, and temporarily raising water table levels. Intense rainfall associated with flooding enhances infiltration, replenishing the aquifer and reducing electrical conductivity as fresh water dilutes more concentrated saline groundwater [51]. Furthermore, reducing water withdrawal during extreme hydrological events can contribute to the recovery of groundwater levels [51], e.g., in 2020 after the series of intense rainfall and reduced agricultural activities interrupted by the COVID-19 pandemic. When monitoring resumed in 2022, the data revealed overall better groundwater quality and a significant increase in groundwater levels, reinforcing the influence of extreme precipitation events on aquifer conditions. The general behavior of the series is characterized by regular fluctuations and an inverse relationship between EC and GWL, which means that, from a hydrological perspective, lower water availability (due to extraction or lack of recharge) tends to increase salinity, while water replenishment (through rainfall or reduced extraction) promotes dilution, thereby reducing electrical conductivity [9].
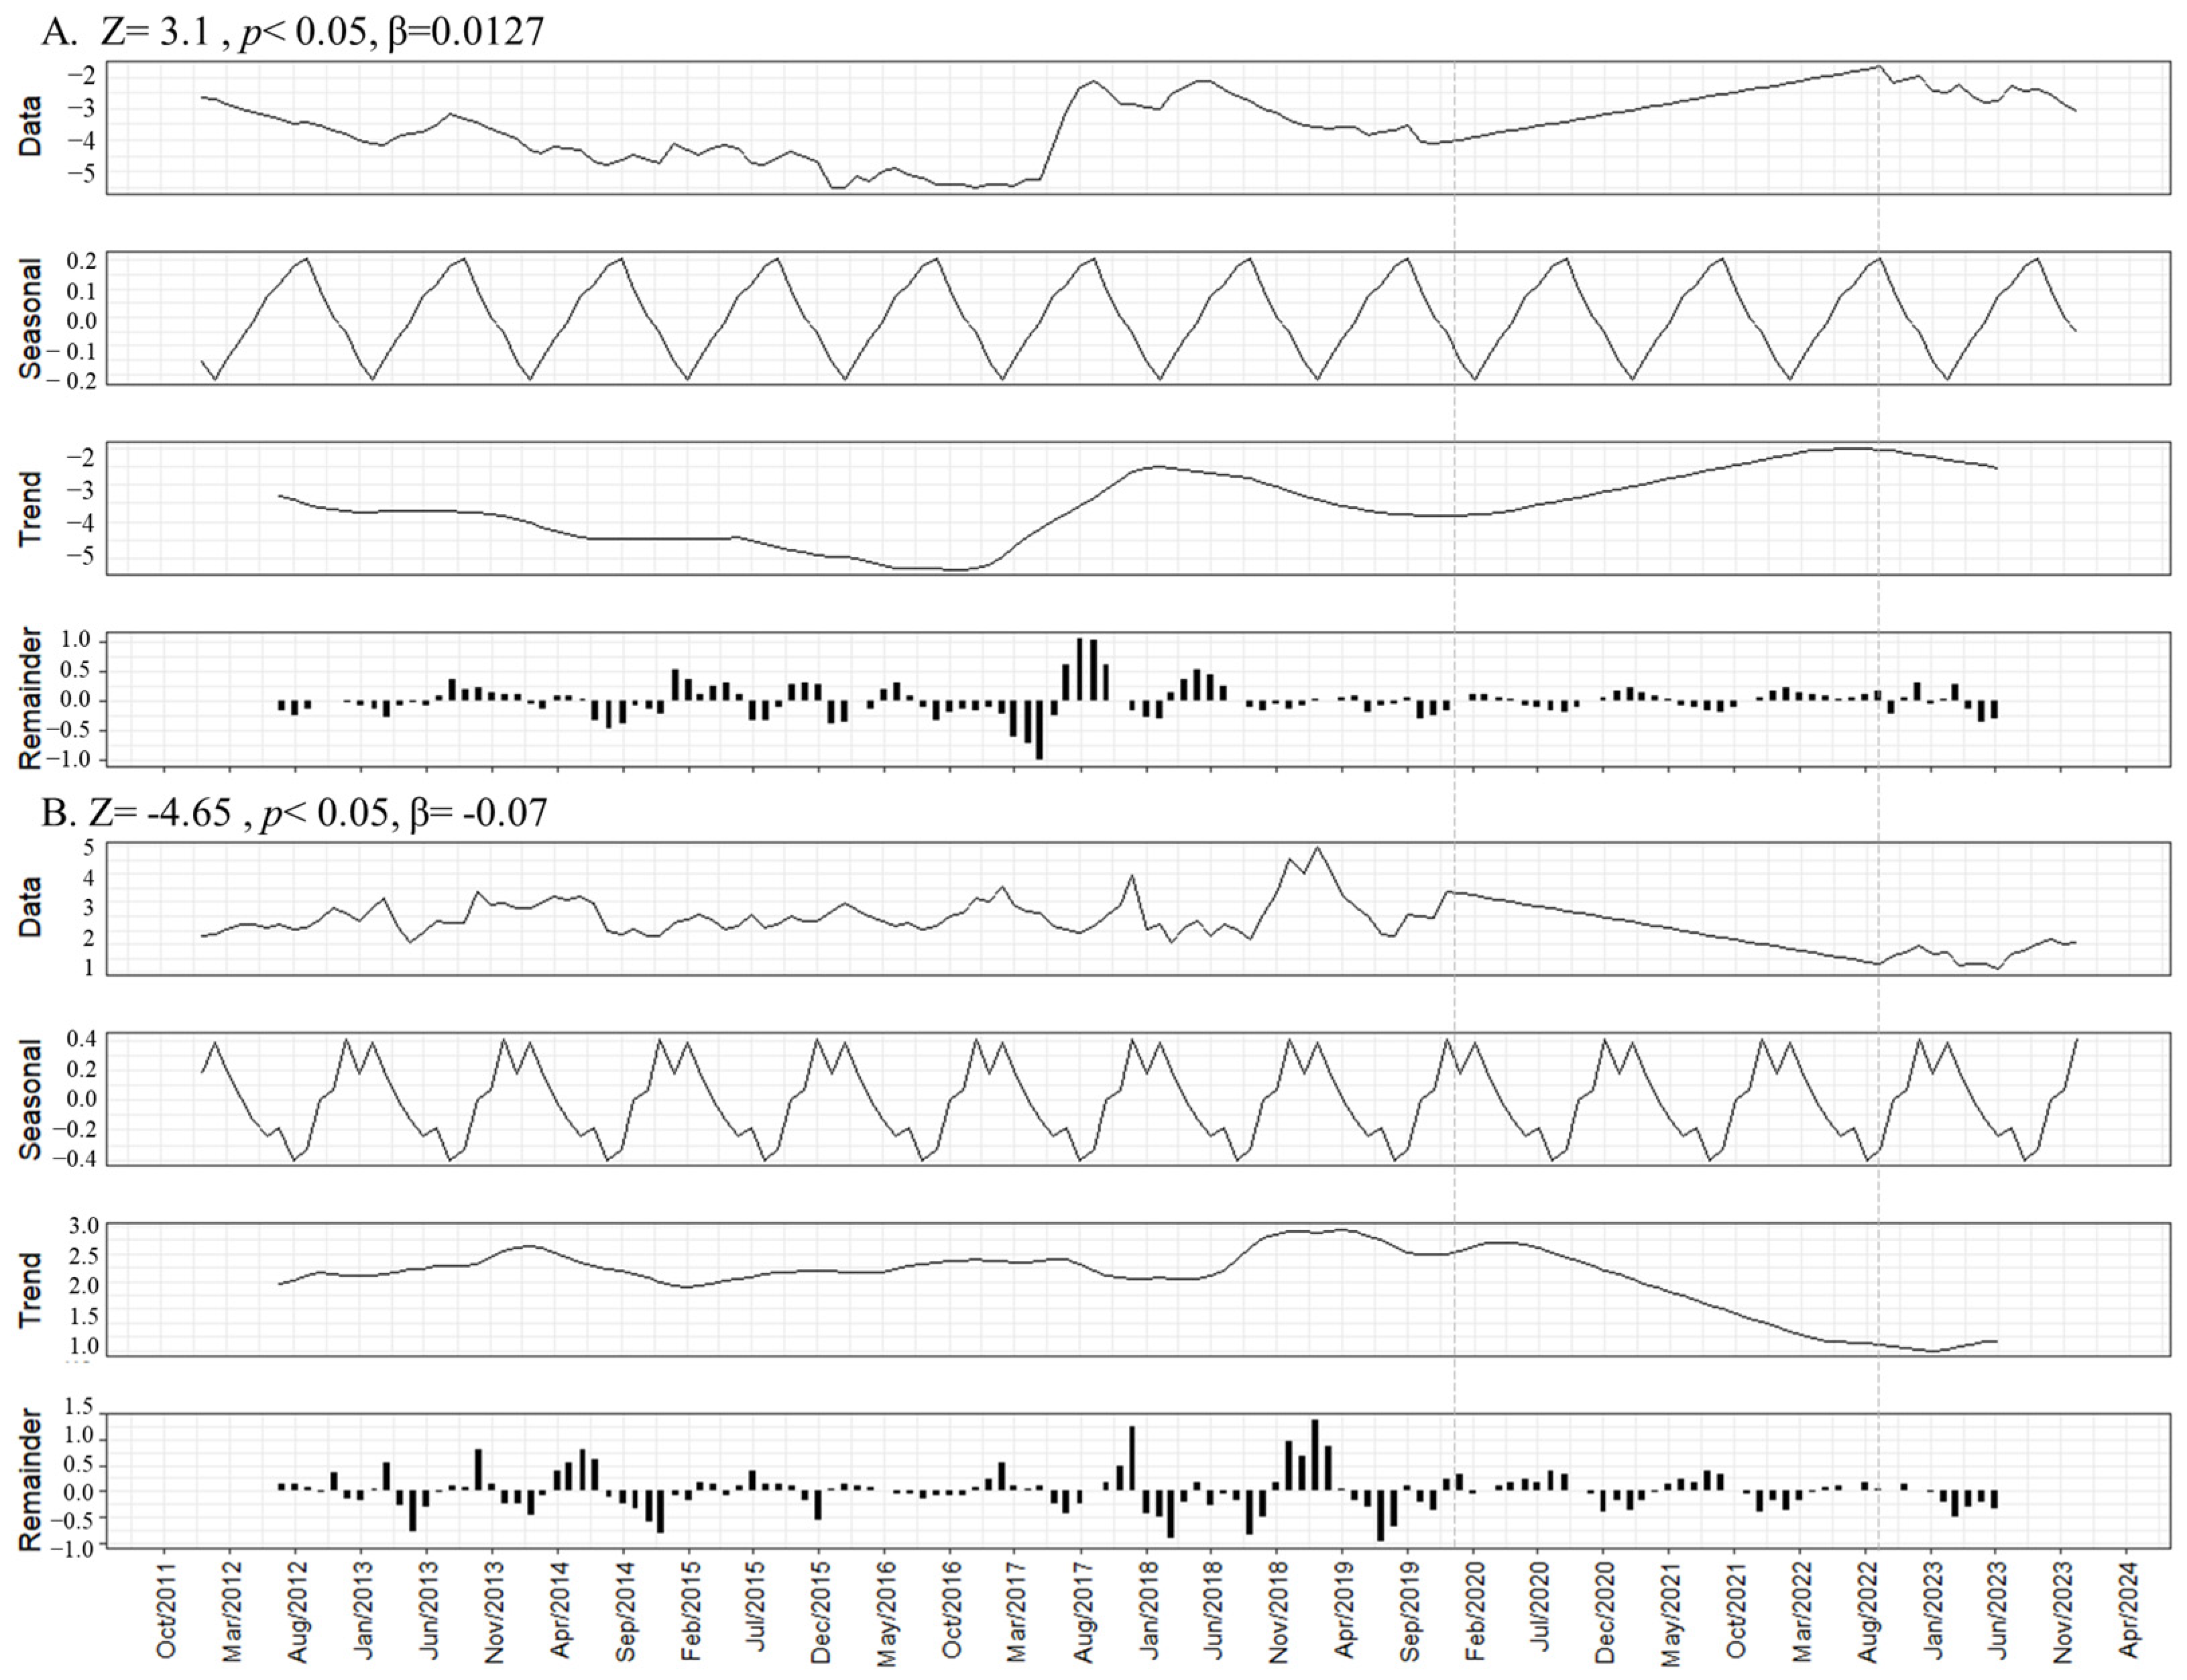
Figure 10 displays the annual time series and associated trend decomposition for groundwater level (A) and electrical conductivity (B) from 2012 to 2023 based on the Mann–Kendall test. The seasonal components of groundwater level and abstractions are highly similar, indicating that these variables are intrinsically interconnected.
The groundwater level increased by 0.0127 m per year (Z = 3.10, p < 0.05). Although data series show a long-term decreasing trend until around 2018, a partial recovery is observed, mainly due to rainfall increase in the 2020–2022 period. The increase in groundwater levels observed in 2022 is consistent with findings that highlight the role of precipitation variability in driving groundwater recharge [43]. The seasonal component exhibits regular fluctuations, indicating cyclical variations. The trend component confirms a declining groundwater level over time, with a slight increase in recent years. The remainder component highlights variability in the data, with some notable deviations.
The electrical conductivity of the aquifer showed a significant decreasing trend in EC over the study period. According to the STL plot and the remaining line, trend component confirms an increase in EC from 2012 to 2018, followed by a declining trend (−0.07 dS per m per yar), from 2020 to 2023. The MK tests demonstrated that there was a significant Z-value (Z = −4.65, p < 0.05), confirming that the salinity of the Mimoso Aquifer is highly variable in time. Electrical conductivity variations are strongly linked to seasonal hydrological cycles, where wet season recharge leads to salt dilution, and dry season evapotranspiration intensifies salinity [7]. Besides that, long-term declines in electrical conductivity have been linked to changes in land use, groundwater recharge rates, and reduced extraction in various aquifer systems [3,52].

3.4. Groundwater Availability and Quality Spatial Distribution

There is a strong hydrological interaction between groundwater levels and electrical conductivity, reinforcing the need for sustainable groundwater management strategies. For this purpose, spatial variability was investigated exploring both parameters. Statistics for groundwater depth and electrical conductivity data in 2012, 2016, 2019, and 2023 can be seen in Table 3.
The average groundwater level values vary over the years, reflecting periods of drought and hydrological recovery. In 2012, the average depth ranged from 2.65 m (January) to 3.92 m (October), indicating a gradual decline throughout the year. The high coefficient of variation (CV) of 26.70% in October suggests greater spatial heterogeneity during that period. High spatial variability in groundwater levels during droughts is commonly linked to uneven recharge and localized over-extraction [9]. In 2016, there is a significant increase in the average groundwater depth, reaching 5.67 m in October, which indicates a period of intensive water extraction and low recharge. This behavior can be associated with consecutive years of drought and high extraction rates. Periods of intensive groundwater abstraction, coupled with low recharge, have been shown to accelerate aquifer depletion in similar hydrogeological settings [7,16]. The CV in June (4.99%) indicates lower spatial variability in that month. In 2019, there are signs of recovery in the groundwater level, with averages ranging from 3.60 m (January) to 4.28 m (October). This recovery may be related to a wetter period, allowing the aquifer recharge. The CV of 37.18% in October suggests considerable variation in water levels across different parts of the study area.
In 2023, there is a more pronounced return to normal conditions, with lower average depths (2.46 m in January and 2.53 m in October), indicating greater water availability. The lower CV in June (33.07%) suggests a more uniform distribution of groundwater levels during that period. The Kolmogorov–Smirnov (KS) test values indicate a slight trend toward normality in the data from 2016 onward, with values below 0.17, demonstrating less deviation from a normal distribution over the years.
For electrical conductivity (EC), in 2012, the average values range from 1.31 (June) to 1.97 dS/m (October), with a relatively stable CV (13–17%), suggesting homogeneous conditions. In 2016, there is a significant reduction in the average EC values (from 0.69 dS/m in January to 0.65 dS/m in October), which is associated with a lower salt accumulation in the groundwater [53]. This may be related to insufficient recharge during drought years, promoting salt leaching. In 2019, EC values increase, reaching 1.06 dS/m in October, possibly due to increased evapotranspiration and salt concentration during the dry season. The CV in October (93.12%) suggests high spatial variability in salinity distribution. Regarding 2023, the EC shows a gradual decrease over time, reflecting a potential recovery in water quality, with averages ranging from 0.61 (June) to 1.11 dS/m (October). However, the high CV in October (130.06%) indicates significant spatial heterogeneity in salinity in the region.
The semivariograms are presented in Figure 11 and Table 4 and were validated using the leave-one-out cross-validation criterion, with a standard deviation close to one. The highest standard deviation recorded in 2023 (October: 0.87; June: 1.16) indicates greater variability in model predictions, suggesting that the accuracy of the adjustments may have been affected by changes in the spatial structure of the variable over time. Nevertheless, the models remain within the desired limits.
For groundwater levels, the predominant variogram models were exponential (Exp) and Gaussian (Gauss) (Figure 11). The variation in model selection suggests changes in the spatial distribution behavior of groundwater depth over the years. In 2012, exponential models were applied for all three months, with C0 values ranging from 0.02 (October) to 0.16 (January) and sill values between 0.36 and 0.49. The range varied considerably, reaching 294.0 m in January, 385.1 m in June, and only 123.0 m in October. The R2 values were high (0.8–0.9), but the DSD showed significant variation (43.9% in January and 28.3% in June), suggesting moderate spatial dependence, whereas in October, the DSD dropped to just 4.5%, indicating strong spatial dependence.
In 2016, Gaussian models were adopted, with nugget effects ranging from 0.00 to 0.18 and sill values between 0.47 and 0.64. The range fluctuated between 121.2 m (October) and 374.0 m (January), while R2 values varied from 0.76 to 0.86. The DSD was 27.7% in January and 28.1% in June, characterizing moderate spatial dependence. However, in October, the DSD dropped drastically to just 0.2%, indicating extremely strong spatial dependence, suggesting that local factors dominated variability during this period.
For 2019, the exponential model was applied in January, while the Gaussian model was used in June and October. The nugget effect was highest in this year, reaching 0.29 in January and 0.40 in June, with sill values between 0.44 and 0.85. The ranges varied between 278.5 m and 365.8 m, and R2 values ranged from 0.87 to 0.89. The DSD was high, being 48.6% in January, 46.8% in June, and 38.1% in October, suggesting moderate to strong spatial dependence, which indicates a well-defined spatial structure in groundwater levels during this period. Finally, in 2023, both exponential and Gaussian models were used, depending on the month. In January, the exponential model exhibited a very low nugget effect (0.02) and a range of 171.0 m, with R2 of 0.79 and DSD of 5.8%, indicating strong spatial dependence. In June, the Gaussian model showed a nugget effect of 0.29, a range of 388.4 m, R2 of 0.94, and DSD of 44.3%, characterizing moderate spatial dependence. In October, the Gaussian model recorded a nugget effect of 0.12, a range of 420.2 m, R2 of 0.78, and DSD of 31.6%, also indicating moderate spatial dependence.
Regarding to electrical conductivity, in 2012, the models used were Gaussian in January and exponential in June and October. In January, with the Gaussian model, a nugget effect of 0.05 and a total sill of 0.11 were observed, along with a range of 342.0 m, R2 of 0.8, and DSD of 45.1%, suggesting moderate spatial dependence. In June, the exponential model also presented a nugget effect of 0.05 and a sill of 0.11, but with a slightly shorter range (327.0 m) and DSD of 40.9%, maintaining a similar spatial dependence pattern. In contrast, in October 2012, with the exponential model, the nugget effect was zero, the sill reached 0.14, the range decreased to 135.0 m, R2 improved to 0.9, and DSD dropped sharply to just 0.9%, indicating very strong spatial dependence and almost no local variability.
Considering 2016, Gaussian models were applied in all three months. In January and June, the nugget effect was zero, with very low sill values (0.02 and 0.05, respectively), and the ranges were relatively short (199.2 m in January and 114.3 m in June). During these months, R2 remained between 0.8 and 0.85, and DSD closed to 0%, suggesting a strong spatial dependence. In October 2016, although the Gaussian model was maintained, the nugget effect slightly increased (0.01), with a sill of 0.02, range of 251.1 m, R2 of 0.86, and a significantly higher DSD (66.7%). However, it is worth noting that for those measurements, sill values are also low, indicating low spatial variability for electrical conductivity.
In 2019, the data showed slight heterogeneity. In January, the Gaussian model resulted in a nugget effect of 0.02, a sill of 0.12, and a short range of 132.0 m, with R2 of 0.87 and DSD of 12.8%, indicating relatively strong spatial dependence. In June, the spherical model was adopted, with a nugget effect of 0.02 and a sill of 0.70; however, the range increased to 361.0 m, R2 reached 0.88, with a strong DSD, corroborating with the CV found (Table 3). In October 2019, with the Gaussian model, the nugget effect increased to 0.05, sill reached 0.15, range was 281.0 m, R2 was 0.89, and DSD rose to 33.3%, indicating moderate spatial dependence, with local influences.
Regarding 2023, a significant shift was observed. In January, using the exponential model, the nugget effect increased to 0.31 and the sill to 0.56, with a range of 366.0 m, R2 of 0.9, and DSD of 55.5%, indicating that salinity began to show moderate to weak spatial structure, with greater influence from local variability. In June 2023, the exponential model resulted in a very low nugget effect (0.01) and a sill of 0.04, but with a long range (430.3 m) and an R2 of 0.91, maintaining a DSD of 33.3%, which indicates moderate spatial dependence and large data continuity. In October 2023, the Gaussian model presented a nugget effect of 0.04, sill of 0.60, range of 352.1 m, R2 of 0.91, and DSD of just 6.7%, indicating that during this month, data exhibited strong spatial dependence, with little influence from local processes.
Figure 12 presents kriging maps of groundwater depth (GW) for the months of January, June, and October in the years 2012, 2016, 2019, and 2023. Each map illustrates spatial variation in groundwater depth over time, highlighting seasonal and interannual trends. Regions with deeper groundwater levels (lighter tones) indicate lower water availability, typically associated with intensive extraction or reduced recharge, whereas shallower areas (darker tones) suggest greater groundwater availability.
Maps reveal seasonal fluctuations in groundwater depth within each year. In general, groundwater levels tend to be lower (deeper depths) during dry periods (October), when recharge is minimal, and higher (shallower depths) in wetter months (January and June), when groundwater volume increases.
Regarding long-term trends, in 2012, despite low rainfall indices, groundwater levels in January still reflected trends from previous years, with an average depth of 2.6 m. Over the course of the year, depth gradually increased, reaching values above 3.2 m in October. The year 2016 was marked by a severe drought and intensive groundwater extraction, leading to a significant variation in groundwater depth, ranging from 3 m to 7.8 m, highlighting the impact of prolonged water scarcity. In 2019, partial recovery of groundwater resources was observed due to increased water availability, resulting in higher groundwater levels, fluctuating between 3.2 m and 6.2 m. By 2023, following a period of increased rainfall and reduced agricultural activity, groundwater levels reached their highest recovery point within the analyzed period, with depths ranging from 2.1 m to 3.38 m.
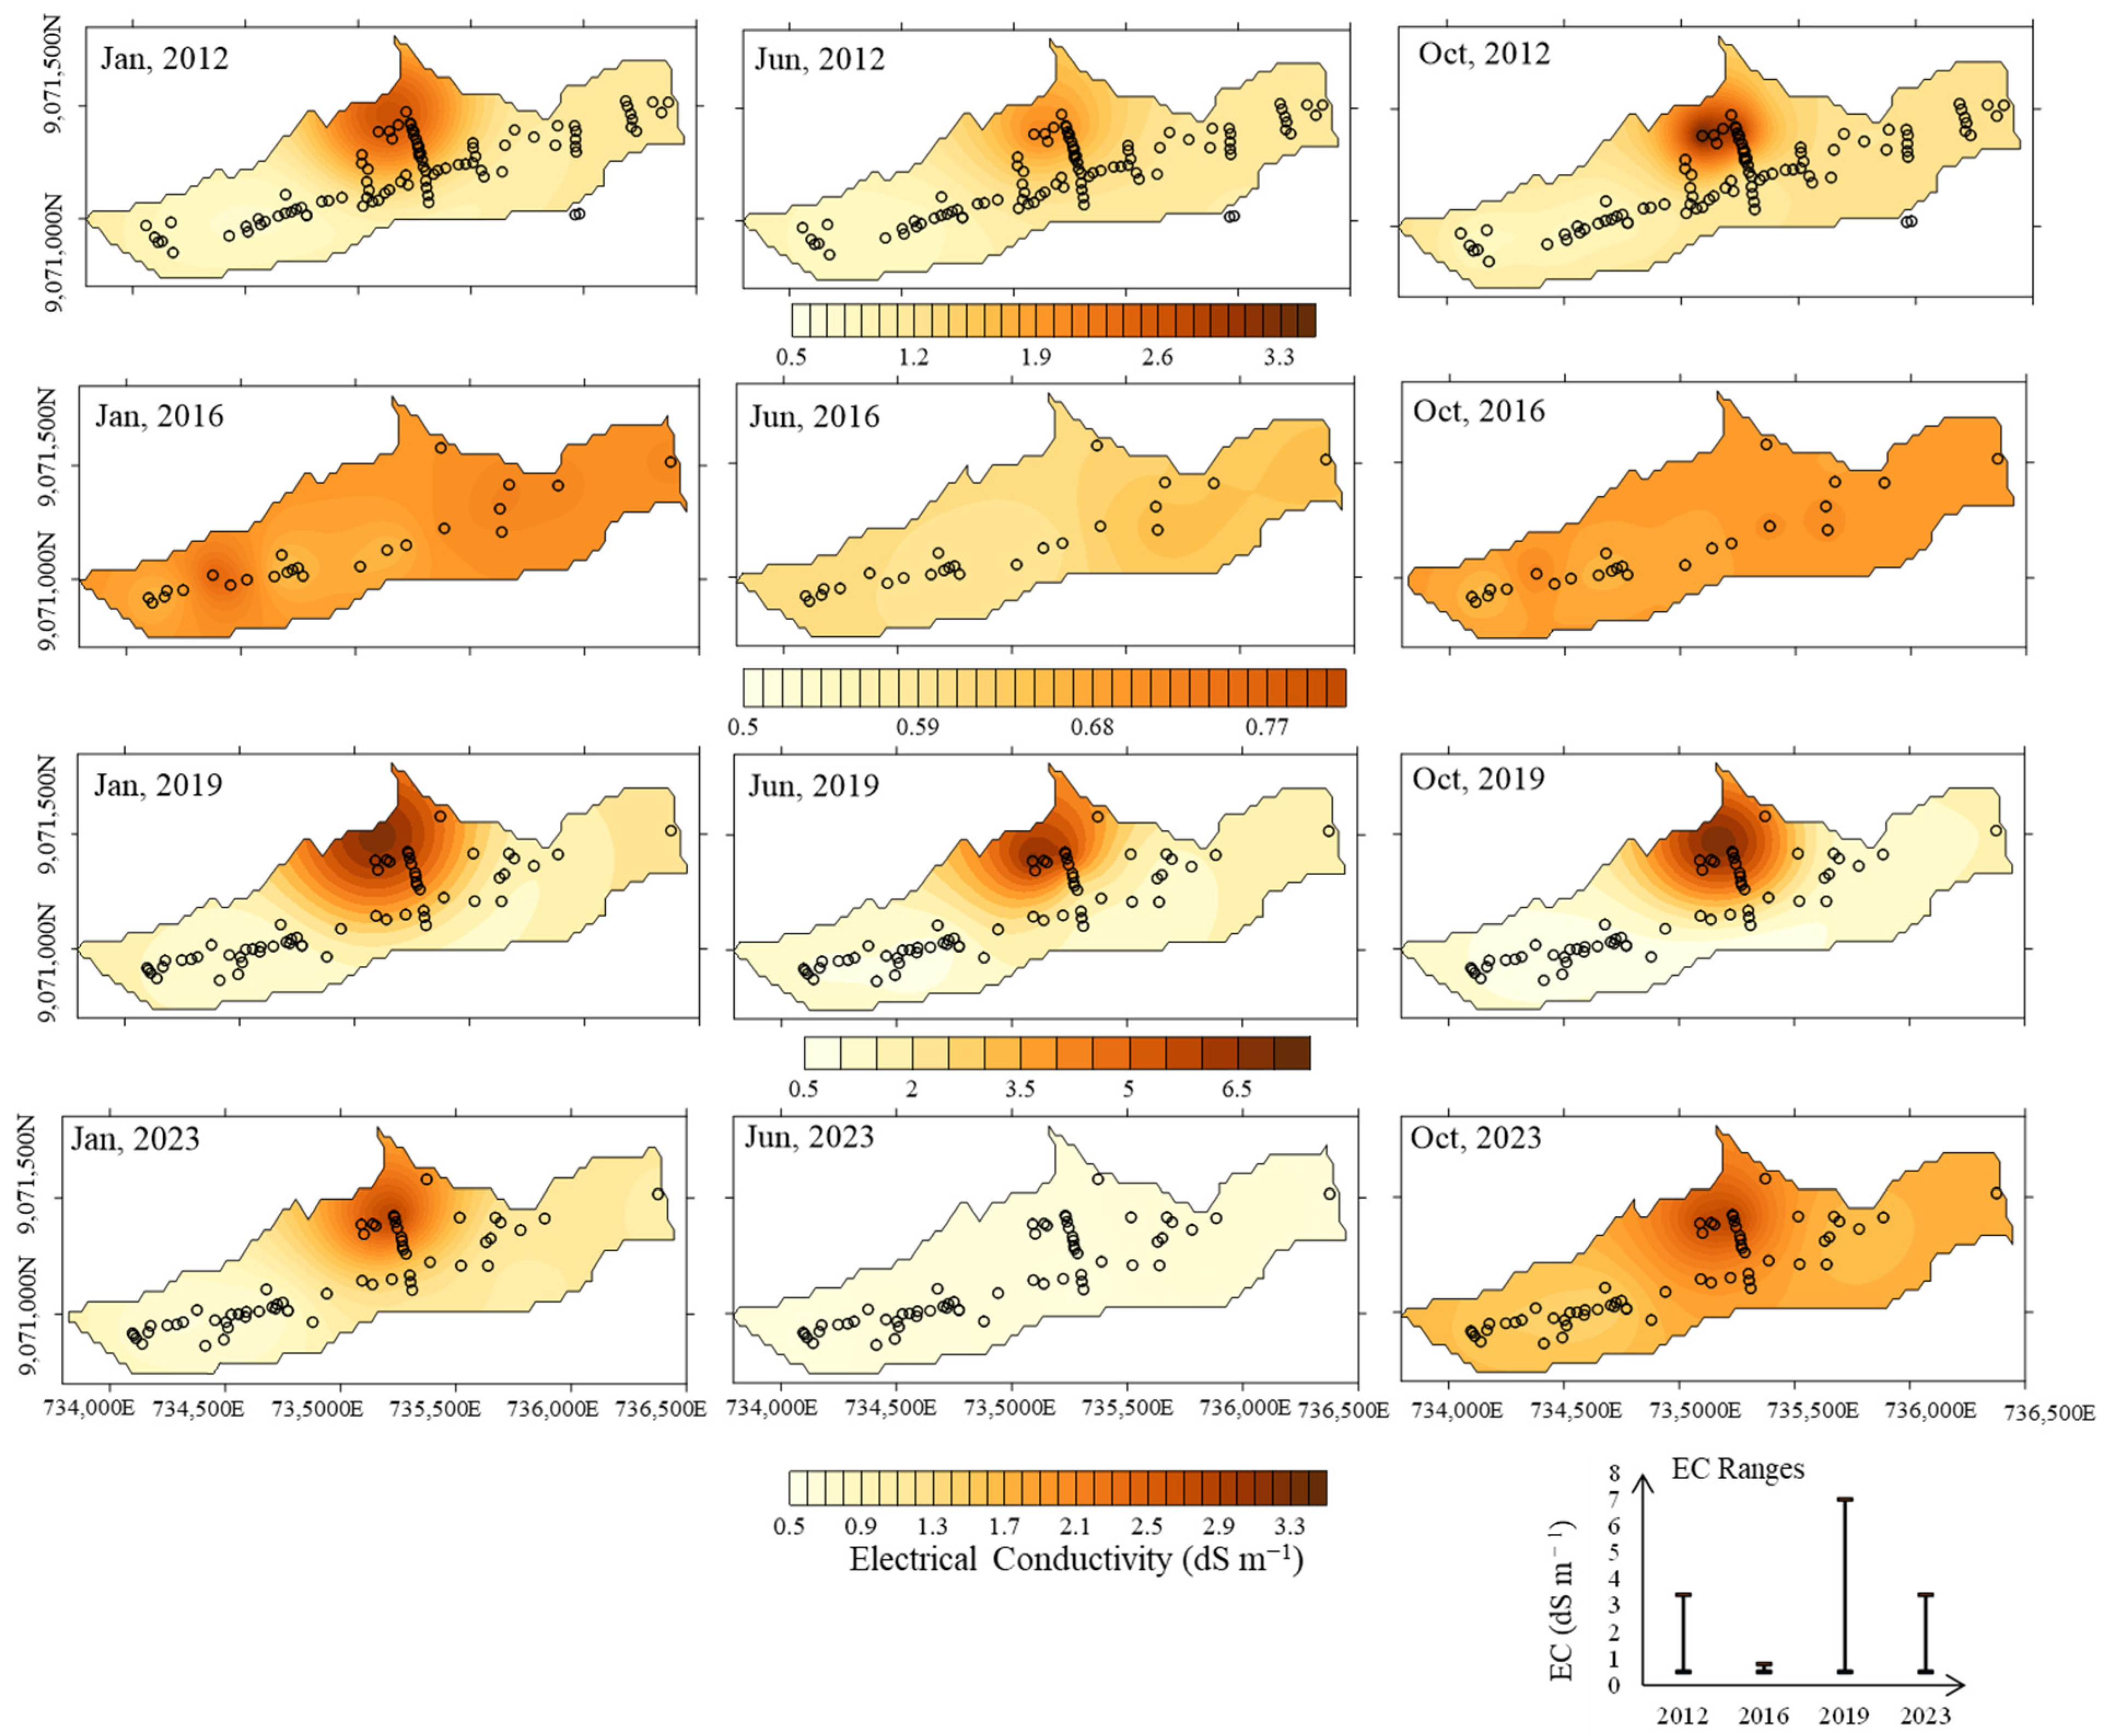
The analysis of these maps highlights the combined influence of seasonality and interannual climatic conditions on groundwater depth. Groundwater level variations over the historical period reflect changes driven by these factors. The decline in groundwater levels between 2012 and 2016 resulted from low precipitation and increased water extraction for agricultural purposes [7]. This period also saw a reduction in the number of monitored points due to severe drought conditions. However, the decrease in agricultural activity and increased precipitation in recent years (2020–2023) contributed to groundwater level recovery, emphasizing the importance of continuous monitoring for sustainable water resource management. Schiavo [54] highlights that the groundwater variation is highly non-linear in time from year to year and highly variable in space, corroborating with the spatial and temporal variation presented in Figure 12. Regarding electrical conductivity and spatial–temporal dynamics, Figure 13 presents the isoline maps of electrical conductivity, based on adjusted semivariogram models.
The variation in EC scales over the years indicates significant changes in the concentration of dissolved salts in groundwater. In 2012, EC values ranged from 0.5 to 2.5 dS/m, suggesting relatively stable conditions. However, in 2016, there was a substantial increase in maximum values, with the scale ranging from 0.7 to 4.8 dS/m, highlighting a marked rise in water salinity. This period coincides with prolonged drought and intensive extraction, which lowered aquifer levels and promoted salt concentration due to reduced dilution. In 2019, the EC scale showed a slight decrease ranging from 0.6 to 3.9 mS/cm, suggesting a partial recovery in groundwater quality. This improvement may be associated with increased recharge during this period, diluting salinity in some areas [7,39]. By 2023, the EC scale had decreased even further, ranging from 0.4 to 3.2 dS/m, reflecting greater water availability and a possible reduction in aquifer exploitation, favoring salt dilution.
In addition to interannual variation, seasonal fluctuations are also observed within each year. In general, the maps indicate that EC tends to be lower during wetter months (January and June), when recharge contributes to salt dilution, and higher in October, a typically drier period characterized by increased evapotranspiration and reduced recharge, leading to greater salt concentration. Depending on the distribution of rainfall throughout the year, these increases and decreases may vary in intensity [10]. Generally, EC levels tend to be higher in October, coinciding with drier periods when reduced recharge leads to salt concentration in groundwater. Conversely, lower EC values in January and June suggest dilution effects due to precipitation and surface water infiltration.
Salinity distribution in aquifers is often controlled by regional flow dynamics, geological heterogeneity, and localized recharge conditions [5,10,39]. It was found that the regions with the highest EC are in the central part of the valley, where the soil texture is finer, and the impediment layer is closer to the soil surface [10,39]. Previous studies indicated that this central region is influenced by the regional underground flow and by contributions of runoff from the slopes of the valley that feed the water table, which also favors the increase in salinity, since it carries part of the salts present in the soil of the slopes for this region [5,7].

4. Conclusions

This study assessed the spatial and temporal variability of groundwater levels and electrical conductivity in the Mimoso Alluvial Valley (MAV) from 2012 to 2023 using geostatistical methods. The results highlight the significant influence of climate variability, land use changes, and groundwater extraction on the region’s hydrogeological dynamics.
Groundwater levels exhibited a declining trend from 2012 to 2018, followed by a partial recovery in 2022, corresponding to increased precipitation and reduced agricultural activity during the COVID-19 pandemic. Electrical conductivity showed an initial increase from 2012 to 2018, likely due to prolonged droughts and intensive water abstraction, but a decreasing trend from 2020 to 2023, indicating improved recharge conditions and reduced salinity.
Geostatistical analysis revealed that the spatial dependence of groundwater levels and salinity varied over time, with strong to moderate spatial dependence detected through semivariogram models. The results confirm that periods of higher water abstraction coincide with increased salinity, reinforcing the need for sustainable water management strategies to prevent long-term aquifer degradation.
The findings emphasize the importance of integrating land use planning with groundwater management to ensure the long-term sustainability of water resources in semiarid regions. Future research should focus on developing predictive models to assess the impacts of climate change on groundwater availability and quality, aiding decision-makers in optimizing water use in agriculture.

Author Contributions

Conceptualization, T.A.B.A. and A.A.d.A.M.; methodology, T.A.B.A., A.M.S.d.C., C.W.L.d.A.F., M.V.d.S. and A.A.d.A.M.; software, T.A.B.A., A.M.S.d.C., L.C.d.S.B. and C.W.L.d.A.F.; validation, T.A.B.A., L.C.d.S.B. and R.S.d.C.; formal analysis, T.A.B.A., L.C.d.S.B., R.S.d.C. and A.A.d.A.M.; investigation, T.A.B.A., L.C.d.S.B., C.W.L.d.A.F., A.M.S.d.C., C.V.d.S.M., M.V.d.S., R.S.d.C. and A.A.d.A.M.; resources, T.A.B.A. and A.A.d.A.M.; data curation, T.A.B.A., R.S.d.C. and A.A.d.A.M.; writing—original draft preparation, T.A.B.A., L.C.d.S.B., C.W.L.d.A.F., A.M.S.d.C., C.V.d.S.M., M.V.d.S., R.S.d.C. and A.A.d.A.M.; writing—review and editing, T.A.B.A., L.C.d.S.B., C.W.L.d.A.F., A.M.S.d.C., C.V.d.S.M., M.V.d.S., R.S.d.C. and A.A.d.A.M.; visualization, T.A.B.A., A.A.d.A.M. and C.V.d.S.M.; supervision, A.A.d.A.M. and M.V.d.S.; project administration, A.A.d.A.M.; funding acquisition, A.A.d.A.M. All authors have read and agreed to the published version of the manuscript.

Funding

The National Council for Scientific and Technological Development—CNPq (151969/2020-5, and 311.588/2023-9); the Brazilian Funding Authority for Studies and Projects—FINEP; and the Foundation of Science and Technology Support for Pernambuco State—FACEPE (“Tecnologias Hídricas para o semiárido” Project—Grant APQ 0300-5.03/17, and BFP-0092-5.03/24).

Data Availability Statement

The data presented in this study are available upon request from the corresponding author.

Acknowledgments

We thank the Postgraduate Program in Agricultural Engineering (PGEA) of the Federal Rural University of Pernambuco (UFRPE) for supporting the development of this research.

Conflicts of Interest

The authors declare no conflicts of interest.

References

  1. Williams, S.A.; Megdal, S.B.; Zuniga-Teran, A.A.; Quanrud, D.M.; Christopherson, G. Mapping Groundwater Vulnerability in Arid Regions: A Comparative Risk Assessment Using Modified DRASTIC Models, Land Use, and Climate Change Factors. Land 2025, 14, 58. [Google Scholar] [CrossRef]
  2. Bouchaou, L.; Alfy, M.; El Shanafield, M.; Siffeddine, A.; Sharp, J. Groundwater in Arid and Semi-Arid Areas. Geosciences 2024, 14, 332. [Google Scholar] [CrossRef]
  3. Wang, W.; Chen, Y.; Chen, Y.; Wang, W.; Zhang, T.; Qin, J. Groundwater dynamic influenced by intense anthropogenic activities in a dried-up river oasis of Central Asia. Hydrol. Res. 2022, 53, 532–546. [Google Scholar] [CrossRef]
  4. Hirata, R.; Suhogusoff, A.; Marcellini, S.; Villar, P.; Marcellini, L. As Águas Subterrâneas e Sua Importância Ambiental e Socioeconômica Para o Brasil; Universidade de São Paulo—Instituto de Geociências: São Paulo, Brazil, 2019. [Google Scholar]
  5. Montenegro, A.A.A.; Montenegro, S.M.G.L. Variabilidade espacial de classes de textura; salinidade e condutividade hidráulica de solos em planicie aluvial. Rev. Bras. Eng. Agric. Ambient. 2006, 10, 30–37. [Google Scholar] [CrossRef]
  6. Fontes Júnior, R.V.P.; Montenegro, A.A.A. Temporal dependence of potentiometric levels and groundwater salinity in alluvial aquifer upon rainfall and evapotranspiration. Rev. Bras. Recur. Hidr. 2017, 22, e54. [Google Scholar] [CrossRef]
  7. Almeida, T.A.B.; Montenegro, A.A.A.; Mackay, R.; Montenegro, S.M.G.L.; Coelho, V.H.R.; de Carvalho, A.A.; da Silva, T.G.F. Hydrogeological Trends in an Alluvial Valley in the Brazilian Semiarid: Impacts of Observed Climate Variables Change and Exploitation on Groundwater Availability and Salinity. J. Hydrol. Reg. Stud. 2024, 53, 101784. [Google Scholar] [CrossRef]
  8. Coelho, V.H.R.; Montenegro, S.; Almeida, C.N.; Silva, B.B.; Oliveira, L.M.; Gusmão, A.C.V.; Freitas, E.S.; Montenegro, A.A.A. Alluvial groundwater recharge estimation in semi-arid environments using remotely sensed data. J. Hydrol. 2017, 548, 1–15. [Google Scholar] [CrossRef]
  9. Abera, K.A.; Asfaw, B.A.; Doyoro, Y.G.; Gebreyohanes, T.; Hussien, A.; Berhane, G.; Hagos, M.; Romha, A.; Walraevens, K. Assessing Shallow Groundwater Quality Around the Sheba Leather Tannery Area, Wikro, North Ethiopia: A Geophysical and Hydrochemical Study. Geosciences 2024, 14, 324. [Google Scholar] [CrossRef]
  10. Almeida, T.A.B.; Montenegro, A.A.A.; de Lima, J.L.M.P.; Farias, C.W.L.A.; Carvalho, A.A.; de Paiva, A.L.R. Spatiotemporal Variability of Groundwater Quality for Irrigation: A Case Study in Mimoso Alluvial Valley, Semiarid Region of Brazil. Water 2025, 17, 410. [Google Scholar] [CrossRef]
  11. Talib, A.; Desai, A.R.; Huang, J. Spatial and temporal forecasting of groundwater anomalies in complex aquifer undergoing climate and land use change. J. Hydrol. 2024, 639, 131525. [Google Scholar] [CrossRef]
  12. Fontes Júnior, R.; Montenegro, A. Impact of land use changes on the water balance in a representative watershed in the semiarid of the state of Pernambuco using the SWAT model. Eng. Agric. 2019, 39, 110–117. [Google Scholar] [CrossRef]
  13. Gomes, G.D.; Nunes, A.M.B.; Libonati, R.; Ambrizzi, T. Projections of subcontinental changes in seasonal precipitation over the two major river basins in South America under an extreme climate scenario. Clim. Dyn. 2022, 58, 1147–1169. [Google Scholar] [CrossRef]
  14. Hussain, S.; Wang, Y.; Awais, M.; Sajjad, M.M.; Ejaz, N.; Javed, U.; Waqas, M.; Zhe, X.; Iqbal, J. Integrated assessment of groundwater quality dynamics and Land use/land cover changes in rapidly urbanizing semi-arid region. Environ. Res. 2024, 260, 119622. [Google Scholar]
  15. de Oliveira, M.E.G.; da Silva, M.V.; de Almeida, G.L.P.; Pandorfi, H.; Oliveira Lopes, P.M.; Manrique, D.R.C.; dos Santos, A.; Jardim, A.M.d.R.F.; Giongo, P.R.; Montenegro, A.A.; et al. Investigation of pre and post environmental impact of the lockdown (COVID-19) on the water quality of the Capibaribe and Tejipió rivers, Recife metropolitan region, Brazil. J. S. Am. Earth Sci. 2022, 118, 103965. [Google Scholar] [CrossRef]
  16. Zhang, X.; Wu, X.; Zhao, R.; Mu, W.; Wu, C. Identifying the facts and driving factors of deceleration of groundwater table decline in Beijing during 1999–2018. J. Hydrol. 2022, 607, 127475. [Google Scholar] [CrossRef]
  17. Pereira, B.S.; Uchôa, J.G.S.M.; Freitas, G.S.; Meira Neto, A.A.; Anache, J.A.A.; Wendland, E.C.; Mendiondo, E.M.; Medeiros, P.H.A. Hydrological heritage: A historical exploration of human–water dynamics in northeast Brazil. Hydrol. Sci. J. 2025, 70, 546–558. [Google Scholar] [CrossRef]
  18. Patel, M.P.; Gami, B.; Patel, A.; Patel, P.; Patel, B. Climatic and Anthropogenic Impact on Groundwater Quality of Agriculture Dominated Areas of Southern and Central Gujarat, India. Groundw. Sustain. Dev. 2020, 10, 100306. [Google Scholar]
  19. Boufekane, A.; Saighi, O. Assessing groundwater quality for irrigation using geostatistical methods—Case of Wadi Nil Plain (North-East Algeria). Groundw. Sustain. Dev. 2019, 8, 179–186. [Google Scholar] [CrossRef]
  20. Dane, K. Sustainable Management of Groundwater Resources in Rosario-Mimoso Valley, Northeast Brazil. PhD Thesis, Hydrogeol. University of Newcastle, Callaghan, Australia, 2005; 120p. [Google Scholar]
  21. Montenegro, S.M.G.L.; Montenegro, A.A.A.; Mackay, R.; Oliveira, A.S.C. Dinâmica hidro-salina em aquífero aluvial utilizado para agricultura irrigada familiar em região semiárida. Rev. Bras. Recur. Hidr. 2003, 8, 85–92. [Google Scholar]
  22. Bouwer, H.; Rice, R.C. A slug test for determining hydraulic conductivity of unconfined aquifers with completely or partially penetrating wells. Water Resour. Res. 1976, 12, 423–428. [Google Scholar]
  23. Montenegro, A.A.A. Stochastic Hydrologeological Modelling of Aquifer Salinization from Small Scale Agriculture in Northeast Brazil. Ph.D. Thesis, University of Newcastle, Callaghan, Australia, 1997; 272p. [Google Scholar]
  24. Corrêa, M.M.; Ribeiro, M.R. Levantamento Detalhado de Solos da Fazenda Nossa Senhora do Rosário (Pesqueira-PE); Relatório Técnico; UFRPE/UFPE/CNPq/BNB: Recife, Brazil, 2001; 35p. [Google Scholar]
  25. Andrade, T.S.; Montenegro, S.M.G.L.; Montenegro, A.A.A.; Rodrigues, D.F.B. Estimation of alluvial recharge in the semiarid. Eng. Agric. 2014, 34, 211–221. [Google Scholar] [CrossRef]
  26. Allen, R.G.; Pereira, L.S.; Raes, D.; Smith, M. Crop Evapotranspiration—Guidelines for Computing Crop Water Requirements, 1st ed.; FAO Irrigation and Drainage Paper 56; FAO: Rome, Italy, 1998; pp. 1–297. [Google Scholar]
  27. Warrick, A.W.; Nielsen, D.R. Spatial variability of soil physical properties in the field. In Applications of Soil Physics; Hillel, D., Ed.; Academic Press: New York, NY, USA, 1980; Chapter 2; pp. 319–344. [Google Scholar]
  28. Hoaglin, D.C.; Mosteller, F.; Tukey, J.W. Análise Exploratória de Dados: Técnicas Robustas; Salamandra: Lisboa, Portugal, 1992; 446p. [Google Scholar]
  29. GEO-EAS 1.2.1, Geostatistical Environmental Assessment Software User’s Guide; Publication No. EPA/600/4-88/033; United States Environmental Protection Agency: Washington, DC, USA, 1991.
  30. Journel, A.G. Fundamentals of Geostatistics in Five Lessons; American Geophysical Union: Washington, DC, USA, 1989; 40p. [Google Scholar]
  31. Webster, R.; Oliver, M.A. Geostatistics for Environmental Scientists, 2nd ed.; Wiley: Chichester, UK, 2007. [Google Scholar]
  32. Cambardella, C.A.; Moorman, T.B.; Novak, J.M.; Parkin, T.B.; Karlen, D.L.; Turco, R.F.; Kornopka, A.E. Field-Scale Variability of Soil Properties in Central Iowa Soils. Soil Sci. Soc. Am. J. 1994, 58, 1501–1511. [Google Scholar]
  33. Golden Software. Surfer for Windows; Version 9.0; Golden Software: Golden, CO, USA, 2010; 66p. [Google Scholar]
  34. Mann, H.B. Nonparametric tests against trend. Econometrica 1945, 13, 245–259. [Google Scholar] [CrossRef]
  35. Kendall, M.G. Rank Correlation Methods; Griffin: London, UK, 1975. [Google Scholar]
  36. Sen, P.K. Estimates of the regression coefficient based on Kendall’s tau. J. Am. Stat. Assoc. 1968, 63, 1379–1389. [Google Scholar]
  37. Cheng, B.; Zhang, Y.; Xia, R.; Wang, L.; Zhang, N.; Zhang, X. Spatiotemporal analysis and prediction of water quality in the Han River by an integrated nonparametric diagnosis approach. J. Clean. Prod. 2021, 328, 129583. [Google Scholar] [CrossRef]
  38. Marengo, J.A.; Galdos, M.V.; Challinor, A.; Cunha, A.P.; Marin, F.R.; Vianna, M.d.S.; Alvala, R.C.S.; Alves, L.M.; Moraes, O.L.; Bender, F. Drought in Northeast Brazil: A review of agricultural and policy adaptation options for food security. Clim. Resil. Sustain. 2022, 1, e17. [Google Scholar] [CrossRef]
  39. Andrade, T.S.; Montenegro, S.M.G.L.; Montenegro, A.A.A.; Rodrigues, D.F.B. Variabilidade espaco-temporal da condutividade eletrica da agua subterrânea na regi.o semiarida de Pernambuco. Rev. Bras. Eng. Agric. Ambient. 2012, 16, 496–504. [Google Scholar]
  40. dos Santos, A.L.M.; Gonçalves, W.A.; Andrade, L.d.M.B.; Rodrigues, D.T.; Batista, F.F.; Lima, G.C.; e Silva, C.M.S. Space–Time Characterization of Extreme Precipitation Indices for the Semiarid Region of Brazil. Climate 2024, 12, 43. [Google Scholar] [CrossRef]
  41. Soares, N.S.; Costa, C.A.G.; Carneiro de Lima, J.B.; Francke, T.; de Araújo, J.C. Method for identification of hydrological seasons in the semi-arid Caatinga biome, Brazil. Hydrol. Sci. J. 2024, 69, 309–320. [Google Scholar] [CrossRef]
  42. IPCC. Climate Change 2021: The Physical Science Basis. Contribution of Working Group I to the Sixth Assessment Report of the Intergovernmental Panel on Climate Change; Masson-Delmotte, V., Zhai, P., Pirani, A., Connors, S.L., Péan, C., Berger, S., Caud, N., Chen, Y., Goldfarb, L., Gomis, M.I., et al., Eds.; Cambridge University Press: Cambridge, UK, 2021; Available online: https://www.ipcc.ch/report/ar6/wg1/chapter/chapter-11/?utm_source=chatgpt.com (accessed on 3 January 2025).
  43. Xu, L.; Gong, H.; Chen, B.; Zhou, C.; Zhong, X.; Ma, Z.; Meng, D. Characterizing Groundwater Level Response to Precipitation at Multiple Timescales in the Lubei Plain Region Using Transfer Function Analysis. Remote Sens. 2025, 17, 208. [Google Scholar] [CrossRef]
  44. Andrade, C.W.L.; Montenegro, S.M.G.L.; Montenegro, A.A.A.; Lima, J.R.S.; Srinivasan, R.; Jones, C.A. Climate change impact assessment on water resources under RCP scenarios: A case study in Mundaú River Basin, Northeastern Brazil. Int. J. Climatol. 2020, 41, E1045–E1061. [Google Scholar] [CrossRef]
  45. Anjinho, P.S.; Barbosa, M.A.G.A.; Costa, C.W.; Mauad, F.F. Environmental fragility analysis in reservoir drainage basin land use planning: A Brazilian basin case study. Land Use Policy 2021, 100, 104946. [Google Scholar] [CrossRef]
  46. Silva, G.R.; da Muniz, R.S.; Oliveira Júnior, A.I.; de Pereira Valões, D.C.; Pereira, D.D.d.M. Caracterização da Bacia Hidrográfica do rio Pajeú—PE, situada na Bacia do São Francisco. Rev. Geogr. 2022, 39, 208–221. [Google Scholar] [CrossRef]
  47. Marengo, J.A.; Cunha, A.P.; Alves, L.M. A seca de 2012-15 no semiárido do Nordeste do Brasil no contexto histórico. Climanalise 2016, 4, 49–54. [Google Scholar]
  48. Montenegro, A.A.A.; Ragab, R. Hydrological response of a Brazilian semiarid catchment to different land use and climate change scenarios: Modeling study. Hydrol. Process. 2010, 24, 2705–2723. [Google Scholar] [CrossRef]
  49. Lins, F.A.C.; Montenegro, A.A.A.; Farias, C.W.L.A.; Silva, M.V.; Souza, W.M.; Moura, G.B.A.; Silva, T.G.F.; Montenegro, S.M.G.L. Soil moisture and hydrological processes dynamics under climate and land use changes in a semiarid experimental basin, Brazil. Ecohydrol. Hydrobiol. 2024, 24, 681–697. [Google Scholar] [CrossRef]
  50. Santiago, C.M.C.; Silva, E.V.; Soares, L.S. Capacidade de suporte dos sistemas ambientais da bacia hidrográfica do Rio São Nicolau (BHSN)-Piauí. Geografia 2023, 48, 1–24. [Google Scholar] [CrossRef]
  51. Kebede, M.M.; Kumar, M.; Mekonnen, M.M.; Clement, T.P. Enhancing Groundwater Recharge Through Nature-Based Solutions: Benefits and Barriers. Hydrology 2024, 11, 195. [Google Scholar] [CrossRef]
  52. Ribeiro, L.; Kretschmer, N.; Nascimento, J.; Buxo, A.; Rötting, T.; Soto, G.; Oyarzún, J.; Maturana, H.; Oyarzún, R.; Kretschmer, N.; et al. Evaluating piezometric trends using the Mann- Kendall test on the alluvial aquifers of the Elqui River basin, Chile Evaluating piezometric trends using the Mann-Kendall test on the alluvial aquifers of the Elqui River basin, Chile. Hydrol. Sci. J. 2015, 6667, 1840–1852. [Google Scholar] [CrossRef]
  53. Hibbs, B.J.; Eastoe, C.J.; Merino, M. Issues of Bias in Groundwater Quality Data Sets in an Irrigated Floodplain Aquifer of Variable Salinity. Geosciences 2024, 14, 66. [Google Scholar] [CrossRef]
  54. Schiavo, M. Spatial modeling of the water table and its historical variations in Northeastern Italy via a geostatistical approach. Groundw. Sustain. Dev. 2024, 25, 101186. [Google Scholar] [CrossRef]
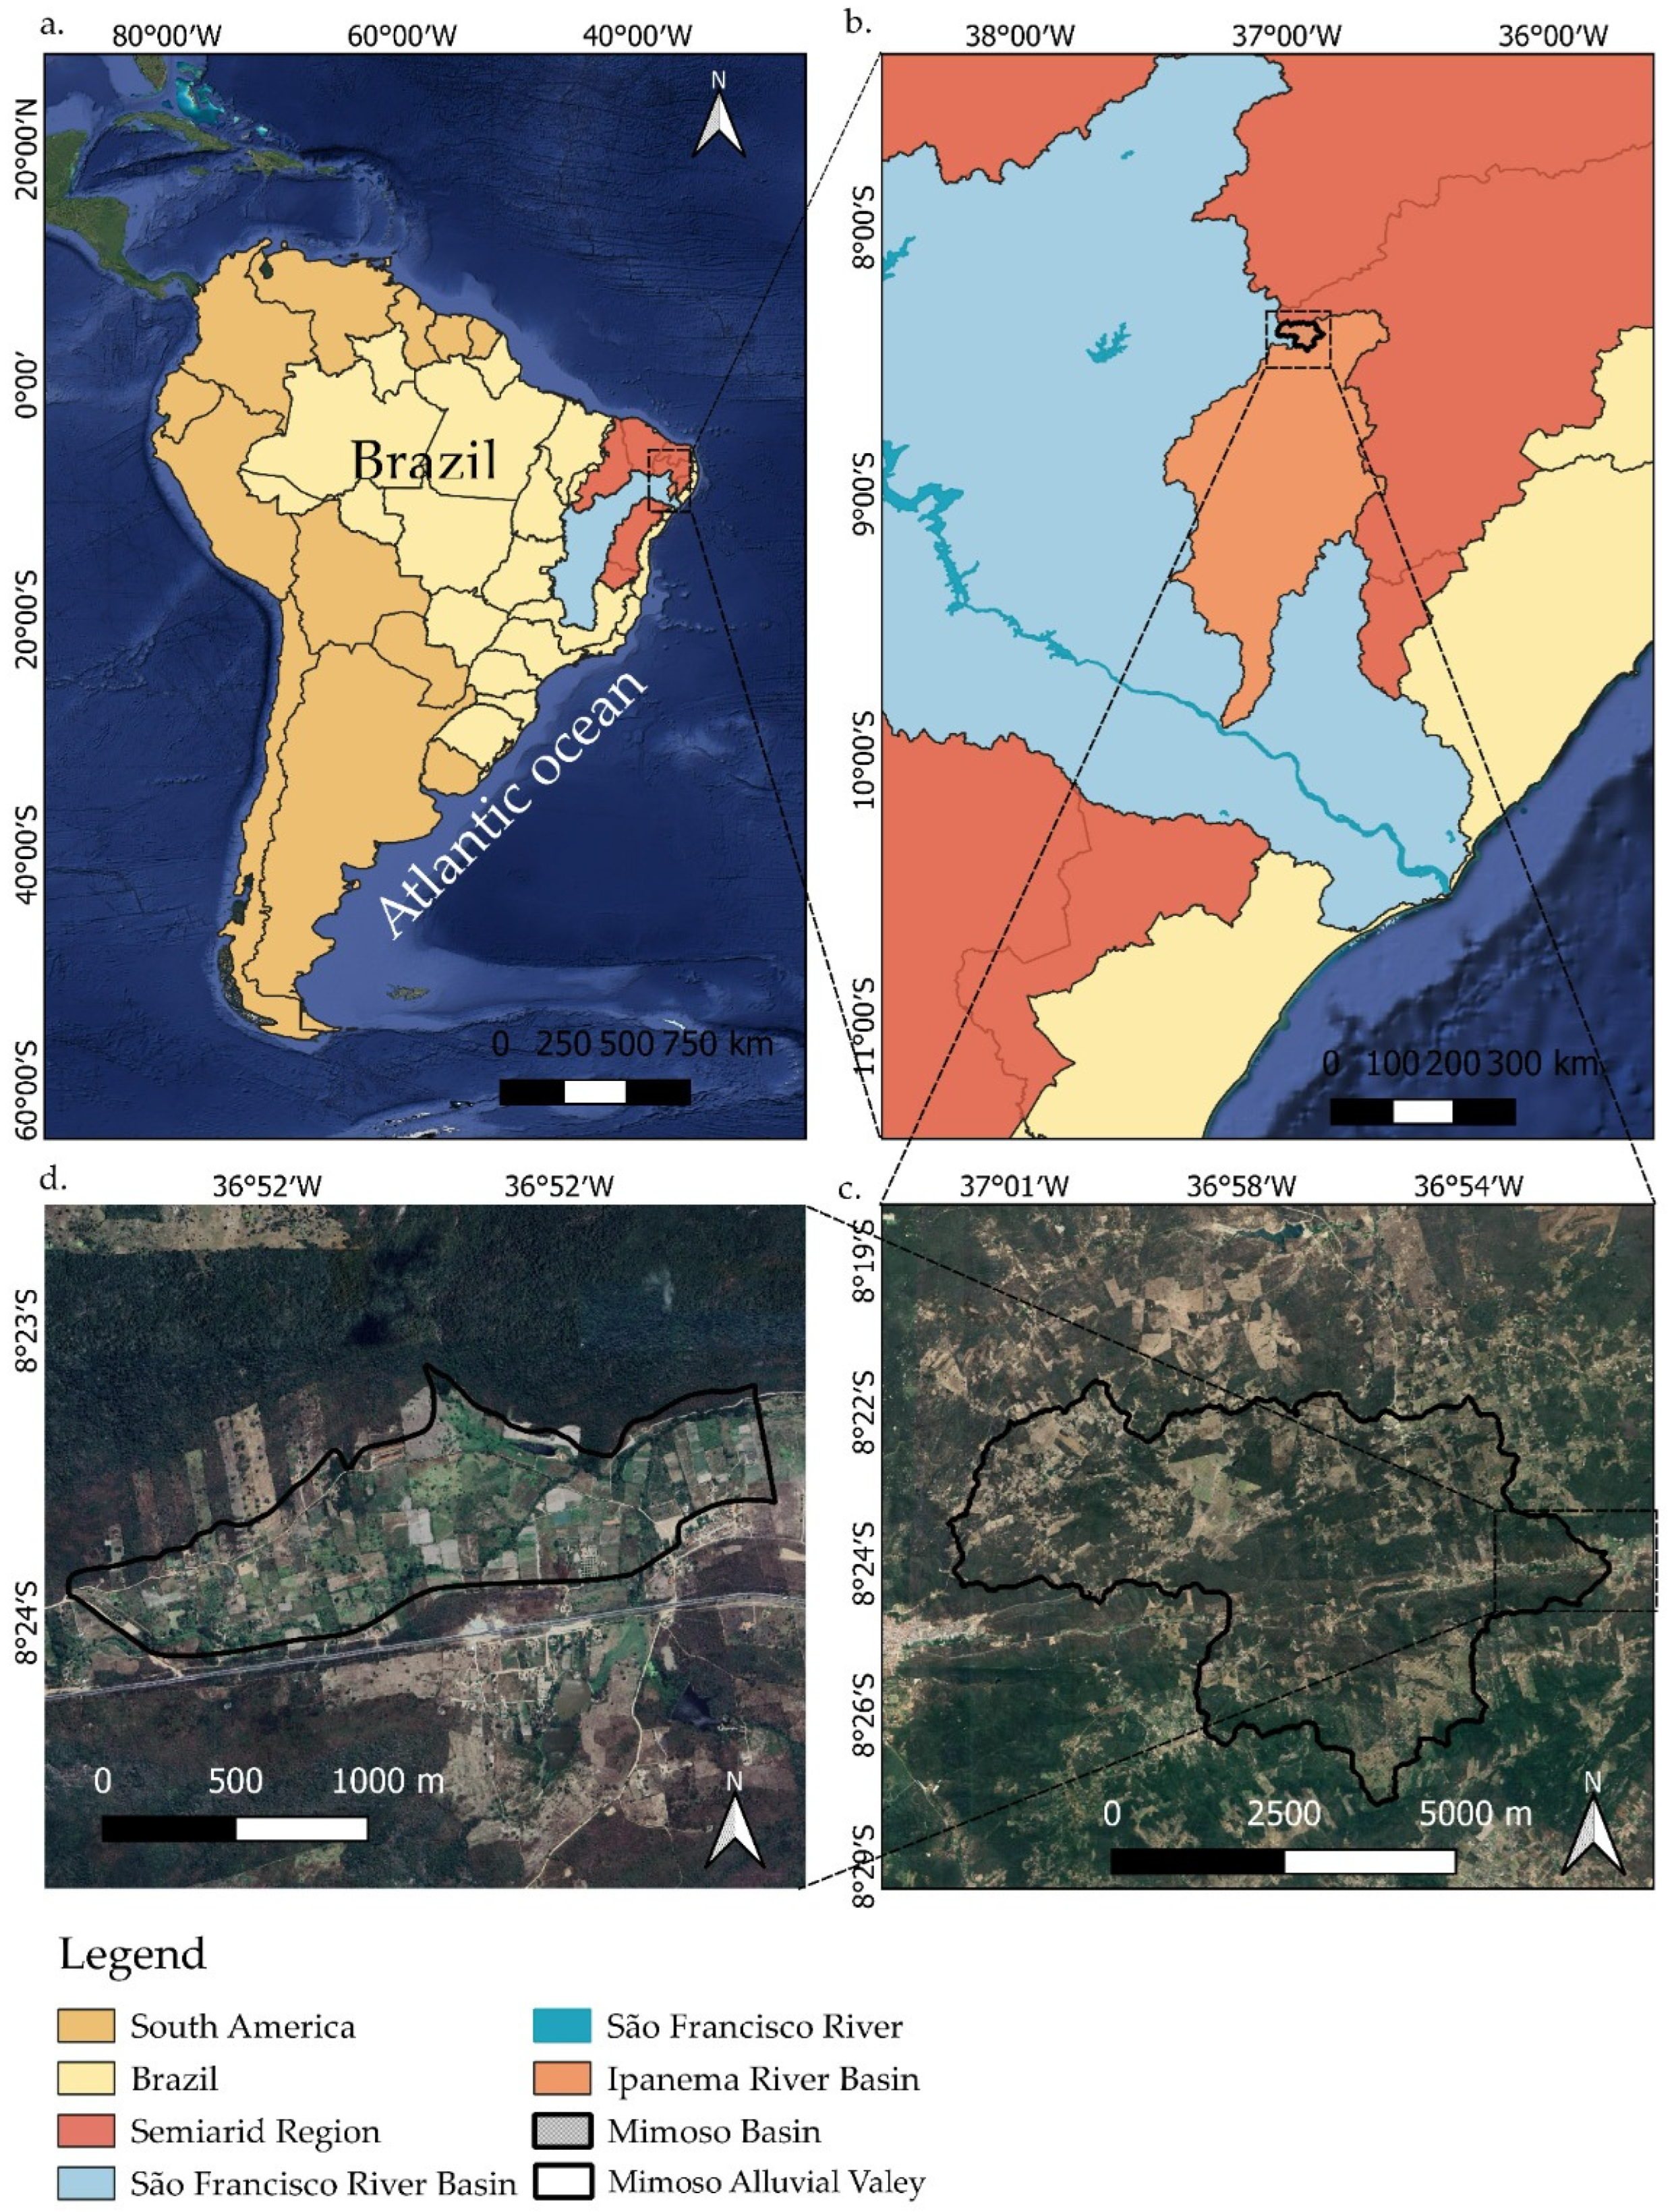
Figure 1. South America map, with location of the Semiarid region and São Francisco River Basin in Brazil (a); location of Ipanema River Basin (b); Mimoso River Basin, Ipanema Basin, Brazil (c) and Mimoso Alluvial Valley (MAV) inserted in the Mimoso stream basin (d).
Geosciences 15 00136 g001
Figure 2. Groundwater monitoring locations at the Mimoso Alluvial Aquifer (A); a saturated hydraulic conductivity map (B); a soil surface texture map (C) and a hydrological cross-section of the Mimoso Alluvial Valley (MAV) where point 1 is located at the left boundary side (D), while for sections 5 and 6, point 1 is located at the right-hand-side boundary.
Geosciences 15 00136 g002
Figure 3. Monthly rainfall (P), evapotranspiration (ET), and air temperature (Air T) from January of 2012 to December of 2015 (A), January of 2016 to December of 2019 (B), and January of 2020 to December of 2023 (C).
Geosciences 15 00136 g003
Figure 4. Interannual and seasonal variability of accumulated rainfall over 90 days for January, June, and October (A) and the total rainfall from 2012 to 2023 (B) in the Mimoso Alluvial Valley.
Geosciences 15 00136 g004
Figure 5. Average monthly groundwater level (GWL) and abstraction (Q) from January of 2012 to December of 2015 (A), January of 2016 to December of 2019 (B), and January of 2020 to December of 2023 (C).
Geosciences 15 00136 g005
Figure 6. Cumulative groundwater recharges (Q) over the Mimoso stream alluvial valley from the three evaluated four-year periods: 2012–2015, 2016–2019, and 2020–2023. The blue lines at the top represent precipitation (right-hand y-axis), while the left y-axis corresponds to cumulative groundwater recharge.
Geosciences 15 00136 g006
Figure 7. Land use map for the years 2012 (a), 2016 (b), 2019 (c), and 2023 (d) in the Mimoso stream basin.
Geosciences 15 00136 g007
Figure 8. Maps of land use transitions between four-year periods 2012–2015 (a), 2016–2019 (b), and 2020–2023 (c) in the Mimoso stream basin.
Geosciences 15 00136 g008
Figure 9. Temporal variation characteristics electrical conductivity (A) and groundwater level (B) during 2012–2023, and flood records in March 2020 recorded by residents (C).
Geosciences 15 00136 g009
Figure 10. Annual time series and associated trend line of the general averages of groundwater level in m (A) and electrical conductivity in dS/m (B) for the period from 2012 to 2023.
Geosciences 15 00136 g010
Figure 11. Fitted theoretical and experimental semivariograms for groundwater level in January (A), June (B), and October (C), and for electrical conductivity in January (D), June (E), and October (F) for the years 2012, 2016, 2019, and 2023.
Geosciences 15 00136 g011
Figure 12. Groundwater depth (GW) kriging maps, and measurement points (circles), for the months of January, June, and October during 2012, 2016, 2019, and 2023, and groundwater level ranges in m.
Geosciences 15 00136 g012
Figure 13. Electrical conductivity (EC) kriging maps, and measurement points (circles), for the months of January, June, and October from 2012, 2016, 2019, and 2023, and electrical conductivity ranges in dS/m.
Geosciences 15 00136 g013
Table 1. Land use classes and their respective areas for the years 2012, 2016, 2019, and 2023 in the Mimoso stream basin.
Class2012201620192023
Area
(km2)(%)(km2)(%)(km2)(%)(km2)(%)
Forest formation2.311.88%2.311.88%2.311.88%2.311.88%
Savanna formation (caatinga)68.8755.93%70.7157.44%78.8364.02%82.6767.15%
Pasture49.8640.50%48.9039.72%40.6333.00%32.9226.74%
Mosaic of uses1.771.43%0.950.77%0.940.76%4.623.76%
Urban area0.180.15%0.190.15%0.240.19%0.270.22%
Other non-vegetated areas0.010.01%0.020.02%0.050.04%0.040.03%
Other temporary crops--0.070.05%0.040.03%0.040.03%
River, lake, and ocean0.130.10%0.030.02%0.090.07%0.250.21%
Table 2. Classes of land use transitions and their respective areas, which occurred over the four-year periods in the Mimoso stream basin.
Four-Year Periods2012–20152016–20192020–2023
Land Use ChangeArea
(km2)(%)(km2)(%)(km2)(%)
Unchanged110.430.90108.760.88106.400.86
Anthropic1.190.010.830.011.530.01
Deforestation4.800.042.680.025.620.05
Recovery of savanna formation (caatinga)6.570.0510.820.099.470.08
Water0.140.000.030.000.090.00
Table 3. Descriptive statistics of the potentiometric levels for the evaluated months.
2012201620192023
JanuaryJuneOctoberJanuaryJuneOctoberJanuaryJuneOctoberJanuaryJuneOctober
A. Groundwater level (m)
n847368363332464142382634
Mean2.653.173.925.654.485.673.603.954.282.462.742.53
Median2.613.043.575.674.855.853.473.853.922.322.632.41
Minimum0.501.202.250.300.300.301.001.152.151.281.000.91
Maximum4.054.8523.258.987.109.105.507.009.056.255.466.12
Standard deviation0.480.520.871.221.421.370.821.071.590.930.900.91
CV (%)8.379.2726.707.354.996.6722.9926.9537.1838.1033.0735.97
KS0.150.120.080.150.120.110.150.170.100.140.080.09
B. Electrical conductivity (dS m−1)
n847368363332423740382533
Mean1.661.311.970.690.620.651.050.971.060.900.611.11
Median0.690.580.760.630.620.610.880.790.740.530.590.68
Minimum0.180.150.290.440.220.370.610.260.510.250.300.44
Maximum27.5020.0426.911.351.061.203.325.486.385.271.226.99
Standard deviation1.631.232.030.160.190.140.540.810.991.150.171.44
CV (%)16.8316.2313.278.285.518.3351.3883.5093.12127.9528.32130.06
KS0.180.090.090.180.090.950.190.100.100.170.080.09
Table 4. Semivariogram parameters and models for groundwater depth and electrical conductivity; statistics of leave-one-out cross-validation.
YearMonthModelNugget (C0)Sill (C0 + C1)Range (A, m)R2DSD (%)Cross-Validation
MSD
1. Groundwater depth (m)
2012JanuaryExp0.160.36294.00.843.90.151.10
JuneExp0.140.49385.10.828.30.081.03
OctoberExp0.020.40123.00.94.50.121.07
2016JanuaryGauss0.130.47374.00.827.7−0.110.84
JuneGauss0.180.64349.50.928.10.051.00
OctoberGauss0.000.48121.20.90.20.191.14
2019JanuaryExp0.290.60365.80.948.6−0.100.85
JuneGauss0.400.85278.50.946.80.040.99
OctoberGauss0.170.44333.50.938.10.101.05
2023JanuaryExp0.020.38171.00.85.80.121.07
JuneGauss0.290.66388.40.944.30.211.16
OctoberGauss0.120.38420.20.831.6−0.080.87
2. Electrical conductivity (dS/m)
2012JanuaryGauss0.050.11342.00.845.10.021.12
JuneExp0.050.11327.00.840.90.121.23
OctoberExp0.000.14135.00.90.90.061.17
2016JanuaryGauss0.000.02199.20.80.0−0.160.92
JuneGauss0.000.05114.30.90.00.031.13
OctoberGauss0.010.02251.10.966.7−0.061.03
2019JanuaryGauss0.020.12132.00.912.80.181.30
JuneEsf0.020.70361.00.92.90.091.20
OctoberGauss0.050.15281.00.933.30.021.12
2023JanuaryExp0.310.56366.00.955.50.131.24
JuneExp0.010.04430.30.933.30.091.20
OctoberGauss0.040.60352.10.96.7−0.100.99
Disclaimer/Publisher’s Note: The statements, opinions and data contained in all publications are solely those of the individual author(s) and contributor(s) and not of MDPI and/or the editor(s). MDPI and/or the editor(s) disclaim responsibility for any injury to people or property resulting from any ideas, methods, instructions or products referred to in the content.