1. Introduction
DsGSDs represent deep gravitational deformation phenomena characterized by slow and progressive displacements over time [
1]. These processes affect large zones on a regional scale, including both sedimentary and metamorphic formations. Several factors play a crucial role in their initiation and evolution, including the geology regarding the presence of stratification planes and/or discontinuities within a potentially unstable mass that can generate deep deformation zones. The geotechnical properties of materials have a significant influence on slope stability, while seismic activity can act as a trigger or accelerator, increasing shear stresses along weakness planes. Hydrogeology is also an important factor, as soil saturation [
2] due to heavy rainfall [
3,
4] can significantly reduce the cohesion and shear strength of the materials themselves, promoting instability.
Unlike classic landslides, which are classified according to parameters such as geometry, the materials involved and the velocity of the movement [
5,
6,
7], DsGSDs require in-depth analyses of kinematic characteristics, triggering mechanisms and, most importantly, the long-term effects of environmental impacts and interactions with existing human activities. Recent studies have shown that the rate of movement of a DsGSD can vary between one and ten centimetres every year, but depending on the conditions, the rate of movement can be as small as a few millimetres every year. This variability is not only temporal but also spatial. In fact, some parts of the slope may show minimal deformation, while other adjacent parts may show more rapid movement, often due to differences in saturation levels or the presence of buried geological discontinuities. Crosta et al. [
8] defined DsGSDs in different ways, depending on both the approach taken and the different evolutionary mechanisms considered. These types of deformations often have a complex morphology with distinctive elements such as double ridges, scarps and counter-slopes. These features, which can be observed on a small scale in cohesive soils, are often accompanied by depressions and other morpho-structural forms. However, it is important to underline that their low rate of displacement over time often contributes to the cover of these structures, as erosion surface and weathering tend to modify or erase their traces. Variations in displacement rate velocity are often associated with predisposing environmental conditions. The work of Hou et al. [
9] highlights how the erosive process associated with the incision of a watercourse can cause a progressive reduction in the shear strength of materials and a consequent acceleration the rate movement of deep gravitational deformations.
In Italy, DsGSDs are a widespread phenomenon, mainly in mountainous areas such as the Alps and the Apennines. The work of Discenza et al. [
10] analyses DsGSDs in the Molise region to understand the mechanisms underlying their development. The study identifies the main predisposing factors, such as geological and geomorphological features that influence the development of these phenomena, through the interpretation of aerial photographs, morphological analyses, field surveys and satellite data. Indeed, multidisciplinary studies show that these deformations often act as precursors to more rapid landslide events, making the implementation of early warning systems based on predictive models and continuous monitoring necessary. The integration of advanced analytical techniques is essential to understanding long-term dynamics. For example, numerical analyses have shown how climate change can accelerate deep deformation processes through increased heavy rainfall, with potential implications for the safety of both infrastructure and local communities [
11]. Recent applications have integrated monitoring techniques such as satellite radar interferometry [
12,
13,
14,
15,
16] and the use of drones for high-resolution photogrammetric surveys [
17,
18] to accurately map unstable areas and analyse the mechanisms of DsGSD movement. Slope stability analysis is a central topic in geotechnical engineering as it studies the complex interactions between stabilizing and destabilizing soil forces. The destabilizing forces can include natural factors such as heavy rainfall [
19,
20,
21], seasonal thermal variations or seismic activity, as well as anthropogenic factors such as excavations [
22], over-burden and land use changes. The ability to monitor and predict their behaviour is fundamental for reducing damage and protecting vulnerable populations, buildings and infrastructure. In this context, the aim of this article is to analyse slope stability using a multidisciplinary approach to assess the possible evolution of the phenomenon and to optimize monitoring and risk management strategies.
This paper deals with the study of the DsGSD evolution in the Borrano area. The analyses were based not only on the results of geognostic and monitoring data garnered previously in the area but also on the execution of new studies that allowed a better definition of the movements.
Table 1 shows the methods used for the analysis of the landslide.
The stratigraphy shows the presence of materials with chaotic layering in the upper part down to the basal formation characterized by the presence of marly clays [
23] with sandstone interbeds [
24]. The hydrogeological setting is constrained by the structural layout of the area, making it extremely complex and difficult to interpret. The underground hydraulic circulation is mainly fed by meteoric precipitation, and there appears to be no connections with external aquifers. In addition, the basement formation, which is fractured, does not allow the consistency and nature of a probable groundwater table to be understood with certainty. In fact, the substrate is stratified according to high-angle dips (>45°), often arranged in a landslide pattern with respect to the topography, generating very deep phenomena that are probably also related to the disintegrating action of circulating waters. The current study shows that the presence of fracture planes associated with particularly fragile geological structures can be an important predisposing cause of these large mass movements [
25,
26]. These planes are characterized by shear deformations that evolve very slowly over time, the rate of which is mainly controlled by the plastic rheological behaviour of the rock involved. Although the magnitude of the displacements over time is very small compared to the planimetric dimensions of the area, the deformations show variability, which is a function of several factors, such as phases of reactivation and acceleration following heavy rainfall events and seismic stresses. These results are essential for developing both mitigation strategies and geological risk management tools. The development of continuous monitoring systems and upgrading the knowledge of hydrogeological and geotechnical parameters could improve the ability to predict the evolution of the phenomenon and protect the infrastructure and communities involved.
2. Materials and Methods
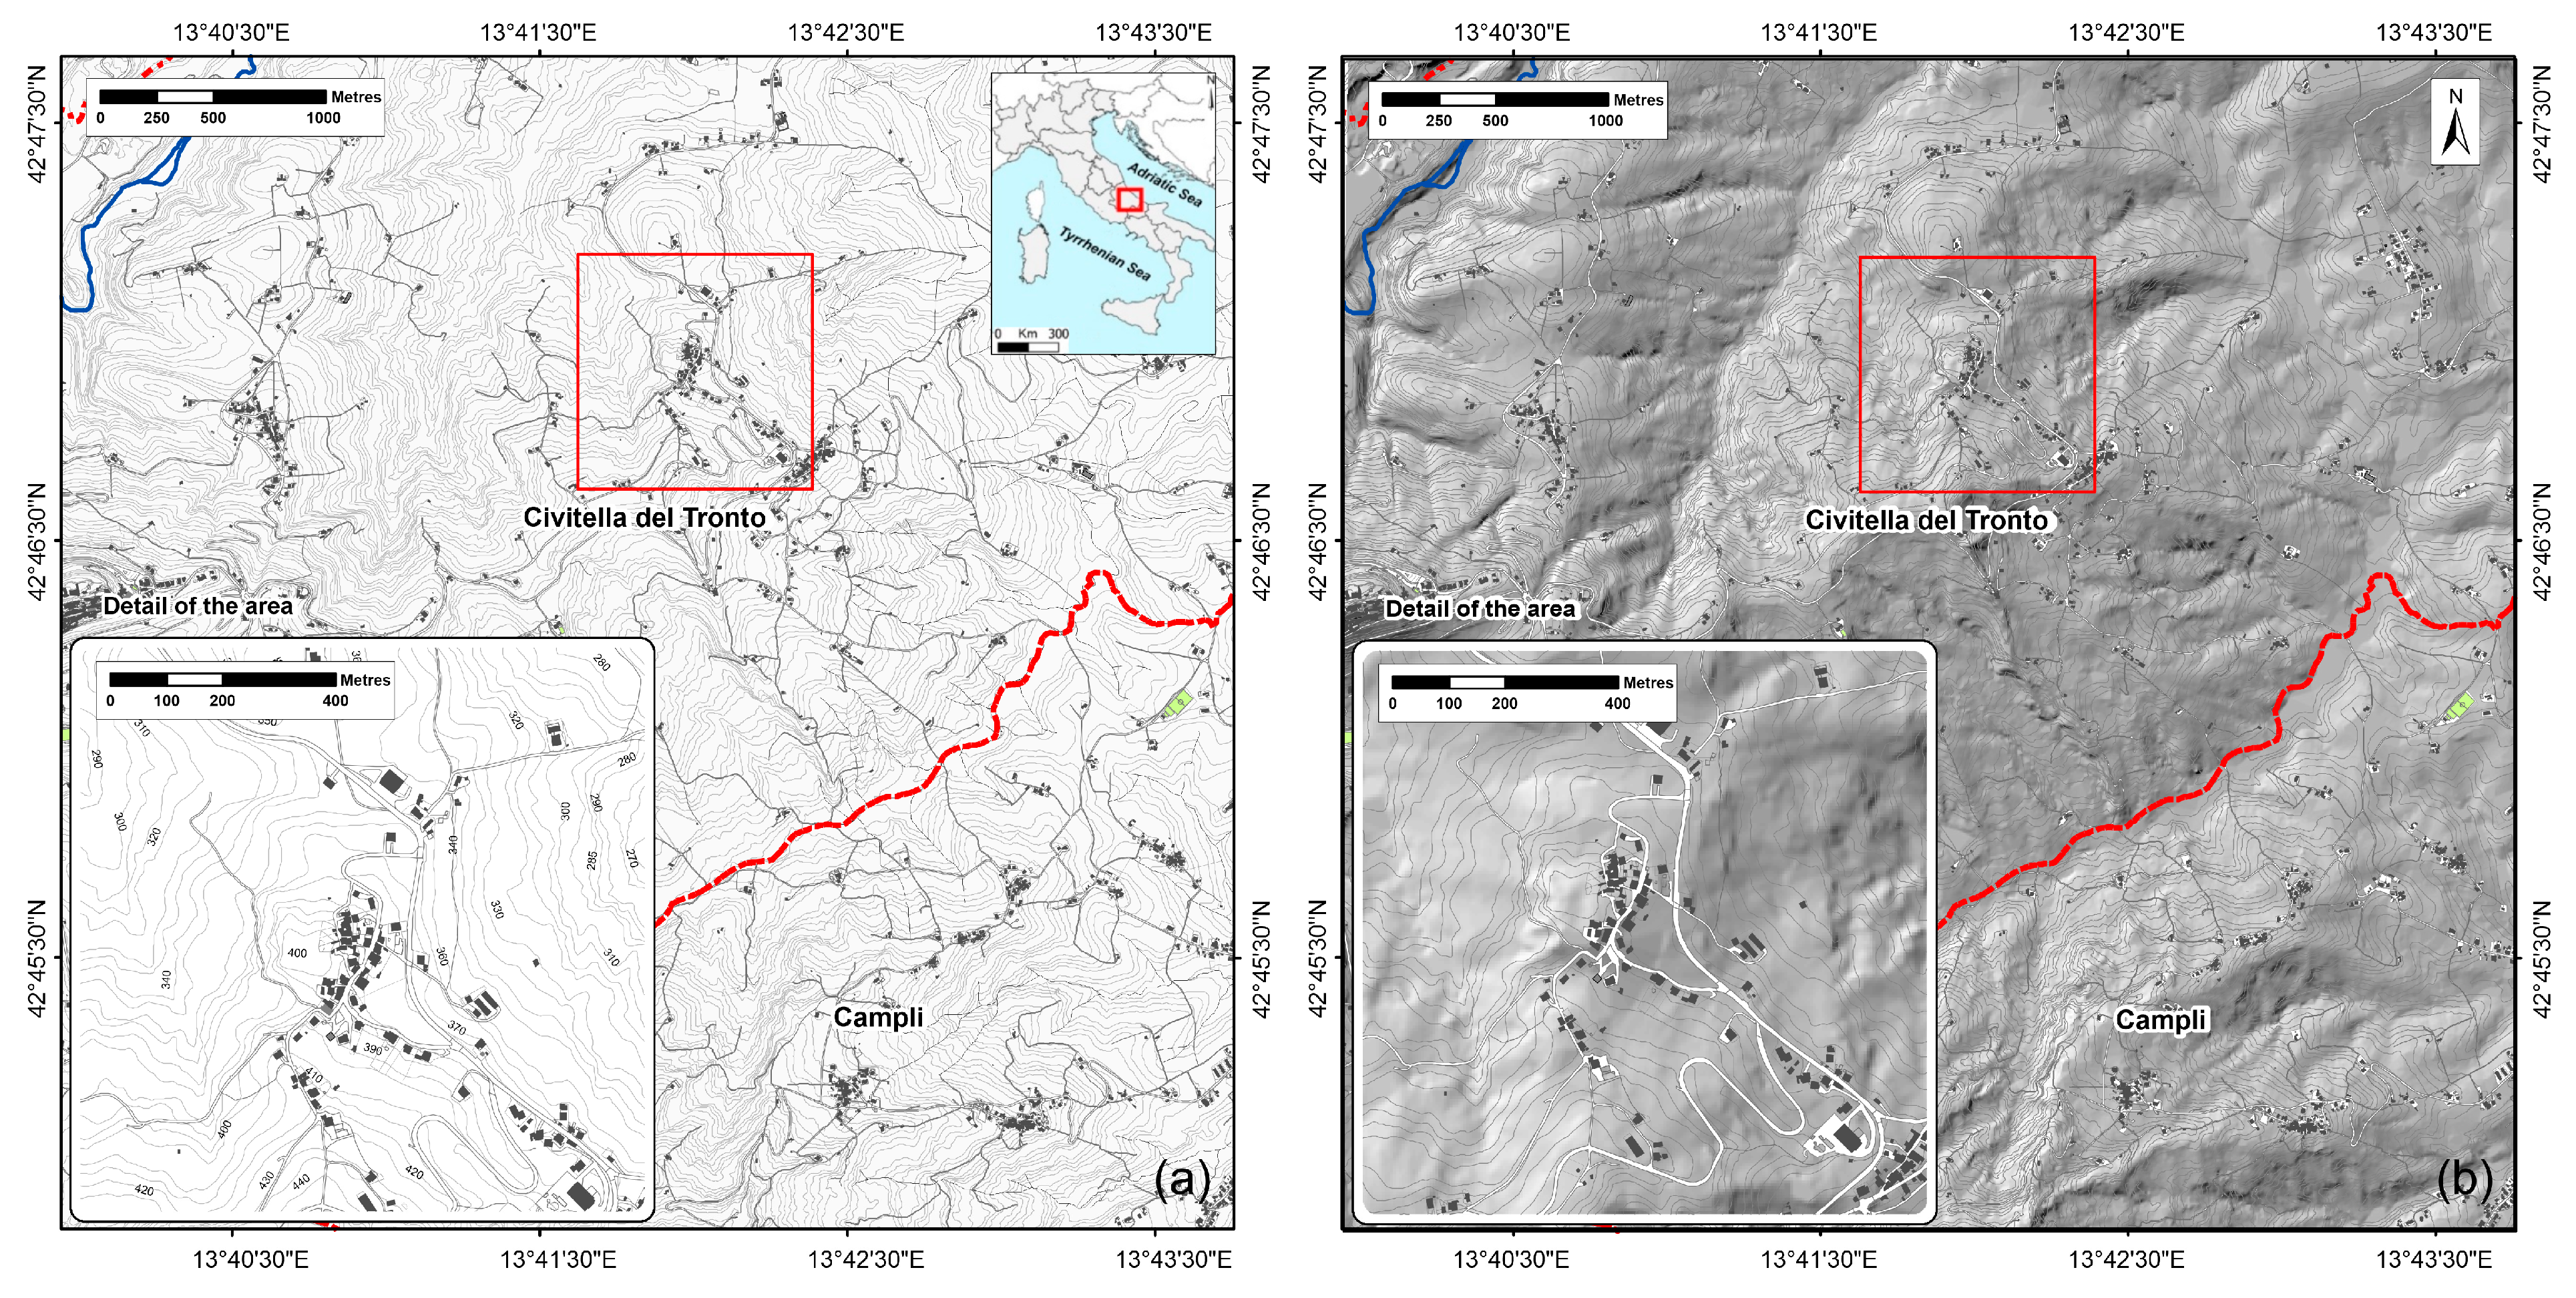
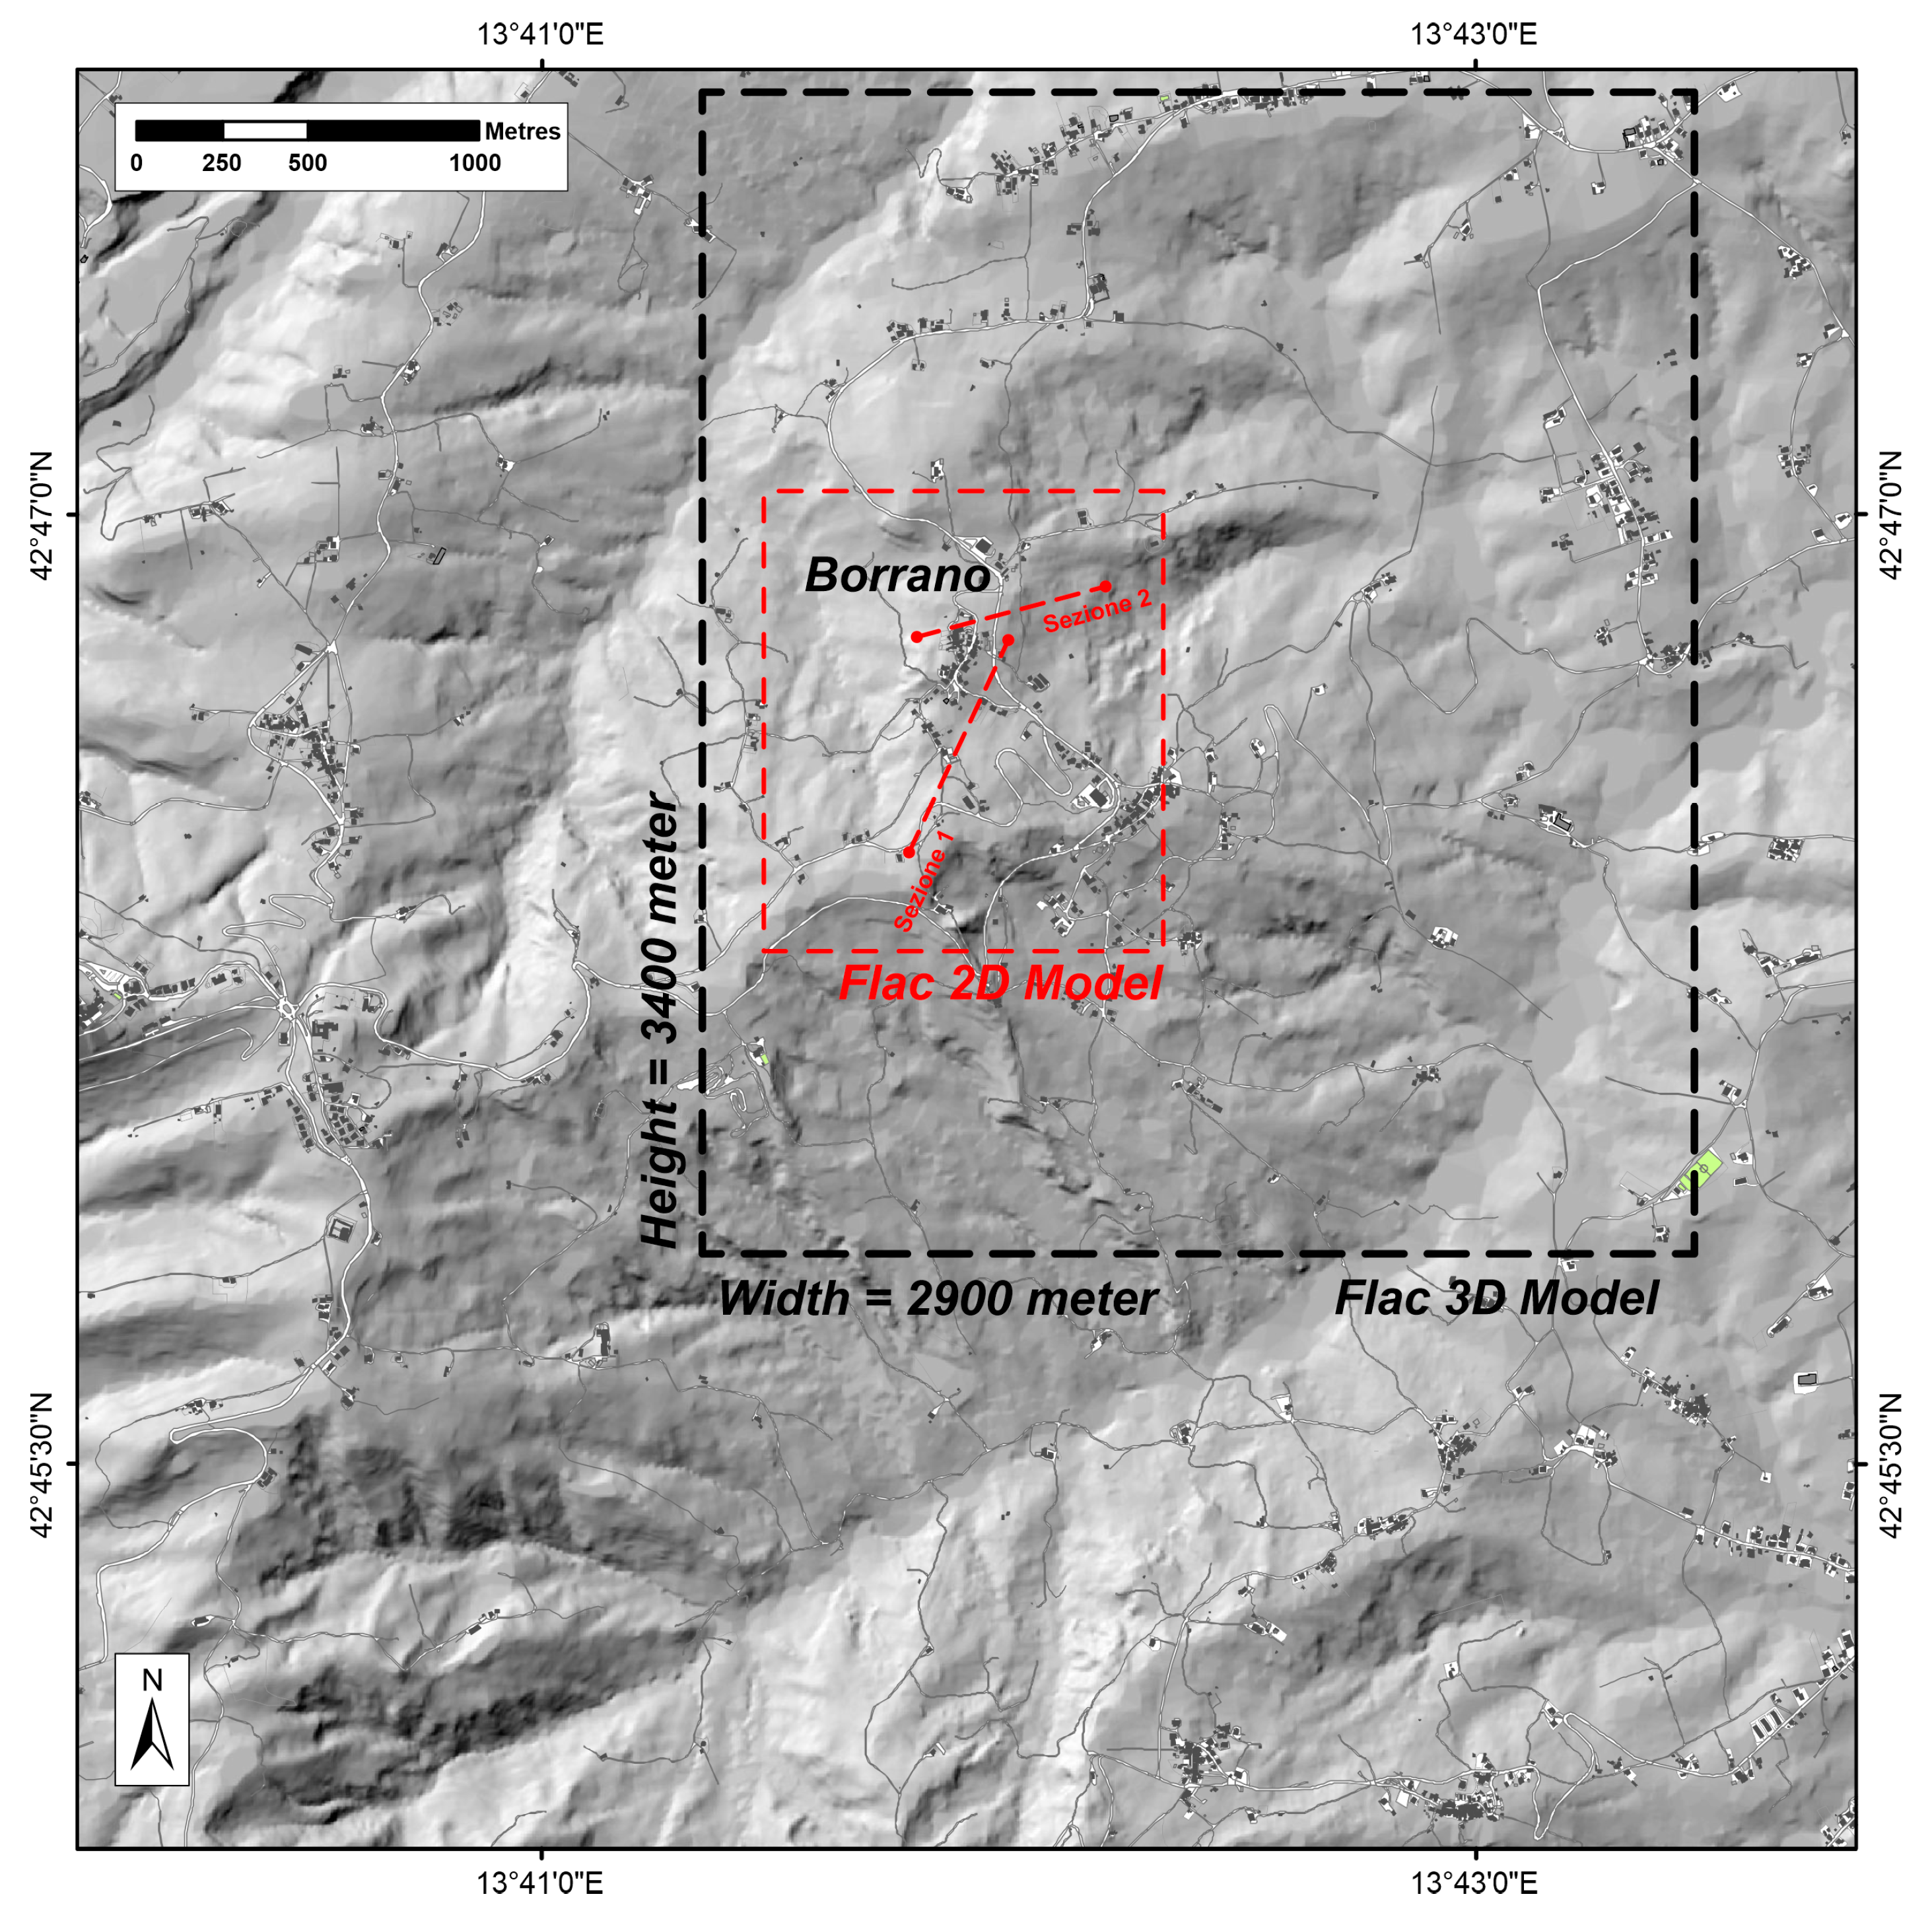
The Borrano hamlet (
Figure 1) is located about 2 km east of the Civitella del Tronto Municipality (Abruzzo Region—Central Italy). The hamlet is part of a morphological system made up of prominent hills crossed by surface gullies at an altitude between 300 and 430 m above sea level in the Salinello River basin, which flows a little further north. A large part of the territory of the Municipality of Civitella del Tronto has always been subject to gravitational instability phenomena, not all of which are easily identifiable [
27,
28,
29]. Characteristics such as sliding surfaces, mobilized volumes and geometries are very variable, as are the causes that have triggered the landslides themselves. In 2017, a series of landslides occurred in the Borrano hamlet, affecting a large area. Natural slopes show continuous evidence of movement, generally triggered by and following extreme rainfall events and, as in this case, accelerated by major seismic events. The continuous morphological evolution of the mobilized volumes creates a progressive state of high risk and a real threat to public safety, represented by the tangible involvement of residential structures and road works in the collapse. The general mechanism of deformation is a combination of roto-translative movements, with diffuse local sliding in the upper part and very deep sliding movements that are not always detectable.
Given the complexity of the territory, an integrated approach combining a field survey, monitoring techniques and advanced numerical modelling was used [
30]. The main techniques used include surface instruments such as clinometers and crack gauges, which provide direct measurements of surface displacements, and depth instruments such as inclinometers and piezometers, which allow the monitoring of ground movements and changes in hydrogeological conditions. The integration of field data was supported by two- and three-dimensional numerical simulations, which allowed the stress–strain behaviour of the materials involved to be reconstructed and the evolution of the area to be predicted.
2.1. Geological Features
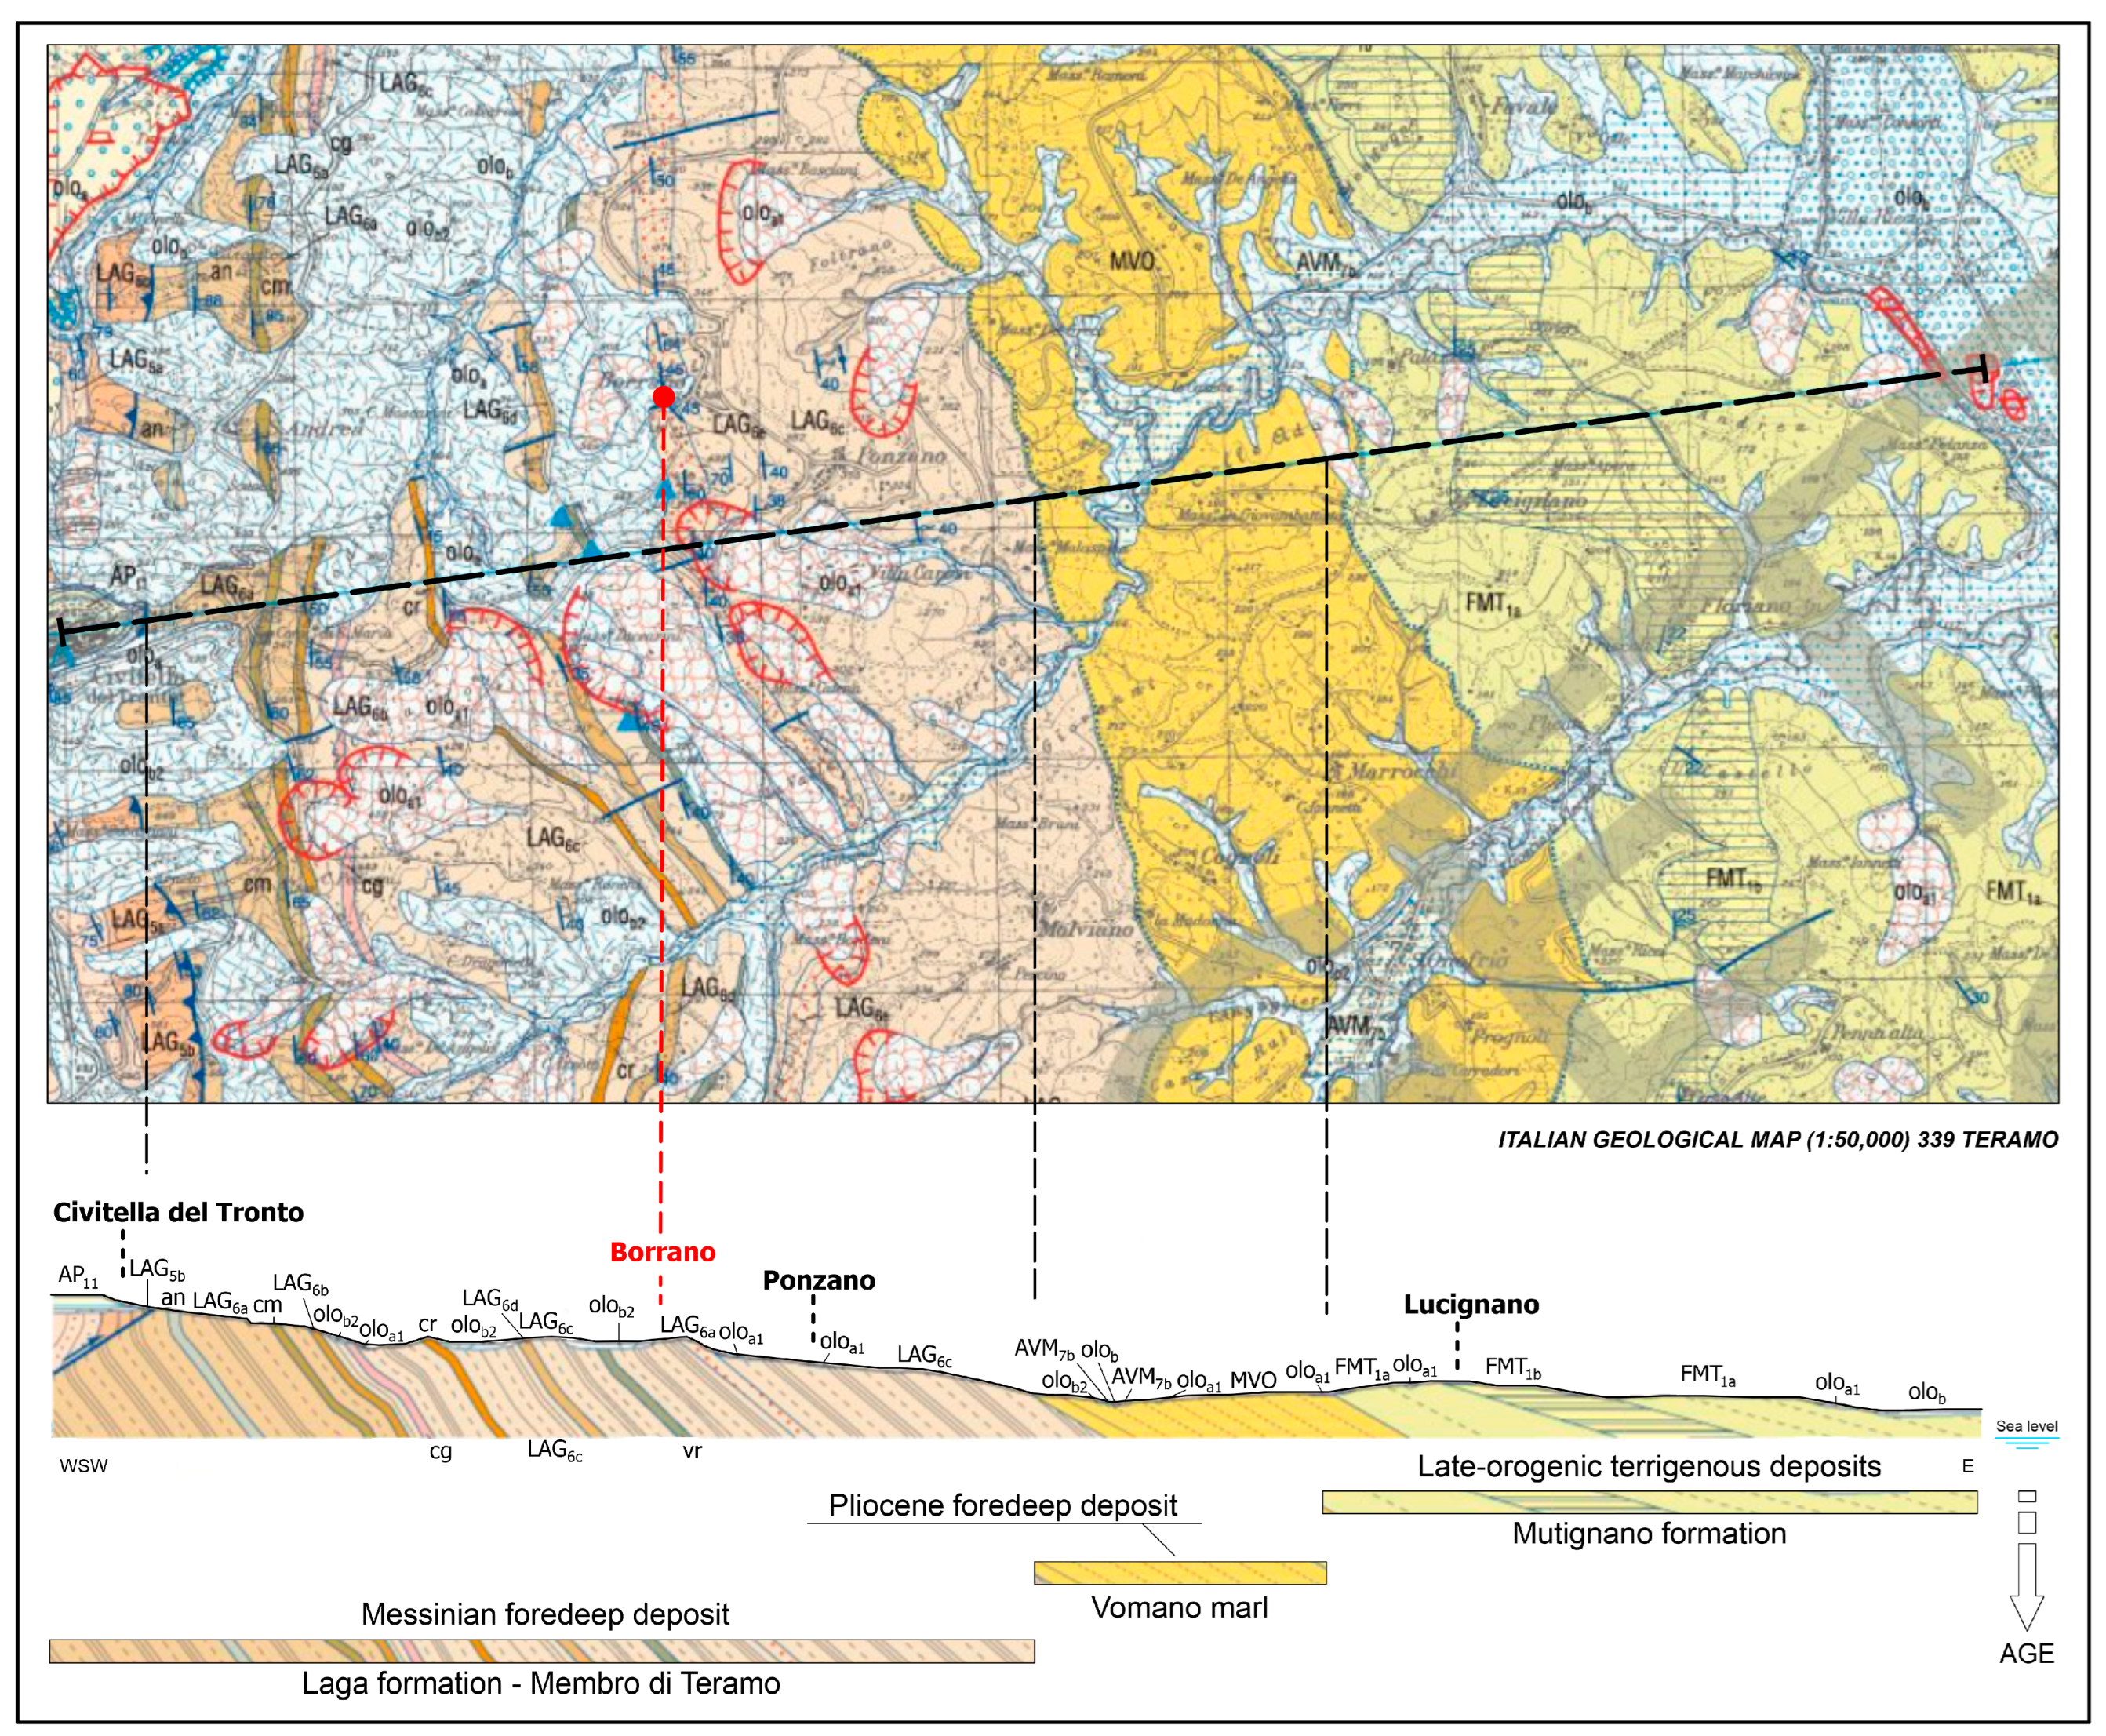
The Laga basin, shown on the Italian Geological Map n.339-Teramo [
31] (
Figure 2) is a marine foredeep basin that was developed during the Miocene period (∼23–5 million years ago) before the uplift of the Apennine chain front. The terrigenous fill sediments were generated by turbiditic currents, creating characteristic stratified deposits such as submarine conoids. Much of the deposition of these layers corresponds to the Messinian period and thus to the end of the Miocene [
32]. The basin [
33,
34,
35,
36] contains ridges (e.g., Montagna dei Fiori) and depressions bounded by faults and transverse discontinuities [
37,
38,
39,
40]. Due to the Messinian salinity crisis, the sediments currently filling this basin (Laga Formation) are rich in gypsum, called evaporites. In fact, the Laga Formation can be subdivided into three members associated with different temporal phases [
41,
42]: “pre-evaporitic”, “evaporitic” and “post-evaporitic”. In the area, the Laga Formation is present in outcrop only with the Gessarenitic Member (LAG5) and the Teramo Member (LAG6), both correlated with Evaporitic and Post-Evaporitic Members [
43,
44].
In the study area, the most recent materials of the Laga Formation (Teramo Member—LAG6) are found, consisting mainly of marly clays and clayey marls alternating with pelitic–arenaceous intervals with a thickness of about 1500 m. These deposits are characterized by structures that follow elongated bands in a north–south direction to the east of the main carbonate-covered fronts of the Central Apennine chain.
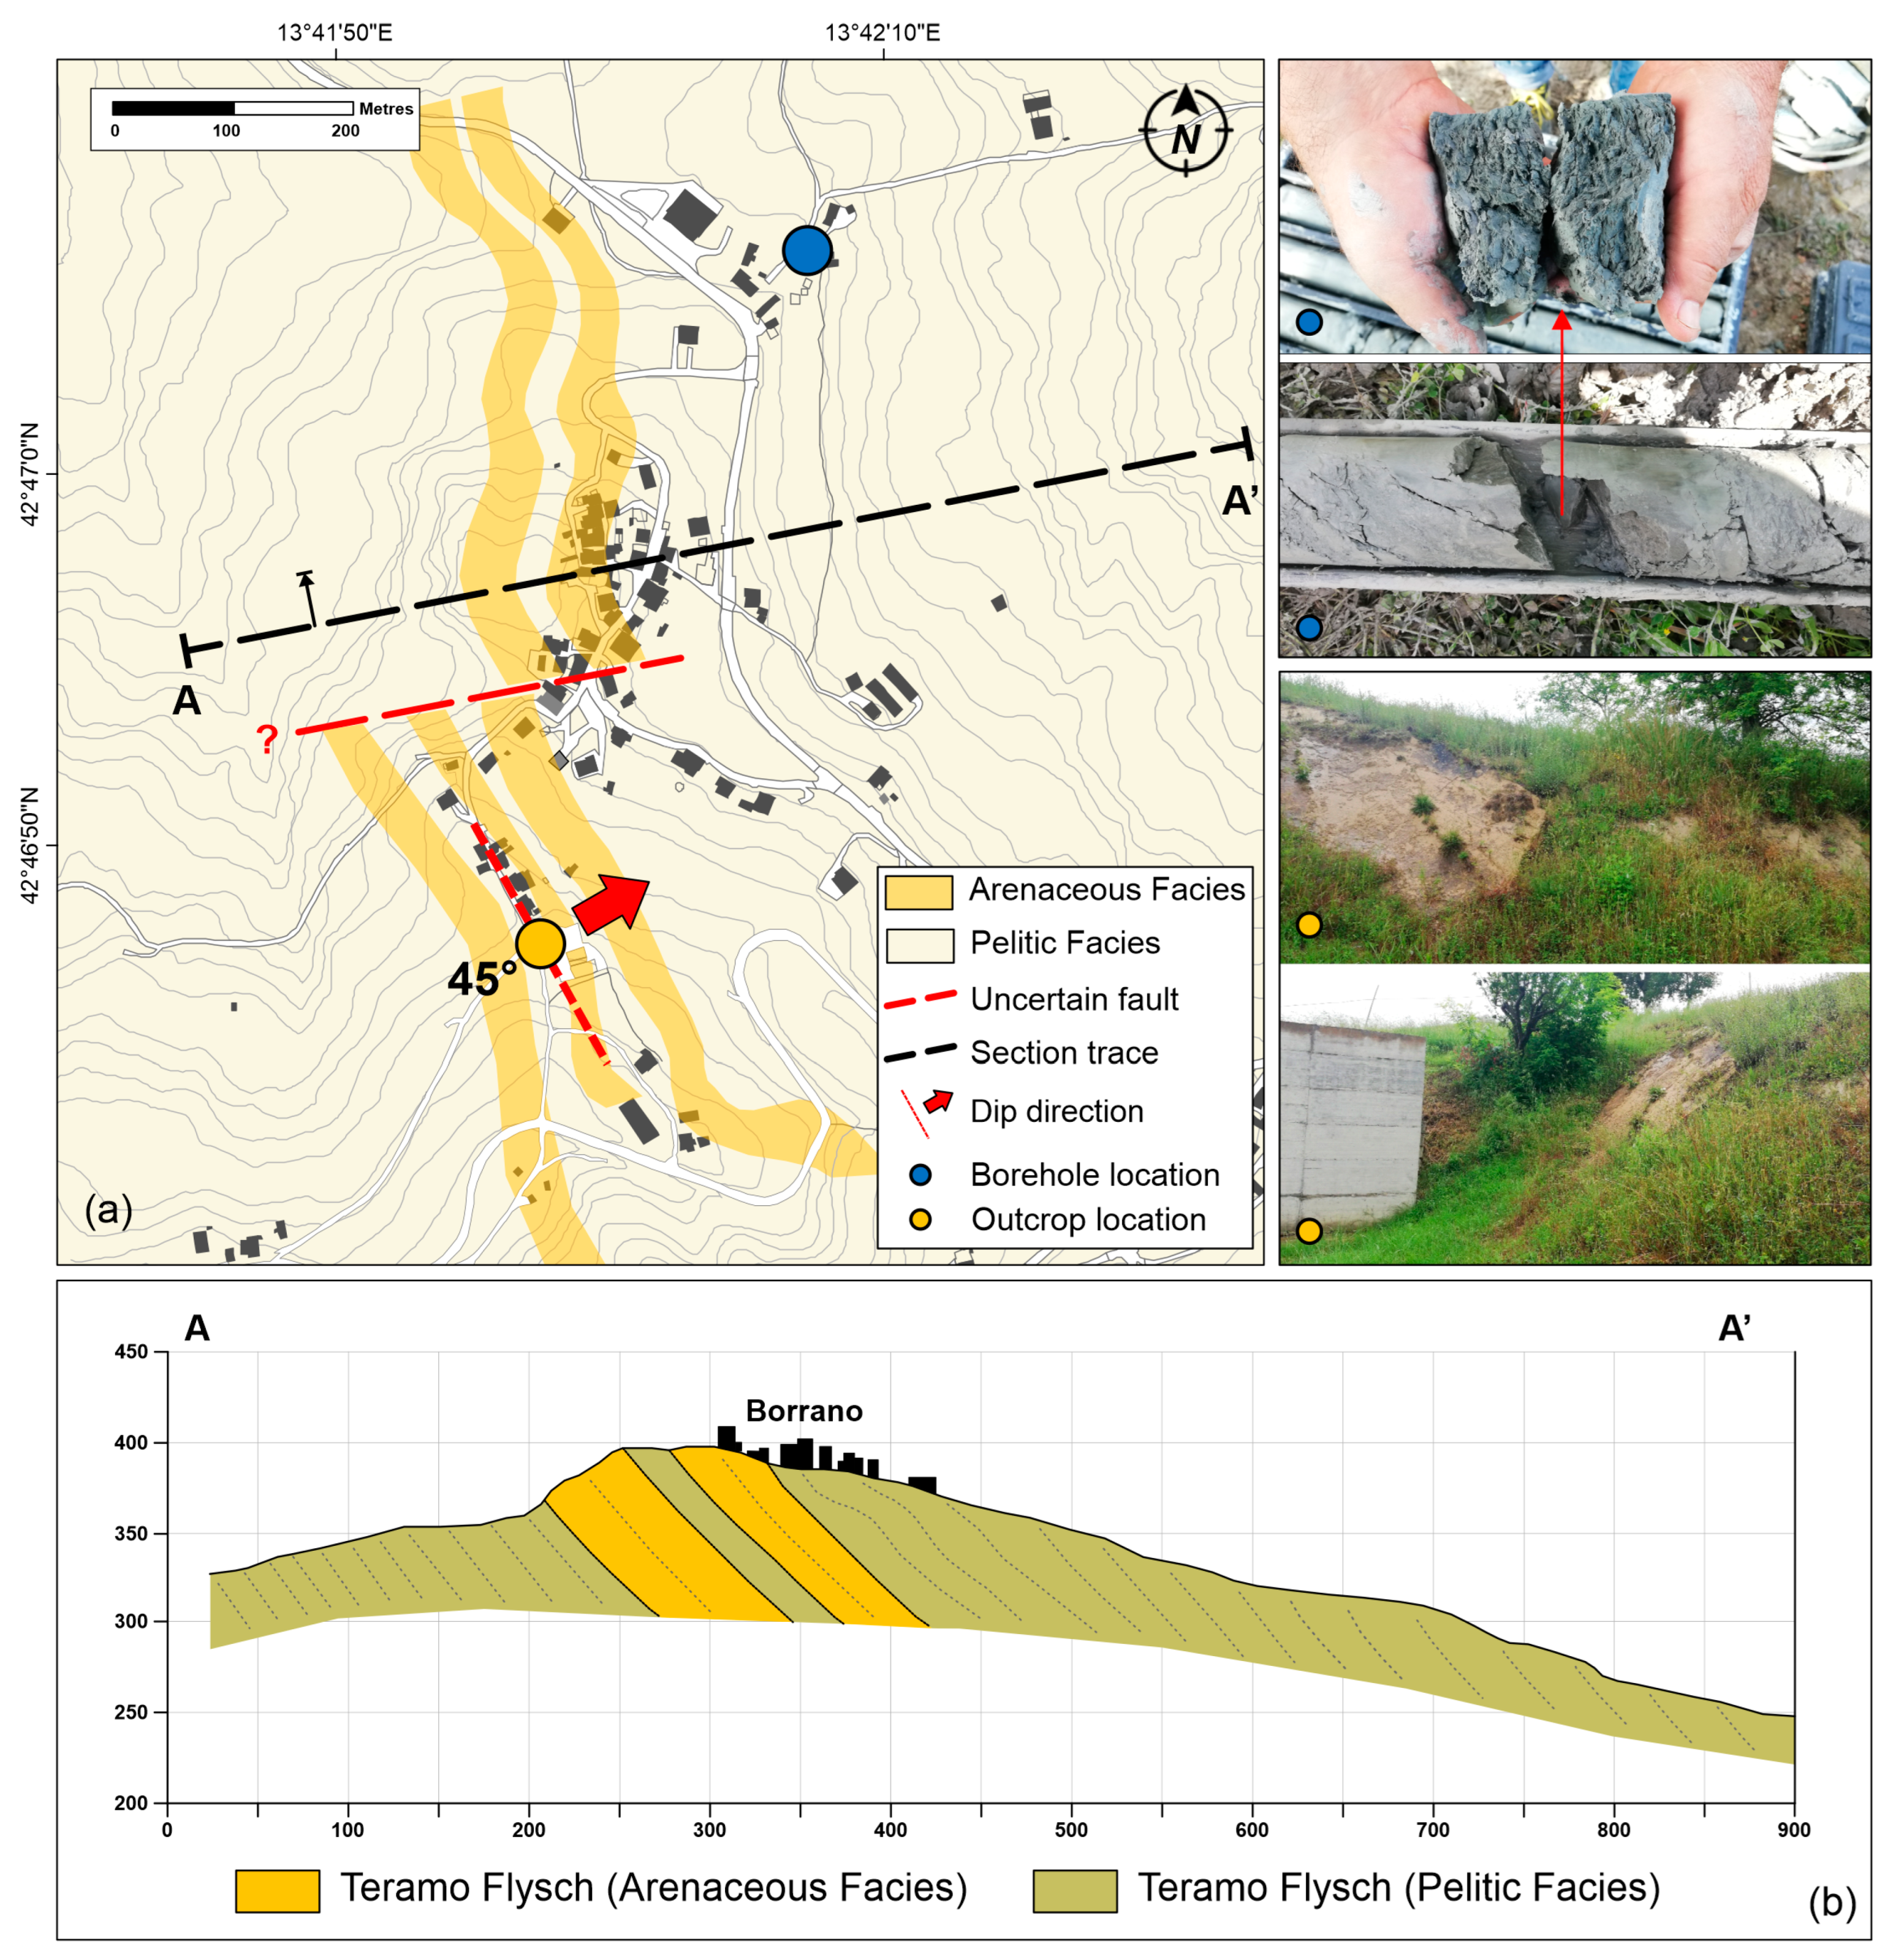
In the Borrano area, the Teramo Flysch Formation is present as a monoclinal structure, with dips towards the north-east. The deposits have different granulometric fractions, separated by the effect of gravity, which are repeated in a cyclic sequence passing from the coarsest sands to the finest pelites. This aspect is present within the Teramo Flysch, where two distinct lithostratigraphic units can be observed:
Arenaceous facies. Within the Teramo Flysch Formation, there are predominantly arenaceous layers with thicknesses of several tens of meters. The structural framework shows a trending monocline, with dips ranging from 38° to 60°. The arenaceous component increases the resistance to erosion, allowing these formations to define the geological subsoil of the area.
Pelitic facies. The Teramo Flysch Formation is dominated by clayey layers. They are constituted by marly clays, with intercalations of a thin arenaceous layer; the structural arrangement follows that of the predominantly arenaceous interval, with the direction of the layers approximately N-N-E, but with an extremely variable dip in the layers.
The detailed survey carried out identified a small outcrop of the Teramo Member (LAG6) in the upper part of the Borrano hamlet (
Figure 3).
2.2. Morphometric Features
In the Borrano area, the main geomorphological phenomena are represented by gravitational movements, localized erosive processes and morphological conditions linked to the structural arrangement of the substrate. These processes, often active, contribute significantly to the evolution of the local landscape and represent a relevant aspect for the land management. Gravitational movements are the dominant geomorphological phenomena, with a variable extent of impact. Erosion processes, although less important than gravitational movements, are mainly concentrated in the beds of the main ditches. These phenomena shape the valley incisions and contribute to the transport of sediment towards the lower areas. However, they represent a minor geomorphological risk due to their marginal position with respect to built-up areas. The surface survey confirmed this general pattern and made it possible to define more accurately the active phenomena present in the study area. The landslides identified are of variable extension and mainly consist of slow movements of the roto-translative type. The ridge areas, which are characterized by old large-scale gravitational movements, are often marked by a regeneration of activity through small landslides. A strong concentration of gravitational movements can be observed on the eastern slope of the morphological relief that connects Borrano to C.da Forlingoni. This slope is about 2 km long and has a difference in height of about 300 m, with slopes incised by various tributaries and characterized, in the upper part, by alternating ridges and valleys in an east–west direction. The concentration and localization of the gravitational movements on the slope are mainly linked to the structure of the substrate, and to the intense deformation within the pelitic association. To better understand the morphometric evolution of the area, studies were carried out using digital terrain models. These models, derived from the regional technical map, scale 1:5000 (Abruzzo Region), integrated with the national lidar data, grid 1.0 × 1.0 m (Ministry for the Environment and Energy Security—Mase), provided a detailed representation of the morphology of the area. The entire territory is characterized by deformations and depressions with very high extension, both on the southeast-facing slopes, such as the area near the Ponzano hamlet [
45], and in the north-east, affecting the Borrano hamlet. Using the digital terrain model, an analysis of the slope and energy of the relief was carried out. This analysis is based on the calculation of the gradient of the plane tangent to the topographic surface, oriented in the direction of the maximum slope, which provides a direct measure of the slope of the terrain. The analysis showed that the slopes in the study area are dominated by values between 10° and 30°, with only a few local parts exceeding this range, and the energy of the relief survey is useful for identifying areas of greater erosion potential and instability (
Figure 4).
The study of the area was carried out using aerial photographs to identify shapes and structural features. The morphology of the terrain, shaped over time by geological processes, reflects the lithological nature of the materials present. Sharp and steep shapes indicate erosion-resistant rocks, while rounded reliefs are associated with more erodible or older lithologies that have been exposed to erosion for a long time. The hydrographic pattern can also reveal the structure of the substrate; in fact, angular shapes are typical of compact and fractured soils where river courses follow discontinuities, while a dendritic pattern, characteristic of clayey or friable rocks, indicates greater erodibility. Any change in tone, colour or texture indicates a change in the characteristics of the soil or surface cover. Another fundamental element is the orientation, which refers to linear elements that follow well-defined directions, typical of fractures or faults, easily distinguishable by their tonal contrast with the surrounding areas. In the study area, particular attention was paid to the identification of the landslides (
Figure 4a), with the aim of understanding the evolutionary processes underway. The methodological approach was based on a stereoscopic interpretation of aerial photographs from regional flights (
Table 2) carried out at three different times: 1982–1987 at a scale of 1:35,000 [
46], 2001–2002 at a scale of 1:13,000 [
47], and finally, the 2010 flight with digital colour images at a scale of 1:5000 [
48].
2.3. Surveys and Monitoring
The Borrano hamlet is located a few hundred meters from the Ponzano hamlet, also in the of Civitella del Tronto Municipality, which was involved in a massive landslide movement in 2017. The Ponzano landslide was caused by factors such as soil saturation due to rain and snowfall and major seismic events that amplified the movement of unstable masses [
49,
50]. The landslide affected a large area of about ten hectares, affecting not only the stability of the slopes but also several local infrastructures and buildings. The first signs of movement were seen as cracks in the ground and on structures, which then developed into an enormous mass movement affecting the entire slope. The event highlighted the importance of constant attention and continuous geotechnical monitoring in landslide-prone areas, especially in areas with similar geological characteristics. In fact, the measurement of soil deformations is an important source of information for a more correct and complete interpretation of the phenomena observed on the surface in terms of the thickness of the mobilized soil [
51] and the velocity of movement. Inclinometric monitoring is one of the most widely used tools and reliable techniques for monitoring the behaviour and stability of slopes and landslides. The use of inclinometers in landslides has the great advantage of providing real-time data on ground movement, enabling timely intervention and effective risk management. By monitoring the behaviour of a landslide-prone slope, it is possible to detect signs of instability before massive movement occurs. Based on the experience of the Ponzano landslide, following the 2016/2017 seismic events, the Borrano area was the subject of its first geognostic survey in 2018 [
52,
53,
54], when the extent of the damage found in some local buildings prompted the installation of a monitoring system capable of alerting the population in the event of an acceleration of the landslide phenomenon. A surface monitoring system, shown schematically in
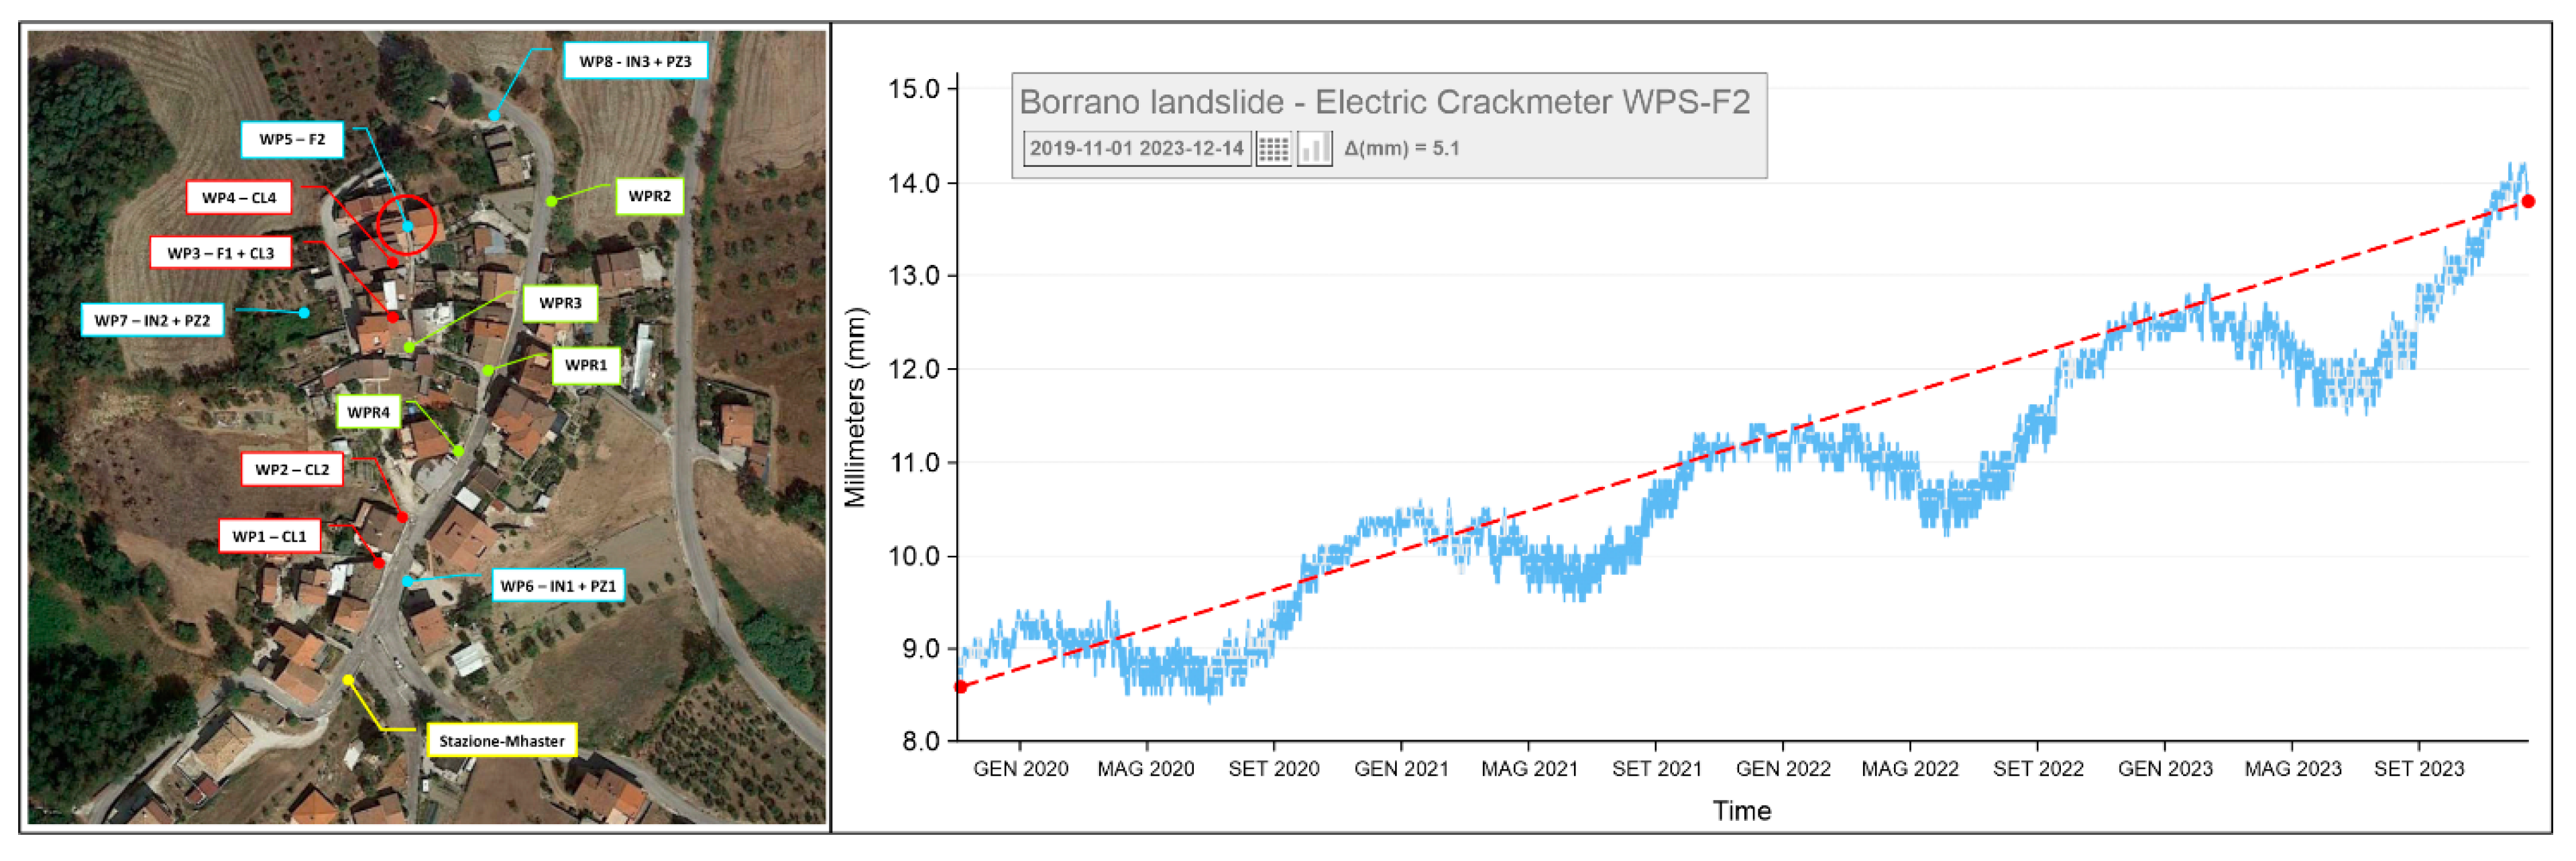
Figure 5, has been installed throughout the area, providing an integrated and technologically advanced system for detecting and analysing the site deformations [
55,
56]. The monitoring network includes a combination of specific instruments, such as crack gauges for monitoring crack openings in structures [
57], clinometers for monitoring slope deformations, and strain gauges for measuring linear deformations [
58]. All devices, strategically placed in the study area, are connected to a remote data transmission system that enables continuous, automated and real-time information collection [
59,
60]. This technological configuration, applied in the context of the Borrano landslide monitoring system, allows constant access to a flow of updated data, useful for both normal monitoring and for the early detection of critical signals or anomalies.
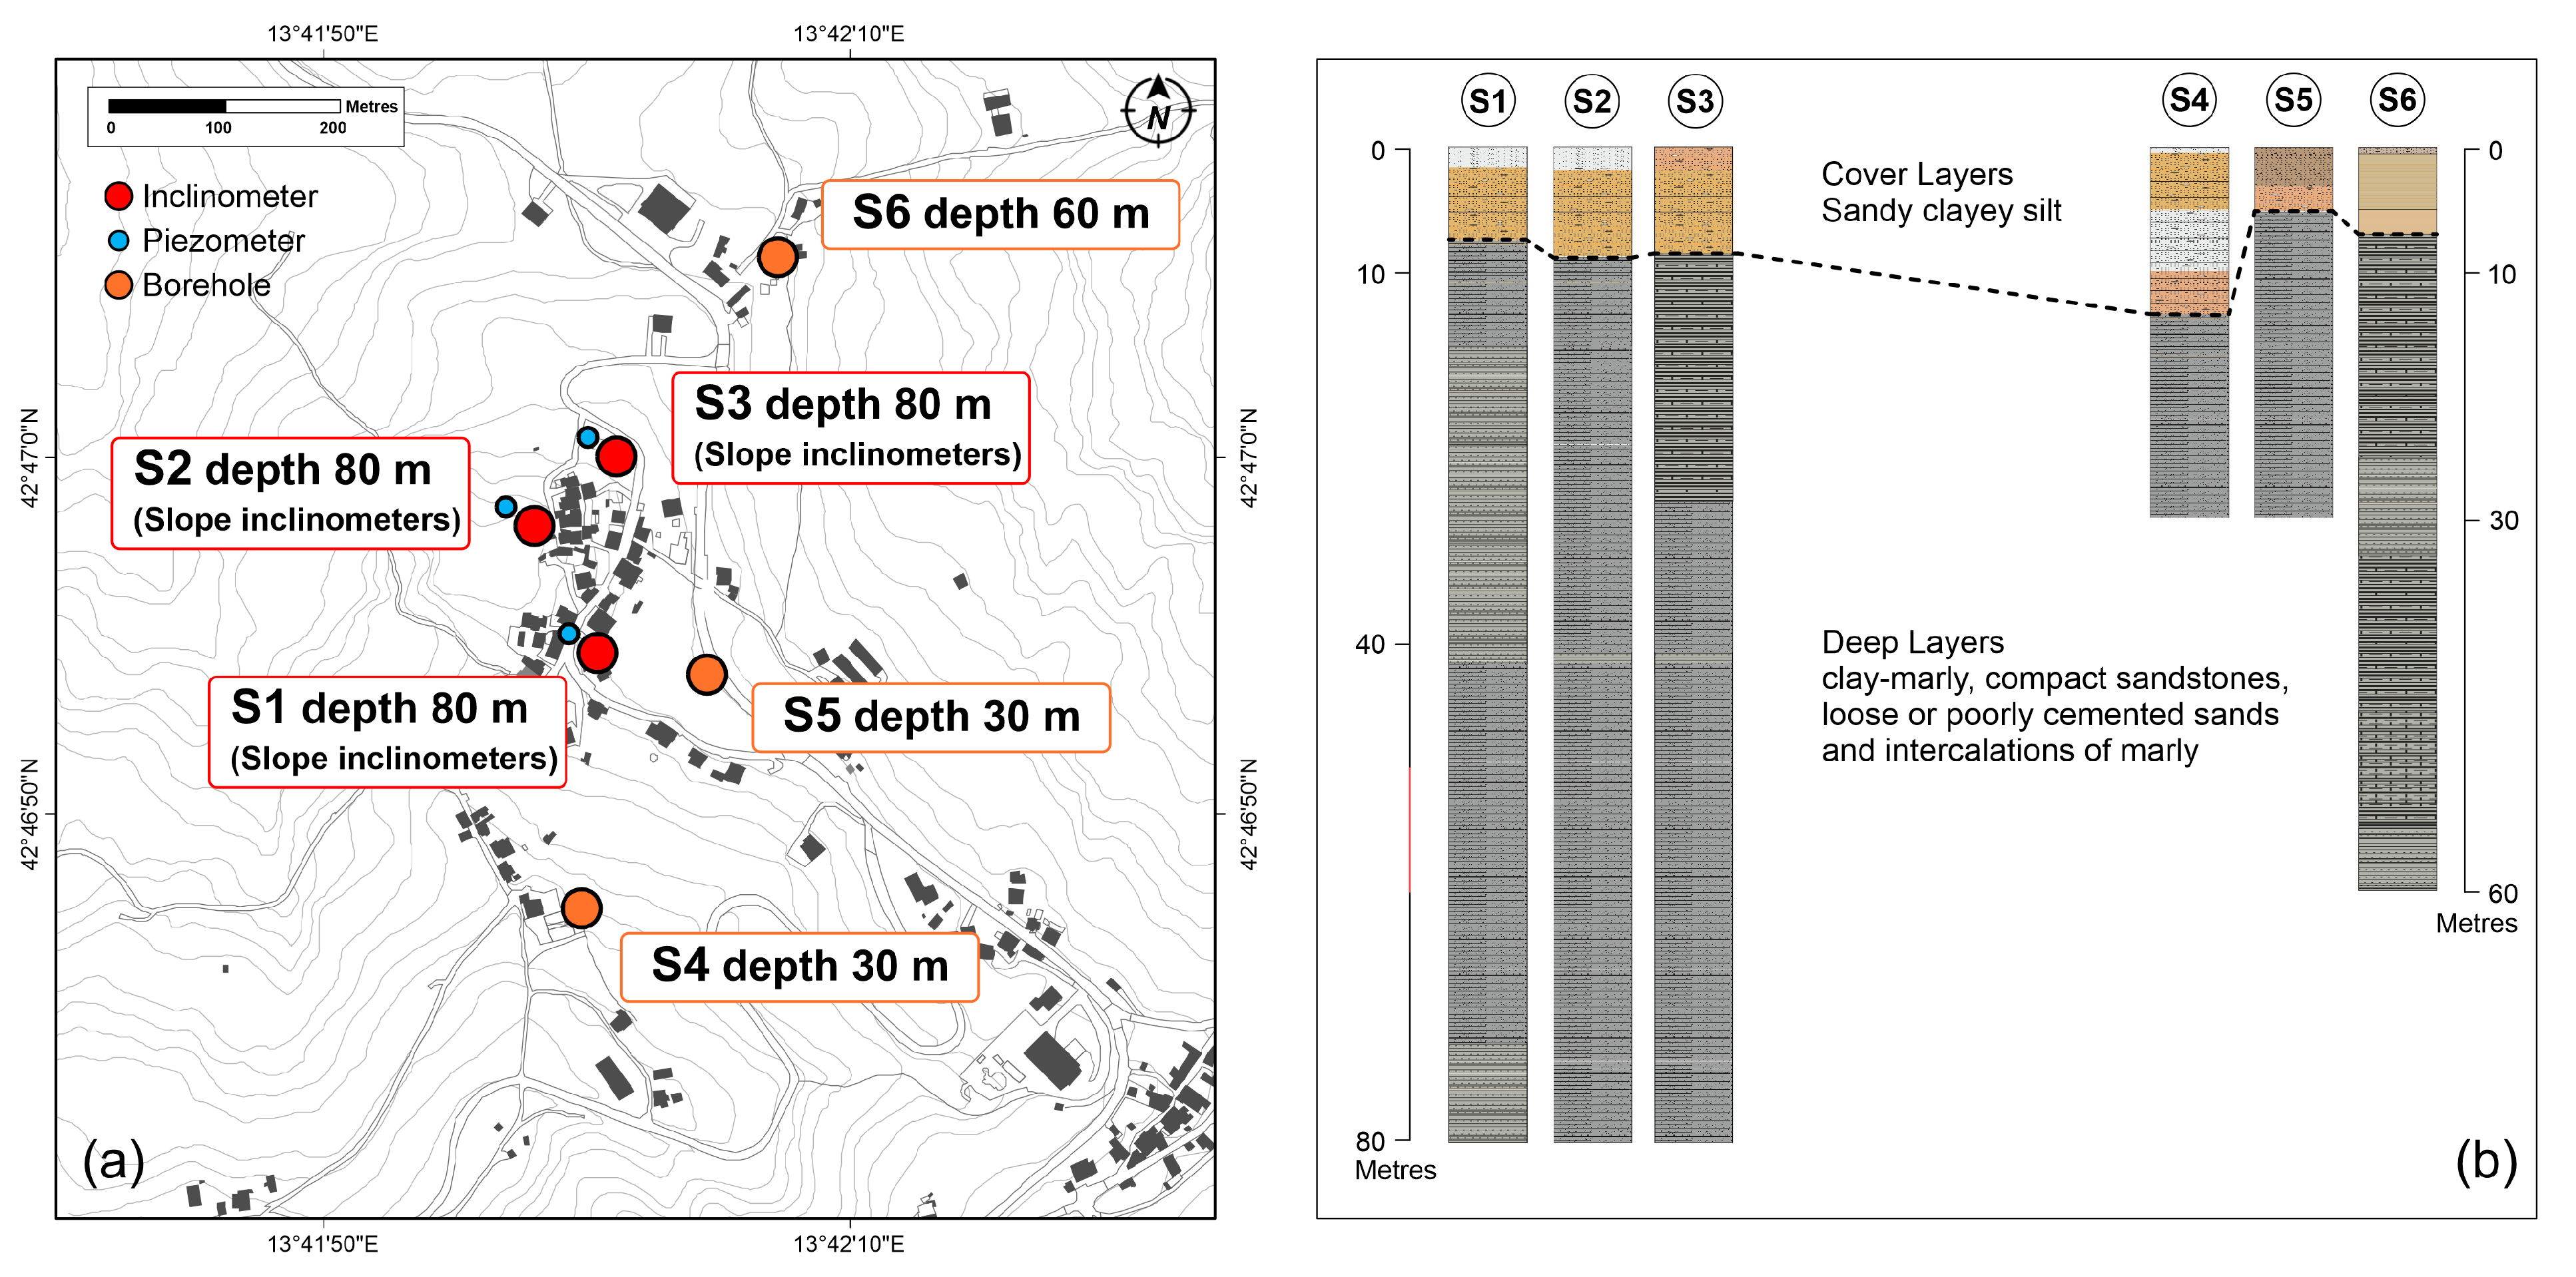
In the first phase, three boreholes equipped with inclinometers and three piezometers were drilled to a depth of 80 m (
Figure 6a). To improve knowledge of the stratigraphic structure of the study area, a second investigation was carried out in 2023 with a further three boreholes at different depths (
Figure 6b). The drilling techniques (continuous coring and core destruction) were adapted to the soils encountered during the execution phase to minimize disturbance and ensure the representative coring of the materials present. The stratigraphy encountered is consistent with the main geological features of the area. The drilled material shows a complex stratigraphic sequence typical of geological contexts influenced by tectonic and depositional dynamics. The lithologies include mainly marly clay, compact sandstones, loose or poorly cemented sands and intercalations of marly limestone. The marly clay materials are characterized by moderate plasticity, especially in the less cemented layers, and frequent irregularly oriented fractures, evidence of past tectonic movements. The sandstone layers, which are well cemented and very compact, vary in thickness from a few centimetres to a few decimetres. There are frequent intercalations of marly limestone alternating with marls, whose low thickness and high cohesion give them greater strength than the adjacent clay layers.
The stratigraphy present in the area is a succession of lithotypes with different mechanical properties, marls, clays, sands and sandstones, following a local depositional and tectonic logic. This complex pattern provides essential information for understanding geological evolution and its mechanical and geotechnical aspects. In detail, in the zone of surveys S1 and S5, the succession is dominated by clayey marls with thin intercalations of marly limestone. From a depth of about 70 m, there is a significant increase in the sandstone component, dominated by compact sandstones. In the S2 survey, the stratigraphy shows loose sands in the interval between 40 and 60 m, while marls and sandstones dominate above and below this interval. Boreholes S3 and S6 show a greater predominance of compact sandstones accompanied by sandy levels alternating with intercalations of clayey marls and marly limestone. Borehole S4 shows natural deposits with a predominance of continuous clayey silt with traces of calcification, sandy layers and carbonaceous remains. At a depth of about 20–30 m, there is a transition to grey-blue clay with frequent thin sandy intercalations and centimetres of clayey silt.
2.4. Two- and Three-Dimensional Slope Stability
In this context, the use of numerical methods has improved the understanding of slope stability by overcoming the limitations of classical analytical methods, which often make simplified assumptions about the shape and position of sliding surfaces [
61,
62]. Among these, the FLAC code [
63] stands out for its ability to model continuous systems through an explicit finite difference approach [
64]. The use of FLAC has proved particularly effective in the analysis of complex slopes [
65], such as those subject to stratification, alternating lithotypes with contrasting mechanical properties, or interactions with existing infrastructure. These analytical capabilities make it possible to more accurately identify the most critical sliding surfaces, even in the presence of variable hydrogeological conditions, and to predict slope behaviour following critical events. The mechanics of the material is derived from general principles (the definition of deformation, laws of motion, etc.) and the use of constitutive equations representing the idealized material. The resulting mathematical expression is a set of differential partial equations relating to mechanical (stresses) and kinematic (strain rate) variables that are solved for specific geometries, geological properties, boundaries and initial conditions. There are several constitutive models that can be used in the code, which share the same incremental numerical algorithm operating in the effective stress plane. In this work, the mechanical behaviour model for the surface alteration cover was developed using a stress–strain model based on the Mohr–Coulomb criterion [
66], where material strength increases linearly with effective normal stress. In this approach, the material reaches failure when the Mohr circle of tangent stresses intersects the failure plane, which is determined by the relationship between cohesion, effective normal stress and the internal friction angle. For the substrate, which is characterized by a complex geological conformation, the ubiquitous joint plasticity (UJP) model was used, which is particularly useful for materials with well-defined planes of weakness [
67,
68]. This model combines the global behaviour of the zones, described by the Mohr–Coulomb criterion, with a specific plastic process for planes of weakness, such as cracks or fracture planes, that develop under external stresses (
Figure 7). The ubiquitous joint models predict the material response of the rock mass by integrating the mechanical property matrices of both the rock and the joints. The equations involve a combination of different components such as the strain–stress relationship, which describes the behaviour of the rock when subjected to external stresses, or the anisotropy consideration, where the mechanical properties of the rock can vary depending on the direction, with the joint orientation and spacing being key factors influencing this anisotropy. Another important aspect is the non-linear behaviour of the rock, which includes the ability to simulate fracture and sliding along discontinuities.
The UJP model is first used to calculate the general deformations and then to analyse the evolution of the plastic deformations that develop in the planes of weakness. In this context, the behaviour of the model is influenced by the presence of these planes of weakness, which modify the load response and require plastic corrections for a more accurate simulation. In this way, the UJP model provides a detailed and realistic simulation of the mechanical behaviour of the material, which is particularly useful for analysing stability and deformation in complex geotechnical situations such as the Teramo Flysch. In this case, the modelling of the planes of weakness considers their orientation, which is set at 45° in the N-E direction.
Slope stability analysis requires special attention in the evaluation of initial conditions, including the piezometric level. In the area, the depth of the piezometric level obtained from borehole measurements have often been affected by the intensity of rainfall. In the numerical analysis, a water table −1.0 m below ground level was assumed with no variations. Geotechnical property values were extrapolated from laboratory tests on borehole samples, except for joint parameters where the angle of friction was assumed to be 50% of the intact material and the cohesion equal to zero, to consider the worst-case condition.
Table 3 shows the main mechanical properties used in the numerical analyses.
Given the complexity of the area, the system was analysed using a two-dimensional model to study local instabilities and a three-dimensional model to determine the large-scale stress–strain state. The construction of the two-dimensional geometric model was carried out on two critical alignments along the maximum slope in the southernmost part of the settlement with
Section 1 and the northernmost part with
Section 2 (
Figure 8). The construction of the three-dimensional geometric model was a key step in accurately representing the complexity of the system. Starting with the actual vector data extracted from the local aero-photogrammetric surveys, contour lines and key control points were processed. The data were used to generate a detailed topographic surface, which formed the basis of the computational model. To improve accuracy, geognostic surveys were used, which allowed the representation of lithological discontinuities, and the main stratigraphic levels were identified in the study area. The geometric volume was discretized using tetragonal elements, chosen for their ability to adapt to complex geometries and to represent morphological and stratigraphic variations with greater accuracy. The modelling process included an initial calibration phase to optimize the grid and ensure that the vertices of the elements coincided with precisely defined elevations. To ensure the correct size of the model and to avoid numerical interference at the edges, an extension of 2900 × 3400 m was chosen, corresponding to approximately 9.86 km². To represent local features in sufficient detail, a zone dimension with meshes varying between 10 and 30 m was adopted, generating a total of 1,195,360 tetragonal zones and 216,042 nodes. In the model, the shallowest part of the ground was modelled with a uniform thickness of 10 m. This layer was defined to simulate the behaviour of the surface alteration cover, which was confirmed by borehole data. Three-dimensional modelling structured in this way allowed topographic, stratigraphic and mechanical data to be integrated into a single coherent system, providing a detailed and accurate representation of the deformation state on a large-scale model.
3. Results
The photo-interpretation study shows a significant evolution of the Borrano area. In the southern part, gravity movements appear to be essentially unchanged in magnitude, with limited evidence of activity such as new scarps or counter-slopes with quiescent movements. The eastern slope of the Borrano settlement shows much greater dynamics over time. In the 1981–1987 photograms, gravitational movements are limited, while the 2010 images and lidar data show a significant increase in landslide phenomena, both in number and extent.
The landslide areas present in the oldest images are significantly enlarged in the latest analyses, indicating an expansion of the unstable area. Focusing on the landslide affecting the hamlet of Borrano, this study shows a significant increase in the area affected (
Figure 9b,c), from about 230,000 m² in the 1980s to about 296,000 m² in 2010. Initially, the landslide only marginally affected the built-up area, especially the eastern part. However, since the 2000s, it is evident that the entire built-up area has been progressively affected by slope movement, indicating a state of activity over time that has created a ridge split that is only visible in three-dimensional reconstructions (
Figure 9a).
This evolution is evidenced by the records of the surface monitoring instruments, which show steadily increasing trends over time. In particular, the graph in
Figure 10 shows the trend of the WPS electric crack-meters located in the northern part of the settlement. The analysis of the data shows a progressive increase in the values recorded, which can be correlated with an acceleration in the processes of deformation and instability of the ground.
Inclinometer measurements allowed ground movement to be monitored in real time, providing the first direct information on the evolution of the area. Inclinometers were the first instruments to identify significant deformations, with particular attention paid to deep displacements and a comparison with structural cracks found in adjacent areas.
The image in
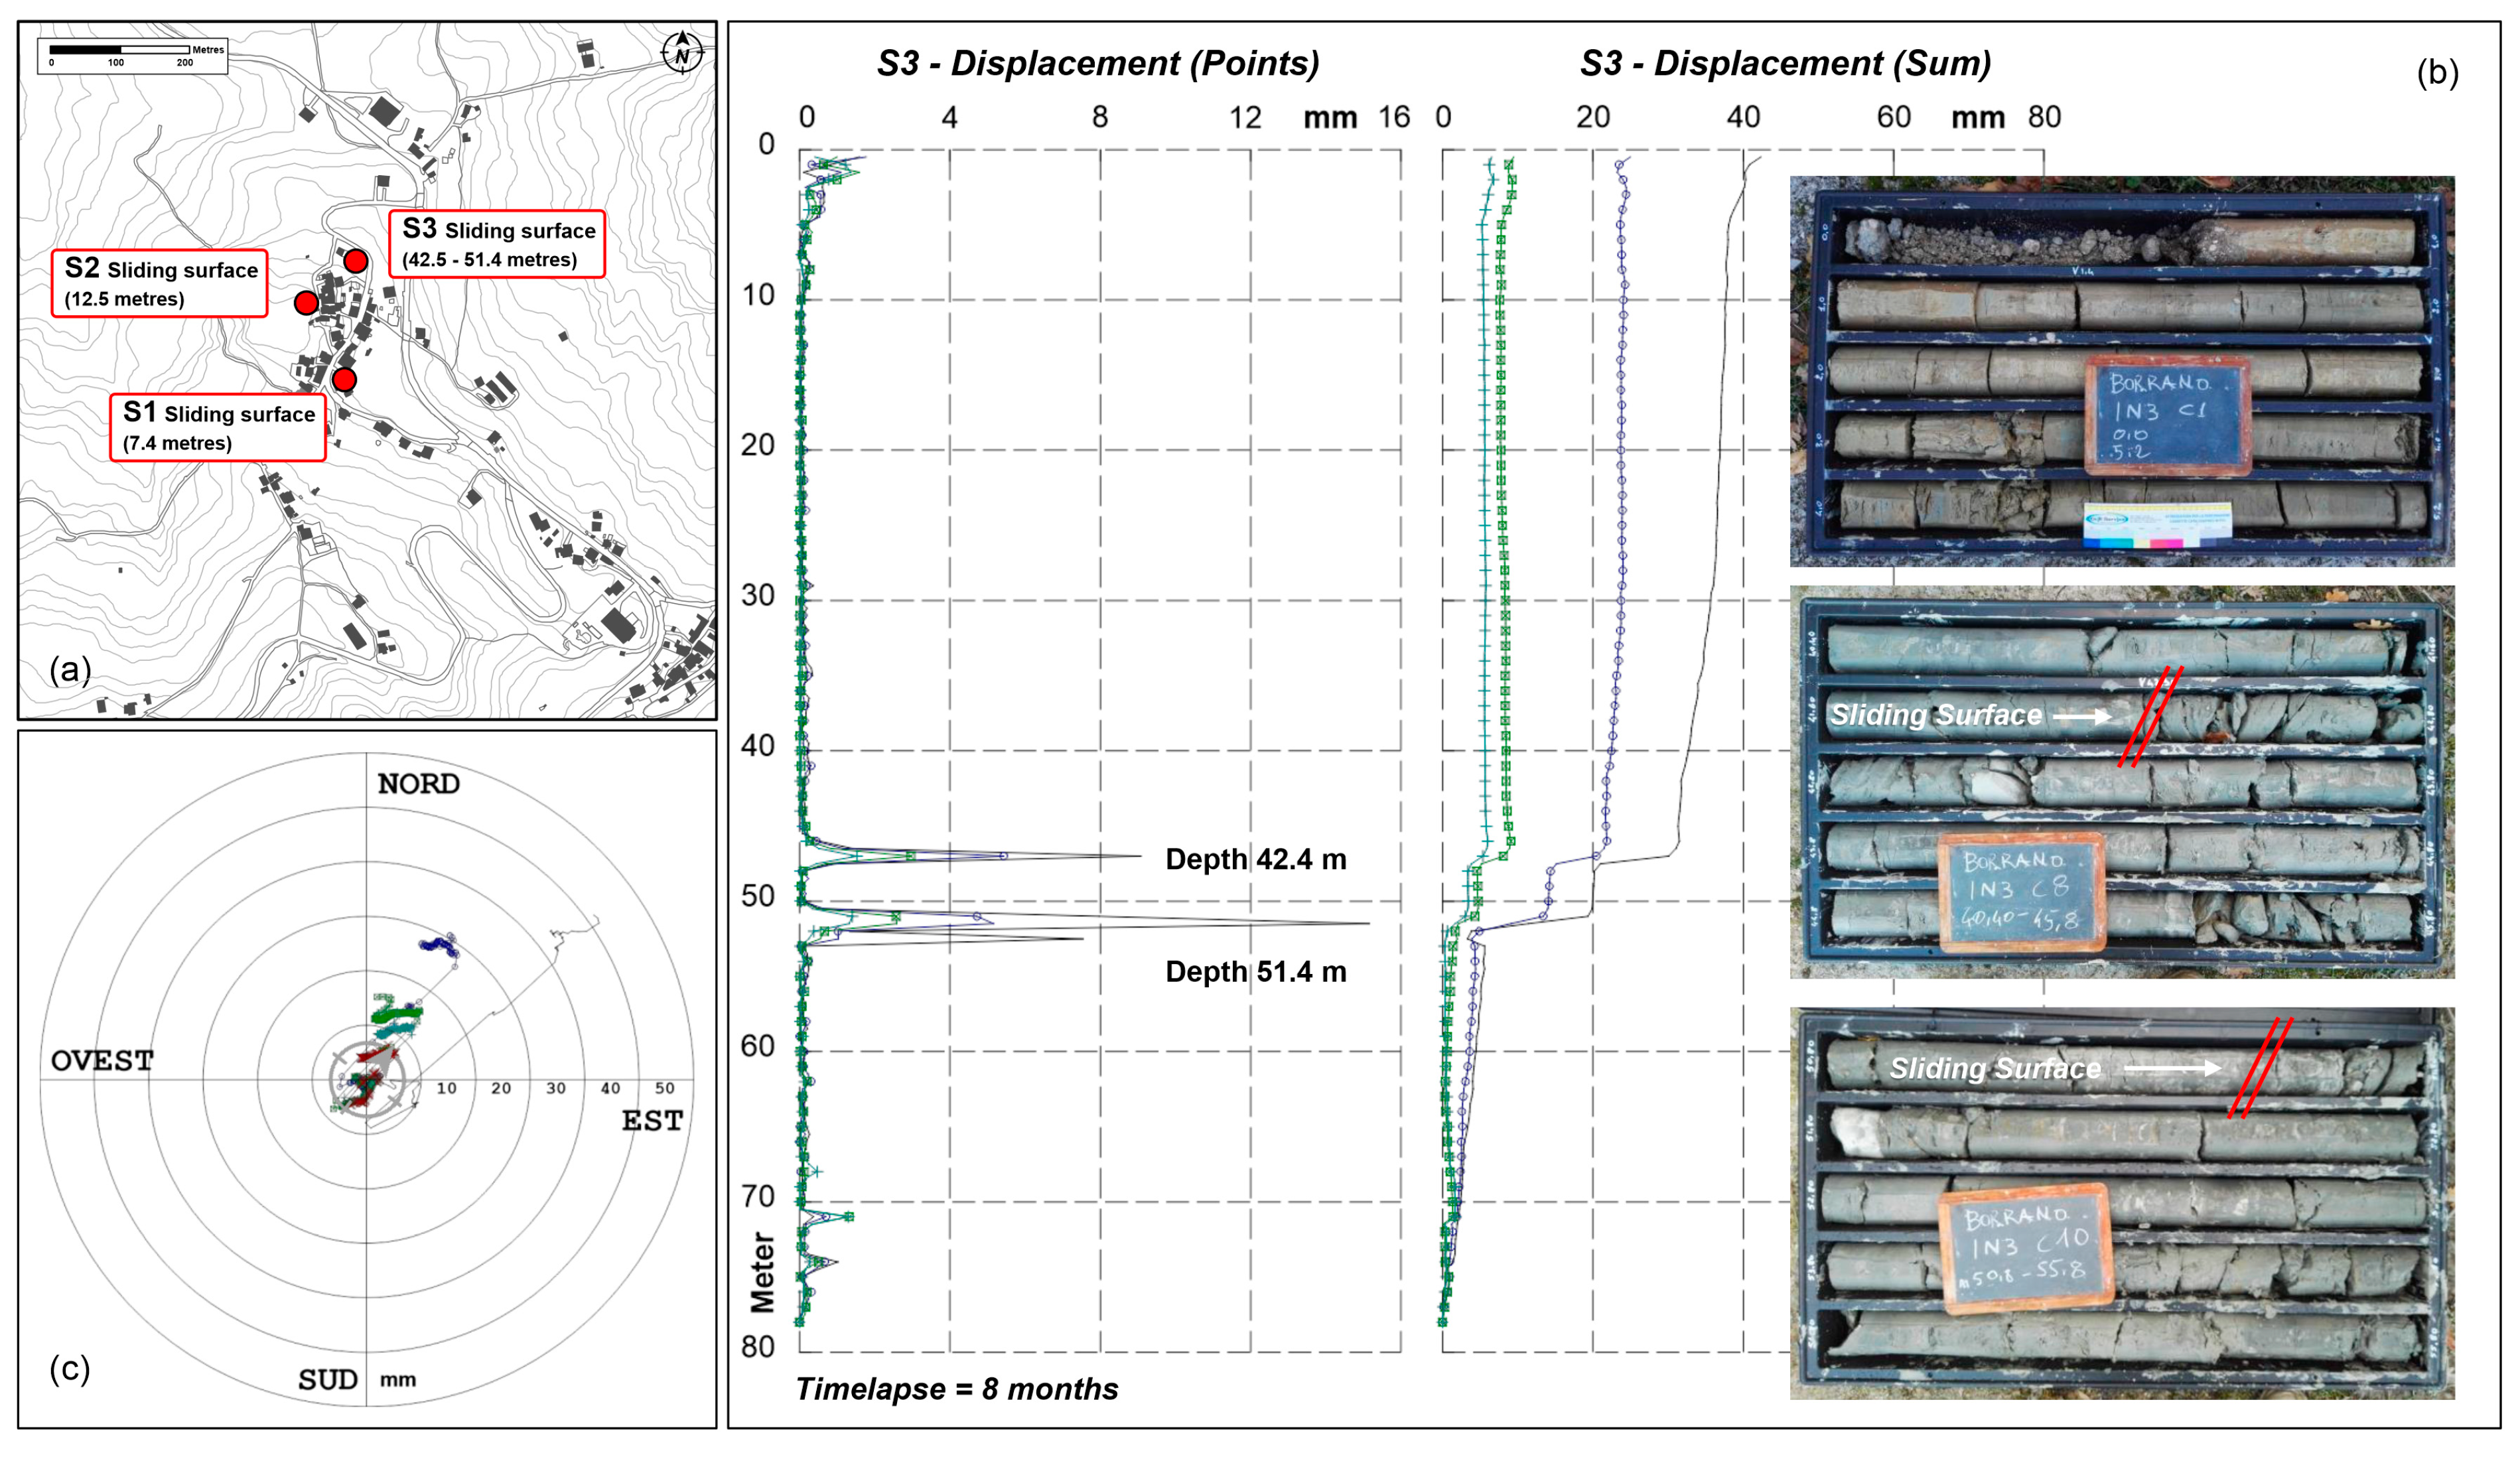
Figure 11 shows the inclinometric analysis carried out in the Borrano area, which provides a complete understanding of the dynamics of the system. It is possible to define a progressive intensification of movements, with significant displacements concentrated at very high depths, suggesting that the deep slip surfaces are active and in continuous evolution. The map on the top left (
Figure 11a) shows the depths of the slip surfaces recorded for each measurement point within the study area, where there is an increase in depth of maximum deformation from south to north.
The point displacement (
Figure 11c) graph shows the point displacements recorded every 0.50 m along the vertical. The most pronounced variations were recorded between 42.4 m and 51.4 m, corresponding to the deep slip surfaces. The second graph, sum displacement, represents the cumulative sum of the displacements and again shows a significant increase in the same depths. In addition, this graph shows that the phenomenon is persistent and that the movements are becoming more pronounced over time, especially at the critical depths, which are likely to be the main planes of weakness. This is consistent with the monitoring period of eight months during, which the displacements have increased, showing a continuous dynamic overtime rather than isolated events. The direction and the magnitude of the displacements are illustrated in the polar diagram (
Figure 11b), where a precise direction of movement was identified (north–north-east), indicating displacements according to preferential directions linked not only to the geometry of the sliding surfaces but also to the geological and stratigraphic nature of the materials involved. The analysis was completed with photographs of the soil samples showing the identified slip surfaces, providing visual evidence of the processes taking place.
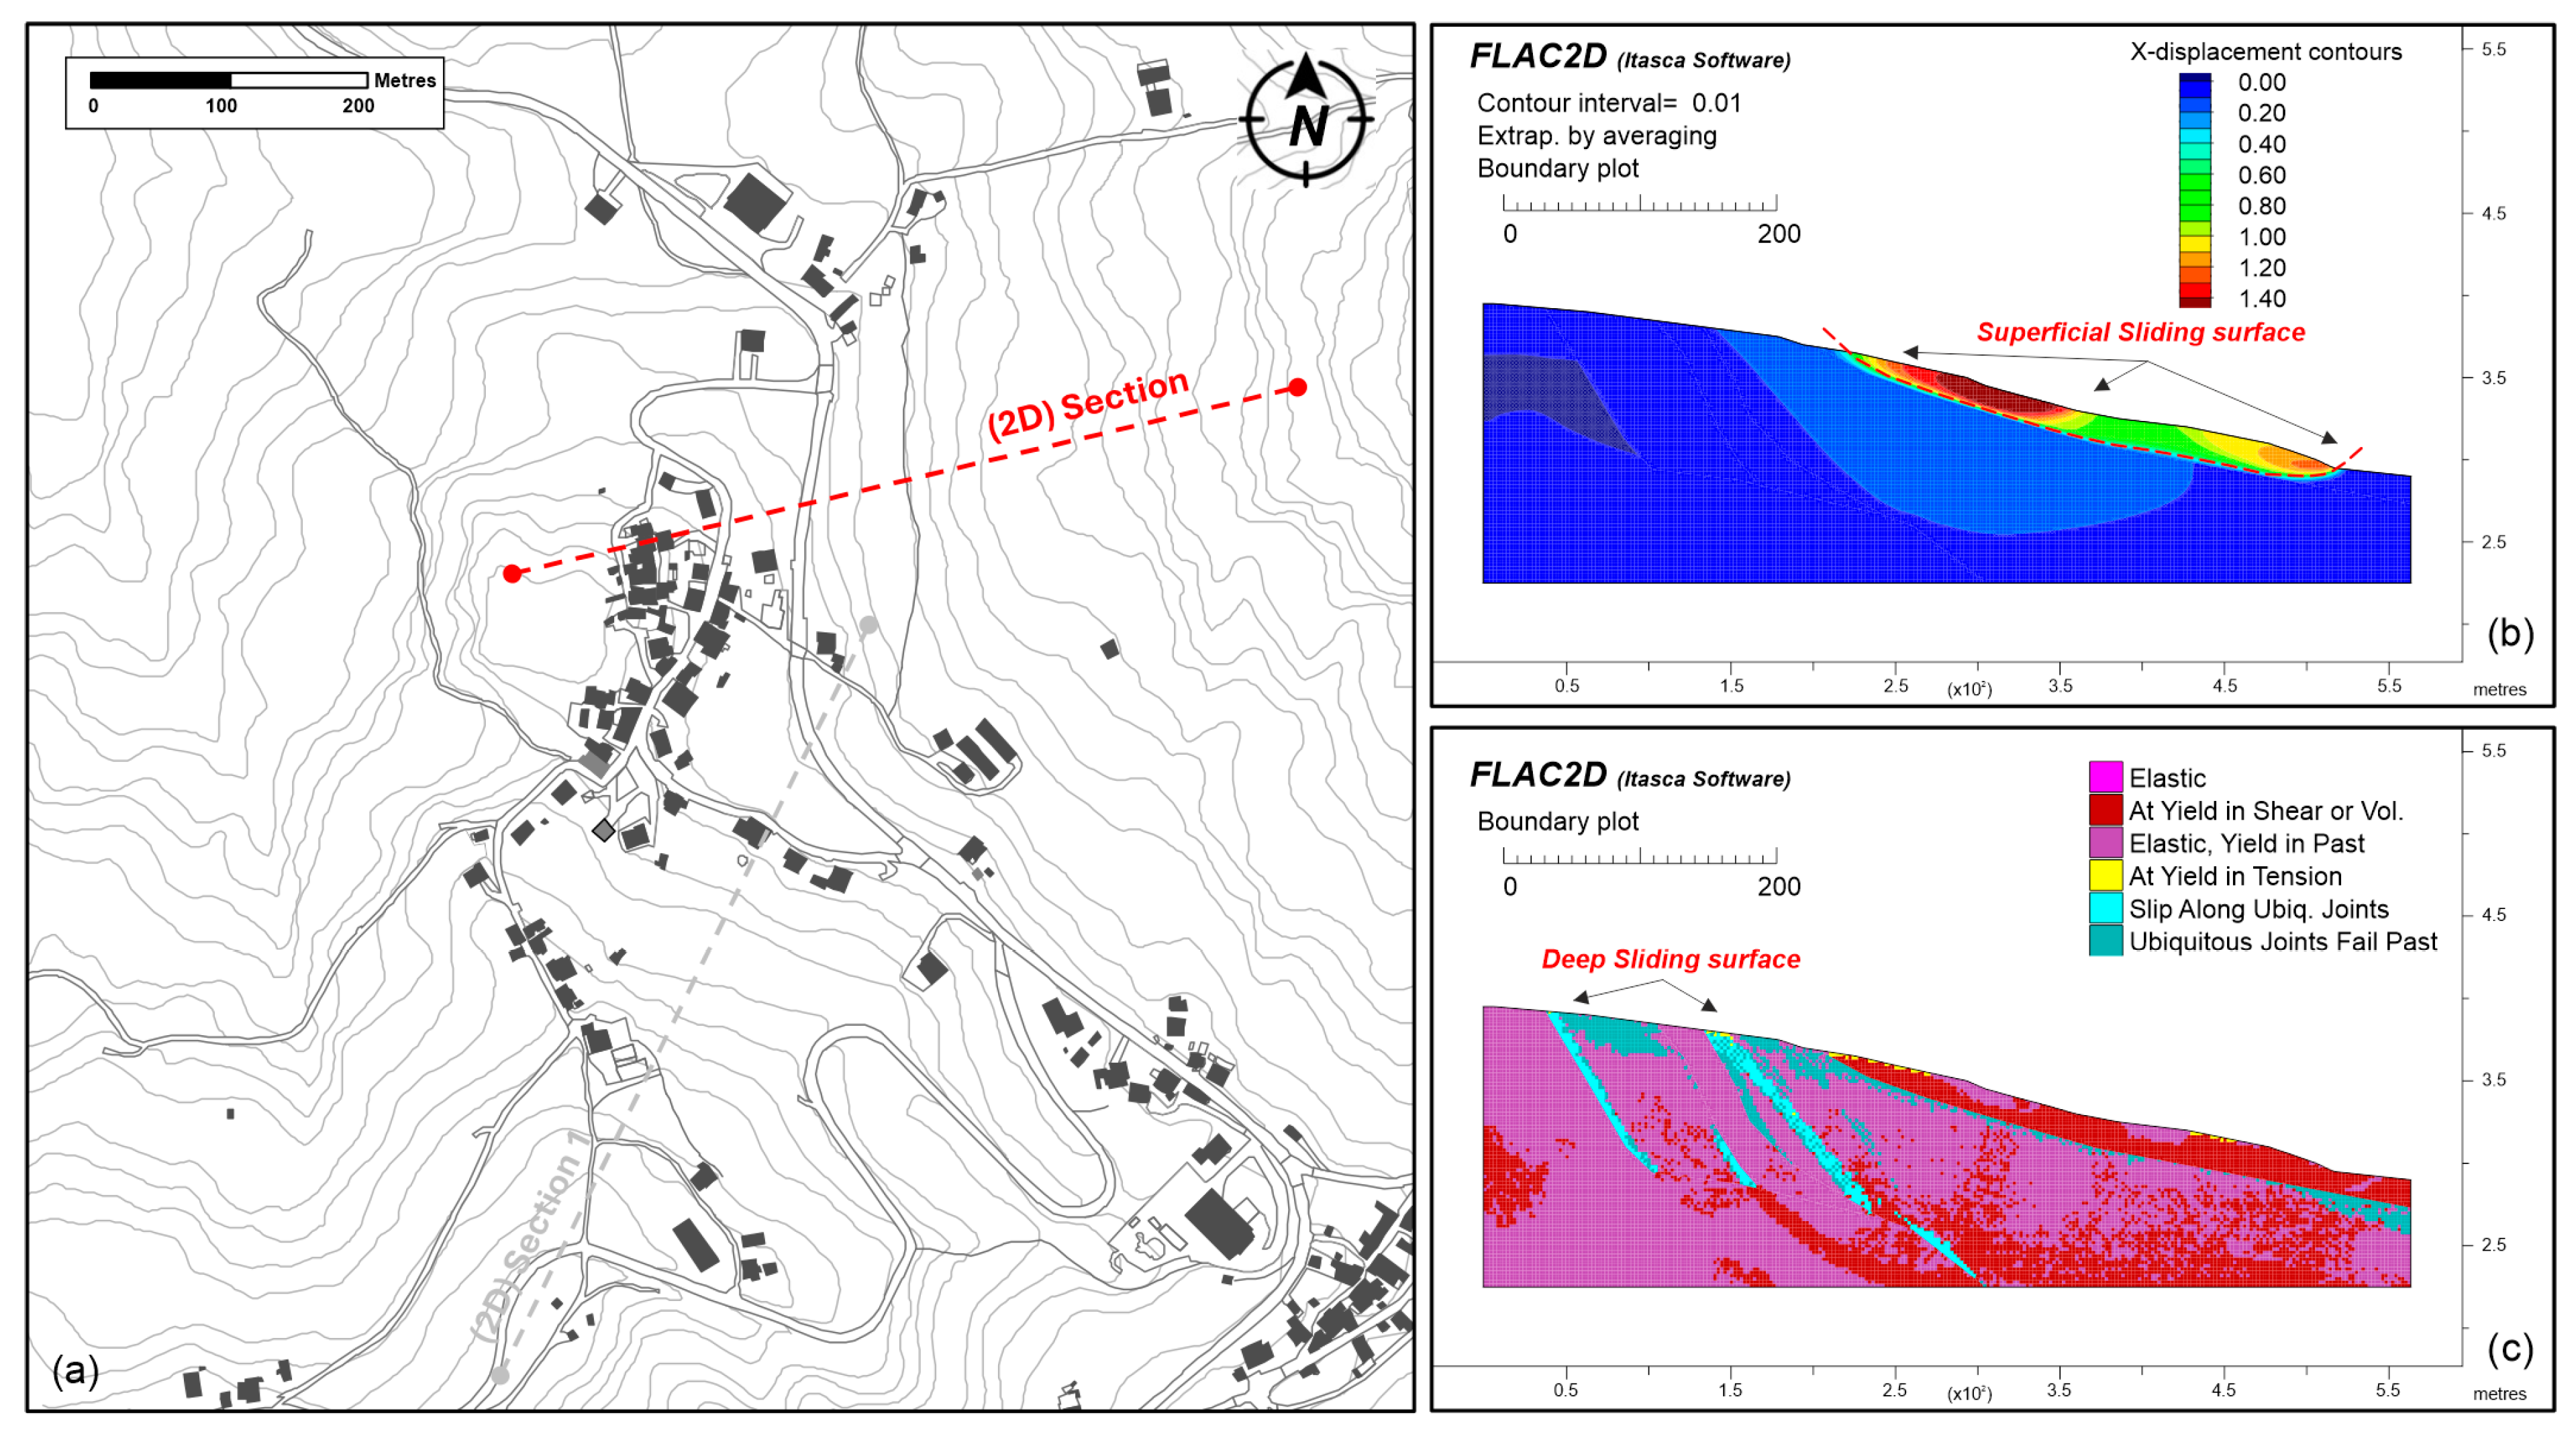
A two-dimensional numerical analysis was carried out in the most critical part of the area to simulate the behaviour of the soil under different loading and saturation conditions. The model was carefully calibrated using geognostic data obtained during the investigations, allowing the determination of deformations and stresses at different soil depths (
Figure 12). The map in
Figure 12b shows a zone of maximum displacement at the most superficial part, where the alteration cover with less mechanical properties encounters the more compact geological substrate. This transition zone may be affected by alteration, erosion or frictional forces that facilitate the movement of the overlying material. At greater depths, secondary failure surfaces develop, which may result from fractures or structural deformation caused by tectonic forces or internal soil pressures. These planes, although less visible on the surface, are critical to the stability of the overall system as they can determine the intensity and direction of deeper and more complex movements of large masses of material. In addition, the graph in
Figure 12c can be used to identify areas in critical condition where the applied stress exceeds the resistance of the material along the planes of weakness, resulting in creep to failure. Slip along ubiquitous joints identify zones where the plastic creep process occurs along planes of weakness distributed throughout the anisotropic material, while ubiquitous joint fail past identifies zones where the joints have already exceeded the strength limit and are in a post-failure state, and thus, the actual mechanical behaviour is governed by residual strength forces.
An important aspect of this analysis is the comparison between the deformations calculated in the numerical models and those observed by monitoring. Inclinometer measurements, which record ground displacements at different depths, provide real data that allow the numerical model to be validated by checking that the geotechnical parameters, the boundary conditions adopted, and the external forcing used are consistent. Indeed, the comparison between the two approaches has shown good agreement in the areas of greatest deformation, where the numerical simulations were able to faithfully reproduce the observed behaviour, suggesting that the model parameters were correctly calibrated. Good agreement between simulated and real results not only improves the understanding of instability mechanisms but also contributes to making predictions of landslide behaviour more reliable and useful for risk management. The comparison between the S3 inclinometer data and the 2D numerical analysis shows a significant correlation in the detection of deep ground movement. The graph in
Figure 13b shows the trend of the shear strain increment (SSI), which represents the incremental change in tangential strain during the numerical simulation. In other words, these values illustrate the progressive evolution of shear stress throughout the model, enabling the identification of zones where notable changes in stress and deformation are occurring. They also highlight creep surfaces, as shear strain increments highlight critical areas where tangential deformation accumulates, suggesting potential planes of slip or fracture. Furthermore, they highlight not only the position but also the temporal evolution of the phenomenon, showing where deformations increase and indicating the possible formation of a slip surface.
Figure 13c illustrates the consistency of the analyses by comparing the graphs of the point and sum displacements of the S3 inclinometer with the trend, on the same vertical, of the shear strain increment map generated by the numerical modelling.
Given the extent of the potentially unstable area, a three-dimensional numerical model was developed to integrate all the available data and to represent in detail the stress–strain behaviour of the entire analysed area. The model was constructed by incorporating two fundamental components: the surface layers, identified in all the boreholes, and the substrate layer. Particular attention was paid to the modelling of the deep layers, again by implementing a constitutive ubiquitous joint plasticity (UJP) connection, capable of describing in three dimensions both the overall mechanical behaviour of the mass (Mohr–Coulomb) and the internal planes of weakness. In this specific case, these planes were schematized with a 45° inclination and a preferential north–north-east direction, in accordance with the stratigraphic and structural information obtained from the geological investigations. The mechanical parameterization and the definition of the boundary conditions followed the same criteria as in the two-dimensional model to ensure consistency and comparability with the real conditions. The three-dimensional approach allowed a detailed analysis of the plastic deformations and their evolution on a territorial scale, highlighting that a significant part of the inhabited area is affected by widespread plastic deformations, indicating an active instability process. The map of the shear strain increment (
Figure 14) shows areas of maximum deformation that are large, continuous and characterized by an elongated north–north-east trend. This configuration reflects the geometry of the fracture system and the assumed planes of weakness within the substrate, suggesting significant structural control over the way the ground deforms and slides. These planes of weakness act as stress concentration surfaces, promoting material movement along predefined directions. The results of the three-dimensional model also show good agreement with the real conditions. There is good comparability with inclinometer measurements, both for deep deformations (inclinometer S3) and surface deformations (inclinometer S1). These are the areas most affected by deep planes of weakness, which, due to the conditions of water circulation, tend to deform along inclined discordant planes, given by the contact between clayey/marly and arenaceous facies.
The image in
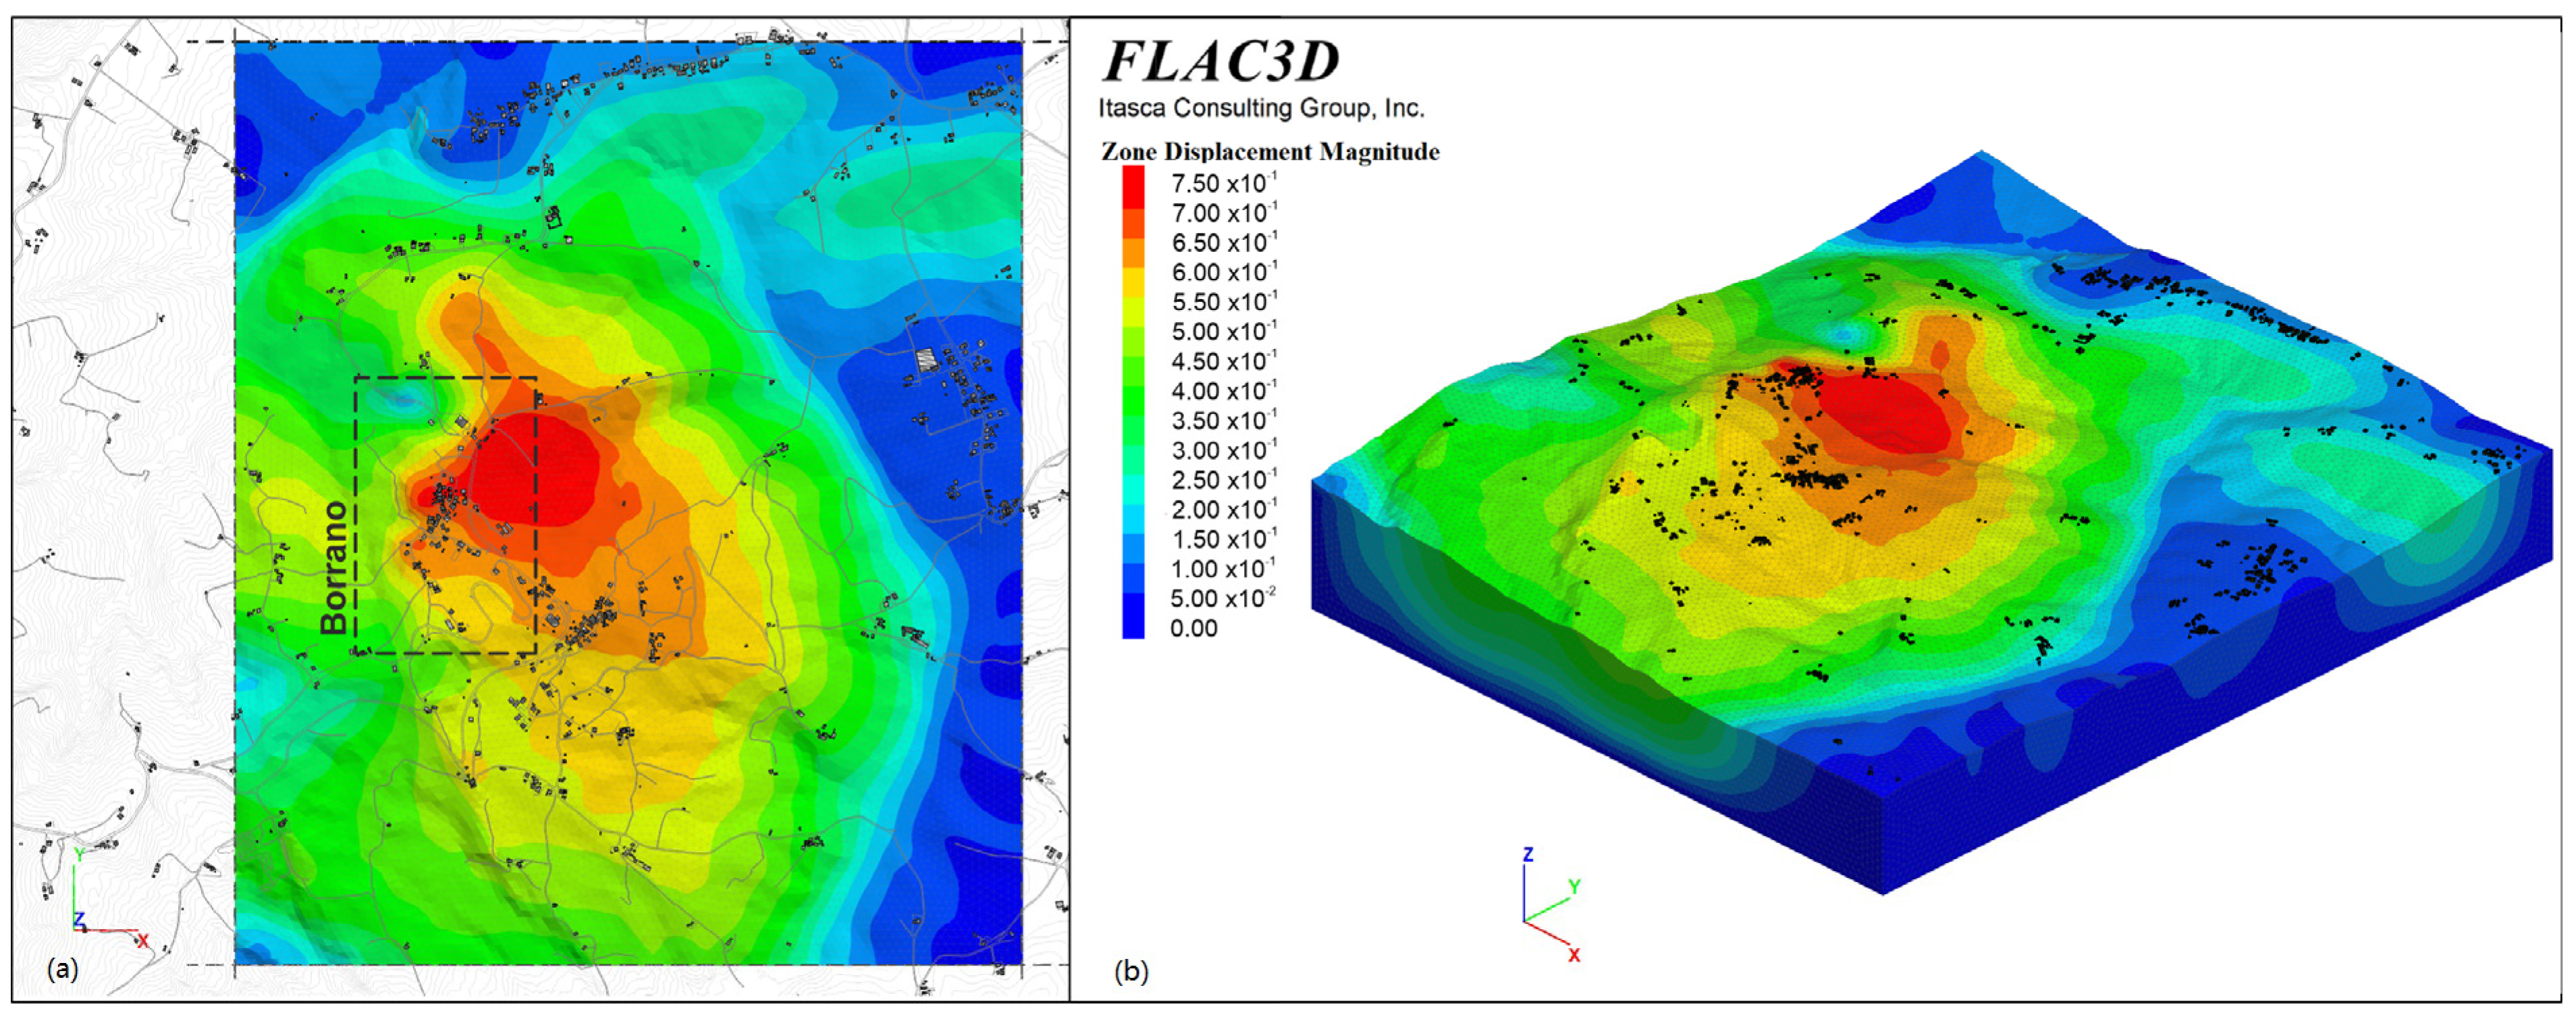
Figure 15 shows the distribution of total displacements within the study area.
Figure 15a shows a planimetric view with maximum displacements (red colour), equal to 0.75 m, concentrated in the central part. This area, which coincides with the Borrano settlement, represents the critical zone of movement, followed by a progressive reduction in deformation values towards the peripheral areas. The three-dimensional isometric representation (
Figure 15b) allows us to appreciate the plano-altimetric profile and the spatial distribution of the displacements, confirming that the central area is subject to the greatest deformations, while the values gradually decrease towards the outside.
4. Discussion
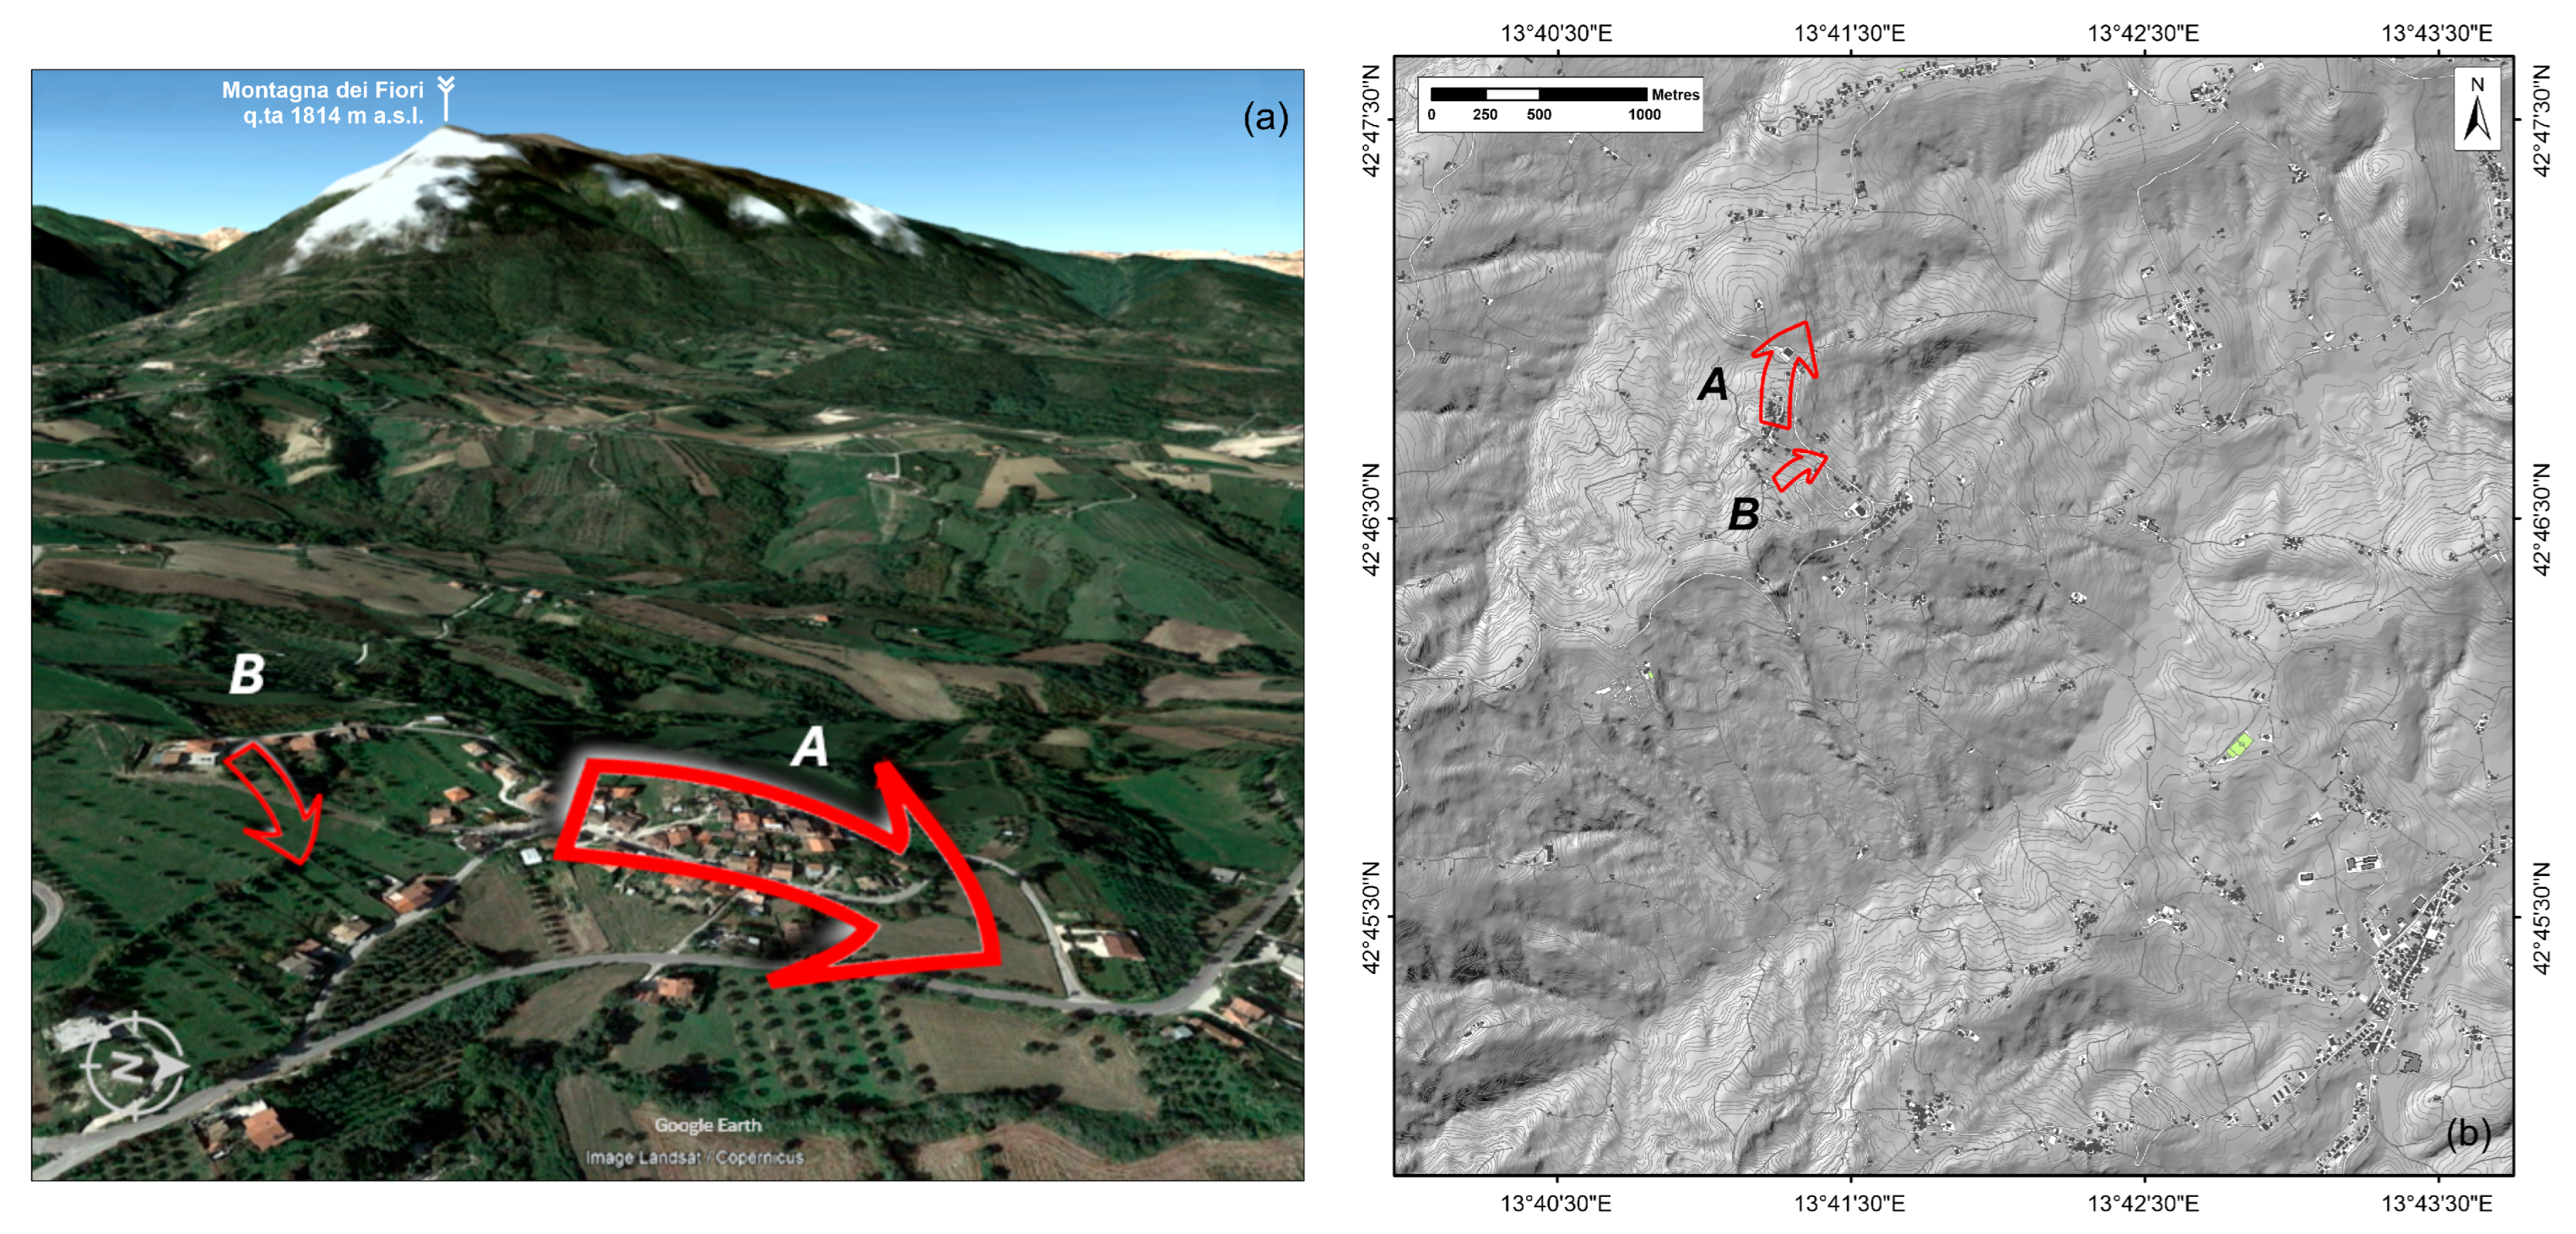
This paper analyses the results of a study carried out in the Borrano area, which is affected by the phenomenon of deep gravitational slope deformation (DsGSD). These deformations represent a complex and relevant issue for hydrogeological risk management, since they develop through slow but continuous movements over time, involving large volumes of soil. The causes of these phenomena, in the specific case of Borrano, are due to a combination of geological, structural and hydrogeological factors, amplified by the action of natural events such as heavy rainfall and earthquakes. This study has been carried out using a multidisciplinary approach, integrating geotechnical monitoring technologies with two- and three-dimensional numerical analyses to understand the processes taking place and their evolution at different scales. The Borrano settlement is at the centre of the movement, making it a critical area for urban planning and the safety of existing buildings. Two main landslide areas can be identified (
Figure 16):
The first (
Figure 16a(A)), much more extensive, affects a large part of the territory. The sliding depth is variable, exceeding 45–55 metres, and the movement follows a north–north-east direction.
The second (
Figure 16a(B)) is located in the southernmost part of the settlement, with a maximum sliding depth of approximately 8–9 m and a predominantly eastward direction of movement. It involves the shallowest and most permeable part of the soil and is mainly influenced by meteoric precipitation.
The critical areas are associated with the presence of deep planes of weakness in the substrate, which facilitate movement along inclined surfaces, especially when significant water circulation is present. These slip planes are associated with the contact zones between the clayey–marly facies, which is characterized by low shear strength and high deformability, and the arenaceous facies, which has greater rigidity and strength. The contrast between the mechanical properties of these lithological units creates structural discontinuities which, under the action of gravity and interstitial pore pressure, create preferential surfaces for the development of movements and deformations. The integration of different methodologies highlights the crucial role of the planes of weakness, mainly oriented in the north–north-east direction. Furthermore, the numerical simulations showed a high correlation with the field monitoring data, confirming the hypothesis that structural discontinuities, amplified by water infiltration, play a key role in the progression of gravity movements. Despite the high level of accuracy achieved, this study also highlighted some critical issues that require further investigation. The geotechnical parameters used in the two- and three-dimensional numerical analyses were validated by numerous laboratory and in situ tests. However, some data were estimated, especially those related to the weakening planes, which require a more detailed analysis. We therefore plan to carry out a detailed sensitivity analysis to assess the influence of the uncertainties of these parameters on the response of the model. Another aspect that deserves further investigation is the refinement of interstitial pressure distribution models, since hydrological conditions have a significant influence on the mechanical response of materials. This approach will make it possible to quantify the variability of the results and thus provide a solid basis for optimizing and validating the numerical model adopted. Furthermore, the integration of advanced geophysical investigations could significantly improve the spatial resolution of the landslide area, allowing a more detailed characterization of the sliding surfaces and zones of weakness at great depths. Techniques such as electrical resistivity tomography (ERT) and seismic refraction can potentially provide high-resolution maps of the subsurface [
69,
70,
71]. ERT investigations are useful for mapping heterogeneous lithological structures [
72], interstitial pressure variations and water preferential infiltration pathways, which are key factors in reducing shear strength and triggering slope movements. This would be particularly useful for improving the prediction of instabilities, which are often more difficult to model due to their high sensitivity to environmental conditions and local parameters.


 ,
, 


