Abstract
Accurate data collection and time series creation are crucial for understanding these changes. However, many areas lack reliable data due to geopolitical issues and government permissions. Urgent action is needed for sustainable water management. This study uses Gravity Recovery and Climate Experiment (GRACE) data to analyze monthly fluctuations in groundwater storage in the Missan region of Iraq from January 2022 to December 2023, using Goddard Space Flight Center (GSFC) mascon, Jet Propulsion Laboratory Downscaled (JPL_D), and Catchment Land Surface Model (CLSM). This study revealed the variability in GWS over the area using RS data and in integration with available monitoring wells. To investigate GWS variability, GSFC, JPL_D, and CLSM observed a downward trend in GWS in 2022; GSFC exhibits the highest negative groundwater trend, while CLSM has the lowest negative trend. Then, from January to June 2023, GSFC had the highest positive trend, while CLSM had the lowest positive trend. Most of the study period has a negative trend for remote sensing that matches the monitoring well data in situ, in which wells 1, 2, and 4 are negative trends of the study period. In conclusion, these results improve the role of remote sensing in groundwater monitoring in small-scale region unconfined aquifers, which supports decision-making in water resource management. The findings illustrated a match between the results derived from the GRACE data and monitoring well data.
1. Introduction
Due to dryness and a lack of winter precipitation, the Middle East—including Iraq—needs immediate groundwater investment to meet the region’s diminishing surface water consumption [1,2]. The escalating demand for water due to rapid population development and recurrent droughts has worsened this problem in recent years [3]. The Gravity Recovery and Climate Experiment (GRACE) mission monitors fluctuation in groundwater globally and follows the distribution of mass and terrestrial water storage (TWS). It was able to precisely detect changes in the amount of groundwater stored due to variations in groundwater levels in large aquifers [4]. Analysis of data obtained from an object using remote sensing (RS) is an effective method [5,6] and very beneficial for simulating various hydrological processes [7,8].
The evaluation of groundwater availability is significantly reliant on groundwater monitoring. Local wells represent a reliable source for groundwater monitoring globally. Nevertheless, insufficient tracking of well systems renders groundwater monitoring less dependable. Due to a lack of monitoring of well networks on a regional or even a local level, it is challenging to comprehend the extent of groundwater pumping and its seasonal fluctuation. The uneven distribution and irregular monitoring of groundwater wells pose significant obstacles to groundwater simulation. Using the data from the water balance elements and GRACE, a new processing approach was implemented in the California Central Valley and in Wadi Ranyah in southwest Saudi Arabia to extract groundwater storage (GWS) changes. The results showed that between Apr 2002 and Dec 2021, groundwater depletion totaled 31 ± 3 cubic kilometers. The groundwater resource fluctuation was predicted to be 3.85 ± 0.15 mm per year [4,9]. Investigating large-scale GWS variations is made possible by increasingly using two cutting-edge strategies to overcome the lack of well measurements: satellite-based RS and global model simulation [10,11,12]. The mascon solutions are ready-to-use maps of equivalent water elevations, which can be used directly without post-processing.
However, GRACE measurements have limitations, such as limited spatial resolution and leakage errors [10]. Despite specific resolution limitations, various studies have demonstrated GRACE’s ability to monitor groundwater storage in smaller watersheds [13]. Studies focused on evaluating GRACE and Global Land Data Assimilation System (GLDAS) products to estimate the groundwater storage change in the Emirate of Abu Dhabi from 2006 to 2010. The results showed remarkable agreement with field data obtained from monitoring wells. Moreover, the Mann–Kendall trend and Sen slope analyses confirmed a significant downward trend in groundwater storage during the studied period [13].
Using [14] the latest hydro-climate modeling techniques and GRACE satellite data analysis using artificial neural network techniques—backpropagation algorithm—we revealed new details about the groundwater behavior in the basin. In addition, the results showed an overall decrease in GRACE-GWS across the basin, with the highest rate of water depletion recorded in March 2011. Managing water resources globally is urgently challenged by climate change [15]. Ground subsidence is a dangerous natural and geological risk [16]. The study [17] revealed that the groundwater level (GWL) in the Saq aquifer in Jordan and Saudi Arabia is declining at an alarming rate (−7 ± 0.3 mm/year), and this decline in GWL is largely attributed to the increasing exploitation of GW for intensive agricultural irrigation. Furthermore, there is a decline in water levels in the wells working as local water sources. The study [18] assessed the GRACE-TWS in monitoring groundwater-level variations in Iran. The Mann–Kendall test findings and Sen’s slope estimator indicated a declining trend at a significance level of 0.05, with a correlation value of 0.57, from 2002 to 2016, by using monthly GWL 144 monitoring wells. The estimate obtained from GRACE has been suggested for utilization in zones lacking enough monitoring well data of sufficient reliability. The study [19] highlighted the significance of considering multisource datasets to constrain the uncertainties in calculating GWS variability and contrasted GWS changes in the US’s main aquifers as determined by GRACE, models, and well measurements. For more logical region groundwater administration, multisource datasets must be integrated into GWS estimation through enhanced data sources, model structure, and post-processing methods.
For issues involving hydrology, it is typically mentioned that the aquifer region cannot be smaller than the spatial precision of the GRACE findings, which is approximately 200,000 km2 for the mascon [20]. Nevertheless, despite the resolution constraints, several research investigations demonstrated that GRACE could detect basins smaller than this [21,22,23]. As an illustration, [24] illustrated good acceptance among terrestrial water storage change and simulations of hydrology in the Garonne river region in France, 50,000 km2. The study [25] illustrated that it was suitable for calculating GW depletion from GRACE data in Jordan across areas more than 1500 km2. The researcher [26] compared groundwater levels from in situ well data with GW levels based on the GRACE satellite data in integration with GLDAS models in Poland, and the findings illustrated that there is high consistency between the in situ well data and the GRACE satellite data. This demonstrated the appreciable accuracy of using GRACE-derived estimations of groundwater level variations at the local level in Iran for basins between 5000 and 20,000 km2; recent success of the application utilizing the GRACE data can largely be attributed to improvement in algorithms that involve data processing. In particular, the creation of global equal area mascon products has minimized leakage error in the land–ocean divide and raised the Signal-to-Noise Ratio (SNR), thereby increasing their applicability at the regional level [27].
Another study [28] implemented a distributed ArcGIS model using gridded datasets to calculate water storage across the Middle East and North Africa. This assessment was made possible by estimating an aquifer’s saturated thickness and effective porosity. In addition, changes in GWS between 2003 and 2014 were measured using land surface parameters (GLDAS) and monthly data for the GRACE. Within the scientific literature on downscaling, numerous statistical techniques have been employed and assessed. Among these are Markov chains, statistical regression methods, strategies for correlating relationships, and techniques based on classes [29]. GRACE data analysis has extensively used advanced machine learning techniques, including random forests and neural networks, to increase prediction accuracy [29]. Statistical methods depend on large datasets and make the assumption that noted data and small-scale information accurately describe system dynamics [29]. Various research has utilized GRACE data and the Google Earth Engine (GEE) platform to estimate the GWS variate [30,31]. GEE, a website for handling massive data from satellites, is becoming increasingly well known as an interdisciplinary tool with many uses in many academic domains [31]. In recent years, multiple machine learning techniques, such as random forests and artificial neural networks, have been utilized for downscaling GRACE data [29]. Ref. [32] employed Google Earth Engine computing in the cloud which integrated hydrological Famine Early Warning Systems Network Land Data Assimilation System (FLDAS) models to analyze groundwater dynamics within the suitable areas for groundwater recharge zones in Brazil from 2014 to 2017. Groundwater storage data can be obtained using GEE [33]. Utilizing MODIS results and Soil Moisture Active Passive (SMAP) products, the study [34] estimated SM at a depth of one kilometer over Africa using Google Earth Engine random forest regression. The findings demonstrate that the suggested approach in GEE allows precise SM estimation at a greater spatial resolution throughout the continent.
This study assessed groundwater storage based on remote sensing data in monitoring temporal and spatial variations at the aquifer scale level. Due to the scarcity of monitoring well data and the absence of long-term or regular time series, this study aims to use in situ well data to formulate resilient management strategies for these essential resources in the context of changing climates and escalating human activities. This study utilizes RS data and monitoring in situ data to highlight the dynamic variations in groundwater storage in the Missan Governorate. By selecting an area with a scarcity of data, this paper seeks to understand how this scarcity affects the results.
These results have allowed us to use GRACE-GSFC gravity data to predict GWS variation in data scarcity and drought to monitor aquifers from expected depletion and ensure water security. This methodology is a method that can be embraced in future studies.
2. Materials and Methods
2.1. Study Area
The Missan Governorate lies in the southern part of Iraq, approximately 400 kilometers south of the capital, Baghdad, and its area is estimated at 3000 square kilometers [35]. The location of this study is between longitude (46°30′–47°30′) E and latitude (32°0′–33°0′) N, as shown in Figure 1. The study area involves the Northeastern Part of Missan (NPM); it extends along the Iraq–Iran border and is distinguished by shallow anticlinal folds separated by synclinal valleys [36]. The ground’s surface height varies from 5 to 270 m above mean sea level (m.a.s.l), as shown in Figure 2. The changing climate significantly impacts hydrological dynamics [37].
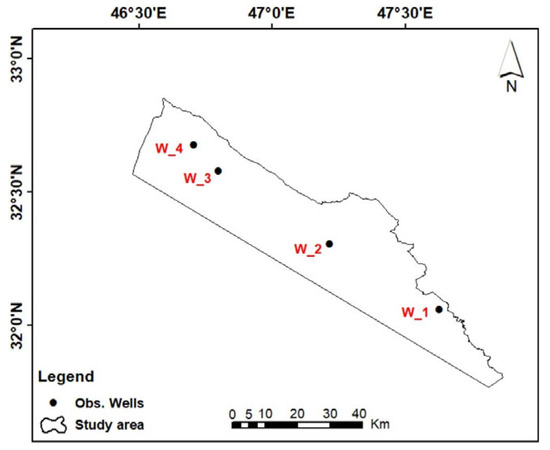
Figure 1.
Distribution of the observation wells in the NPM.

Figure 2.
Elevation map of the NPM.
The groundwater aquifer system in the interest area consists of two different hydrogeological units. Most of the study area is located in the easternmost part of the stable shelf, known as the Mesopotamian Zone [38]. The first unit is a shallow, unconfined aquifer. The alluvium aquifer, water-bearing strata consists of sand and gravel with clay and silt layers. This unit lies within the Quaternary sedimentary formations [39]. The second aquifer is the Mukdadiya water-bearing layer, which is either confined or semi-confined. Groundwater depth in this area varies between 26 and 162 m. The average annual rainfall is about 210 mm per year [40]. For the unconfined aquifer, the specific yield is 0.25 [41]. There are four groundwater monitoring wells, as illustrated in Figure 1.
2.2. Data Sources
Remote sensing technology represented by GRACE data was applied to detect variations in groundwater storage within the study area characterized by scarcity of in situ data. These GRACE data were obtained from several platforms, using statistical analysis to verify the results.
Estimates of monthly changes in groundwater levels through Jan 2022 and Dec 2023 in the studied aquifers were based on data collected from four sources, as shown in Table 1.

Table 1.
Data source used.
The first source, the monthly (GWL) data measured by four unconfined wells (the first unit; alluvium aquifer), was obtained by the General Authority for Groundwater in Iraq. These are unpublished data, as shown in Figure 3. The available data used in this study is the short-term time series from January 2022 to December 2023, after excluding missing data. Each well was monitored at different times; their depths were 72, 36, 50, and 66 m for wells W_1, W_2, W_3, and W_4, respectively. The best location for wells is significantly determined by the parameters of the aquifer’s depth, thickness, and permeability [42] and the location’s terrain [43].
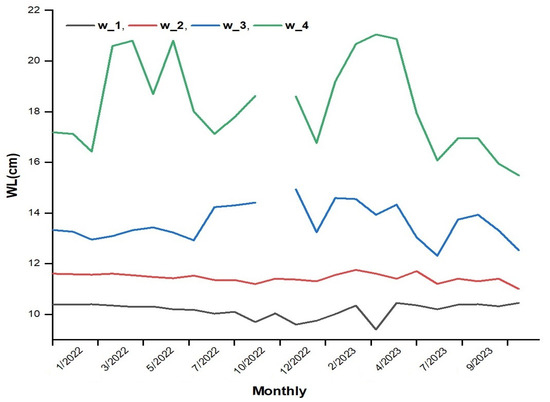
Figure 3.
Water level in the NPM’s monitoring wells.
Second, the monthly TWS was based on the GRACE mascon solutions processed by the GSFC, with spatial resolution of 0.5 × 0.5 degrees and totaling 24 months of GRACE-TWS estimates [44]. GWS estimates based on GRACE satellite data were computed by subtracting non-groundwater storage components (e.g., canopy water (CW), surface water (SW), soil moisture (SM), and snow water (SW)) [45] from TWS based on the same period [46,47] GRACE analyzes vertically integrating mass variations, including data from shallower and deeper aquifers [48]. In this study, soil moisture storage at depths ranging from 0 to 2 m in the area of interest was obtained monthly utilizing the GLDAS model NOAH025_Mv2.1 dataset with a resolution of 0.25 degrees and temporal resolution.
The third source, [49] GRACE data, were incorporated into a CLSM to create models of GWS variations. The CLSM model represents a significant development in land surface modelling, as it overcomes some of the limitations associated with traditional models. It provides a digital representation of land–atmosphere interactions and allows for simulating climate changes [50]. It is physically based to simulate the dynamics of shallow stored groundwater below 2 m of bedrock. On the other hand, it ignores the effects of anthropogenic activities such as pumping and thus reflects natural variability in GWS within the aquifer [50].
GWS data obtained from the (CLSM025_DA1_D v2.2) are currently in a daily format with a spatial resolution of 0.25 degrees by 0.25 degrees and available in Net-CDF format. The GWS data are being aggregated into a monthly format.
Finally, this study used GEE technology for processing GRACE-JPL mascon data dependent on machine learning to downscale the spatial resolution from 55,660 m to 10,000 m using JavaScript.
Precipitation data from the Global Precipitation Measurement (GPM) and Gauge Precipitation Climatology Project (GPCP) [45], temperature data from the AIRS source with the monthly temporal resolution, and unpublished Amount of Evaporation (ET) data from the Agricultural Meteorology Center of the Iraqi Ministry of Agriculture were used. The data utilized in the study are shown in Table 2.
Table 2.
Summary of the datasets utilized in this study.
2.3. Methodology
Based on the importance of monitoring the variation in groundwater storage discussed earlier, several data sources of the GWS were chosen to analyze the dynamic variation. To estimate monthly GWS variations from four sources, the vertical analysis utilized the GRACE TWS, the outputs of the Catchment Land Surface Model (CLSM), the WaterGAP Global Hydrology Model (WGHM) simulations, and, finally, in situ well observations. From 2005 to 2016, the provinces in which 18 aquifers are located were utilized for the analysis in China [51]. Most research assesses the accuracy of the downscaled GWS by contrasting its time series with that of GWL or GWS obtained from in situ data [52,53]. The Jet Propulsion Laboratory’s (JPL) GRACE data mascon solutions have a native spatial resolution of 300 km = 3 degrees [54]. To retrieve missing data from GRACE as a result of post-processing, the mascon was multiplied by the scaling factor in the 0.5 degree spatial resolution [55]; due to neighboring pixels so dependent on one another, scaling factors are not anticipated to downscale GRACE TWS data [55] effectively. The GEE, a free source online, offers multiple types of satellite imagery and geospatial datasets in its data catalogs. This system’s virtue is that there is no requirement to download data.
Meanwhile, there is no need to modify the data geometrically or radiometrically [30]. This study estimated groundwater storage derived from GRACE satellite data from the GEE system. The GEE system contains all commands and programming codes accessible and prepared for processing [56]. From processing GRACE_JPL monthly mass grids version 03—global mascon (CRI Filtered), the data are available from March 2002 to March 2024, and the FLDAS is available from Jan 1982 to present.
The final finding is raster form; after that, GWS raster data are converted to ArcGIS 10.8 to create time series for the study area using a spatial toolbox for January 2022–December 2023. The principal components of GRACE TWS (SMS, CWS, SWE, SWS, and GWS) are used to estimate GWS_GSFC, after applying Equation (1); the elements such as canopy water storage and surface water storage did not show significant effects, as their mean values were close to zero. Therefore, it was ignored. Also, the study area does not have snow water equivalent depth. In Figure 4, a flowchart illustrates the method utilized to estimate GWS_GSFC.
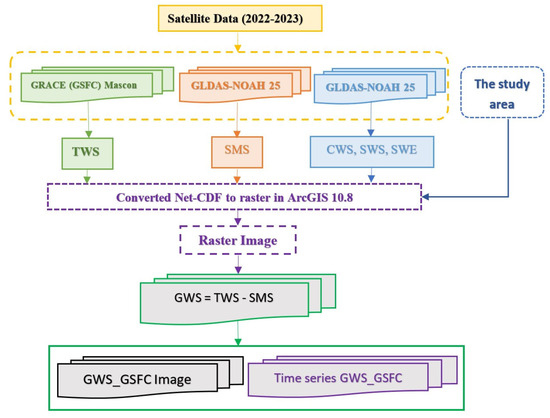
Figure 4.
Estimating GWS_GSFC from January 2022 to December 2023.
GWS, TWS, SMS, CWS, SWE, and SWS refer to groundwater storage, terrestrial water storage, soil moisture storage, canopy water storage, snow water equivalent, and surface water storage, respectively.
For creating a time series for the monitoring wells, the average groundwater level was calculated and then multiplied by a given yield to obtain the GWS, as shown in Equation (2) [57].
where GWS, GWL, and are groundwater storage, groundwater level, and the specific yield, respectively.
Additionally, all monthly time series created from multiple sources of data in this study were plotted, and statistical analyses were performed utilizing the Origin 2019B program.
A variety of regression algorithms can be used to address downscaling, which is the process of improving the spatial resolution of satellite TWS data [58]. Random Forest regression (RFR) is known to be an effective machine learning (ML) method [59]. In this framework, GRACE TWS observations (0.5° degree) were integrated with FLDAS soil moisture variables and MODIS land cover data for spatial downscaling. Key processing steps are described in the following sections.
Data acquisition:
GRACE data (NASA/GRACE/MASS_GRIDS_V03/MASCON_CRI) provided monthly water equivalent thickness from January 2022–December 2023. The FLDAS/NOAH01 dataset contributed soil moisture profiles 0–200 cm depth, precipitation, and SWE. The MODIS MCD12Q1 land cover classification served as static auxiliary data.
Temporal alignment:
An internal join operating synchronized image pairs utilizing date metadata, ensuring temporal constancy between GRACE and FLDAS collections.
Spatial Downscaling:
- A machine learning approach utilizing these items:
- Stratified sampling of GRACE’s TWS values.
- Random Forest regression trained on FLDAS predictors:
- Soil moisture profiles four layers, precipitation, SWE, and land cover classification.
3. Results and Discussion
These results reveal significant trends in the groundwater balance (GWS), with high negative values in GSFC and JPL_D at −18.14 cm and −11.74 cm, respectively, as shown in Table 3, reflecting the clear impact of groundwater overexploitation and climate change. In contrast, CLSM shows lower depletion rates, which may be attributed to differences in the models used or the spatial resolution of GRACE data, as pointed out by [60], and a prolonged dry spell with less precipitation [61]. In contrast, CLSM had a minimal GWS deficit of −4.40 cm. Nevertheless, GSFC, JPL_D, and CLSM had the highest GWS surplus, measuring 5.94 cm, 3.45 cm, and 2.74 cm, respectively. The mean results exhibit a negative trend, suggesting that the GWS is declining alarmingly. The greatest temporal variability was observed in the GSFC and JPL_D, with standard deviations of 7.29 and 3.76, respectively. The least variable was CLSM, which had a standard deviation of 2.02.
Table 3.
GRACE data’s fundamental statistical parameters.
According to the GRACE data histograms, shown in Figure 5, the probability distributions of the GRACE data are either normal or tend to be normal. Skewness values for GSFC and CLSM are minimal (−0.5 < skewness < 0.5), which supports this JPL_D; on the other hand, JPL_D shows a value > 0.5, indicating a slightly positively skewed distribution. Furthermore, all Kurtosis numbers are modest (<3) and negative, suggesting a Platykurtic distribution with light tails or no outliers.
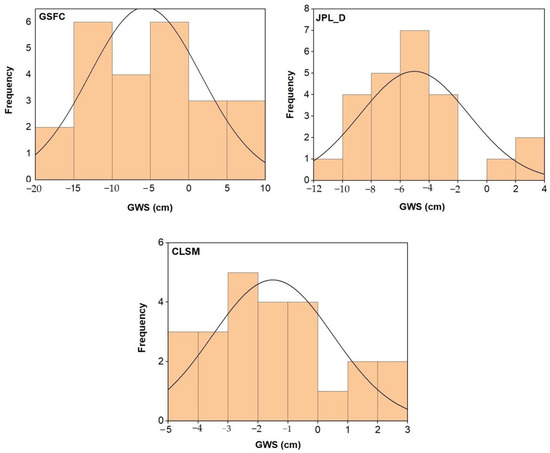
Figure 5.
Data histograms from GRACE.
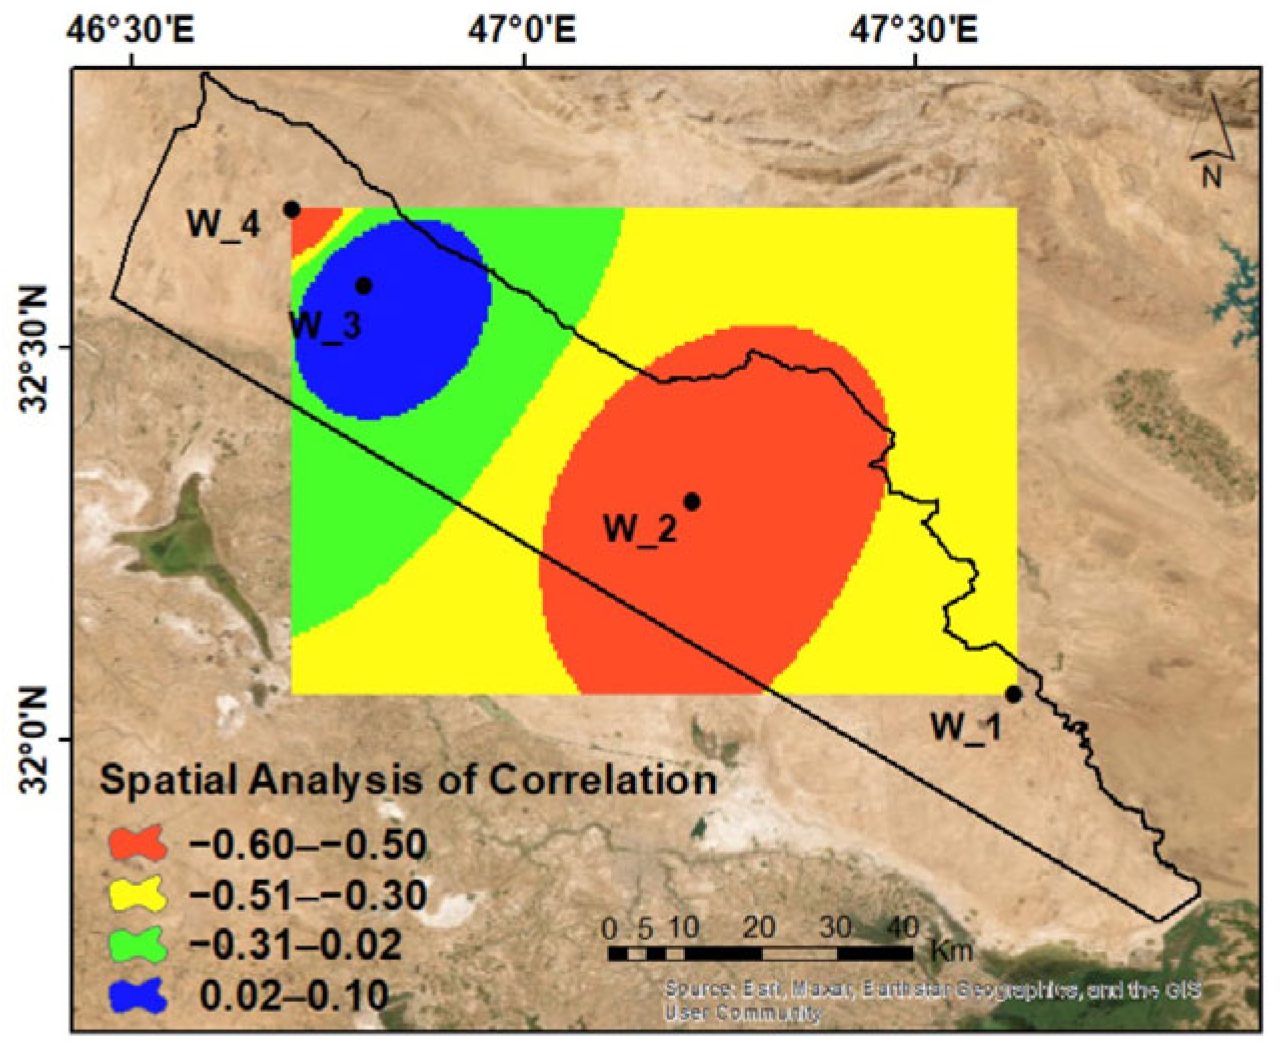
In addition, the analysis of temporal variability indicates that depletion rates are not constant but rather subject to seasonal variations influenced by rainfall and natural recharge. This is consistent with the results of the Pearson correlation, which showed a strong negative correlation in some wells, confirming the close relationship between withdrawal rates and climate change. The greatest decline was shown in GWS for W_4, W_2, and W_1, with −0.60, −0.50, and −0.30, respectively. Meanwhile, W_3 showed a slight increase of 0.10.
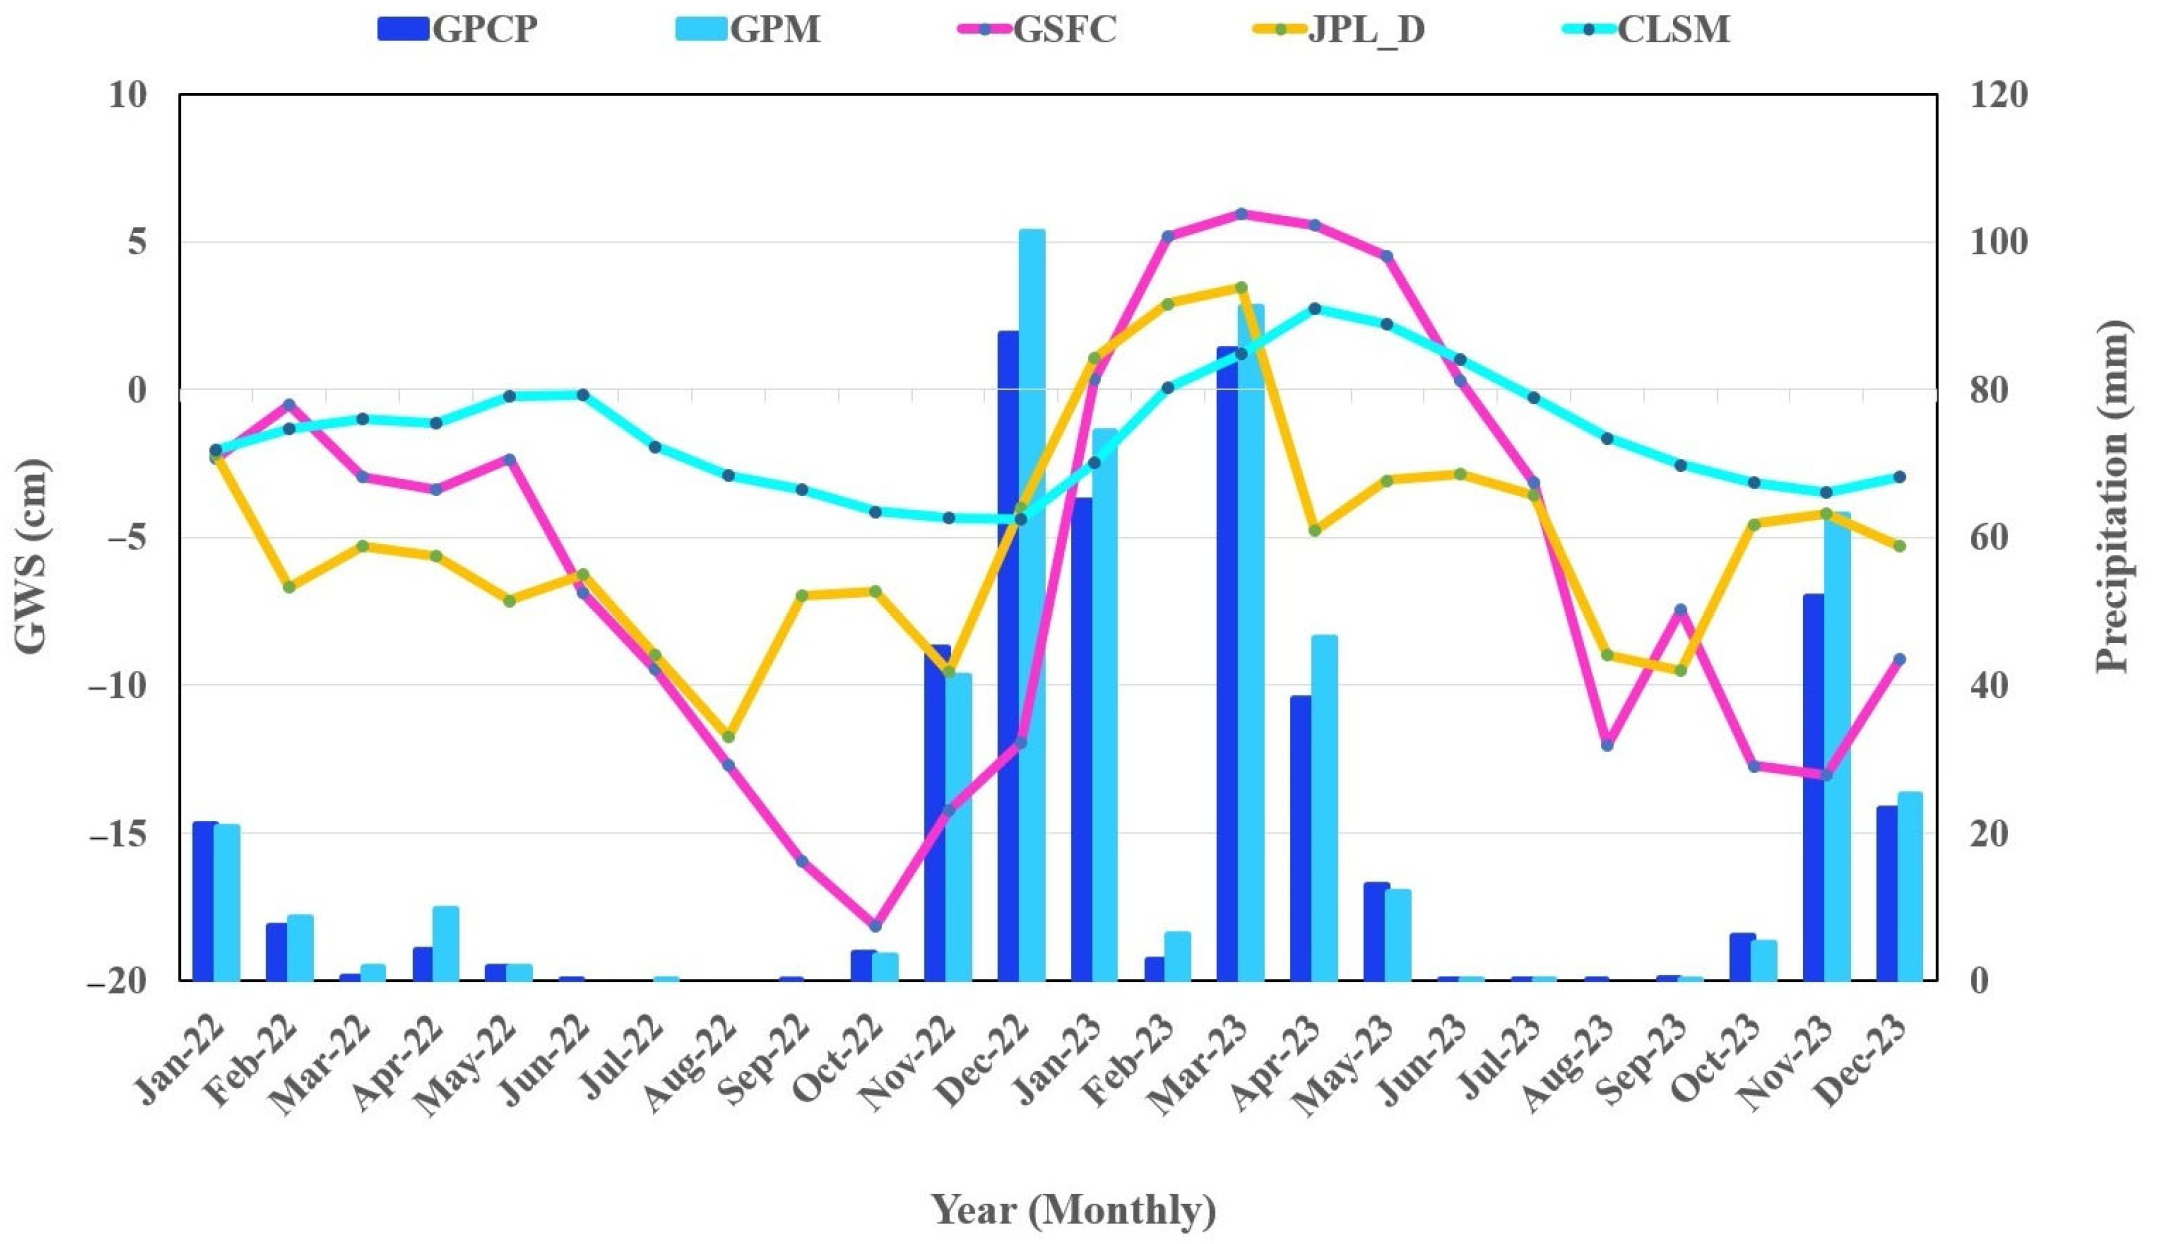
Figure 6 shows the GWS fluctuations from January 2022 to December 2023 in NPM, where monitoring wells and remote sensing data revealed a positive trend between January 2023 and June 2023. This trend appears to be consistent with the observed increase in rainfall during this period, which enhances groundwater recharge, according to [56].
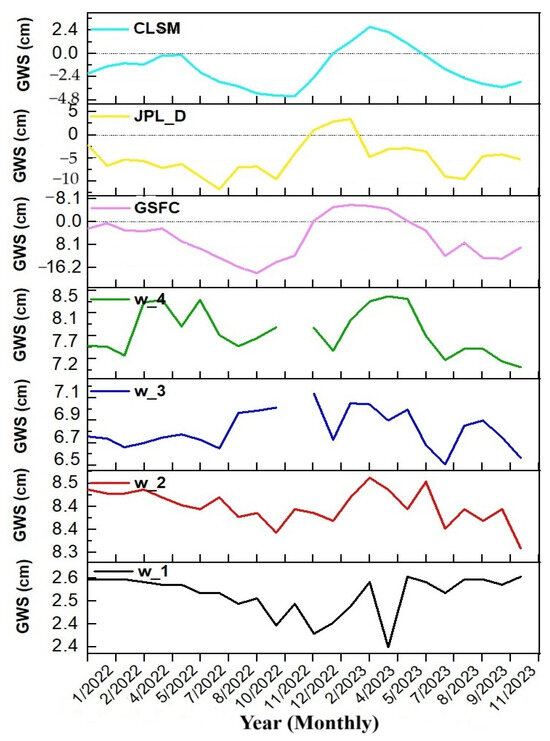
Figure 6.
Monthly time series of GWS based on various sources from Jan 2022 to Dec 2023 in the study area.
This agreement between the well data and satellite (RS) data indicates the accuracy of the models used to estimate the changes in GWS. However, understanding the sustainability of this positive trend requires considering other influencing factors, such as precipitation, temperature, and evaporation levels. In the next section, these factors will be analyzed in more detail to assess the ability of groundwater resources to recover in the long term.
The depletion rates of the W_4, W_2, and W_1 wells are higher in comparison to the W_3 well, as shown by the depletion trend of −5.10 × 10⁻⁴ ± 4.31 × 10⁻⁴, −8.22 × 10⁻⁵ ± 3.86 × 10⁻⁵, −1.66 × 10⁻⁵ ± 7.19 × 10⁻⁵, and 5.44 × 10⁻⁵ ± 1.74 × 10⁻⁴ cm per monthly, respectively. The average monthly negative trend is −1.39 × 10⁻⁴ ± 1.79 × 10⁻⁴ cm/monthly, while the yearly negative trend rate of GWS in these wells is −1.66 × 10⁻³ ± 2.13 × 10⁻³ cm/year. However, the RS data GSFC trend was more negative than that of the JPL_D and CLSM at −2.40 × 10⁻³ ± 7.21 × 10⁻³, which matches those submitted by [60,62]. The negative trend in the study area is closely associated with groundwater extraction rates that exceed recharge rates to support agricultural activities, threatening the sustainability of water resources.
On the other hand, the results showed that R2 of GWS for the monitoring wells are 0.62, 0.15, 0.46, and 0.24 for W_4, W_2, W_3, and W_1.
Nevertheless, the highest Pearson correlation of GWS was negative for the W_4, W_2, and W_1 wells compared to the W_3, at −0.60, −0.50, −0.30, and 0.10, respectively, as shown in Figure 7. In comparison, the RS data recorded the highest negative Pearson correlation for GSFC and JPL_D compared to the CLSM at −0.70, −0.50, and 0.20, respectively. Still, mascon solutions provide improved resolution for studies in small-scale locations [63]. The inhomogeneity of the aquifer’s geological structure is the reason for the poor correlation between the wells, and this differs depending on the region. When nearby private wells’ groundwater is extracted, in addition to the various depths of the four wells, these factors contribute to this weakness.

Figure 7.
Spatial analysis of correlation of the wells.
The observed negative correlations can be attributed to the increased groundwater consumption, where withdrawals exceeded recharge due to insufficient rainfall—the primary source of replenishment. Additionally, the studied wells are located in shallow aquifers rather than deep ones, making them more susceptible to depletion. Furthermore, the intensification of human activities in the region, driven by the scarcity of surface runoff, has exacerbated reliance on groundwater resources. Another key limitation is the small number of monitoring wells available for comparison with satellite data, all of which are situated in shallow aquifers with relatively short time series. These factors collectively contribute to the observed trends and highlight the challenges in assessing groundwater storage variations with limited in situ data, according to [64]. Ref. [65] clarified that the Euphrates River’s discharge has dropped by over 70% of its natural flow, causing the nation to over-rely on its groundwater supplies.
The results of the correlation analysis showed that GWS_GSFC has a strong negative Pearson correlation, a moderate negative Spearman correlation, and a weak negative (non-significant) Kendall correlation. Then, GWS_JPL_D has a moderate negative Pearson correlation and weak negative (non-significant) Spearman and Kendall correlations. Finally, GWS_CLSM has weak positive (non-significant) Pearson, Kendall, and Spearman correlations due to the exaggeration of GWS [66], as shown in Table 4.
Table 4.
GRACE data’s types of correlations.
However, Figure 8, Figure 9 and Figure 10 show GWS variations as an outcome of climate changes; the precipitation season was defined as the period from October to May of the following year. Overall, groundwater levels rise throughout the precipitation season, while levels decrease throughout the drought season. This indicates that precipitation is a vital component in groundwater recharge. GWS for the GSFC showed a positive trend from January to June 2023 had the highest positive trend due to precipitation recharging the aquifer in contrast to the remainder of the study period, which showed a negative trend.
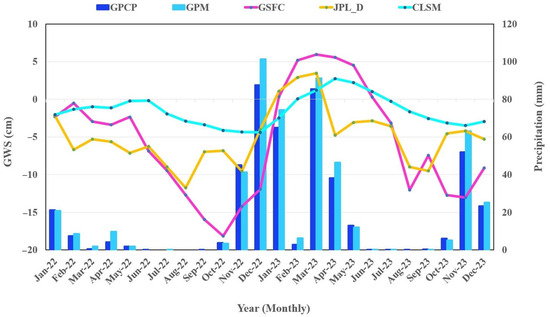
Figure 8.
Time series comparison of precipitation (GPCP and GPM) and GWS based on various sources between January 2022 and December 2023.
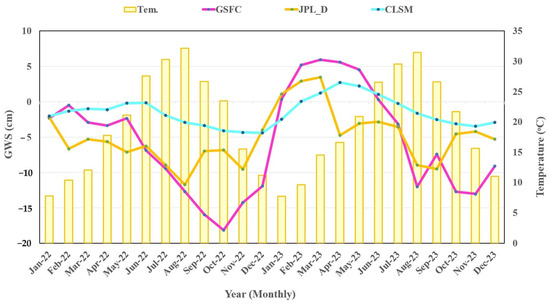
Figure 9.
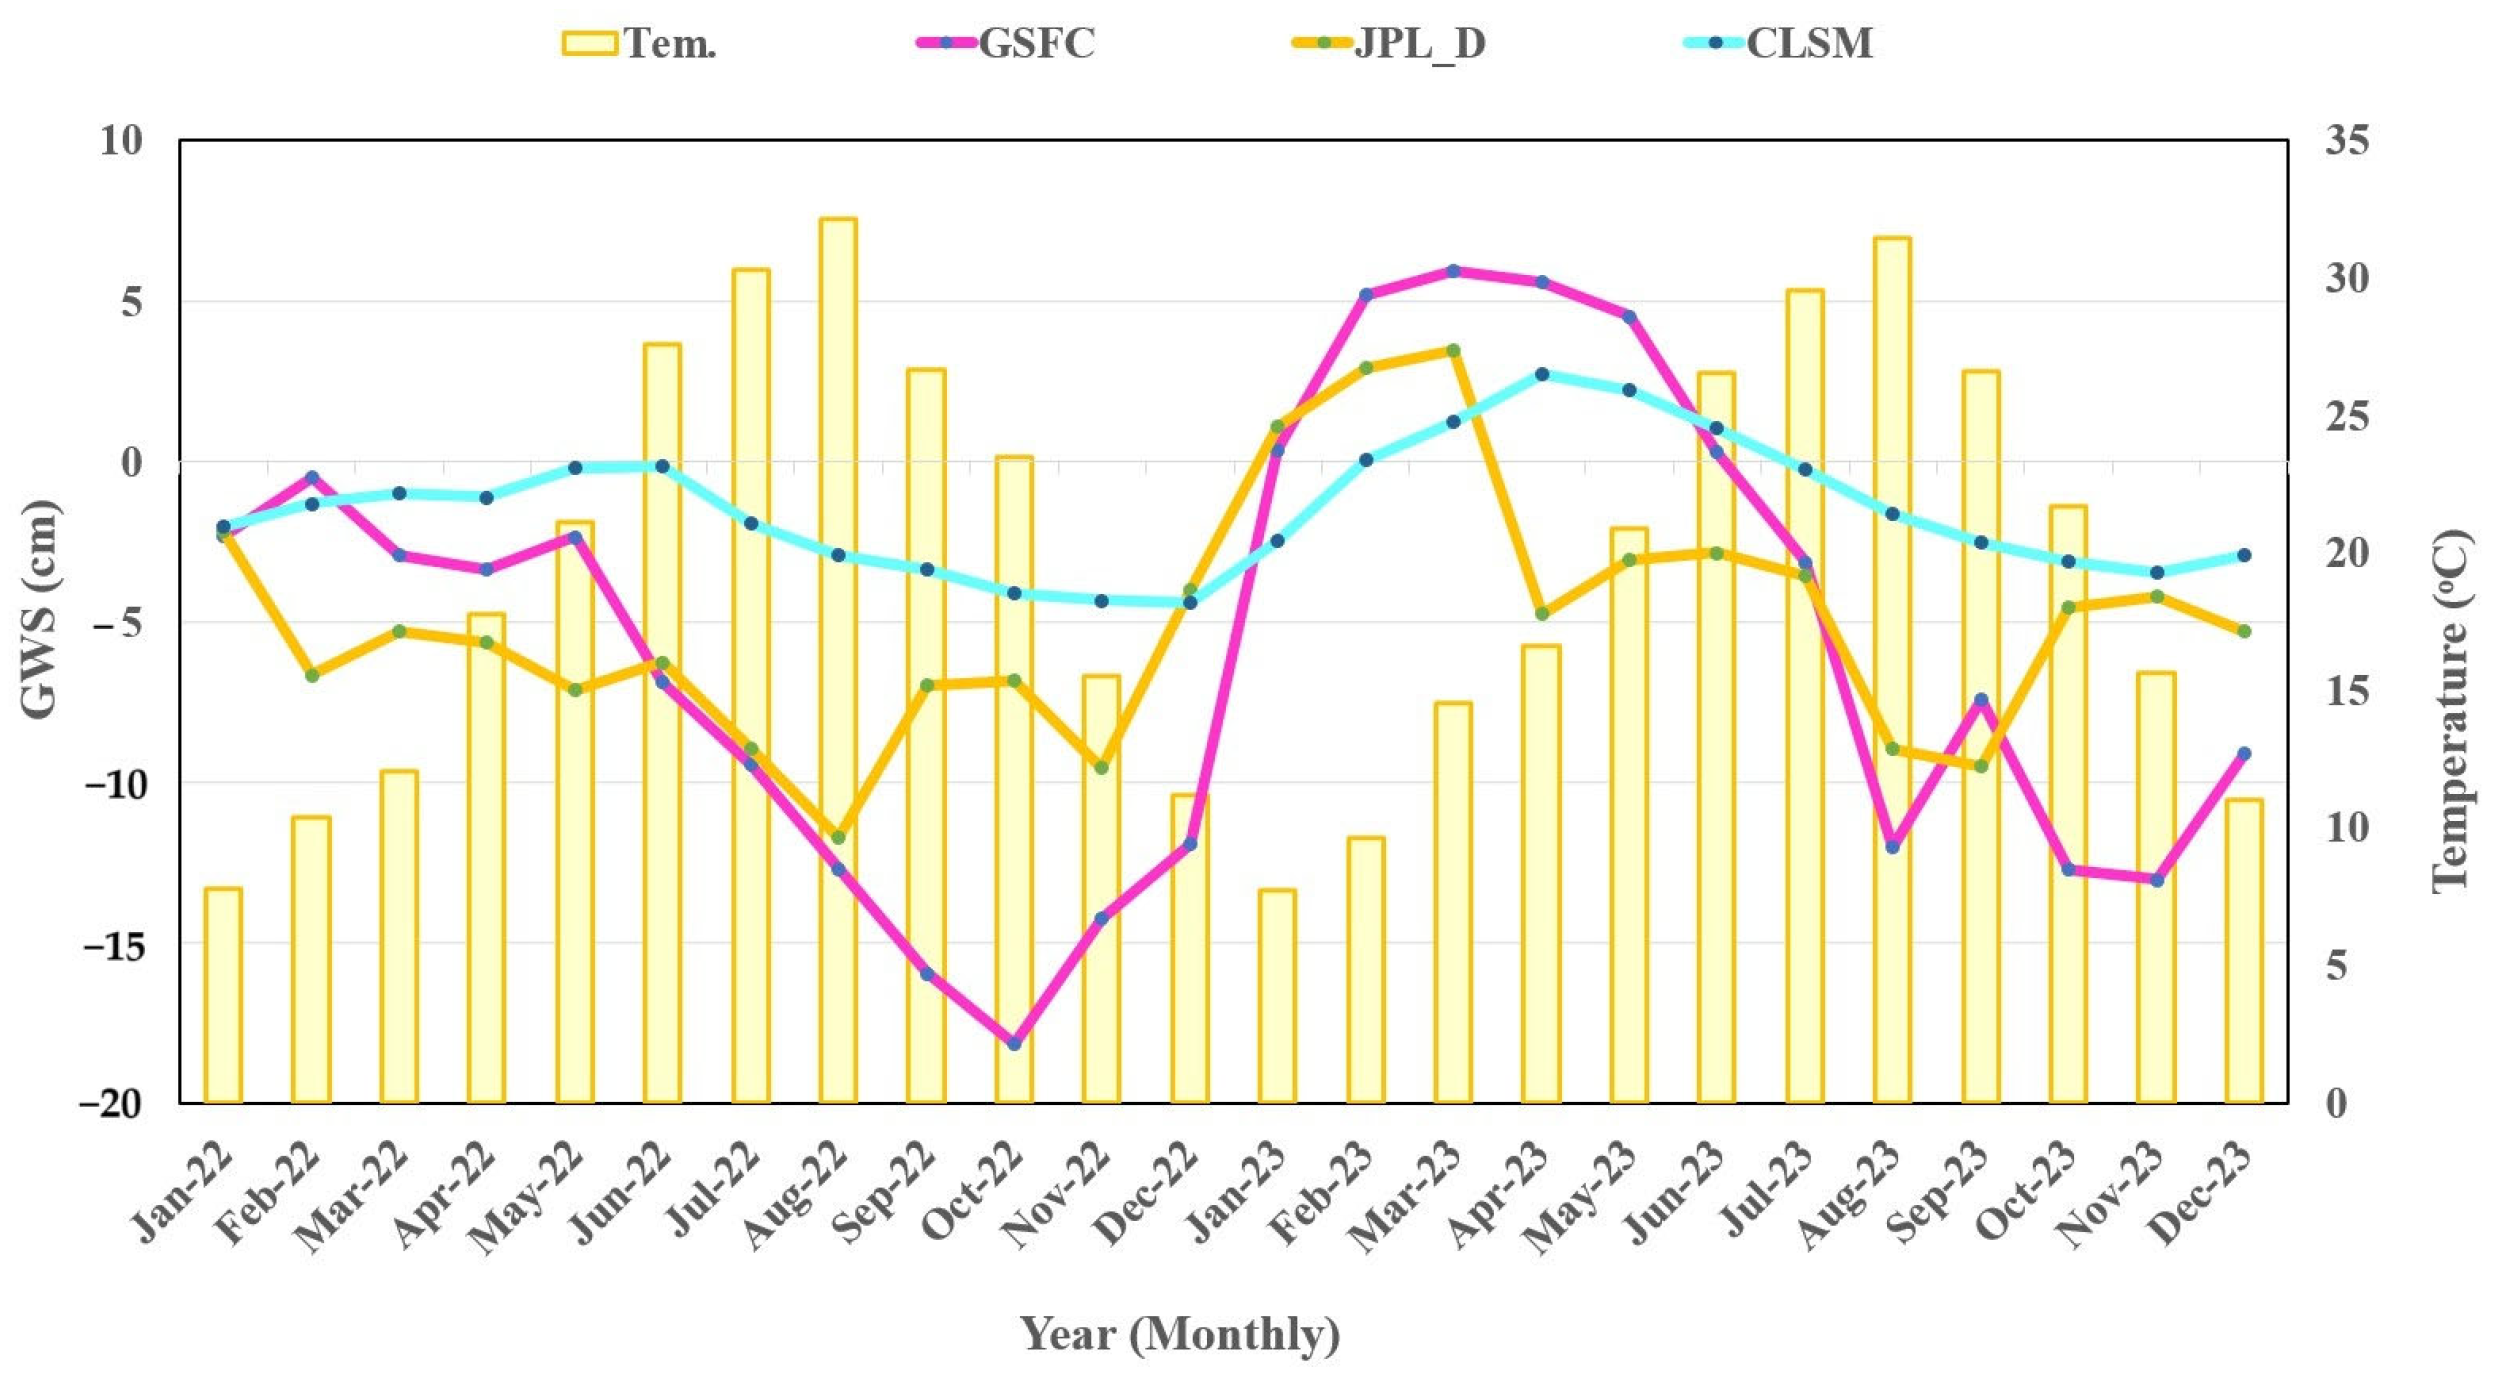
Time series comparison of temperature and GWS based on various sources between January 2022 and December 2023.
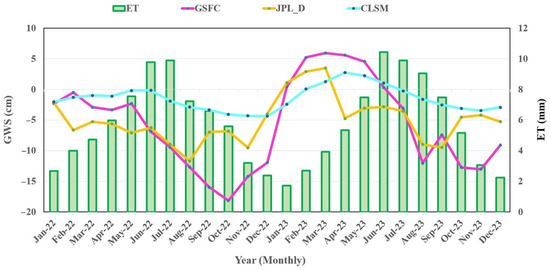
Figure 10.
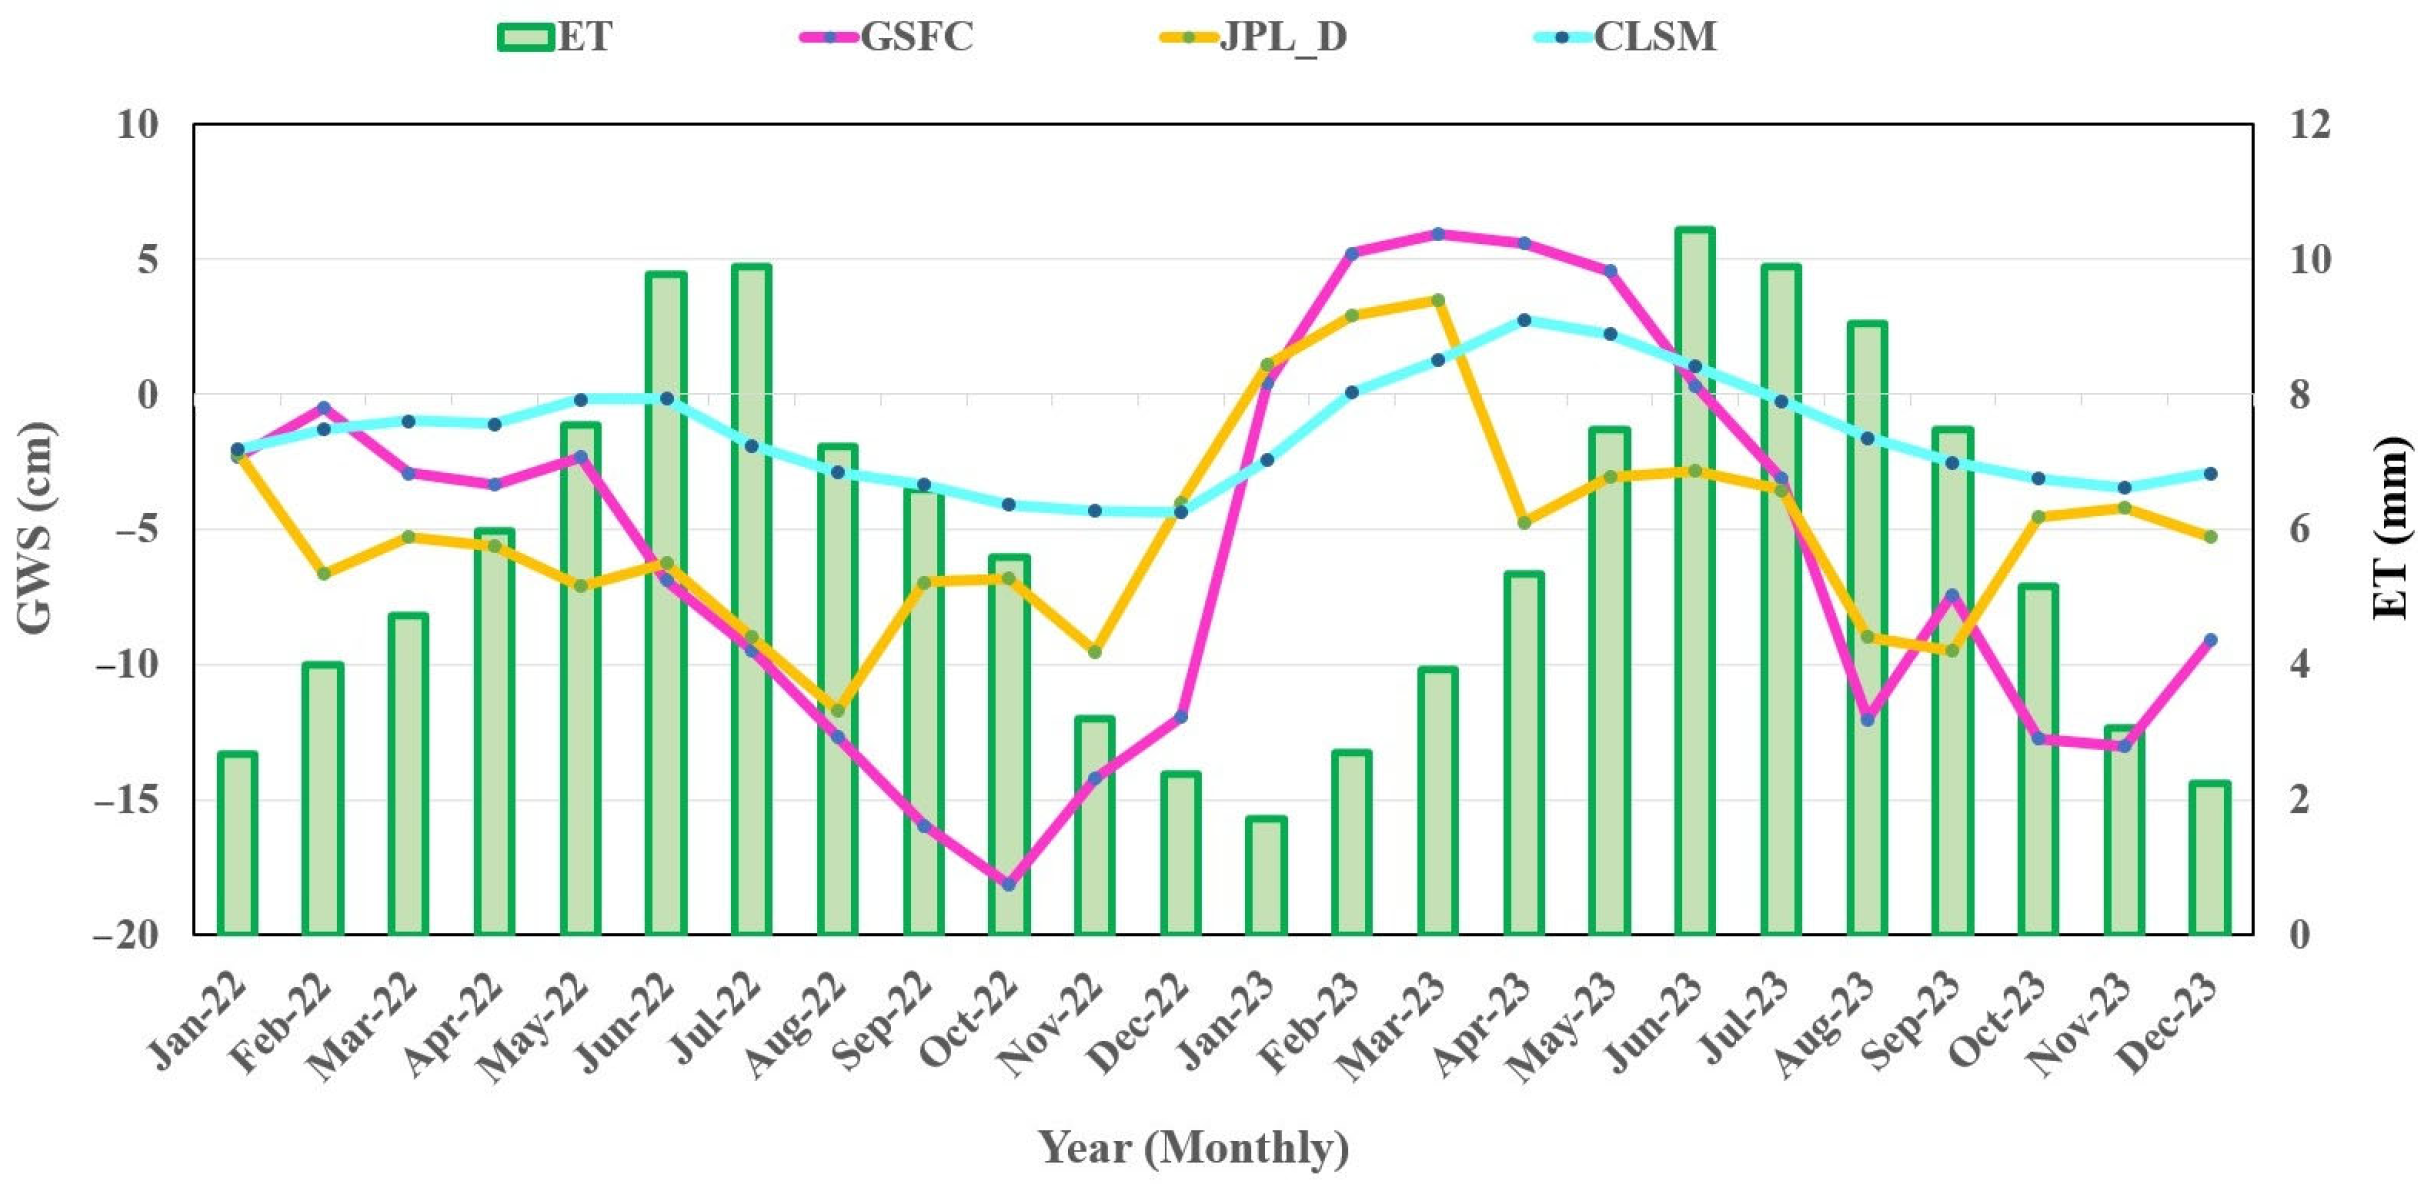
Time series comparison of ET and GWS based on various sources between January 2022 and December 2023.
While GWS for the JPL_D showed a positive trend from January to March 2023 had the highest positive trend due to precipitation, this was a negative trend compared to the rest of the research period. GWS for the CLSM showed a positive trend from Feb to July 2023 had the highest positive trend in contrast to the remainder of the study period.
Not all GWS curves based on RS follow a uniform pattern in response to rainfall due to the variation between the CLSM model and the GRACE satellite data, which may be due to the CLSM model’s unsuitability to local climatic conditions [54]. According to [35], between 2002 and 2022, Iraq’s groundwater depletion rate was −9.64 mm/year. Rising temperatures increase the evaporation rate, directly leading to decreased GWS, as shown in Figure 9 and Figure 10. GWS based on GRACE satellite data has been frequently utilized for tracking groundwater depletion and dynamic variations [67,68]. The data demonstrate a distinct seasonal variation in groundwater levels, which rise considerably in the winter due to more precipitation and fall sharply in the summer due to higher temperature, evaporation, and consumption rates. This illustrates that the sensitivity groundwater levels are to seasonal variations in the climate. The change in GWS levels can be attributed to seasonal variations due to different spatial dimensions and processing as well as an effect of human activities.
Generally, Figure 6, Figure 8, Figure 9 and Figure 10 showed a negative trend from January 2022 to December 2022 for the remote sensing that matches the monitoring well data in situ, in which wells 1, 2, and 4 are negative trends of the study period.
Uncertainty Analysis
The uncertainty analysis was executed on the GWS variations estimated by several sources’ datasets. Utilizing the law of error propagation, all errors were taken into account while estimating the uncertainties of GRACE-based GWS [69]. In TWS, the standard deviation of mascon solutions was utilized to represent uncertainty. The uncertainty in non-GWS variables was calculated as a standard deviation of the models’ long-term variance [51]. We assumed that the errors of TWS and non-GWS elements are separate and few affect each other mutually, and they are equal to the square root of the sum of individual errors [70]. The uncertainty in GRACE-derived GWS _JPLD is the largest of the GWS findings at 3.76. This is because of uncertainties in the GRACE data, post-processing, and elimination of non-GWS elements [10,71,72]. Note that the uncertainties for the GWS_GSFC estimated by GRACE and CLSM are 2.79 and 3.02, respectively.
4. Conclusions
This study revealed the variability in GWS across the study area from January 2022 to December 2023 by integrating remote sensing (RS) data with available monitoring well measurements. The GSFC, JPL_D, and CLSM analyses showed a decreasing trend in GWS during 2022, with GSFC recording the highest rate of decline, while CLSM was the least affected, as it was not affected by human activities. However, the first half of 2023 witnessed a reversal in the trend, with GSFC showing the highest rate of increase in GWS, while CLSM recorded the lowest rate of increase. However, this improvement was temporary, as the decreasing trend resumed in all three types until the end of the study, indicating the influence of climatic factors and increasing human consumption.
In general, this variability in GWS is attributed to drought, climate change, intensive irrigation consumption, and human activities, reflecting the challenges of water resource management. Moreover, this study faced major limitations, which were the limited number of monitoring wells and their heterogeneous distribution. Other limitations were being limited to the shallow aquifer, the absence of long time series, the lack of information about the lithological of each well, and the absence of modern programming methods that can enhance the accuracy of the findings.
In conclusion, this study emphasizes the importance of GRACE-GSFC gravity data in estimating GWS changes, especially in the context of data scarcity and drought, enhancing its ability to monitor groundwater depletion and contribute to achieving water security.
The primary reason for adopting this methodology is the absence of data to monitor groundwater variations in a large region, at low-cost, and for continuous periods.
5. Recommendations
The latest product released for mascon solutions can be utilized to achieve good accuracy. Data from monitoring wells should be obtained in long time series, homogeneously distributed over the region, in appropriate quantity, and including shallow and deep aquifers. Due to the low accuracy of GRACE, the use of modern algorithms and software can improve the accuracy, such as utilizing GRACE data with GPS and InSAR data to verify changes in groundwater.
Author Contributions
Conceptualization, M.S.A.-K. and I.A.A.; methodology, I.A.A. and M.S.A.-K.; software, H.K.M.; validation, I.A.A., M.S.A.-K., and H.K.M.; formal analysis, I.A.A., M.S.A.-K., and H.K.M.; investigation, M.S.A.-K., I.A.A., and H.K.M.; resources, H.K.M.; data curation, I.A.A., M.S.A.-K., and H.K.M.; writing—original draft preparation, M.S.A.-K., I.A.A., and H.K.M.; writing—review and editing, I.A.A., M.S.A.-K., and H.K.M.; visualization, M.S.A.-K. and I.A.A.; supervision, I.A.A. and M.S.A.-K. All authors have read and agreed to the published version of the manuscript.
Funding
This research received no external funding.
Data Availability Statement
The data is available upon request from the authors.
Conflicts of Interest
The authors declare no conflicts of interest.
References
- AlJumaili, K.K.; Al-Khafaji, M.S.; Al-Awadi, A.T. Assessment of Evapotranspiration Estimation Models for Irrigation Projects in Karbala, Iraq. Eng. Technol. J. 2014, 32, 1149–1157. [Google Scholar] [CrossRef]
- Saeed, F.H.; Al-Khafaji, M.S.; Al-Faraj, F. Hydrologic Response of Arid and Semi-Arid River Basins in Iraq under a Changing Climate. J. Water Clim. Change 2022, 13, 1225–1240. [Google Scholar] [CrossRef]
- Saeed, F.H.; Al-Khafaji, M.S.; Al-Faraj, F.A.M.; Uzomah, V. Sustainable Adaptation Plan in Response to Climate Change and Population Growth in the Iraqi Part of Tigris River Basin. Sustainability 2024, 16, 2676. [Google Scholar] [CrossRef]
- Mohamed, A.; Alarifi, S.S.; Mohammed, M.A.A. Geophysical Monitoring of the Groundwater Resources in the Southern Arabian Peninsula Using Satellite Gravity Data. Alex. Eng. J. 2024, 86, 311–326. [Google Scholar] [CrossRef]
- Aziz, N.A.; Alwan, I.A. An Accuracy Analysis Comparison of Supervised Classification Methods for Mapping Land Cover Using Sentinel 2 Images in the Al-Hawizeh Marsh Area, Southern Iraq. Geomat. Environ. Eng. 2021, 15, 5–21. [Google Scholar] [CrossRef]
- Alwan, I.A.; Karim, H.H.; Aziz, N.A. Investigate the Optimum Agricultural Crops Production Seasons in Salah Al-Din Governorate Utilizing Climate Remote Sensing Data and Agro-Climatic Zoning. Iraqi J. Sci. 2019, 60, 2087–2094. [Google Scholar] [CrossRef]
- Brunner, P.; Hendricks Franssen, H.-J.; Kgotlhang, L.; Bauer-Gottwein, P.; Kinzelbach, W. How Can Remote Sensing Contribute in Groundwater Modeling? Hydrogeol. J. 2007, 15, 5–18. [Google Scholar] [CrossRef]
- Thakur, J.K.; Singh, S.K.; Ekanthalu, V.S. Integrating Remote Sensing, Geographic Information Systems and Global Positioning System Techniques with Hydrological Modeling. Appl. Water Sci. 2017, 7, 1595–1608. [Google Scholar] [CrossRef]
- Scanlon, B.R.; Longuevergne, L.; Long, D. Ground Referencing GRACE Satellite Estimates of Groundwater Storage Changes in the California Central Valley, USA. Water Resour. Res. 2012, 48, 1–9. [Google Scholar] [CrossRef]
- Chen, J.; Cazenave, A.; Dahle, C.; Llovel, W.; Panet, I.; Pfeffer, J.; Moreira, L. Applications and Challenges of GRACE and GRACE Follow-on Satellite Gravimetry. Surv. Geophys. 2022, 43, 305–345. [Google Scholar] [CrossRef] [PubMed]
- Condon, L.E.; Kollet, S.; Bierkens, M.F.P.; Fogg, G.E.; Maxwell, R.M.; Hill, M.C.; Fransen, H.H.; Verhoef, A.; Van Loon, A.F.; Sulis, M. Global Groundwater Modeling and Monitoring: Opportunities and Challenges. Water Resour. Res. 2021, 57, e2020WR029500. [Google Scholar] [CrossRef]
- Gleeson, T.; Wagener, T.; Döll, P.; Zipper, S.C.; West, C.; Wada, Y.; Taylor, R.; Scanlon, B.; Rosolem, R.; Rahman, S. GMD Perspective: The Quest to Improve the Evaluation of Groundwater Representation in Continental-to Global-Scale Models. Geosci. Model Dev. 2021, 14, 7545–7571. [Google Scholar] [CrossRef]
- Alghafli, K.; Shi, X.; Sloan, W.; Shamsudduha, M.; Tang, Q.; Sefelnasr, A.; Ebraheem, A.A. Groundwater Recharge Estimation Using In-Situ and GRACE Observations in the Eastern Region of the United Arab Emirates. Sci. Total Environ. 2023, 867, 161489. [Google Scholar] [CrossRef] [PubMed]
- Nannawo, A.S.; Lohani, T.K.; Eshete, A.A. Analyzing Groundwater Storage Anomalies in Data-scarce Areas of Ethiopia’s Rift Valley Basin Using Artificial Neural Network. World Water Policy 2024, 10, 909–939. [Google Scholar] [CrossRef]
- Hatem, I.; Alwan, I.A.; Ziboon, A.R.T.; Kuriqi, A. Assessment of Agricultural Drought in Iraq Employing Landsat and MODIS Imagery. Open Eng. 2024, 14, 20220583. [Google Scholar] [CrossRef]
- Boloorani, A.; Soleimani, M.; Papi, R.; Alavipanah, S.; Fadhil Al-Quraishi, A. Zoning Areas Susceptible to Land Subsidence in Tigris and Euphrates Basins. Eng. Technol. J. 2019, 37, 265–272. [Google Scholar] [CrossRef]
- Fallatah, O.A.; Ahmed, M.; Save, H.; Akanda, A.S. Quantifying Temporal Variations in Water Resources of a Vulnerable Middle Eastern Transboundary Aquifer System. Hydrol. Process. 2017, 31, 4081–4091. [Google Scholar] [CrossRef]
- Rahimzadegan, M.; Entezari, S.A. Performance of the Gravity Recovery and Climate Experiment (GRACE) Method in Monitoring Groundwater-Level Changes in Local-Scale Study Regions within Iran. Hydrogeol. J. 2019, 27, 2497–2509. [Google Scholar] [CrossRef]
- Rateb, A.; Scanlon, B.R.; Pool, D.R.; Sun, A.; Zhang, Z.; Chen, J.; Clark, B.; Faunt, C.C.; Haugh, C.J.; Hill, M. Comparison of Groundwater Storage Changes from GRACE Satellites with Monitoring and Modeling of Major US Aquifers. Water Resour. Res. 2020, 56, e2020WR027556. [Google Scholar] [CrossRef]
- Vishwakarma, B.D.; Devaraju, B.; Sneeuw, N. What Is the Spatial Resolution of Grace Satellite Products for Hydrology? Remote Sens. 2018, 10, 852. [Google Scholar] [CrossRef]
- Becker, M.; LLovel, W.; Cazenave, A.; Güntner, A.; Crétaux, J.-F. Recent Hydrological Behavior of the East African Great Lakes Region Inferred from GRACE, Satellite Altimetry and Rainfall Observations. C. R. Géosci. 2010, 342, 223–233. [Google Scholar] [CrossRef]
- Wang, X.; de Linage, C.; Famiglietti, J.; Zender, C.S. Gravity Recovery and Climate Experiment (GRACE) Detection of Water Storage Changes in the Three Gorges Reservoir of China and Comparison with in Situ Measurements. Water Resour. Res. 2011, 47. [Google Scholar] [CrossRef]
- Ouma, Y.O.; Aballa, D.O.; Marinda, D.O.; Tateishi, R.; Hahn, M. Use of GRACE Time-Variable Data and GLDAS-LSM for Estimating Groundwater Storage Variability at Small Basin Scales: A Case Study of the Nzoia River Basin. Int. J. Remote Sens. 2015, 36, 5707–5736. [Google Scholar] [CrossRef]
- Biancamaria, S.; Mballo, M.; Le Moigne, P.; Sánchez Pérez, J.M.; Espitalier-Noël, G.; Grusson, Y.; Cakir, R.; Häfliger, V.; Barathieu, F.; Trasmonte, M.; et al. Total Water Storage Variability from GRACE Mission and Hydrological Models for a 50,000 km2 Temperate Watershed: The Garonne River Basin (France). J. Hydrol. Reg. Stud. 2019, 24, 100609. [Google Scholar] [CrossRef]
- Liesch, T.; Ohmer, M. Comparison of GRACE Data and Groundwater Levels for the Assessment of Groundwater Depletion in Jordan. Hydrogeol. J. 2016, 24, 1547–1563. [Google Scholar] [CrossRef]
- Rzepecka, Z.; Birylo, M. Groundwater Storage Changes Derived from GRACE and GLDAS on Smaller River Basins—A Case Study in Poland. Geosciences 2020, 10, 124. [Google Scholar] [CrossRef]
- Wiese, D.N.; Landerer, F.W.; Watkins, M.M. Quantifying and Reducing Leakage Errors in the JPL RL05M GRACE Mascon Solution. Water Resour. Res. 2016, 52, 7490–7502. [Google Scholar] [CrossRef]
- Lezzaik, K.; Milewski, A. A Quantitative Assessment of Groundwater Resources in the Middle East and North Africa Region. Hydrogeol. J. 2018, 26, 251–266. [Google Scholar] [CrossRef]
- Eshagh, M.; Fatolazadeh, F.; Goïta, K. Impact of Uncertainty Estimation of Hydrological Models on Spectral Downscaling of GRACE-Based Terrestrial and Groundwater Storage Variation Estimations. Remote Sens. 2023, 15, 3967. [Google Scholar] [CrossRef]
- Shami, S.; Ghorbani, Z. Investigating Water Storage Changes in Iran Using Grace and Chirps Data in the Google Earth Engine System. Int. Arch. Photogramm. Remote Sens. Spat. Inf. Sci. 2019, 42, 981–984. [Google Scholar] [CrossRef]
- Mehdi, A.; Mobin, E.; Mohammad, A.; Elyasi, A.H.; Zahra, N. Application Assessment of GRACE and CHIRPS Data in the Google Earth Engine to Investigate Their Relation with Groundwater Resource Changes (Northwestern Region of Iran). J. Groundw. Sci. Eng. 2021, 9, 102–113. [Google Scholar]
- Magnoni, P.H.J.; Silva, C.d.O.F.; Manzione, R.L. Groundwater Recharge and Water Table Levels Modelling Using Remotely Sensed Data and Cloud-Computing. Sustain. Water Resour. Manag. 2020, 6, 113. [Google Scholar] [CrossRef]
- Pulla, S.T.; Yasarer, H.; Yarbrough, L.D. GRACE Downscaler: A Framework to Develop and Evaluate Downscaling Models for GRACE. Remote Sens. 2023, 15, 2247. [Google Scholar] [CrossRef]
- Mohseni, F.; Ahrari, A.; Haunert, J.-H.; Montzka, C. The Synergies of SMAP Enhanced and MODIS Products in a Random Forest Regression for Estimating 1 Km Soil Moisture over Africa Using Google Earth Engine. Big Earth Data 2024, 8, 33–57. [Google Scholar] [CrossRef]
- Ghalib, H.B.; Söğüt, A.R. Environmental Isotopic Characterization of Groundwater and Surface Water in Northeast Missan Province, South Iraq. Acta Geol. Sin. Ed. 2014, 88, 1227–1238. [Google Scholar] [CrossRef]
- Parsons, R.M. Ground-Water Resources of Iraq, Khanaqin-Jassan Area (Vol. 1); Development Board, Ministry of Development Government of Iraq: Baghdad, Iraq, 1956.
- Muhaisen, N.; Khayyun, T.; Al-Mukhtar, M. Drought Forecasting Model for Future Climate Change Effects in a Regional Catchment Area in Northern Iraq. Eng. Technol. J. 2024, 42, 1–15. [Google Scholar] [CrossRef]
- Kassab, I.I.M.; Abbas, M.J.; Buday, T.; Jassim, S.Z. The Regional Geology of Iraq, Vol. 2, Tectonism, Magmatism and Metamorphism; Geological Survey and Mineral Investigation: Baghdad, Iraq, 1987. [Google Scholar]
- Saleh, S.A.; Al-Ansari, N.; Abdullah, T. Groundwater Hydrology in Iraq. J. Earth Sci. Geotech. Eng. 2020, 10, 155–197. [Google Scholar]
- Al-Shammary, S.H. Hydrogeology of Galal Basin-Wasit East, Iraq. Ph.D. Thesis, Department of Geology, College of Science, University of Wasit, Kut, Iraq, 2006. [Google Scholar]
- Al-Aboodi, A.H.; Al-Kadhimi, A.M.; Al-Tai, M.A. Mathematical Model of Groundwater Flow in Teeb Area, Missan Province, South of iraq. Kufa J. Eng. 2013, 5, 51–70. [Google Scholar] [CrossRef]
- Aziz, N.A.; Hasan, R.H.; Abdulrazzaq, Z.T. Optimum Site Selection for Groundwater Wells Using Integration between GIS and Hydrogeophysical Data. Eng. Technol. J. 2018, 36, 596–602. [Google Scholar] [CrossRef]
- Khalaf, A.G. Determination the SuiTable Locations for Drilling Wells for Irrigation Purpose by Using Geographic Information System (GIS). Eng. Technol. J. 2016, 34, 80–89. [Google Scholar] [CrossRef]
- Available online: https://Earth.Gsfc.Nasa.Gov/Geo/Data/Grace-Mascons (accessed on 16 April 2024).
- Available online: https://Giovanni.Gsfc.Nasa.Gov/Giovanni (accessed on 16 April 2024).
- Tiwari, V.M.; Wahr, J.; Swenson, S. Dwindling Groundwater Resources in Northern India, from Satellite Gravity Observations. Geophys. Res. Lett. 2009, 36, 184–201. [Google Scholar] [CrossRef]
- Müller Schmied, H.; Cáceres, D.; Eisner, S.; Flörke, M.; Herbert, C.; Niemann, C.; Peiris, T.A.; Popat, E.; Portmann, F.T.; Reinecke, R. The Global Water Resources and Use Model WaterGAP v2. 2d: Model Description and Evaluation. Geosci. Model Dev. 2021, 14, 1037–1079. [Google Scholar] [CrossRef]
- Huang, Z.; Pan, Y.; Gong, H.; Yeh, P.J.; Li, X.; Zhou, D.; Zhao, W. Subregional-scale Groundwater Depletion Detected by GRACE for Both Shallow and Deep Aquifers in North China Plain. Geophys. Res. Lett. 2015, 42, 1791–1799. [Google Scholar] [CrossRef]
- Li, B.; Rodell, M.; Kumar, S.; Beaudoing, H.K.; Getirana, A.; Zaitchik, B.F.; de Goncalves, L.G.; Cossetin, C.; Bhanja, S.; Mukherjee, A. Global GRACE Data Assimilation for Groundwater and Drought Monitoring: Advances and Challenges. Water Resour. Res. 2019, 55, 7564–7586. [Google Scholar] [CrossRef]
- Koster, R.D.; Suarez, M.J.; Ducharne, A.; Stieglitz, M.; Kumar, P. A Catchment-based Approach to Modeling Land Surface Processes in a General Circulation Model: 1. Model Structure. J. Geophys. Res. Atmos. 2000, 105, 24809–24822. [Google Scholar] [CrossRef]
- Yang, J.; Pan, Y.; Zhang, C.; Gong, H.; Xu, L.; Huang, Z.; Lu, S. Comparison of Groundwater Storage Changes over Losing and Gaining Aquifers of China Using GRACE Satellites, Modeling and in-Situ Observations. Sci. Total Environ. 2024, 938, 173514. [Google Scholar] [CrossRef] [PubMed]
- Houborg, R.; Rodell, M.; Li, B.; Reichle, R.; Zaitchik, B.F. Drought Indicators Based on Model-assimilated Gravity Recovery and Climate Experiment (GRACE) Terrestrial Water Storage Observations. Water Resour. Res. 2012, 48. [Google Scholar] [CrossRef]
- Seyoum, W.M.; Milewski, A.M. Improved Methods for Estimating Local Terrestrial Water Dynamics from GRACE in the Northern High Plains. Adv. Water Resour. 2017, 110, 279–290. [Google Scholar] [CrossRef]
- Watkins, M.M.; Wiese, D.N.; Yuan, D.; Boening, C.; Landerer, F.W. Improved Methods for Observing Earth’s Time Variable Mass Distribution with GRACE Using Spherical Cap Mascons. J. Geophys. Res. Solid Earth 2015, 120, 2648–2671. [Google Scholar] [CrossRef]
- Landerer, F.W.; Swenson, S.C. Accuracy of Scaled GRACE Terrestrial Water Storage Estimates. Water Resour. Res. 2012, 48, 4531. [Google Scholar] [CrossRef]
- Asrade, T.M.; Kerebih, M.S.; Assefa, N.Y. Estimation of Groundwater Storage Change and Groundwater Recharge Using GRACE Data in Jedeb Watershed Under the Application of Google Earth Engine. Air Soil Water Res. 2024, 17, 11786221241295456. [Google Scholar] [CrossRef]
- Mohamed, A. Gravity Applications in Estimating the Mass Variations in the Middle East: A Case Study from Iran. Arab. J. Geosci. 2020, 13, 364. [Google Scholar] [CrossRef]
- Strassberg, G.; Scanlon, B.R.; Rodell, M. Comparison of Seasonal Terrestrial Water Storage Variations from GRACE with Groundwater-level Measurements from the High Plains Aquifer (USA). Geophys. Res. Lett. 2007, 34, 14. [Google Scholar] [CrossRef]
- Zhao, W.; Sánchez, N.; Lu, H.; Li, A. A Spatial Downscaling Approach for the SMAP Passive Surface Soil Moisture Product Using Random Forest Regression. J. Hydrol. 2018, 563, 1009–1024. [Google Scholar] [CrossRef]
- Belgiu, M.; Drăguţ, L. Random Forest in Remote Sensing: A Review of Applications and Future Directions. ISPRS J. Photogramm. Remote Sens. 2016, 114, 24–31. [Google Scholar] [CrossRef]
- Alattar, M.H. Mapping Groundwater Dynamics in Iraq: Integrating Multi-Data Sources for Comprehensive Analysis. Model. Earth Syst. Environ. 2024, 10, 4375–4385. [Google Scholar] [CrossRef]
- Khaki, M.; Hoteit, I. Monitoring Water Storage Decline over the Middle East. J. Hydrol. 2021, 603, 127166. [Google Scholar] [CrossRef]
- Nikraftar, Z.; Parizi, E.; Saber, M.; Hosseini, S.M.; Ataie-Ashtiani, B.; Simmons, C.T. Groundwater Sustainability Assessment in the Middle East Using GRACE/GRACE-FO Data. Hydrogeol. J. 2024, 32, 321–337. [Google Scholar] [CrossRef]
- Othman, A.; Abdelrady, A.; Mohamed, A. Monitoring Mass Variations in Iraq Using Time-Variable Gravity Data. Remote Sens. 2022, 14, 3346. [Google Scholar] [CrossRef]
- Chulov, M. Iraq: Water, Water Nowhere. World Policy J. 2009, 26, 33–41. [Google Scholar] [CrossRef]
- Yang, X.; Tian, S.; Feng, W.; Ran, J.; You, W.; Jiang, Z.; Gong, X. Spatio-Temporal Evaluation of Water Storage Trends from Hydrological Models over Australia Using GRACE Mascon Solutions. Remote Sens. 2020, 12, 3578. [Google Scholar] [CrossRef]
- Khorrami, B.; Ali, S.; Sahin, O.G.; Gunduz, O. Model-coupled GRACE-based Analysis of Hydrological Dynamics of Drying Lake Urmia and Its Basin. Hydrol. Process. 2023, 37, e14893. [Google Scholar] [CrossRef]
- Rodell, M.; Velicogna, I.; Famiglietti, J.S. Satellite-Based Estimates of Groundwater Depletion in India. Nature 2009, 460, 999–1002. [Google Scholar] [CrossRef]
- Richey, A.S.; Thomas, B.F.; Lo, M.; Reager, J.T.; Famiglietti, J.S.; Voss, K.; Swenson, S.; Rodell, M. Quantifying Renewable Groundwater Stress with GRACE. Water Resour. Res. 2015, 51, 5217–5238. [Google Scholar] [CrossRef] [PubMed]
- Rodell, M.; Houser, P.R.; Jambor, U.; Gottschalck, J.; Mitchell, K.; Meng, C.-J.; Arsenault, K.; Cosgrove, B.; Radakovich, J.; Bosilovich, M.; et al. The Global Land Data Assimilation System. Bull. Am. Meteorol. Soc. 2004, 85, 381–394. [Google Scholar] [CrossRef]
- Voss, K.A.; Famiglietti, J.S.; Lo, M.; De Linage, C.; Rodell, M.; Swenson, S.C. Groundwater Depletion in the Middle East from GRACE with Implications for Transboundary Water Management in the Tigris-Euphrates-Western Iran Region. Water Resour. Res. 2013, 49, 904–914. [Google Scholar] [CrossRef] [PubMed]
- Li, Q.; Pan, Y.; Zhang, C.; Gong, H. Quantifying Multi-Source Uncertainties in GRACE-Based Estimates of Groundwater Storage Changes in Mainland China. Remote Sens. 2023, 15, 2744. [Google Scholar] [CrossRef]


Disclaimer/Publisher’s Note: The statements, opinions and data contained in all publications are solely those of the individual author(s) and contributor(s) and not of MDPI and/or the editor(s). MDPI and/or the editor(s) disclaim responsibility for any injury to people or property resulting from any ideas, methods, instructions or products referred to in the content. |
© 2025 by the authors. Licensee MDPI, Basel, Switzerland. This article is an open access article distributed under the terms and conditions of the Creative Commons Attribution (CC BY) license (https://creativecommons.org/licenses/by/4.0/).