Abstract
With ambitious targets set by the EU for the reduction of emissions from the energy sector by 2030, there is a need to design and develop more building projects using renewable energy sources. Even though in Europe, heating and cooling share from renewable resources is increasing, and in 2021, the total share in this sector in Croatia was at 38%, the share of heat production by heat pumps is rather low. One possibility to increase this share is to install energy piles when constructing a building, which is becoming an increasingly common practice. This case study focuses on such a system designed for a large, non-residential building in Zagreb, Croatia. The complex was designed as 13 separate dilatations, with central heating and cooling of all facilities, covered by 260 energy piles (130 pairs in serial connection), with a length of the polyethylene pipe of 20 m in a double loop inserted within the pile. The thermo-technical system was designed as a bivalent parallel system, with natural gas covering peak heating loads and a dry cooler covering cooling peak loads when the loads cannot be covered only by ground-source heat pumps. In the parallel bivalent system, the geothermal source will work with a much higher number of working hours at full load than is the case for geothermal systems that are dimensioned to peak consumption. Therefore, the thermal response test was conducted on two energy piles, connected in series, to obtain thermogeological parameters and determine the heat extraction and rejection rates. The established steady-state heat rate defines the long-term ability to extract heat energy during constant thermal load, with the inlet water temperature from the pile completely stabilized, i.e., no significant further sub-cooling is achieved in the function of the geothermal field operation time. Considering the heating and cooling loads of the building, modeling of the system was performed in such a manner that it utilized renewable energy as much as possible by finding a bivalent point where the geothermal system works efficiently. It was concluded that the optimal use of the geothermal field covers total heating needs and 70% for cooling, with dry coolers covering the remaining 30%. Additionally, based on the measured thermogeological parameters, simulations of the thermal response test were conducted to determine heat extraction and rejection rates for energy piles with various geometrical parameters of the heat exchanger pipe and fluid flow variations.
1. Introduction
With almost half of the final energy consumption belonging to the heating sector in Europe, diversification of this sector is of high significance for the entire EU. With 70% of the heating coming from fossil fuels [1], adding decarbonization to diversification, it is a sector that needs more systems installed that use renewable energy. One way to diversify and lower the use of fossil fuels is to use shallow geothermal energy via geothermal heat pumps. With a higher coefficient of performance (COP) when compared to air-source heat pumps, ground-source heat pumps (GSHP) have proven to be up to the task. However, ground source heat pump systems with classic vertical borehole heat exchangers (BHEs) have disadvantages in the form of high capital cost of drilling. To reduce this cost, other designs have also been developed and implemented. One of these is to implement the so-called energy piles, where the piles, already designed to be the bearing part of the building, are equipped with ground heat exchanger pipes. Therefore, the reduction of drilling costs can be significant, and energy piles provide capitally less intensive shallow geothermal systems, especially for large buildings. When it comes to the design of energy piles, there are many authors who have researched the thermal and mechanical coupling characteristics of energy piles to ensure their safety and optimal design, as summarized in [2]. The research was carried out on in situ tests and laboratory model tests, and numerical simulation was also implemented to study pile behavior. Furthermore, Song et al. [2] proposed a probabilistic sizing method that considers the uncertainty of soil parameters and uses the thermomechanical load transfer method to optimize the pile size (length and diameter). Jelušič and Žlender [3] presented the comparative analysis of the optimal design for both conventional and energy piles based on various alternative scenarios with different vertical loads on piles, alternatives of discrete cross-section, and different Young’s moduli of the soil. The research showed that the implementation of the energy pile is most economically feasible for small vertical loads on soil with a high Young’s moduli. The study of the thermal performance of energy piles equipped with single-U heat exchangers showed that fluid circulation velocity and the inner radius of the heat exchanger pipe independently affect the energy output of the energy pile [4]. This research also showed that concrete affects the heat transfer only in a short time after the start of the heat transfer and that the effect of ground thermal conductivity on heat transfer increases with time. The ratio of thermal conductivity of the ground and concrete has an effect on the energy output. When this ratio is lower than 1, the heat exchange efficiency increases with the increase in pile radius. New designs of energy piles, or rather different pipe configurations in energy piles, can lead to an improvement in the heat exchange rate, as shown by Mehrizi et al. [5]. Numerical simulation showed that the W-shape-all-around configuration had better efficiency in heat transfer when compared to single-U and 1-W-shaped. Also, this research showed that serial connection of energy piles had better performance and efficiency when compared to parallel connection in the cooling mode. The energy piles are finding new implementations, such as using energy piles in snow melting systems for bridge decks [6], co-utilization of solar and shallow geothermal energy in building integrated photovoltaic/thermal energy pile systems [7], or implementing micro energy piles to enhance foundation safety and cooling system efficiency in transformers [8]. In this case study, a non-residential building was constructed on 13 separate dilatations, with 260 energy piles to cover heating and cooling needs. To determine thermogeological parameters and heat extraction and rejection rates, a classic thermal response test and step test were conducted, and results were used to optimize the operation of the bivalent thermo-technical system.
2. Materials and Methods
2.1. Thermogeological Testing of the Ground—Theory Background
A Thermal Response Test (TRT) is conducted based on the principle of releasing heat into the ground through a series of electric heaters to determine the fundamental thermogeological properties of the soil. The main analysis of the test involves prolonged monitoring of the rise in pile fluid temperature over time with constant thermal power being applied. This method originated from well-testing procedures of oil and gas wells during the phase of hydrodynamic production capacity determinations. It is, in fact, based on the theory of the mutual analogy between Darcy’s and Fourier’s laws, which describe the movement of incompressible fluids in porous media [9] and the conduction of heat in solids [10,11], respectively, using the differential diffusion equation for an infinite reservoir The field test procedures follow the International Ground Source Heat Pump Association (IGSHPA) guidelines, which require at least 48 h of testing to ensure accuracy. If the testing is conducted at less than this value, it can give false readings due to the effect of the heterogeneity of the ground, power fluctuations, and time to establish the required semi-steady state heat transfer.
In an ideal test scenario with constant thermal power q′ in an infinite medium, the temperature change at a specific radius T(r,t) is described by the solution involving the exponential integral Ei of the general heat diffusion equation (where α is the heat diffusivity factor and λ is the heat conductivity factor).
Exponential integral Ei can be substituted with the natural logarithm for a value of x < 0.01, so the simplified equation of the temperature change at radius r could be obtained:
When performing in situ tests on a real pile, the interpretation method must account for the extent of damage in the grouted zone, also known as the skin factor s in petroleum engineering well testing procedures. In a shallow geo-exchange utilization system, this is usually represented as equivalent pile thermal resistance Rb to the heat flow q from the ground to the fluid in the pipes. The space between the outer diameter of the installed polyethylene pipes and the pile wall acts as a thermal resistance medium due to the lower thermal conductivity of the bentonite–cement–water mixture compared to the ground. However, in the case of energy piles, the grout is conventional concrete, which, in fact, has solid thermal conductivity factors. Additionally, the low thermal conductivity nature of the polyethylene piping through which the fluid flows contributes to the overall thermal resistance between the fluid and the ground. This equivalent thermal resistance can be expressed through the temperature difference ΔTskin between the working fluid and the pile outer wall during continuous operation of the pile.
To determine the equivalent thermal conductivity factor, it is essential first to identify the period after which the semi-steady state of heat transfer begins, i.e., to determine the initial duration of the unsteady-state heat transfer period. The standard method for determining the beginning of this semi-steady-state period, during which the ground’s thermal conductivity is defined, involves a formula that includes the value of thermal diffusion of the soil, typically based on soil composition obtained through drilling:
Obtained time through this equation is not an exact value [12] since it relies upon applying catalog values of heat diffusivity α for the drilled type of rocks; therefore, such determination of the unsteady-state transition period can lead to an error for heterogeneous geology of the ground. A much more precise method is the use of a derivative curve of the recorded data, which is often used in hydrodynamic measurements as described in the novel method by Kurevija et al. [13]. It consists of observing the rise of temperature in a constant time step as a function of total time. In the initial time of the testing, the temperature rise for the same time interval is high, but with time, the temperature change value is damped. The appearance of a semi-steady state can be assumed to occur when the value reaches a temperature change of 0.25 °C/10 min [13]. After determining the period of the semi-steady state heat transfer transition, it is possible to interpret the data for determining the effective thermal conductivity and the straight line equation κ [12]:
When displaying recorded data of the working fluid temperature evolution over time, it is possible to display the inverse temperature curve by subtracting the recorded temperature difference from the initial ground temperature T0. This mode demonstrates the actual work of the energy pile in the winter months when heat energy is extracted from the ground and when the ground is sub-cooled. In other words, it shows what the results of the thermal response test would be as it was performed by subcooling the ground instead of heating it.
In the novel TRT procedure with multiple heat steps or steady state thermal response step test (SSTRST), the first power step is applied for usually around 72–96 h of testing time, after which pile temperature appears nearly constant, or when the so-called steady state seems to be reached [14]. After the apparent stabilization of the temperature, the heat power on electric heaters is changed to a lower value inside the TRT machine until temperature stabilization is achieved again through a period of 24–48 h. The procedure is repeated three to four times to have enough stabilization points to apply a linear trendline of heat extraction rates in W/m vs. constant pile temperature. When analyzing the data obtained by the step test, an empirical method is used that considers that the heat steps, q′, could be linearly approximated if all of the heat steps have reached a steady state heat transfer or nearly reached it.
During the step test, the initial heat step is conducted with the highest power, and all subsequent heat steps are lowered by reducing the power of the electric heaters in the TR machine. This procedure allows precise determination of extraction rates for BHE (in W/m) in both heating and cooling cycles as a function of EST [14,15].
During initial step :
The second part of the equation represents an increase in temperature during the first period of the TR test. After that period is finished (in time t1), heat power is decreased in the TRT machine to some lower value q2′:
Second step:
After the second period is finished (at time t2), there is another power decrease at the TRT machine at q3′
Third step:
In equations, is a dimensionless factor that corresponds to the sum of all the terms inside Equation (1) in braces: .
So, the general equation that describes the recorded temperature curve during step TR tests can be stated as follows [16]:
The entire methodology can be described with the following Figure 1 showing the principles of the SSTRS test:
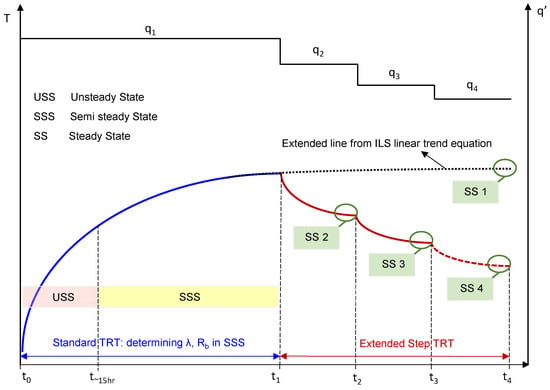
Figure 1.
Principle of steady-state thermal response step test evolution as a function of heat power and time.
In low conductivity grounds like clays and marls, achieving a steady state during a first heat step often requires a very long testing time. Therefore, an approximation of the steady state is frequently made using a theoretical prolongation of the test with a diffusivity equation (dotted line in Figure 1 expressing “Extended line from ILS linear trend equation”). These prolonged values would match real recorded values of the temperature if the TRT would last a very long time. Having multiple stabilization points after test completion (Figure 1 SS 1, 2, 3, 4 points) gives the opportunity to construct a linear trendline of pile extraction rates versus pile temperature for any loads of geo-exchange system. When designing geo-exchange bivalent systems (a combination of shallow geothermal piles and some other source of heat like natural gas), where the geo-exchange system operates at peak load for an extended period during winter. Such analysis is crucial to determine the minimal allowed temperature at the energy pile grid without having significant sub-cooling of the ground over time.
2.2. Geological Environment at the Researched Location and Case Study Data
The location of the case study is the IKEA Outlet shop building, which is constructed just outside of the main area of the Zagreb/Croatia aquifer, i.e., alluvium of the recent streams of the Sava River (“a”—Quaternary deposits: pebbles, sand, silts, and clay). According to Figure 2, the location of the case study is in the area of Quaternary marsh loess deposits (“lb”—clay, silts, sands, pebbles, peat, and lignite). The existence of the water-saturated gravel layers was also confirmed by earlier investigations at the older IKEA building nearby, where groundwater is used for the heating and cooling of the shopping center by a heat pump. These permeable layers at 14.0–26.0 m are defined by low hydraulic conductivity, along with the deeper horizons, which are also included in the production of groundwater (43.0–48.5 m in depth).
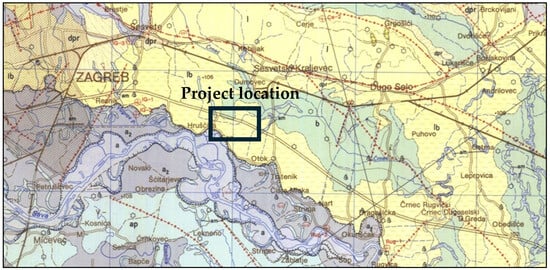
Figure 2.
Legend for geology map: a–alluvium: gravels, sands, and clays; a2–middle terrace: gravels and sands; ap–flood facies: clayey sand, clayey silt; b–marsh sediments: clays, clayey silt; dpr–diluvium–proluvium: fine-grained clays, sands, and gravels; l–clayey silt; lb–marshy loes: silty clays. General geological map of the wider Zagreb area and location of the non-residential case study [17].
The case study is a large commercial building (IKEA Outlet Center village) located east of Zagreb, the capital of Croatia. At the location of the object, a test pile was installed to test the construction loads and define the lithological soil composition, as seen in Figure 3, as well as to determine the needed depth of the piles. A lithological column was defined on a series of test piles, and according to the general geological map depicted in Figure 2, it was expected that the column would be highly heterogeneous and depths of certain layers would even alternate inside the micro-location. According to the analysis of the project mentioned above, the lithological column consists of five main geotechnical mediums: 1. Clay—high plasticity (generally brown in color, hard squeezing); 2. Clay—medium plasticity (grey color, light squeezing, alternates in layers with peat, occurrence of sand layers); 2a. Black peat (alternated with high-grade clay of medium 2); 2b. Clayey sand (grey in color, medium to good compactness, alternated with medium 2); 3. Well-graded gravel (a little dusty, the largest grain 3–5 cm, grey in color, good compactness, with sand occurrence); 4. Organic clay and high plasticity dust (dark brown to black in color, rigid, contains plant residues along with the layers of peat and organic dust of rust-brown in color); 5. Organic clay and high plasticity dust (light grey to grey color, rigid, generally dusty).
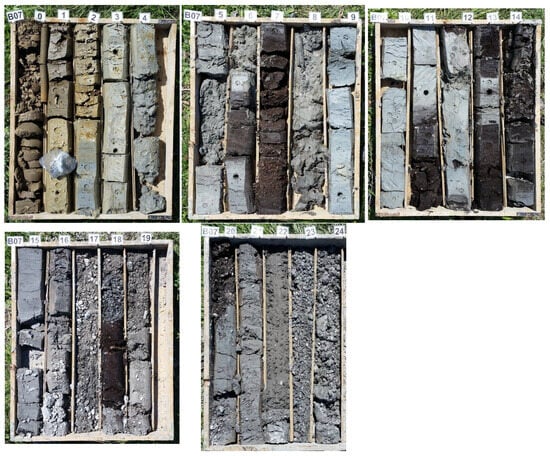
Figure 3.
Coring samples were taken from geotechnical research of the location prior to the drilling of the energy piles.
To have a valid geothermal field design, it was impossible to use catalog values of the ground thermal conductivity in micro-locations with such variations of ground layers. Conducting a long-term step thermal response test and obtaining proper thermogeological parameters is, therefore, an absolute precondition to have solid confidence in the multiyear operation of the geo-exchange field and heat pump system.
The shallow geothermal energy exploitation of construction piles in the bivalent parallel thermo-technical system with natural gas was planned within the framework of the construction of the building. The object was built as 13 separate dilatations (objects A–M) and a deep foundation of the facility on piles. A part of the pile installation that was used for energy purposes was drilled with a 60 cm diameter Continuous Flight Auger (CFA Pile) technology. The diameter of the armature is 40 cm, on which polyethylene pipes are affixed to enable working fluid circulation and heat exchange via piles. The CFA pile length in the field is 19.3 to 21.3 m, and the polyethylene pipes are placed on a 20 m line length in a so-called loop arrangement, which makes 80 m of heat exchanger pipe length per pile. The built-in pipes are type PE100 RC SDR11, with an outside diameter of 25 mm. Engineering design envisioned that two piles are connected to a hydraulic serial connection, which makes a total of 160 m of installed pipes available for heat exchange per two piles. The total number of energy piles to exploit shallow geothermal energy amounts to 260, or 130 pairs of piles in a serial connection.
Presuming that heating and cooling of all 13 dilatations of a building cannot be covered only by geothermal heat pumps, the use of a gas boiler for the supplementation of heat energy in peak consumption was foreseen, as well as a dry cooler for cooling peak loads. In the parallel bivalent system, the geothermal source will work with a much higher number of working hours at full load than is the case for geothermal systems that are dimensioned to peak consumption. Therefore, the thermal response test was performed to determine thermogeological parameters of the soil/ground for the heat exchange evaluation, as well as steady-state heat extraction/rejection of the energy piles in the function of the pile output temperature. The established steady-state heat rate defines the long-term ability to extract heat energy during constant thermal load, with the inlet water temperature from the pile completely stabilized, i.e., no significant further sub-cooling is achieved in the function of the geothermal field operation time. The length of a pile is 20 m (Figure 4b), the distance between the pipes in the pile is 34 cm, and the distance between the two test piles in the field is 4 m (Figure 4c). The TRT was performed on two energy piles connected in series within a geothermal field during the construction phase within the C dilatation (Figure 4a).
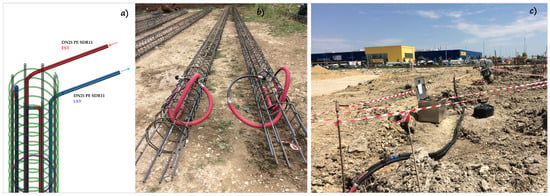
Figure 4.
(a) Pilot setup with heat exchangers, (b) energy piles of 20 m in length ready to be installed with U-loop pipe, (c) installation of TRT equipment on two serial coupled piles at the construction field.
During the installation of the TR test, the surface polyethylene pipes used to connect the two piles to the serial connection were insulated by a 15 mm thick insulation to minimize thermal interference due to daily air temperatures. The entire testing was performed for almost 250 h. The measurement was completed by circulating water at a flow of 0.25 L/s, under which conditions the turbulent flow in the pipes was achieved.
3. Results
3.1. Thermogeology Results from Thermal Response Test Performed on the Test Piles
The TR testing was conducted during the summer period. The TRT apparatus (Precision Geothermal—model GeoCube500) has a maximum power of 9.0 kW (3 × 2.5 kW + 1 × 1.5 kW) at a 240 V voltage. Data recording was performed with the Hobo U30 Series Data Logger, HOBOware Pro Software 2.4.0. with intervals of 5 min. The measurement began with a circulation of 0.25 L/s with the heaters being turned off to determine the mean effective static ground temperature over the length of the pile, which was determined at 16.8 °C. Given that there are only 20 m of shallow energy piles, it should be noted that this is a seasonally variable value due to the climatic impact on the surface at the first 5–10 m of depth. Given the current experience in measuring ground temperature changes with depth and practical experiences with shallow drilling in the area, a temperature drop of 2.0 °C was expected at the site in winter conditions, i.e., the static value in the heating season was presumed to be 14.8 °C. It is also necessary to consider that above the piles, the heated part of the building is placed, so this value is not expected to be lower due to the formation of the so-called urban heat island.
After initial circulation, heaters of average power 3182 W (79.5 W/m) were turned on, along with voltage and electric current monitoring to determine the coefficient of thermal conductivity in the time interval that lasted for 100.7 hr. During this condition, 320 kWh of energy was rejected into the ground.
After the temperature measurement, the output/input temperature of TRT was +28.1/+31.3 °C, which is Δ11.3 °C more than the static initial temperature of the ground if the outlet temperature from the pile is observed. In the heating cycle (inverse curve on the diagram—sub-cooling the ground), an equivalent temperature difference would mean the temperature of the circulating medium with input to pile at +2.3 °C and pile output at +5.5 °C.
The rise in temperature during this period increases linearly in the logarithmic time unit ln(t), indicating the achievement of the semi-steady state of the heat transfer. It indicates the ability of the pile to operate over a longer period of time at this heat rejection rate, with a relatively small further rise in temperature in the logarithm of the time function. Figure 5 shows the inlet and outlet fluid temperature data for the first interval of the pile test in the time function to determine the coefficient of effective thermal conductivity.
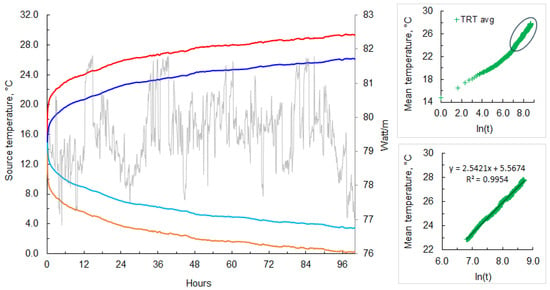
Figure 5.
First heat step and determination of effective thermal conductivity of the heterogeneous ground.
The diagram also shows the inverse temperature curve, for example, of heat energy extraction from the ground during the heating cycle (bottom lines). In order to determine the thermal conductivity coefficient of the ground, the data of the mean temperature of the circulating fluid from the first condition is drawn as a function of the natural logarithm of time ln(t)—upper right figure inside Figure 5. After the electric heater is set to a certain power level, the temperature in the energy pile starts to grow due to the thermal conductivity of the ground. This diagram is used to determine the period of time when the rise in temperature becomes linear in the function of the time (semi-steady state) and when the radius of investigation surpasses the thermal resistances of the pile and near-drilling zone. Using derivation curve analysis, it was established that the period in which the semi-steady state heat transfer appears is 10 h, since after this period, the temperature change in the 5 min step does not exceed 0.25 °C, i.e., there is a logarithmic dependence of temperature rise in time function. The 5-min step was chosen because it corresponds approximately to one cycle of fluid flow in the piles.
In order to determine the thermal conductivity coefficient of ground from the part of the data with linear dependence of the temperature on the logarithm of the time, the slope of the interpolated line is determined (lower right figure inside Figure 5), and using Equation (8) thermal conductivity is calculated. Given that the linear regression slope in Figure 5. is 2.5421, with a mean thermal power of 79.55 W/m, effective thermal conductivity for a 40 m pile is then 2.49 W/m K according to Equation (8), which is a very good value in thermogeology.
With calculated thermal conductivity and known geometry of the pile (diameter and length), it is possible to calculate the pile’s thermal resistance. It is composed of thermal resistance to the heat energy transfer from the working fluid to the plastic wall of the pipe (convection), to the conduction of the heat energy through the wall of the PE pipe, and to the conduction of heat energy from the wall of PE pipes to concrete grout and ground. With Equation (5), thermal resistance is calculated for the 600 mm pile diameter and 2-h Standard Moving Average, giving a value of 0.109 m °C/W. This value in thermogeology presents efficient heat transfer inside the pile, which is expected due to the concrete filling of the pile.
3.2. Thermal Response Step Test Results to Determine Extraction Capacity of the Pile
After the first condition of 3182 W (79.5 W/m) for 100.7 h, a cycle of thermal power reduction was started with the additional three thermal steps to achieve the temperature stabilization points and the established steady-state mode of operation (Figure 6).
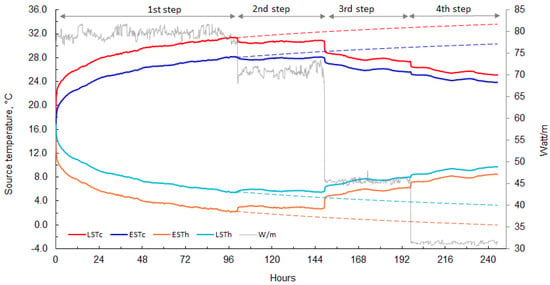
Figure 6.
Entire thermal response test of the ground with four heat steps and one extended condition (dotted lines).
By setting the steady-state temperature in each of the conditions as a separate point, it is possible to construct the pilot yield diagram for both heat rejection and heat extraction rate (W/m) as the function of the desired outlet temperature (EST), as seen in Figure 6. According to the EN14511 norm [18], the temperature for the cooling mode is set at EST/LST 30/35 °C and in the heating mode at EST/LST 0/−3 °C, which is used as a standardized norm for a reliable coefficient of performance (COP) of the heat pump. In the first condition, no steady state has been achieved, and the extended interval by the linear dependence of the logarithm of time was chartered (dotted lines in Figure 6) according to the general diffusivity equation.
With the graphically obtained equation of the steady-state heat transfer, the estimation of the heat exchanger steady-state yield seems to be 80 W/m, or 1.60 kW per 20 m long pile with the static temperature at 16.8 °C during the summer period. Therefore, it is possible to reject heat into the ground in the summer cooling mode at 30/35 °C for the mentioned 80 W/m (including waste compression heat). Therefore, the equation for estimating the cumulative cooling in W/m as the outlet temperature of the fluid is as follows:
According to norm EN14511, the EST of 0 °C is set in the heating cycle as the minimum permissible amount on the outlet of the pile during long-term operation. With constant heat load applied, it is also necessary to add the useful power of the heat pump compressor when operating in the heating mode. Since this is a shallow drilling, there is a climatic influence on soil temperature for the first 5–10 m; therefore, static temperature in the summer and winter seasons is not the same. To estimate the heat extraction potential of the piles, the static temperature values were corrected for an additional temperature drop of 2 °C (during the winter period). The static temperature from the measured summer 16.8 °C conditions was set to 14.8 °C in the winter conditions for the heating regime of the heat pump. Then, the equation for estimating the cumulative heating of the piles in W/m as the function of the outlet temperature of the fluid becomes as follows:
If a lower temperature limit of 0 °C is set as the minimum permissible on the heat pump evaporator, then by solving the trendline equation from Figure 7, the heat extraction yield of the pile is 66 W/m for EST = 2.7 °C and LST = 0 °C, at the flow of 0.25 L/s. That is, the yield of every 20 m depth pile would be 1.32 kWt in the function of continuous long-term steady-state space heating without further ground sub-cooling. To this value, it is necessary to add the useful power of the heat pump compressor to obtain the total heat power of the geothermal system.
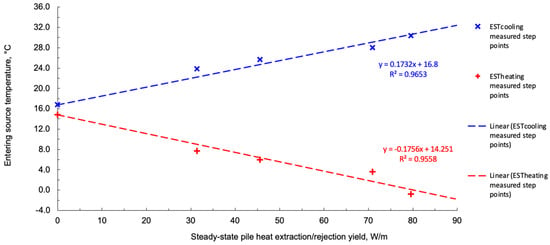
Figure 7.
Steady-state heat rejection/extraction rates during long-term operation in the function of the fluid temperature for the installed energy piles (with corrected static temperature during the winter period).
For example, in the system of 256 piles where they are connected as two in the series, a total of 338 kWth of heat power, plus compressor power, can be gained. However, it should be emphasized that it is a parallel bivalent system where the geothermal system carries the base load and runs continuously throughout the heating season, and the gas system complements the system at peak loads if needed.
Since field piles are spaced 4 m from each other, it is necessary to estimate thermal interference between individual piles (Figure 8). The diffusion equation is solved with the line source theory of heat energy flow through the infinite medium. With the knowledge of thermal conductivity and thermal diffusion, it is possible to calculate the soil temperature at a certain radius from the pile for continuous and uniform heat load. If the energy pile is extracting heat for the determined maximum yield of 66 W/m, or 1.32 kWt per pile, it is apparent that the radius of the affected area expands to half the distance between two piles or 2 m (blue line). In this case, the value of ground temperature drop equals 1 °C for 2000 full load hours. It should be stressed that for the efficient and sustainable operation of the system, it is necessary to use geothermal cooling for the facility, i.e., to store heat energy in the ground during the summer months. In this way, the system is brought into balance, and the negative changes of sub-cooling are reversed on an annual basis.
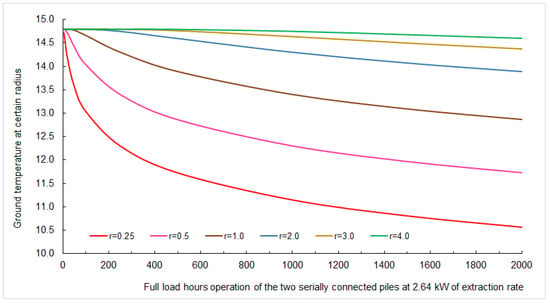
Figure 8.
Influence of thermal interference between energy pile system for different radii and the annual full-load hours.
3.3. Simulation of the Energy Pile Field and Optimization of the Borehole Grid
When modeling the BHE field and simulating the long-term operation of the heat pumps, a series of thermogeological parameters have to be considered, which, to a certain extent, affect the efficiency and economy of the entire system. Proper determination of the required length of the ground with adequate analytical and numerical models is the most important part of optimizing the system. Possible oversizing or undersizing of the heat exchanger will energetically and economically irreversibly affect the system as a whole. If the heat exchanger is undersized when modeling the system, it will directly reduce the thermodynamic efficiency of the heat pumps in the normal operating mode. In an undersized system, if the heat balance in the ground is not fully restored between the two seasons, the soil temperature will gradually sub-cool for many years to technically unacceptable working fluid temperature values in the pipes and ultimately cause the heat pump to stop working. Also, increasing the viscosity of the working fluid at lower temperatures by adding too much glycol mixture can cause laminar flow in the pipes, thereby increasing the equivalent pile resistance and reducing heat transfer. The correct dimensioning of the ground exchanger and the operating working temperature must, therefore, reduce a long-term negative change in soil temperature and working fluid temperature to a minimum. These changes are caused solely by imbalances in heat extraction and rejection between seasons, as well as by thermal interferences between individual piles in a particular geometric grid. The imbalance especially appears in locations where one of the heating or cooling cycles is dominant.
For the case study in question, a simulation of the geothermal system was conducted to establish the expected consumption of the thermal and cooling energy of the facility since there are 13 separate dilatations, with central heating and cooling of all facilities (Figure 9).
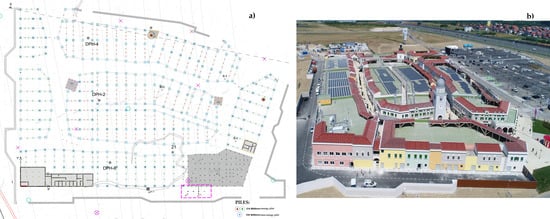
Figure 9.
(a) Pile grid arrangement of 256 × 20 m energy piles in different concrete dilatations; (b) current view of commercial buildings after system completion.
For the design outdoor temperature of −13 °C and an interior temperature of 20 °C, the thermal losses of the building at peak load were determined at 370 kWth, with the cooling requirements at 750 kWf. As previously determined, the maximum load of a single pile is 1.32 kWth, where temperatures at the inlet and outlet of the heat exchanger do not fall below the techno-economically set limit of EST = 0 °C (minimum operating regime 0.0/−2.5 °C at peak consumption). For a geothermal field of 256 pilots (128 pairs of piles connected by two in series), the installed heat power of the piles grid is then 336 kWth.
In the heating cycle, the cumulative delivered heat power is the sum of the installed heat power of the piles and the compressors of the heat pumps. If the work of the heat pump with COP = 4.0 is foreseen (for example, EST/LST = 0.0/−2.5 °C; LLT/ELT = 42/37 °C), then the compressor power will be 112 kWe and the system can total deliver 448 kWth of energy to the consumer in the peak period.
In the cooling cycle, the heat power of the compressors is waste heat and must be rejected to the ground together with the heat from the facility. For the same type of heat pump as in the heating cycle, the cooling effect for the operating regime EST/LST = 30/35 °C and LLT/ELT = 7/12 °C would be 477 kWf with the EER of 5.46. The power of the compressor would be 107 kWe, and the geothermal field of the piles would be operating with a total of 584 kWf.
Based on the analysis of the results of the step TR test and the equations of a steady-state heat transfer, it was seen that the field of 256 pilots could fully meet the heating energy needs of the building with a technically economical mode of operation. However, it was seen that the pile field could not fully meet the cooling needs of the building while respecting the technically economically acceptable EER on the heat pumps and critical limit temperature on condensers. As part of the mechanical engineering design, the commercial building was equipped with a backup heating system using gas boilers, as well as a dry cooling tower in a bivalent energy cooling system.
In order to use mostly renewable shallow geothermal energy, it was necessary to model the system with dedicated geothermal software in order to find a bivalent cooling point where the geothermal system will work efficiently and where the energy ratios from the renewable source will be favorable. Two scenarios were simulated. In the first one, 100% of the heating and cooling needs were covered by the geothermal system to set the basis, and in the second, the use of a bivalent cooling system is considered. The simulation was performed in the Earth Energy Designer (EED v4.19) program package, which achieved the optimum design of the pile grid and energy usage.
Scenario 1. Energy consumption of the facility in the heating and cooling was calculated for the situation where 100% of the heating and cooling demands are recovered from the geothermal resource and are determined at a total of 487.5 MWhf for cooling and 555.0 MWhth for heating (Table 1). Given the peak values of the heating (370 kWth) and cooling (750 kWf) capacity, the total equivalent full load working hours of the heat pumps would be 1500 h in heating and 650 h in cooling. The simulation results showed that during cooling in peak conditions, pile fluid reaches an EST of 37.0 °C (LST 40.0 °C), which is technically and economically unacceptable as a condition at heat pump condensers (Figure 10). Therefore, it was necessary to reduce the rejected energy values to the ground level using the auxiliary dry coolers during the warmest period of summer. However, the fluid temperatures during the first heating season in winter are quite high due to the substantial heat energy rejected into the ground during the summer, with mean EST at 6.5 °C (LST 3.5 °C)

Table 1.
Heating and cooling energy needs in Scenario 1.
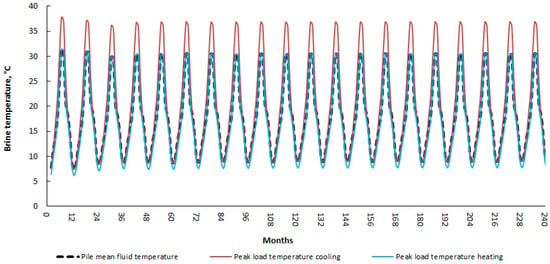
Figure 10.
Temperature evolution of brine in energy piles over 20 years for Scenario 1.
Scenario 2. The second scenario implies the use of a bivalent cooling system by setting the bivalent point at an air temperature of 27 °C. Above this point, cooling capacity is also taken by the dry coolers so that the geothermal source remains in an effective temperature regime and avoids overheating of the pile fluid. By analyzing the frequency of occurrence of temperature bins for the City of Zagreb, it was shown that for average values of 15-year data, temperatures above 27 °C appear in 593 h. The energy analysis in Table 2. shows the cooling needs of Scenario 2, with different energy needs and peak power in the cooling mode when compared to Scenario 1. In this case, the geothermal field takes over 70% of the total cooling needs of the facility, i.e., 343 MWhf of cooling energy, with a peak cooling power capacity of heat pumps equal to 438 kWf in July. The remaining cooling energy of around 140 MWhf per year is taken over by dry coolers, with a total peak cooling power of the bivalent system of 750 kWf in July. Figure 11 shows the simulation results of monthly minimum, mean, and maximum heat exchanger fluid temperatures for the following 20 years of system operation.

Table 2.
Heating and cooling energy needs in Scenario 2.
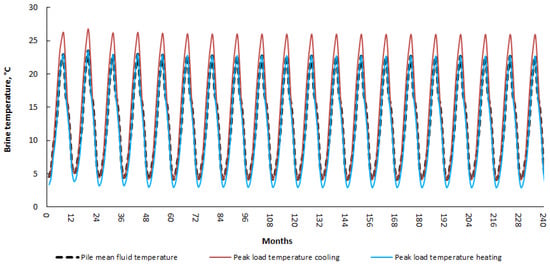
Figure 11.
Temperature evolution of brine in energy piles over 20 years for Scenario 2.
The simulation results showed that during cooling in peak conditions, pile fluid reaches a mean temperature of EST 26.0 °C (LST 29.0 °C), while during heating in peak conditions, it reaches a mean temperature of EST 4.5 °C (LST 1.5 °C), which is technically and economically acceptable for the system operation.
4. Conclusions
In order to have an optimized design of the ground heat exchanger field, it is necessary to determine thermogeological properties at the site itself. For this reason, thermal response tests, both classic and step tests, should be an integral part of every shallow geothermal project during its construction process. Obtained results of the ground thermal conductivity and pile resistance (pile skin factor) should be used in optimizing to avoid oversizing or undersizing of the ground heat exchanger field, thus leading to an ineffective system. Furthermore, when designing an energy pilot system, the imbalances in the heat extraction and rejection between seasons, as well as thermal interferences between individual piles in a particular geometric grid, have to be accounted for. The imbalance usually appears in locations where either heating or cooling is dominant or in cases where, due to very shallow installation, the effect of ground seasonal temperature change is more visible (different static temperatures of the ground in the heating/cooling season).
After iterative computational simulations on the geothermal field of energy piles at the case study location, Scenario 2, with a bivalent cooling system, was found to meet the technical requirements for the system to operate at optimum.
The total energy for the heating cycle was predicted to be obtained by geothermal heat pumps and 256 piles installed in the field. In the heating mode, the peak capacity of the system is 370 kWth on the geothermal heat exchanger, and during the year, 555.0 MWhth of heating energy is delivered to the consumer, assuming COP = 4, which approximately corresponds to 1500 equivalent FLH. The average temperature of the pile fluid does not fall below EST 3.0 °C (LST 0.0 °C) during the coldest months of February after 20 years. In the base load mode, the minimum average temperature of the pile for the coldest month of February after 20 years is EST 4.1 °C (LST 1.1 °C). Temperatures show uniformity over the course of 20 years due to the somewhat equilibrium in energy extraction and rejection from the ground.
In the cooling mode, the peak capacity of the system is 438 kWf on the geothermal heat exchanger, and during the year, 344.0 MWhf of cooling energy is delivered to the consumer, assuming EER = 4.5, which approximately corresponds to 785 equivalent working hours at full load. It should be noted that the cumulative cooling energy rejected by the geothermal exchanger is the sum of the energy from the facility and the waste heat of the compressors. The system operates in a bivalent mode, which means that dry coolers cover a residual capacity of around 140 MWhf, with a combined maximum peak capacity of 750 kWf. The mean pile temperature does not rise above 30 °C for peak consumption (EST 26.0 °C; LST 29.0 °C) during the hottest month of August after 20 years. In the base operating mode, the maximum mean pile temperature for the hottest month of August after 20 years is EST 22.5 °C (LST 25.5 °C).
This project is the biggest case study with energy piles in the Republic of Croatia, and certainly respectable in size amongst the ones in the EU. This analysis showed that energy piles could be economically attractive options as a solution for renewable heating and cooling for buildings that require such support ground structures. This is due to the fact that no extra drilling is needed except for an already-needed pile during building construction. Special care, however, should be taken to the hydraulics of the system to ensure a designed flow to every pile in the field.
Author Contributions
Conceptualization, T.K. and M.M.; methodology, T.K.; software, T.K.; validation, M.M.; formal analysis, T.K. and M.M.; investigation, M.M.; data curation, M.M.; writing—original draft preparation, T.K. and M.M.; writing—review and editing, T.K. and M.M. All authors have read and agreed to the published version of the manuscript.
Funding
This research is performed according to the project objectives of the Interreg Danube Region Programme, Project ID DRP0200244, Project Danube GeoHeCo (Fostering the implementation of shallow Geothermal Hybrid Heating and Cooling Systems in the Danube Region).
Data Availability Statement
Data Availability Statement: The original contributions presented in this study are included in the article. Further inquiries can be directed to the corresponding author.
Conflicts of Interest
The authors declare no conflicts of interest.
Abbreviations
| c | specific heat (J/kg °C) |
| Ei | exponential integral |
| r | radius around line source |
| rw | wellbore radius (m) |
| Rb | equivalent pile resistance (°C m/W) |
| s | skin |
| t | time (h) |
| Ti | undisturbed mean ground temperature (°C) |
| T | pile fluid temperature (°C) |
| q′ | heat power (W/m) |
| α | thermal diffusivity (m2/h) |
| γ | Euler’s constant |
| λ | thermal conductivity of ground (W/m K) |
| ρ | density of the ground (kg/m3) |
| BHE | Pile heat exchanger |
| CFA | Continuous flight auger |
| COP | Coefficient of performance |
| EER | Energy Efficiency Ratio |
| ELT | Entering load temperature |
| EST | Entering Source Temperature to the heat pump |
| FLH | Full load hours |
| GSHP | Ground-source heat pumps |
| IS | Initial state |
| LST | Leaving Source Temperature from the heat pump |
| LLT | Leaving load temperature |
| MD | Measured |
| PE | Polyethylene |
| RC | Resistant to crack |
| SDR | Standard dimension ratio |
| SS | Steady-state |
| SSS | Semi-steady state |
| SSTRST | Steady State Thermal Response Step Test |
| TRT | Thermal Response Test |
| USS | Unsteady-state |
References
- European Comission (EC). Advancing District Heating & Cooling Solutions and Uptake in European Cities: Overview of Support Activities and Projects of the European Commission on District Heating & Cooling; Publications Office of the European Union: Luxembourg, 2023. [Google Scholar]
- Song, H.; Pei, H.; Zhang, P. Probabilistic method for the size design of energy piles considering the uncertainty in soil parameters. Undergr. Space 2023, 10, 37–54. [Google Scholar] [CrossRef]
- Jelušič, P.; Žlender, B. Determining optimal designs for conventional and geothermal energy piles. Renew. Energy 2020, 147, 2633–2642. [Google Scholar] [CrossRef]
- Ghasemi-Fare, O.; Basu, P. Predictive assessment of heat exchange performance of geothermal piles. Renew. Energy 2016, 86, 1178–1196. [Google Scholar] [CrossRef]
- Mehrizi, A.A.; Porkhial, S.; Bezyan, B.; Lotfizadeh, H. Energy pile foundation simulation for different configurations of ground source heat exchanger. Int. Commun. Heat Mass Transf. 2016, 70, 105–114. [Google Scholar] [CrossRef]
- Liu, H.; Maghoul, P.; Bahari, A.; Kavgic, M. Feasibility study of snow melting system for bridge decks using geothermal energy piles integrated with heat pump in Canada. Renew. Energy 2019, 136, 1266–1280. [Google Scholar] [CrossRef]
- Wang, F.; You, T. Synergetic performance improvement of a novel building integrated photovoltaic/thermal-energy pile system for co-utilization of solar and shallow-geothermal energy. Energy Convers. Manag. 2023, 288, 117116. [Google Scholar] [CrossRef]
- Garakani, A.A.; Derakhshan, A. Implementing micro energy piles: A novel geothermal energy harvesting technique for enhancing foundation safety and cooling system efficiency in electric power transformers. Geothermics 2024, 123, 103097. [Google Scholar] [CrossRef]
- Lee, J. Well Testing; Society of Petroleum Engineers of AIME (SPE): Richardson, TX, USA, 1982. [Google Scholar]
- Ingersoll, L.R.; Plass, H.J. Theory of the ground pipe heat source for the heat pump. ASHVE Trans. 1948, 54, 339–348. [Google Scholar]
- Carslaw, H.S.; Jaeger, J.C. Conduction of Heat in Solids; Claremore Press: Oxford, UK, 1946. [Google Scholar]
- Gehlin, S. Thermal Response Test: Method Development and Evaluation. Ph.D. Thesis, Luleå University of Technology, Luleå, Sweden, 2002. [Google Scholar]
- Kurevija, T.; Macenić, M.; Strpić, K. Steady-state heat rejection rates for a coaxial borehole heat exchanger during passive and active cooling determined with the novel step thermal response test method. Min. Geol. Pet. Eng. Bull. 2018, 33, 61–71. [Google Scholar] [CrossRef]
- Kurevija, T.; Strpić, K.; Koščak-Kolin, S. Applying petroleum the pressure buildup well test procedure on thermal response test—A novel method for analyzing temperature recovery period. Energies 2018, 11, 366. [Google Scholar] [CrossRef]
- Chiasson, A.D. Geothermal Heat Pump and Engine Systems; ASME Press and John Wiley & Sons: Hoboken, NJ, USA, 2016. [Google Scholar]
- Matthews, C.S.; Russell, D.G. Pressure Buildup and Flow Tests in Wells; Society of Petroleum Engineers of AIME (SPE): Richardson, TX, USA, 1967. [Google Scholar]
- Basch, O. Osnovna Geološka Karta SFRJ 1:100.000, List Ivanić-Grad L33–81; Geološki Zavod: Zagreb, Croatia; Savezni Geološki Institute: Beograd, Serbia, 1983. [Google Scholar]
- EN 14511:2011; Air Conditioners, Liquid Chilling Packages and Heat Pumps with Electrically Driven Compressors for Space Heating and Cooling. CEN: Brussels, Belgium, 2011.
Disclaimer/Publisher’s Note: The statements, opinions and data contained in all publications are solely those of the individual author(s) and contributor(s) and not of MDPI and/or the editor(s). MDPI and/or the editor(s) disclaim responsibility for any injury to people or property resulting from any ideas, methods, instructions or products referred to in the content. |
© 2025 by the authors. Licensee MDPI, Basel, Switzerland. This article is an open access article distributed under the terms and conditions of the Creative Commons Attribution (CC BY) license (https://creativecommons.org/licenses/by/4.0/).