Article

Age of Blown Sand in the East Slovak Lowland—Case Study from Svätuše Sand Pit, Slovakia

by
Diana Dirnerová
1,*,
Roman Farkašovský
1 and
Róbert Hinca
2
1
Institute of Geosciences, Faculty of Mining, Ecology, Process Control and Geotechnologies, Technical University in Košice, Letná 9, 040 01 Košice, Slovakia
2
Institute of Nuclear and Physical Engineering, Faculty of Electrical Engineering and Informatics, Slovak University of Technology in Bratislava, Ilkovičova 3, 841 04 Bratislava, Slovakia
*
Author to whom correspondence should be addressed.
Geosciences 2025, 15(11), 429; https://doi.org/10.3390/geosciences15110429
Submission received: 21 August 2025 / Revised: 6 November 2025 / Accepted: 10 November 2025 / Published: 12 November 2025

Abstract

A sedimentary profile consisting of blown sand capped by a sand-loam bedded interval was analysed in the Svätuše sand pit in the East Slovak Lowland. Stratigraphically, blown sands from this lowland have so far only been indirectly classified into the Weichselian glacial, mainly into its middle and upper stages. The age classification presented in this study results from the optically stimulated luminescence dating method. It identifies the blown sand from the Svätuše as originating during the Early Glacial and Early Pleniglacial phases of the Weichselian glacial (MIS 4–5d). At the end of the Early Glacial phase of the Weichselian glacial, palaeoenvironmental conditions changed. The deposition of blown sand became episodic rather than continuous. As a result, the analysed sedimentary record is composed of a sand-loam interbedded interval in the uppermost part.

1. Introduction

Aeolian sediments play a crucial role in indicating climatic and environmental conditions during the Quaternary period. Using luminescence methods, they are relatively easy to date, thus creating the possibility of correlating the lithological record with the stratigraphic record and inferring past climatic conditions.
The ages of the aeolian sediments determined by the OSL dating method range from a few decades to at least 150 kyr in Western Europe [1]. There are also numerous studies dealing with the age classification of aeolian sediments within Central Europe based on OSL dating. Almost all of them are identified as deposited during the Last Glacial Maximum up to the Holocene era [2,3,4,5,6].
In Slovakia, Quaternary aeolian sediments are preserved in the Danubian Lowland and Záhorská Lowland in the west, and the East Slovak Lowland in the east. Many researchers have achieved valuable results in the sediments from East Slovakia (authors mentioned below), but information about their age has been determined indirectly. Aeolian sediments of the East Slovak Lowland have been identified as having started to form during the cool dry periods of the Pleistocene, when soft material was blown off by the wind and deposited in typical forms like loess sheets at first, and, later, sand dunes [7]. Only sporadic preservation of these sediments is interpreted as related to the sedimentation under steppe-tundra conditions in predominantly swamp depositional settings with relatively frequent floods [8,9].
The age of the aeolian sediment deposition was determined as the Holsteinian (MIS 9–11) up to early and middle Weichselian (MIS 3–5) in the case of loess sheets [7,10] and as the end of Weichselian (MIS 2) and the Holocene in the case of blown sand [11,12]. In both cases, the age was determined through the analysis of the obtained fauna remnants. Pelíšek [13] stated that the genetically various types of blown sand are preserved in the area. The older ones, stratigraphically positioned under the alluvial floodplain, were identified as formed during the Late Weichselian (MIS 2) or later. The younger ones are classified as having been deposited during the Holocene (MIS 1) over the loess sheets and may have been formed by re-blowing the previously deposited blown sand.
Within the blown sand, a striking horizon of intercalated red-brown clayey sand and grey-yellow loose sand layers was recorded by some authors (e.g., [7,9]). As Kvitkovič [7] summarised in his paper, the interpretation of this horizon formation differs between authors. Some consider pedogenesis as a formation process, but others are inclined to solifluction in a periglacial climate. Regarding the latter interpretation, the age of this sand was put into the periglacial period at the end of MIS 2 [7,10]. Although most authors agree on this age of aeolian deposits, Košťálik [9,10] states that, for the blown sand, the earlier ages (MIS 3–5) cannot be excluded.
The source of aeolian sediments represents fluvial deposits of adjacent rivers [14] that brought material from the Neogene volcanic source as well as flysch-sandstone formations [15]. The wind-driven transport was established as mostly from the north [8,15,16], which was also documented from the adjacent region in Hungary as a continuation of the aeolian sand of East Slovakia. In this area of Hungary, the age of blown sand is interpreted as Late Glacial to Holocene (MIS 1–2), and the age is deduced from the radiocarbon dating of fossil soils (and their included charcoal remnants) preserved as horizons within this sand (e.g., [2,17,18,19,20]).
The classification of aeolian sediments in the East Slovak Lowland by age has so far been deduced based on preserved faunal remains or based on lithology and geomorphology. Concerning the lack of age data confirmed by numerical dating methods, the main aim of this study is to determine the age range of blown sand in the area of the East Slovak Lowland. For this purpose, an active sand pit Svätuše, was selected as study locality, because of the opportunity to analyse the total thickness of the sand dune, from its base to the top (almost 15 m), including the uppermost sand-loamy interval. For more comprehensive conclusions, the following tools were chosen: detailed sedimentary analysis focused on preserved sedimentary structures, as well as petrographic analysis focused on quartz grains required for OSL dating.

2. Location and Geological Settings of the Study Area
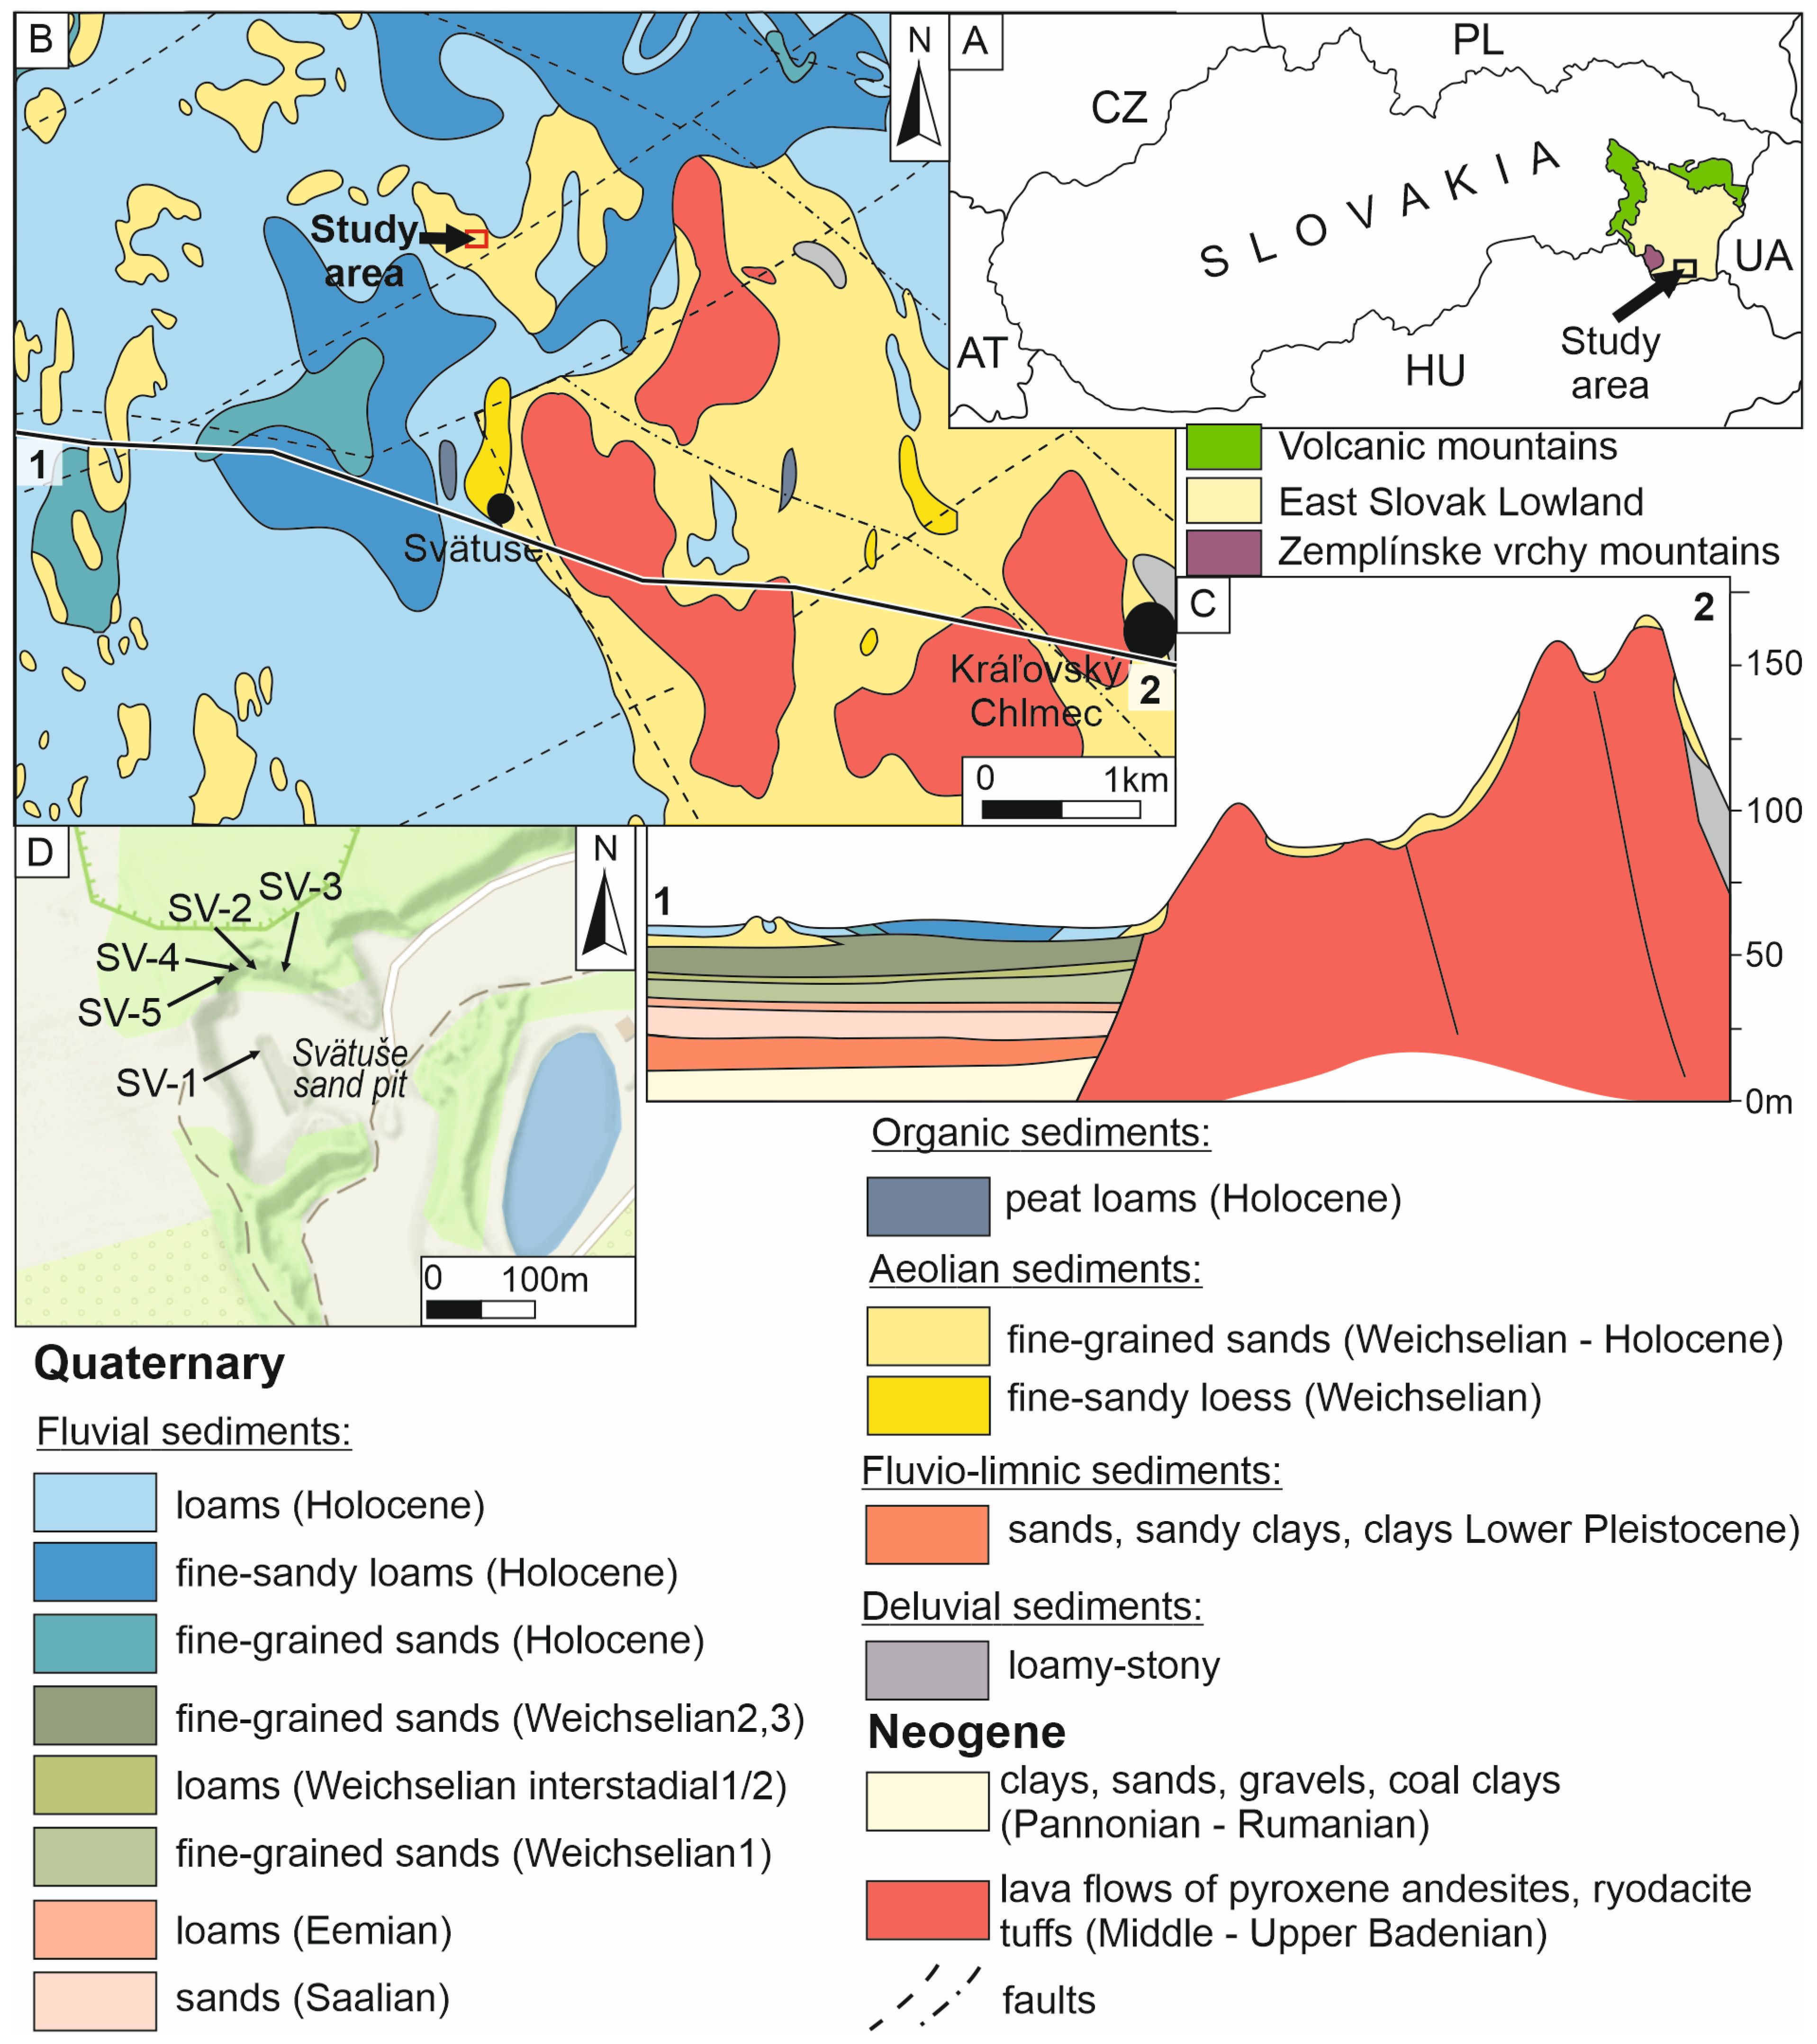
The study area is located in the southeast of eastern Slovakia, near the village Svätuše, 4.5 km NW of Kráľovský Chlmec (GPS coordinates: 48°26′31″ N, 21°55′23″ E). It is an area where blown sand [8,21] is preserved locally. It represents remnants of dunes significantly destroyed due to erosion, mining processes, and agricultural activity. As a result of the orthophotomosaic and digital terrain analysis, Bónová et al. [15] identified various types of dunes.
It is an area of the East Slovak Lowland, the geomorphologic unit bordered by some striking positive morphostructures to the NE, SW, and W. These are represented by the Neogene volcanic Slanské vrchy Mts. and Vihorlat Mts., and by the Zemplínske vrchy Mts. (Figure 1).
Figure 1. Location of the study area: (A)—map of Slovakia showing the position of the East Slovak Lowland and surrounding Slanské vrchy Mts., Vihorlat Mts. and Zemplínske vrchy Mts.; (B)—geology of the study area and its surroundings (geological map after Baňacký et al. [21]); (C)—cross-section of the area indicating position of the Quaternary deposits; (D)—close-up of the profile with arrows indicating the position of the samples taken (detailed position is also in Figure 2).
Geosciences 15 00429 g001
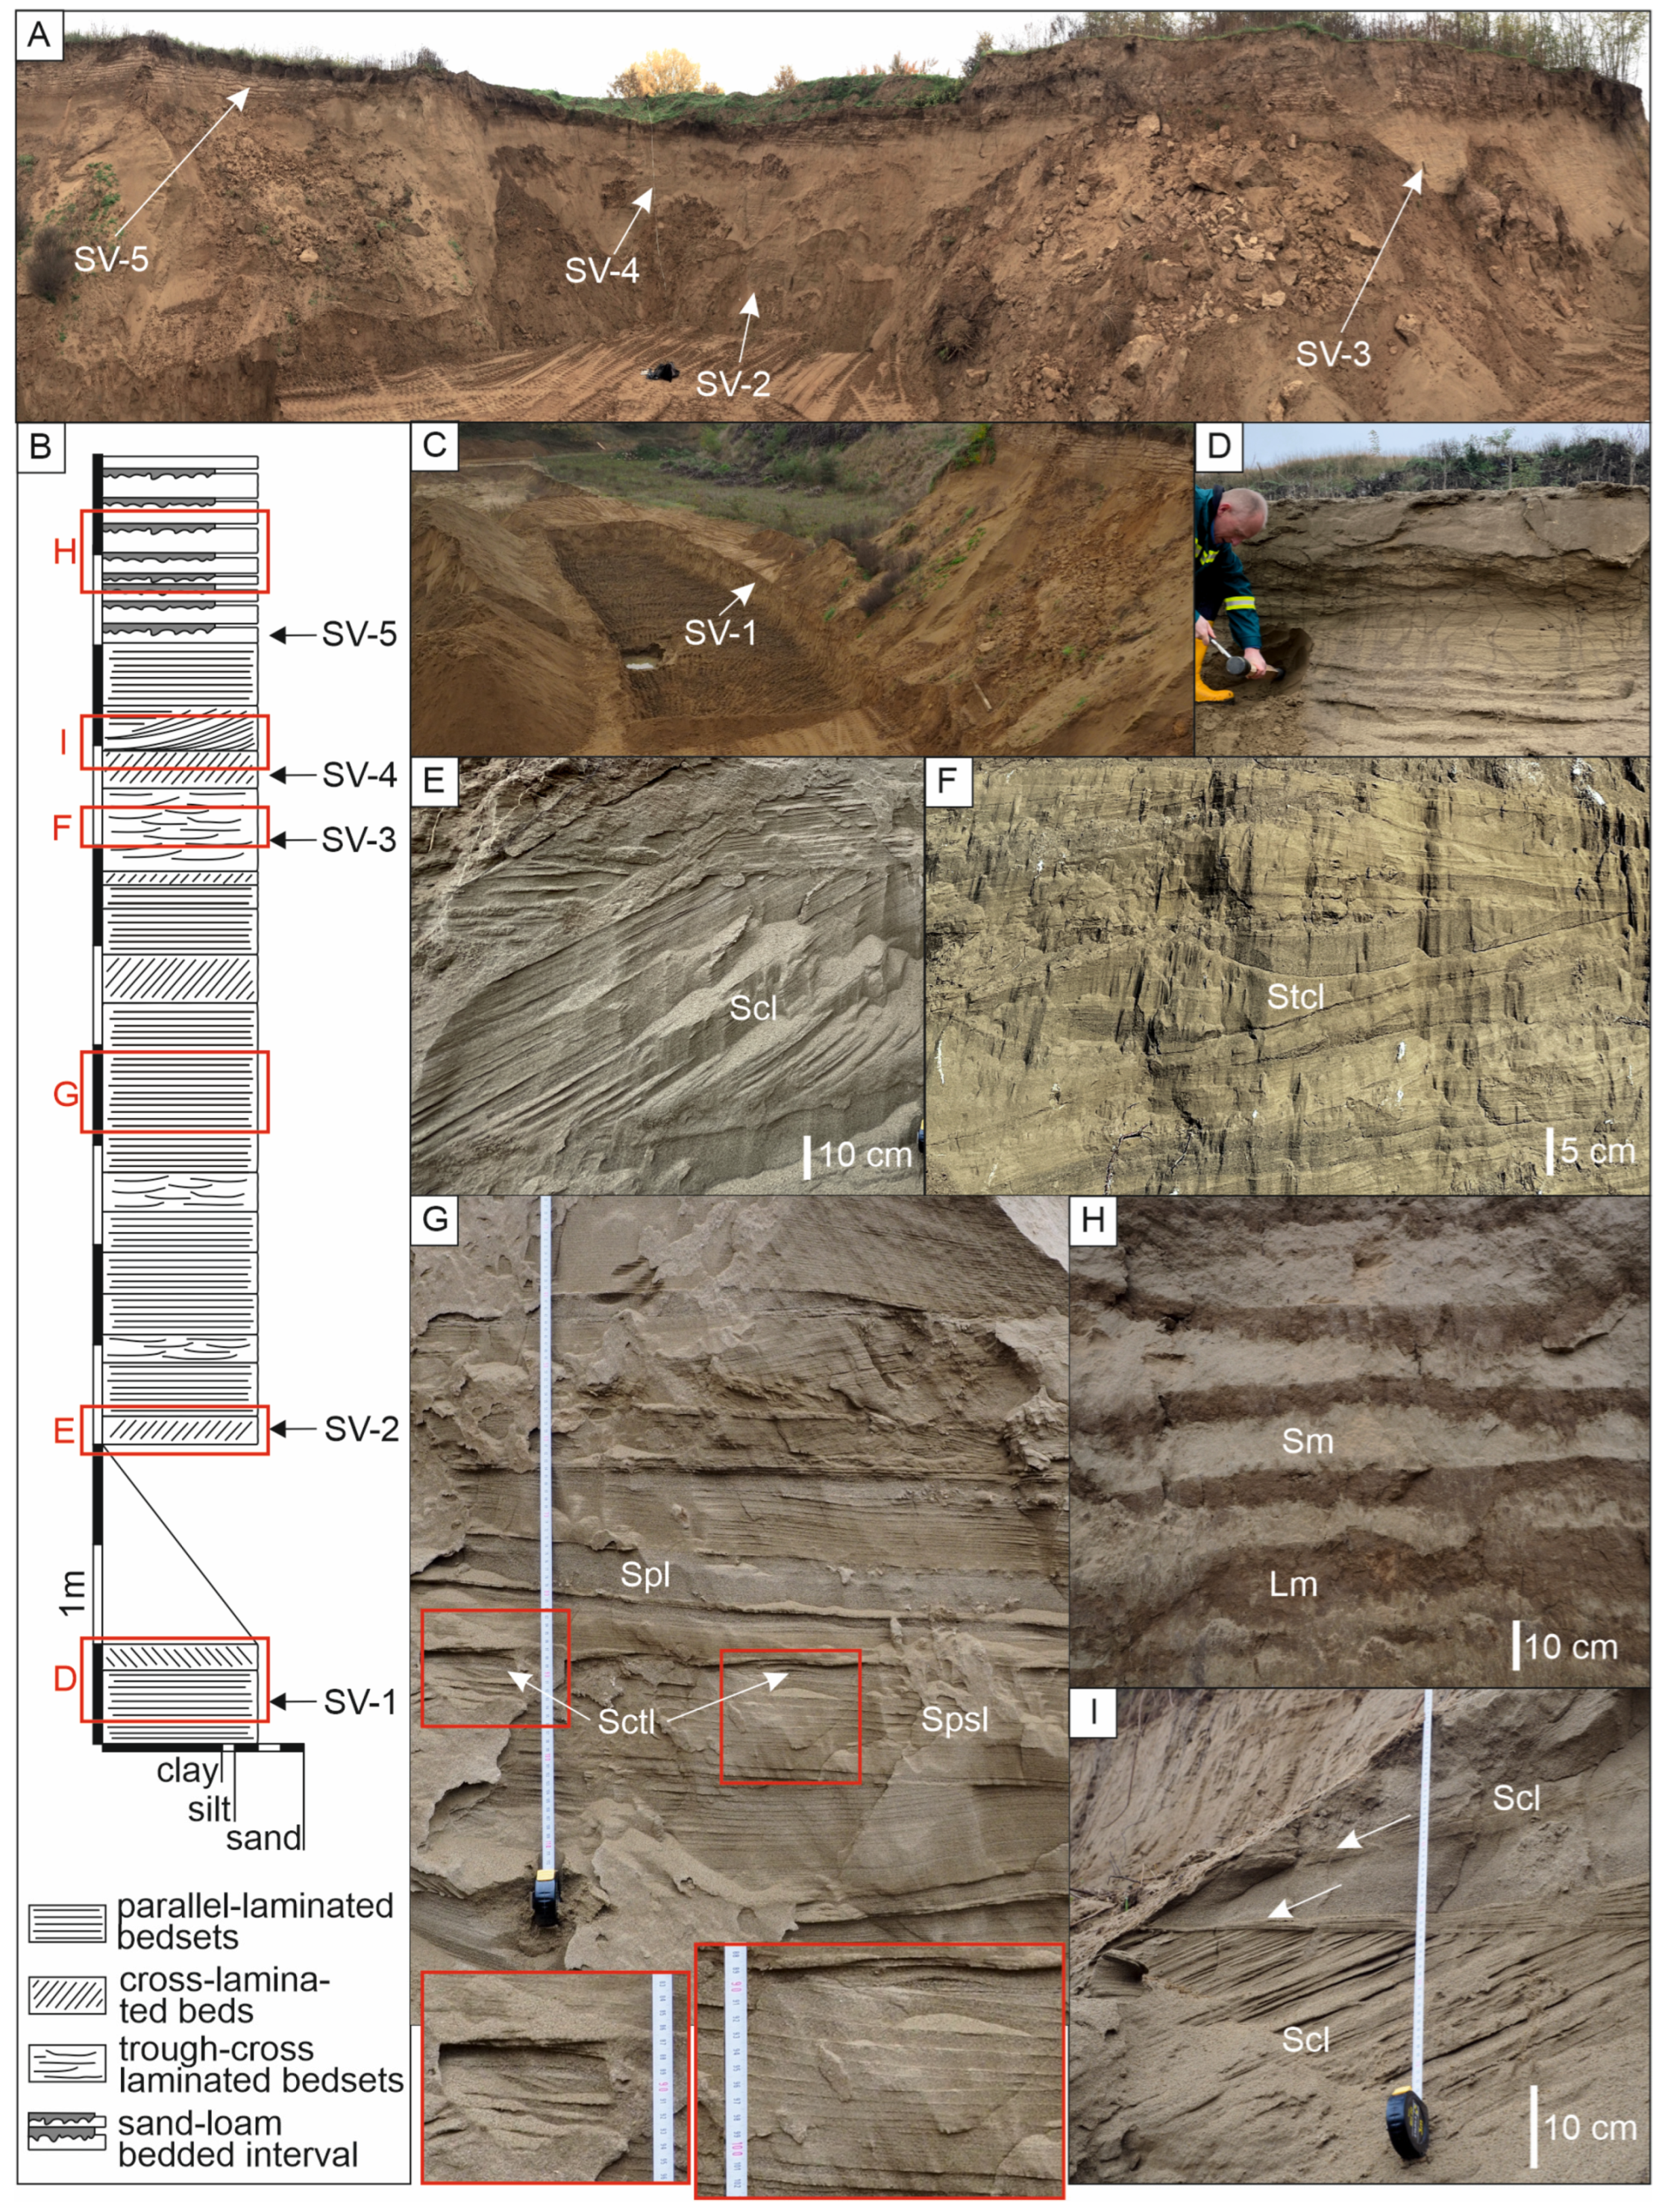
Figure 2. Results of the sedimentological analysis: (A)—part of the sand pit with position of sand samples collected for OSL dating; (B)—schematic sedimentary record of the study area with position of samples analysed by OSL dating (red rectangles indicate position of the photodocumentation); (C)—another view from sand pit allowing the view on the sampling position of the lowermost sample; (D)—sand of the lowermost part with process of sampling; (E)—cross-laminated sand (Scl)with tangential bottom; (F)—trough cross-laminated beds (Stcl) with visible grain-size variations; (G)—parallel laminated bedset consisting of various subtypes like: climbing translatent lamination (Sctl; close-up on the left), pin-stripe lamination (Spsl; close-up on the right), and plane-bed lamination (Spl); (H)—alternating beds of structure-less sand (Sm) and loams (Lm); (I)—cross-laminated sand beds with tangential bottoms pinching-out downdip (highlighted by arrows).
Geosciences 15 00429 g002
Geologically, the area is situated in the Trebišov depression [22], an eastern part of the East Slovak Basin. The basin is filled by Miocene (Eggenburgian) to Pliocene clastic sedimentary rocks interbedded with evaporites and caustobioliths, predominantly due to shallow-marine sedimentation (Figure 1C).
Volcanism, as a consequence of back-arc extension following the subduction of the Outer Carpathian basement below the overriding orogen [22,23], also participated in the depositional history of the basin. Individual stages of volcanic activity are represented by bimodal rhyolite-andesite aerial volcanism, lava flows, and associated volcanoclastic deposition [8,23].
Recently, the area of the East Slovakia Lowland has become relatively flat. Deposits of the locality lie in the tectonic depression characterised by a small-scale to medium-scale downthrow during the Quaternary period [24]. The total Quaternary subsidence in the depression was approximately 70 m [8]. Descending parts of the lowland have been filled with fluvial sediments from nearby rivers Bodrog, Latorica, Laborec, and Ondava, which flow in from the north. The fluvial loams and fine-grained sand, occasionally deluvial stony loams, and organic sediments are typical of the area (Figure 1C). River sediments were locally redeposited by the wind and created accumulations of blown sand, especially near small positive morphostructures formed by isolated relics of volcanic bodies. Sandy loesses were deposited in a lesser amount. Volcanics are here defined as pyroxenic andesites and redeposited andesite tuffs (Figure 1).

3. Materials and Methods

3.1. Sedimentary and Petrographic Analysis

The sediments considered in this study were examined through field observations of the Svätuše sand pit, which is active, and its mining is in progress. At the time of research, two sand walls were accessible for study, one oriented in an ENE-WSW direction and one in a NNE-SSW direction (Figure 1C). Concerning the predominant S-ward direction of the paleo-winds forming the blown sand in the area [8,10,15,16], it was possible to document the sedimentary structures on the lee-side of the sand dune as well as transversal. This allowed correlation and better interpretation of individual sediment beds. The sand walls display up to 10 m of sedimentary record vertically, but laterally, it was more limited because of the soft sediment and the steep walls, which were in danger of collapsing.
The precise lithological classification of the sand was examined by grain-size analysis using the dry sieve method. For sieving, a vibratory sieve shaker Retch AS 200 was employed. Mesh sizes of the sieves were selected concerning the limit values of the Udden-Wentworth grain size scales (63, 125, 250, 500, 1000 μm [25]). The mud fraction (under 63 μm) was not further analysed due to its small percentage. As follows, the obtained data were statistically evaluated (calculations after Folk and Ward [26]; classification after Folk [27]) for an accurate lithological classification.
The modal composition of the sand grains, their size, and rounding were investigated in thin sections, which were prepared by embedding loose sand grains in epoxy. All microscopic observations were made using a petrographic polarising microscope, Olympus BX53, with a Promicam 3-3CP camera. The long diameters of the sand grains were measured in the photomicrographs of the thin sections using QuickPHOTO Camera 3.2 software. More than 600 individual sand grains were measured in each thin section. Microscopic grain size determination was performed to support the sieve analysis. Categories of sand grain roundness were assessed according to Pettijohn et al. [28].

3.2. Sampling and Sample Preparation for Dating

Five representative samples, designated as SV-1 to SV-5 (more details in Figure 1 and Figure 2), were taken from the sand profile for the OSL dating to determine the age range of its deposition. The first sample, SV-1, was taken below the lowest level of the sand pit, which represents the base of blown sands preserved (the precise location of sampling is in Figure 1 and Figure 2C). Samples SV-2 to SV-5 were collected from the sand wall formed as a result of the mining process, where the uppermost was positioned under the sand-loam interval (Figure 1 and Figure 2).
Sampling was realised by opaque metal tubes to prevent exposure of the sediment to daylight, as is needed in the case of OSL dating. Sediment was also collected into transparent bags for gamma spectrometry and petrography.
OSL sample handling, preparation, and measurement were performed in the OSL dating laboratory within dark room conditions at the Institute of Geosciences of the Technical University of Košice. At first, the samples were completely dried and sieved to obtain the grain size fraction of 180–250 μm. Quartz grains needed to be separated, and for this purpose, routine methodology (e.g., [29]) was used. At first, the sediment was etched with HCl (30%, 2 h) and H2O2 (10%, 24 h) for the elimination of carbonates and organic matter, respectively. Then, heavy liquid separation, using LST fastfloat (sodium heteropolytungstates), was carried out. This step was repeated for better results. Very often, the process of quartz separation is complicated, mainly by the higher feldspar admixture due to their similar density values. Therefore, HF (40%, 1 h) etching was carried out using different dissolution rates for both minerals. In addition, it also led to the necessary etching of the quartz grains and the removal of their outer alpha-irradiated layer.

3.3. Optically Stimulated Luminescence (OSL) Dating

For the dating of the samples analysed in this study, the automated TL/OSL reader (model Risø TL/OSL-DA-20) equipped with a calibrated 90Sr/90Y beta source was used. The samples were analysed using the single-aliquot regenerative dose protocol [30,31,32], which allows correction for sensitivity changes and monitoring potential signal recuperation. The accuracy of sensitivity correction was controlled by a recycling test, in which it was tested whether the signal from two different measurement cycles with the same regeneration doses is the same; and a recuperation test, where it was tested whether a zero regeneration dose gives no signal.
The dating process of all analysed samples included a purity test important for revealing the possible contamination by feldspars and related overestimation of the calculated dose; a preheat test for the evaluation of the correct preheat temperature; and a dose recovery test for the verification of whether the preheat plateau test was interpreted accurately and selected conditions for measurements fit well.

3.4. Dose Rate Analysis

To calculate the age of sediments using the OSL dating method, it is necessary to determine the naturally occurring radiation of the analysed samples and then determine their dose rate. In this study, the radioactivity was identified by the gamma spectrometry measurement in the Low-activity laboratory of the Institute of Nuclear and Physical Engineering of the Slovak Technical University in Bratislava, where the mass activities of natural radionuclides were specified. The measurement was performed in a low background chamber with a high-resolution HPGe detector using Marinelli beakers to ensure geometry [33].
Information about the mass activities of individual radionuclides was converted to beta and gamma dose rates based on conversion factors [34]. For the analysis of the total dose rate, the cosmic ray dose rate was also estimated based on the burial depth and altitude of the individual samples, as well as their water content in the natural and saturated states. Since the samples for this study were collected from an active sand pit, the burial depth was not taken to be the actual mining surface, but the natural surface represented the reference level.

4. Results and Interpretation

4.1. Grain Size Analysis

Only minor differences in grain size were recorded during terrain works for the sand of the profile (Figure 2). This observation was confirmed by the grain-size analysis of individual samples (Table 1). As a result, fine-grained, fine- to medium-grained, and very fine- to fine-grained sand were distinguished. Silt and clay (mud) content, or coarse sand content, is negligible. Only in one sample does the mud content reach more than 5% (microscopically identified as almost only coarse silt), which was also the reason why the mud content was not analysed in more detail.
The microscopically determined grain size corresponds to the results of sieve analysis. The smallest grains measured in thin sections are around 40 µm in size, which puts them in the silt category. The content of these silt grains in the samples is not higher than 5%. The largest sand grains reach a size of around 570 µm, which ranks them in the coarse sand class. The percentual content of this grain size class is even lower, less than 1%. The most representative in thin sections are the grain size classes of the fine and very fine or medium coarse sand, respectively.
The statistical evaluation of grain size results (Table 1) allowed the classification of the sand as monomodal, moderately well sorted, with symmetrical or negative skewness, and with various types of kurtosis (leptokurtic, mesokurtic, or platykurtic).

4.2. Sedimentological Analysis

The entire profile consists of fairly homogenous aeolian blown sand passing upwards into the interval of intercalated sand-loam couplets (Figure 2). Sand is typically light yellowish brown (2.5Y 6/4 based on the Munsell chart) in the whole profile, including the upper interval. Loams, on the other hand, are distinguished by a reddish-brown colour (5YR 5/4 based on the Munsell chart).
Some sedimentary structures have been identified during the detailed analysis of the sedimentary record in the Svätuše sand pit. Based on them, four types of beds/bedsets were recognised in this study:

4.2.1. Parallel Laminated Bedsets

Parallel lamination is a relatively frequent sedimentary structure observed in the sedimentary record. It is typical for bedsets where single sand beds are easily differentiated due to their varying grain sizes (Figure 2G). In more detail, these beds are identified as sub-horizontal, low-inclined, sometimes wavy or trough-like, and laminated. The thickness of the beds varies between 1 and 10 cm, and the inclination is low (up to 15°). Bedsets consist predominantly of beds typical for pin-stripe lamination, plane-bed lamination, and occasionally also climbing translatent stratification. Pin-stripe laminated beds are dominant and form 10–20 cm thick successions. Plane-bed lamination is less frequent and is recorded as 5–10 cm thick beds. The rarest, climbing translatent stratification is recorded as 0.5–1 cm thick beds with lateral extension of 4–6 cm (Figure 2G).
These parallel laminated bedsets are interpreted as wind ripple lamination [35], where different subtypes of lamination most likely point to changing wind velocities and direction during migration of the wind ripples in the interdune environment. Plane-bed strata form when wind velocity is too high to form ripples [36]. The pin-stripe lamination may indicate migration of the ripples through the relatively horizontal surface with low angles of climb [35]. Climbing translatent stratified beds, on the other hand, most likely point to migration of the wind ripples under the higher angle of climb [36].

4.2.2. Cross-Laminated Beds

Sand beds typical of cross-lamination are more frequently recorded on the sand walls oriented more or less parallel to the paleo-wind direction. They are characterised by a thickness ranging from 10 to 50 cm and planar tops and bottoms (Figure 2E). The internal structure of the beds consists of planar high-angle (about 30°) inclined laminae, which are tangential at the bottom. Occasionally, pinching-out downdip (Figure 2I) was recorded.
These are typical grain-fall laminated beds (sensu [36]) formed on the lee side of the dune where sediment grains fall out of suspension after overcoming a crest. Based on the thickness of preserved beds, they most likely indicate the migration of small dunes forming during low-velocity wind currents.

4.2.3. Trough-Cross Laminated Bedsets

These bedsets were observed only on the sand walls perpendicular to the paleo-wind direction. They are identified based on typical curved planar erosional surfaces separating different laminae sets, where each is concordant with the basal erosional surface. Differences in the grain size of individual sets of laminae are obvious and highlight the erosional scours or troughs (Figure 2F).
These structures are interpreted as a sand flow cross-stratification [36], where individual troughs with laminae sets represent dune slipfaces, and they are interbedded with the grainfall laminae [36]. Grain-size differences support this interpretation. Only a small inclination of the scours and laminae relates to the probable lee side of the dune oriented perpendicularly to the wind direction.

4.2.4. Sand-Loam Bedded Interval

It is an interval preserved only in the upper part of the analysed profile. The whole interval reaches about 200 cm and consists of structureless beds of sand and loams of 1–20 cm thickness. Contacts between sand-loam couplets are planar and undulated. Basal bedding surfaces of sand beds are sharp in almost all cases, and their tops are transitional with adjacent loamy beds, so individual sand-loam couplets can be identified (Figure 2H). Sand-to-loam ratio changes from one spot to the other as the thickness of individual beds varies laterally.
The observed sedimentary features indicate some palaeo-environmental changes. These may result from slight changes in climate, allowing the start of pedogenetic processes (e.g., [7,9,10]; [17,19] in Hungary). However, lithologic changes may also be related to the reduced sand dynamics and/or episodic deposition of blown sand. Transitional aeolian-fluvial depositional conditions also cannot be completely ruled out.

4.3. Petrographic Analysis

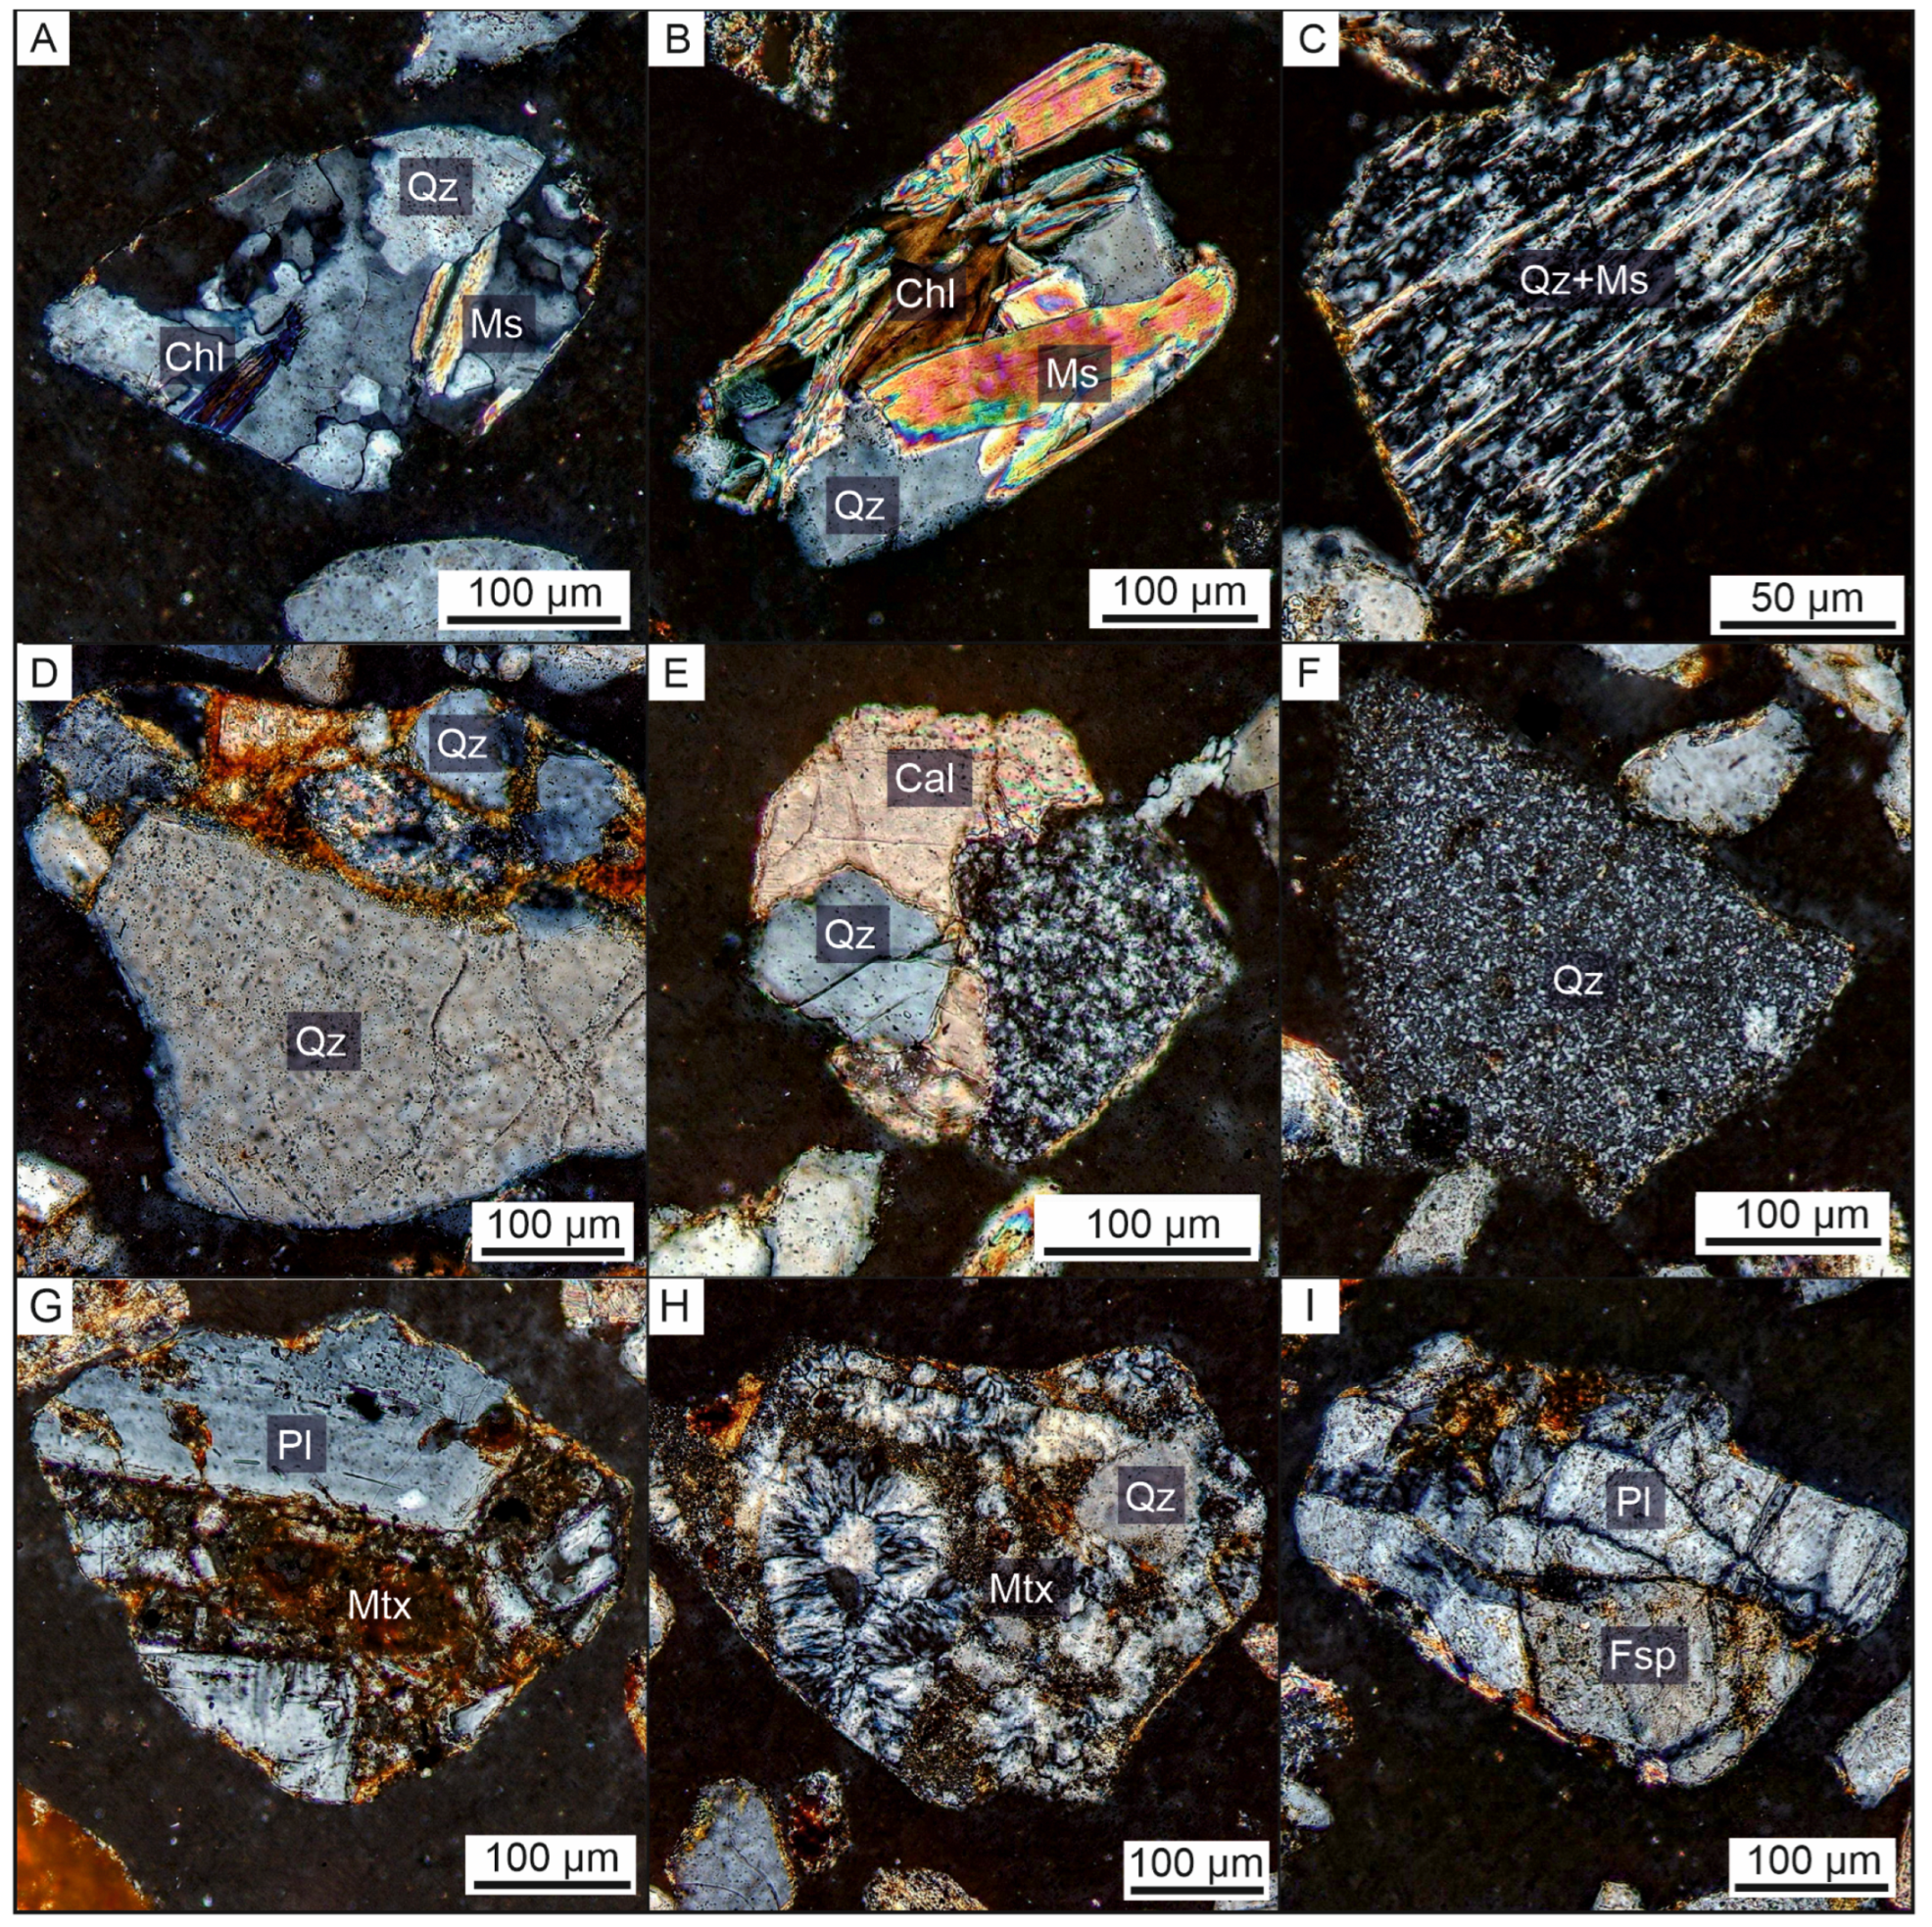
The aeolian sand of the Svätuše sand pit is typical siliciclastic arenaceous sediments. In both samples, the sand is mainly composed of different types of quartz grains (Figure 3), which represent up to 59.8% of the total volume in the case of sample SV-3 and 52.4% in the case of sample SV-2. Within the quartz, monocrystalline undulatory grains significantly predominate (Figure 3A), polycrystalline grains with a higher number of subgrains are common, and monocrystalline non-undulatory quartz grains are less common (Figure 3B,C).
Such a predominance of monocrystalline undulatory quartz and polycrystalline quartz grains indicates that the main source of the quartz was low- to medium-grade metamorphic rocks. On the other hand, the less common non-undulatory quartz grains are most likely of igneous origin. Some of them are surrounded by matrix remnants and show features of magmatic corrosion (Figure 3B), indicating that they come from acidic volcanic rocks.
Sand is also made of rock fragments (Figure 4). Sample SV-2 contains 31.6% and sample SV-3 38.4% of the total volume. The analysis of their composition reveals the predominance of two types of lithic clasts: schistose low-grade metamorphic rocks (Figure 4D–F), and sedimentary very fine-grained sandstones (Figure 4G,H), silicate-siltstones and mudstones, and silicite rocks (Figure 4I). In addition to them, fragments of the carbonate-cemented clastic sedimentary rocks (Figure 4H), as well as clasts of the pure carbonate cement and individual carbonate grains were identified (Figure 5E,F). Igneous rocks are mainly represented by fragments of andesite (Figure 4H), and less frequently by acidic rock fragments (Figure 4I). Deformed granitoid rocks occur only rarely (Figure 4G).
Another group of sand grains is formed by feldspars (Figure 5A–D), plagioclases, as well as alkali feldspars. They represent less than 10% of the total volume in both samples (8.6% in SV-2 and 9.2% in SV-3). Plagioclases are often idiomorphic zoned phenocrysts, partially resorbed, with remnants of matrix on the edges (Figure 5A,B), which indicates their origin as intermediate volcanic rocks.
Petrographic analysis confirmed that the blown sand contains enough pure quartz grains (50–60%) for OSL analysis. Other quartz grains are embedded in lithic clasts of low-grade metamorphic rocks, very fine-grained sandstones, volcanic, and plutonic rocks. Their use for OSL analysis depends on the successful physical and chemical separation from unwanted non-quartz components. Residual combined quartz-feldspar grains may reduce the accuracy of the dating OSL analysis.

4.4. Age Determination by the OSL Method

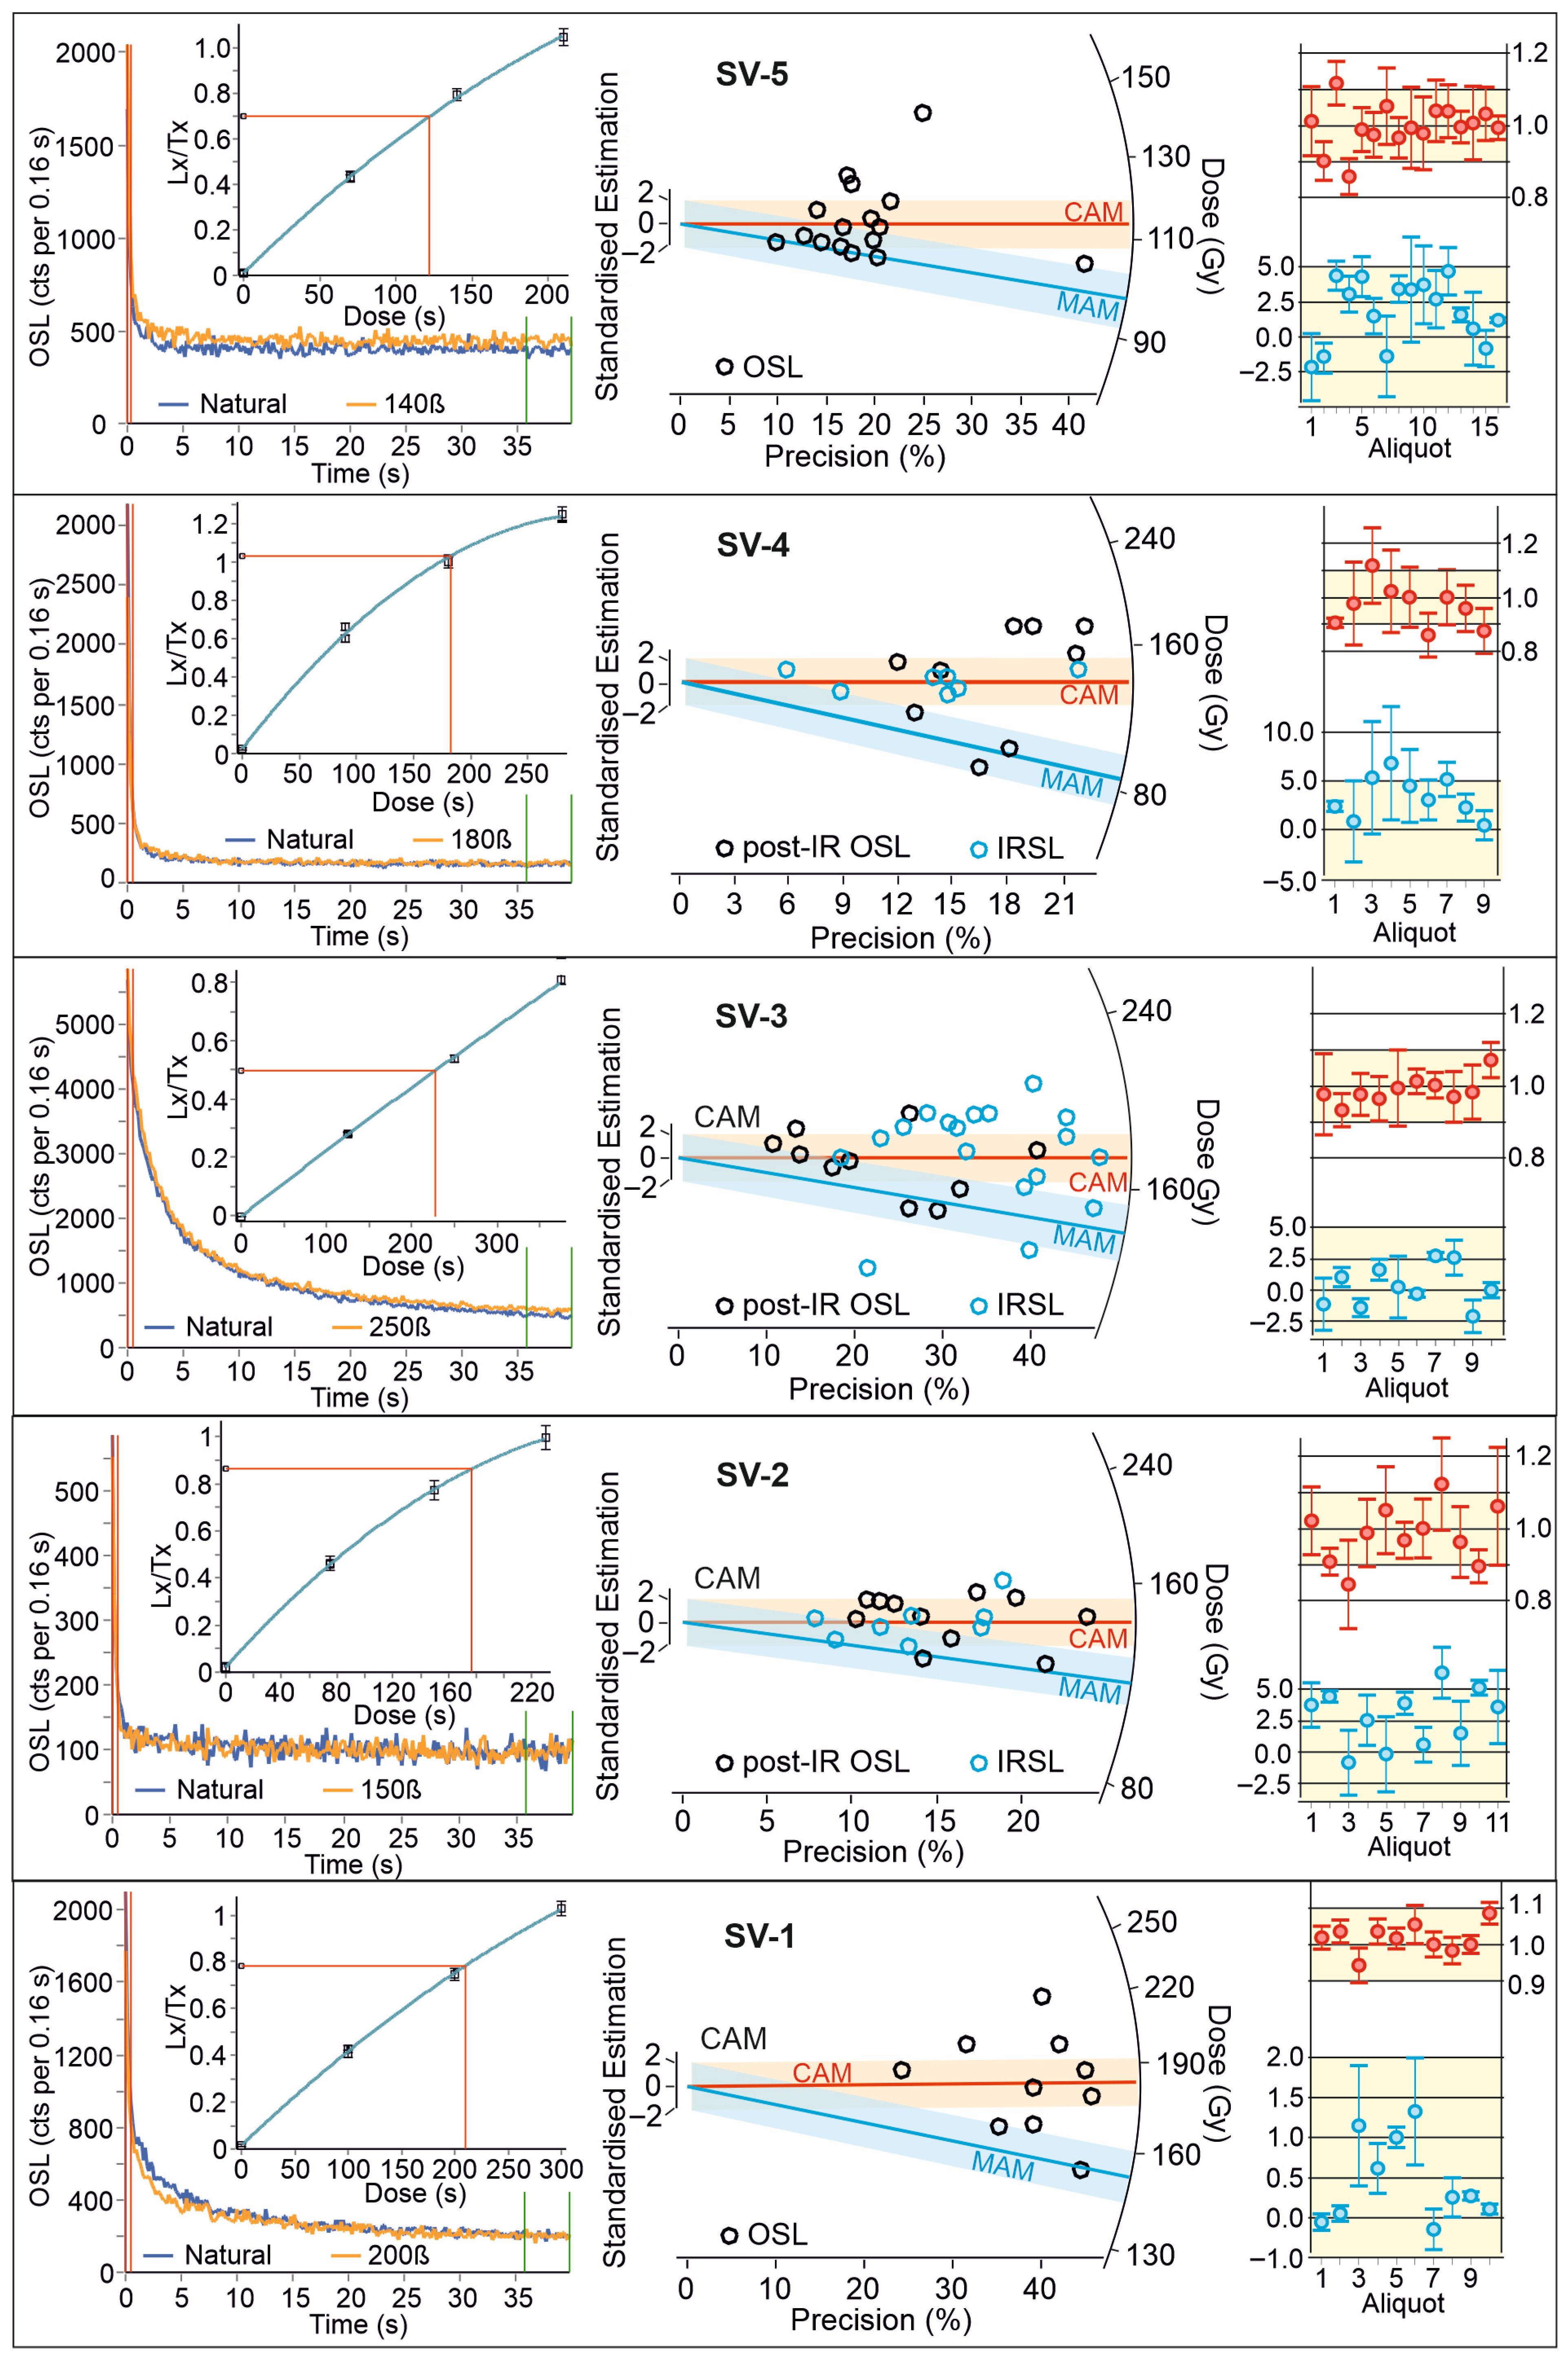
In this study, five samples from one outcrop were analysed. The OSL quartz purity check showed that the separation of quartz from most samples is still not sufficient (not even after repeated HF cleaning). As a result, the quartz-dominated post-IR OSL signal was analysed during the dating process in such cases (after [37]). The preheat temperature during measurement was established by the preheat plateau test at 220 °C (samples SV-1 and SV-4) and 240 °C (samples SV-2, SV-3, and SV-5), and controlled by the dose recovery test with a 10% tolerance. During the entire dating process, control factors such as the recycling ratio and recuperation were checked, and only aliquots within a 10% deviation were accepted (Figure 6; Table 2). At the same time, the equivalent dose values obtained are over-dispersed in all samples (dispersion higher than 30%).
Due to the problem with feldspar contamination in some samples, the double SAR method was used to check if the De obtained from post-IR OSL (quartz-dominated signal) is comparable to the De obtained from IRSL (feldspar signal). All aliquots with an IRSL signal in samples with identified contamination were compared. This test shows that doses obtained from post-IR blue OSL and those from IRSL are not the same for the individual aliquot, but they both are within 6% deviance of the equivalent dose identified from all accepted aliquots of one sample (based on post-IR OSL signals; Figure 6). The mentioned comparison test was used only as a check. For the final age calculation, OSL equivalent doses were used for SV-1 and SV-5, and post-IR OSL equivalent doses were used for SV-2, SV-3, and SV-4.
These results demonstrate that, although the equivalent dose values are reliable, they are too scattered to use a central age model (CAM) to accurately calculate age (Table 2). To avoid receiving an overestimated age, the minimum age model (MAM) was selected as more statistically suitable [38]. It is a model for OSL dating of samples where not all the grains have been fully bleached [39], which is consistent with petrographic conclusions regarding the source area of the analysed sand.
As a result, the age calculated by the OSL method was determined as 105.3 ± 6.2 kyr to 67.0 ± 3.9 kyr (Table 2), which stratigraphically corresponds to the Early Glacial and Early Pleniglacial phases (MIS 4–5d) of the Weichselian stage (Figure 7).

5. Discussion

The sedimentary record analysed in this study and described above is characteristic for an aeolian depositional environment. It is indicated by the preserved deposits consisting of fine-grained, well-sorted sand with typical aeolian sedimentary structures. The geographical position of the studied sediments also refers to an aeolian origin. Sand is preserved close to the volcanic bodies, which at the time of deposition represented topographic obstacles, allowing sediment accumulation at their foothills by wind blowing.
The thickness of the entire sand succession was, according to direct observation in the Svätuše sand pit, around 12 m. Sedimentary structures recorded during the sedimentary analysis refer to the migration of the small dunes with slightly varying intensity and direction of the paleo-winds and the rate of the sediment supply. On the other hand, a sand-loam bedded interval in the upper part of the profile most likely indicates a small change in depositional conditions. It is a striking horizon within the blown sand, identified also in the vicinity of the studied area of the East Slovak Lowland (e.g., [9,16]).
Similar sand-loam bedded intervals were identified in the adjacent area of Hungary, where they are identified as paleosoils within blown sands and represent an object of interest concerning radiocarbon dating and interpretation of stratigraphic history in the area (e.g., [17,19]). Continuity between sand from the East Slovakian Lowland and that of the adjacent area of Hungary is also documented by the predominantly S-ward direction of paleo-winds (e.g., [8,15,16]).
In the case of the adjacent Hungarian blown sand, the age is identified as a Weichselian Late Pleniglacial and Late Glacial to Holocene (MIS 1–3), and it is interpreted as re-blown [19,42] and/or moved by human activities from previously deposited aeolian sand (e.g., [43,44,45]). Blown sand from the study area corresponds to the Early Glacial and Early Pleniglacial phases of the Weichselian glacial period (MIS 4–5d) based on results of OSL dating within this study. It is, in turn, interpreted as blown directly from the alluvial plains of the surrounding rivers (e.g., [8,14]), which is also indicated by the middle stage of textural and compositional maturity of the analysed sand (subrounded to subangular grains, variable modal composition, minor but present clayey matrix).
The modal composition of the sand indicates that alluvial plains sourced sediment mainly from the surrounding Neogene volcanic mountains and more distant Western Carpathians Flysch belt mountains. The excessive proximity of some sources, as well as their petrographic diversity, was also reflected during the process of OSL dating itself. The equivalent dose values obtained from individual grains and used for age calculation show excessive dispersion (Figure 6) related to the different bleaching histories of them. As a result, the minimum age model (MAM) was used to calculate the age of blown sand from Svätuše.
Blown sand from more remote areas within Central Europe has also been dated as Late Weichselian to Holocene (e.g., [5,6]), but the studied profile has no apparent connection with these areas, and therefore, correlations are not presented. Moreover, the Early Weichselian is identified as a period represented by the lack of continuous continental sedimentary records, insufficient resolution of results, and poor age control [46]. In Poland, the resulting OSL-dated time span is represented mainly by fluvial and lacustrine deposition [46,47,48]. However, their proximity to ice sheets was higher than in the case of the East Slovak Lowland. In addition, Slovakia is quite climatically diverse despite its size [49].
The age span of deposition, interpreted from the Svätuše sand pit (Figure 7), is characterised as the period during which cold, non-forested steppe conditions prevailed in the periglacial region of the High Tatras in Slovakia [49]. The sedimentary record of the study area, consisting predominantly of blown sand representing dune deposits, fits well with such climatic conditions.

6. Conclusions

Svätuše sand pit represents an active quarry where an almost 15 m thick succession of deposits can be studied. A preserved sedimentary profile was analysed, aiming at assessing the chronostratigraphical position of the deposits using OSL dating. In addition, sedimentological and petrographical analyses were also performed and brought important supplementary data regarding depositional processes and conditions.
As a result, the blown sand from Svätuše is interpreted as fine-grained, well-sorted deposits of small dunes and an overlying sand-loam interval, indicating a slight change in depositional conditions, formed during the beginning of the Weichselian Glacial, concretely during the Early Glacial and Early Pleniglacial phases (MIS 4–5d). The modal composition of this sand confirms that it was blown from the alluvial plains of nearby rivers, which bring material from Neogene volcanics and Paleogene flysch-sandstones.
Since this petrographic diversity of the source areas was also reflected in the OSL dating process itself, and some of the measured quartz grains were most likely not completely bleached, the age of the sand from Svätuše was calculated using a minimum age model.

Author Contributions

Conceptualisation, D.D. and R.F.; methodology, D.D. and R.F.; software, D.D., R.F. and R.H.; validation, D.D., R.F. and R.H.; formal analysis, D.D. and R.F.; investigation, D.D. and R.F.; resources, D.D. and R.F.; data curation, D.D., R.F. and R.H.; writing—original draft, D.D. and R.F.; visualisation, D.D. and R.F.; review and editing, D.D. All authors have read and agreed to the published version of the manuscript.

Funding

This research received no specific grant from any funding agency in the public, commercial, or not-for-profit sectors.

Data Availability Statement

The raw data supporting the conclusions of this article will be made available by the authors on request.

Acknowledgments

The authors are grateful to three anonymous reviewers for their insightful and valuable comments and suggestions, which significantly improved the manuscript.

Conflicts of Interest

The authors declare no conflict of interest.

References

  1. Koster, E.A. Recent advances in luminescence dating of Late Pleistocene (cold climate) aeolian sand and loess deposits in western Europe. Permafr. Periglac. Process. 2005, 16, 131–143. [Google Scholar] [CrossRef]
  2. Lóki, J.; Négyesi, G.; Buró, B.; Félegyházi, E. Aeolian Surface transformations on the Alluvial fan of the Nyírség. J. Environ. Geogr. 2012, 5, 21–28. [Google Scholar] [CrossRef]
  3. Kadlec, J.; Kocurek, G.; Mohrig, D.; Shinde, D.P.; Murari, M.K.; Varma, V.; Stehlík, F.; Beneš, V.; Singhvi, A.K. Response of fluvial, aeolian, and lacustrine systems to late Pleistocene to Holocene climate change, Lower Moravian Basin, Czech Republic. Geomorphology 2015, 232, 193–208. [Google Scholar] [CrossRef]
  4. Moravcová, M.; Fordinál, K.; Maglay, J. Late Quaternary History and Palaeoclimatic Implications of Danubian Flat Based on Dating, Geochemistry, Lithology, Isotope Analyses and Land Snail Assemblages. Slovak Geol. Mag. 2018, 18, 31–70. [Google Scholar]
  5. Rychel, J.; Woronko, B.; Błaszkiewicz, M.; Karasziewicz, T. Aeolian processes records within last glacial limit areas based on the Płock Basin case (Central Poland). Bull. Geol. Soc. Finl. 2018, 90, 223–237. [Google Scholar] [CrossRef]
  6. Holuša, J.; Moska, P.; Nývlt, D.; Woronko, B. OSL-based chronology of the cold-climate aeolian sand dunes, Moravian Sahara, lower Morava Basin, Czechia. Quat. Sci. Rev. 2024, 334, 1–13. [Google Scholar] [CrossRef]
  7. Kvitkovič, J. Concerning the basic geomorphological problems of the East Slovakian Lowland. Geogr. Mag. 1964, XVI, 143–159. [Google Scholar]
  8. Baňacký, V.; Elečko, M.; Kaličiak, M.; Straka, P.; Škvarka, Ľ.; Šucha, P.; Vass, D.; Vozárová, A.; Vozár, J. Explanations to the Geological Map of the Southern Part of East Slovak Lowland and Zemplínske Vrchy Mts; State Geological Institute of Dionýz Štúr: Bratislava, Slovakia, 1989; pp. 1–143. [Google Scholar]
  9. Košťálik, J. Contribution to the study of the genesis and stratigraphy of eolian sand of the southern part of the East Slovak Lowland. Geogr. Cassoviensis 2009, III, 81–91. [Google Scholar]
  10. Košťálik, J. Eolic sediments in Western Carpathians, their characterisation and chronostratigraphy. Acta Mont. Slovaca 1997, 2, 39–41. [Google Scholar]
  11. Ložek, V. Research of Deposits of Natural Fertilizers in Eastern Slovakia; State Geological Institute of Dionýz Štúr: Bratislava, Slovakia, 1963; pp. 346–348. [Google Scholar]
  12. Schmidt, Z. Quaternary Molluscs of the Southern Part of the East Slovak Lowland; State Geological Institute of Dionýz Štúr: Bratislava, Slovakia, 1974. [Google Scholar]
  13. Pelíšek, J. Characteristics of the blown sands of Slovakia. Geol. Work 1963, 64, 103–120. [Google Scholar]
  14. Horniš, J. Sedimentary-Petrographic Analysis of Quaternary Sediments of the East Slovak Lowland; State Geological Institute of Dionýz Štúr: Bratislava, Slovakia, 1977; pp. 1–72. [Google Scholar]
  15. Bónová, K.; Bóna, J.; Mikuš, T.; Ferková, A. Heavy minerals of the aeolian sediments in the East Slovak Basin (Western Carpathians)—Implications for their origin, transport process and sedimentary history. Aeolian Res. 2024, 66, 1–18. [Google Scholar] [CrossRef]
  16. Kvitkovič, J.; Lukniš, M.; Mazúr, E. Geomorphology and Quaternary of Slovak lowlands. Geogr. Mag. 1956, 8, 101–106. [Google Scholar]
  17. Csongor, E.; Borsy, Z.; Szabó, I. Age of charcoal samples of geomorphologic interest in Northeast Hungary. Radiocarbon 1980, 22, 774–777. [Google Scholar] [CrossRef]
  18. Ujházy, K.; Gábris, G.; Frechen, M. Ages of periods of sand movement in Hungary determined through luminescence measurements. Quat. Int. 2003, 111, 91–100. [Google Scholar] [CrossRef]
  19. Lóki, J.; Demeter, G.; Négyesi, G.; Vass, R.; Molnár, M. Holocene sand movements in the Nyírség area. In Studies in the Field of Geology in Honor of Dr. Miklós Kozák; Püspöki, Z., Ed.; University of Debrecen: Debrecen, Hungary, 2008; pp. 111–123. [Google Scholar]
  20. Gábris, G.Y. The stages of the last 30 years of geological history and the main periods of the movement of blown sand in Hungary. Hung. Geogr. Bull. 2003, CXXVII, 1–14. [Google Scholar]
  21. Baňacký, V.; Elečko, M.; Kaličiak, M.; Lexa, J.; Straka, P.; Vass, D.; Vozár, J.; Vozárová, A. Geological Map of the Southern Part of East Slovak Lowland and Zemplínske Vrchy Mts. at Scale 1:50000; State Geological Institute of Dionýz Štúr: Bratislava, Slovakia, 1986. [Google Scholar]
  22. Jacko, S.; Jacko, S.; Labant, S.; Bátorová, K.; Farkašovský, R.; Ščerbáková, B. Structural constraints of neotectonic activity in the eastern part of the Western Carpathians orogenic wedge. Quat. Int. 2021, 585, 27–43. [Google Scholar] [CrossRef]
  23. Vass, D.; Elečko, M.; Janočko, J.; Karoli, S.; Pereszlenyi, M.; Slávik, J.; Kaličiak, M. Palaeogeography of the East-Slovakian Basin. Slovak Geol. Mag. 2000, 4, 377–407. [Google Scholar]
  24. Maglay, J.; Halouzka, R.; Baňacký, V.; Pristaš, J.; Janočko, J. Neotectonic Map of Slovakia 1:500,000; Ministry of Environment of Slovak Republic: Bratislava, Slovakia, 1999. [Google Scholar]
  25. Wentworth, C.K. A scale of grade and class terms for clastic sediments. J. Geol. 1922, 30, 377–392. [Google Scholar] [CrossRef]
  26. Folk, R.L.; Ward, W.C. Brazos River bar: A study in the significance of grain size parameters. J. Sediment. Petrol. 1957, 27, 3–26. [Google Scholar] [CrossRef]
  27. Folk, R.L. Petrology of Sedimentary Rocks; Hemphill Publishing Company: Austin, TX, USA, 1980; pp. 1–182. [Google Scholar]
  28. Pettijohn, F.J.; Potter, P.E.; Siever, R. Sand and Sandstone, 2nd ed.; Springer: Berlin/Heidelberg, Germany, 1987; pp. 139–213. [Google Scholar]
  29. Murray, A.; Arnold, L.; Buykaert, J.-P.; Guérin, G.; Qin, J.; Singhvi, A.; Smedley, R.; Thomsen, K. Optically stimulated luminescence dating using quartz. Nat. Rev. Method Prim. 2021, 1, 1–31. [Google Scholar] [CrossRef]
  30. Murray, A.S.; Roberts, R.G.; Wintle, A.G. Equivalent dose measurement using a single aliquot of quartz. Radiat. Meas. 1997, 27, 171–184. [Google Scholar] [CrossRef]
  31. Murray, A.S.; Roberts, R.G. Measurement of the equivalent dose in quartz using a regenerative-dose single-aliquot protocol. Radiat. Meas. 1998, 29, 503–515. [Google Scholar] [CrossRef]
  32. Murray, A.S.; Wintle, A.G. Luminescence dating of quartz using an improved single-aliquot regenerative-dose protocol. Radiat. Meas. 2000, 32, 57–73. [Google Scholar] [CrossRef]
  33. Gilmore, G.R. Practical Gamma-Ray Spectrometry, 2nd ed.; John Wiley & Sons, Ltd.: Hoboken, NJ, USA, 2008; pp. 1–381. [Google Scholar]
  34. Guérin, G.; Mercier, N.; Nathan, R.; Adamiec, G.; Lefrais, Y. On the use of the infinite matrix assumption and associated concepts: A critical review. Radiat. Meas. 2012, 47, 778–785. [Google Scholar] [CrossRef]
  35. Bristow, C.; Mountney, N.P. Aeolian Stratigraphy. In Treatise on Geomorphology; Shroder, J.F., Ed.; Elsevier: San Diego, CA, USA, 2013; pp. 246–268. [Google Scholar]
  36. Hunter, R.E. Basic types of stratification in small eolian dunes. Sedimentology 1977, 24, 361–387. [Google Scholar] [CrossRef]
  37. Wallinga, J.; Murray, A.S.; Bøtter-Jensen, L. Measurement of the dose in quartz in the presence of feldspar contamination. Radiat. Prot. Dosim. 2002, 101, 367–370. [Google Scholar] [CrossRef]
  38. Galbraith, R.F.; Laslett, G.M. Statistical models for mixed fission track ages. Nucl. Tracks Radiat. Meas. 1993, 21, 459–470. [Google Scholar] [CrossRef]
  39. Fattahi, M.; Heidary, M.; Ghasemi, M. Employing minimum age model (MAM) and finite mixture modeling (FMM) for OSL age determination of two important samples from Ira trench of North Tehran fault. Geochronometria 2016, 43, 38–47. [Google Scholar] [CrossRef]
  40. Ivy-Ochs, S.; Kerschner, H.; Reuther, A.; Preusser, F.; Heine, K.; Maisch, M.; Kubik, P.W.; Schlüchter, C. Chronology of the last glacial cycle in the European Alps. J. Quat. Sci. 2008, 23, 559–573. [Google Scholar] [CrossRef]
  41. Peeters, J.; Cohen, K.M.; Thrana, C.; Busschers, F.S.; Martinius, A.W.; Stouthamer, E.; Middekoop, H. Preservation of Last Interglacial and Holocene transgressive systems tracts in the Netherlands and its applicability as a North Sea Basin reservoir analogue. Earth-Sci. Rev. 2019, 188, 482–497. [Google Scholar] [CrossRef]
  42. Cohen, K.; Gibbard, P. Global Chronostratigraphical Correlation Table for the Last 2.7 Million Years v. 2019 (Poster Version), 2nd ed.; Mendeley Data: London, UK, 2022. [Google Scholar]
  43. Borsy, Z.; Csongor, É.; Lóki, J.; Szabó, I. Recent results in the radiocarbon dating of wind-blown sand movements in Tisza Bodrog Interfluve. Acta Geogr. Debrec. 1985, 22, 5–16. [Google Scholar]
  44. Borsy, Z. Blown sand territories in Hungary. Z. Für Geomorphol. 1991, 90, 1–14. [Google Scholar]
  45. Nyári, D.; Kiss, T. Holocene quicksand movements in Bács-Kiskun County in the light of archaeological finds. Cumania 2005, 21, 83–89. [Google Scholar]
  46. Marks, L.; Gałązka, D.; Woronko, B. Climate, environment and stratigraphy of the last Pleistocene glacial stage in Poland. Quat. Int. 2016, 420, 259–271. [Google Scholar] [CrossRef]
  47. Goździk, J. The Vistulian aeolian succession in central Poland. Sediment. Geol. 2007, 193, 211–220. [Google Scholar] [CrossRef]
  48. Krzyszkowski, D. Saalian sediments of the Bełchatów outcrop, central Poland. Boreas 1991, 20, 29–46. [Google Scholar] [CrossRef]
  49. Mello, M.; Lapin, M.; Pecho, J. Climate in the Past and Present in the Slovak Landscapes—The Central European Context. In Landscapes and Landforms of Slovakia; Lehotský, M., Boltižiar, M., Eds.; Springer Nature: Cham, Switzerland, 2022; pp. 27–45. [Google Scholar]
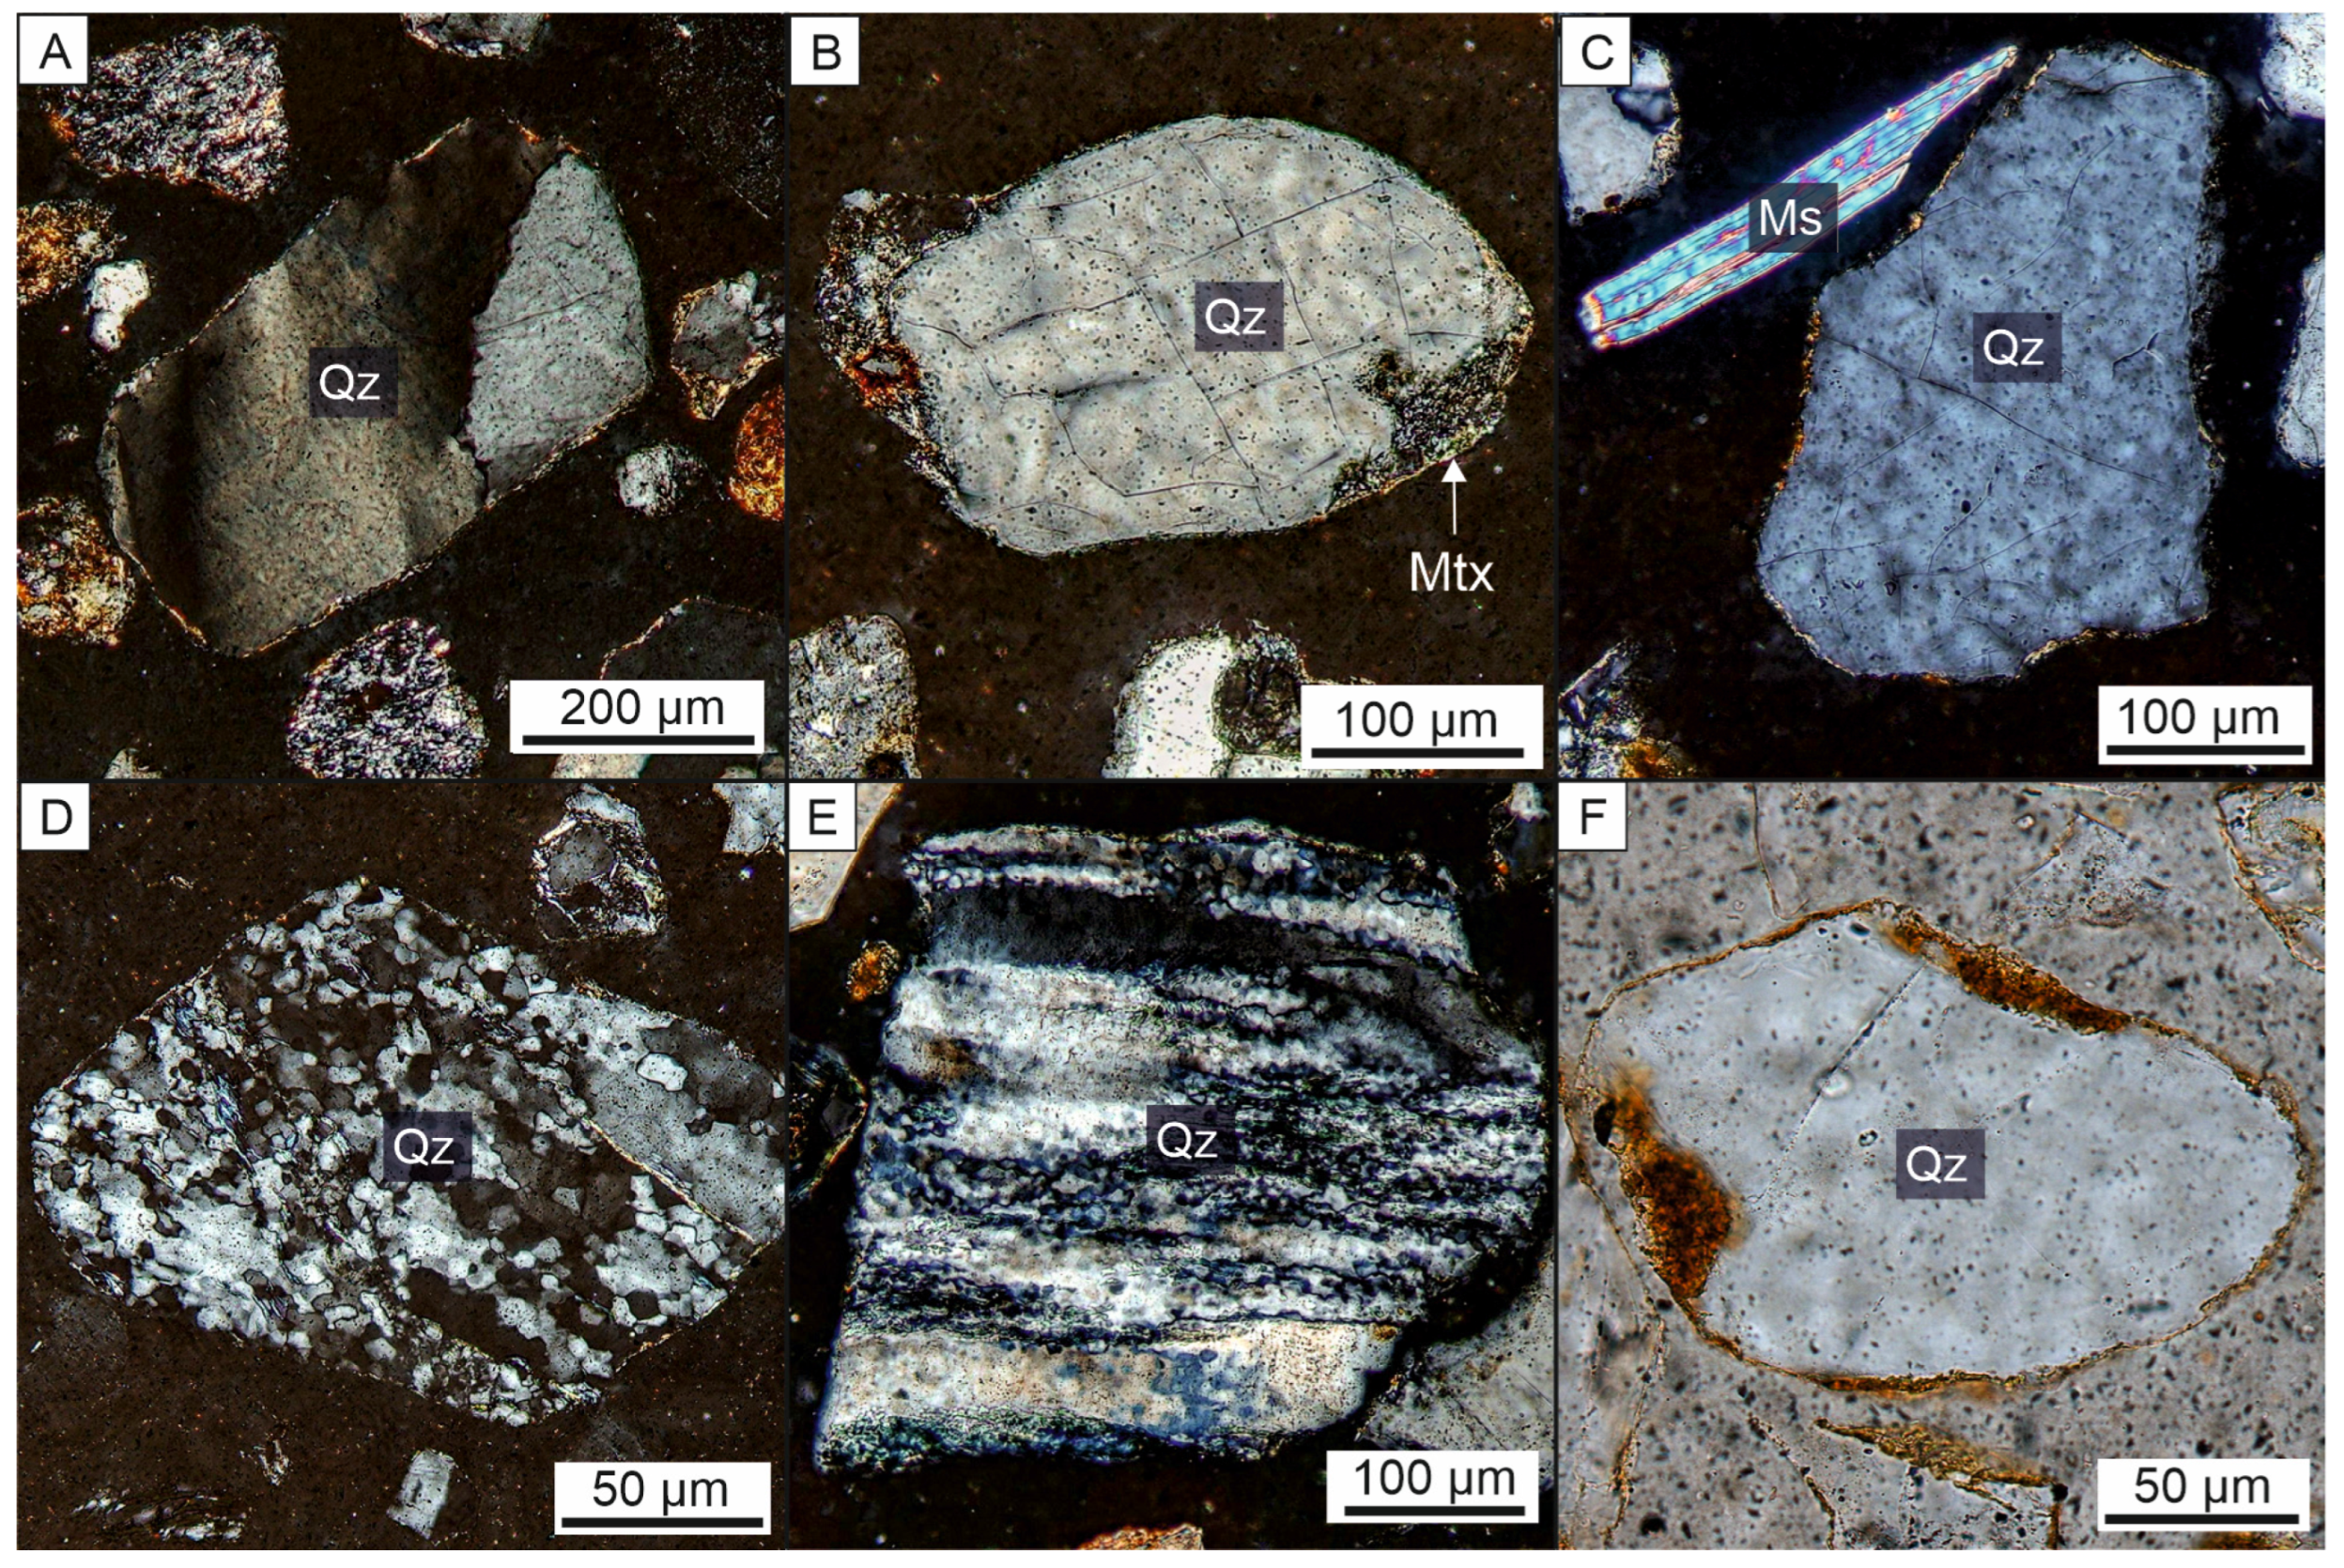
Figure 3. Quartz is the most abundant grain type in the sand; (A)—subrounded quartz grain with strong undulose extinction, CPL; (B)—rounded monocrystalline quartz phenocryst originating from acid volcanic rock, corrosion features due to remelting can be seen and remnants of matrix on the sides, CPL; (C)—subangular monocrystalline quartz grain, CPL; (D)—subrounded polycrystalline quartz grain, CPL; (E)—subangular polycrystalline quartz grain with preferred orientation of the subgrains, CPL; (F)—rounded quartz grain with the surface rimmed by thin red-brown iron oxide, PPL; CPL—crossed polarised light, PPL—plane-polarised light.
Geosciences 15 00429 g003
Figure 4. Fragments of magmatic, metamorphic, and sedimentary rocks; (A)—rounded clast of the metamorphic rock made up of polycrystalline quartz and mica, CPL; (B)—subangular clast of the metamorphic rock with the oriented grains of the white mica, chlorite, and quartz, CPL; (C)—subrounded clast of the low-grade metamorphic rock formed dynamically recrystallized quartz and white mica with strong preferred orientation, CPL; (D)—subangular clast of the siliciclastic psamitic sedimentary rock, CPL; (E)—subangular clast of the sandtone with the quartz clasts surrounded by the calcite cement, CPL; (F)—angular clast of the sedimentary silicite rock, CPL; (G)—subrounded clast of andesite, made up of plagioclase phenocrysts lying in more fine-grained matrix, CPL; (H)—subrounded clast of the acid volcanic rock, formed mainly by matrix material, CPL; (I)—subrounded clast of deformed plutonic rock formed by fractured feldspar grains.
Geosciences 15 00429 g004
Figure 5. Feldspar and calcite fragments in the sand; (A)—subrounded grain of zoned volcanic plagioclase, with signs of magmatic corrosion, and remnants of matrix material, CPL; (B)—subrounded plagioclase of volcanic origin with typical polysynthetic twining and remnants of matrix on the side, CPL; (C)—subrounded feldspar clast, partially altered, CPL; (D)—subrounded clast of feldspar with inclusions of the idiomorphic zircons, CPL; (E)—subrounded clast of calcite which originally formed calcite cement of the psamitic rock, CPL; (F)—rounded clast of the calcite originating from the clastic sedimentary rock cement, PPL—plane polarised light.
Geosciences 15 00429 g005
Figure 6. Typical OSL decay curve, dose response curve, and results of the SAR dose protocol for individual samples through the OSL dating process. In all samples, the age was calculated using blue OSL or post-IR OSL signal. The minimum age model (MAM) is used for the final dose estimation. Graphs showing recuperation (blue circle) and recycling ratio (red circle) results refer to blue OSL or post-IR OSL signals used for the age calculation.
Geosciences 15 00429 g006
Figure 7. Stratigraphy of the last 200 kyr with the designation of age position of dated samples in this study (according to [39,40,41]).
Geosciences 15 00429 g007
Table 1. Results of the grain-size analysis realised by the sieve method.
SampleGrain Size (%)Mean (ϕ)Median (ϕ)Sorting
(ϕ)
Skewness
(ϕ)
Kurtosis
(ϕ)
Mud/Coarse SiltSand
Very
Fine
FineMediumCoarse
SV-53.613.564.917.60.52.52.5moderately wellsymmetricalleptokurtic
SV-41.315.870.911.60.22.52.5wellnegative phi valuesleptokurtic
SV-32.213.957.625.01.32.42.4moderately wellsymmetricalleptokurtic
SV-20.711.043.543.02.02.12.1moderately wellsymmetricalplatykurtic
SV-17.835.944.610.90.12.82.9moderately wellnegative phi valuesmesokurtic
Table 2. Main results of the OSL dating and some complementary data. * Aliquots represent the number of measured/accepted values.
SampleDepth (cm)Ra-226 (Bq/kg)Th-232 (Bq/kg)K-40 (Bq/kg)Dose Rate (Gy/kyr)Water (%)Aliquots *Equivalent Dose (Gy)
Minimum/Average
Age (kyr)
SV-520015.5 ± 2.515.4 ± 4.3290 ± 211.5 ± 0.113.020/1697.82 ± 1.2/
111.7 ± 4.8
67.0 ± 3.9
SV-440014.6 ± 2.414.7 ± 4.1283 ± 211.3 ± 0.118.020/990.0 ± 8.5/
151.5 ± 13.0
68.1 ± 7.5
SV-350014.2 ± 3.014.9 ± 4.2289 ± 221.4 ± 0.114.020/10144.0 ± 1.3/
173.2 ± 8.3
105.33 ± 6.2
SV-290013.4 ± 2.213.2 ± 3.8290 ± 211.2 ± 0.120.020/11116.3 ± 3.9/
147.6 ± 5.9
94.6 ± 6.3
SV-1120022.1 ± 3.519.9 ± 4.6298 ± 221.5 ± 0.111.010/10153.81 ± 10.93/
181.4 ± 6.3
100.5 ± 9.3
Disclaimer/Publisher’s Note: The statements, opinions and data contained in all publications are solely those of the individual author(s) and contributor(s) and not of MDPI and/or the editor(s). MDPI and/or the editor(s) disclaim responsibility for any injury to people or property resulting from any ideas, methods, instructions or products referred to in the content.